1. Introduction
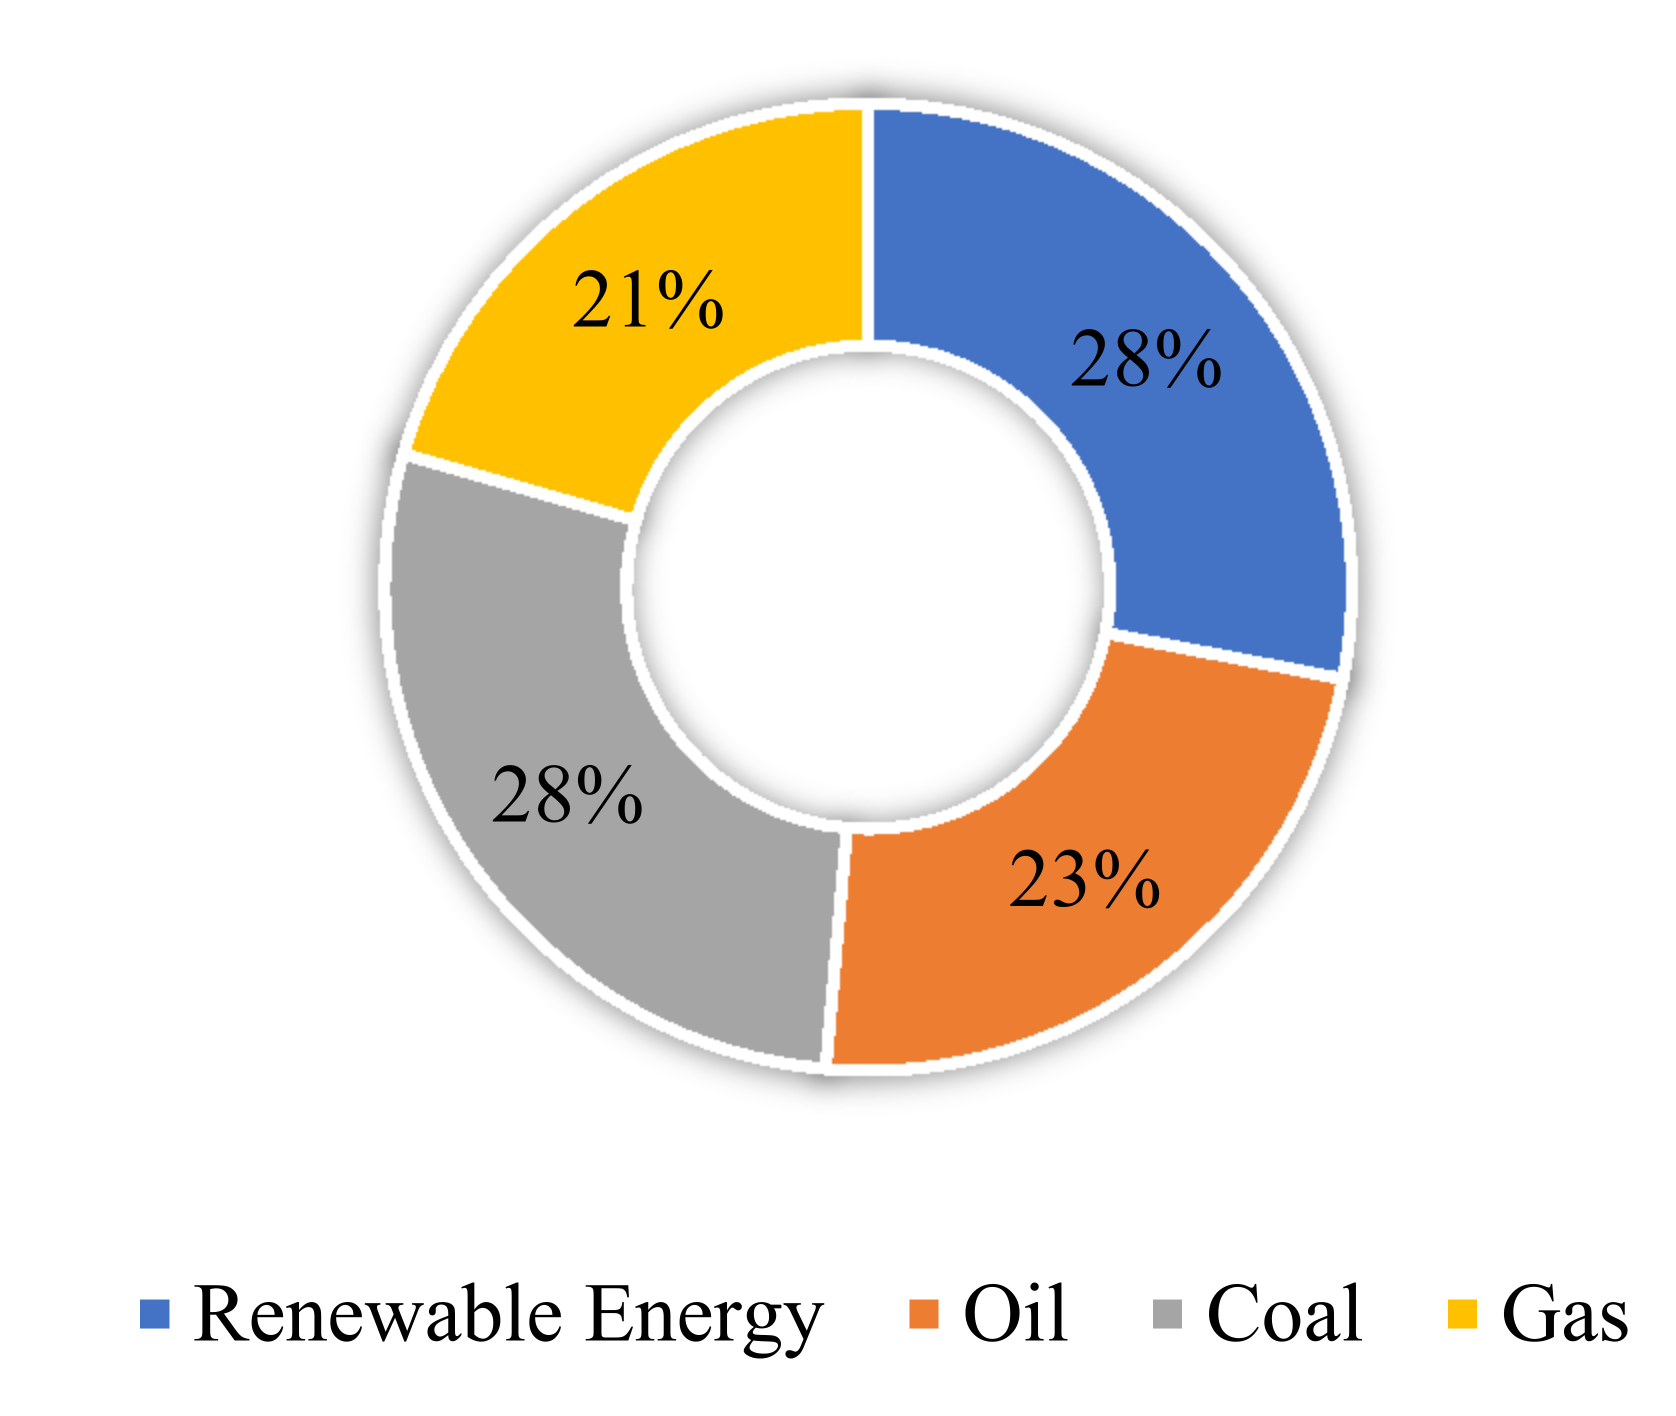
The availability of clean energy is necessary to meet national energy needs to efficiently support the goal of the sustainable development of new and renewable energy in Indonesia. By 2025, it is expected that the renewable energy mix can grow to 23% with an installed capacity of 5500 MWe as shown in
Figure 1. Until 2018, the percentage of renewable energy utilization reached 6.2%. The bioenergy sector is expected to contribute 8.2% to national energy, one way of which is through the development of bioenergy power plants [
1]. The utilization of new and renewable energy has become a topic of interest and is on the agenda in the world as one of the solutions to overcome the problems of the current energy crisis. The cause of this energy crisis is the decreasing availability of fossil fuels. Biomass, because of its abundant availability, can substitute for the use of fossil fuels. Compared to other renewable energy sources (wind, solar, etc.), energy production from biomass requires lower capital investment costs [
2]. To encourage the acceleration of the use of renewable energy in Indonesia, the government has established various policies. The government has the target of an additional installed capacity from renewable energy power plants of 905.73 megawatts (MW), consisting of 196 MW from geothermal powerplants, 557.93 MW from hydro power plants, 138.8 MW from solar power plants, and 13 MW from bio power plants. Meanwhile, the renewable energy investment target in 2021 will increase to USD 2.05 billion or approximately IDR 28.9 trillion (assuming an exchange rate of IDR 14,100 per dollar) from the investment achievement in 2020, which amounted to USD 1.36 billion or approximately IDR 19.2 trillion. Some of the government’s policies on new energy are as follows [
3]:
Implementation of the mandatory B30 program for all sectors, followed by the development of biodiesel trials as a substitute for fossil diesel with B100 (biodiesel 100%) development technology;
Mixing of research octane number 92 Oil Fuel in East Java in the context of efforts to procure bioethanol-type biofuel, in accordance with the Regulation of the Minister of Energy and Mineral Resources Number 12 of 2015;
Acceleration of waste power plant development in 12 selected cities, as mandated by Presidential Regulation Number 35 of 2018 concerning the acceleration of waste power plant development programs;
Encouraging the use of rooftop solar power plants in accordance with the mandate of the Minister of Energy and Mineral Resources Regulation Number 49 of 2018 concerning the Use of Rooftop Solar Power Generation Systems by state power plant consumers;
Simplifying the bureaucratic process through the of Energy and Mineral Resources Online Licensing Application, which is integrated with data on natural resources, operations, production, and marketing/sales of each type of energy;
Increasing the use of renewable energy to reduce dependence on fossil fuels, which will have an impact on increasing Indonesia’s economic stability.
Figure 1.
Primary energy supply by 2025.
Figure 1.
Primary energy supply by 2025.
The utilization of biomass waste into energy can be a solution to reduce dependency on fossil fuel. The potential energy from biomass is currently at 32,654 MW and 1716.5 MW has been developed [
4]. Development of bioenergy-based power plants (on-grid) until 2013 reached 90.5 MW, while for those off-grid it reached 1626 MW [
5]. One of the most significant biomass potentials in Indonesia is from solid waste from oil palm plantations. Oil palm plantations in Indonesia are the largest source of biomass with a total electricity energy that can be generated of 5495 MWe [
6]. The sources come from plantation wastes (oil palm fronds and oil palm trunks) or waste from oil palm mill production (meso scrap fiber, palm kernel shell, and oil palm mill effluent). However, not all these wastes are utilized as energy, so they have the potential to become sources of greenhouse gas emissions when they decompose. In addition, in terms of the environment in recent years, the oil palm plantation industry in Indonesia has been in the European Union’s and the United States’ spotlight because it is considered an industry that is not environmentally friendly due to the impact it causes [
7]. If the renewable energy target policy is implemented by 2030, it is expected to reduce greenhouse gas emissions by 29% compared to 2010.
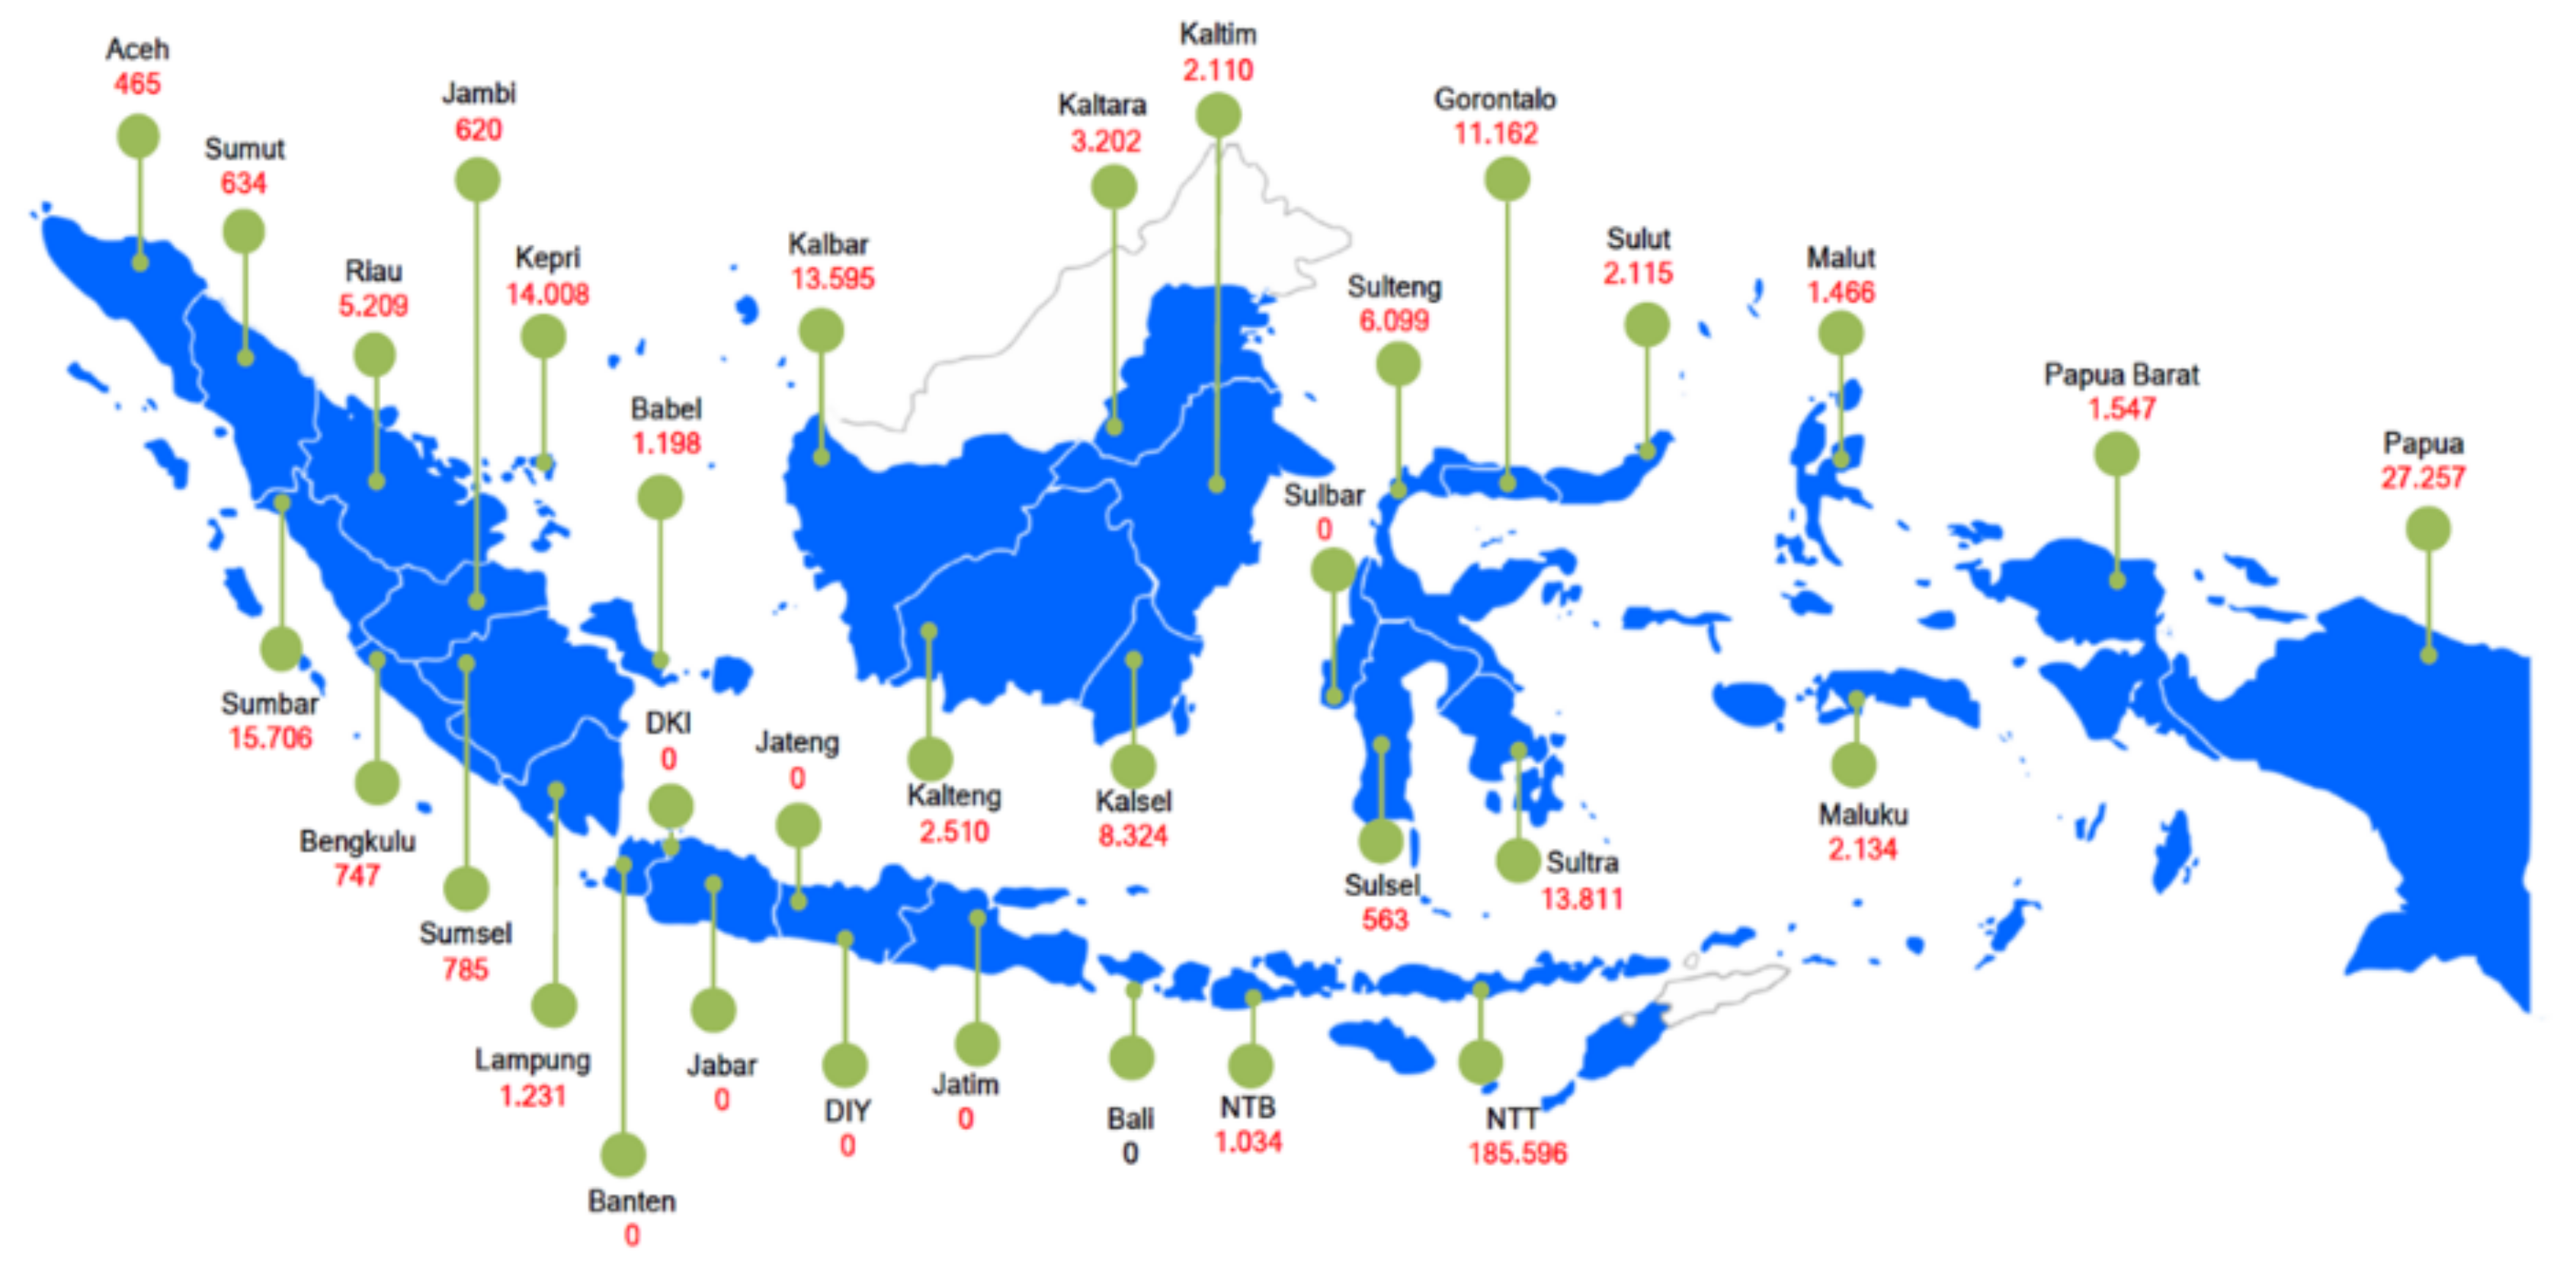
Indonesia has five provinces with the most extensive oil palm plantations, namely, South Sumatra, Central Kalimantan, West Kalimantan, North Sumatra, and Riau. In 2019, the Indonesian State Electricity Company reported that Indonesia’s electrification ratio had reached 99%. However, the electrification ratio is still calculated from the number of people who obtain electricity for access to lighting and not for the productive sector. The Ministry of Energy reported the data on villages that did not have access to electricity to be as many as 2281 villages out of a total of 232,128 villages in Indonesia [
1]. Meanwhile, for the five provinces with the most extensive oil palm plantations, there are 785 villages, 2510 villages, 13,595 villages, 634 villages, and 5209 villages, respectively, as shown in
Figure 2. The condition is ironic, since these five provinces produce much of the oil palm plantation waste. At present, access to electricity only benefits people in urban areas where there is an installed electricity network. In contrast, construction of the network constrains those plantations because the cable must pass through the plantations. Thus, the issue of land acquisition is a significant factor in the lack of access to electricity in rural communities located in oil palm plantations.
Oil palm plantation wastes are oil palm fronds and oil palm trunks. Oil palm fronds during pruning and replantation activities are always stacked and collected at an average production rate of 9.8 t-dry/ha-estate/year and 14.9 t-dry/ha-replantation/year. A study reported that oil palm fronds contain 25.5% (dry basis) hemicellulose material, which has excellent potential to be used as a raw material for biofuels and bio-based material production [
8,
9,
10,
11]. Oil palm trunks are the second type of biomass residue produced during replanting. Oil palm trunk production is estimated at 62.8 t-dry/ha-replantation/year. At present, oil palm fronds are usually burned as fuel in processing plants, and the remainder is disposed of in plantations, while oil palm trunks after the replanting process are not utilized [
10]. Utilization of oil palm waste as a raw material for renewable energy that can generate electricity is a solution to the residue of oil palm industry activities in Indonesia. According to the Ministry of Energy and Mineral Resources of the Republic of Indonesia, the renewable energy market in Indonesia is not yet optimal because it relies on solar panels which have components that are imported. Thus, the government is pushing a draft Indonesian Presidential Regulation that will regulate the price of new renewable electricity. Through this policy, it is hoped that the production of renewable energy that utilizes oil palm waste as a raw material can grow in oil palm industrial areas in Indonesia. In addition, the push for the use of renewable energy is in line with the global commitment to the 7th point of the Sustainable Development Goals that are to be achieved by 2030 regarding clean and affordable energy.
One technology that can be used to convert biomass into alternative energy without producing emissions is gasification [
12]. Gasification is the process of converting solid or liquid raw materials into thermochemical gases [
13]. Different to combustion, gasification produces higher efficiency, and the pollutants are still below emissions standards. The gasification process consists of several sequential stages, namely, the drying, pyrolysis, partial oxidation, and reduction stages. Gasification requires media such as air, oxygen, or water vapor. The gas produced from the gasification process, commonly called synthetic gas (syngas), consists of combustible syngas (i.e., CO, H
2, and CH
4) and non-combustible gas (i.e., CO
2, N
2, and the remaining O
2) [
14]. Gasification reactions occur in a reactor called a gasifier. There are various types of gasifiers such as updraft, downdraft, cross draft, bubbling fluidized bed gasifiers, and circulating fluidized beds (CFBs) [
15]. One type of gasifier that is widely used is the downdraft [
16,
17,
18]. A downdraft gasifier has the advantage of a high carbon conversion rate, low tar production, and simple construction compared to other types [
19].
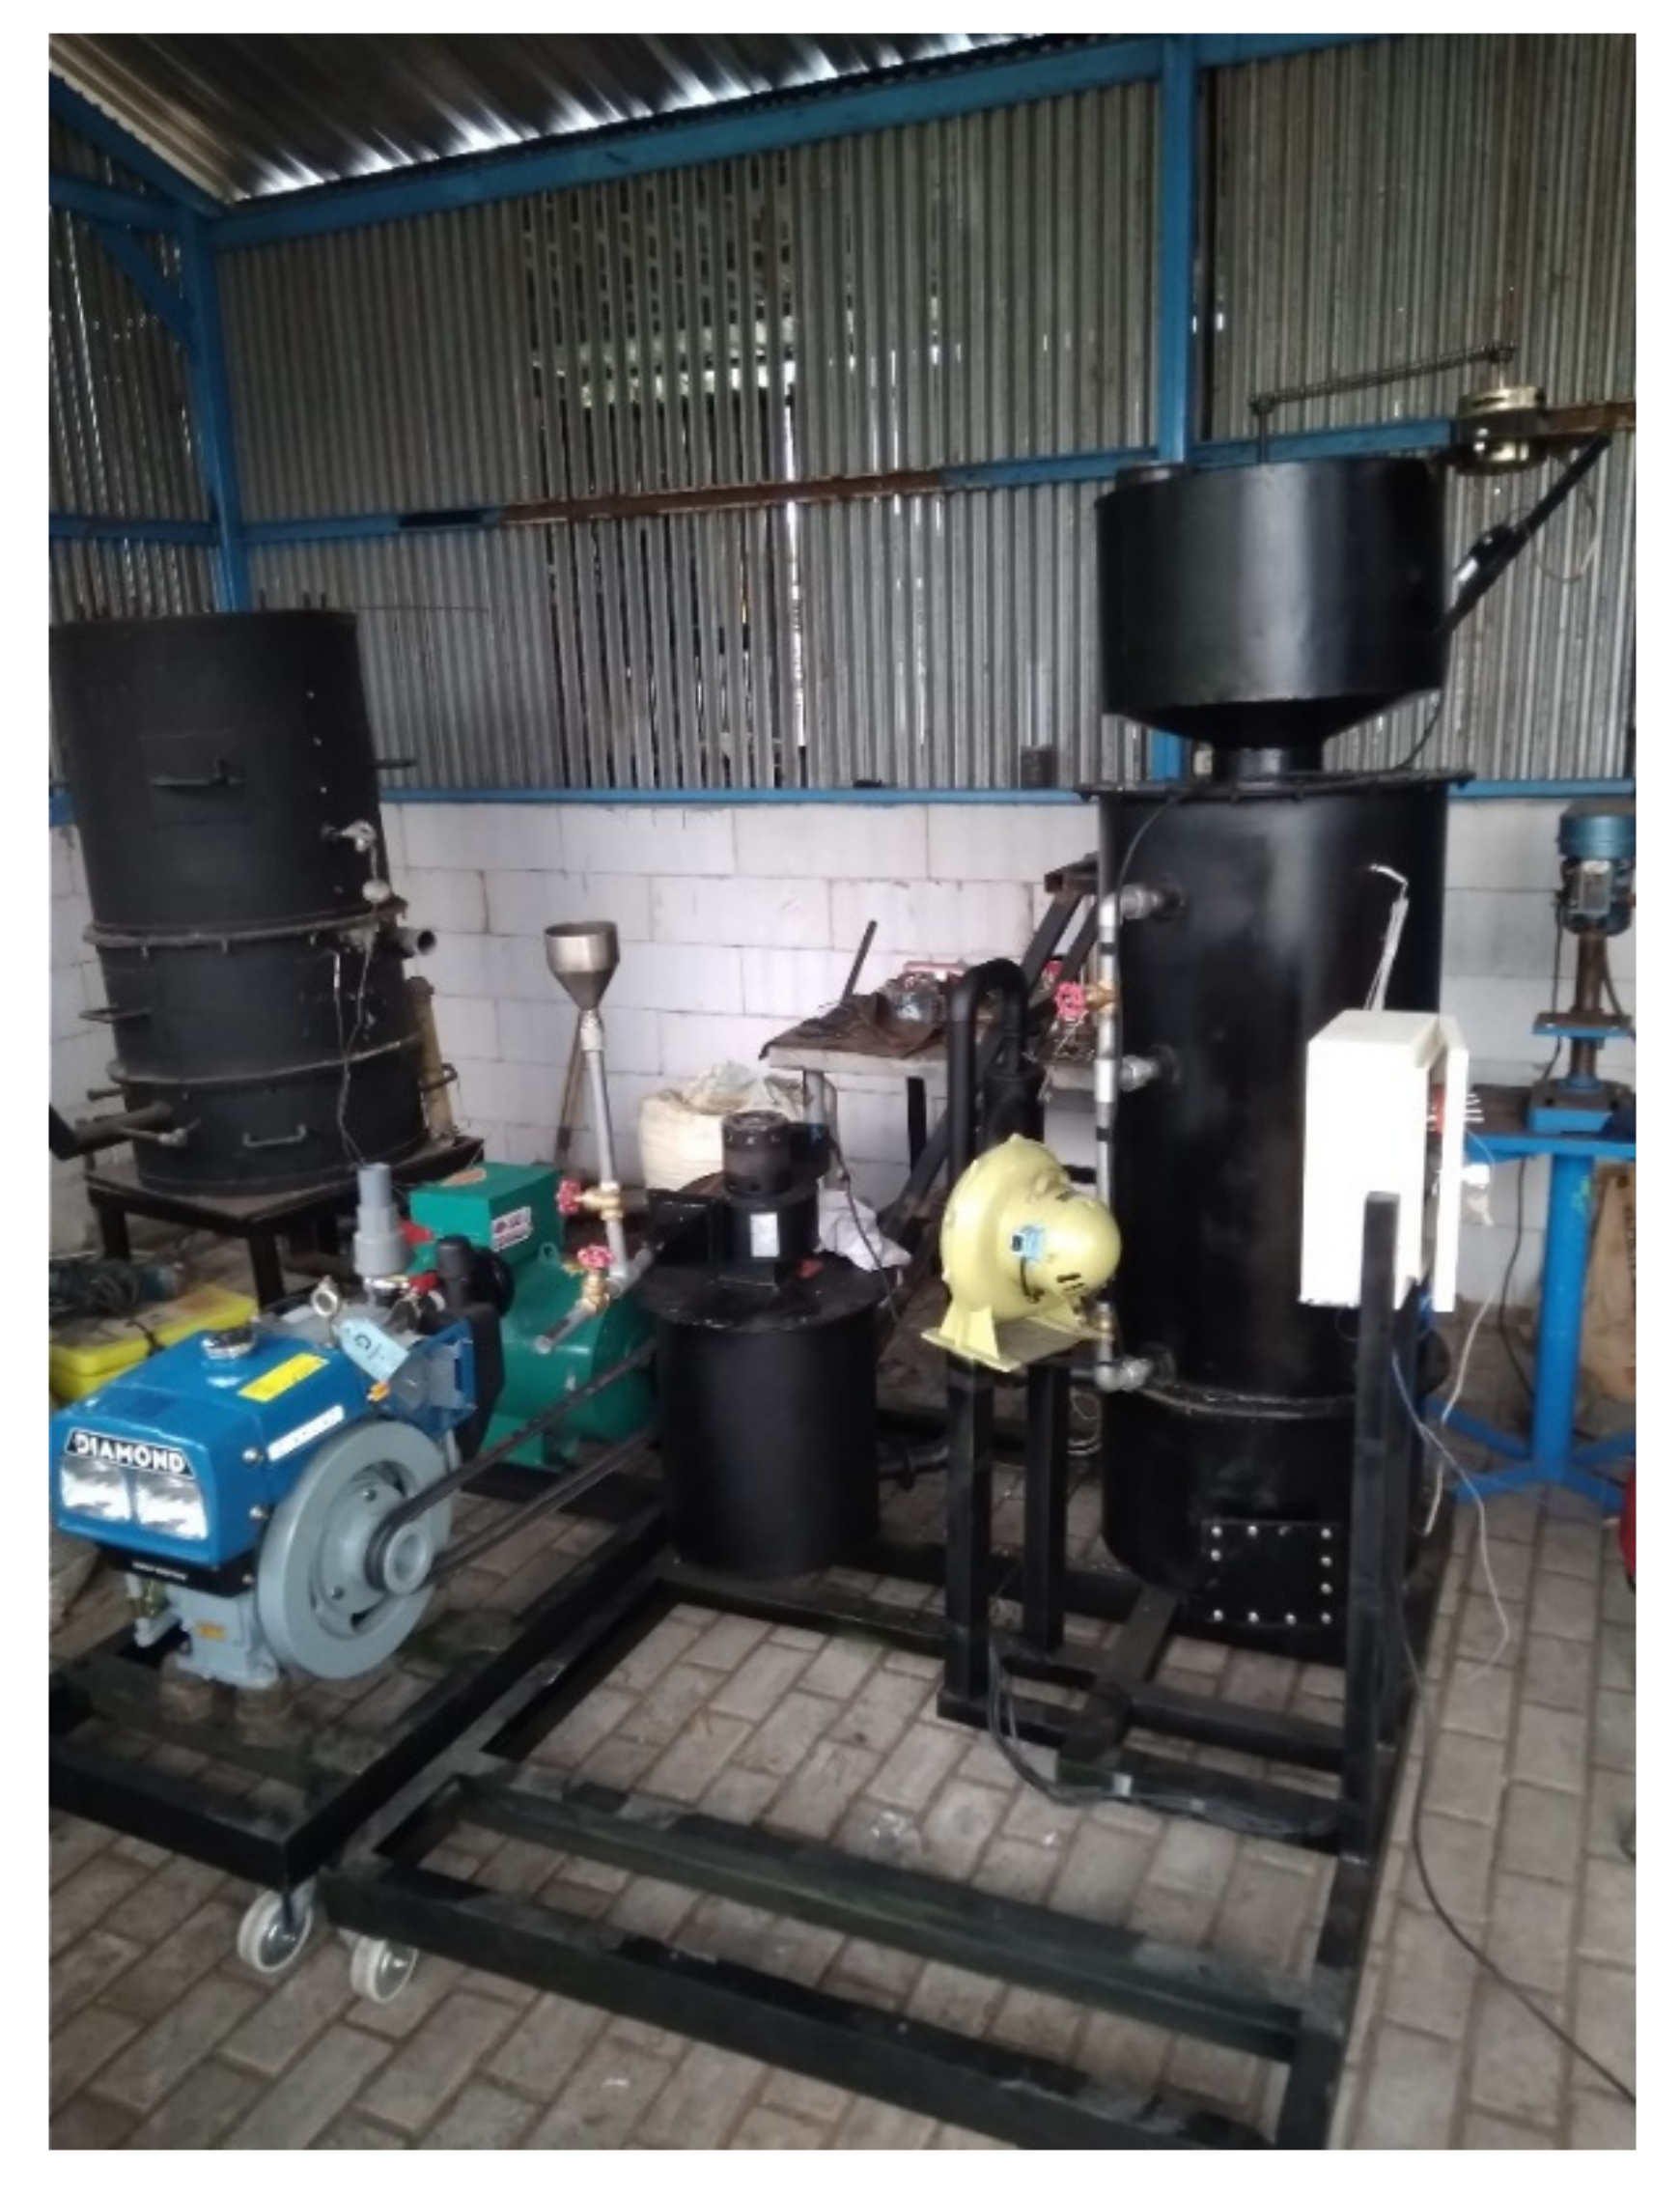
The aim of this study was to analyze the utilization of oil palm plantation waste as fuel in gasification power plants. The analyses simultaneously carried out were technical, economic, investment risk, social, and environmental impact analyses. Oil palm plantation wastes used were oil palm fronds and oil palm trunks. Both of these plantation wastes have been reported by several previous studies and are suitable as feedstock for gasification. The power plant analyzed was upscaled from a laboratory-scale prototype with a capacity of 10 kW, which has been reported in previous studies, to a small-scale power plant with a capacity of 100 kW. The gasification technology used the multi-stage downdraft gasifier [
20]. This technology has the advantage of being able to produce syngas with a high–low heating value and a low tar content of 2.6 times compared to the single-stage downdraft gasifier that has been reported in other studies. Moreover, this multi-stage gasification technology was also equipped with an air heating system that was also capable of producing low tar content up to 27.8 mg/Nm
3 and temperature increases at the partial oxidation zone with a constant equivalent ratio [
18].
Several previous studies using gasification technology for power generation have been carried out. Romaniuk [
21] conducted research by utilizing agricultural waste as fuel in gas generators. Modification of the gas generator was conducted by adjusting the supply of oxidizer (air supply) into the reaction zone. A downdraft-type gasification power plant with a capacity of 25 kW was also developed by ENTRAGE Energies System AG, using a 4.3 L six-cylinder petrol engine coupled to an electric generator. A downdraft-type gasification power plant was also developed by ALL POWER LABS with a power output of 15 kW [
21,
22]. The gasifier was coupled to a four-cylinder diesel engine and an electric generator. Currently, one of the largest biomass power plants is located in the UK, near Cheshire, and it produces 21.5 MW of electrical energy. A gasification power plant with a capacity of 100 kW in current market conditions is more profitable than a larger capacity provided that the fuel used is not difficult to supply [
23]. Situmorang [
24] reports that gasification power plants can be used to utilize locally available biomass as fuel with a generating capacity of less than 200 kW.
Before the power plant was implemented, it was necessary to evaluate the feasibility and sustainability of the project in terms of economic, social, and environmental as well as the risk variables that could hinder the success of the project. Some analyses that needed to be conducted were techno-economic, risk, and social–environmental. Techno-economic analyses of gasification power plants have been carried out in several previous studies. Porcu [
25] conducted a techno-economic analysis of a gasification power plant being upscaled from 500 to 200 kW using a bubbling fluidized bed gasifier. Singh conducted a techno-economic analysis of hybrid power plants between gasification, solar PV, and fuel cells, but the gasification technology used was not mentioned. Economic and environmental impact analyses of an 11 MW capacity gasification power plant were carried out by Cardoso [
23], and the results of the study reported that the NPV was influenced by revenue from electric sales. Sobamowo [
26] conducted a techno-economic analysis of a gasification power plant using downdraft gasification technology with a capacity of 60 MW; the results of the study reported that the distance between the power plant and the source of raw materials affected the raw material costs. Moreover, local materials for capital investment, maintenance, and fuel costs provided higher profit margins.
Emiliano [
27] conducted a techno-economic assessment of power plants with gasification technology. The results of the study reported that the price of gaseous fuel (i.e., natural gas) dramatically affects the economics of the power plant project. In addition, power efficiency and the selling price of electricity can produce a higher NPV. Cali [
28] conducted a techno-economic analysis of the FOAK industrial gasification plant. The results of the study reported that the cost of fuel dramatically affects the cost of electricity (COE), and the economic results can be increased by technical development to reduce operating costs. Kivumbi [
29] conducted a techno-economic analysis of a gasification power plant with a capacity of 425 kW using municipal solid waste as fuel. The results of the study reported that for small-scale power plants, a high interest rate causes the return on investment to be longer, so it is not appropriate. In addition, the distance between the source of raw materials and power plants affects the total cost of transportation to increase the cost of electricity production. Gokalp [
30] conducted a techno-economic analysis of a gas tire scrap power plant capacity of 5 MWe. The gasification technology used was a circulating fluidized bed. The results of the study reported that the price of raw materials dramatically influences the financial result, but if it cannot be reduced, the efficiency of the gasification system needs to be increased. Based on the results of the published techno-economic analyses, various variables affect the financial results of a gasification power plant and are different for each region, the type of raw material used, and the planned generating capacity. Moreover, most publications only discuss the economic analysis, and only a few discuss investment, social, and environmental risk analyses simultaneously, while these are interrelated. The generating capacity analyzed was also medium- to large-scale, while for the microscale, the literature is still limited.
This research is critical because of the limitations in the literature on technical and economic analyses; specifically, it was a small-scale 100 kW gasification power plant that utilized oil palm plantation waste as the primary fuel. In this study, the technical analysis carried out to calculate the capacity of the gasification system was based on the type of solid fuel and internal combustion engine. Meanwhile, the economic analysis conducted was calculated as the net present value (NPV), internal rate of return (IRR), benefit-to-cost ratio (B/C), and payback period (PBP). The investment risk was also analyzed using the Monte Carlo method. Furthermore, the final analysis carried out was an analysis of the social and environmental impacts due to the gasification power plant.
3. Result
3.1. Techno-Economic Analysis
In this study, the analysis was conducted for the utilization of oil palm plantation waste converted into electrical energy using gasification technology in Indonesia. The analysis was conducted close to the actual condition, and the analysis was carried out based on a literature study that was conducted for potential bioenergy investment, especially biomass in Indonesia.
The oil palm plantation waste was grouped into two types, namely, waste from plantations in the form of oil palm fronds and trunks and waste from the processing of oil palm into crude oil palm such as fiber, shells, empty fruit bunches, and liquid waste or oil palm mill effluent (POME) [
8]. From all types of plantation waste, the most significant potential was oil palm fronds with a total production of 49.41 million tons/year which were derived from the Sumatra region; 23.50 million tons/year in Kalimantan; 218 thousand tons/year in Java, Bali, and Madura; 2.17 million tons/year in Sulawesi; and 202.64 thousand tons/year in Papua. The total energy that can be generated from all the potential reaches 5495 Mwe [
6]. Palm fronds were chosen because they are always available on plantations and do not require a significant supply cost compared to other wastes. The waste from palm processing was owned by the company, so that if the community or other parties needed it, they must buy it first, while oil palm fronds can be taken for free and only require costs for transportation, chopping, and drying. Besides the oil palm fronds, oil palm trunk is also used as additional raw materials. However, due to the fact that it is only available during the replanting process, the amount was less if it was divided within one year. The total potential energy from oil palm trunk reaches 815 MW [
6].
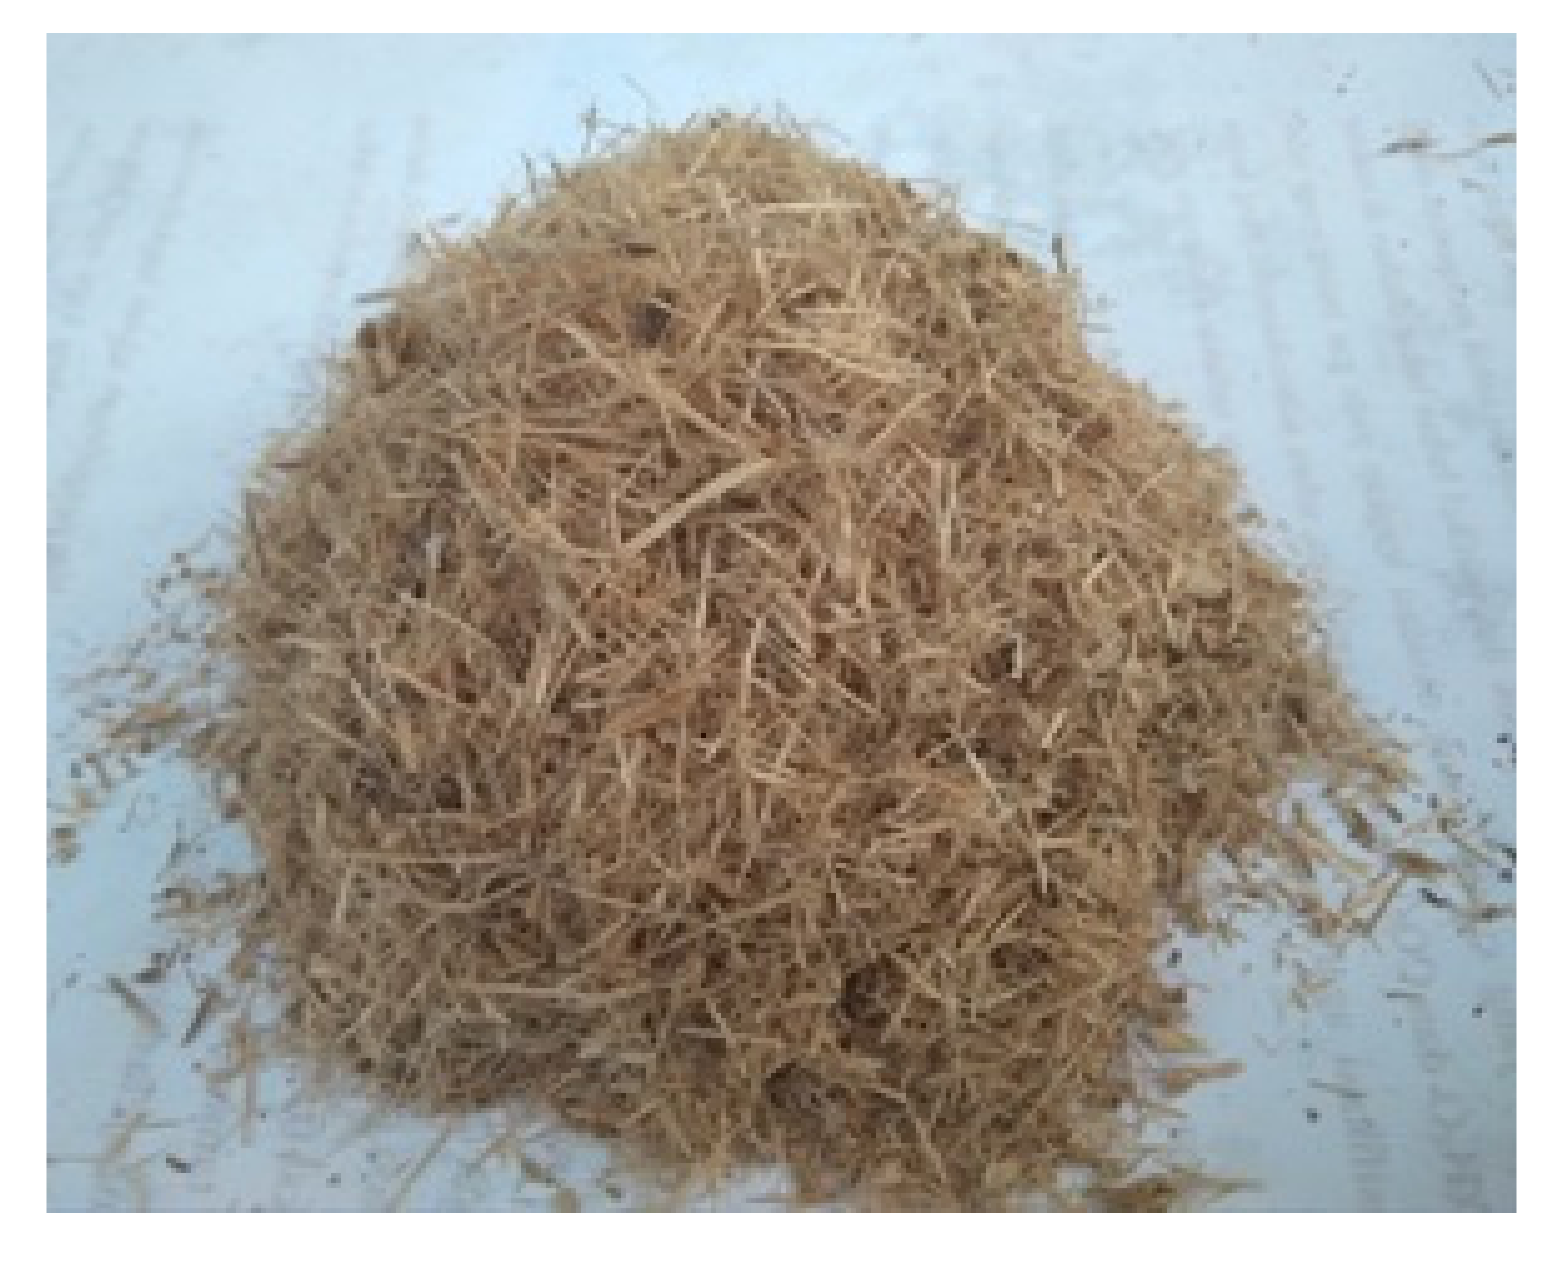
The first step for the raw material for oil palm fronds before use was to strip the leaves, then transport them to the power plant storage facility. The next step was to shred and dry them under the sun and then finally store them in a warehouse. The oil palm fronds were used as the primary fuel, and the oil palm trunks were use as the secondary fuel. When both were available, they were mixed with a percentage of 70% fronds and 30% trunk. The power plant was ideally placed close to the location of the plantation so that the cost of the transportation of the raw materials could be reduced [
23]. Based on the planned installed capacity, 1189 tons/day of raw materials were needed. Thus, at least 100 hectares of oil palm plantation were required. When compared with the areas of lands in Sumatra, Kalimantan, Sulawesi, and Papua, this plant can be placed anywhere because the existing land area was greater than the required minimum land area [
40]. The maximum moisture content of the solid fuel was 40%.
Actually, the oil palm fronds are not purely waste. So far, they have been left piling up beside the palm trees until they rot and become soil fertility. However, to reach this stage requires a long time. Thus, to maintain balance, not all the fronds produced were used entirely. As much as 70% of the waste was utilized, and the remaining 30% was left as soil fertilizers. Although the availability of the land area was quite extensive, most of the landowners were companies, while a limited amount was owned by the community. Cooperation between the power plant manager and the company was needed to ensure the availability of raw materials and the sustainability of the power plant in the future. The biomass power plant with gasification technology was expected to operate for 20 years with a construction period of one year. The plant works 355 days a year and has a ten-day shutdown schedule for maintenance.
Following its capacity, the number of employees needed to operate the power plant was estimated at six people, consisting of one manager, two operators, two technicians, and one administrator. Economic analysis was conducted by predicting the cost components associated with power plant construction, starting from the planning stage to the implementation stage.
3.1.1. Investment Cost
The investment costs were calculated based on an investment analysis for power plants of the same scale used as a reference in this study. The power plant with a capacity of 10 kW was built in 2017. All costs were converted from IDR to USD. The exchange rate in 2019 for USD 1 was IDR 14,012.73, while the IDR to USD currency exchange rate in the year the reference power plant project was IDR 13,693. The breakdown of capital costs refers to the IRENA [
41] and are presented in
Table 3.
3.1.2. Operating Cost
The operating cost component was the costs incurred each year for power plants, which consisted of raw material costs (consisting of costs for providing raw materials and transportation), operating and maintenance costs (O&M), tax burden, and annual depreciation costs. Operating and maintenance costs included the costs of providing electricity, clean water, ash disposal, engine component replacement, and the gasifier component. This also included costs for labor, consisting of basic salaries, benefits, and health insurance. Office operational costs consisted of administrative costs, office stationery, official travel, and transportation costs. Electricity needs for plant operations were calculated based on the number of operating hours for one year. Details of the cost of electricity needs for the plant are presented in
Table 4.
The cost component of the solid fuel is the cost of collecting, cutting, and transportation from the source of the solid fuel to the location of the power plant. Oil palm fronds are not purchased but rather harvested from trees, collected, and transported. The cost component was harvesting, transportation, and labor costs, while for oil palm trunk, the costs incurred were logging costs. Costs incurred to produce electricity were calculated based on the standard O&M cost for diesel engines from IRENA 2018 of
$0.008/kWh [
41]. The O&M cost component for diesel engines was obtained by multiplying yearly electric production by the standard O&M cost from IRENA. Fuel costs consisted of biomass and diesel because they were operated in dual fuel. The percentage of syngas substitution against diesel was a maximum of 60%. Details of the electricity production costs are presented in
Table 5.
3.2. Gasifier Upscaling
The capacity of the power plant that was analyzed economically was 100 kW. Based on the technical aspects, the diesel engine and gasifier were upgraded. The selected diesel engine was Cummins 6BT5.9G2, which was coupled with a 100 kVA generator. The technical specifications can be seen in
Table 6.
Based on the engine specifications, the output capacity was calculated using the method by Kivumbi [
29] with the results shown in
Table 7.
Furthermore, after the capacity of the diesel engine was known, the specifications of the gasifier could be calculated using the method used by Kivumbi [
29] with the results presented in
Table 8.
Based on the parameters of the diesel engine and gasifier that were calculated, the electrical energy output capacity was calculated, and the results obtained are presented in
Table 9. The number of operating days for one year was assumed to be 355 days, with 42.6% electricity production efficiency. Total electricity production per day was 839.13 kWh/day, so that the total electricity production for one year is 297,891.57 kWh/year.
3.3. Revenues
Revenue was obtained by multiplying the total electricity production for one year with the price of electricity following the state power plant standard for renewable energy, which was
$0.121/kWh. Electricity consumption costs for the plant reduced gross revenue. Detailed calculations for the power plant are presented in
Table 10.
3.4. Financial Assumption
The financial assumptions used in this study included the operating life of the plant and the interest rate presented in
Table 11. Each year, it was estimated that all costs and selling prices would experience inflation of 2% [
26]. The net present value was calculated using an interest rate of 8%.
3.5. Economic Feasibility Analysis
An economic feasibility study was carried out to decide whether the investment in the power plant that is to be carried out was profitable and feasible for investment. The conducted economic analysis was the NPV, PBP, and the IRR [
43]. The NPV calculation was conducted by calculating the present value of cash flows for a certain period. The calculated cash flow was the difference between the benefits and costs for each year the NPV was determined. The equation to calculate the NPV is shown below [
23]:
where i is the interest rate, N is the number of periods (years), C
y are number of cash inflows in year y, and C
y = 0 is the total investment of the first year plus cash outflows. Interest rates were used to calculate the discount factor and present values for costs and benefits. The operating period was assumed to be 20 years [
25] with an interest rate of 8%. After calculating, if the NPV was positive, the investment was profitable and vice versa. Thus, if t was profitable, capital costs could be returned during the operating period.
The internal rate of return was analyzed based on the accumulation of NPV values. IRR is the present value of costs and benefits. Investment can be made if the IRR value is higher than the interest rate and vice versa. The equation used to calculate IRR was as follows [
23]:
The initial investment cost is the total investment cost in the first year, i is the interest rate, and y is the current year. The payback period was analyzed to determine the cost for each year so that the initial investment costs could be returned. The equation used to calculate the payback period is as follows [
23]:
Risk analysis on the choice of inputs was used to generate electricity per kWh using a standard deviation approach. The approach tries to categorize the different input types of fuel from oil palm waste for mechanization of energy generation. The equation used for calculating the standard deviation was as follows:
3.6. Techno-Economic Analysis
The economic analysis was carried out on a power plant that was scaled up from 10 kW to 100 kW. A sensitivity analysis was carried out by looking at the effect of the percentage increase in construction costs, the price of biomass fuel, and the price of diesel fuel on the economic value of the project. The sensitivity analysis of the investment costs to produce each kWh of electricity was also varied to determine the investment costs that could produce an internal rate of return higher than the interest rate. In addition, a risk analysis was also carried out to see the effect of investment costs and operating costs on NPV [
25].
3.6.1. Economic and Sensitivity Analysis
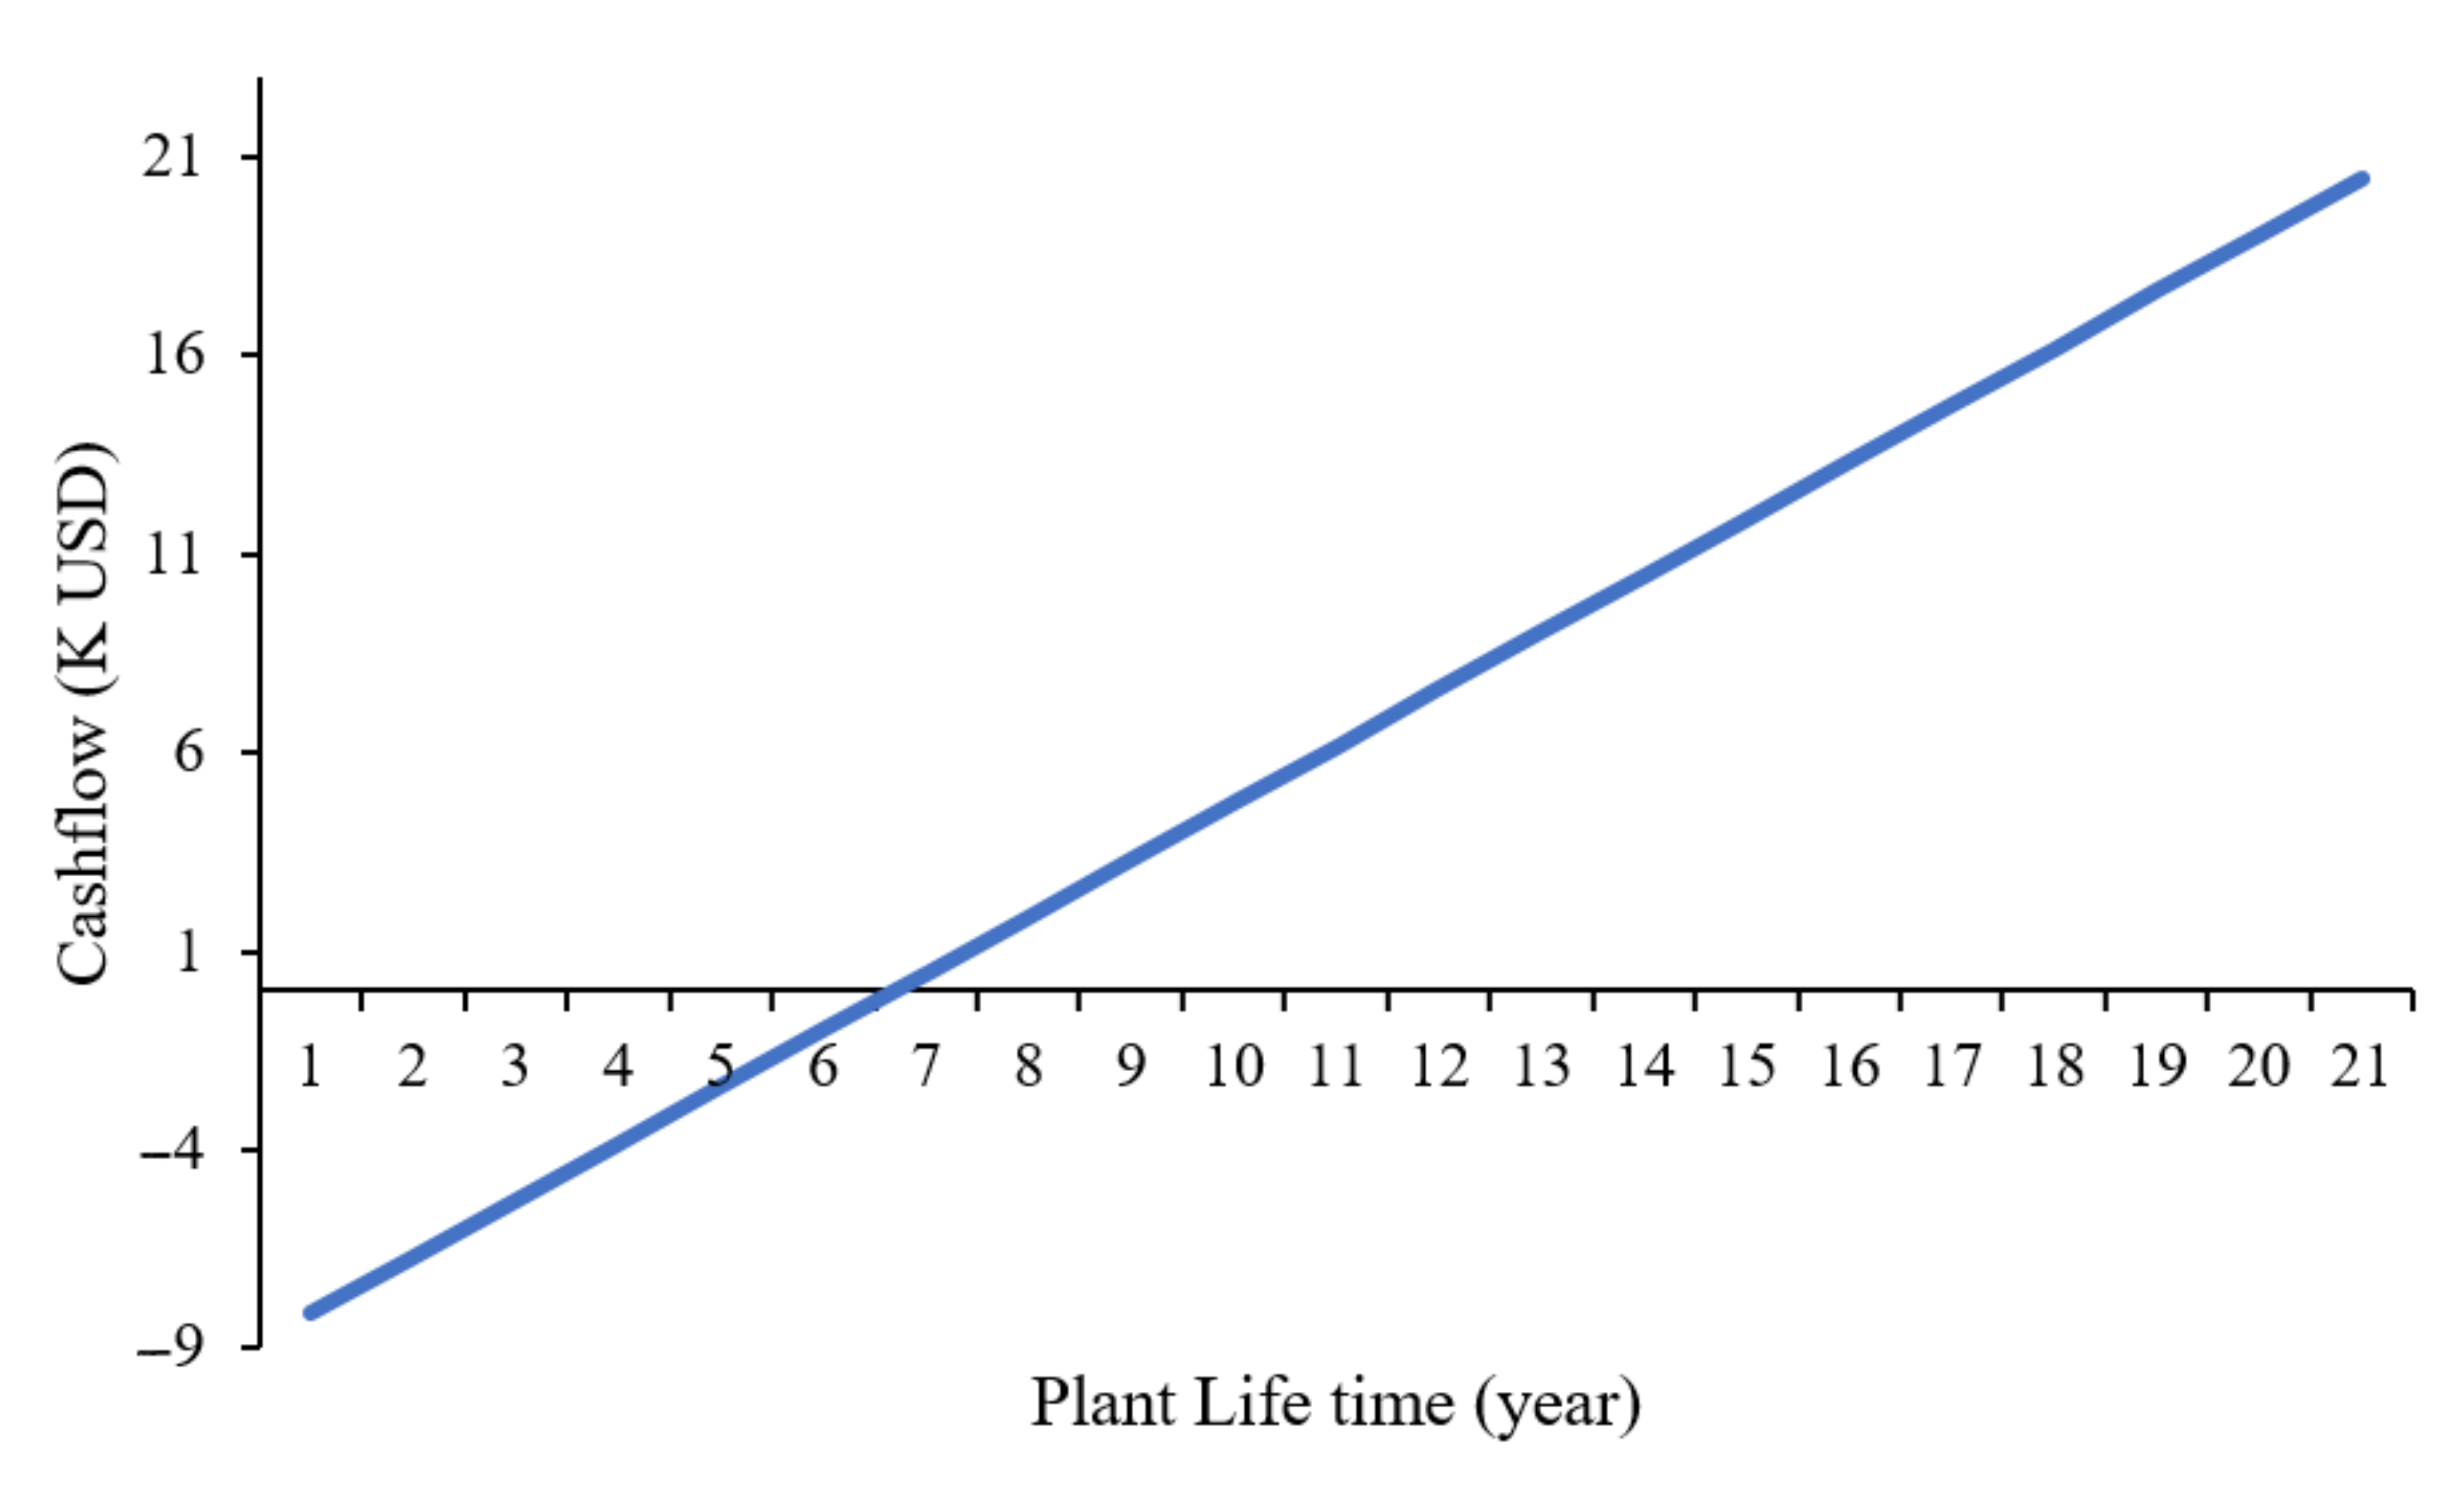
Based on the results of economic analysis, power plant investment can reach a break event point in the 6th year as shown in
Figure 5. With an interest rate base of 8%, the net present value was positive after accumulating for 20 years of operation at USD 48,846 as shown in
Table 12, which means this power plant project provides benefits. The ratio between cost and benefit was greater than 1, at 1.16. Meanwhile, the internal rate of return was also above the interest rate of 9.72%, so the investment was still profitable. The cost of electricity was still below the selling price from the state power plant of USD 0.083/kWh, where the selling price from the government was USD 0.121/kWh, so there was a difference of USD 0.037/Kwh as profit.
The sensitivity analysis was performed using the Crystal Ball software Version 11.1.2.4
® with 100,000 trials. The feature used was the decision table tool [
44,
45]. With this feature, we could simulate several different values or two decision variables. Interest rates varied from 7% to 12%. The results of this analysis are presented in
Table 12. The NPV continued to decrease along with the increase in the interest rate, but the value remained positive. The same trend also occurred in the IRR and B/C ratio. Even though the NPV was always positive, and the B/C ratio was above 1, the results showed that when the interest rate was at 10–12%, the IRR was already below the interest rate. Thus, investment had a percentage return that was greater than the interest rate if the interest rate was lower or equal to 9%. However, the value of the interest rate was a fluctuating value depending on the economic conditions of the Indonesian state.
Investment costs were also varied to determine the range of investment costs that still provided benefits. The range of investment costs, according to IRENA was from USD 950 to 1650/kW [
41]. If one looks at the comparison of the investment costs in
Table 13, in the range from USD 950 to 1100/kW, it was still profitable because the IRR was above the interest rate. Meanwhile, above USD 1100/kW, it was no longer profitable because the IRR was under the base interest rate. In this study, the investment cost, which was the base case, was USD 950/kWh.
The solid fuel that used for gasification was oil palm frond and oil palm trunk. When compared for the two fuels, as shown in
Table 14, oil palm trunk resulted in a higher NPV and IRR, which means that it was profitable to use oil palm trunk as fuel. The cost for oil palm trunk was
$0.025/kg, while oil palm frond was
$0.026/kg. The difference was because the oil palm frond requires additional harvesting costs for each period while the palm trunk does not. However, the use of oil palm frond and oil palm trunk is still profitable. The difference is only in the profit margin. However, the price for diesel fuel was a maximum at
$0.47/L or the price of subsidies from the government, so that IRR was above 8%.
The effect of diesel fuel price and the interest rate on IRR was also analyzed, and the results are presented in
Table 15. The diesel fuel price used as the base case was the price of a subsidy. If there was an increase in the price of subsidies, the investment remains profitable, as long as the maximum price of diesel fuel is
$0.47/L, with a maximum interest rate of 9%. This power plant was calculated to implement small villages with low to medium economic levels, and electricity was not used for extensive commercial activities. Thus, it was possible to use diesel fuel at a subsidized price as long as the price was no more than the maximum price above. If the price and interest rate were to exceed, the IRR value was under the base case of interest rate. The existence of subsidies from the government is very influential on the benefits to be obtained from a power plant project. In addition, the subsidy policy can also attract investors to make investments [
8,
41,
43].
The effect of feed-in tariffs on the NPV, B/C Ratio, and IRR was analyzed, and the results are presented in
Table 16. The simulation results of the feed-in tariff was below the base case of USD 0.12/kWh, the IRR was under the base case of interest rate. Thus, if there was a decrease in feed-in tariffs from the government under the base case, investment in power plants does not provide optimal benefits. Based on the pattern of increasing feed tariffs in Indonesia to date, it always increases over a specified period. Thus, the feed-in tariff can be assumed not to reduce return of investment period because the value continues to increase. However, decreases were still possible depending on changes in subsidies and political decisions.
3.6.2. Financial Risk Analysis
Financial risk assessment was carried out to evaluate the effect of economic parameters on investment risk. The risk analysis of the power plant project was carried out using Crystal Ball software
®. This software was chosen because of the ease of operation, and it is compatible with MS Excel
® [
44]. Another advantage, was that various types of data distribution can be chosen according to needs. The simulation was conducted with 1,000,000 iterations. The Monte Carlo method was used for the risk analysis as it calculates with the technique of statistical sampling, operates with random input components, and has uncertainty [
25]. The input variable was simulated with several iterations and produced several data in the form of probabilities. The normal probability distribution was used. The selection of a probability distribution model in the Monte Carlo analysis was essential because it affects the accuracy of the simulation results [
43,
46,
47]. In addition, the number of iterations must also be adjusted to obtain convergence. With a greater number of iterations, the mean and standard deviation will be evenly distributed.
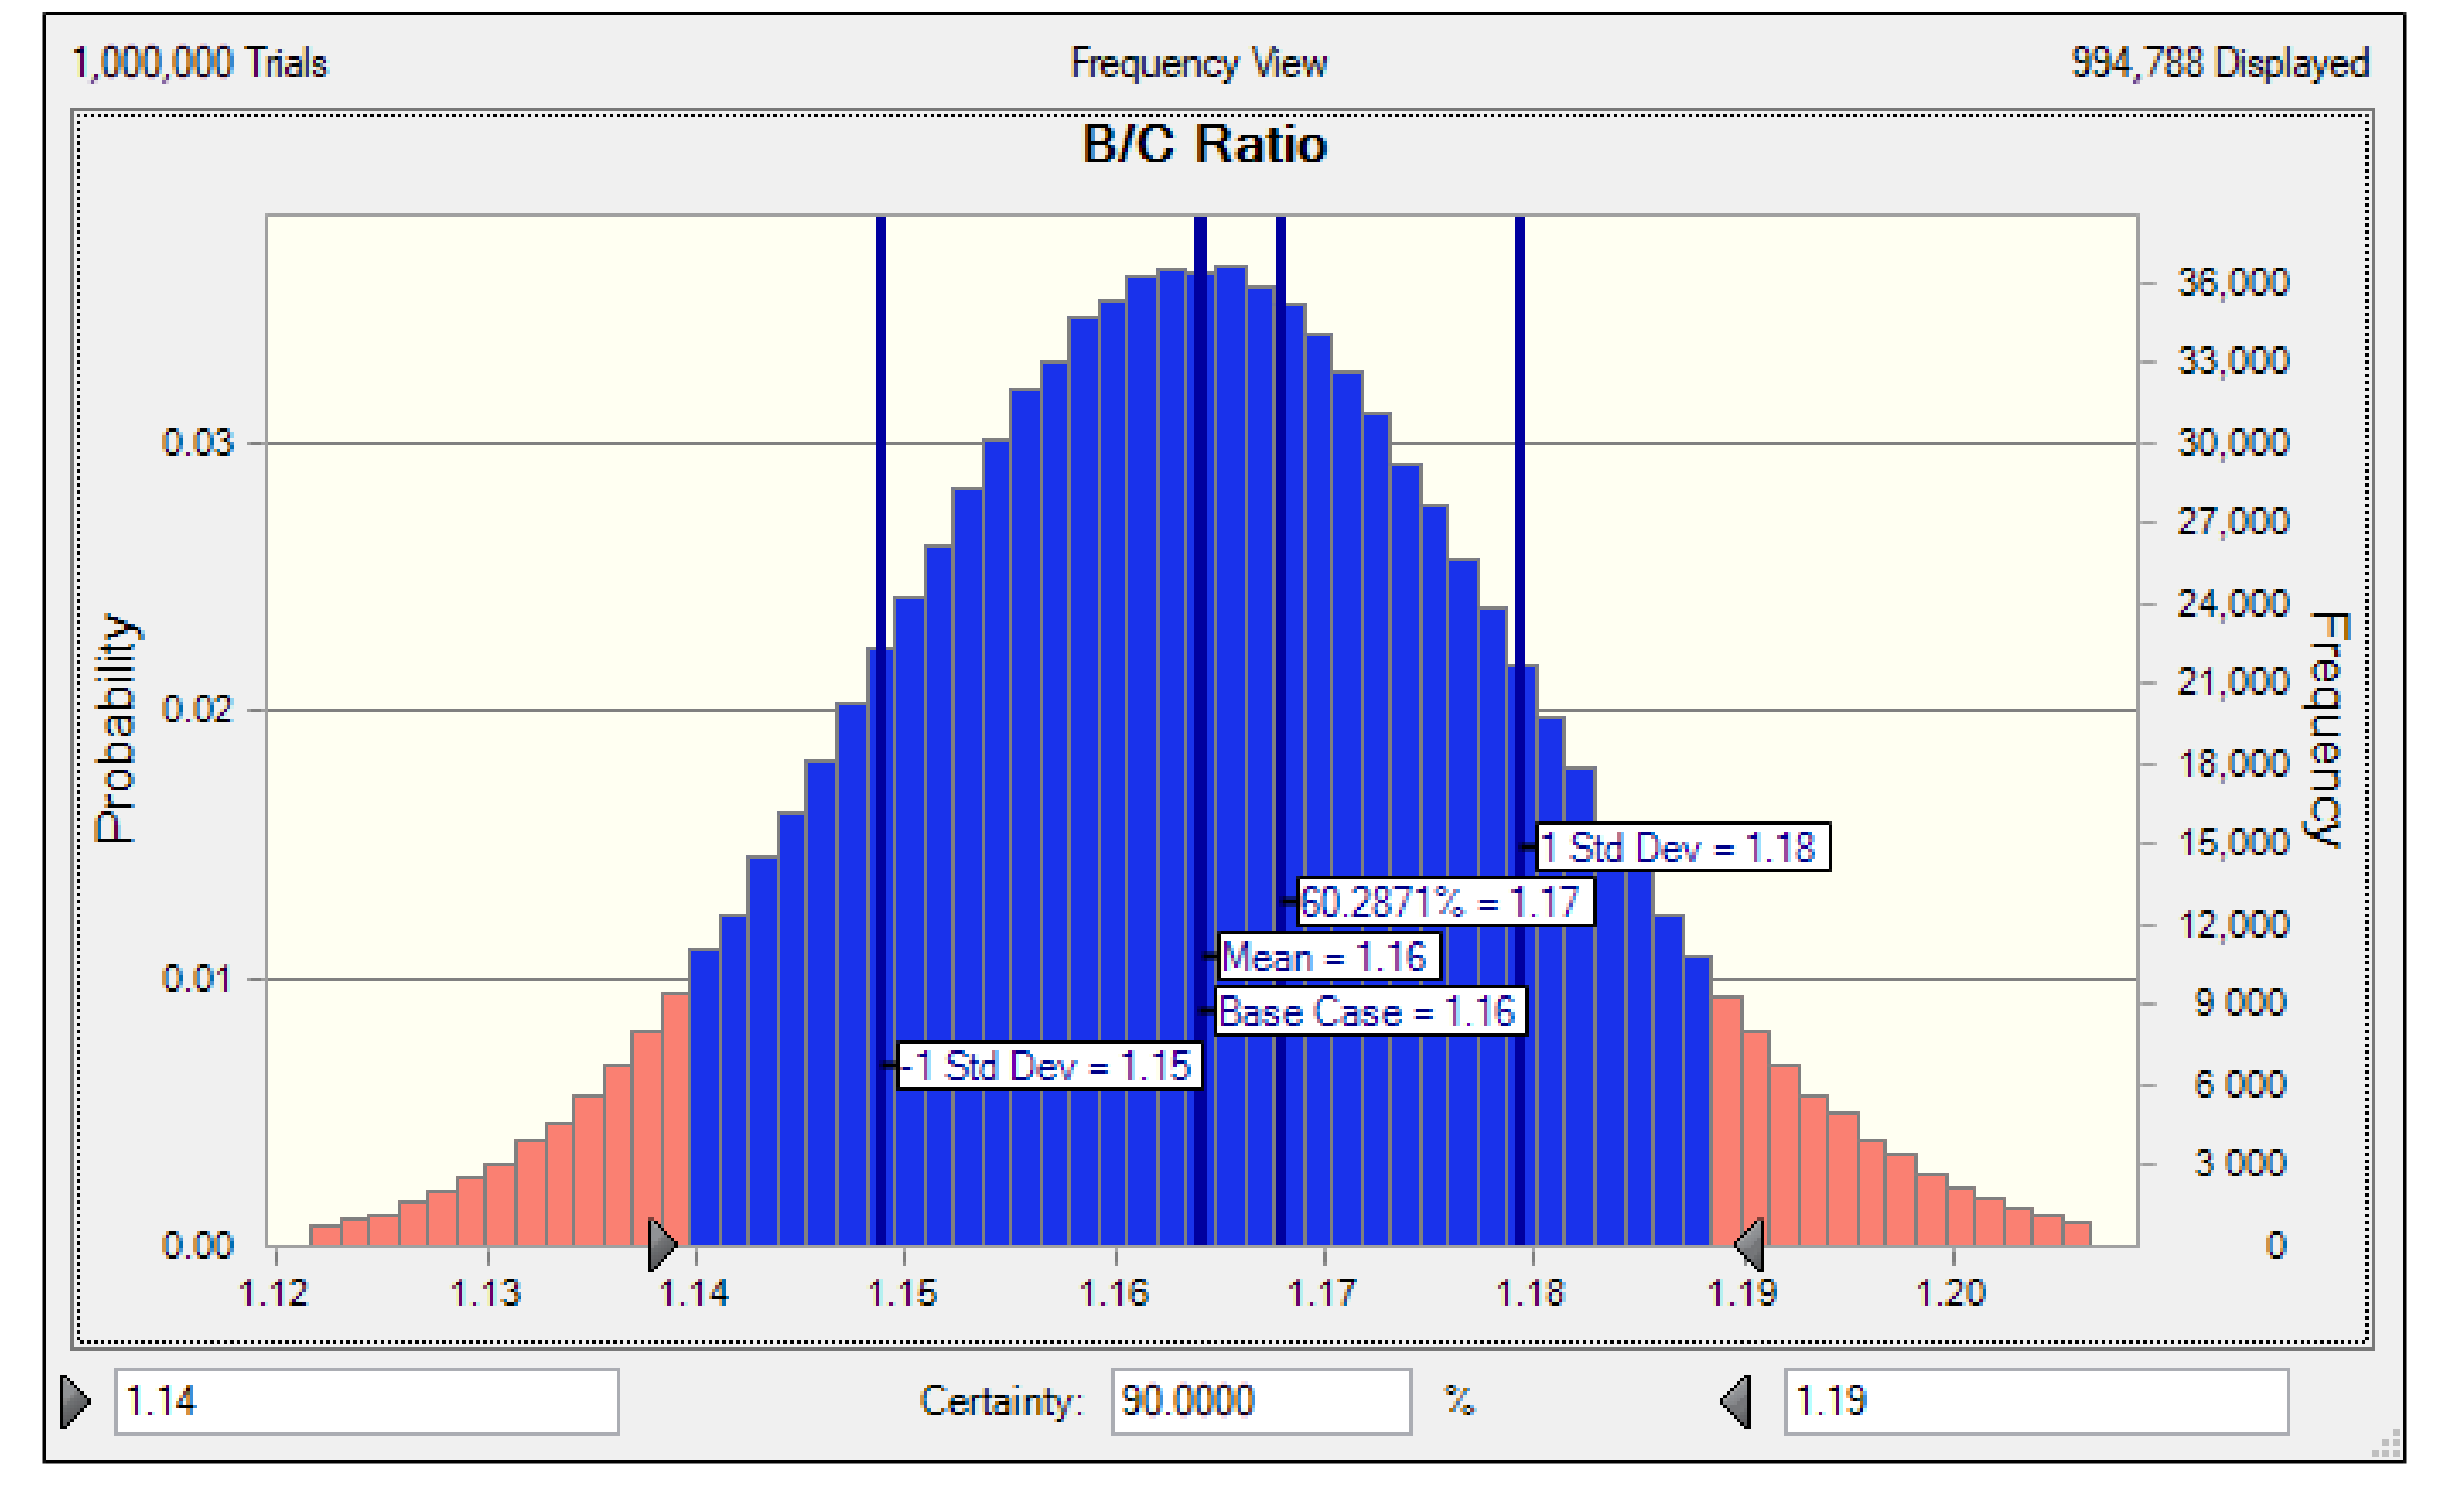
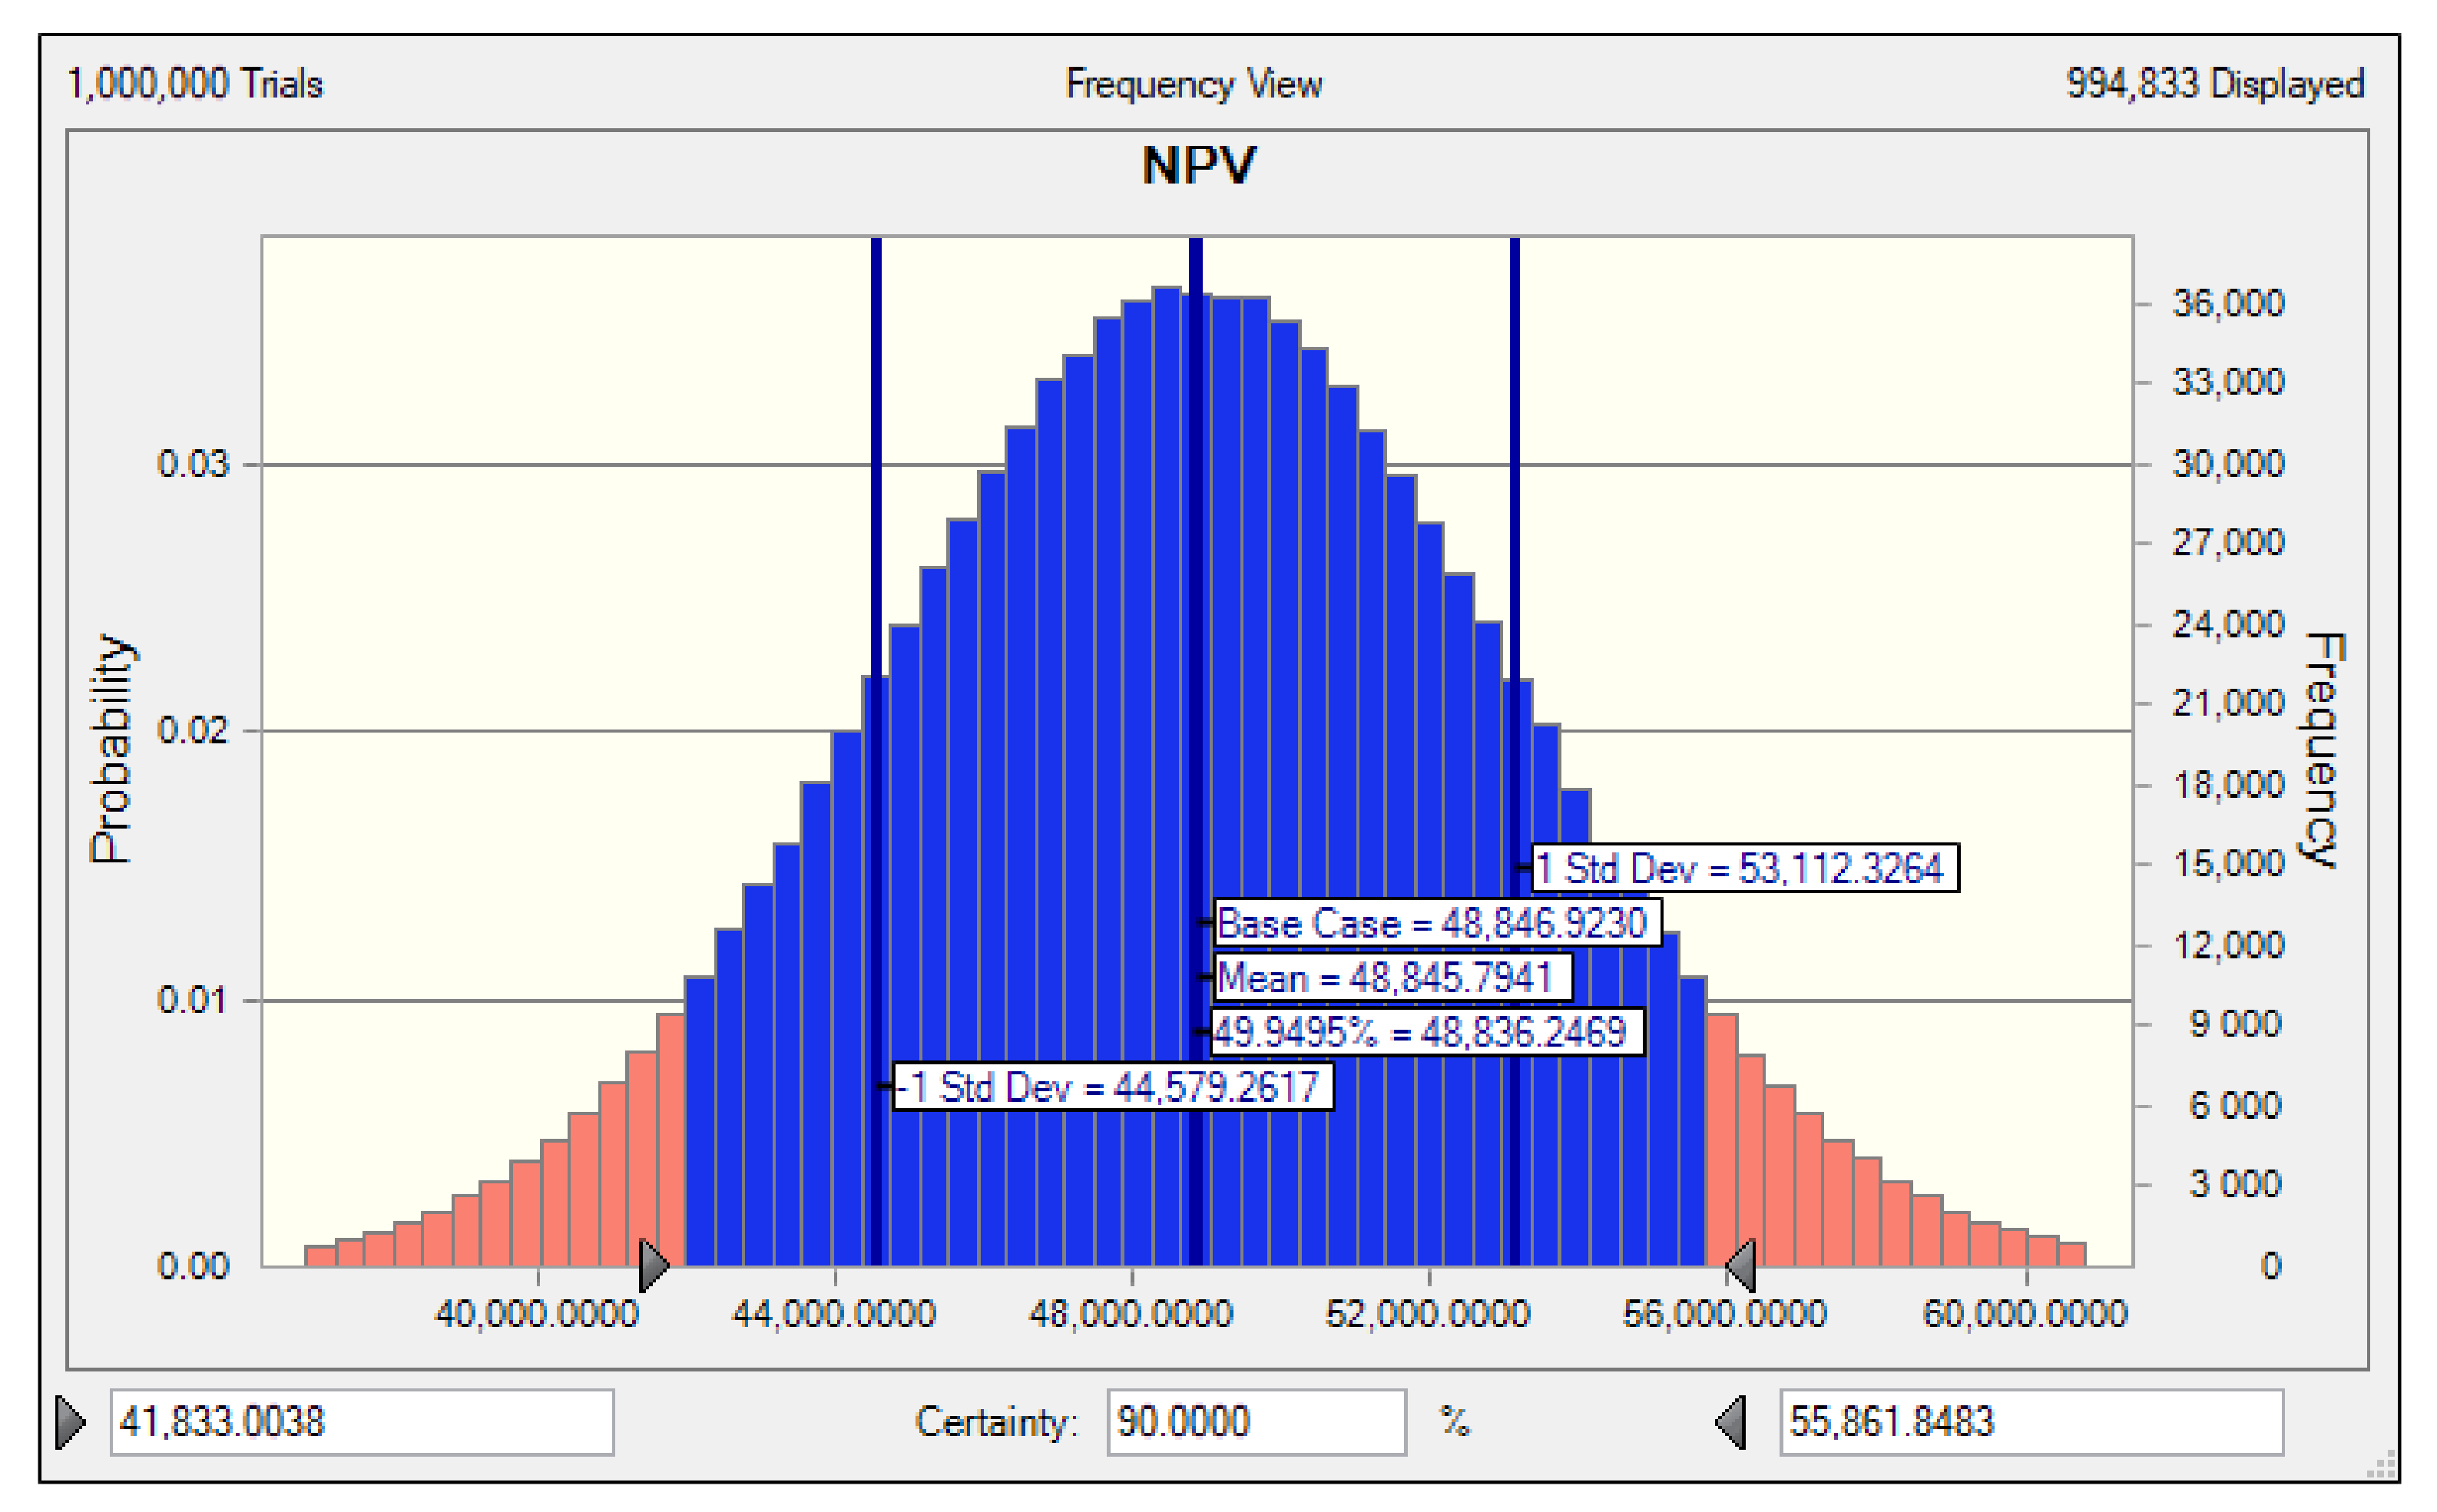
The risk analysis was carried out to look at the effect of capital cost, O & M cost, and revenue on NPV, IRR, and the B/C Ratio. They were assumed with a probability of 90% using a normal distribution and a standard deviation of 1% from the base case.
Figure 6,
Figure 7 and
Figure 8 show the forecast capital cost, O&M cost, and revenue. The results of the risk analysis are shown with a 90% confidence level and a 10% failure rate [
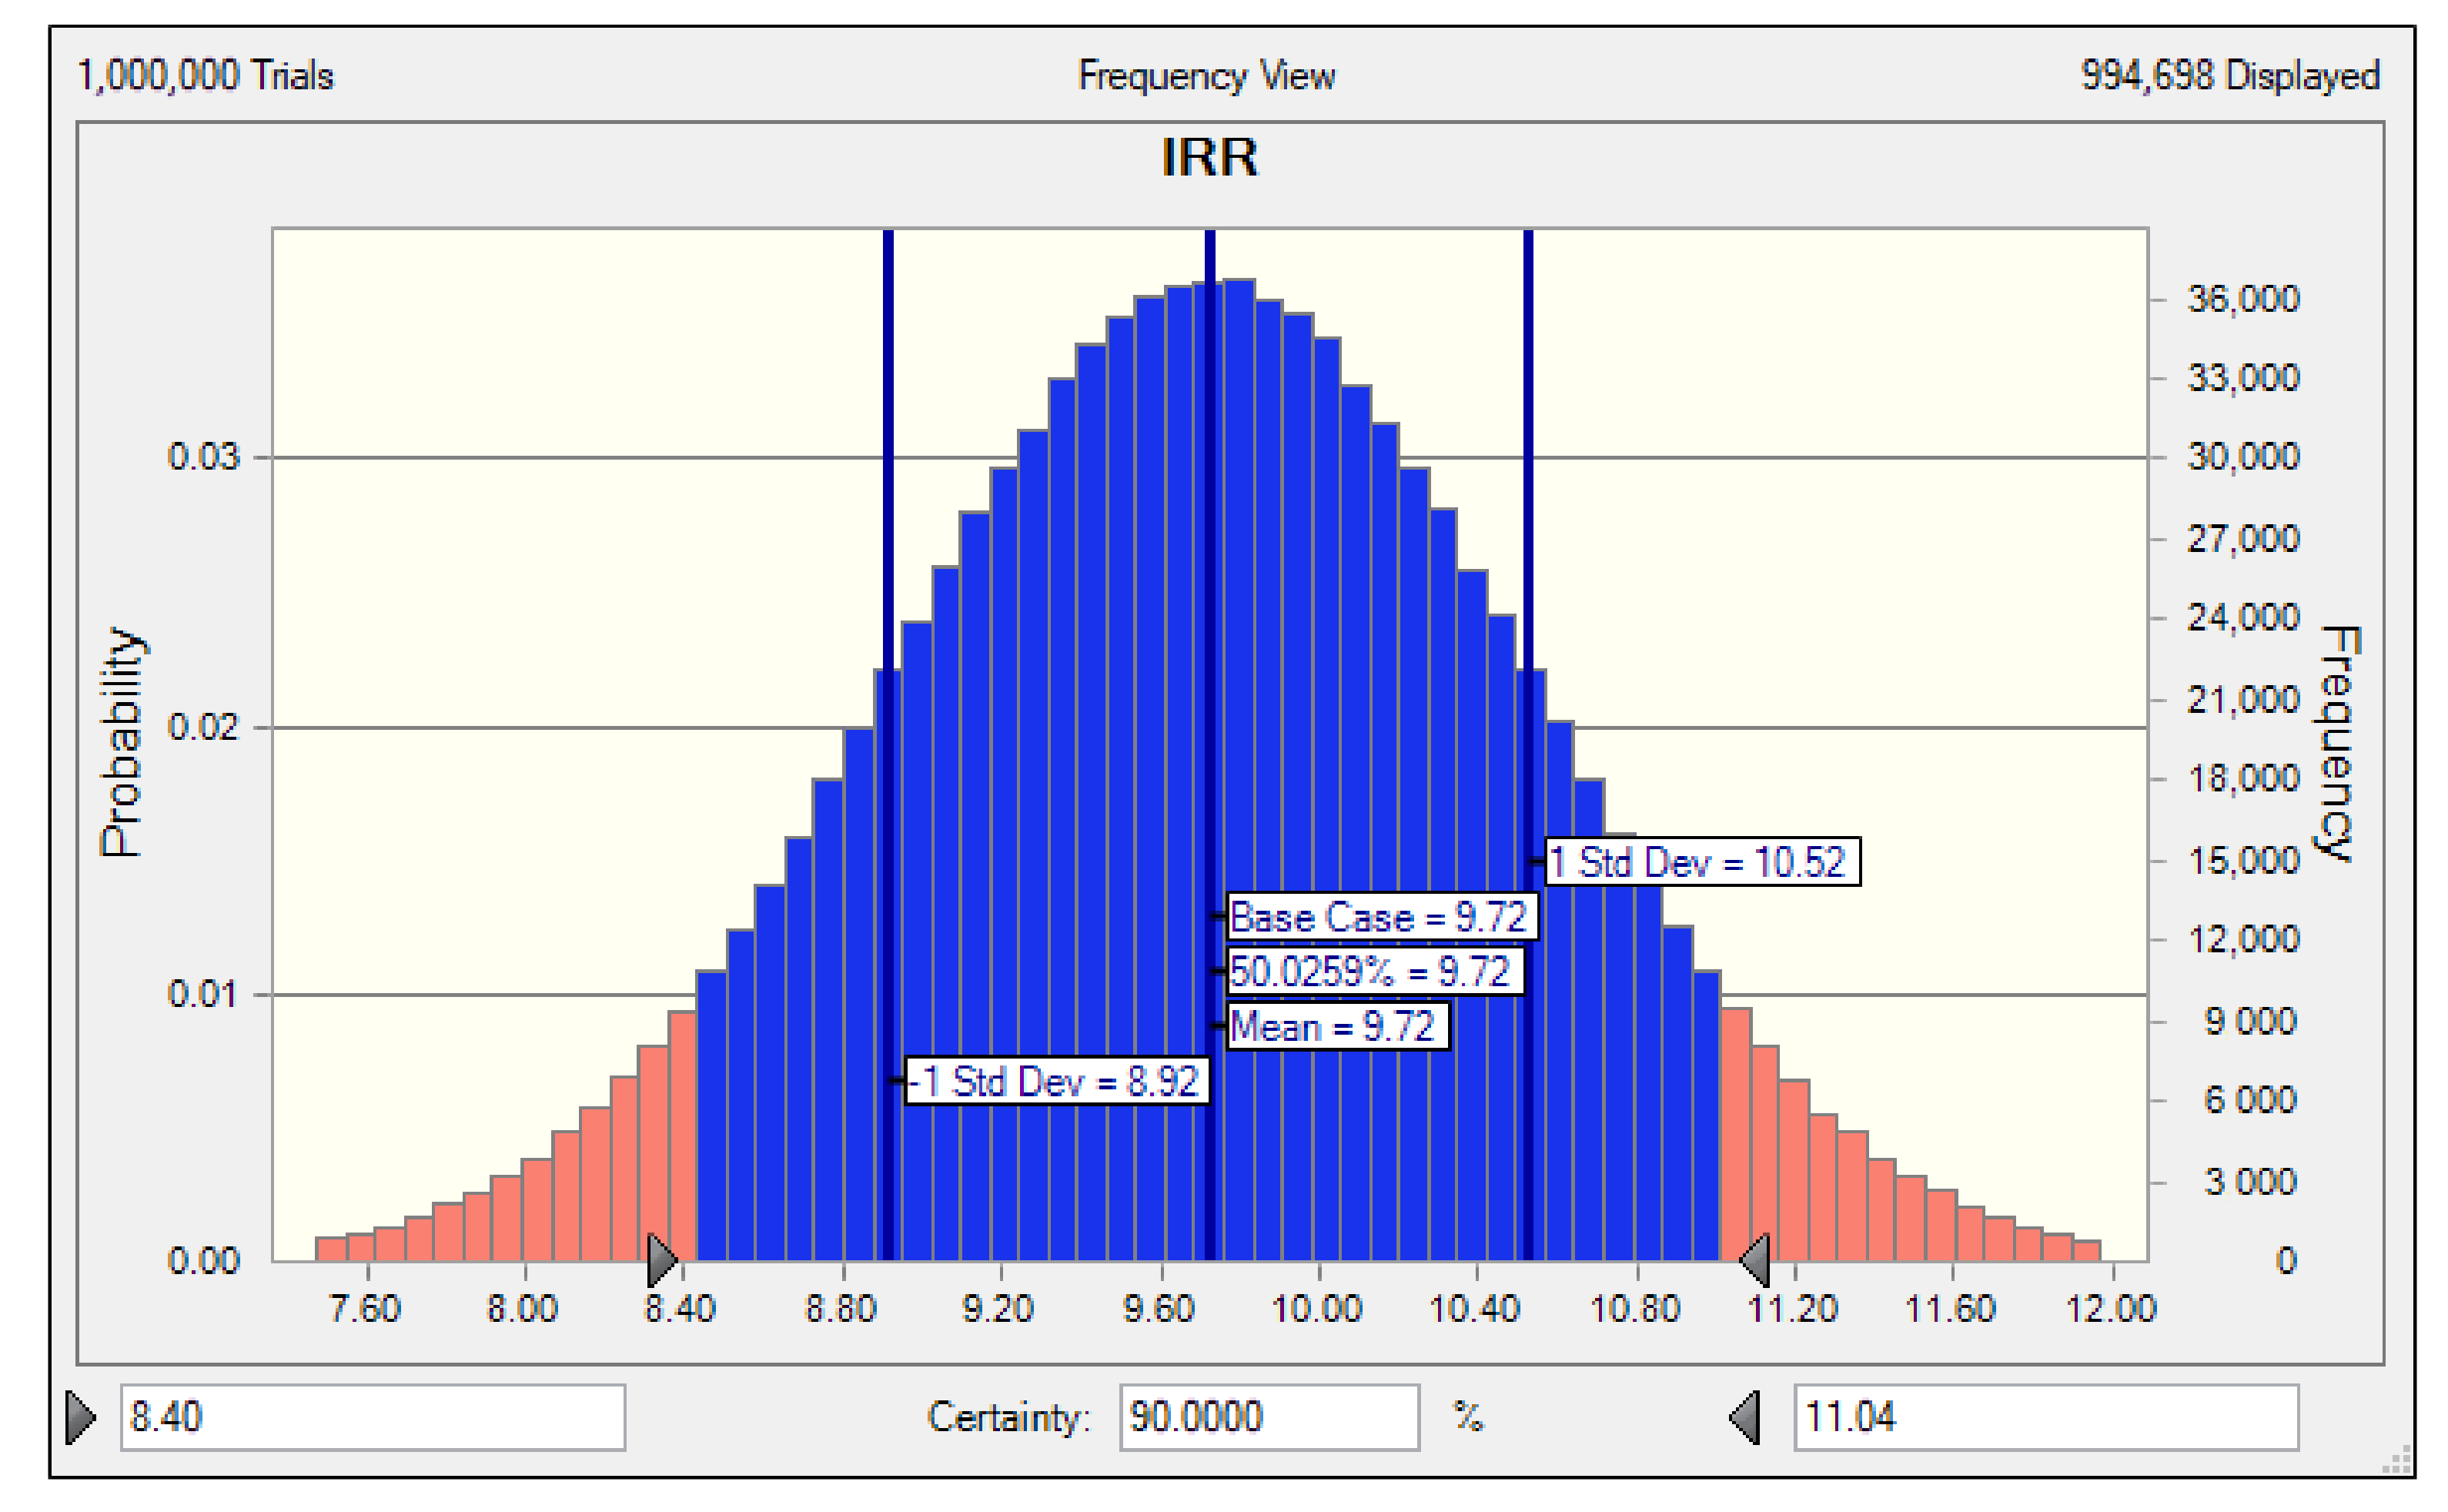
25] that over the past 20 years, the NPV range obtained was from USD 41,833 to 55,861. NPV was estimated to have an increase of 49.94% from the base case during the operating period of the plant, which means the power plant project can provide benefits to investors.
Meanwhile, the IRR with a 90% probability obtained between 8.40% and 11.04%, which means it was still higher than the interest rate. The percentage of IRR higher than the base case was 50.02%, and the percentage of IRR higher than the interest rate was 98.42%. B/C ratio forecast with 90% probability was obtained from 1.14% to 1.19% and had a percentage greater than the base case of 60.28%. Based on the results of the risk analysis, the probability of investment risk was relatively small because the NPV was always positive, and the IRR had the higher base case interest rate. Besides, with a 50% chance of NPV above the base case, results were very promising for investors because the estimated profits obtained during the operating life of the power plant were higher.
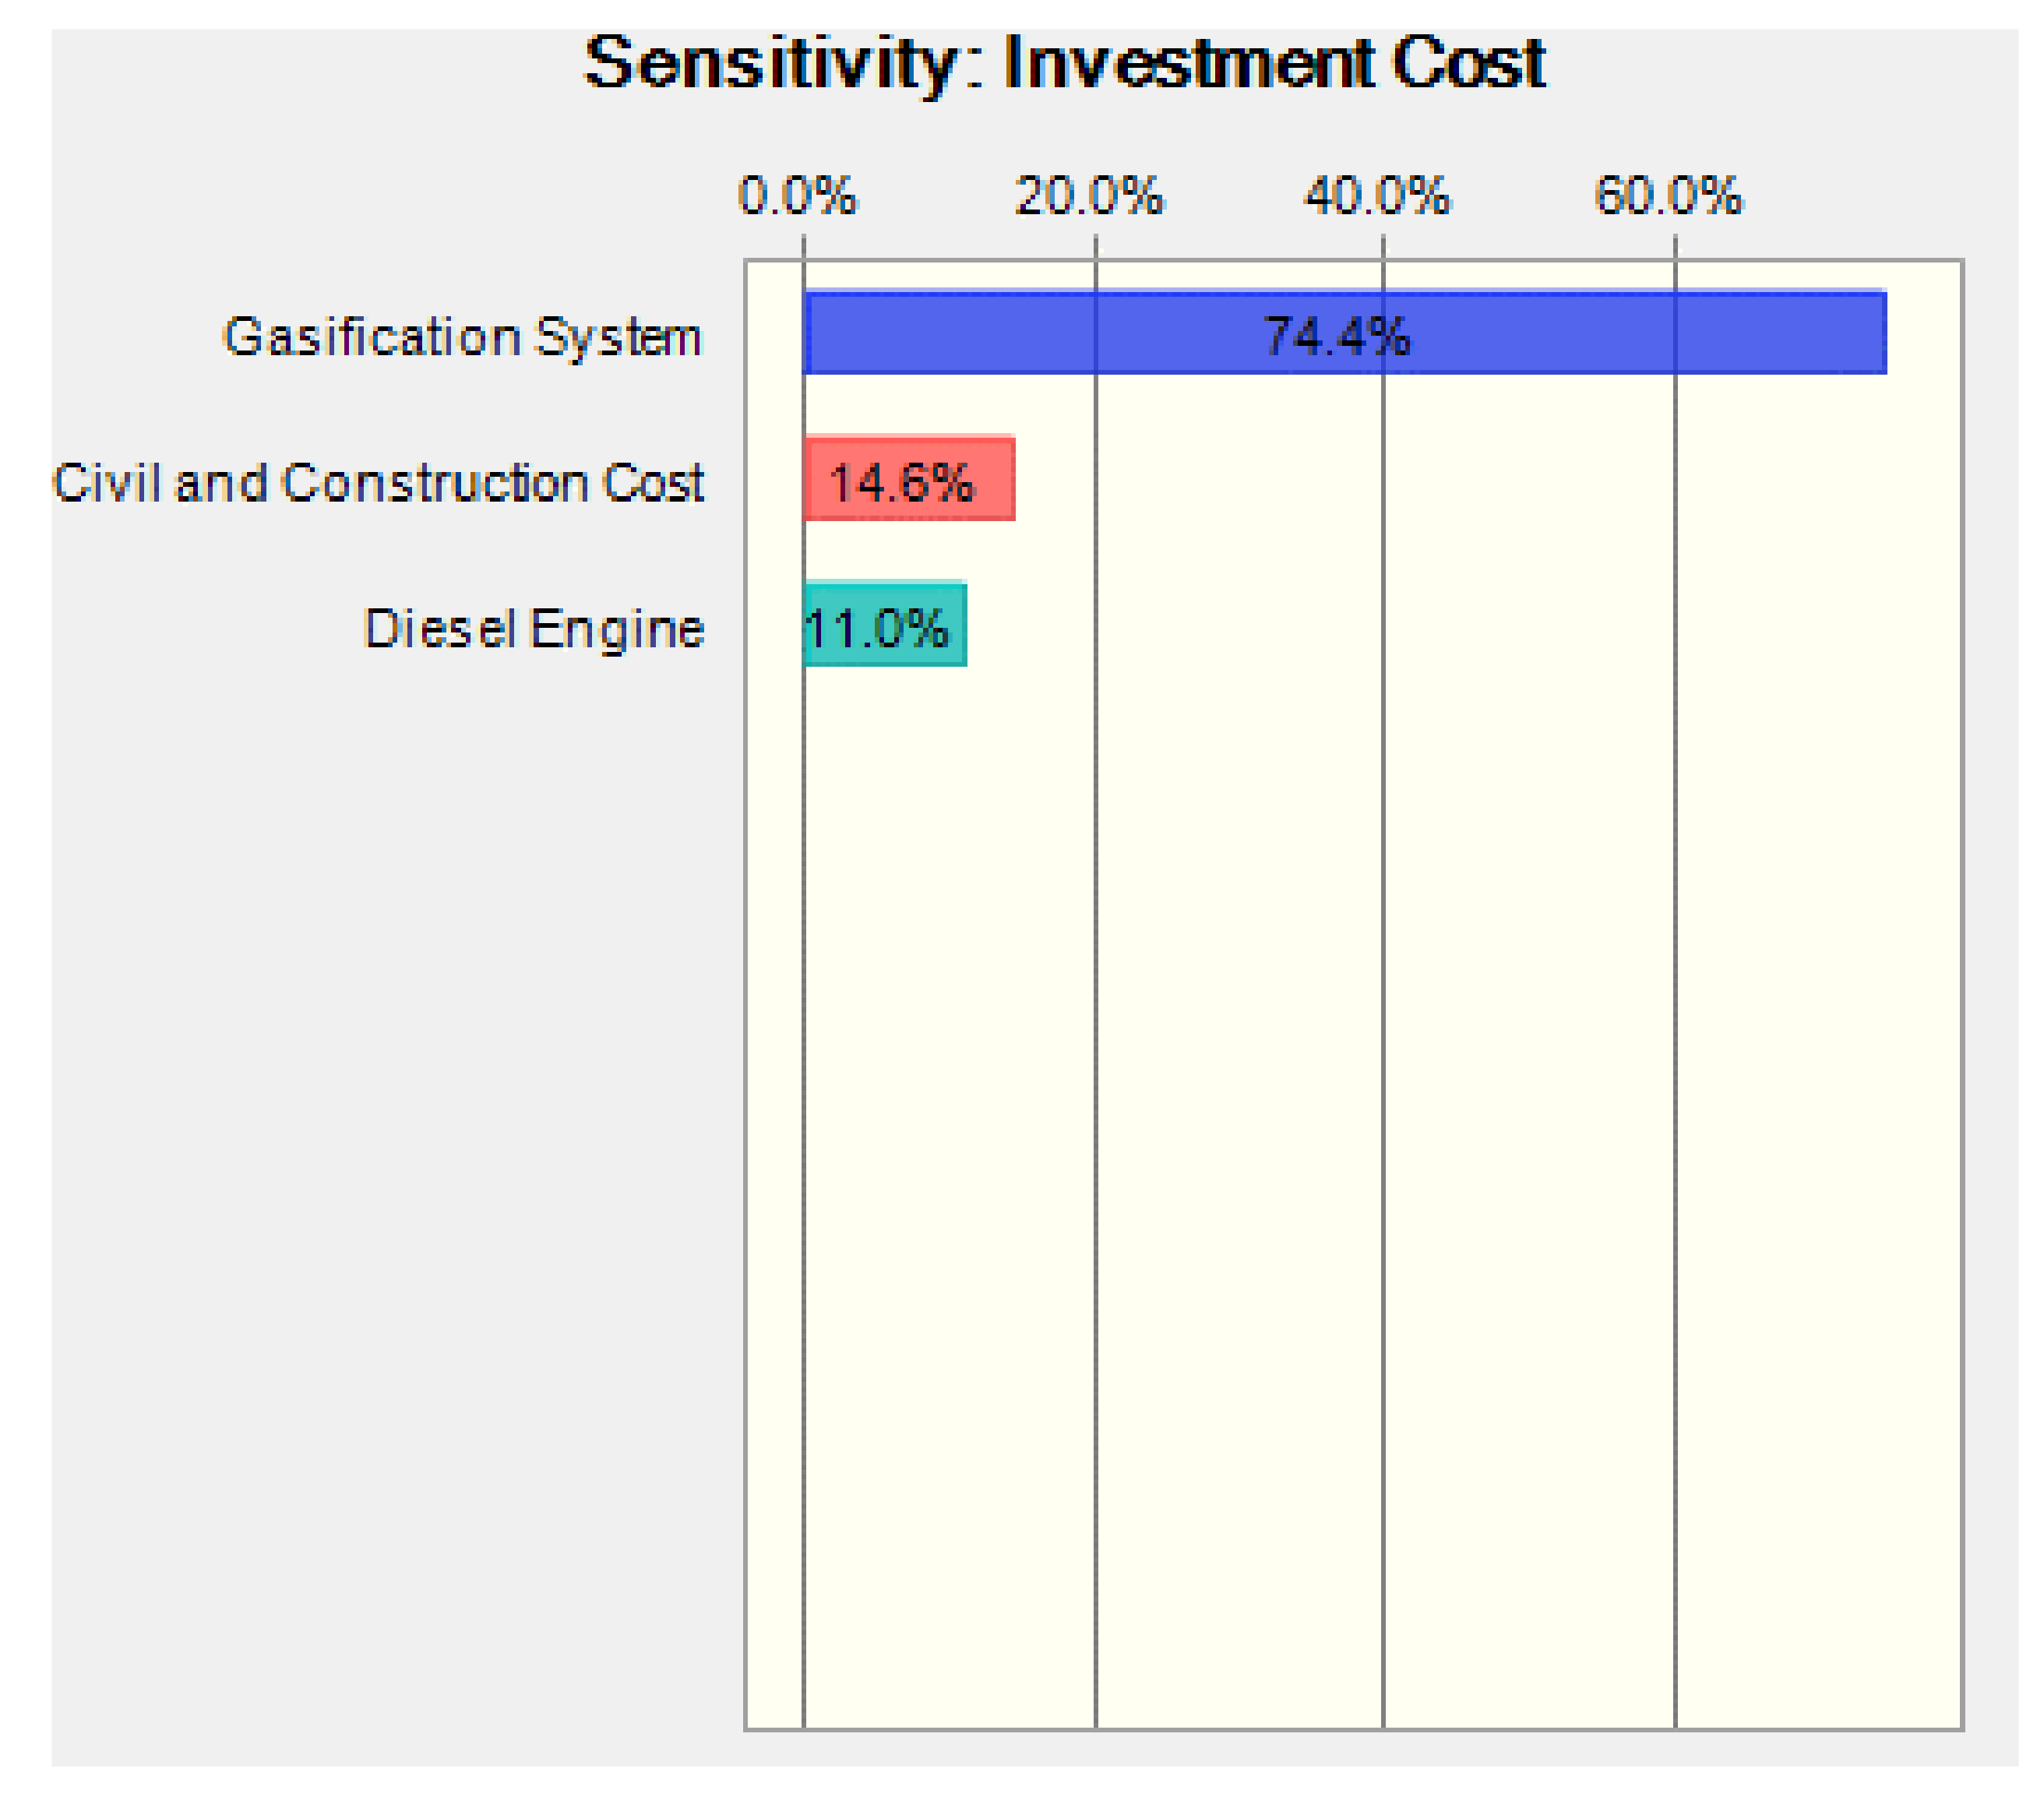
Based on the risk analysis of components that affect NPV, 68% of the most significant influence was investment cost, while capital cost and revenue were the remainders. Thus, if the investor can control and reduce investment costs, then it was possible to obtain higher profits. The investment component that was possible to be reduced was the capital cost of the gasification system. The investment cost was 74.4%, as shown in
Figure 9. The gasification system used was foreign-made or made with imported products. Considering the pilot-scale development experience that has been done, it was possible to produce gasification systems independently so that investment costs can be reduced.
Furthermore, to determine the type of fuel that was able to produce the largest kWh with low risk, standard deviation analysis was used. The analysis can provide information in the form of the types of raw materials used to produce electricity with the smallest deviation. The mechanism for calculating investment risk from the standard deviation was carried out by comparing the three fuels used to produce electrical energy, namely, palm fronds, empty fruit bunch, and oil palm trunks.
Table 17 shows a comparison of the three types of fuel used to generate electricity. Fuel derived from oil palm waste was categorized based on the type of waste tested through mechanization so that it was able to generate electricity from renewable energy fuel. The results of the analysis show that the type of fuel from the palm fronds had the lowest standard deviation value and the feedstock price of the frond waste was cheaper than other types of oil palm waste. The results of these calculations show that the smallest risk for producing electricity comes from renewable energy fuel, which comes from the type of palm frond waste at a price of 0.0259 USD/Kg and was able to generate electricity worth 0.0259 USD/kWh.
3.7. Socio-Environment Impact Analysis
Inside the Industrial Revolutions 4.0 era, access to electricity is one of the primary needs of everyday life both in urban and rural areas. The implementation of power plants, especially in rural areas, has the aim of improving the socio-economic life of the community. Social influence is expected to be felt in the long term, such as the ability to read, study, and obtain information, and the addition of skills so that it can open opportunities for people to be more creative and innovative in developing their ability to face the vicious cycle of poverty.
Positive influences from an economic perspective can increase people’s income and create many new businesses. Socio-cultural changes are marked by changes in lifestyle that are widely adopted from television shows, including in terms of daily lifestyle. Other changes include an increase in school performance and better health and awareness in protecting the environment and safety. The negative influence that must be watched is the fading of local cultural values, such as cooperation, and consumer culture, seen from the adoption of television shows and other media.
Before the gasification power plant was implemented, the majority of the village community’s work was as farmers and farm laborers, whereas after the power plant, many residents left their jobs in the agricultural sector. They turned to the productive sector that uses electricity as an energy source to produce products. The economy, which had previously relied on agriculture, then relied on services and industry. The presence of power plants was proven to recruit labor so that unemployment was reduced. One factor was the new employment opportunities presented for residents. The employment opportunities included food and beverage, document services, boarding, and rented houses, lodging, and other service sectors.
The community around the power plant area was directed to obtain additional income apart from agricultural products. The electricity provided by gasification power plants has a positive impact on the community’s economy. The community has new business opportunities including in the fisheries and trade sectors. If this gasification power plant was built in a coastal area that has biomass potential, the community was also facilitated by making boreholes so that sufficient water was available, and the establishment of a fish auction place.
Viewed from an environmental aspect, the implementation of power plants will have an impact on the environment, starting from the construction process to the operation. Impacts that occur are possibly both temporary and permanent. The construction of power plants involves the use of land or space inside or on the surface of the land, the use of water resources, and the most influential environment was the presence of pollution to the air and water. The indicators and parameters of the environmental quality index can be seen in
Table 18.
The construction of a power plant that utilizes green land will disrupt vegetation and also affect the wildlife that exists in the environment. Flue gas produced from the combustion of diesel engines will cause an increase in air temperature around the power plant, in addition to the combustion product in the form of CO2, which causes pollution or contributes to the emission of greenhouse gases. Water used as a syngas cooler before it is used on a diesel engine will reduce the water supply around the plant, both for surface and underground water. After the water is used, it becomes wastewater and needs to be disposed of in the environment. With wastewater disposal, the temperature of the waste will be higher than the average temperature, and the most dangerous impact is the pollutants contained in the water, which can cause environmental damage. Therefore, before wastewater is discharged, it is necessary to treat it first. In addition to liquid waste, solid waste in the form of ash from gasification is also produced from power plants. The handling of solid waste must be managed so that it does not have a negative impact. Furthermore, the level of noise and vibration around the project site will increase; during plant operations this condition also continues to occur.


 ,
, 


