1. Introduction
Expansion of renewable energy is one of the key elements of the global strategy to mitigate global warming. For the next years and decades, a large expansion of wind energy is planned. The global wind-power market is expected to reach 69,700 megawatts by 2027 [
1]. The European Commission raised the EU’s renewable energy target from 32% to 40% by 2030, seeking to build 451 GW of wind-power capacity by 2030, up from 180 GW today. The USA plans a massive expansion of wind farms off the coasts. The Departments of the Interior, Energy and Commerce committed to a shared goal of generating 30 gigawatts of offshore wind in the U.S. by 2030 [
2].
However, the operation and maintenance (O&M) of wind turbines remain important factors, influencing the wind energy price. For instance, onshore wind farm operators spent around USD 15 billion on O&M services in 2019, of them, 57% on unplanned repairs [
3,
4]. The total repair budgets in Europe increased from 2019 to 2020 from USD 4.7–8.6 million, and unplanned repairs also increased slightly in Europe (2%) and even by 10% in the United States [
5].
Furthermore, wind turbines installed at the beginning of 20th century are becoming old now. The number of WTs reaching 20 years of operation annually, for instance, in Spain and Germany will be of the order of 800 per year in the next decade [
6]. Ageing fleets lead to increased repair requirements.
Wind turbine service companies and wind-park owners face a large choice of technologies for the blade repair. In this work, the authors sought to compare and evaluate available blade repair technologies, using the materials testing and microscopy analysis of repaired samples. The authors sought to provide the service companies and end users with necessary information for the comparing and selecting of the repair technologies, and, on the other hand, to give the adhesive and equipment developers feedback on the performance of their products in quasi-real conditions.
2. Repair Costs and Technologies: State of the Art
With an estimated 700,000 blades in operation globally, there are, on average, 3800 incidents of blade failure each year [
7]. The defect types can be classified as surface defects (e.g., leading edge erosion), nonstructural defects (e.g., matrix defects, delamination), and structural defects (with failed fibers). In [
8], it was reported that 6.2 minor repairs, 1.1 major repairs, and 0.43 major replacements are required on average per turbine per year. The major repairs are carried out when both laminates, including fibers, are damaged.
Different repair technologies can be used, depending on the type of defects, e.g., tapes and shells (for erosion repair, surface defects), filling, sealing, resin injection (for matrix cracks, debonding), and plug/patch and scarf repair for structural damage. Damaged regions are removed by grinding, and a patch is attached to the parent laminate [
9]. A detailed overview of wind turbine (WT) blade repair technologies is given in [
9].
In [
10], a survey of damage mechanisms and frequencies of wind turbine blades was carried out among service companies and wind turbine owners. Among other things, it was observed that current repair technologies are far from perfect, since the next repair can be required 4–6 years after the first repair.
The quality of blade repair is very important for the post-repair time of wind turbine blades [
9,
11]. Low quality repair can lead to an eccentric load path, bending in the patch, and stresses in the adhesive and composite. One of the common defects in composites and repaired composites are voids. Voids can form during curing by the mechanical trapping of air, and the diffusion of dissolved water and gases in the resin [
11,
12]. Katnam and colleagues [
11] reported that “micro-voids are frequently seen in adhesive bonds cured at elevated temperatures” and showed that the tensile strength depends on the micro-voids. Voids create local stress concentrations [
13,
14,
15].
According to [
7], the costs of unscheduled maintenance activities, and the repair of failures, can be estimated as:
where c
D—costs of downtime per hour,
TD—duration of downtime, N
F—number of failures per year, and
Crep1—costs of single repair. The single repair costs can be calculated:
where
Ctrans—costs of transportation,
Cequip—costs of equipment and materials, and
Clabor—costs of field labor.
Clabor = Mt
repc, where M—size of team, c—hourly costs, and t
rep—time of repair. The technology-related parameters include duration of work t
w, size of team M, equipment and materials costs
Cequip, and the “output parameter” amount of repairs N
F (or inversely, time between repairs, 1/N
F).
There are various methods to improve the repair technology, taking into account Equation (1): reduce time of repair and size of team, increase quality of each repair, and reduce the required number of repairs. One interesting direction is to reduce the time of curing by using fast curing polymers or ultraviolet (UV). The various repair and curing technologies are associated with various initial investments, but also can lead to different qualities of repaired structures. In this paper, the quality and properties of composite structures, repaired with the use of different techniques, is investigated.
3. Concept of Experiments
In this study, the idea of testing of several available composite repair technologies is realized. Laminate plates were damaged, and then repaired, using various repair technologies, available on the market. The repair of blades was carried by a repair technician, who has many years of experience in the practical repair of offshore and onshore wind turbines (to prevent influence of human errors, or variability caused by different skill levels). Then, the repaired plates were tested (tensile static and fatigue), and the microscopic analysis of structures of repaired samples was carried out.
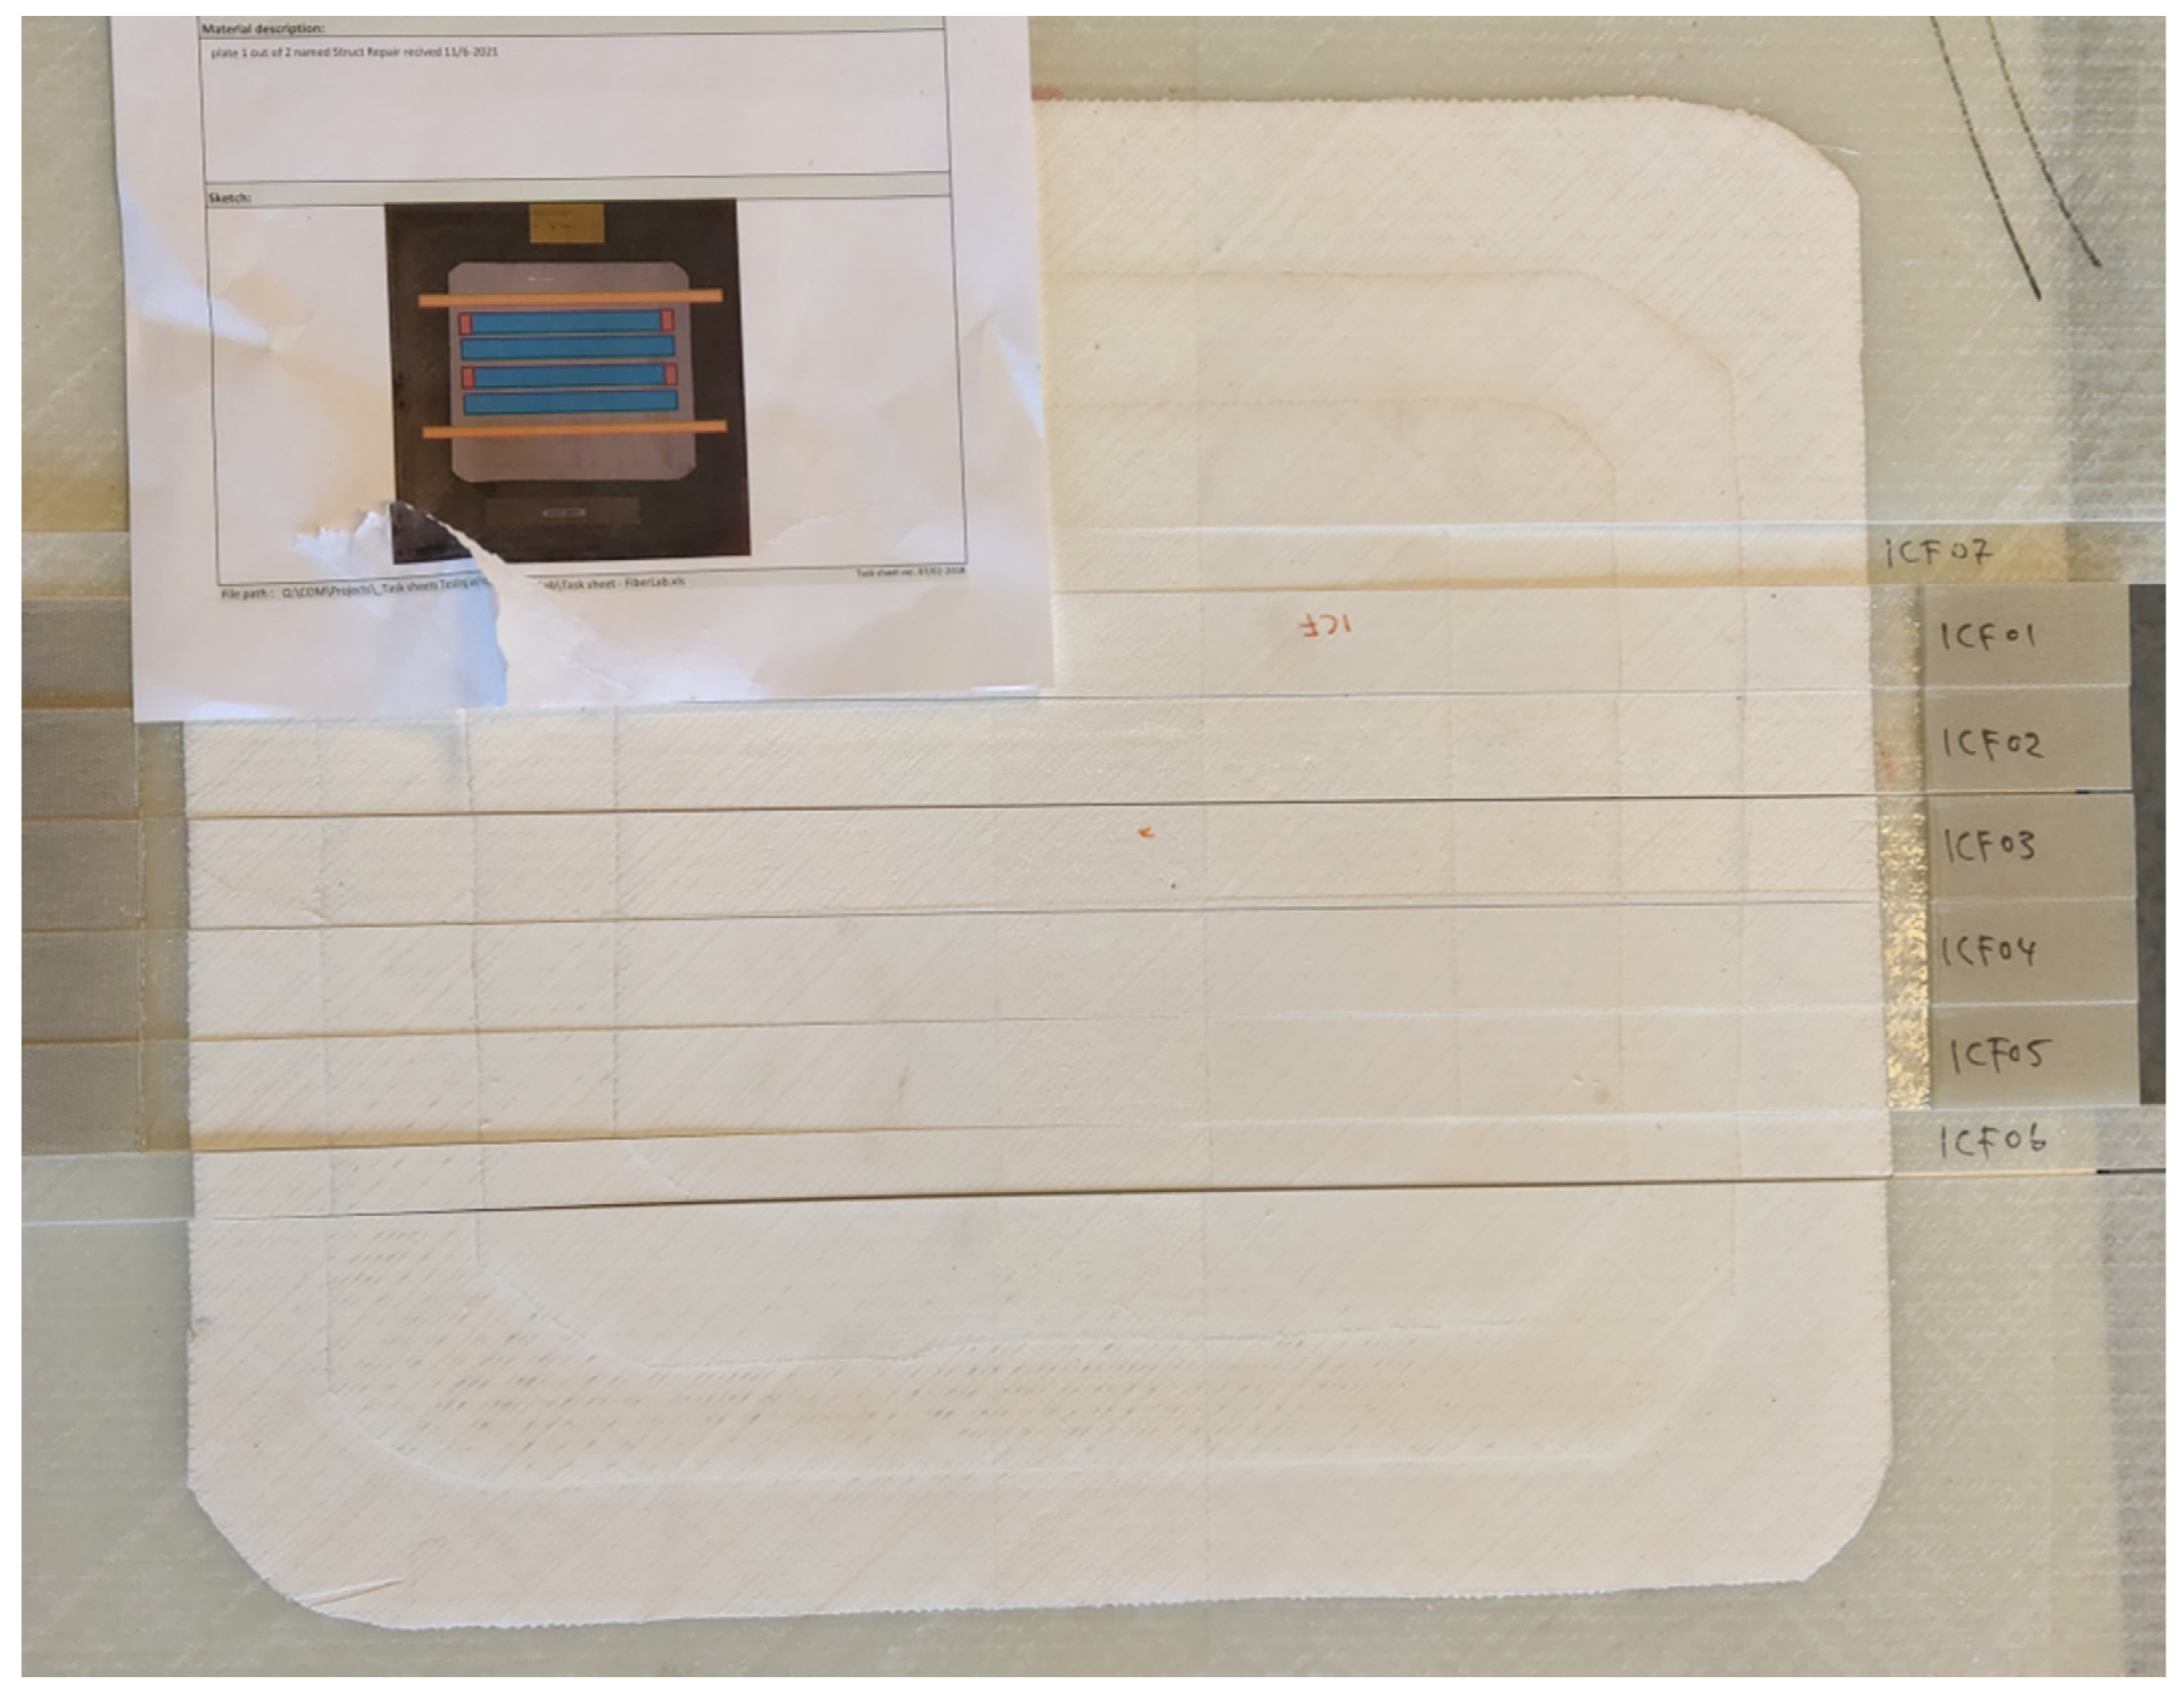
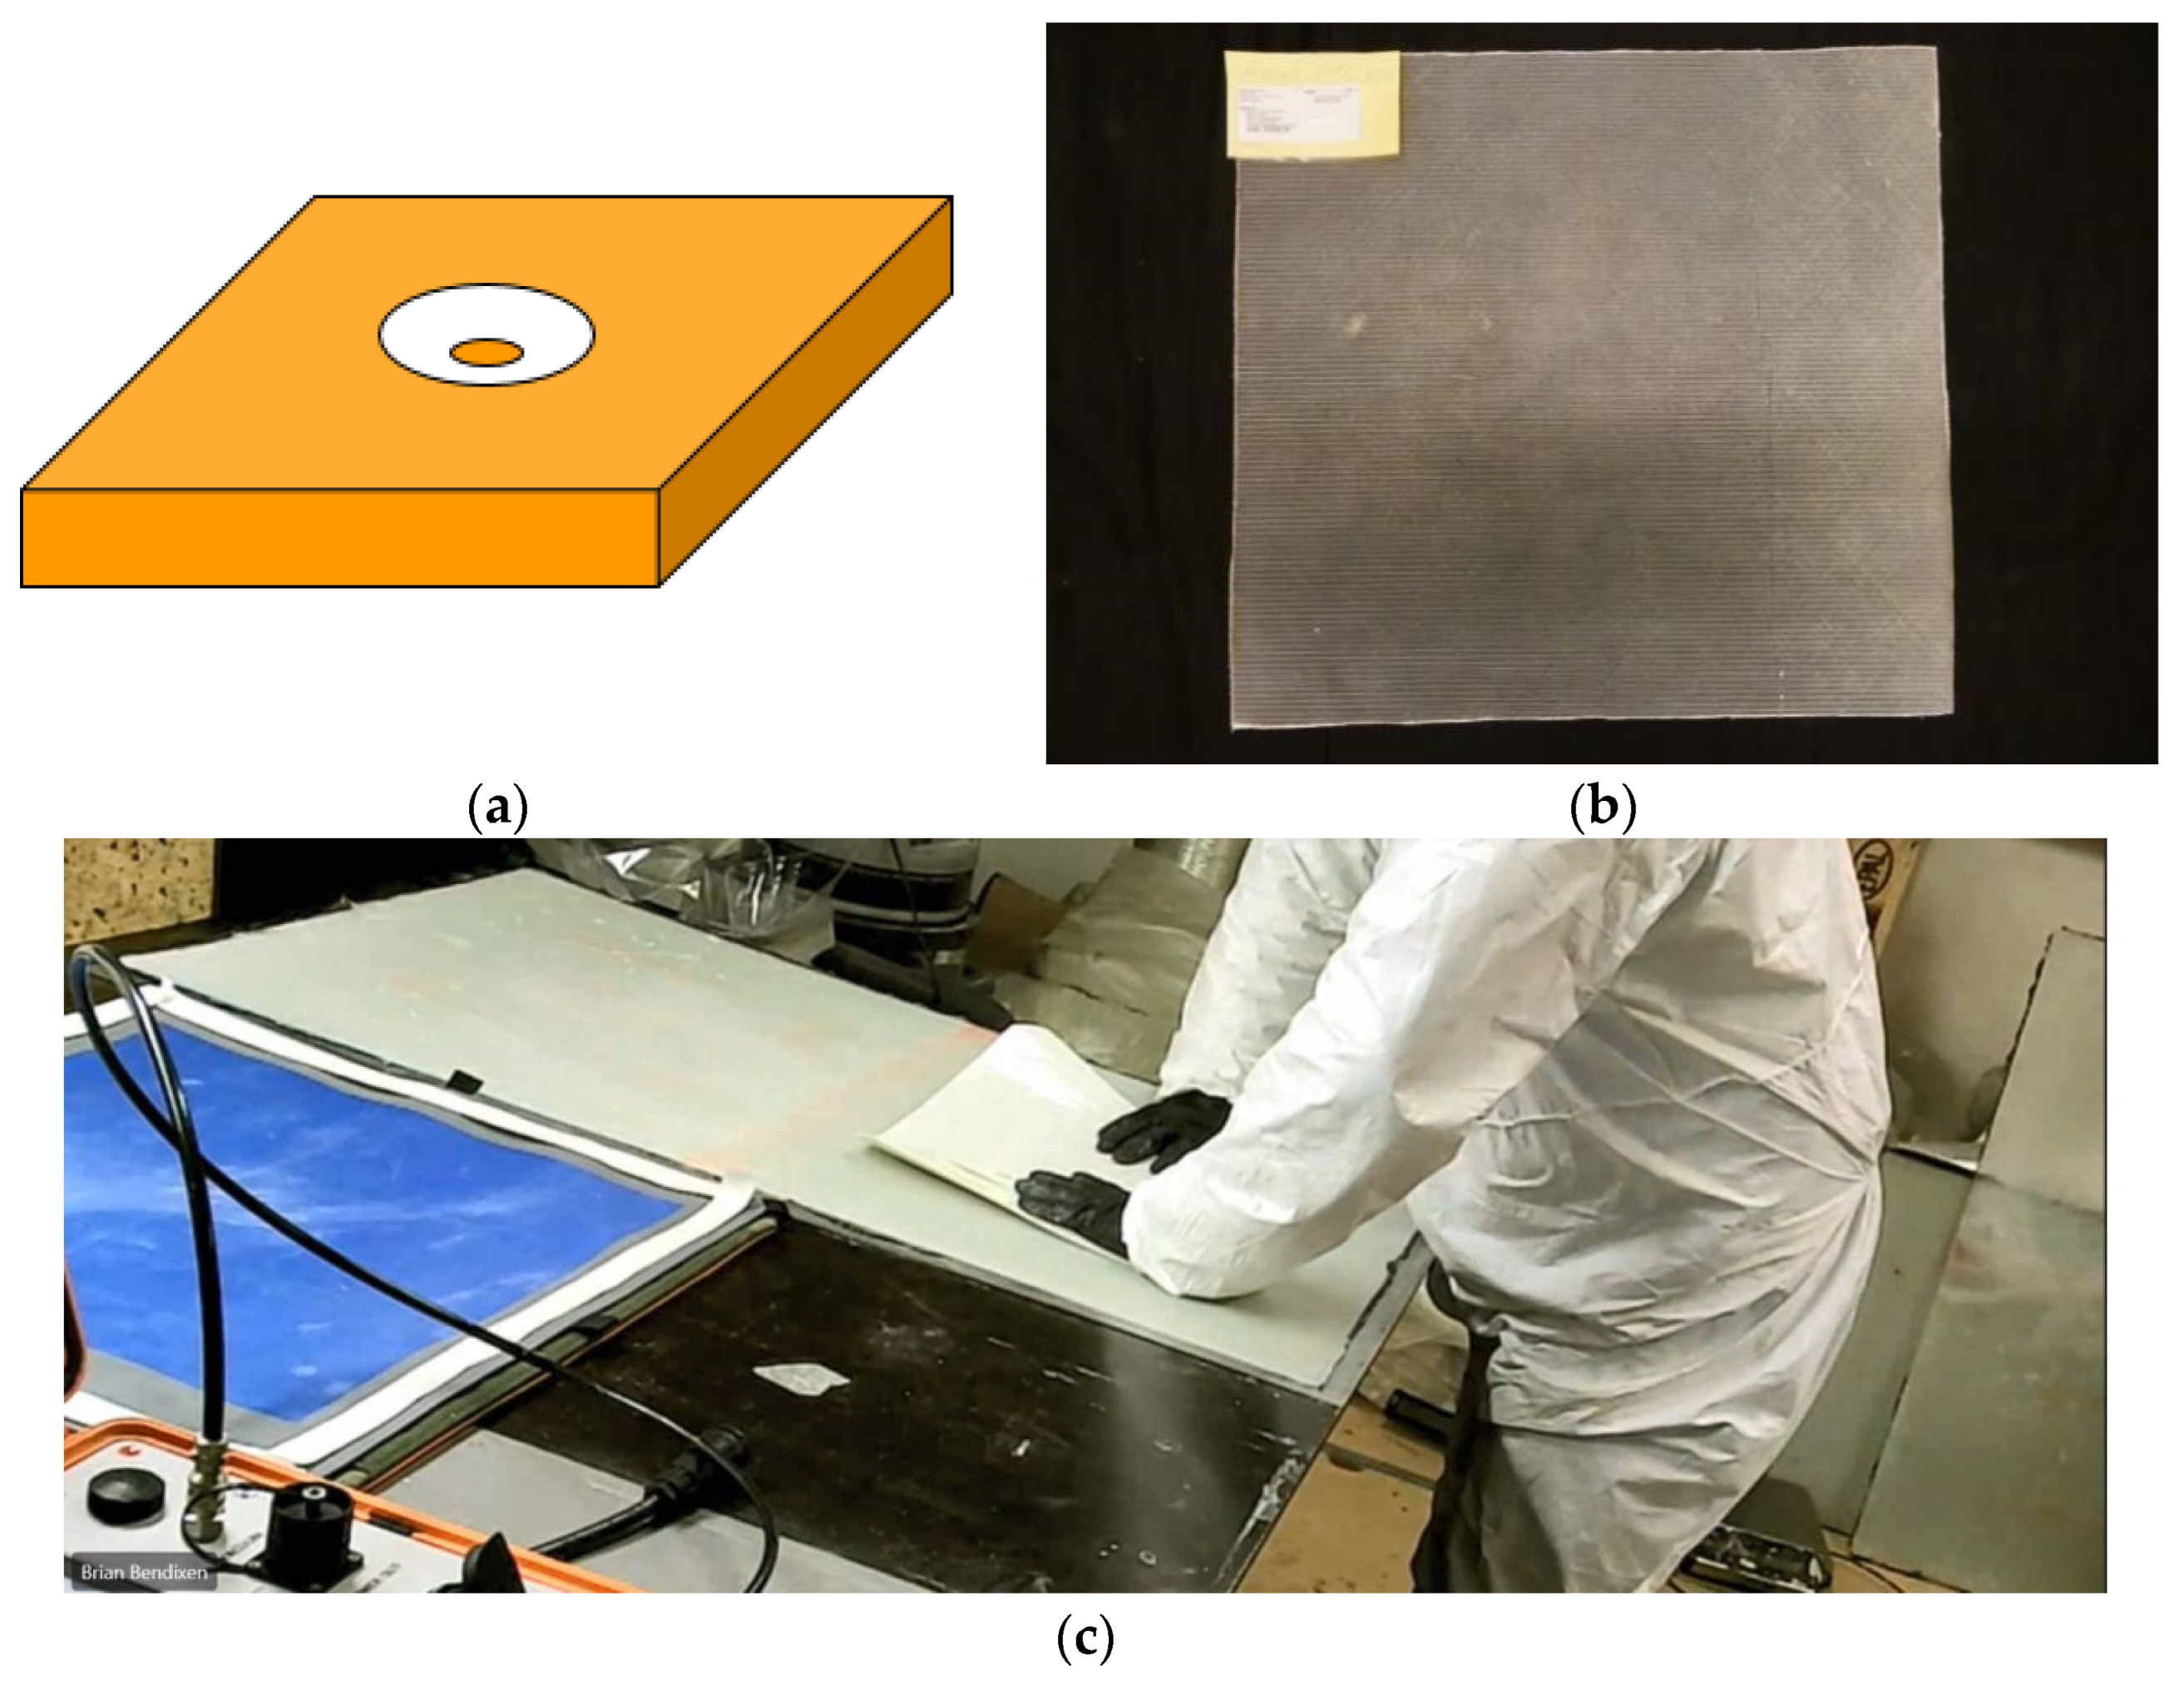
Figure 1 shows a schema of a damaged blade and a photo of a repaired blade.
In the experiments, six different repair technologies were used, namely:
- -
Hand layup lamination (traditional repair technology, by putting resin on the laminate and hand rolling afterward) (HL),
- -
Vacuum repair with hand layup (V1): after the resin is put on the laminate and vacuum is applied, to get all the resin through the laminate and to get all the air out of the laminate,
- -
Vacuum repair with infusion (V2): dry laminate is put on the repair and vacuum is applied to pull the resin through the laminate with vacuum pressure,
- -
Ultraviolet repair (UVh1): handheld, portable, continuous UV spectrum curing,
- -
Ultraviolet repair (UV2): stationary device,
- -
High-temperature thermal curing (HTC).
Table 1 shows the evaluation of the time/labour efforts of using the different repair technologies in real conditions, made by the service team.
Table 2 shows estimations of temperatures and duration of curing for different technologies.
Several laminate plates (60 cm × 60 cm, with five layers, thickness 4 mm) were taken, and a three-layer-deep crack was introduced in the center of the plate. The damaged site was sanded out (with the same sand tool and angle in all cases) and repaired. The laminates were from glass fibers, and Bodonex 900 matrix resin, Biax 600: Orientation: +/−45.
Table 3 shows the adhesives and laminates used in each technology.
4. Experimental Testing Program
All samples, including the unrepaired reference plate, were tested in uniaxial tension until failure. From each plate, four samples were cut from the center on the scarf repair, with the dimensions 300 × 25 mm. Due to the large elongation, sample length had to be reduced to not cover the entire repair but only the center of patches.
Figure 2 shows how the samples were cut from the repaired laminates. Samples were held using mechanical jaws, with constant test speed of 2 mm/min applied.
Extensometers were mounted on each side of the sample at the center of the repair, to measure the strain between . Above the strain was measured using machine displacement.
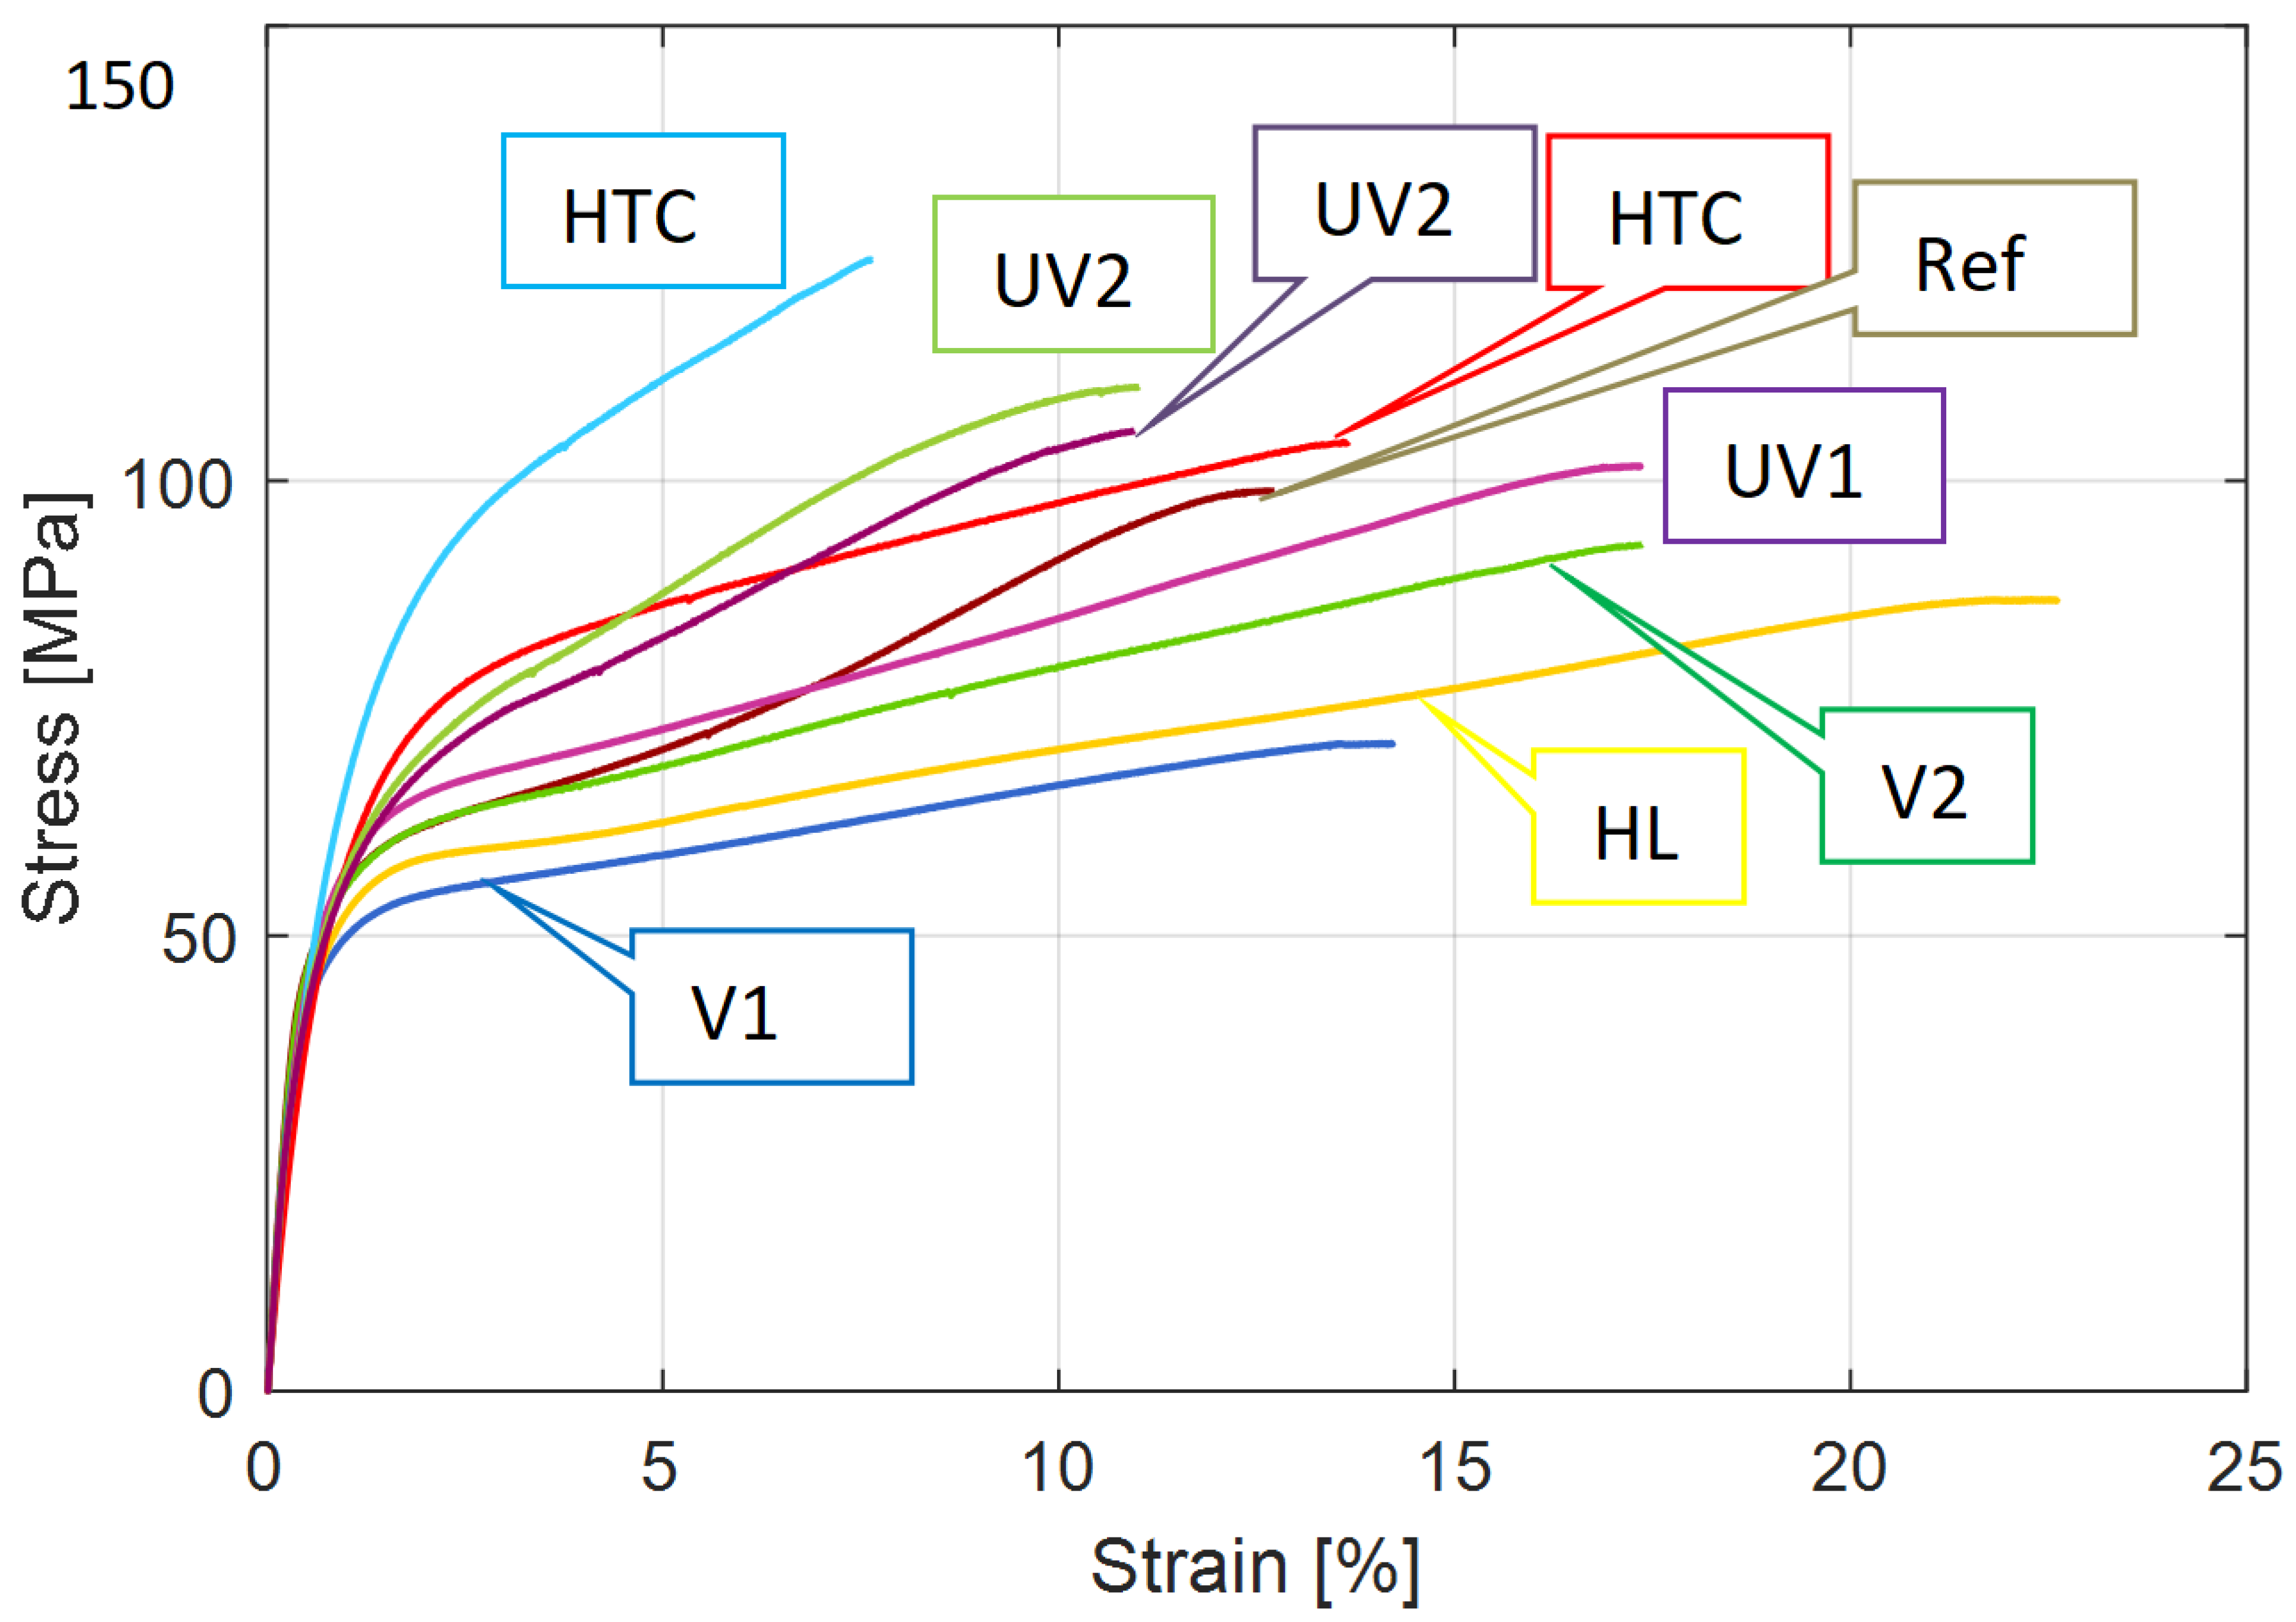
Figure 3 shows the typical stress-strain curves of tested samples.
Table 4 shows the mechanical properties of repaired samples, determined in the tests.
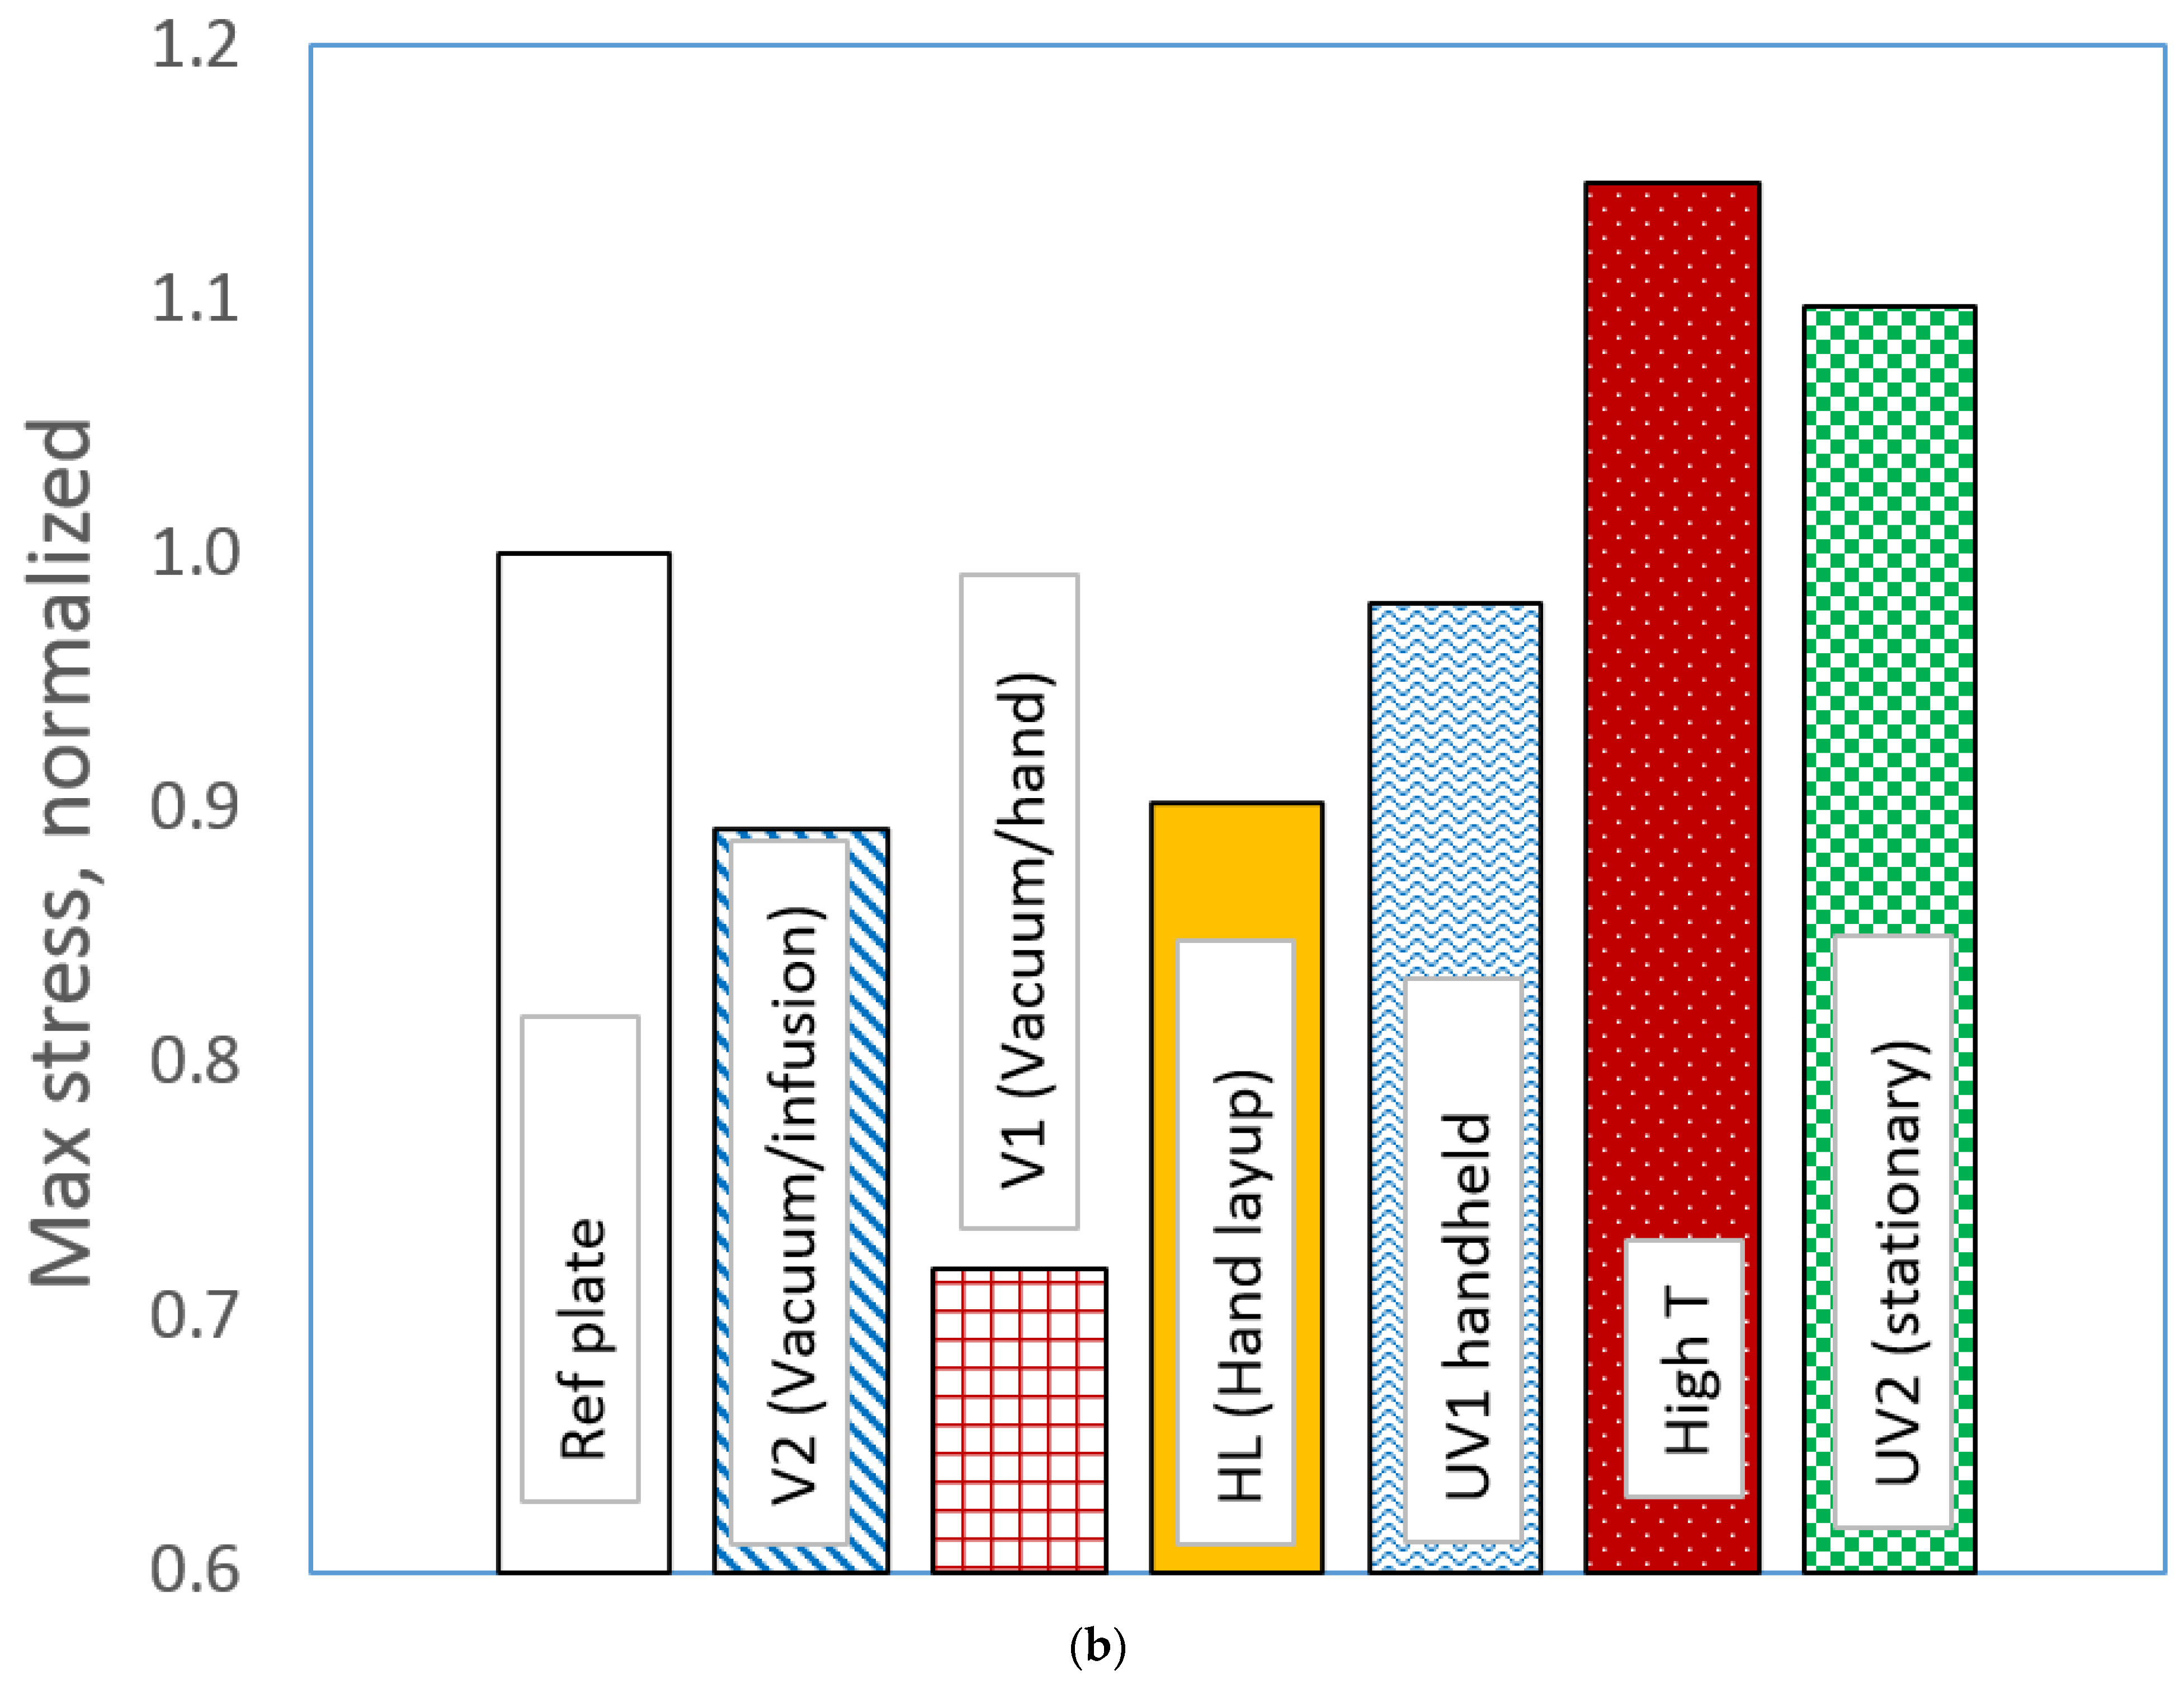
Figure 4 shows the comparison of Young moduli and maximum failure stresses for different tested cases, normalized by reference/unrepaired case values.
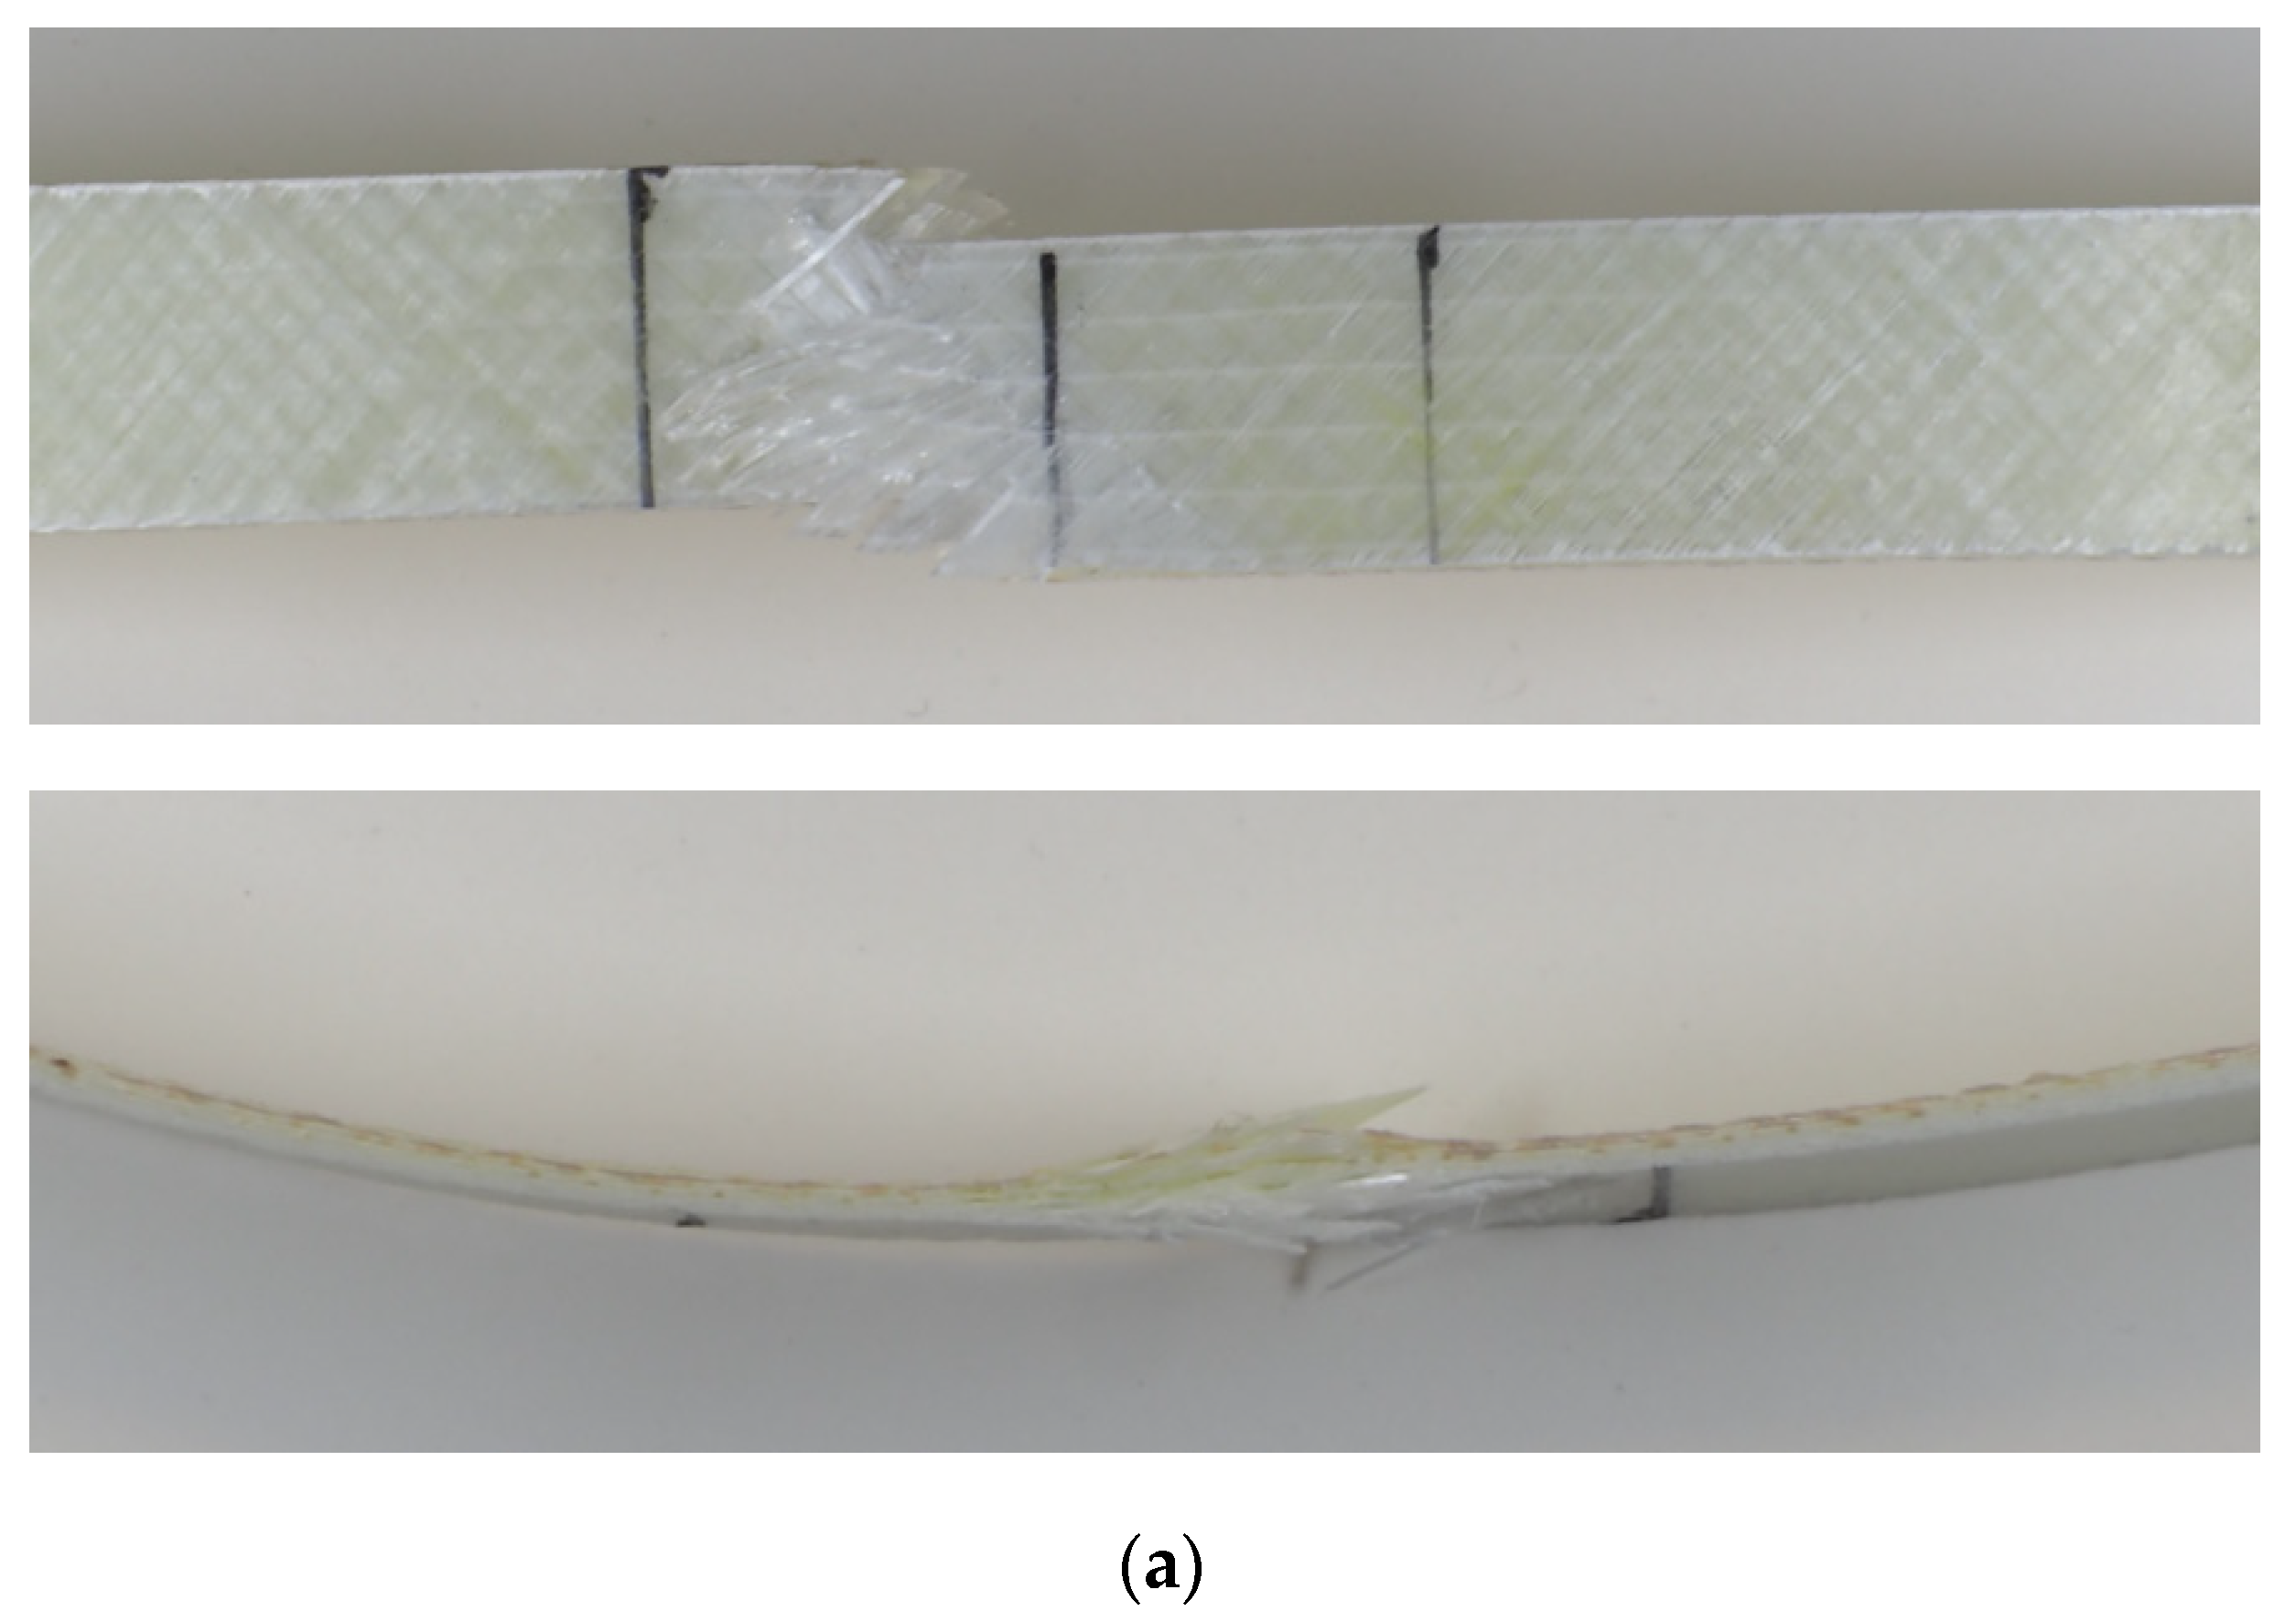
Figure 5 shows also locations of cracks for some samples (vacuum repair with hand layup, hand layup lamination and handheld UV curing technology).
Based on the studies, the following conclusions can be drawn. All the technologies provide relatively good quality of repair under static loading. Technologies with application of vacuum lead to stiffer repaired structures, and also to lower maximum stresses. High-temperature curing leads to softer structures, but with higher maximum stress. Ultraviolet curing technologies ensure average stiffness and high strength.
5. Fatigue Testing
At the next stage, fatigue testing of repaired samples was carried out. The fatigue specimens, measured 520 × 25 mm with the distance 420 mm between tabs, were cut from the repaired samples.
The samples were tested under cyclic loading (load control fatigue) at 0.5% strain level. The tests were carried out at 3 Hz using load control. The samples were tested to failure and the cycle count was recorded.
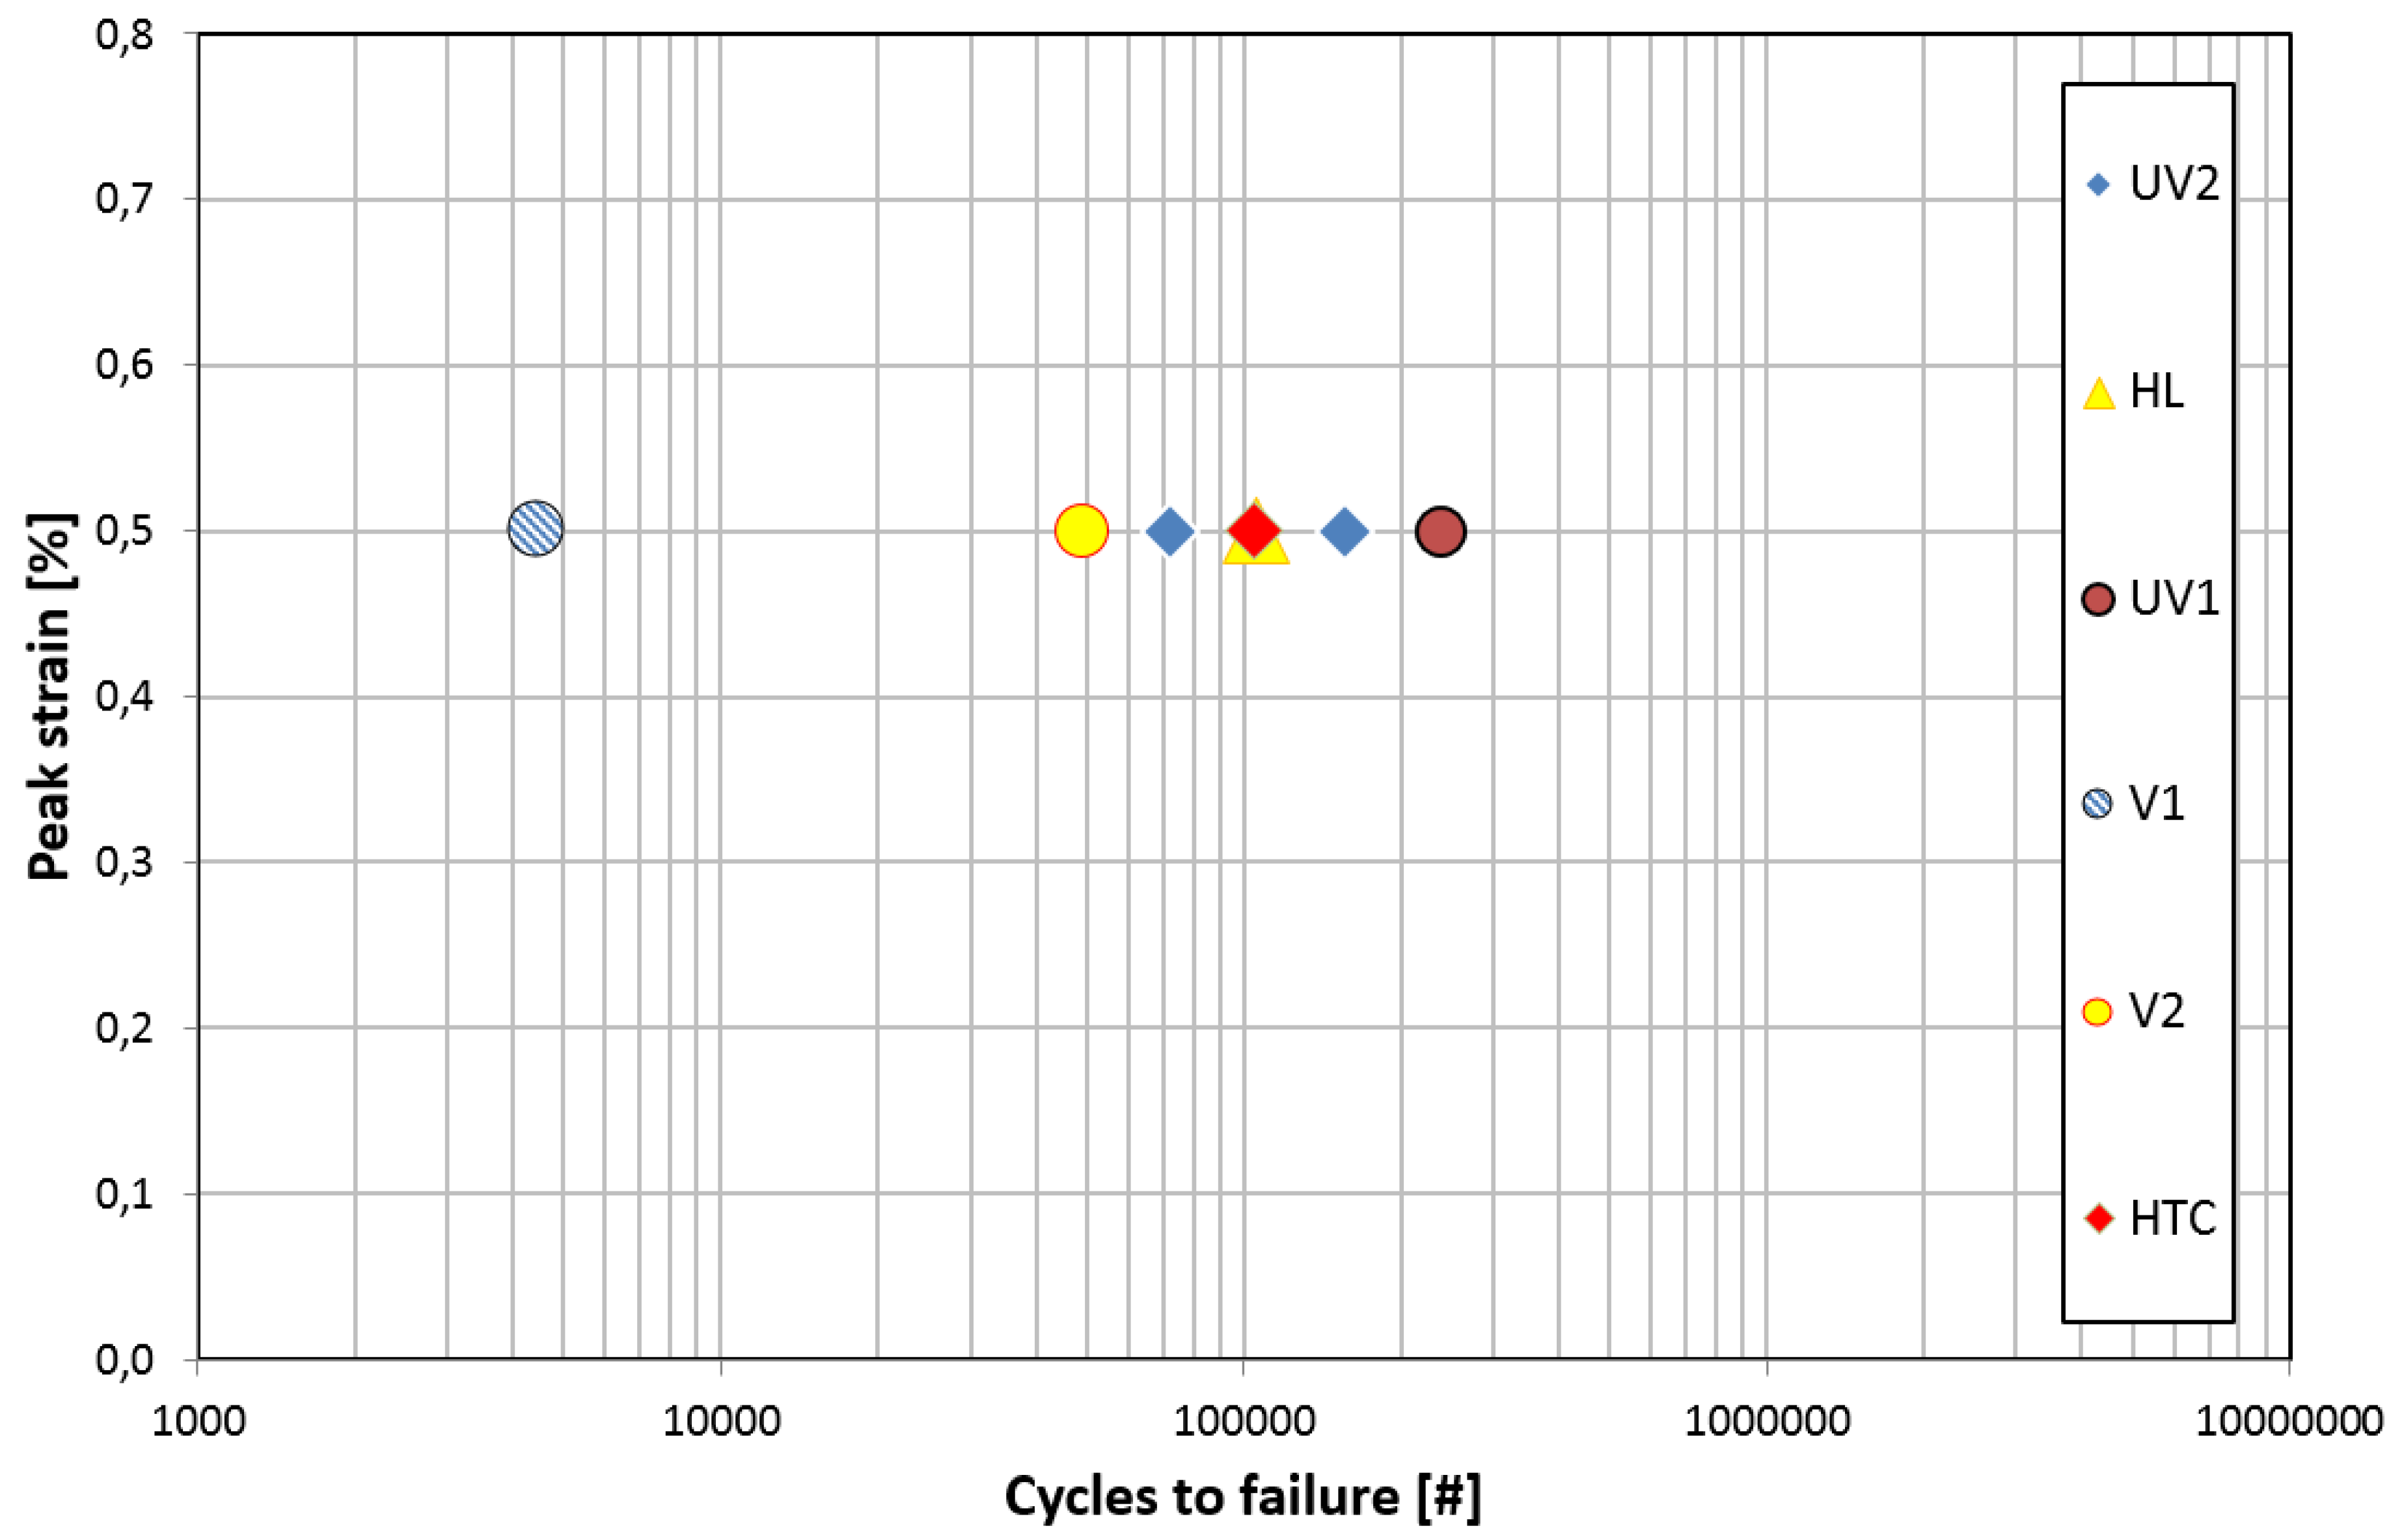
Figure 6 shows the common strain level on a peak strain basis for all series.
Vacuum repair with hand layup (V1) shows the lowest performance. Even hand layup (HL) is better than vacuum repair with infusion (V2). UV2 (stationary UV system) shows average lifetime, but high variability. UV1 (handheld UV curing) shows the best lifetime. HTC shows average level.
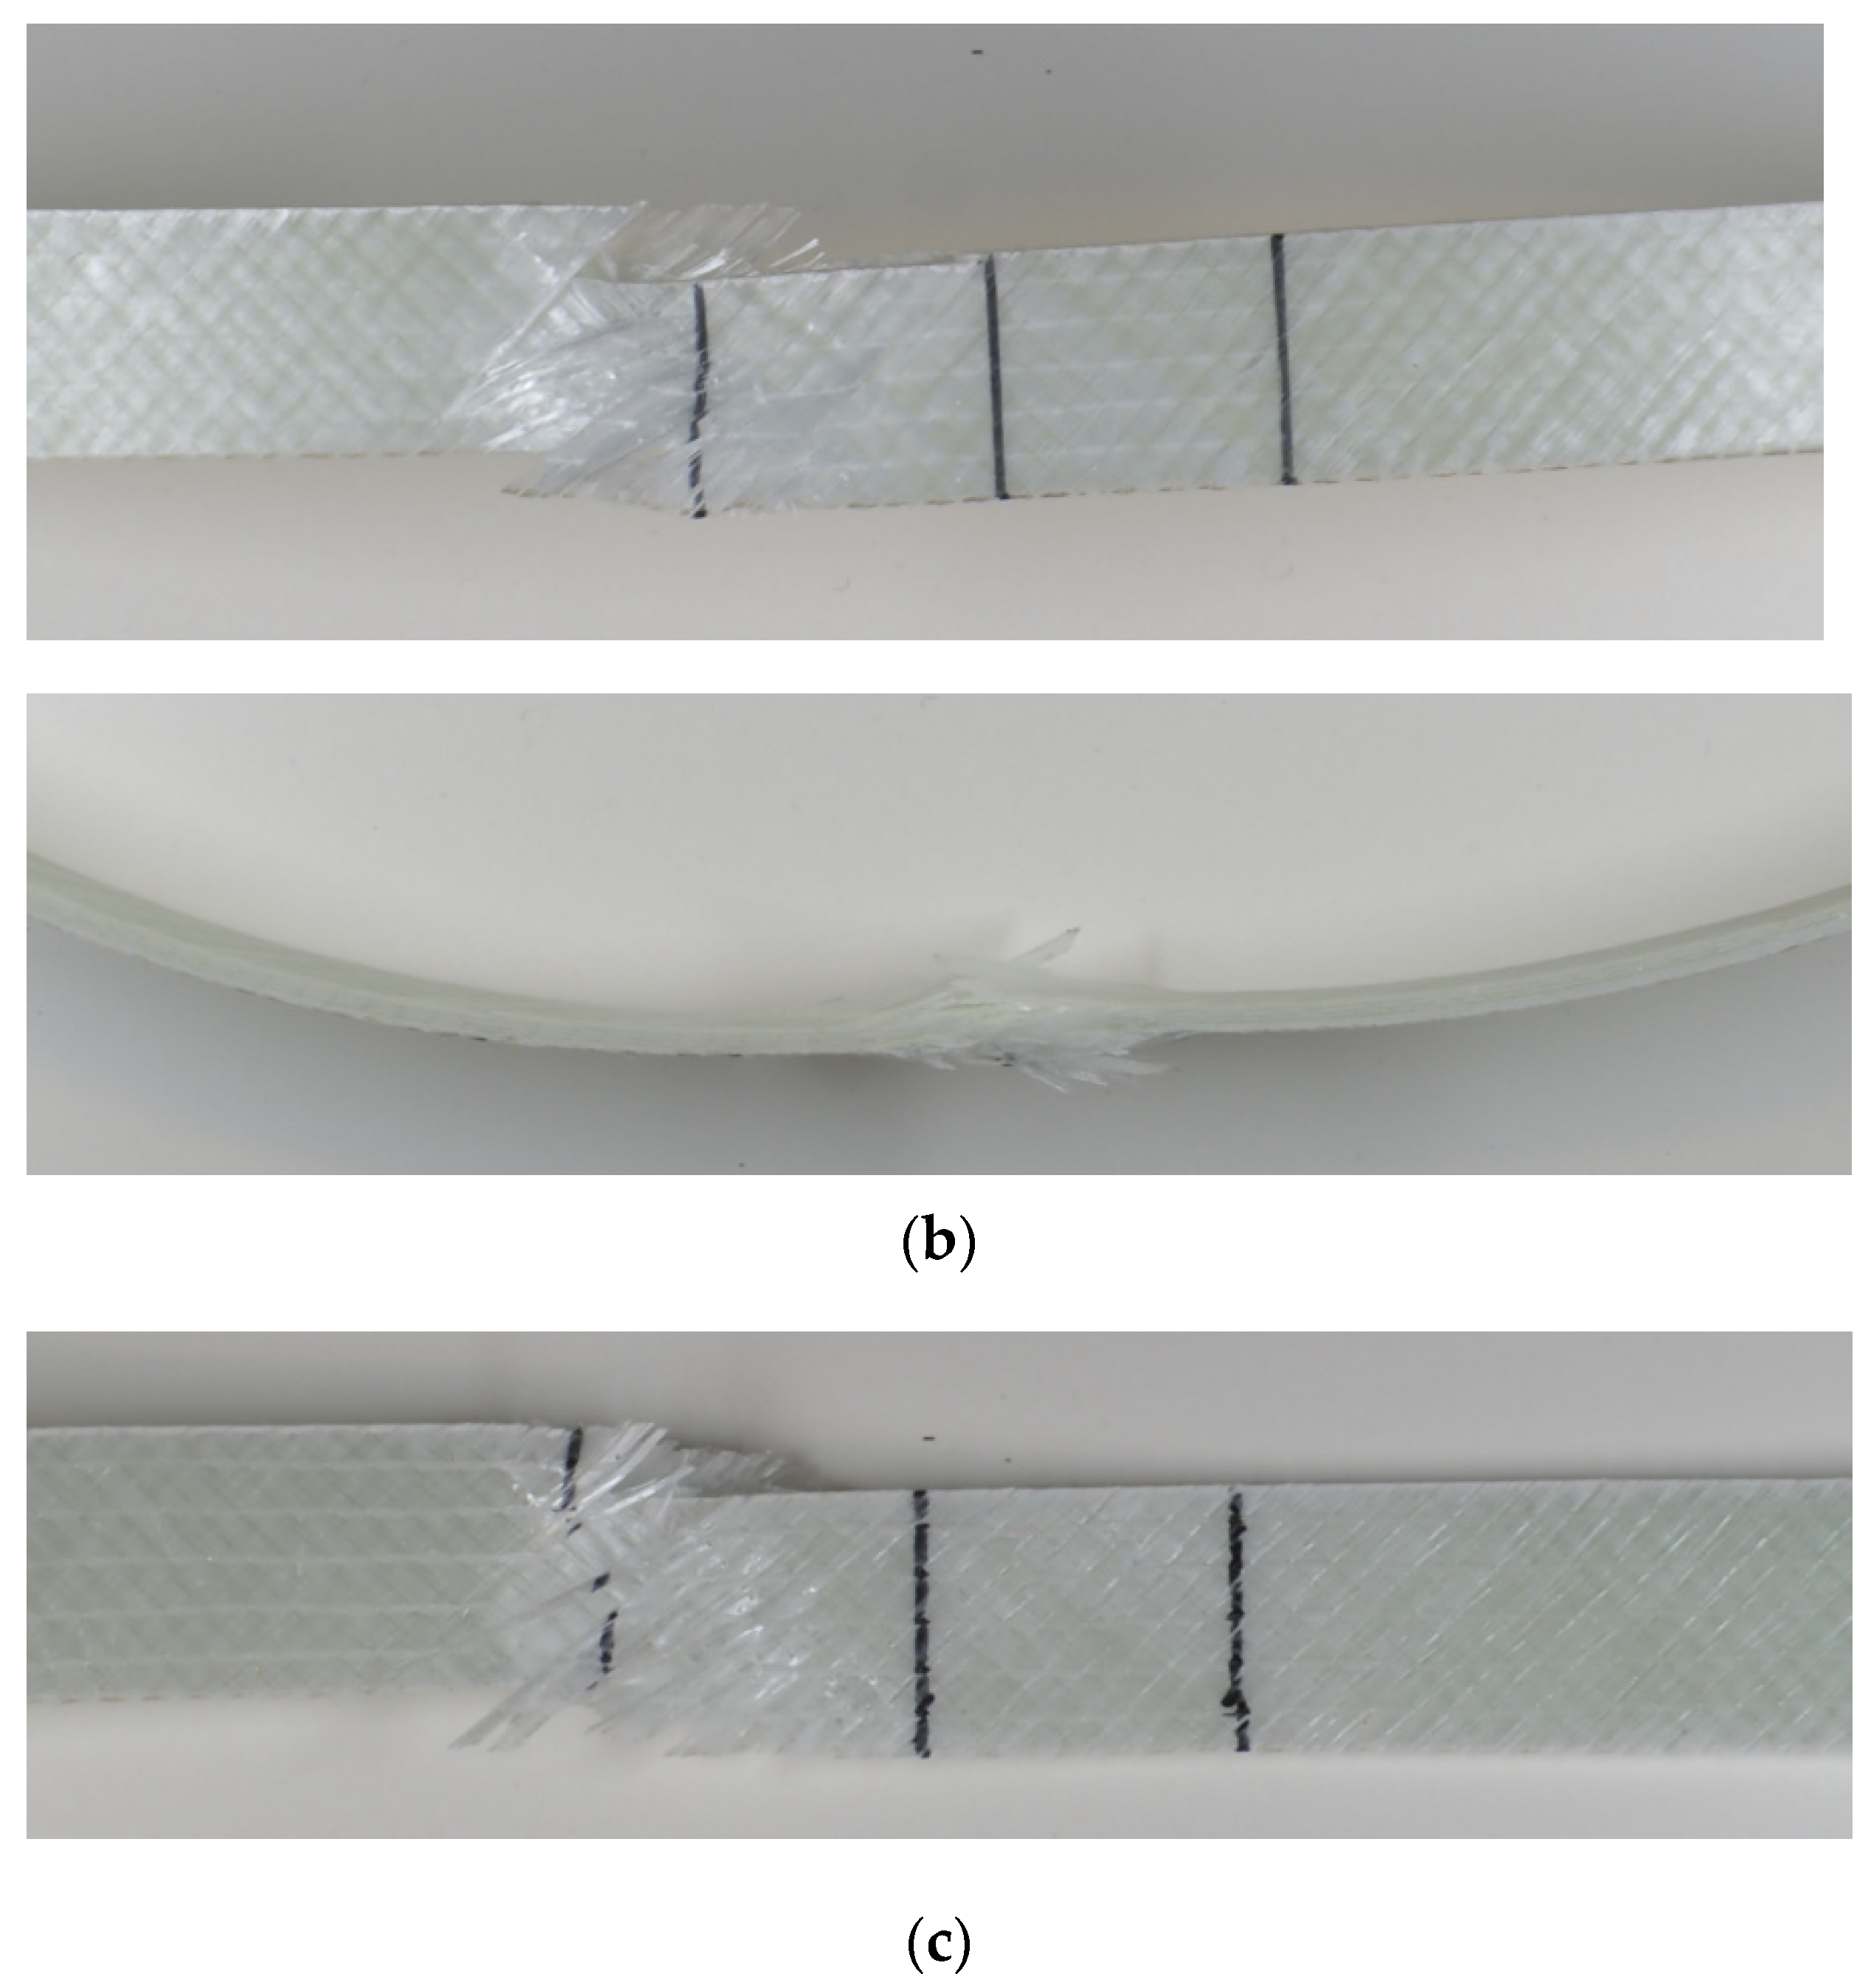
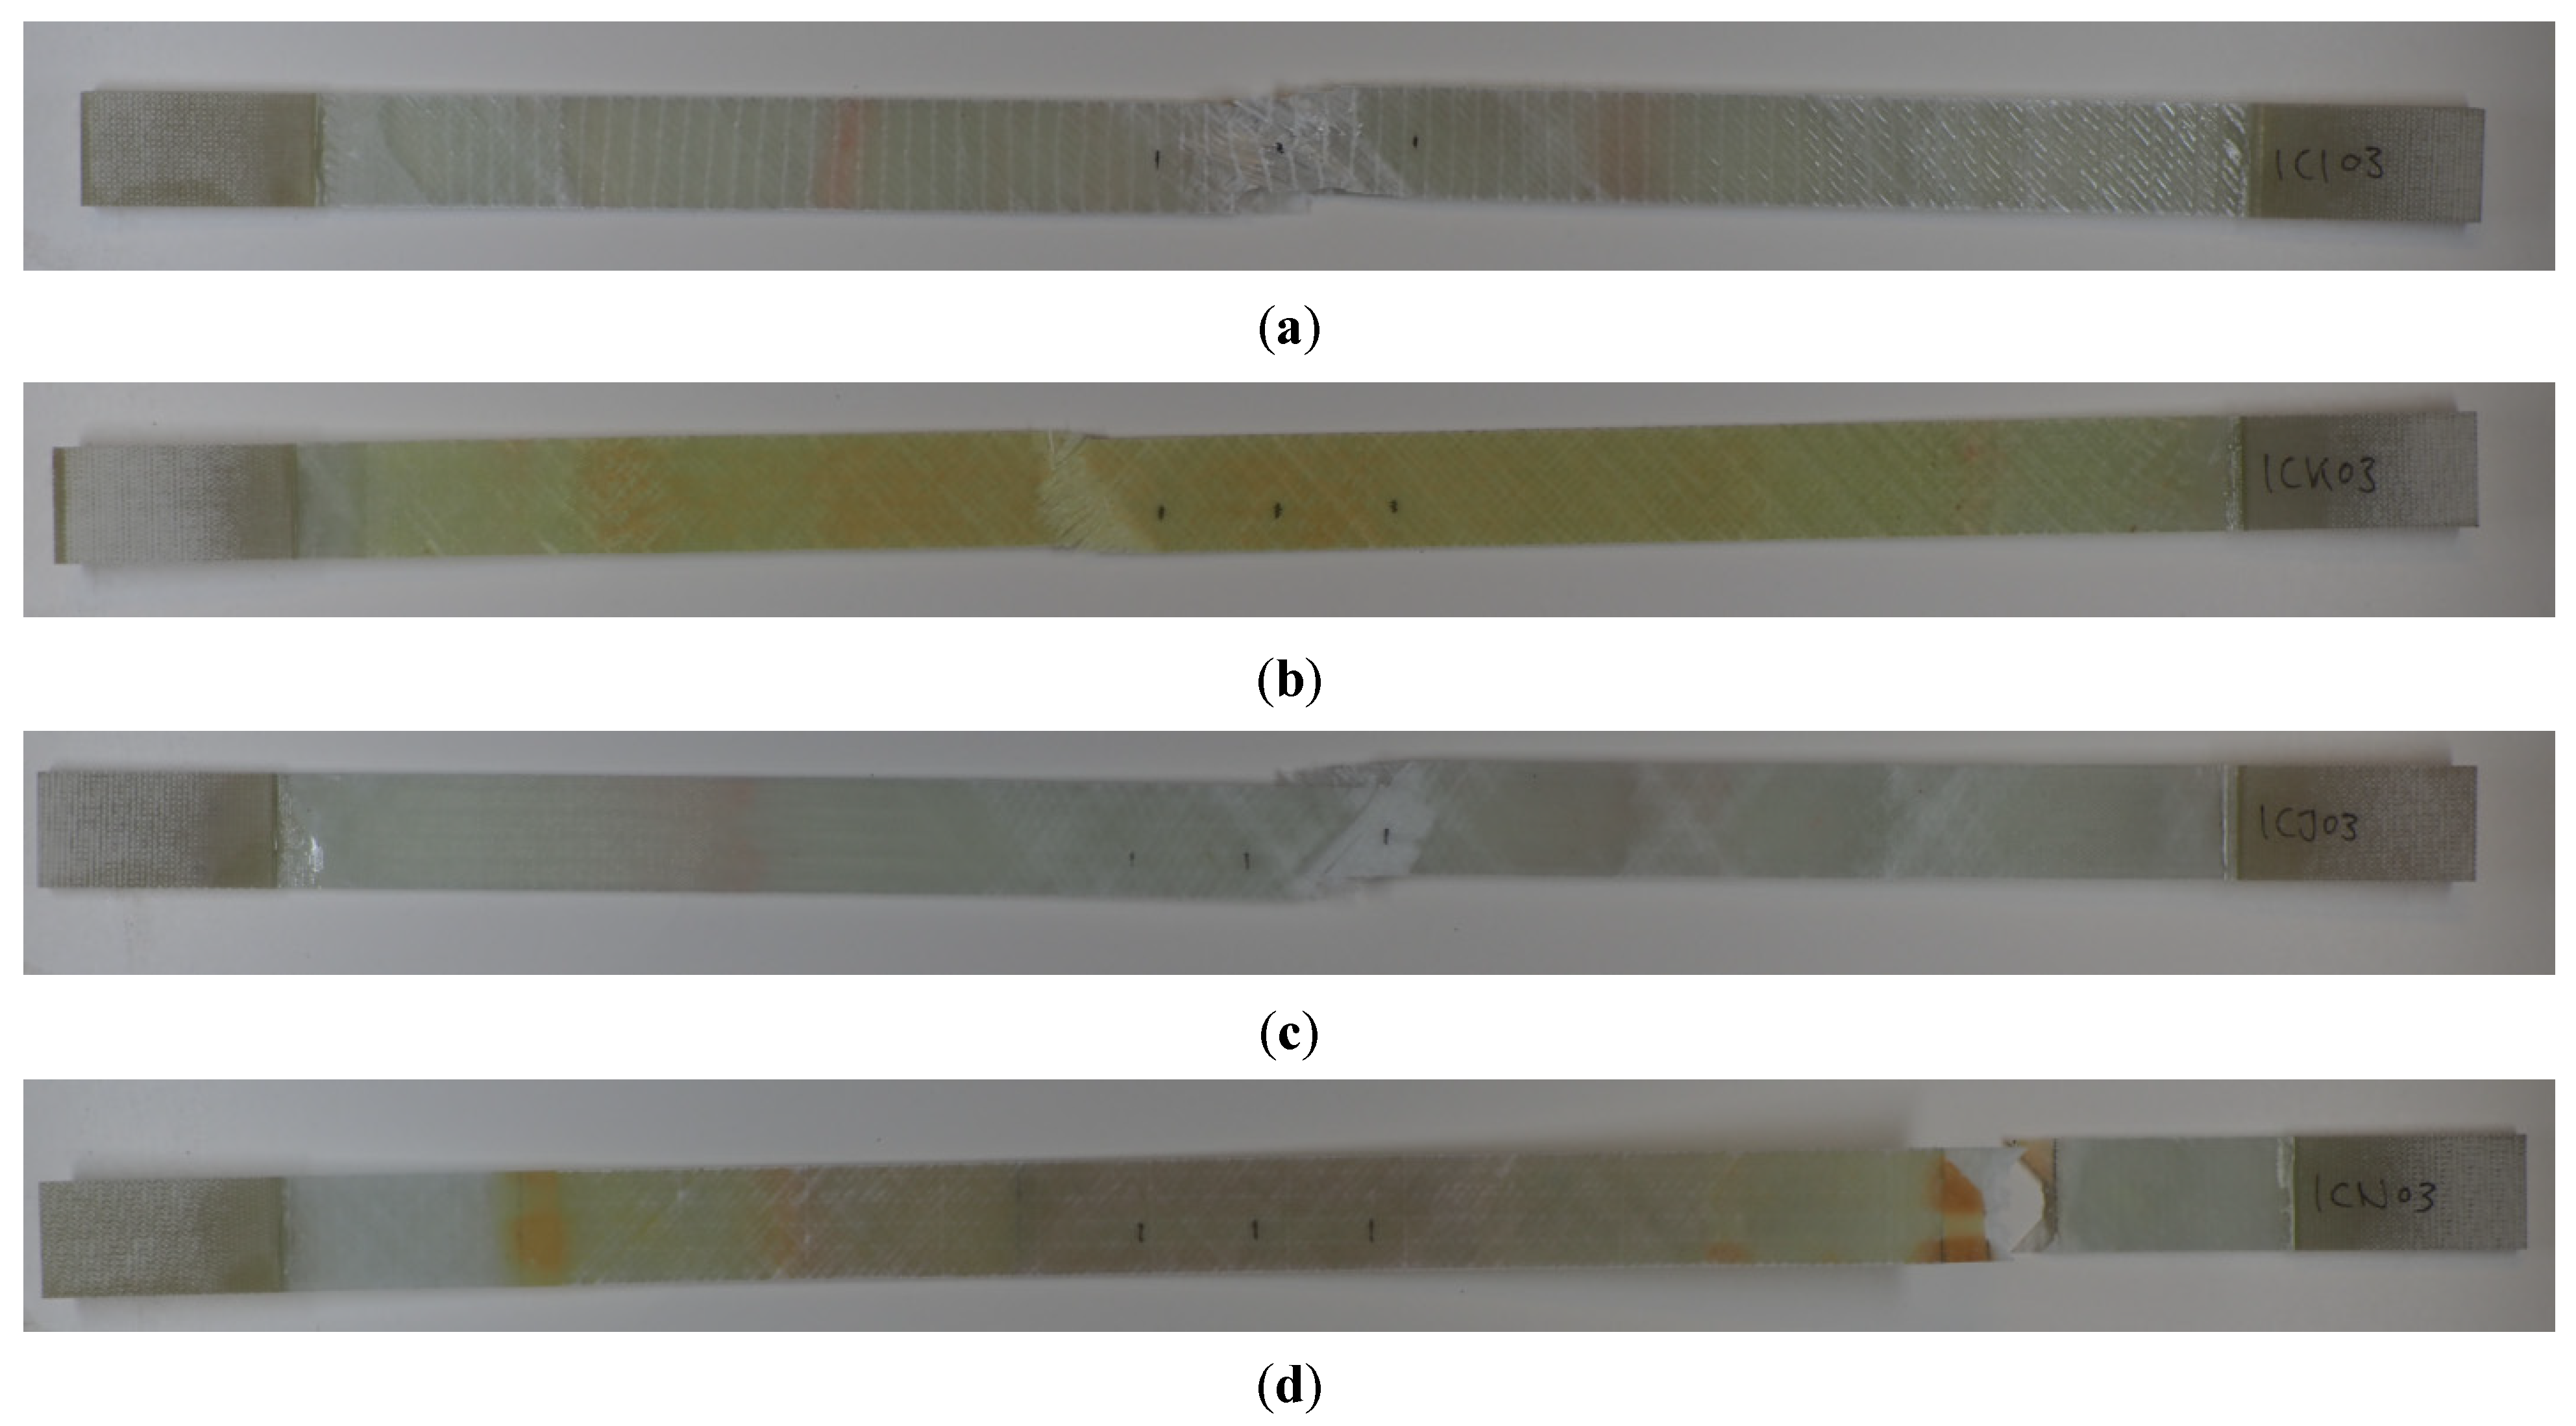
Figure 7 shows locations of failure for some samples (UV1, V1, V2). It can be seen that while all the static samples failed in the middle of the sample (i.e., in the scarf/adhesive/parent laminate “sandwich”), failure under fatigue loading started at different locations. the HL and UV2 samples broke on scarf/laminate interface, while the UV1, V2, and V1 samples were broken in the middle of the samples, similar to the static samples.
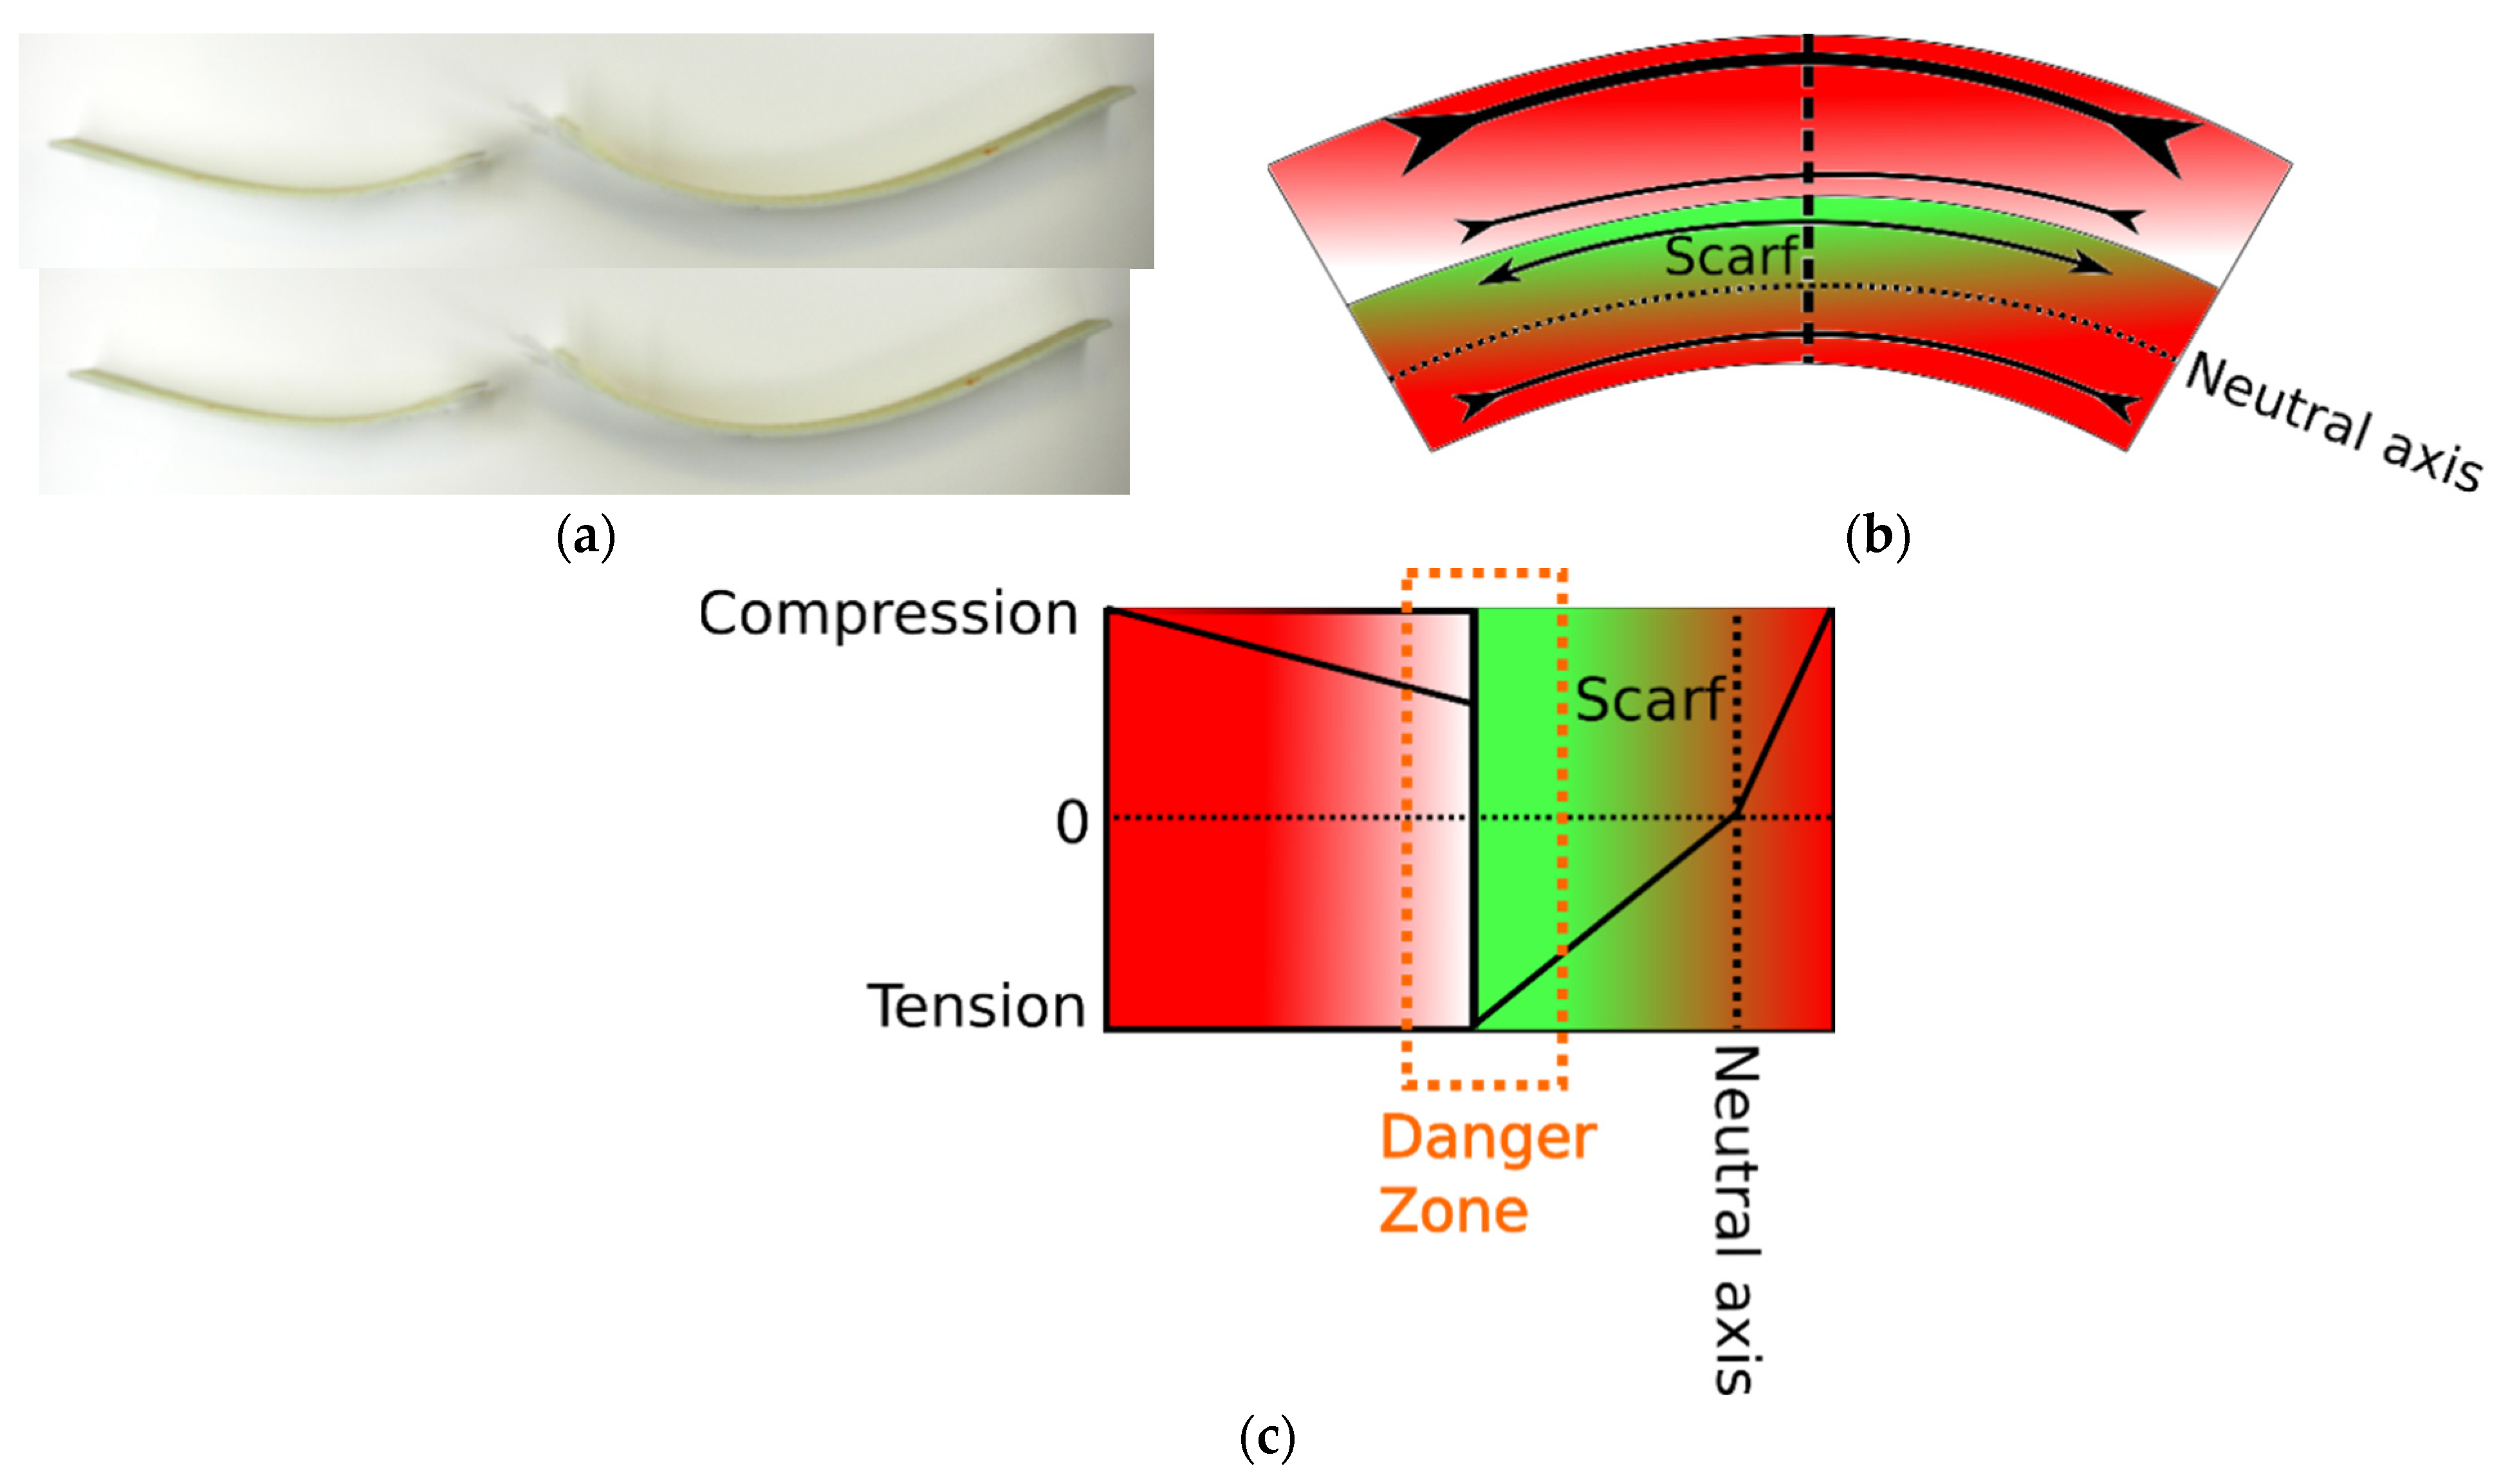
6. Sample Deformation: Internal Residual Stresses in the Repaired Blades
In the static tests, it was observed that the repaired samples tend to bend and show curvature after the tests. The hypothesis was formulated that the curvature of samples is a result of residual stresses, caused by different heating in scarf and parent laminate during curing processes.
Figure 8 shows several typical curved samples and a schema of potential local stress concentration, caused by different thermal and mechanical stresses in the repaired structure after curing.
Figure 8c shows how the deformation in the substrate laminate results in residual compressive stress in the laminate.
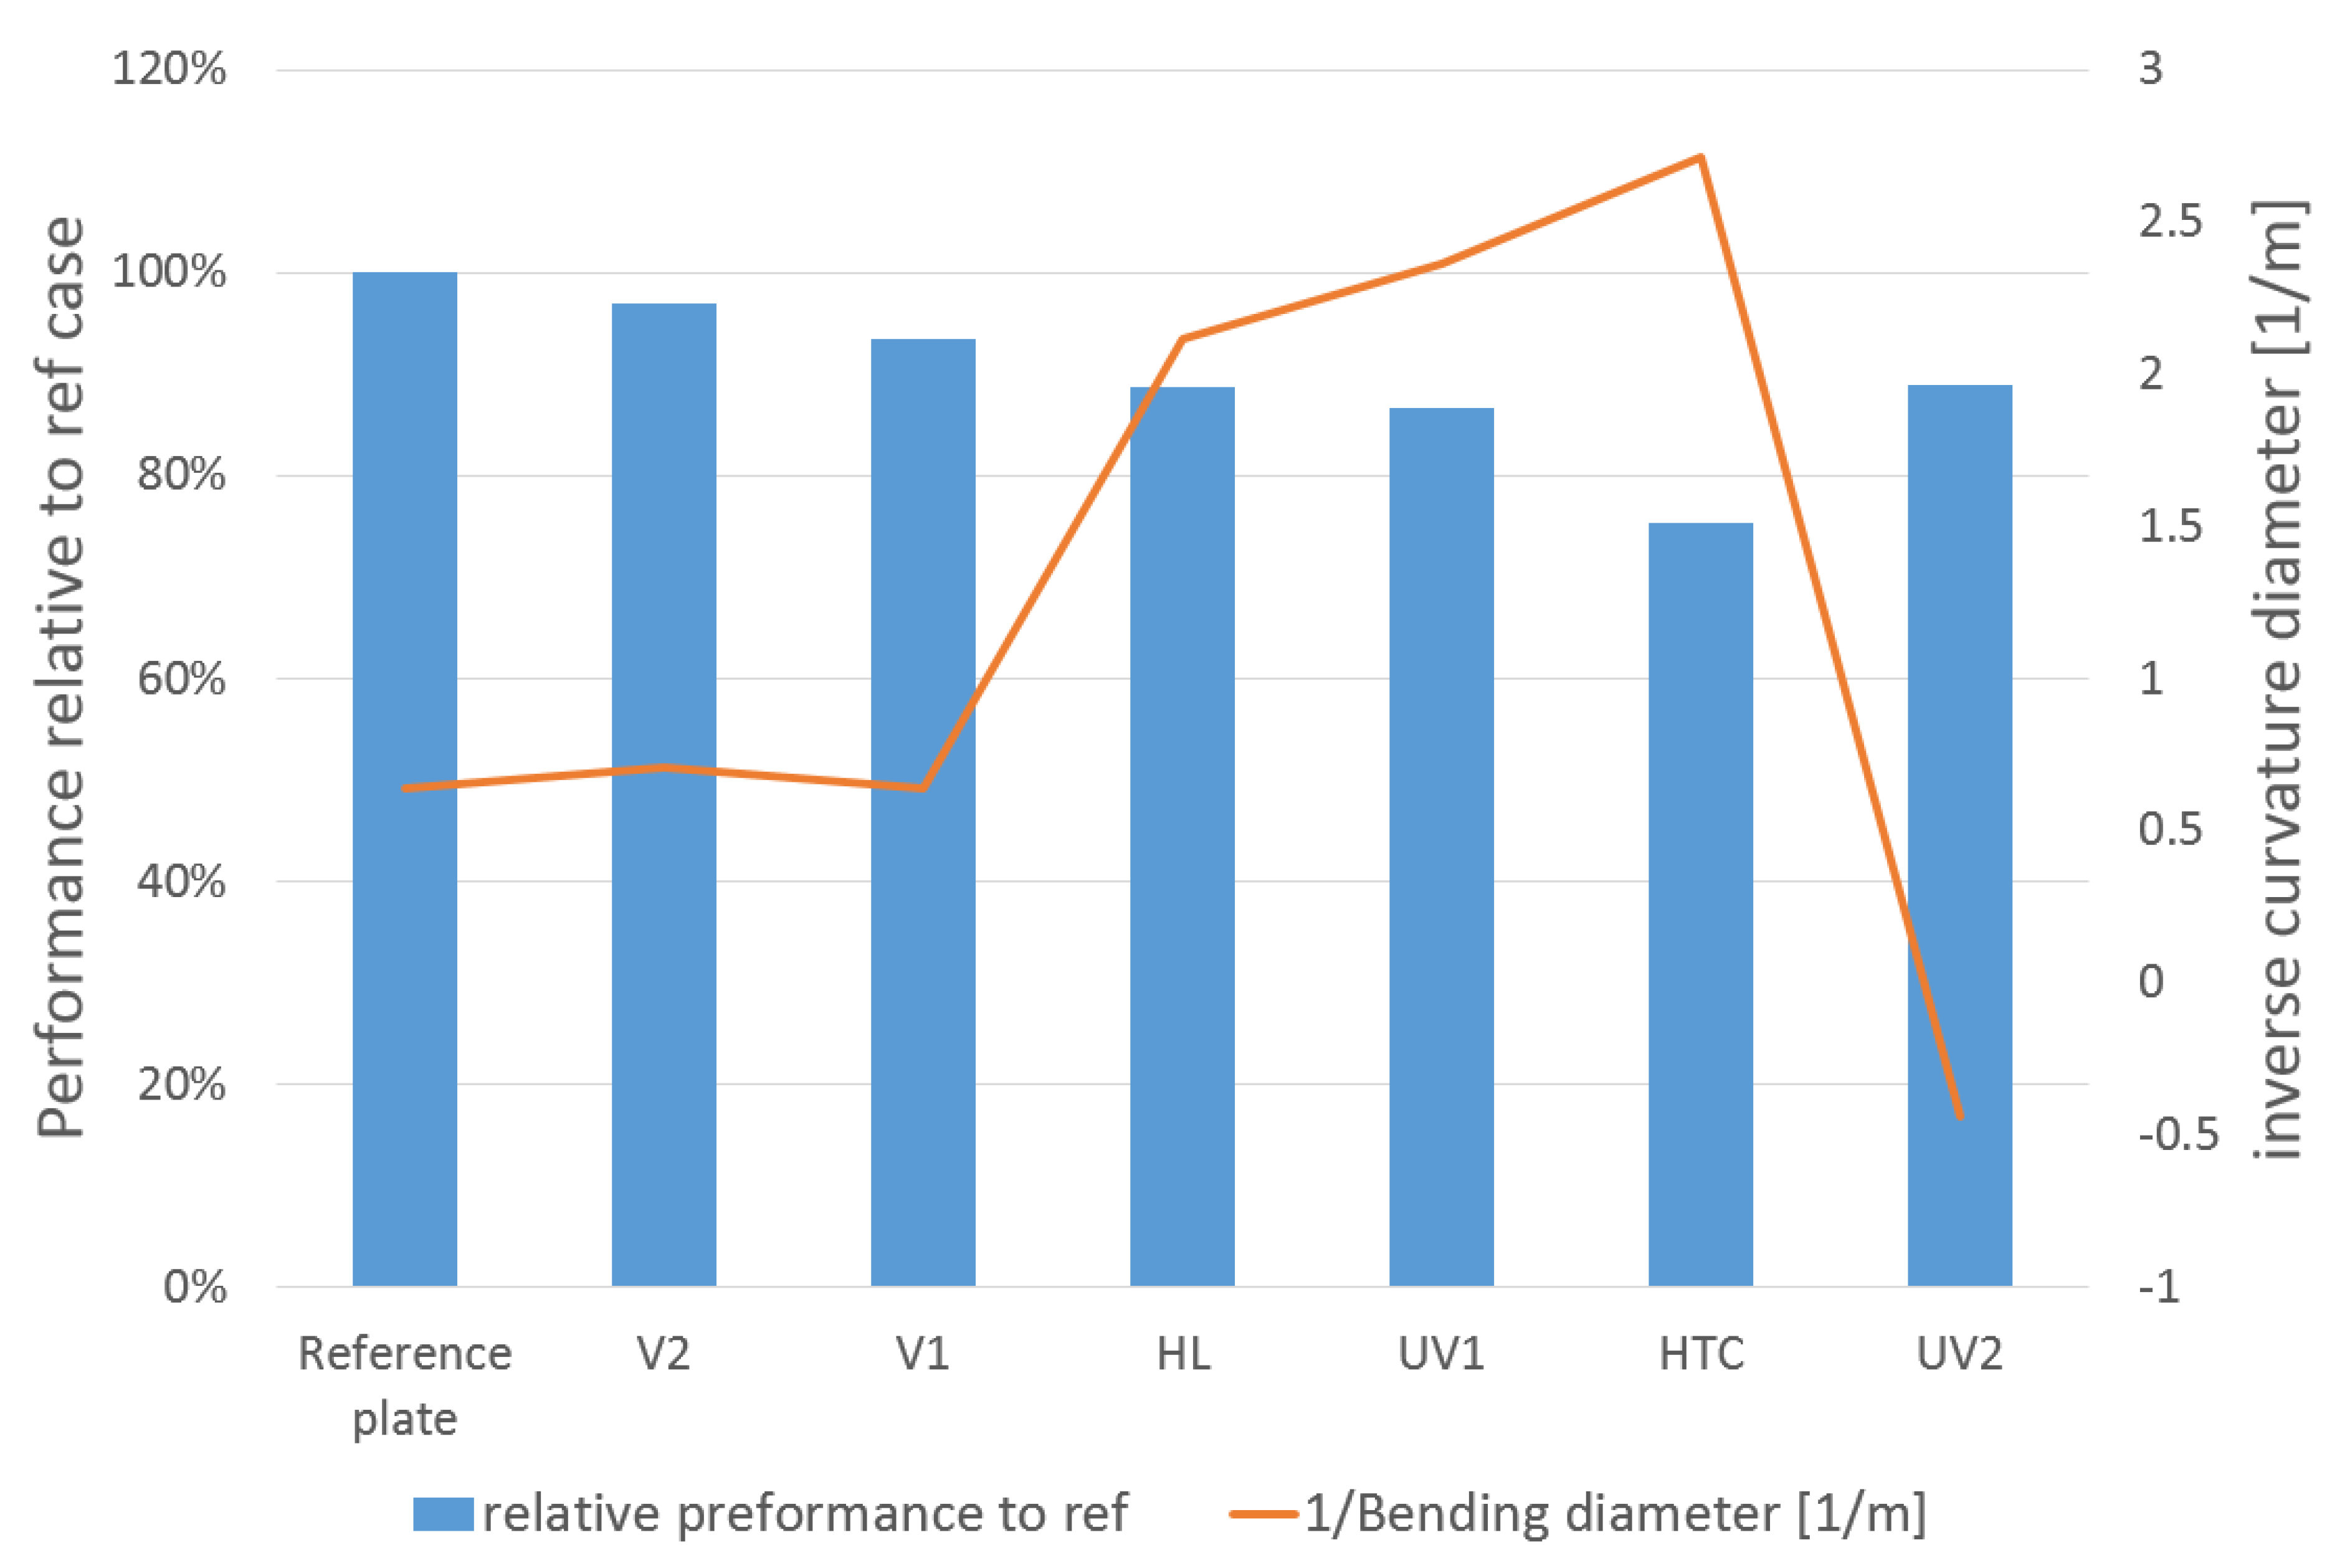
Curvatures of the samples were determined using the software IC Measure 2–0.026 (The Imaging Source Asia Co., Ltd., New Taipei City, Taiwan). The inverse curvature diameter was measured from pictures, taken perpendicular to the samples. The three-point circle was defined, and the diameter was calculated automatically. The curvature-tested samples, plotted versus the performance relative to the reference (non-repaired) case, are plotted in
Figure 9.
From
Figure 9, one can observe a correlation: that highly bent samples correspond also to relatively soft and tough (high maximum stress) repaired structures.
While the sample bending is a result of large strains applied during the destructive testing, and such high strains cannot be observed in real life, this illustrates the potential for undesirable internal stresses, when repairs are applied to a potentially unknown substrate.
7. Microscopic Analysis of Mechanisms of Damage of Repaired Blades
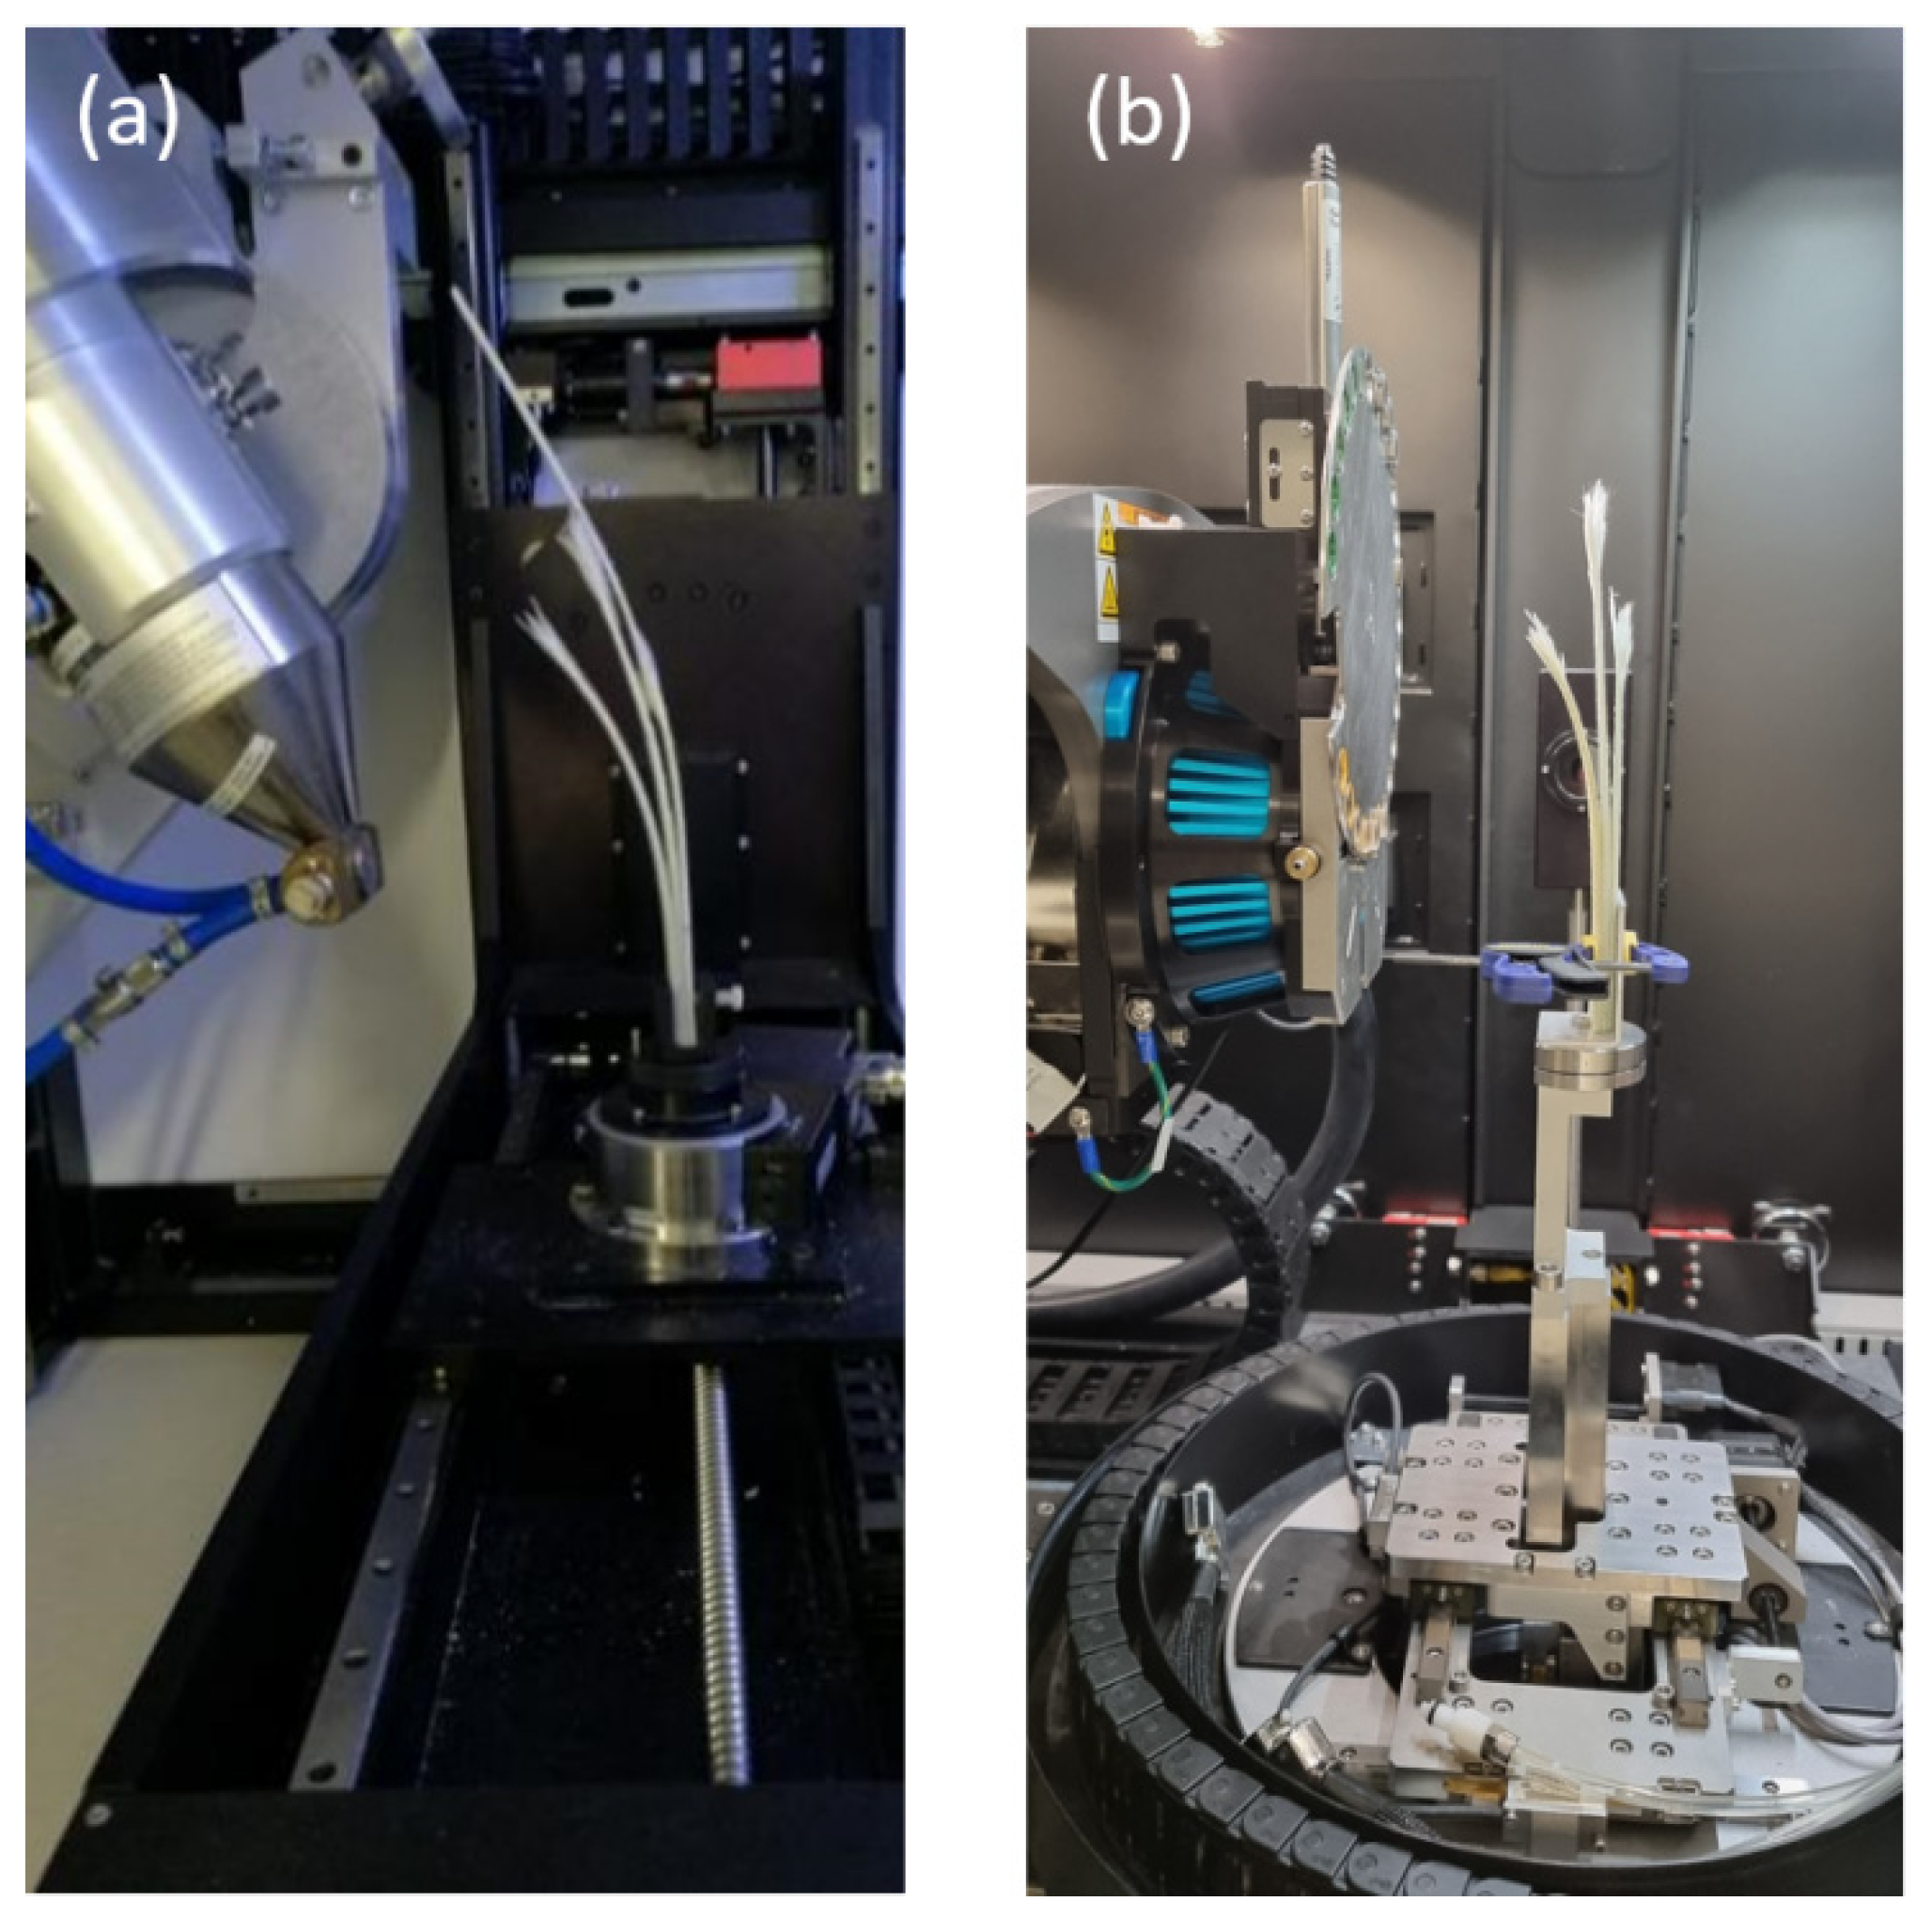
The tested samples were investigated by X-ray tomography to characterize the failure mechanisms. The samples were scanned with a polychromatic beam with energies up to 120 keV using a Nikon 225 and a Zeiss Xradia 520 Versa scanner.
Figure 10 shows the scanning setup in the two scanners. The reconstructions were performed using a standard filtered back projection resulting in a voxel size of 9.64 µm.
The reconstructions were segmented using a constant threshold to separate the black air bubbles from the grey epoxy and the white fibers. The histogram shows a clear dip between the black air bubbles and the grey epoxy and this position was selected as the segmentation threshold. The segmentation was performed on a sub-volume consisting of 1108 × 68 × 129 pixels that was positioned within the repair.
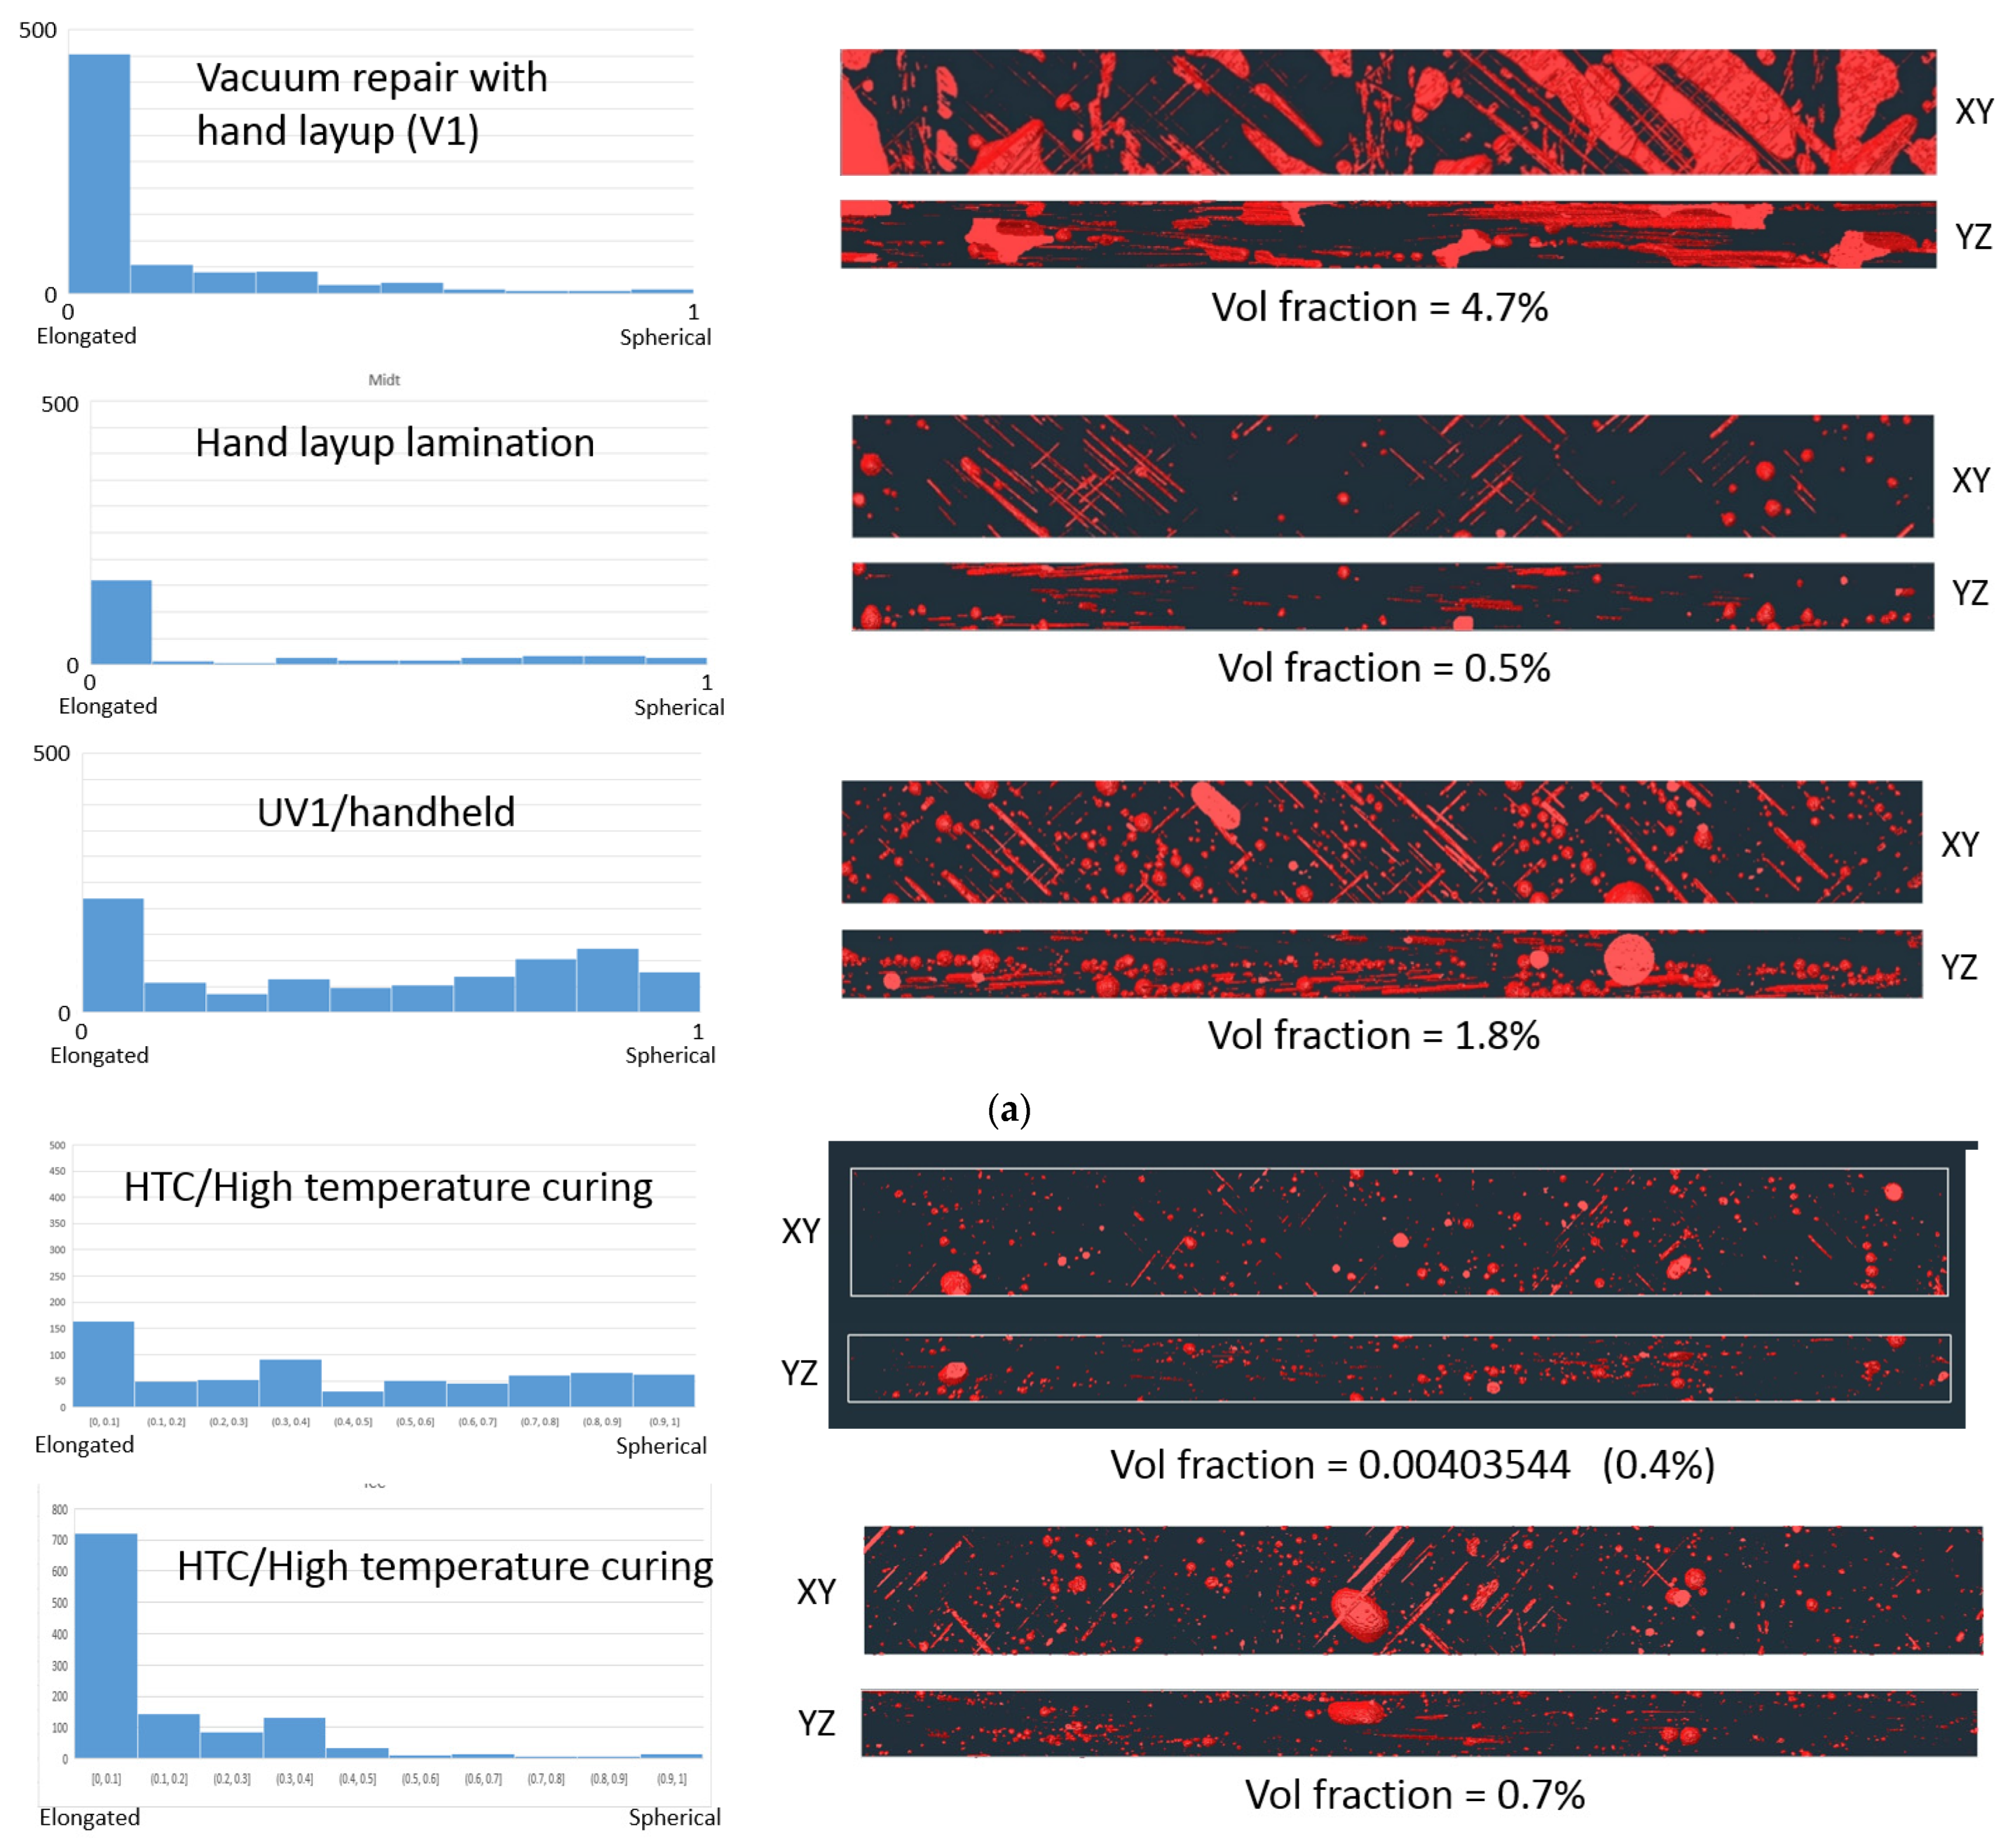
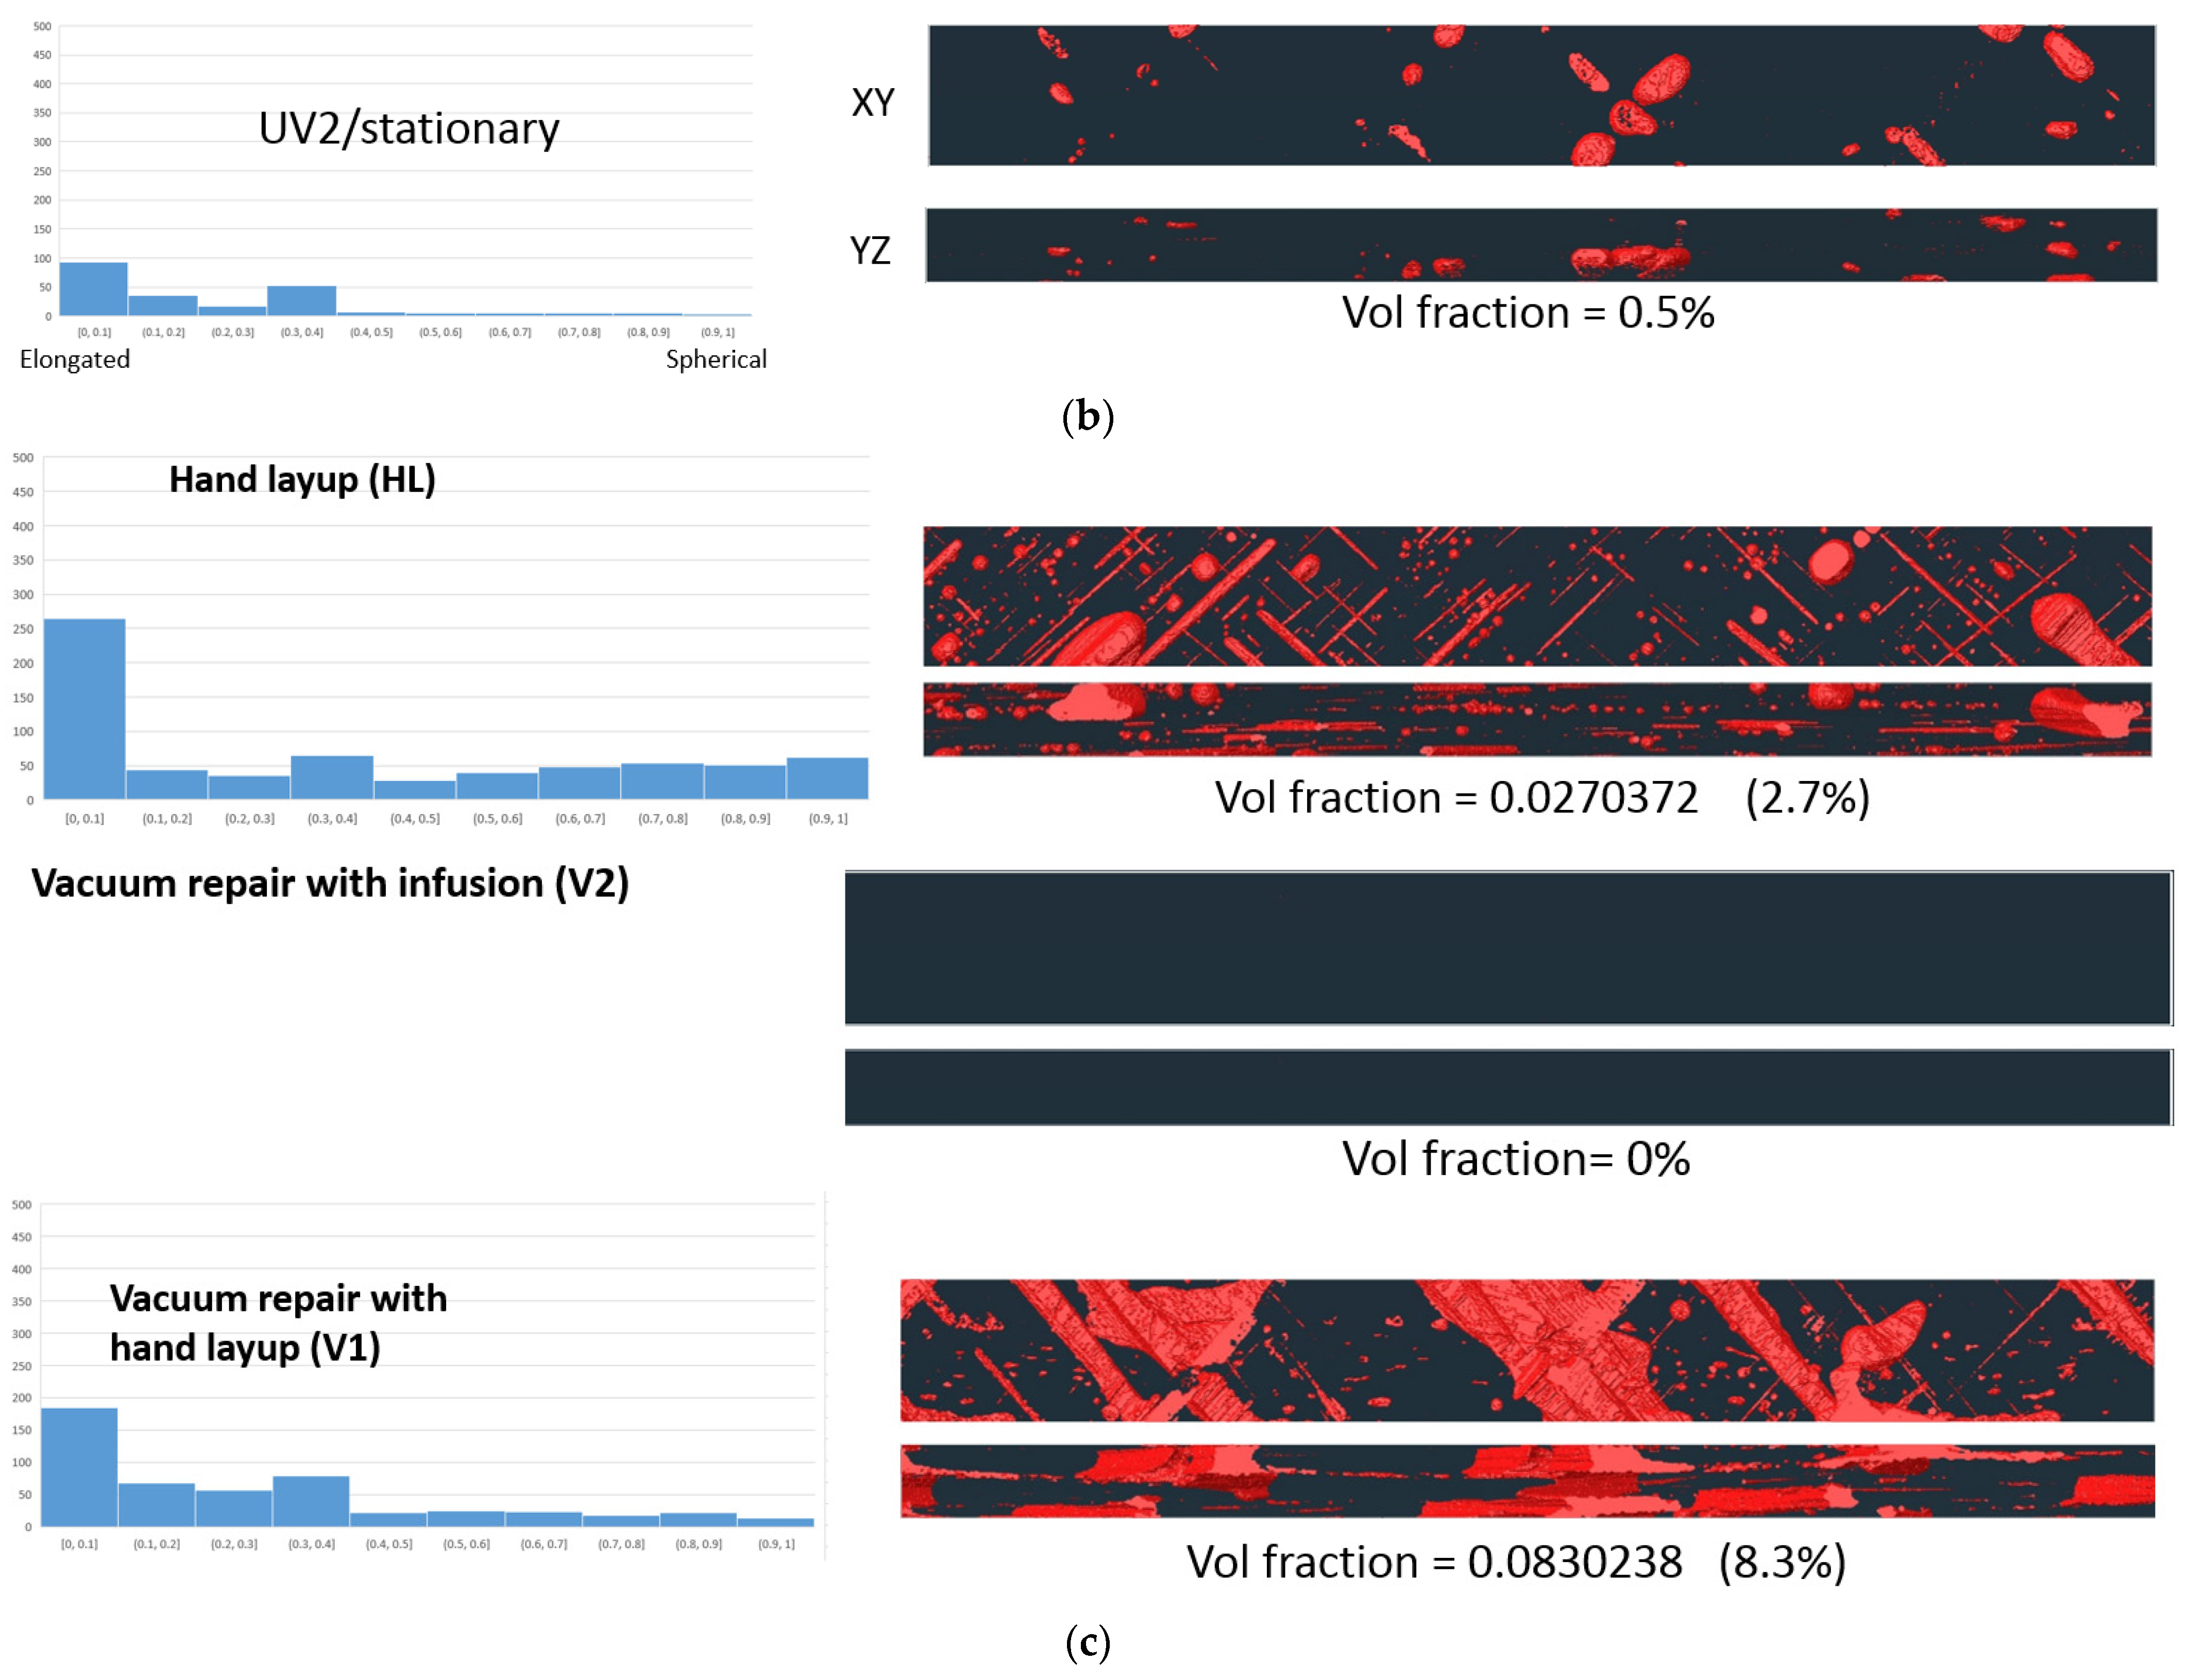
Figure 11 shows the distribution of the void content seen from two different directions (perpendicular to each other) and the shape (ellipsoid versus spherical) of the voids in the repaired samples. The elongation of the segmented objects (voids) was determined as the ratio between the length and width of the bounding box containing the individual voids. This value will be in the interval [0, 1] for elongated to spherical objects.
The volume fraction of voids within the analyzed volume was calculated. In
Figure 11 it can be seen that the vacuum repair with hand layup (V1) leads to a rather high porosity in the adhesive, over 4.7%. High-temperature curing (HTC) and stationary UV curing (UV2) technologies ensure the porosity of the level of 0.5%, relatively low. UV handheld (UV1) leads to acceptable, but still relatively high, porosity of 1.8%. High-temperature curing (HTC) leads to relatively equal distribution of elongated (i.e., fiber adjacent) and spherical voids, while vacuum and hand layup lead to the prevalence of elongated, fiber adjacent voids.
It is of interest that the V2 technology (vacuum repair with infusion) leads to very low porosity (below 0.0002%). Such a big difference between vacuum technologies can be explained as follows: vacuum infusion is “sucking” the resin through the laminate/repair and, therefore, dragging the porosities out. When hand lay-up is carried out, the resin does not really flow, only the operator applies and traps air. The same is the case for UV curing, which does not cause the resin travel, and thus can lead to more porosity.
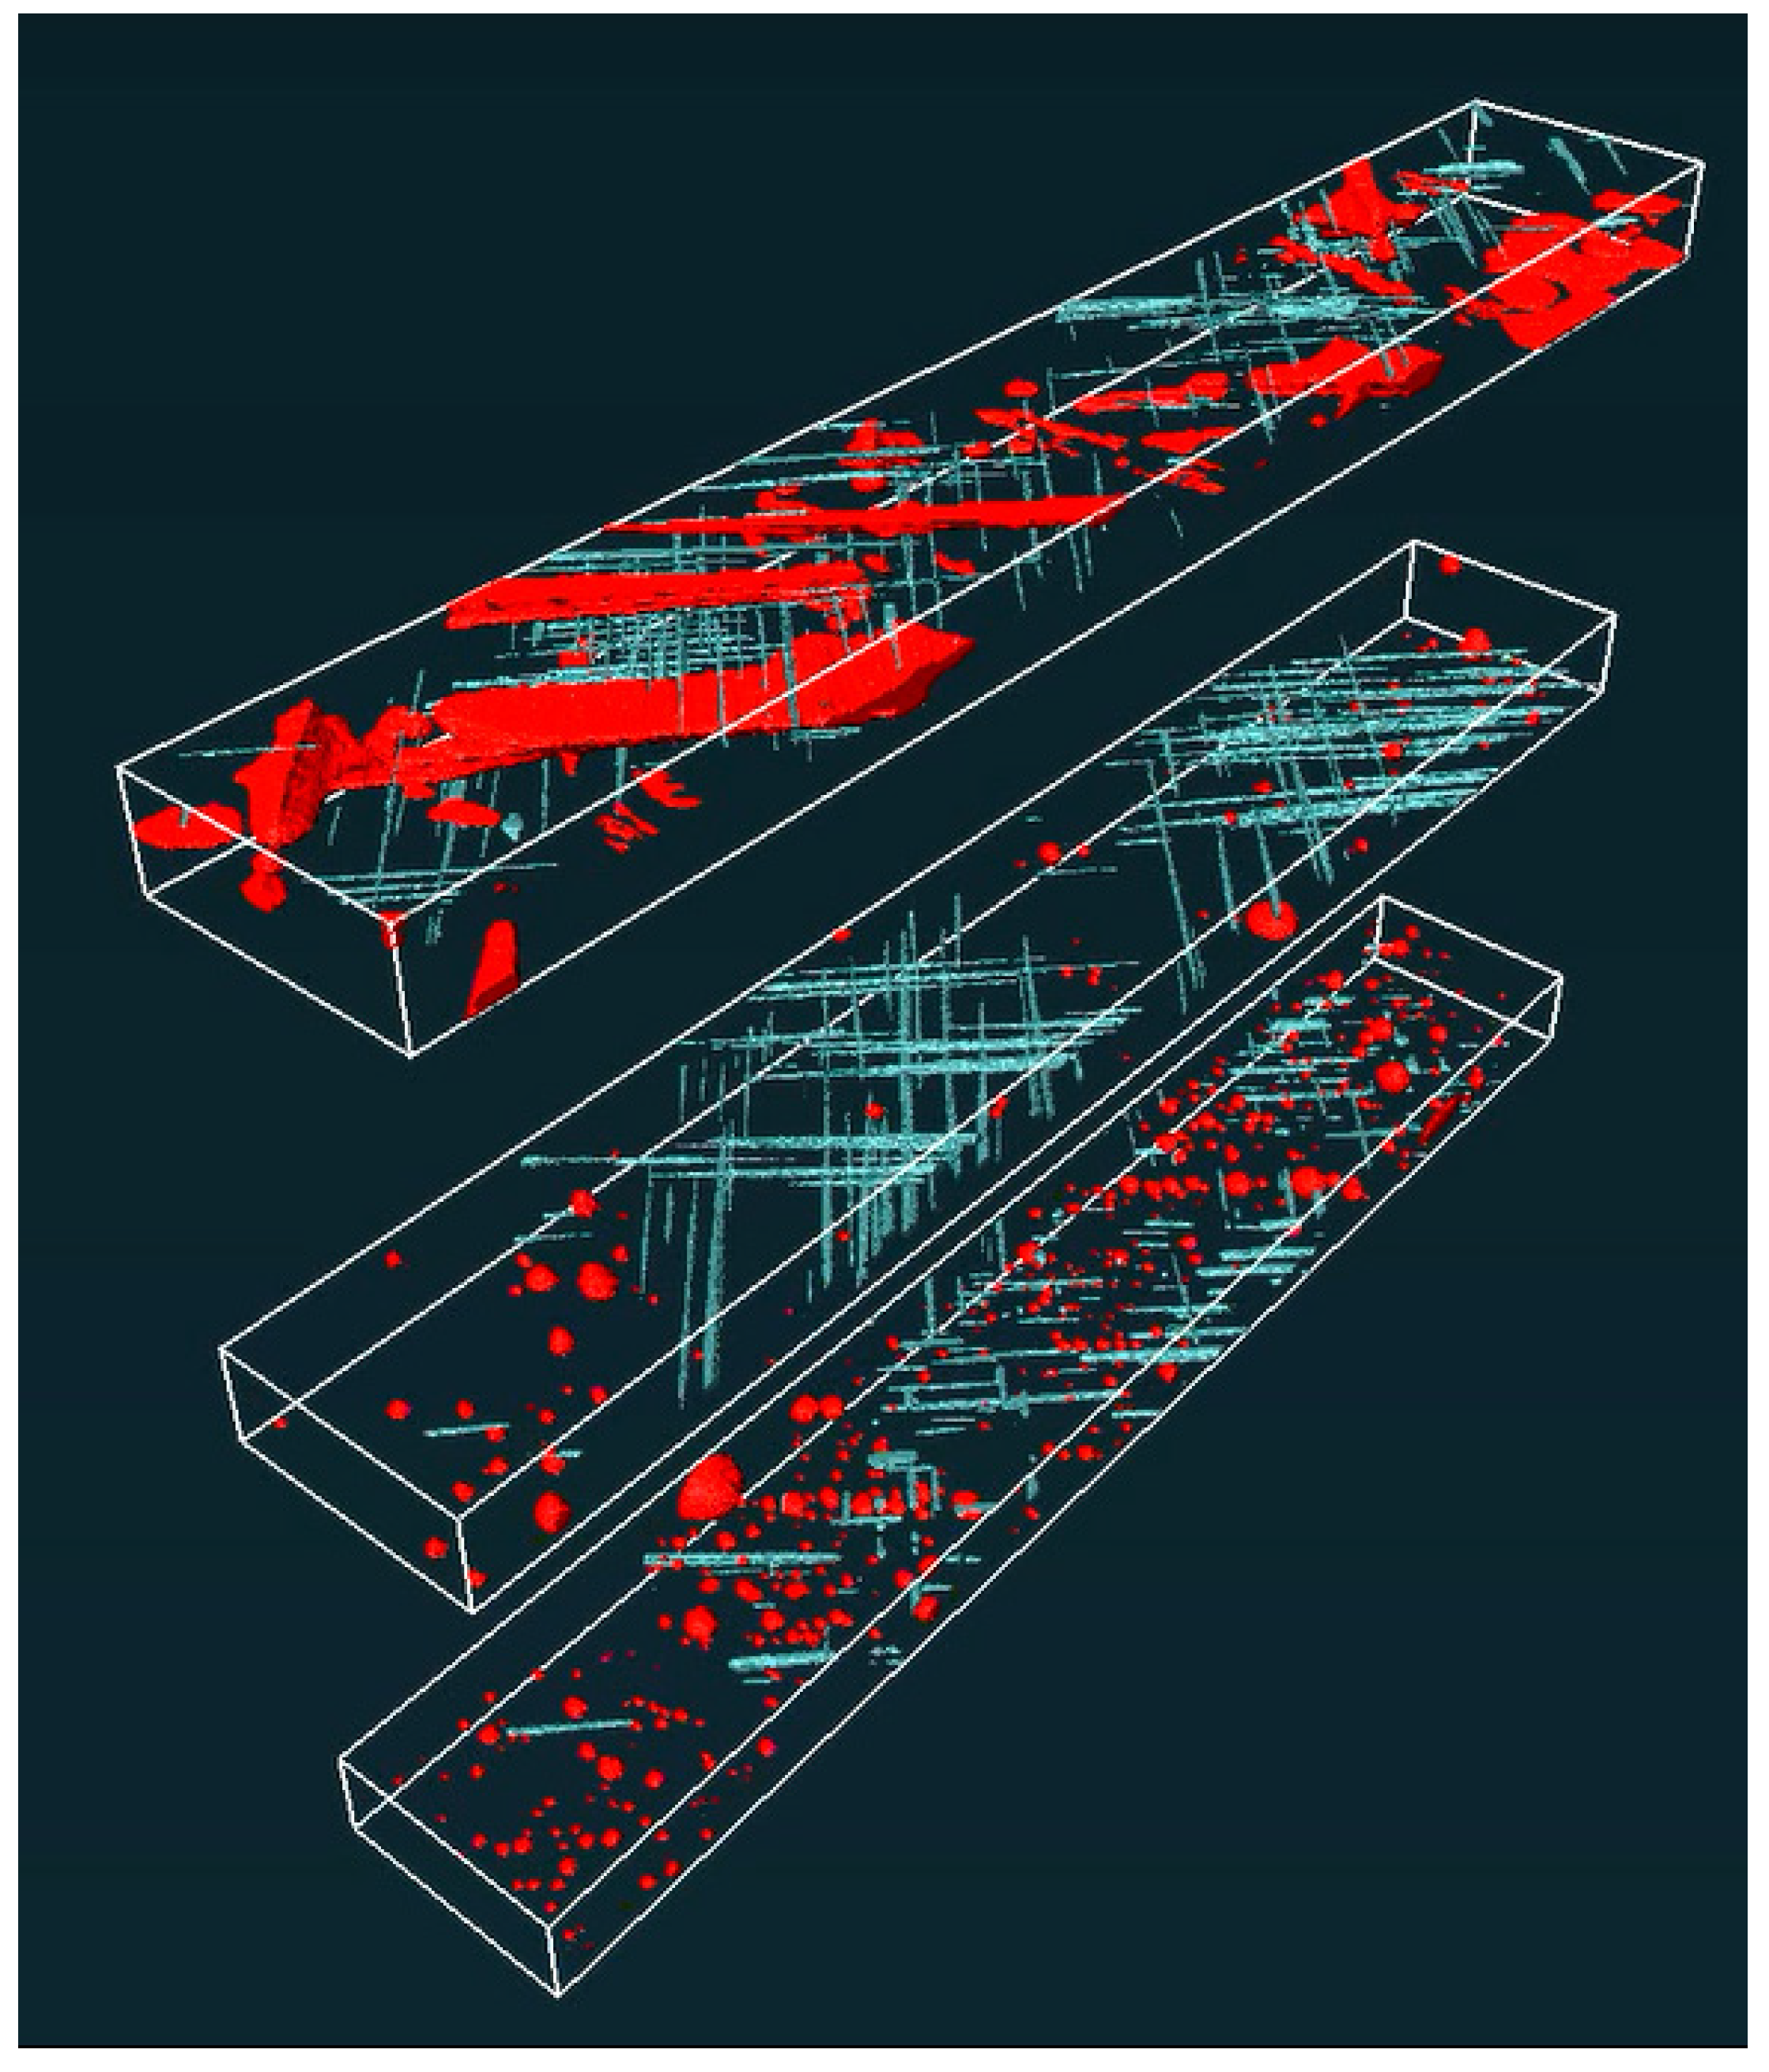
To visualize the void shape distribution more clearly, the different voids were marked with different colors.
Figure 12 shows the void distribution, where voids in resin are marked in red, while voids or air bubbles near fibers are marked in turquoise color, for vacuum repair with hand layup (V1), hand layup lamination (HL), and UV curing handheld (UVh1). Many small air bubbles in the bundles, and large air bubbles between bundles horizontally, form in V1 technology. Hand layup lamination (HL) leads to fewer small air bubbles in the bundles, and a few large and more spherical air bubbles. Handheld UV technology (UV1) leads to both small and medium-sized air bubbles in the bundles, and large and more spherical air bubbles between bundles.
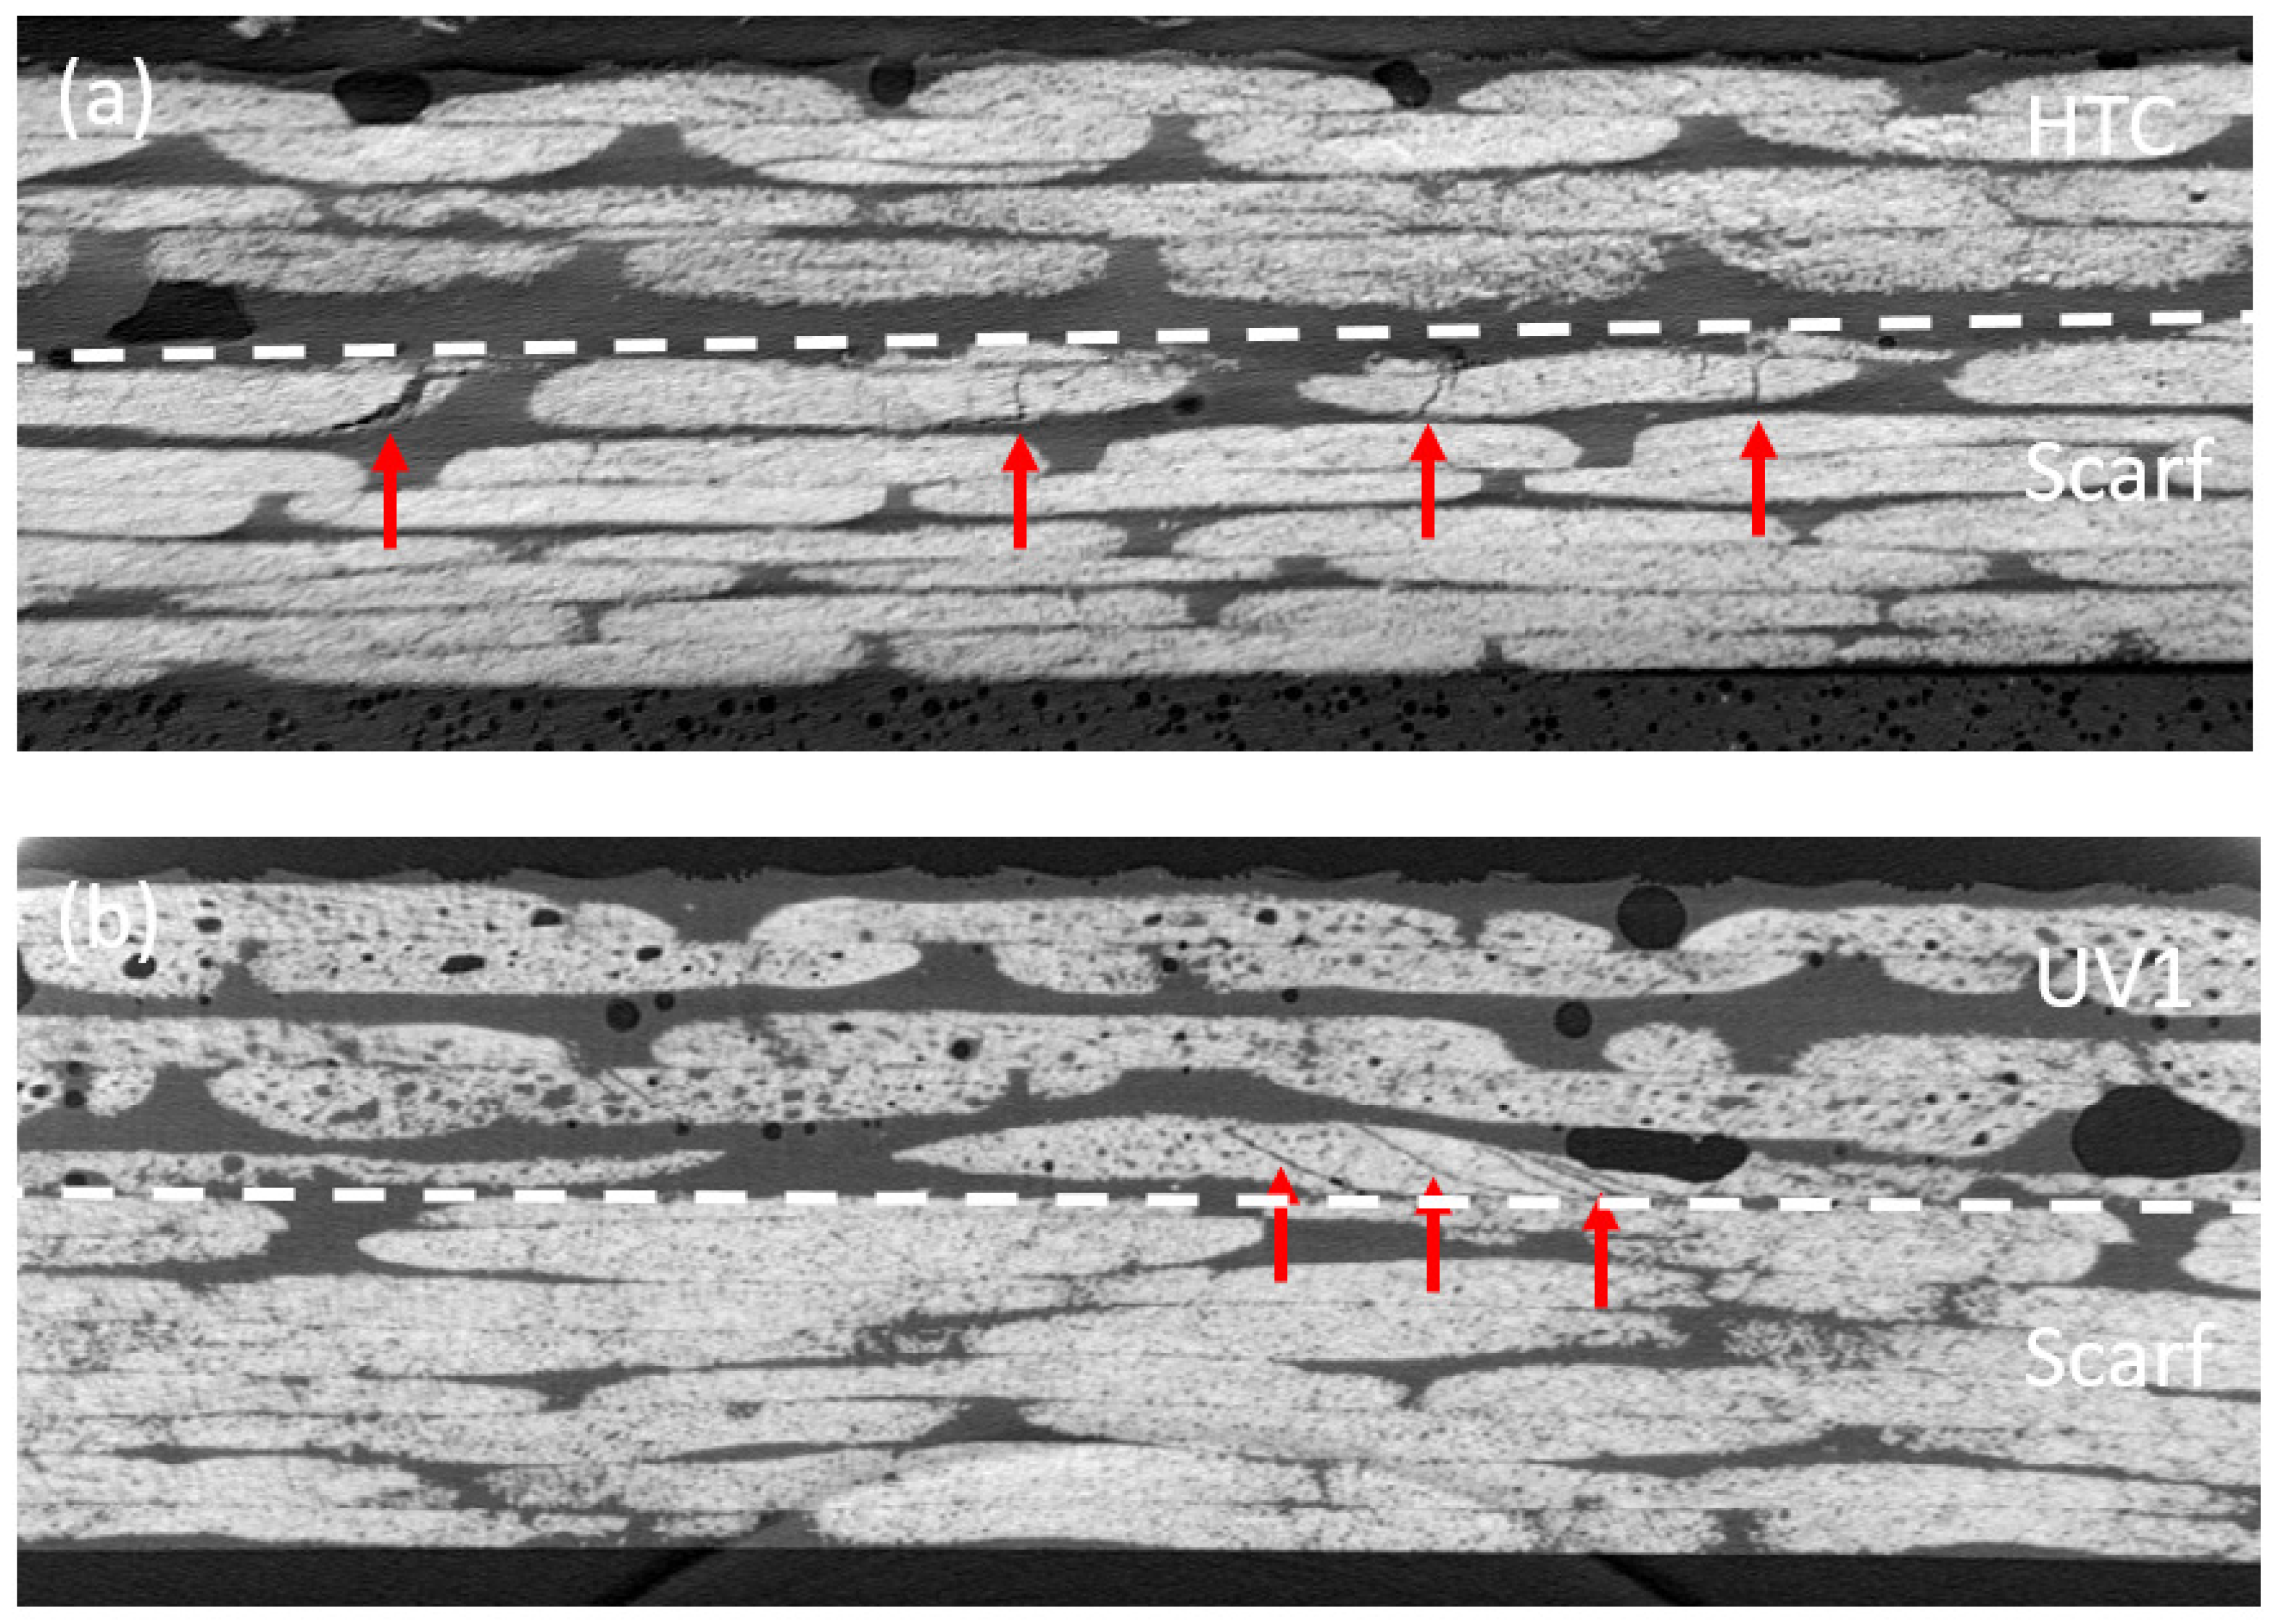
Furthermore, the microcracks/defects were identified in samples by inspecting virtual cross-sections through the tomographic reconstructions of the repaired samples.
Figure 13 shows the cracks identified in samples, namely, in high-temperature cured samples (HTC) and in handheld UV cured samples (UV1). In the first case (HTC), the cracks were found in the parent laminate. In the second case (UV1), the cracks were seen in scarf.
Based on these investigations, the following conclusions can be drawn: the vacuum hand layup technology leads to the formation of a lot of voids in the repaired part, more than all other technologies. However, the vacuum infusion technology leads to a very low porosity.
Comparing these observations to the observations from
Section 5 (fatigue testing), one can see that the fatigue lifetime corresponds to the trend of porosity: with a view on lifetime, vacuum repair with hand layup (showing very high porosity) shows the lowest lifetime. Handheld UV curing shows the best performance (even better than industrial UV curing), what supposedly reflects the experience of the technician.
8. Conclusions
Technologies for the structural repair of damaged wind turbine blades are compared, with view on strength, stiffness, and porosity of repaired laminates. Six widely used technologies were applied to repair damaged laminates under comparable conditions, and the resulting repaired samples were tested under tensile static and fatigue tests, and subject to microscopic X-ray investigations.
Technologies using the application of vacuum lead to stiffer repaired structures, and lower maximum stress. High-temperature curing leads to softer structures, but with higher maximum stress. Ultraviolet curing technologies ensure average stiffness and high strength.
The vacuum hand layup technology leads to the formation of a lot of voids in the repaired part, more than all other technologies. The hand layup without vacuum also creates long elongated voids, probably related to badly bonded fibers.
Several samples show clear residual stresses and were bent after testing. This can mean that some repair technologies create internal/thermal stresses in laminates. Also, in some cases, cracks in the “parent” composite, and microcracks in scarf were observed after repair.
Fatigue lifetime results follow the trend of porosity: vacuum hand layup technology shows the lowest lifetime, and both UV and high temperature curing show average results. Handheld UV curing shows the best performance (even better than industrial UV curing), which supposedly reflects the experience of the technician. The UV2 (stationary UV system) shows an average lifetime, but high variability.
This work is a basic study and comparison of the most commonly used repair techniques. The future directions should also include other more advanced technologies, nanoengineered adhesives, comparison of various techniques of surface preparation, effect of humidity and temperature on the repair techniques, and also more parametric studies using large statistics (varying the same resins and temperatures of curing).
Author Contributions
Conceptualization, L.M.J.; methodology, L.M.J., A.F.; validation, A.F., N.F.-J.J., T.J., B.B.; formal analysis, N.F.-J.J.; investigation, L.M.J., S.F., N.F.-J.J.; data curation, N.F.-J.J., T.J., B.B.; writing—original draft preparation, L.M.J.; writing—review and editing, L.M.J.; supervision, L.M.J.; project administration, L.M.J.; funding acquisition, L.M.J. All authors have read and agreed to the published version of the manuscript.
Funding
This research was funded by Innovation Foundation of Denmark in the framework of the Grand Solutions project DURA-LEDGE, Durable leading edges for high tip speed wind turbine blades, File nr.: 8055-00012A, and of the Ministry of Foreign Affairs of Denmark, in the framework of Danida grant 19-M02-DTU “Maintenance and Repair Strategy for Wind Energy Development”.
Acknowledgments
The authors gratefully acknowledge the financial support of the Innovation Foundation of Denmark in the framework of the Grand Solutions project DURALEDGE, Durable leading edges for high tip speed wind turbine blades, File nr.: 8055-00012A, and of the Ministry of Foreign Affairs of Denmark, in the framework of Danida grant 19-M02-DTU “Maintenance and Repair Strategy for Wind Energy Development”. L.M.J. is grateful to Povl Brøndsted and Tom Andersen for valuable discussions.
Conflicts of Interest
The authors declare no conflict of interest.
Abbreviations
| c | hourly costs |
| cD | costs of downtime per hour |
| Cequip | costs of equipment and materials |
| Clabor | costs of field labor |
| Crep1 | costs of single repair |
| Ctrans | costs of transportation |
| TD | duration of downtime |
| M | size of repair team |
| NF | number of failures per year |
| trep | time of repair |
| tw | duration of work |
| HL | hand layup lamination |
| HTC | high-temperature thermal curing |
| UV1 | ultraviolet repair with handheld, portable, continuous UV spectrum curing |
| UV2 | ultraviolet repair with stationary device |
| V1 | vacuum repair with hand layup |
| V2 | vacuum repair with infusion |
References
- Global Wind Power Market Report 2021–2027; Global; Research and Markets: 2021. Available online: https://www.prnewswire.com/news-releases/global-wind-power-market-report-2021-2027---wind-energy-research--development-projects-get-a-shot-in-the-arm-leading-to-increase-in-patent-filing-301373291.html (accessed on 13 October 2021).
- Nilsen, E. Biden Administration Announces Plans for Massive Expansion of Wind Farms off US Coasts. Available online: https://www.wdsu.com/article/biden-administration-announces-plans-for-massive-expansion-of-wind-farms-off-us-coasts/37954033# (accessed on 13 October 2021).
- Unplanned Wind Turbine Repairs to Cost Industry $8 Billion+ in 2019. Available online: https://www.woodmac.com/press-releases (accessed on 24 February 2022).
- Ziegler, L.; Gonzalez, E.; Rubert, T.; Smolka, U.; Melero, J.J. Lifetime extension of onshore wind turbines: A review. Renew. Sustain. Energy Rev. 2018, 82, 1261–1271. [Google Scholar] [CrossRef] [Green Version]
- Liu, D. Where is the European Wind Power Market? And where is it going? In Proceedings of the Blades Global Conferences, Online Conference, 11 March 2021. [Google Scholar]
- Mishnaevsky, L., Jr. Offshore Wind Energy: Challenges and Perspectives, Green Technologies for Eurasia’s Sustainable Future. Available online: https://papers.ssrn.com/sol3/papers.cfm?abstract_id=3990559 (accessed on 13 October 2021).
- Mishnaevsky, L., Jr.; Thomsen, K. Costs of repair of wind turbine blades: Influence of technology aspects. Wind Energy 2020, 23, 2247–2255. [Google Scholar] [CrossRef]
- Carroll, J.; McDonald, A.; McMillan, D. Failure rate, repair time and unscheduled O&M cost analysis of offshore wind turbines. Wind Energy 2016, 19, 1107–1119. [Google Scholar]
- Mishnaevsky, L., Jr. Repair of wind turbine blades: Review of methods and related computational mechanics problems. Renew. Energy 2019, 140, 828–839. [Google Scholar] [CrossRef]
- Boopathi, K.; Mishnaevsky, L., Jr.; Sumantraa, B.; Premkumar, S.A.; Thamodharan, K.; Balaraman, K. Balaraman, Failure mechanisms of wind turbine blades in India: Climatic, regional and seasonal variability. Wind Energy 2021. [Google Scholar] [CrossRef]
- Katnam, K.B.; Comer, A.J.; Roy, D.; da Silva, L.; Young, T. Composite Repair in Wind Turbine Blades: An Overview. J. Adhes. 2014, 91, 113–139. [Google Scholar] [CrossRef]
- Eom, Y.; Boogh, L.; Michaud, V.; Sunderland, P.; Månson, J.-A.E. Dynamics of void formation upon curing of epoxy resin. In Proceedings of the 12th International Conference on Composite Materials (ICCM 12), Paris, France, 5–9 July 1999. [Google Scholar]
- Kardos, J.L.; Duduković, M.P.; Dave, R. Void Growth and Resin Transport During Processing of Thermosetting—Matrix Composites. In Advances in Polymer Science 80; Springer: Berlin/Heidelberg, Germany, 1986; pp. 101–123. [Google Scholar]
- Tang, J.-M.; Lee, W.I.; Springer, G.S. Effects of Cure Pressure on Resin Flow, Voids, and Mechanical Properties. J. Compos. Mater. 1987, 21, 421–440. [Google Scholar] [CrossRef]
- Mischnaewski, L., III; Mishnaevsky, L., Jr. Structural repair of wind turbine blades: Computational model for the evaluation of the effects of adhesive and patch properties on the repair quality. Wind Energy 2021, 24, 402–408. [Google Scholar] [CrossRef]
Figure 1.
Schema of damaged plate (a), photos of plate (b) and of repair procedure (c).
Figure 1.
Schema of damaged plate (a), photos of plate (b) and of repair procedure (c).
Figure 2.
Photo of repaired plate, and geometry of samples to be cut out.
Figure 2.
Photo of repaired plate, and geometry of samples to be cut out.
Figure 3.
Typical stress-strain curves of the specimens. Here: HL—hand layup lamination, HTC—high-temperature thermal curing, UV1—ultraviolet repair with handheld, portable, continuous UV spectrum curing, UV2—ultraviolet repair with stationary device, V1—vacuum repair with hand layup, V2—vacuum repair with infusion, and Ref—reference, unrepaired sample.
Figure 4.
Comparison of different repair technologies, (a) relative (normalized by reference/unrepaired case) Young moduli, and (b) relative (normalized by unrepaired case) strengths of samples.
Figure 4.
Comparison of different repair technologies, (a) relative (normalized by reference/unrepaired case) Young moduli, and (b) relative (normalized by unrepaired case) strengths of samples.
Figure 5.
Locations of failure for some samples: (a) V1, vacuum repair with hand layup, (b) HL, hand layup lamination, (c) UV1, handheld UV curing.
Figure 5.
Locations of failure for some samples: (a) V1, vacuum repair with hand layup, (b) HL, hand layup lamination, (c) UV1, handheld UV curing.
Figure 6.
Cycle to failure for fatigue testing of peak strain 0.5%.
Figure 6.
Cycle to failure for fatigue testing of peak strain 0.5%.
Figure 7.
Locations of failure for some samples: (a–c) UV1, V1, and V2 samples (failure in the middle of the sample), and (d) UV2 sample (failure at the border scarf/parent laminate).
Figure 7.
Locations of failure for some samples: (a–c) UV1, V1, and V2 samples (failure in the middle of the sample), and (d) UV2 sample (failure at the border scarf/parent laminate).
Figure 8.
Curved samples (a) and schema of danger zones caused by residual stresses (b). The lower figure (c) shows the potential danger zone, which can appear in post-repair blade posts.
Figure 8.
Curved samples (a) and schema of danger zones caused by residual stresses (b). The lower figure (c) shows the potential danger zone, which can appear in post-repair blade posts.
Figure 9.
Curvature of tested samples, plotted versus the performance relative to the reference (non-repaired) case.
Figure 9.
Curvature of tested samples, plotted versus the performance relative to the reference (non-repaired) case.
Figure 10.
Scanning setup of three samples within the Nikon scanner (a) and the Zeiss Xradia 520 Versa scanner (b).
Figure 10.
Scanning setup of three samples within the Nikon scanner (a) and the Zeiss Xradia 520 Versa scanner (b).
Figure 11.
Volume fraction of voids and shapes of voids (elongated versus spherical) for tested samples: (a) vacuum repair with hand layup/hand layup/handheld UV, (b) high-temperature curing/stationary UV, and (c) hand layup/vacuum repair with infusion/vacuum repair with hand layup.
Figure 11.
Volume fraction of voids and shapes of voids (elongated versus spherical) for tested samples: (a) vacuum repair with hand layup/hand layup/handheld UV, (b) high-temperature curing/stationary UV, and (c) hand layup/vacuum repair with infusion/vacuum repair with hand layup.
Figure 12.
Voids in resin (red) versus voids near fibers (blue), for vacuum repair with hand layup (V1), hand layup lamination (HL), and UV curing handheld (UV1).
Figure 12.
Voids in resin (red) versus voids near fibers (blue), for vacuum repair with hand layup (V1), hand layup lamination (HL), and UV curing handheld (UV1).
Figure 13.
Cracks identified in samples (a) HTC and (b) UV1. The white dotted line indicates the interface between the scarf and the repair, and the red arrows indicate cracks.
Figure 13.
Cracks identified in samples (a) HTC and (b) UV1. The white dotted line indicates the interface between the scarf and the repair, and the red arrows indicate cracks.
Table 1.
Evaluations of efforts of different repair technologies made by technician team.
Table 1.
Evaluations of efforts of different repair technologies made by technician team.
| Technology | Time for Repair | Time/Cost for Training | Materials Costs | Temperature of Curing |
|---|
| High-temperature thermal curing (HTC) | 165 | 1 day training | | 120 degrees |
| Ultraviolet repair, handheld (UV1) | 120 | 1 day training | €40,000 | UV light |
| Hand layup lamination (HL) | 330 | 1 day training | €20,000 | 80 degrees |
| Vacuum repair with hand layup (V1) | 615 | 2 days training | €30,000 | 80 degrees |
| Vacuum repair with infusion (V2) | 375 | 2 days training | €30,000 | 80 degrees |
Table 2.
Overview: Temperatures and duration of curing.
Table 2.
Overview: Temperatures and duration of curing.
| Technology | Apply Vacuum, Minutes | Heating Blanket, Minutes | UV Light | Total in Min | Grinding—Measure Patch—Cut Reinforcement | Laminate |
|---|
| Ultraviolet repair (UV2) | 60 | | | | | |
| High-temperature thermal curing (HTC) | 60 | 30 | 45 | 30 | | 165 |
| Ultraviolet repair, handheld (UV1) | 60 | 30 | | | 30 | 120 |
| Hand layup lamination (HL) | 60 | 30 | | 240 | | 330 |
| Vacuum repair with hand layup (V1) | 60 | 30 | 45 | 480 | | 615 |
| Vacuum repair with infusion (V2) | 60 | 30 | 45 | 240 | | 375 |
Table 3.
Adhesives, laminates, and resins used.
Table 3.
Adhesives, laminates, and resins used.
| | How Is It Cured | Adhesive Used | Laminate Used | Amount of Repair Product Used |
|---|
| Ultraviolet repair, handheld (UV1) | Heat Blanket 80 degrees, 4 h | Vinyl Ester Epoxy Resin | Number of layers: 3. Size of layers xy 20 × 20–30 × 30–40 × 40 | 200 mL resin and 200 g glass fiber |
| Hand layup lamination (HL) | Heat blanket 4 h | SIKA Sikadur 30 | Number of layers 3. Size of layers xy 20 × 20–30 × 30–40 × 40.
Type of GF: Biax 600 | 300 mL mixing bag and 200 g glass fiber. |
| Vacuum repair with hand layup (V1) | Heat blanket, 4 h | Gurrit Ampreg 31 | Number of layers: 3. Size of layers xy 20 × 20–30 × 30–40 × 40.
Type of GF: Biax 600 | 200 mL and 200 g glass fiber |
| Vacuum repair with infusion (V2) | Heat blanket, 4 h | Bodotex 900 | Number of layers: 3. Size of layers xy 20 × 20–30 × 30–40 × 40. Type of GF: Biax 600 | Used 200 mL.
1 kg repair kit or mix by weight and 200 g glass fiber |
| High-temperature thermal curing (HTC) | Heat blanket, 28 min | - | Number of layers: 4
Size of layers: 20 × 20–27 × 27–33 × 33–40 × 40
Type of GF: Biax 450 | 200 g glass fiber |
Table 4.
Mechanical properties of repaired samples.
Table 4.
Mechanical properties of repaired samples.
| Technology | E-Modulus
[GPa] | Max Stress
[MPa] | Linear Strain
[%] | Uniform Strain
[%] |
|---|
| Reference plate (non-repaired) | 0.74 | 1.10 | | 0.76 |
| Vacuum repair with infusion (V2) | | | | |
| Vacuum repair with hand layup (V1) | | | | |
| Hand layup lamination (HL) | | | | |
| Ultraviolet repair, handheld (UVh1) | | | | 4 |
| High-temperature curing (HTC) | 6 | | | |
| Ultraviolet repair (UV2 (stationary)) | | | | |
| Publisher’s Note: MDPI stays neutral with regard to jurisdictional claims in published maps and institutional affiliations. |
© 2022 by the authors. Licensee MDPI, Basel, Switzerland. This article is an open access article distributed under the terms and conditions of the Creative Commons Attribution (CC BY) license (https://creativecommons.org/licenses/by/4.0/).


 ,
, 


