Article

Research on Straw-Based High-Quality Energy in China under the Background of Carbon Neutrality

1
School of Economics and Management, Beijing University of Chemical Technology, 15 East Road of North Third Ring, Beijing 100029, China
2
School of Economics and Management, Beijing University of Technology, Beijing 100124, China
*
Author to whom correspondence should be addressed.
Energies 2022, 15(5), 1724; https://doi.org/10.3390/en15051724
Submission received: 6 January 2022 / Revised: 16 February 2022 / Accepted: 22 February 2022 / Published: 25 February 2022
(This article belongs to the Special Issue New Insights into Energy Economics and Sustainable Development)

Abstract

:
It is imperative to use clean energy in order to achieve “carbon neutrality” and “carbon peaking”. This research aims to explore the impact of the agricultural mechanization level, the rural infrastructure construction level, and the rural economic development level on the utilization of high-quality straw energy, and, resultingly, this study aims to help provide suggestions for promoting high-quality straw energy utilization, develop the potential of high-quality straw energy, and alleviate China’s energy shortage problem. This paper develops a measurement model using the ridge regression model with panel fixed effects, which overcomes the multi-collinearity problem among the various factors influencing the utilization of high-quality energy from straw. Panel data from 24 provinces and cities, from 2009 to 2017, are used. The results show that the improvements of the agricultural mechanization level, the rural infrastructure construction level, and the rural economic development level all promote the use of high-quality straw energy. Moreover, the level of rural economic development plays a mediating role in the agricultural mechanization level and the rural infrastructure construction level pertaining to straw-based high-quality energy. Policy implications can be easy to derive based on our findings, and these include strengthening governmental investment in agricultural machinery in rural areas, paying more attention to areas with backward rural energy infrastructure construction, ensuring the steady improvement of economic development in rural areas, providing the necessary economic foundation for agricultural supply, and promoting the use of high-quality energy from straw.

1. Introduction

“Carbon neutrality” and “carbon peaking” have become hot topics in recent years. China is actively formulating an action plan for peaking carbon emissions by 2030, while optimizing its industrial structure and energy structure, and striving to achieve carbon neutrality by 2060 [1]. In this context, the carbon emissions caused by fossil energy consumption cannot be ignored, and it is imperative to seek the utilization of clean energy. The utilization of Biomass as a renewable feedstock for the production of biofuels has been attracting researchers and industrial attention in recent years [2]. Alongside the continuous progress of science and technology, the utilization of straw as a biomass energy has gradually garnered more and more attention. Straw is a renewable biological resource with multiple uses. Straw-based high-quality energy can be divided into these categories: straw pyrolysis gasification centralized gas supply, straw biogas centralized gas supply, straw solidification molding, and straw carbonization [3]. In-depth study of straw-based high-quality energy is of strategic significance in order to alleviate energy shortages [4]. Considering the energy crisis and the carbon emissions reduction target, the utilization of high-quality straw energy is an inevitable choice, as it is a necessary measure for environmental protection, an important means to solve the problems of agriculture (rural areas and farmers), and a feasible strategy to achieve “carbon neutrality”.
Research on straw has developed rapidly since the beginning of the 20th century. The research mainly focuses on the measurement of straw resources, the harm of straw burning [5], the comprehensive utilization of straw [6,7,8], the distribution of straw resources [9], and the utilization of straw based on the behavior of farmers [10,11,12,13].In summation, there are numerous problems which remain unsolved in the existing studies. Firstly, the existing research methods are relatively simple. Most empirical studies use survey data to answer the questions of straw “burning” or “not burning”, and this same limited process applies to straw utilization. Are there more macroscopic data, and more scientific methods, to explore the comprehensive utilization of straw? These studies do not answer these questions. Secondly, few existing studies focus on the quantitative analysis of the optimal utilization of straw energy; there is a failure to answer the influencing factors, and this is not conducive to further exploration of optimal straw energy utilization. In view of this, this paper studies the factors affecting straw-based high-quality energy, in depth, in order to promote the utilization of straw and make a contribution to carbon neutrality.
The higher the degree of agricultural mechanization in rural areas, the greater potential for recycling straw for further utilization. The allocation of agricultural science and technology resources is an important factor in order to promote the adjustment of China’s agricultural structure, enhance the competitiveness of agriculture, and realize agricultural growth and sustainable development [4]. Improving the utilization efficiency of agricultural machinery is an important process to promote the development of agricultural economy [14]. The rational use of machinery can both improve the productivity of agricultural labor and free the rural labor force to engage in other production activities [15]. Farmers will choose a more environmentally friendly way to dispose of straw, and therefore, the higher the level of agricultural machinery utilization, the better the effect of straw-based high-quality energy.
The development level of rural energy infrastructure determines the quantity and quality of energy supply. The better the development of rural energy infrastructure, the easier it is to promote straw-based high-quality energy [16]. Strengthening the construction of energy infrastructure is of great significance to alleviating energy poverty. Energy infrastructure is positively correlated with the energy development index [17]. When the level of rural energy infrastructure is represented by rural power supply, the greater the power supply, and the greater the convenience for rural residents to use electricity. Further improving rural power infrastructure construction is conducive to promoting clean energy utilization [18], and the agricultural production efficiency increases with the increase of rural per capita electricity consumption [19].
The higher the level of economic development in rural areas, the more likely farmers are to use clean energy [20]. When studying the influencing factors of rural energy consumption in karst areas, scholars found that the annual net income of the region has a significant positive impact on the consumption of electricity and straw energy [21]. As per capita household income increases, the proportion of non-commercial energy consumption declines [22]. Improving farmers’ income levels can enhance these farmers’ ability to pay for modern energy services, which can facilitate farmers’ access to modern energy equipment, and promote the utilization of high-quality straw energy [23,24].
The novelty of this paper is summarized in the following three points: firstly, straw-based high-quality energy is placed under the background of carbon neutrality, and the factors affecting the straw-based high-quality energy are explored to promote the development of China’s circular economy in order to solve China’s energy dilemma; secondly, this paper adopts the panel fixed effect ridge regression estimation method, which overcomes the serious multicollinearity problem between various factors, and, resultingly, although part of the accuracy is abandoned, a more realistic regression process can be obtained; thirdly, in the aspect of model construction, the level of rural economic development is taken into account, as a mediator variable, in order to clarify the mechanism of the rural mechanization level and the rural infrastructure construction level pertaining to high-quality straw energy utilization.
This paper is arranged as follows: Section 1 contains the introduction and a review of the literature; Section 2 presents the materials and methods; Section 3 presents the results and discussion, and, finally, Section 4 presents conclusions, policy implications, limitations, and future scope.

2. Materials and Methods

2.1. Variable Definitions

Considering the availability of data, the data exclude the Hong Kong, Macao, and Taiwan regions. This paper also considers each city’s agricultural proportion, and the problems pertaining to crop planting structure. The sample was derived from Shanghai, Fujian, Hainan, Tibet, Shaanxi, Qinghai, and Xinjiang. The statistical yearbook did not start publishing the data pertaining to optimal straw energy utilization until 2009, and, as a result, the final research of this paper includes 24 provincial administrative regions. The sample data are balanced panel data from 2009 to 2017, and the sample observation values include 216 data. Data are collected from the China Statistical Yearbook, China Rural Statistical Data, the China Energy Statistical Yearbook, the China Financial Yearbook, and from other statistical databases. The variables used in this article are shown in Table 1.
1.
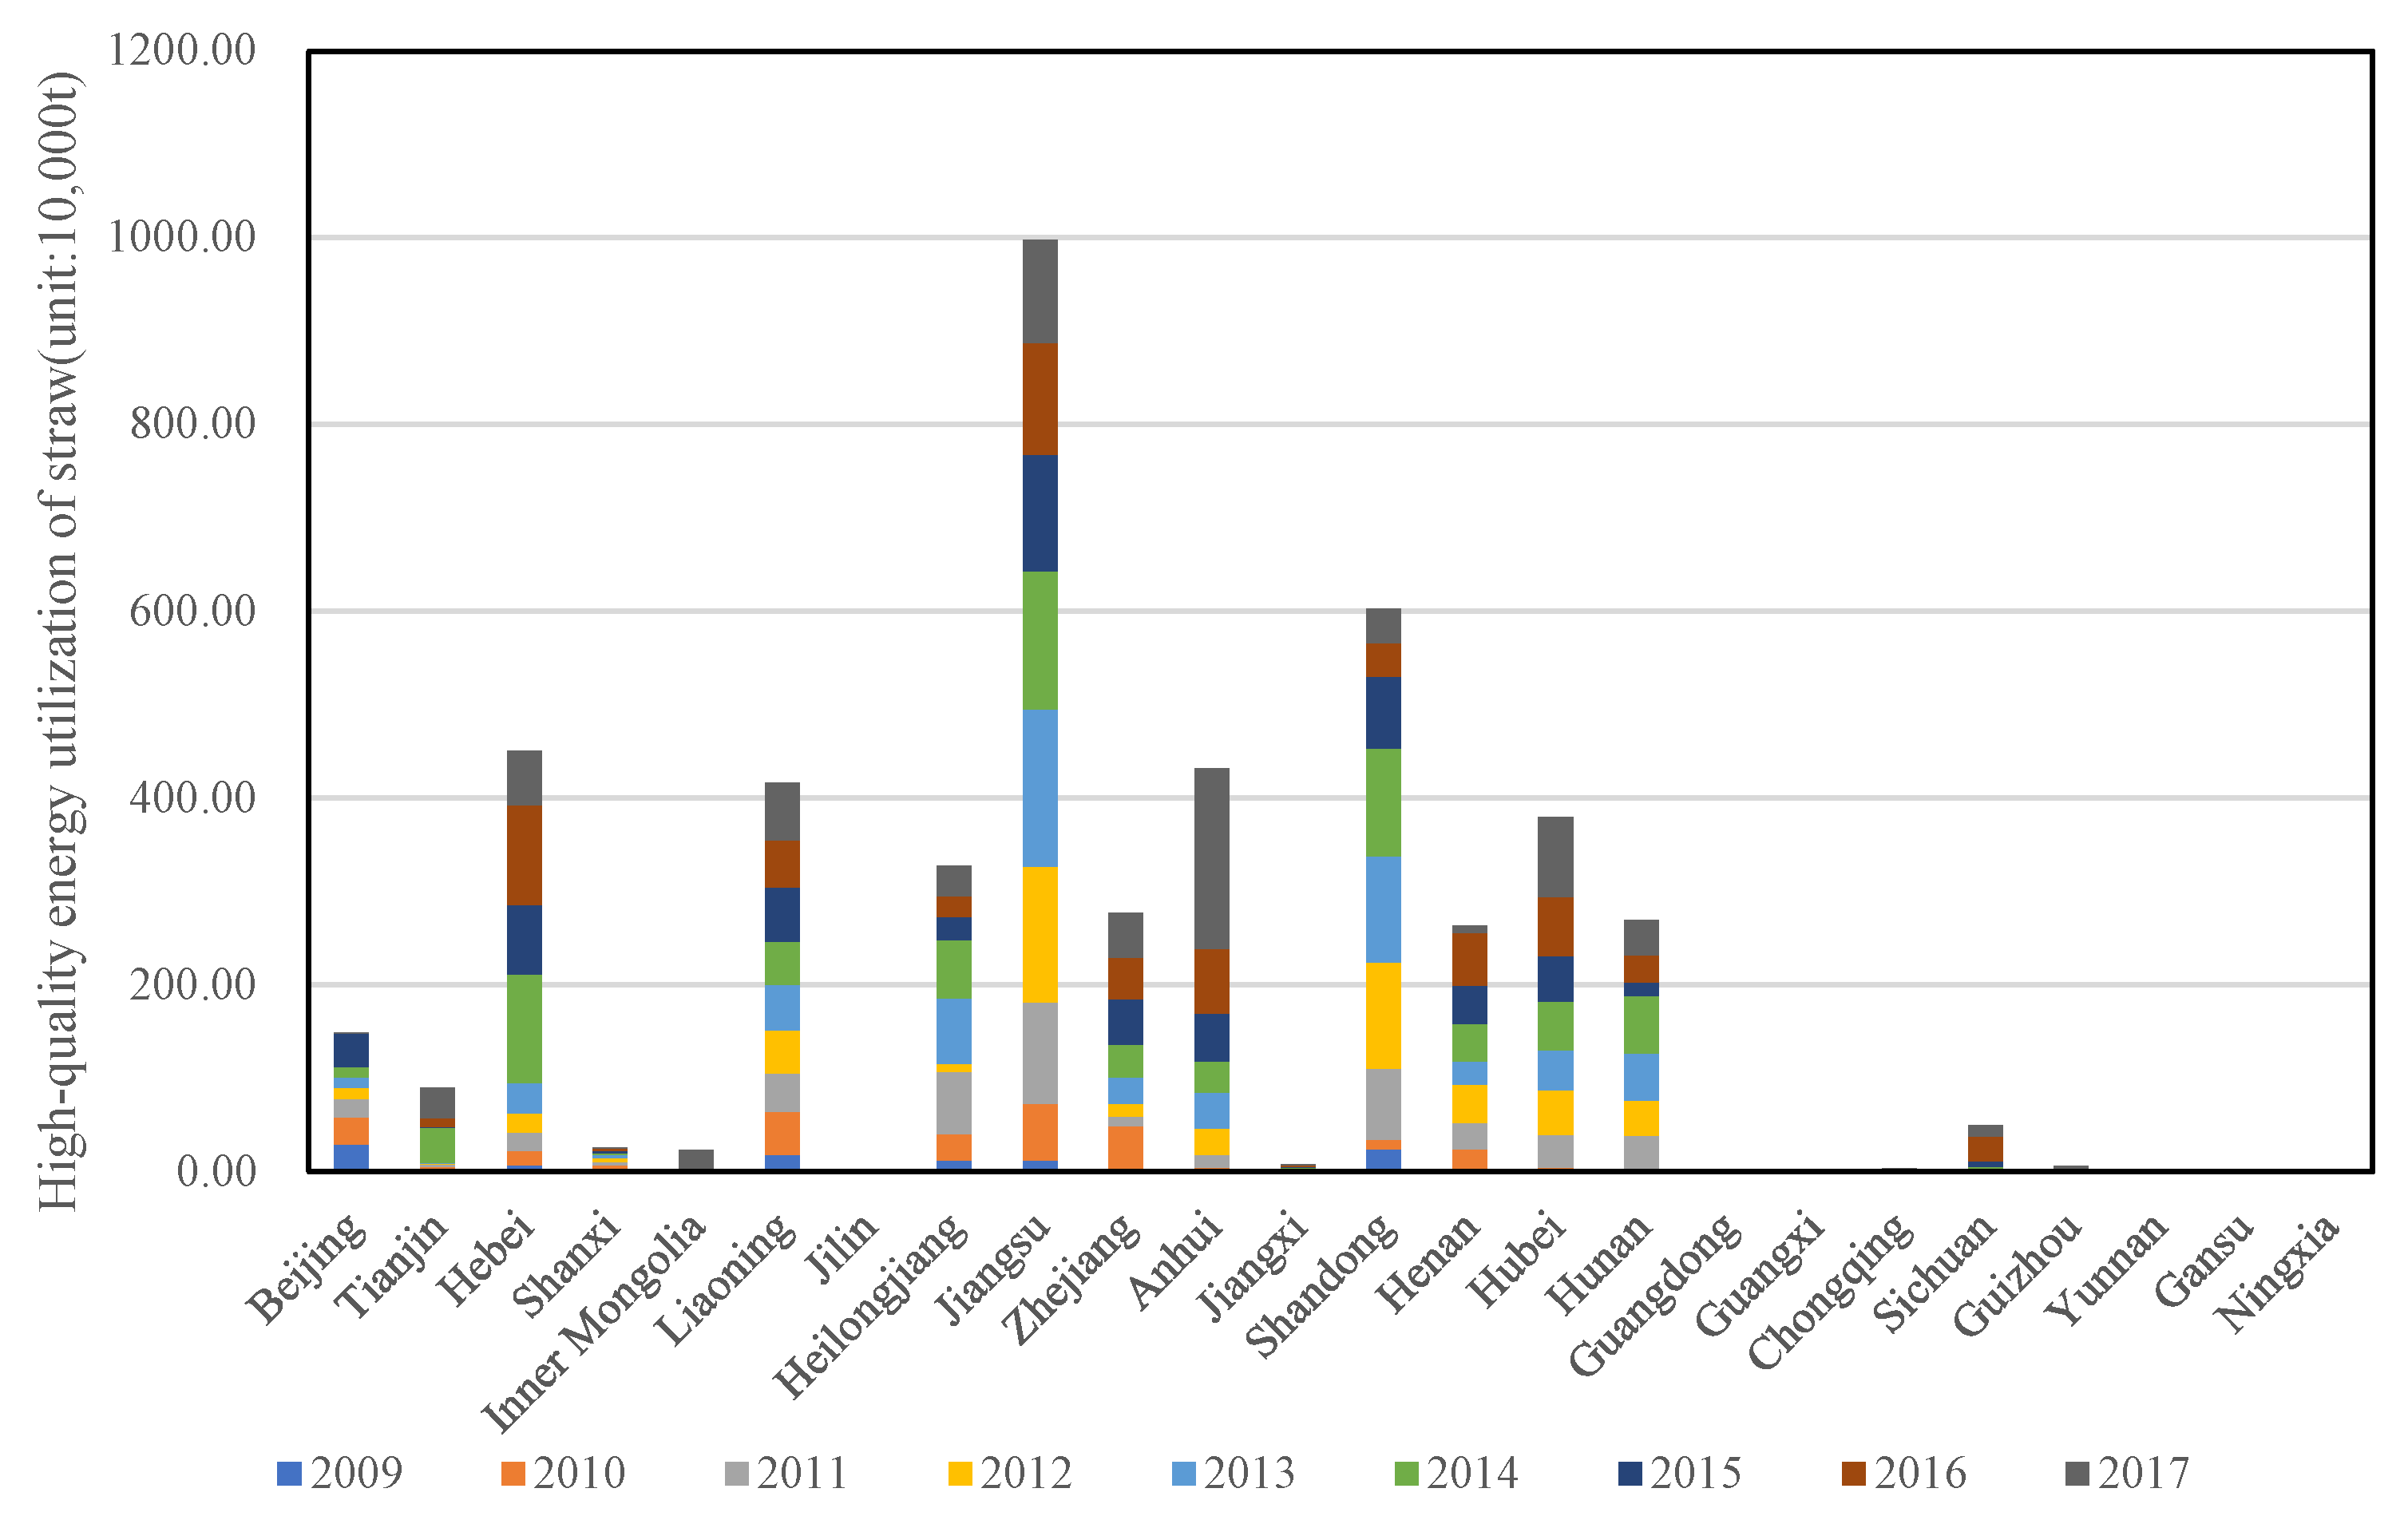
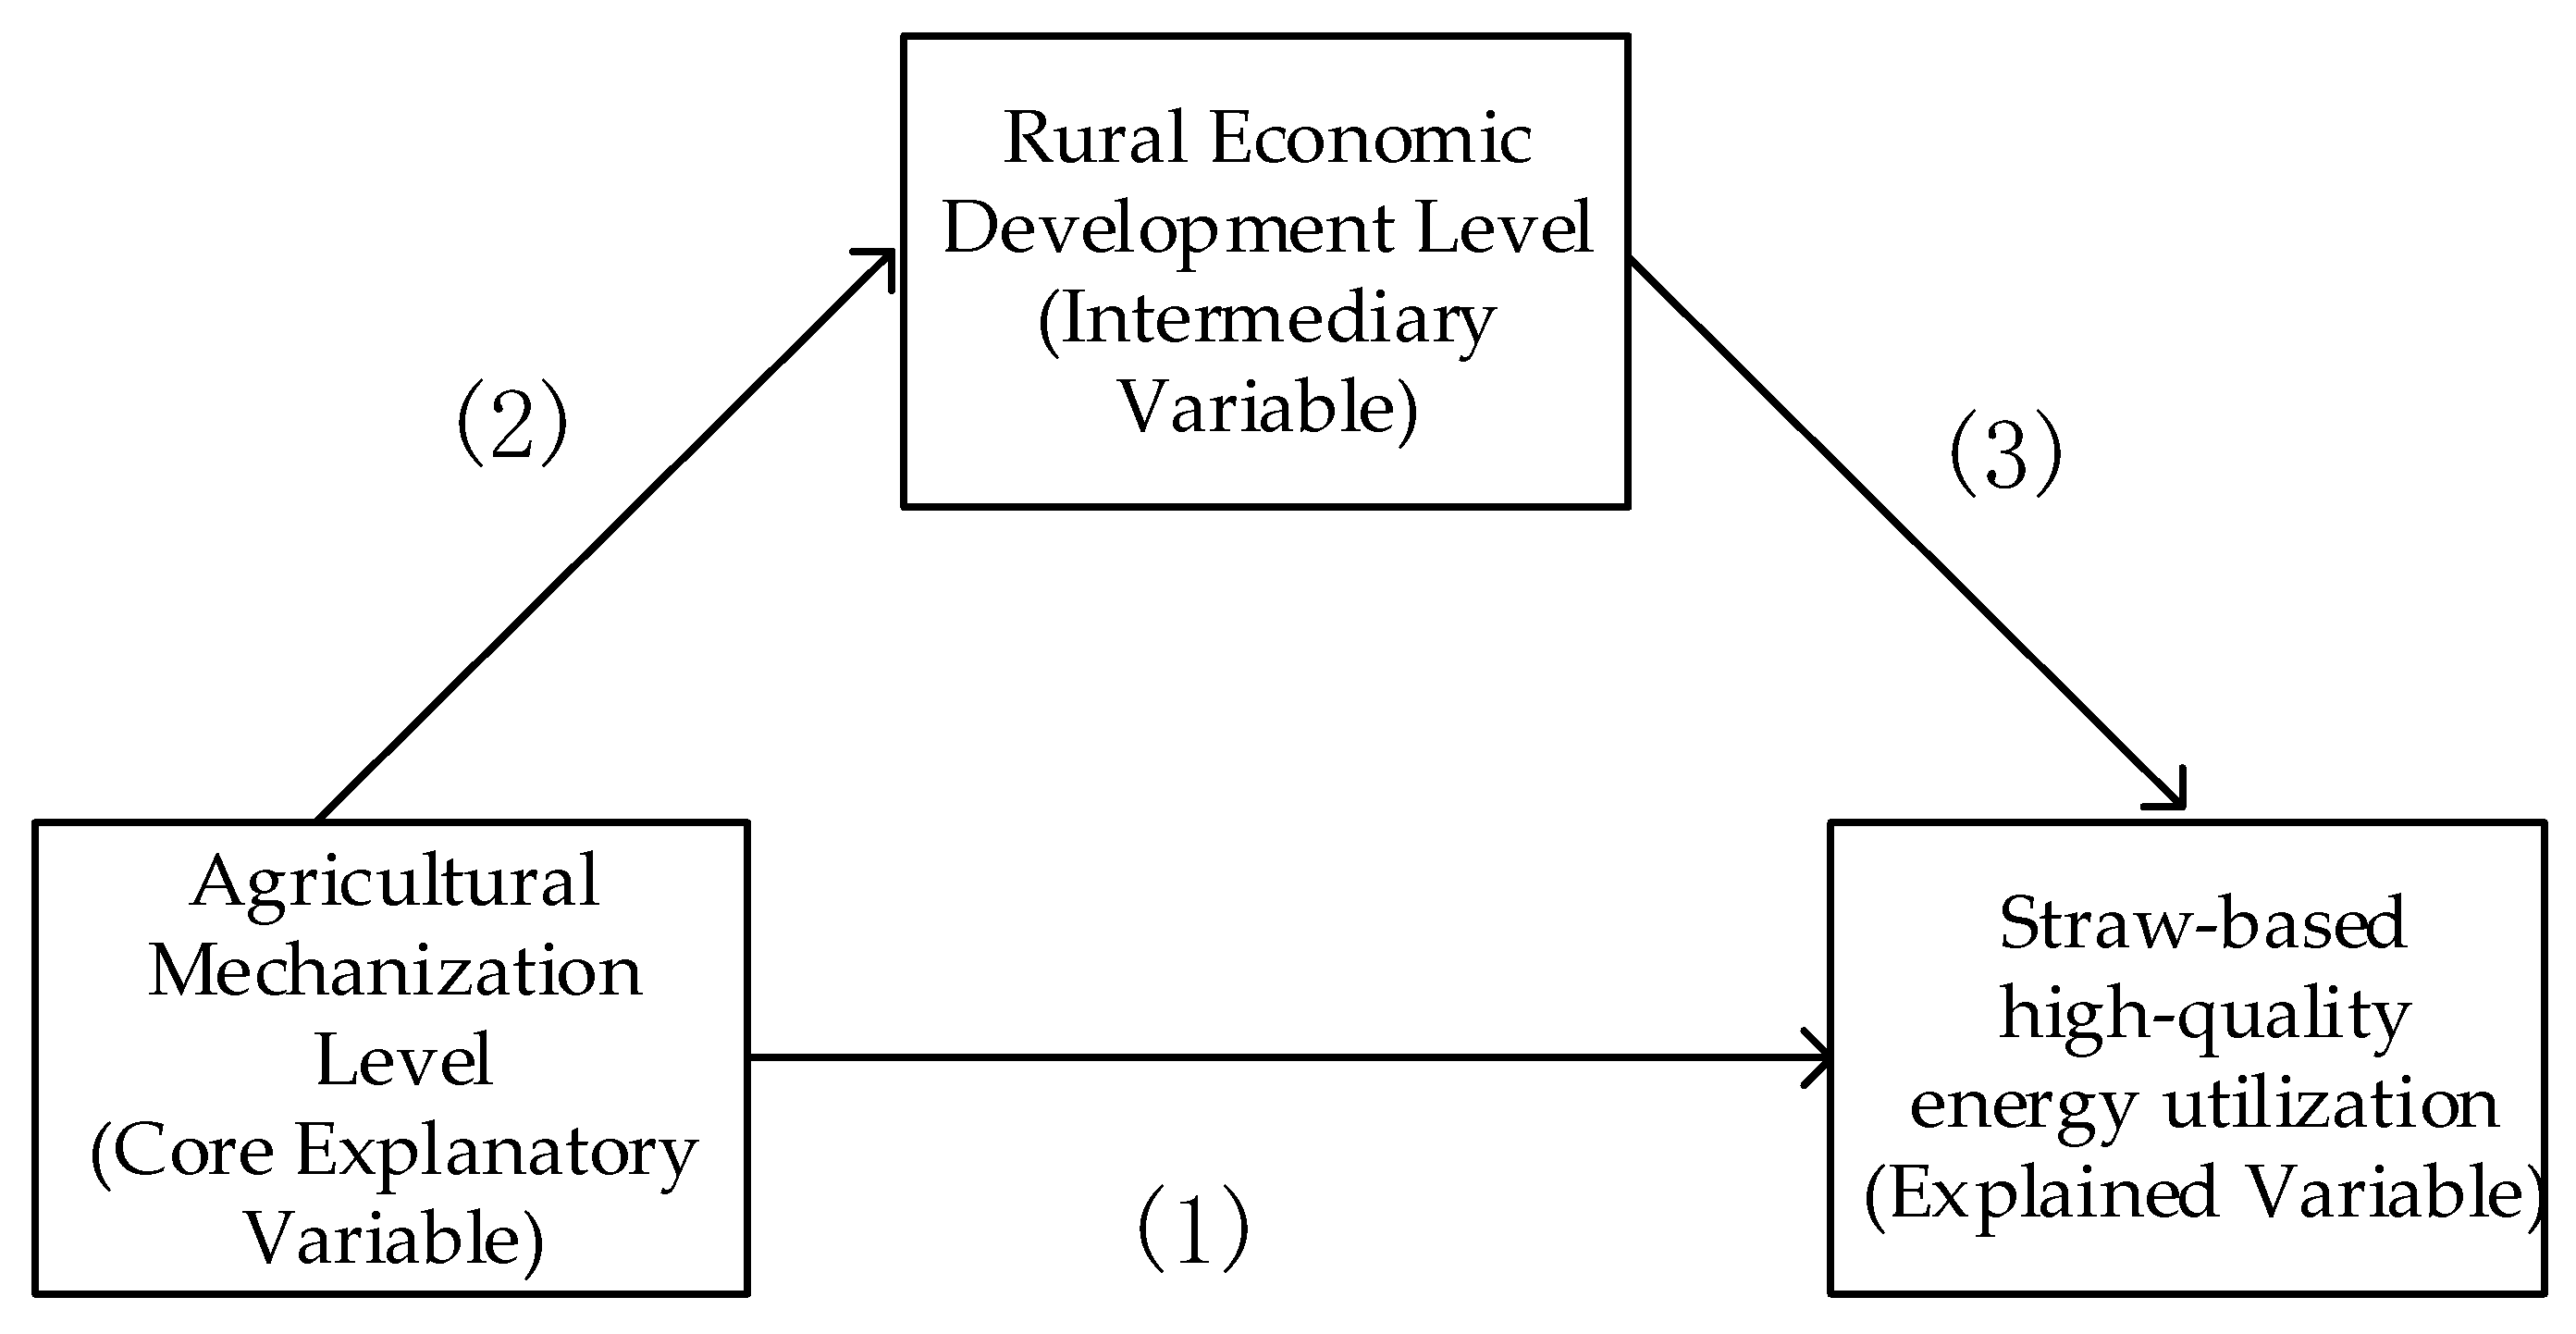
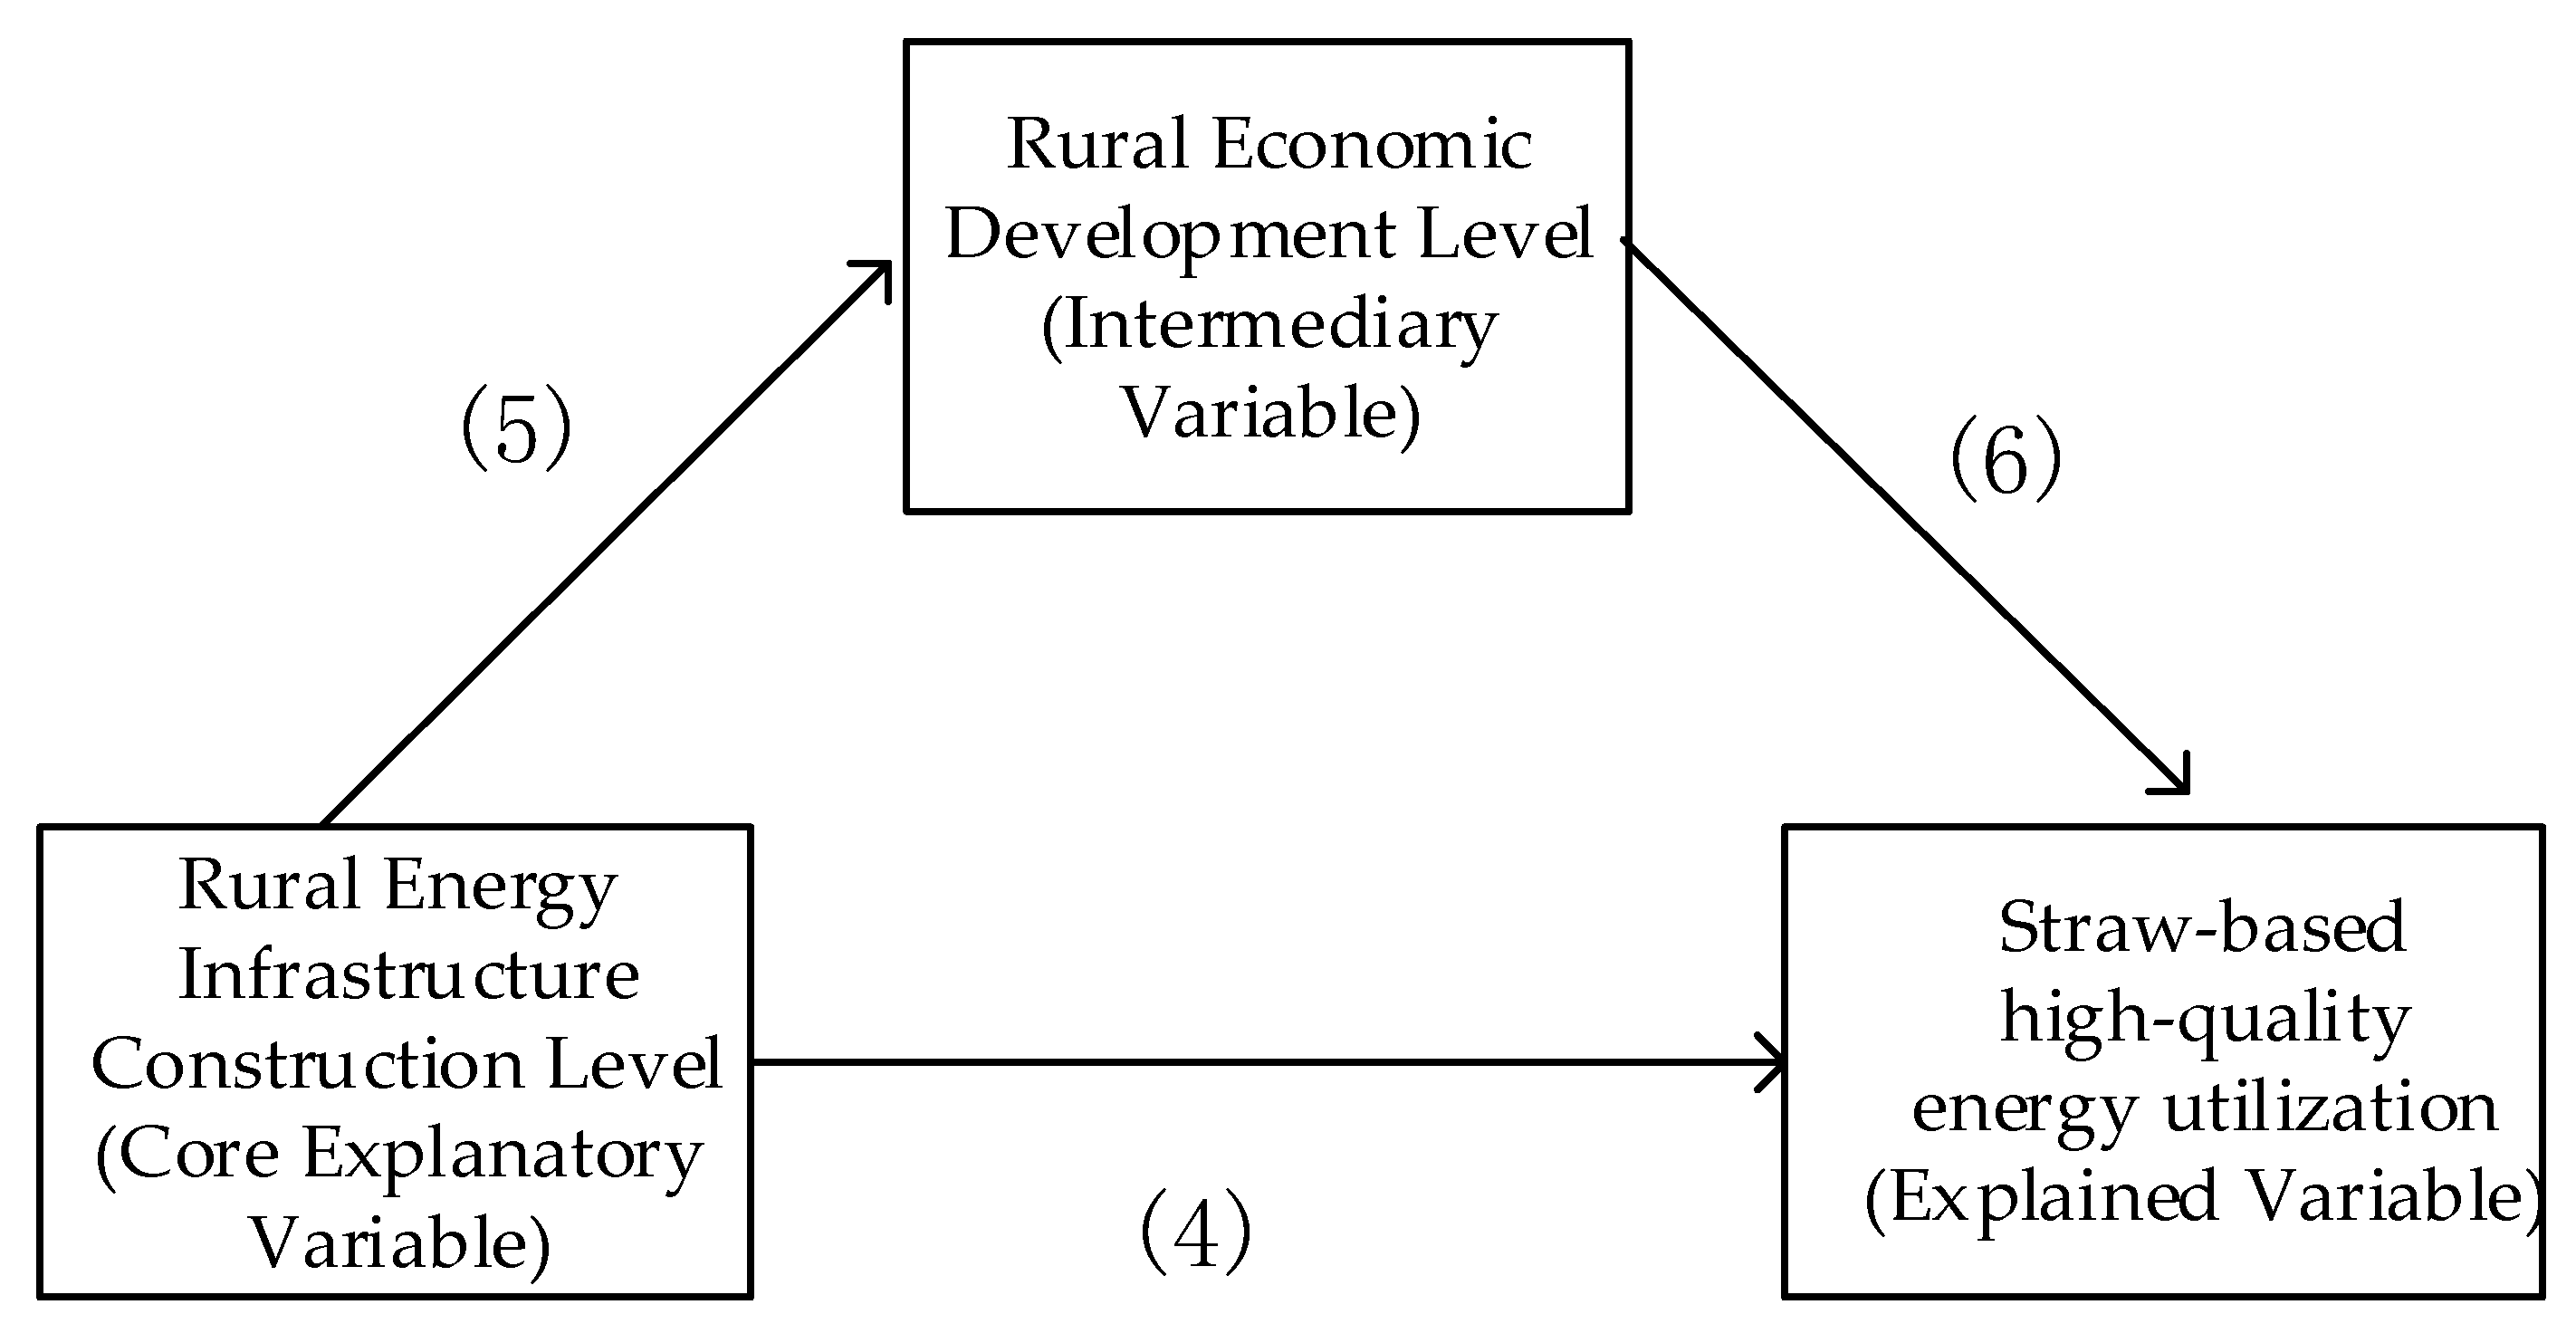
Explained variable: straw-based high-quality energy utilization.
Straw-based high-quality energy utilization includes the following: straw pyrolysis gasification centralized gas supply, straw biogas centralized gas supply, straw solidification molding, and straw carbonization. Conversion standards for gasification, solidification, and carbonization of straw [23] are shown in Table 2.
According to the preliminary data pertaining to straw gasification for centralized gas supply, straw biogas for centralized gas supply, straw solidification molding, and straw carbonization (in China Agricultural Statistics, and from the conversion criteria in the table above), the amount of excellent straw energy utilized in 24 provincial administrative units in China, from 2009 to 2017, can be calculated as Figure 1.
2.
Core explanatory variables: the agricultural mechanization level, and the rural energy infrastructure construction level.
In this paper, the total power of agricultural machinery (MACHINE) is used to represent the level of agricultural mechanization in various provinces and cities. The total power of agricultural machinery refers to the sum of the rated power of all agricultural machinery. Agricultural machinery refers to machinery and equipment used in farming, animal husbandry, fishery, primary processing of agricultural products, agricultural transportation, and farmland capital construction. Based on existing studies, this paper uses electricity to represent the construction level of rural energy infrastructure in each province.
3.
Intermediate variable: rural economic development level.
The per capita disposable income of rural households is selected to represent the level of rural economic development.
4.
Control variables.
Variables pertaining to rural population, financial education expenditure, financial agricultural expenditure, income gap between urban and rural areas, agricultural fertilizer application amount, total sown area of crops, the number of large livestock at the end of the year, and straw outputs are all selected as the control variables to measure different regions.
It should be noted that the amount of straw is calculated from the economic output of main crops according to the straw-valley ratio method [12]. Straw-valley ratio is the ratio of crop straw yield to crop yield. When straw-valley ratio and crop yield are known, straw yield can be obtained.

2.2. Empirical and Econometric Steps

The test methods pertaining to the mediating effect mainly include stepwise regression, Sobel test, and Bootstrap test, among which stepwise regression is the most widely used. The step by step test method has the highest reliability, although it has lower test power [25]. Therefore, this paper adopts the stepwise regression test in order to test whether the level of rural economic development is the intermediary variable of the agricultural mechanization level and the rural energy infrastructure construction level affecting straw optimized energy utilization. The test in this paper will be divided into the following two stages:
Stage 1: Test the mediating effect of the rural economic development level on agricultural mechanization and optimal straw energy utilization. In order to increase the stability of variables and eliminate the problem of heteroscedasticity, the 9-year data, of the 24 provinces, corresponding to all indicators except the urban-rural income gap in the model, are taken logarithms. The model is set to:
ln u t i l i z i t = α 1 + β 1 ln m a c h i n e i t + ρ 1 c o n t r o l s i t + ε 1
ln i n c o m e i t = α 2 + β 2 ln m a c h i n e i t + ρ 2 c o n t r o l s i t + ε 2
ln u t i l i z i t = α 3 + β 3 ln m a c h i n e i t + λ 3 ln i n c o m e i t + ρ 3 c o n t r o l s i t + ε 3
where, i represents province, t represents year, α represents constant term, β , ρ , and λ represent regression coefficient, and ε represents error term. The general forms and procedures are similar to those adopted by Joseph et al. [26], Gucheng et al. [27], and Hao et al. [28], who used similar control variables to assess straw-based high-quality energy. In addition to the work of these researchers, we added the mediating variable. This paper is the first analysis to apply these econometric empirical steps to straw-based high-quality energy, particularly at a macro level.
Equation (1) tests whether the level of agricultural mechanization has a significant impact on straw-based high-quality energy. Equation (2) tests whether the level of agricultural mechanization has a significant impact on the intermediate variable (the level of agricultural economic development). Equation (3) tests whether the mediating variable (the level of rural economic development) has a significant impact on straw optimized energy utilization after controlling the level of agricultural mechanization. The verification mechanism of the first stage is shown in Figure 2.
Stage 2: Test the mediating effect between the level of rural economic development and the level of rural energy infrastructure construction pertaining to straw optimized energy utilization. Where ele is rural electricity consumption.
ln u t i l i z i t = α 4 + β 4 ln e l e i t + ρ 4 c o n t r o l s i t + ε 4
ln i n c o m e i t = α 5 + β 5 ln e l e i t + ρ 5 c o n t r o l s i t + ε 5
ln u t i l i z i t = α 6 + β 6 ln e l e i t + λ 6 ln i n c o m e i t + ρ 6 c o n t r o l s i t + ε 6
Equation (4) tests whether the construction level of rural energy infrastructure has a significant impact on optimal straw energy utilization. Equation (5) tests whether the construction level of rural energy infrastructure has a significant impact on the intermediary variable (rural economic development level). Equation (6) tests whether the mediating variable (rural economic development level) has a significant impact on optimal straw energy utilization after controlling the construction level of rural energy infrastructure. The inspection mechanism of the second valence paragraph is shown in Figure 3.

3. Results and Discussion

3.1. Descriptive Statistical Analysis

Considering that the urban-rural income gap is the result of taking ratio, logarithmic processing is not carried out for the time being, and logarithms are taken for the core explanatory variables and control variables except the urban-rural income gap. The descriptive statistics of variables involved in this paper are shown in Table 3.
LLC Test and Fisher-ADF are used to test the stationarity of each variable, and it is found that each variable meets the first-order integration condition. The co-integration test of the Kao method confirms that at the significance level of 1%, there is a long-term stable relationship between the variables of the model, which could be established for regression analysis.

3.2. Colinear Diagnosis of Variables

Before empirical regression, multicollinearity test is conducted between core explanatory variables and control variables. In this paper, the variance inflation factor (VIF) is used to test multicollinearity.
The size of VIF reflects the existence of multicollinearity between independent variables. The weaker the multicollinearity between independent variables, the closer VIF is to 1. The higher the VIF is, and the smaller 1/VIF is, the more serious the impact of multicollinearity is. As there is no VIF threshold table, we use a rule of thumb. When VIF >= 10, it indicates that there is serious multicollinearity between the independent variable and the control variable, and such collinearity may unduly affect the least squares estimate. As shown in Table 4, the maximum VIF is 42.50. The VIF of ln c_area, ln straw, ln income, ln fert, ln popular, ln edu, and ln ag_expen are all greater than 10, and the average VIF is 19.87.
From the above output results, there is significant multicollinearity among various variables. As there is significant multicollinearity between core explanatory variables and control variables, this paper adopts the ridge regression analysis method for regression analysis, proposed by Hoerl and Kennard [29,30]. The ridge regression analysis method is a statistical method that fundamentally eliminates the multicollinearity effect between independent variables. This is, for all intents and purposes, an improved least square method, which seeks a more realistic regression process at the cost of giving up the unbiased nature of least squares and partial accuracy.
To illustrate the basic idea of ridge regression analysis: when there is multicollinearity of explanatory variables in the multiple linear regression model, that is, | X X | 0 , it is assumed that X X is added with a normal number matrix k I ( k > 0 , I is the identity matrix), then X X + k I is much further from the singular matrix than X X . k is the ridge parameter, reflecting the deviation degree of the ridge regression estimator. When k = 0, it is the least square estimator; When k > 0, the ridge regression coefficient is biased, but it is often more stable than the ordinary least square estimator. To obtain ridge regression equation, the value of ridge parameter k must be determined first.
In this paper, k is determined according to ridge trace map. When k is slightly away from 0, the estimated value of regression coefficient may fluctuate violently, and even change the sign of positive and negative. However, k increases further, the estimated value of the regression coefficient tends to change slowly. Since ridge regression estimation is biased, it is necessary to select a k value as small as possible to make the regression coefficient more stable.
Figure 4 is a ridge trace diagram of various factors influencing the utilization of high-quality straw energy. As shown in Figure 4, the regression coefficients of each core explanatory variable and control variable vary greatly with the increase of the ridge parameter k value. The trace method can be obtained, when the ridge parameter k is equal to 0.2, the coefficient of each variable tends to be stable, thus this article sets the optimal ridge parameter k0 to 0.2.
Panel ridge regression is divided into fixed-effect ridge regression and random-effect ridge regression [29]. The Hausman test in Table 5 indicates that the fixed effects model should be used [31].

3.3. Regression Analysis

The regression results are shown in Table 6. Models 1, 2, and 3 test the mediating effect of the rural economic development level on agricultural mechanization and straw quality energy use. Model 1 tests the influence of the agricultural mechanization level on the optimal energy utilization of straw. The regression coefficient of the total power of agricultural machinery is 0.186, which is significant at the level of 1%, indicating that the improvement of the agricultural mechanization level promotes the optimal energy utilization of straw.
The increase in the degree of agricultural mechanization in rural areas will help liberate the labor force to engage in other production activities, and more time and energy will be saved to choose other methods of straw utilization. Mechanized agricultural production methods help to extract the straw from the field. Various high-quality straw energy utilization methods are also inseparable from advanced agricultural machinery. Therefore, the improvement of the level of agricultural mechanization will help promote straw-based high-quality energy.
Model 2 tests the influence of the agricultural mechanization level on the level of rural economic development. The regression coefficient of total power of agricultural machinery is 0.00962, which is significant at the 1% level, indicating that the improvement of the agricultural mechanization level will promote the level of rural economic development.
The work efficiency of farmers has been significantly improved due to the popularization of agricultural mechanization. Farmers can use the time saved to expand their food production, or to choose other jobs that are more efficient and economical. Therefore, farmers’ income has generally increased.
Model 3 examines the mediating effect of the level of rural economic development between agricultural mechanization and high-quality straw energy utilization. The regression results show that the regression coefficient of the per capita disposable income of rural households is 0.679, and the regression coefficient of the total power of agricultural machinery is 0.179. However, the regression coefficient of the total power of agricultural machinery is smaller in Model 3 than in Model 1, indicating that the level of rural economic development serves as mediation between agricultural mechanization and high-quality straw energy utilization. The higher the household income per capita, the more capital farmers have to choose high-quality commodities, and they will be more inclined to choose clean energies that will increase well-being. Increasing income levels can enhance farmers’ ability to pay for clean energy services.
Models 4, 5, and 6 test the mediating effect of the level of rural economic development between the level of rural energy infrastructure construction and the utilization of high-quality straw energy. Specifically, Model 4 examines the impact of the rural energy infrastructure construction level on high-quality straw energy utilization. The regression coefficient of rural electricity consumption is 0.0492, and it is significant at the 1% significance level. This shows that the level of rural energy infrastructure construction can promote high-quality straw energy utilization. Energy infrastructure construction is conducive to the operation of straw pyrolysis gasification, biogasification, solidification, and carbonization. It promotes farmers to choose high-quality straw energy utilization methods.
Model 5 examines the impact of rural energy infrastructure construction on the level of rural economic development. The coefficient of rural electricity consumption is 0.0267, and it is significant at a significance level of 1%, indicating that the construction of rural energy infrastructure is conducive to the improvement of rural economic development.
Model 6 examines the mediating effect of the level of rural economic development between the level of rural energy infrastructure construction and the utilization of high-quality straw energy. The regression results show that the regression coefficient of the per capita disposable income of rural households is 0.651, and the regression coefficient of rural electricity consumption is 0.0318. The regression coefficient of rural electricity consumption is smaller in Model 6 than in Model 3, and both are significant at the 1% level. This shows that the level of rural economic development acts as part of the mediating effect between the level of rural energy infrastructure construction and the utilization of high-quality straw energy. Both the per capita disposable income of rural households in Models 3 and 6 pass the significance test, indicating that the improvement of the level of rural economic development has promoted the use of high-quality straw energy. From the perspective of supply, the increase of the rural income level will lead to accumulated funds for production and operation, and productivity will be effectively improved due to sufficient funds, which will facilitate the collection, storage, and transportation of straw, thus the straw-based high-quality energy will be improved. From the perspective of demand, the improvement of the rural economic level leads to the increase of farmers’ purchasing power. Productivity has been improved due to increased investment, and, at the same time, technology has been accumulated, while technical support for straw-based high-quality energy has been realized.

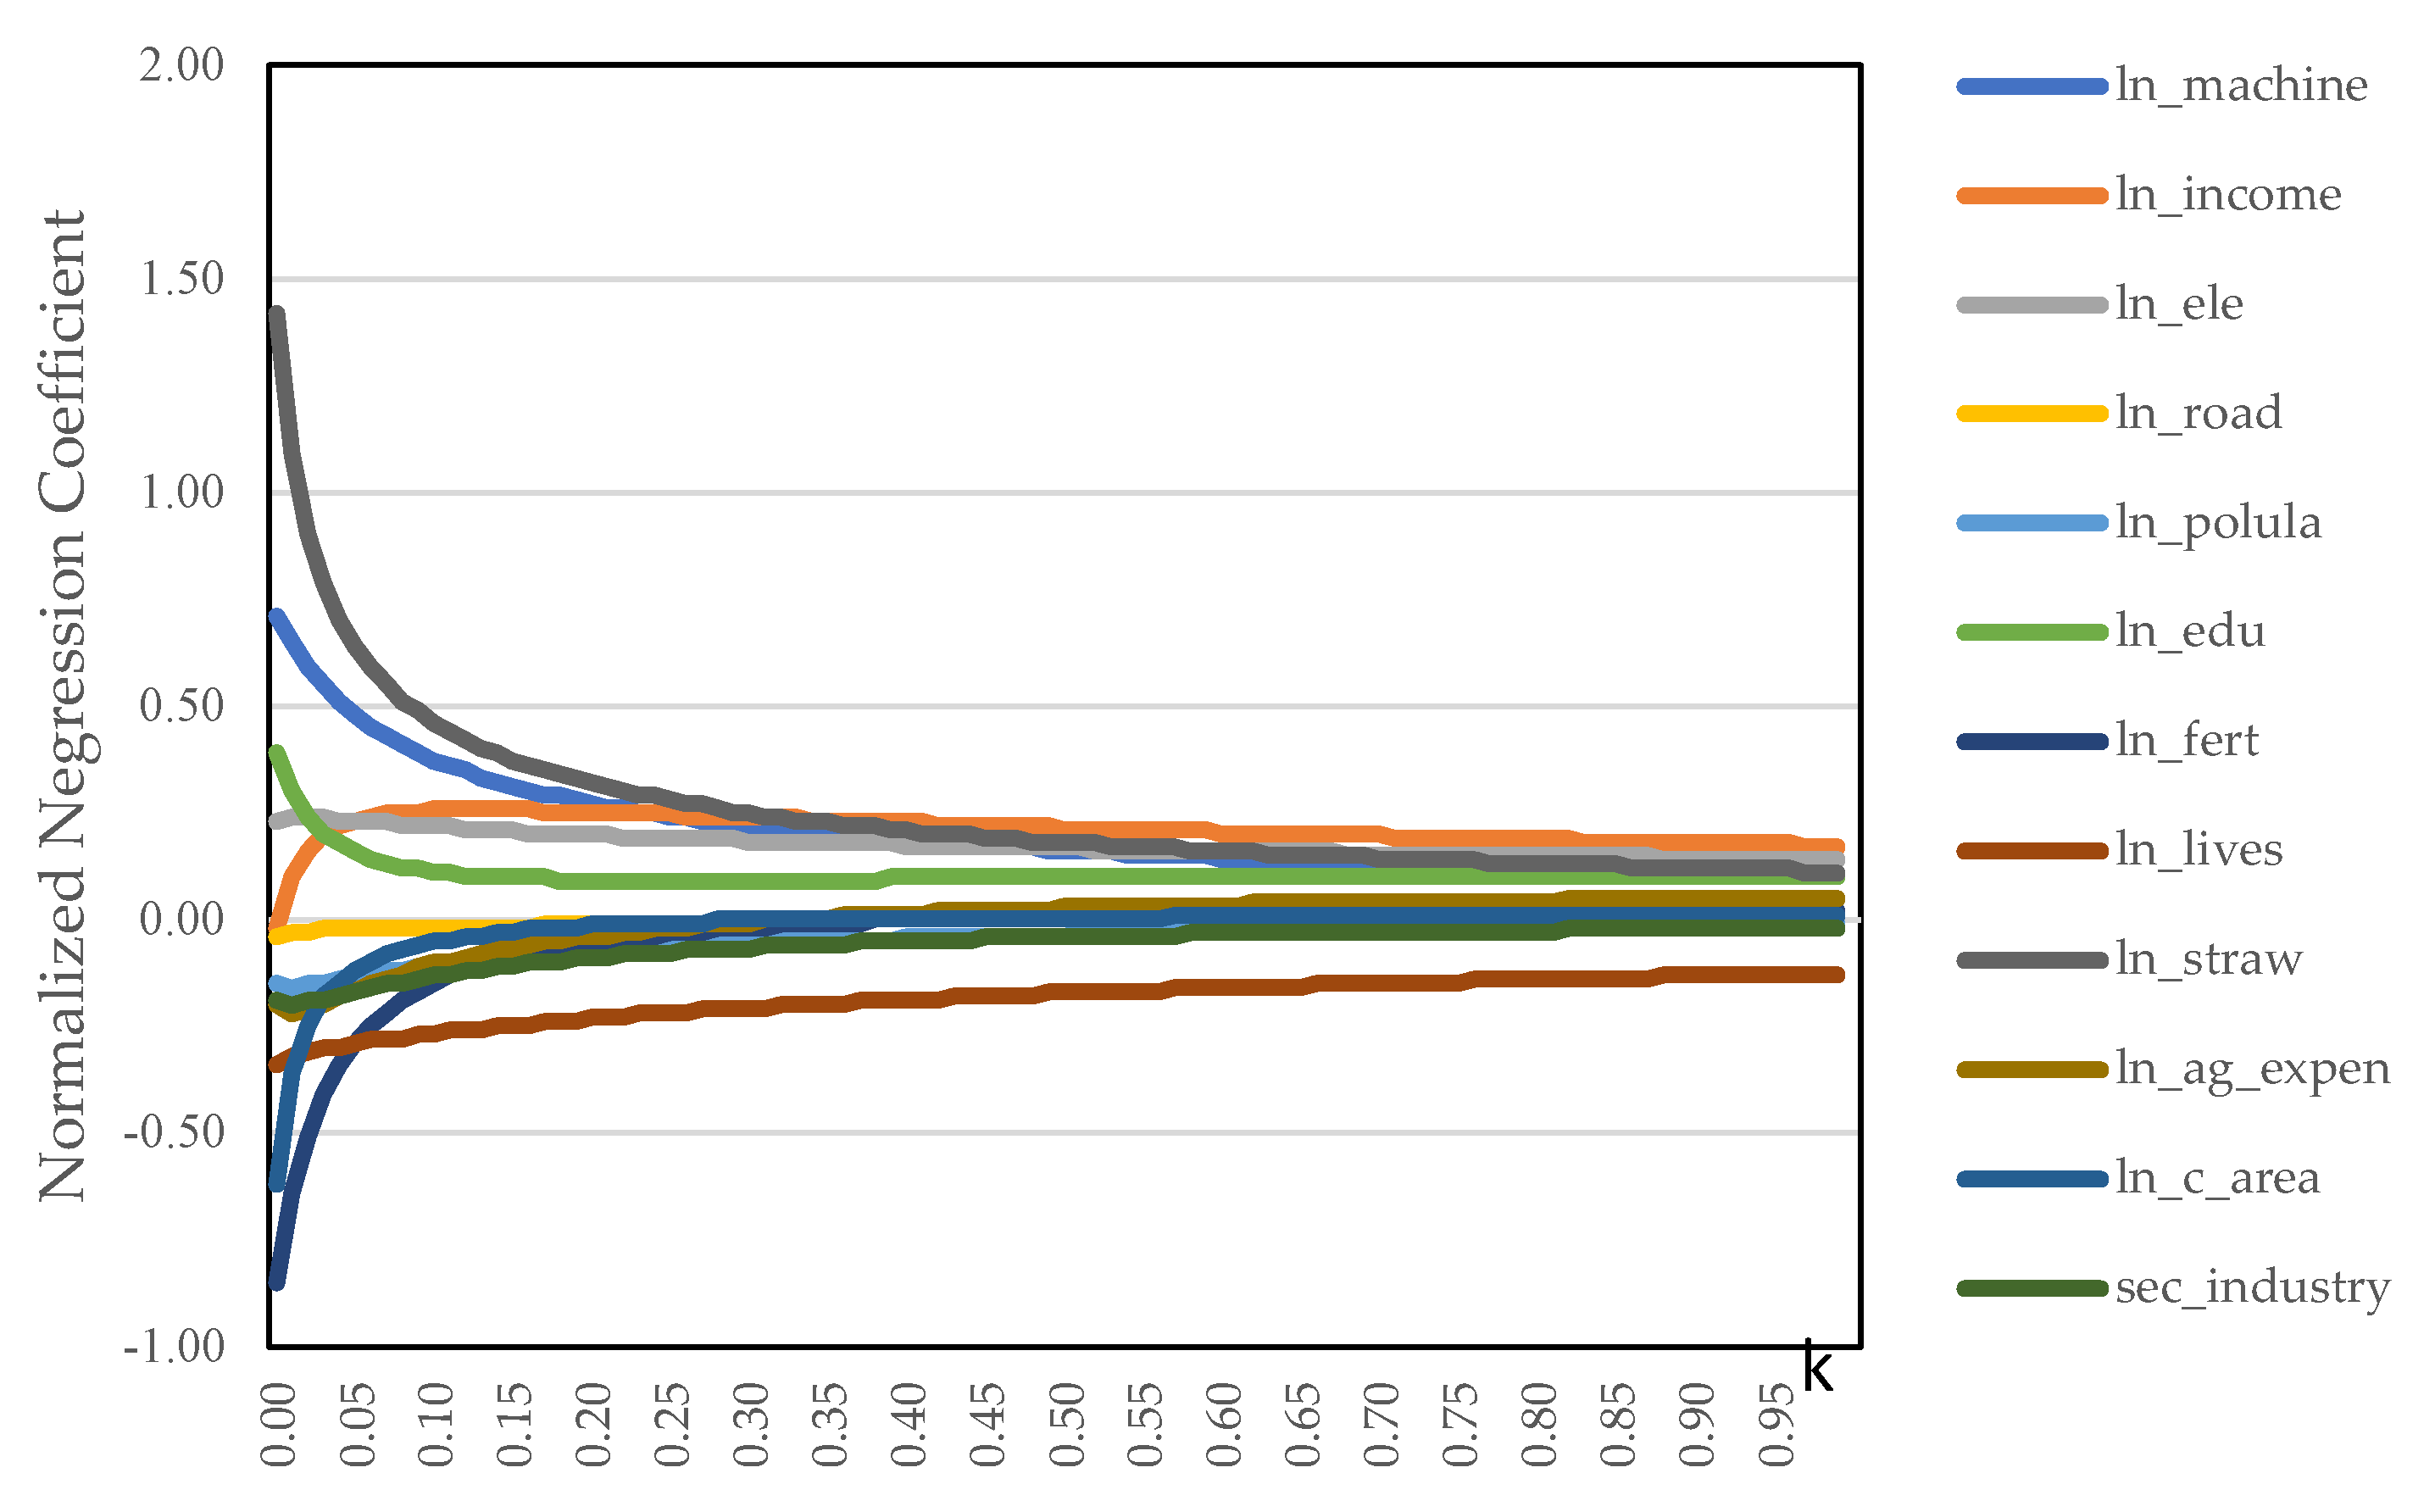
3.4. Robustness Test

In order to test the robustness of the model, the per capita disposable income of rural households is replaced by the consumption level of rural residents (Consumption) to measure the level of economic development in rural areas. Re-estimating Models 1–6 gives the results as shown in Table 7.
Comparing the regression results in Table 6 and Table 7, it is found that the coefficients and significance of the core explanatory variables change very little, and the signs of the coefficients of the control variables are approximately consistent with the benchmark model, which shows that the model established in this paper has good robustness.

4. Conclusions and Policy Implications

Using the 2009–2017 provincial panel data of 24 provinces and cities in China, this paper empirically analyzes the relationship between the agricultural mechanization level, the rural energy infrastructure construction level, the rural economic development level, and straw-based high-quality energy by using the fixed-effect ridge regression method. It is expected to promote the utilization of high-quality straw energy, reduce the frequency of straw burning, reduce air pollution, increase the proportion of renewable energy, and help accomplish the goal of “carbon neutrality”. The results are detailed herein.
Firstly, the improvement of the agricultural mechanization level helps to promote excellent straw energy utilization. Rational use of agricultural machinery can help to utilize straw for environmentally friendly recycling. The improvement of agricultural mechanization in rural areas helps to liberate labor to engage in other production activities, and farmers have more time and energy to choose other ways of straw utilization. The pyrolytic gasification, biogas, solidification molding, and carbonization of straw are inseparable from high-precision mechanization. The improvement of the agricultural mechanization level will promote the improvement of equipment for straw’s excellent energy utilization, and the straw’s excellent energy utilization will also be further improved.
Secondly, the improvement of energy infrastructure construction in rural areas is conducive to the optimization of straw energy utilization. In this paper, the rural energy infrastructure construction level is represented by rural electricity consumption. A potential hypothesis for this relationship emerges: in the case of sufficient electricity supply in rural areas, farmers may reduce the proportion of burning straw instead of firewood, while choosing cleaner electricity or gas. In addition, good energy infrastructure construction is conducive to the operation of straw pyrolysis and gasification, biogas, solidification and molding, and carbonization, which will further promote farmers to choose excellent energy utilization modes of straw.
Thirdly, the improvement of the rural economic development level is conducive to promoting the utilization of high-quality straw energy. This paper uses the per capita disposable income of rural households to represent the level of rural economic development. One hypothesis is: the higher the per capita income of households, the more capital farmers have to choose high-quality goods, and the more inclined they are to choose clean energy that will increase their well-being. In addition, the improvement of income levels can enhance farmers’ ability to pay for modern energy services, and it can promote farmers to choose high-quality straw energy utilization.
Fourthly, the level of rural economic development plays a partial intermediary effect between the level of agricultural mechanization and the impact of rural energy infrastructure construction on optimized straw energy utilization. Our country’s agriculture has developed rapidly in recent years,, agricultural production efficiency is rapidly increasing, and the rapid popularization of the rural power grid for the farmers’ life brings a new form of energy supply, and, at the same time, brings great convenience for farmers to receive outside information, creating a steady rise in farmers’ income, and gradually promoting the conversion of farmers’ cognition of energy utilization, thus promoting the development of high-quality straw energy utilization.
Based on the above theoretical findings, the following policy suggestions are put forward:
Firstly, the government should strengthen the investment in the rural areas of agricultural machinery, facilitating increased purchasing of agricultural machinery and tools, while providing suitable advice to farmers in the purchase of agricultural machinery. It will rationalize the configuration of farm machinery and tools for farmers’ families, with the minimum cost to achieve the largest agricultural modernization, and this will maximize and liberate the workforce while promoting the various energy uses straw.
Secondly, the government should pay more attention to areas with backward energy infrastructure construction in rural areas, formulate reasonable energy use policies according to local conditions, appropriately reduce electricity charges in areas with significant straw burning, stimulate farmers to use clean energy, reduce the straw burning rate, and guide farmers to choose high-quality straw energy use.
Thirdly, the government should strengthen financial services in rural areas to ensure the steady improvement of economic development in rural areas. The level of economic development is the material basis of agricultural development in rural areas. It is necessary to promote the healthy development of the rural economy, maintain moderate economic growth scale, provide necessary economic basis for agricultural supply, and stimulate the vitality of high-quality straw energy utilization.
This paper proposes a new possibility for the utilization of high-quality straw energy, and it anticipates the use of renewable energy in relieving energy pressures. This evidence can contribute to China’s carbon neutrality and carbon peaking goals. However, the research in this paper still has some limitations. At present, we only use data from China to conduct relevant research. In the next step, we expect to use data from around the world to test our results, and this should make a contribution to carbon emission reduction around the world.

Author Contributions

Conceptualization, J.-Q.R.; methodology, Y.-W.Y.; software, Y.-W.Y.; validation, J.-Q.R.; investigation, Y.-W.Y.; resources, J.-Q.R.; data curation, Y.-W.Y.; writing—original draft preparation, Y.-W.Y.; writing—review and editing, Y.-W.Y.; visualization, Y.-Y.C.; supervision, Y.-Y.C.; project administration, Y.-Y.C.; funding acquisition, J.-Q.R. All authors have read and agreed to the published version of the manuscript.

Funding

This paper is supported by the Fundamental Research Funds for Central Universities (Grant Nos. XK1802-5 and PT2021) and the Beijing Social Science Foundation of China (Grant Nos. 18GLB029) and the National Office for Philosophy and Social Sciences (Grant Nos. 16BGL007).

Institutional Review Board Statement

This study is not applicable for involving humans or animals.

Informed Consent Statement

Not applicable.

Data Availability Statement

The analysis data were taken from the China Statistical Yearbook, China Rural Statistical Data, the China Energy Statistical Yearbook, the China Financial Yearbook, and from other statistical databases.

Conflicts of Interest

The authors declare no conflict of interest.

References

  1. Sun, H.; Wang, E.; Li, X.; Cui, X.; Guo, J.; Dong, R. Potential biomethane production from crop residues in China: Contributions to carbon neutrality. Renew. Sustain. Energy Rev. 2021, 148, 111360. [Google Scholar] [CrossRef]
  2. Tawalbeh, M.; Rajangam, A.S.; Salameh, T.; Al-Othman, A.; Alkasrawi, M. Characterization of paper mill sludge as a renewable feedstock for sustainable hydrogen and biofuels production. Int. J. Hydrogen Energy 2021, 46, 4761–4775. [Google Scholar] [CrossRef]
  3. Ministry of Agriculture, PRC. China Agricultural Statistics 2016; China Agriculture Press: Beijing, China, 2017; p. 185. [Google Scholar]
  4. Barros, M.V.; Salvador, R.; de Francisco, A.C.; Piekarski, C.M. Mapping of research lines on circular economy practices in agriculture: From waste to energy. Renew. Sustain. Energy Rev. 2020, 131, 109958. [Google Scholar] [CrossRef]
  5. The Ministry of Agriculture and Rural Affairs of the People’s Republic of China. The First Meeting of the 13th National Committee of the CPPCC No. 3304. 2018. Available online: http://www.moa.gov.cn/gk/tzgg_1/tz/201810/t20181019_6161171.htm (accessed on 5 January 2022).
  6. Ren, J.; Yu, P.; Xu, X. Straw Utilization in China—Status and Recommendations. Sustainability 2019, 11, 1762. [Google Scholar] [CrossRef] [Green Version]
  7. Phuong, P.H.; Nghiem, T.; Thao, P.M.; Pham, C.; Thi, T.; Thanh Dien, N. Impact of rice straw open burning on local air quality in the Mekong Delta of Vietnam. Atmos. Pollut. Res. 2021, 12, 101225. [Google Scholar] [CrossRef]
  8. Liu, T.; He, G.; Lau, A.K.H. Statistical evidence on the impact of agricultural straw burning on urban air quality in China. Sci. Total Environ. 2020, 711, 134–633. [Google Scholar] [CrossRef]
  9. Sun, M.; Xu, X.; Wang, C.; Bai, Y.; Fu, C.; Zhang, L.; Fu, R.; Wang, Y. Environmental burdens of the comprehensive utilization of straw: Wheat straw utilization from a life-cycle perspective. J. Clean. Prod. 2020, 259, 120702. [Google Scholar] [CrossRef]
  10. Zheng, H.; Wang, Y.; Feng, X.; Li, S.; Leong, Y.K.; Chang, J. Renewable biohydrogen production from straw biomass—Recent advances in pretreatment/hydrolysis technologies and future development. Int. J. Hydrogen Energy 2021, in press. [Google Scholar] [CrossRef]
  11. Liu, L.; Zhang, J.; Zhang, C.; Qiu, H. Will the expansion of the scale of operation help farmers to adopt environmentally friendly production behaviors—Taking the return of straw to the field as an example. Agric. Technol. Econ. 2017, 5, 17–26. [Google Scholar]
  12. Seglah, P.A.; Wang, Y.; Wang, H.; Bi, Y.; Zhou, K.; Wang, Y.; Wang, H.; Feng, X. Crop straw utilization and field burning in Northern region of Ghana. J. Clean. Prod. 2020, 261, 121–191. [Google Scholar] [CrossRef]
  13. Zeng, Y.; Zhang, J.; He, K. Effects of conformity tendencies on households’ willingness to adopt energy utilization of crop straw: Evidence from biogas in rural China. Renew. Energy 2019, 138, 573–584. [Google Scholar] [CrossRef]
  14. Hu, Y.; Li, B.; Zhang, Z.; Wang, J. Farm size and agricultural technology progress: Evidence from China. J. Rural Stud. 2019. [Google Scholar] [CrossRef]
  15. Li, F.; Feng, S.; Lu, H.; Qu, F.; Haese, M.D. How do non-farm employment and agricultural mechanization impact on large-scale farming? A spatial panel data analysis from Jiangsu Province, China. Land Use Policy 2021, 107, 105517. [Google Scholar] [CrossRef]
  16. Jian-gong, Z.; Ting-wu, Y.; Guo-lei, Y. The paradox between farmers willingness and their behaviors of straw-return-to-field practice from the perspective of family endowment and the analysis of the moderating effects of farmers’ ecological cognition. Res. Agric. Mod. 2020, 41, 999–1010. [Google Scholar]
  17. Jiang, M.; Hu, X.; Chunga, J.; Lin, Z.; Fei, R. Does the popularization of agricultural mechanization improve energy-environment performance in China’s agricultural sector? J. Clean. Prod. 2020, 276, 124210. [Google Scholar] [CrossRef]
  18. Jin, X.; Zuo, X.; Dong, X.; Dong, Y.; Ding, H. Analysis of the policy guarantee mechanism of rural infrastructure based on deep learning. Technol. Forecast. Soc. Chang. 2021, 166, 120605. [Google Scholar] [CrossRef]
  19. Xueyan, Z.; Huanhuan, C.; Yanyan, M.A.; Zhiyu, G.; Bing, X. Spatio-temporal variation and its influencing factors of rural energy poverty in China from 2000 to 2015. Geogr. Res. 2018, 37, 1115–1126. [Google Scholar]
  20. Reidsma, P.; Bakker, M.M.; Kanellopoulos, A.; Alam, S.J.; Paas, W.; Kros, J.; de Vries, W. Sustainable agricultural development in a rural area in the Netherlands? Assessing impacts of climate and socio-economic change at farm and landscape level. Agric. Syst. 2015, 141, 160–173. [Google Scholar] [CrossRef]
  21. Qi, W.; Kangning, X.; Bin, Y.; Xingju, Z.; Wei, R. Consumption Characteristics of Rural Energies in Karst Area and their Influencing Factors. Chin. J. Agric. Resour. Reg. Plan. 2019, 40, 146–157. [Google Scholar]
  22. Liang, Y. Analysis of influencing factors of rural energy consumption structure in mountainous areas of Southwest China—A case study of Zhaotong City, Yunnan Province. J. Geogr. 2012, 2, 221–229. [Google Scholar]
  23. Clausen, L.T.; Rudolph, D. Renewable energy for sustainable rural development: Synergies and mismatches. Energ Policy 2020, 138, 111289. [Google Scholar] [CrossRef]
  24. Xuelian, W.; Junbiao, Z.; Junhui, F. Farmers’ willingness to participate in the market circulation of crop straws and its influence factors. Arid Area Resour. Environ. 2017, 31, 79–84. [Google Scholar]
  25. Fang, J.; Wang, X.; Wen, Z.; Huang, J. Cybervictimization and loneliness among Chinese college students: A moderated mediation model of rumination and online social support. Child Youth Serv. Rev. 2020, 115, 105085. [Google Scholar] [CrossRef]
  26. Phiri, J.; Malec, K.; Kapuka, A. Impact of Agriculture and Energy on CO2 Emissions in Zambia. Energies 2021, 14, 8339. [Google Scholar] [CrossRef]
  27. Li, G.; Li, Y.; Zhou, X. Agricultural Mechanization, Labor Transfer and the Growth of Farmer’s Income: A Re-examination of Causality. China’s Rural Econ. 2018, 11, 112–127. [Google Scholar]
  28. Gai, H.; Yan, T.; Zhang, J. Perceived Value, Government Regulations and Farmers’Behaviors of Continued Mechanized Operation of Straw Returning to the Field:An Analysis Based on Survey Data from 1288 Farmers in Three Provinces of Hebei, Anhui and Hubei. China’s Rural Econ. 2020, 8, 106–123. [Google Scholar]
  29. Hoerl, A.E.; Kennard, R.W. Ridge regression: Biased estimation for nonorthogonal problems. Technometrics 1970, 1, 55–67. [Google Scholar] [CrossRef]
  30. Hoerl, A.E.; Kannard, R.W.; Baldwin, K.F. Ridge regression: Some simulations. Theory Methods 1975, 2, 105–123. [Google Scholar] [CrossRef]
  31. Yrjälä, K.; Ramakrishnan, M.; Salo, E. Agricultural waste streams as resource in circular economy for biochar production towards carbon neutrality. Curr. Opin. Environ. Sci. Health 2022, 100339. [Google Scholar] [CrossRef]
Figure 1. Straw-based high-quality energy utilization in each province from 2009 to 2017.
Energies 15 01724 g001
Figure 2. The first stage inspection mechanism.
Energies 15 01724 g002
Figure 3. The second stage inspection mechanism.
Energies 15 01724 g003
Figure 4. Ridge trace diagram of panel fixed effect ridge regression.
Energies 15 01724 g004
Table 1. Variable definitions.
Variable TypesVariable NameVariable CodeVariable Declaration
Explained VariableStraw-based high-quality energy utilizationUtilizet, high-quality energy utilization of crop straw
Core Explanatory VariablesRural mechanization levelmachine10,000 kW, expressed by the total power of agricultural machinery, mainly including agricultural tractors, combine harvesters, motorized threshers and other machinery
Rural energy infrastructure construction levelele100 million kW·h, expressed in rural electricity consumption
Mediating VariableIncome level of rural residentsincomeYuan/person, per capita disposable income of rural households
Control VariableRural populationpopula10,000, rural population
Financial education expenditureedu100 million yuan, local fiscal expenditure-education expenditure
Fiscal expenditure on agricultural supportag_expen100 million yuan, local fiscal expenditure-expenditure on agriculture, forestry and water affairs
Urban-rural income gapincome_gapPer capita disposable income of urban households/per capita disposable income of rural households
Amount of agricultural fertilizerfert10,000 t, the amount of chemical fertilizers actually used in agricultural production this year, calculated by the discount method
Total sown area of cropsc_area1000 hm2, total sown area of crops
Number of large livestock stocks at the end of the yearlives10,000, large livestock, pigs, sheep, poultry and other livestock and poultry number
Straw yieldstraw10,000 t, calculated by the method of “grass-valley ratio”
Table 2. Conversion standards for gasification, curing, and carbonization of straw.
ProjectCentralized Gas Supply by Pyrolysis and Gasification of StrawStraw Methane Centralized Gas SupplyStraw
Curing Molding Fuel
Straw
Carbonization
Convert StandardAir gasification: 1 kg straw gasification gas is 2 m3, and each household needs 3 m3 of gas every dayMedium temperature fermentation, straw gas production rate 35%, biogas proportion 0.97 kg/m3, the average household needs to use 1 m3 per day1.1 t straw to produce molding fuel 1 t1 t straw to produce 0.3 t biochar
Table 3. Descriptive statistics of variables (2009–2017).
VariableObservationsMeanMedianStd. Dev.MinimumMaximum
ln utiliz21610.0210.082.8133.46614.47
ln machine2167.9308.0250.9124.8949.499
ln income2169.0869.1180.4388.00010.13
ln ele2164.9034.5801.1822.3137.543
ln popula2167.5147.7120.8235.5658.684
ln edu2166.3936.4100.6374.1517.854
ln fert2165.0625.4150.9252.1406.574
ln lives2165.5136.0821.2222.5877.010
ln ag expen2165.9776.0580.5694.1546.931
ln c area2168.4458.6850.9824.7959.609
ln straw2167.7768.0161.0594.2249.312
income gap2162.7592.6440.5071.8454.281
Table 4. Multicollinearity test among dependent variables.
VariableVIF1/VIF
ln c_area42.500.0235
ln straw33.340.0300
ln income29.870.0335
ln fert22.790.0439
ln popula20.840.0480
ln edu16.610.0602
ln ag_expen14.560.0687
Income_gap9.3700.107
ln ele4.6200.216
ln lives4.2500.235
Mean VIF19.87
Table 5. Summary of inspection results.
Test TypeTesting PurposeTest ValueTest Results
F TestFE Model or POOL Model?F (23,181) = 11.706, p = 0.000FE Model
BP TestFE Model or POOL Model?χ2(1) = 188.242, p = 0.000RE Model
Hausman TestFE Model or RE Model?χ2(11) = 21.471, p = 0.029FE Model
Table 6. Regression results of the fixed-effect ridge regression model.
VariableModel 1Model 2Model 3Model 4Model 5Model 6
ln_income 0.679 *** 0.651 ***
6.06 6.830
ln_machine0.186 ***0.00962 **0.179 ***
2.990 2.140 2.89
ln_ele 0.0492 ***0.0267 ***0.0318 ***
2.72 17.17 1.830
ln_popula−0.0893 ***−0.0277 ***−0.0705 ***−0.0728 ***−0.0238 ***−0.0573 ***
−4.740 −20.27 −4.030 −5.460 −20.71 −4.700
ln_edu0.664 ***0.242 ***0.499 ***0.582 ***0.221 ***0.438 ***
7.210 36.29 5.96 7.7 33.85 6.740
ln_fert0.0621 **0.00587 ***0.0582***0.0500 **0.00565 ***0.0464 ***
2.210 2.890 2.07 2.51 3.290 2.330
ln_lives0.0333−0.0138 ***0.04270.0197−0.0111 ***0.0269
1.100 −6.310 1.43 0.950 −6.160 1.310
ln_ag_expen0.618 ***0.325 ***0.397 ***0.580 ***0.292 ***0.389 ***
5.310 38.53 3.980 5.990 35.01 4.890
ln_c_area0.136 ***−0.001830.137 ***0.0964 ***−0.001050.0971 ***
4.480 −0.830 4.530 4.440 −0.560 4.480
income_gap−0.502 ***−0.246 ***−0.335 ***−0.477 ***−0.220 ***−0.334 ***
−3.280 −22.13 −2.300 −4.020 −21.53 −3.010
ln_straw0.153 ***0.0158 ***0.142 ***0.114 ***0.0135 ***0.105 ***
4.060 5.780 3.800 4.290 5.870 4.000
R20.98850.96570.98860.98820.95020.9883
Adj-R20.98650.95970.98650.98160.94150.9862
F11.1791300.213910.120110.9178207.09119.9763
Note: the values in brackets are t values of each statistic; *** and ** indicate passing the test at the significance level of 1%, 5%, and 10%, respectively.
Table 7. Robustness test results.
VariableModel 1Model 2Model 3Model 4Model 5Model 6
ln_consum 0.457 *** 0.471 ***
3.970 5
ln_machine0.186 ***0.00737 *0.184 ***
2.990 1.86 2.950
ln_ele 0.0492 ***0.0316 ***0.0343 **
2.72 15.04 1.970
ln_popula−0.0893 ***−0.0233 ***−0.0739 ***−0.0728 ***−0.0286 ***−0.0594 ***
−4.740 −18.52 −4.250 −5.460 −18.43 −4.890
ln_edu0.664 ***0.226 ***0.531 ***0.582 ***0.262 ***0.458 ***
7.210 26.38 6.340 7.7 29.84 7.070
ln_fert0.0621 **0.00399 **0.0609 **0.0500 **0.003530.0484 **
2.210 2.28 2.160 2.51 1.520 2.420
ln_lives0.0333−0.0100 ***0.04060.0197−0.0130 ***0.0258
1.100 −5.480 1.350 0.950 −5.350 1.250
ln_ag_expen0.618 ***0.295 ***0.440 ***0.580 ***0.346 ***0.416 ***
5.310 26.84 4.370 5.990 30.79 5.210
ln_c_area0.136 ***−0.0006890.136 ***0.0964 ***−0.0010.0969 ***
4.480 −0.360 4.490 4.440 −0.410 4.450
income_gap−0.502 ***0.0118 ***0.145 ***−0.477 ***0.0146 ***0.107 ***
−3.280 5.01 3.860 −4.020 4.720 4.050
ln_straw0.153 ***−0.196 ***−0.392 ***0.114 ***−0.222 ***−0.373 ***
4.060 −16.31 −2.570 4.290 −16.07 −3.220
R20.98850.99970.98850.98820.93100.9882
Adj-R20.98650.99960.98640.98160.91890.9861
F11.179198.921510.316610.9178151.622510.0881
Note: The values in parentheses are the t-values of each statistic; ***, **, and * indicate passing the test at the significance level of 1%, 5%, and 10%, respectively.
Publisher’s Note: MDPI stays neutral with regard to jurisdictional claims in published maps and institutional affiliations.

