1. Introduction
In recent years, with the rapid development of battery technology, electric vehicles (EVs) have demonstrated their superiority as a promising alternative to conventional gasoline cars [
1]. The advantages of EVs include less noise pollution, no fumes, and no direct greenhouse gas emissions. However, EVs also have certain drawbacks, which are mainly related to their batteries. For instance, the capacity of a battery will deteriorate overtime, which leads to high depreciation. In addition, the long charging time of a battery becomes a challenging issue compared to that of fueling gas. As a result, most people still hesitate to purchase EVs instead of driving gasoline cars.
Consequently, the EV industry has been struggling for years to develop an effective solution to minimize the inconvenience caused by the battery charging process. Fortunately, the idea of battery swapping (BS) works in confronting the above-mentioned problems [
2]. However, early attempts for BS made by some global EV manufacturers have failed, because they need to build a large number of BS stations even for a small geographical location. For example, a U.S.-based company “Better Place” pioneered this business model and began installing battery stations in 2008 in Israel; however, it quickly went bankrupt in 2013 [
3].
Another example is that of a Swedish start-up “Powerswap AB” that could successfully replace EV batteries via a robotic device within 3 min; however, it could not survive either. Even Tesla invited 200 EV owners to conduct experiments for adopting BS technology stations in early 2013 but received few responses. Due to the high investments required to establish the BS infrastructure, EV users are often forced to drive long distances to swap their batteries and have bad experiences.
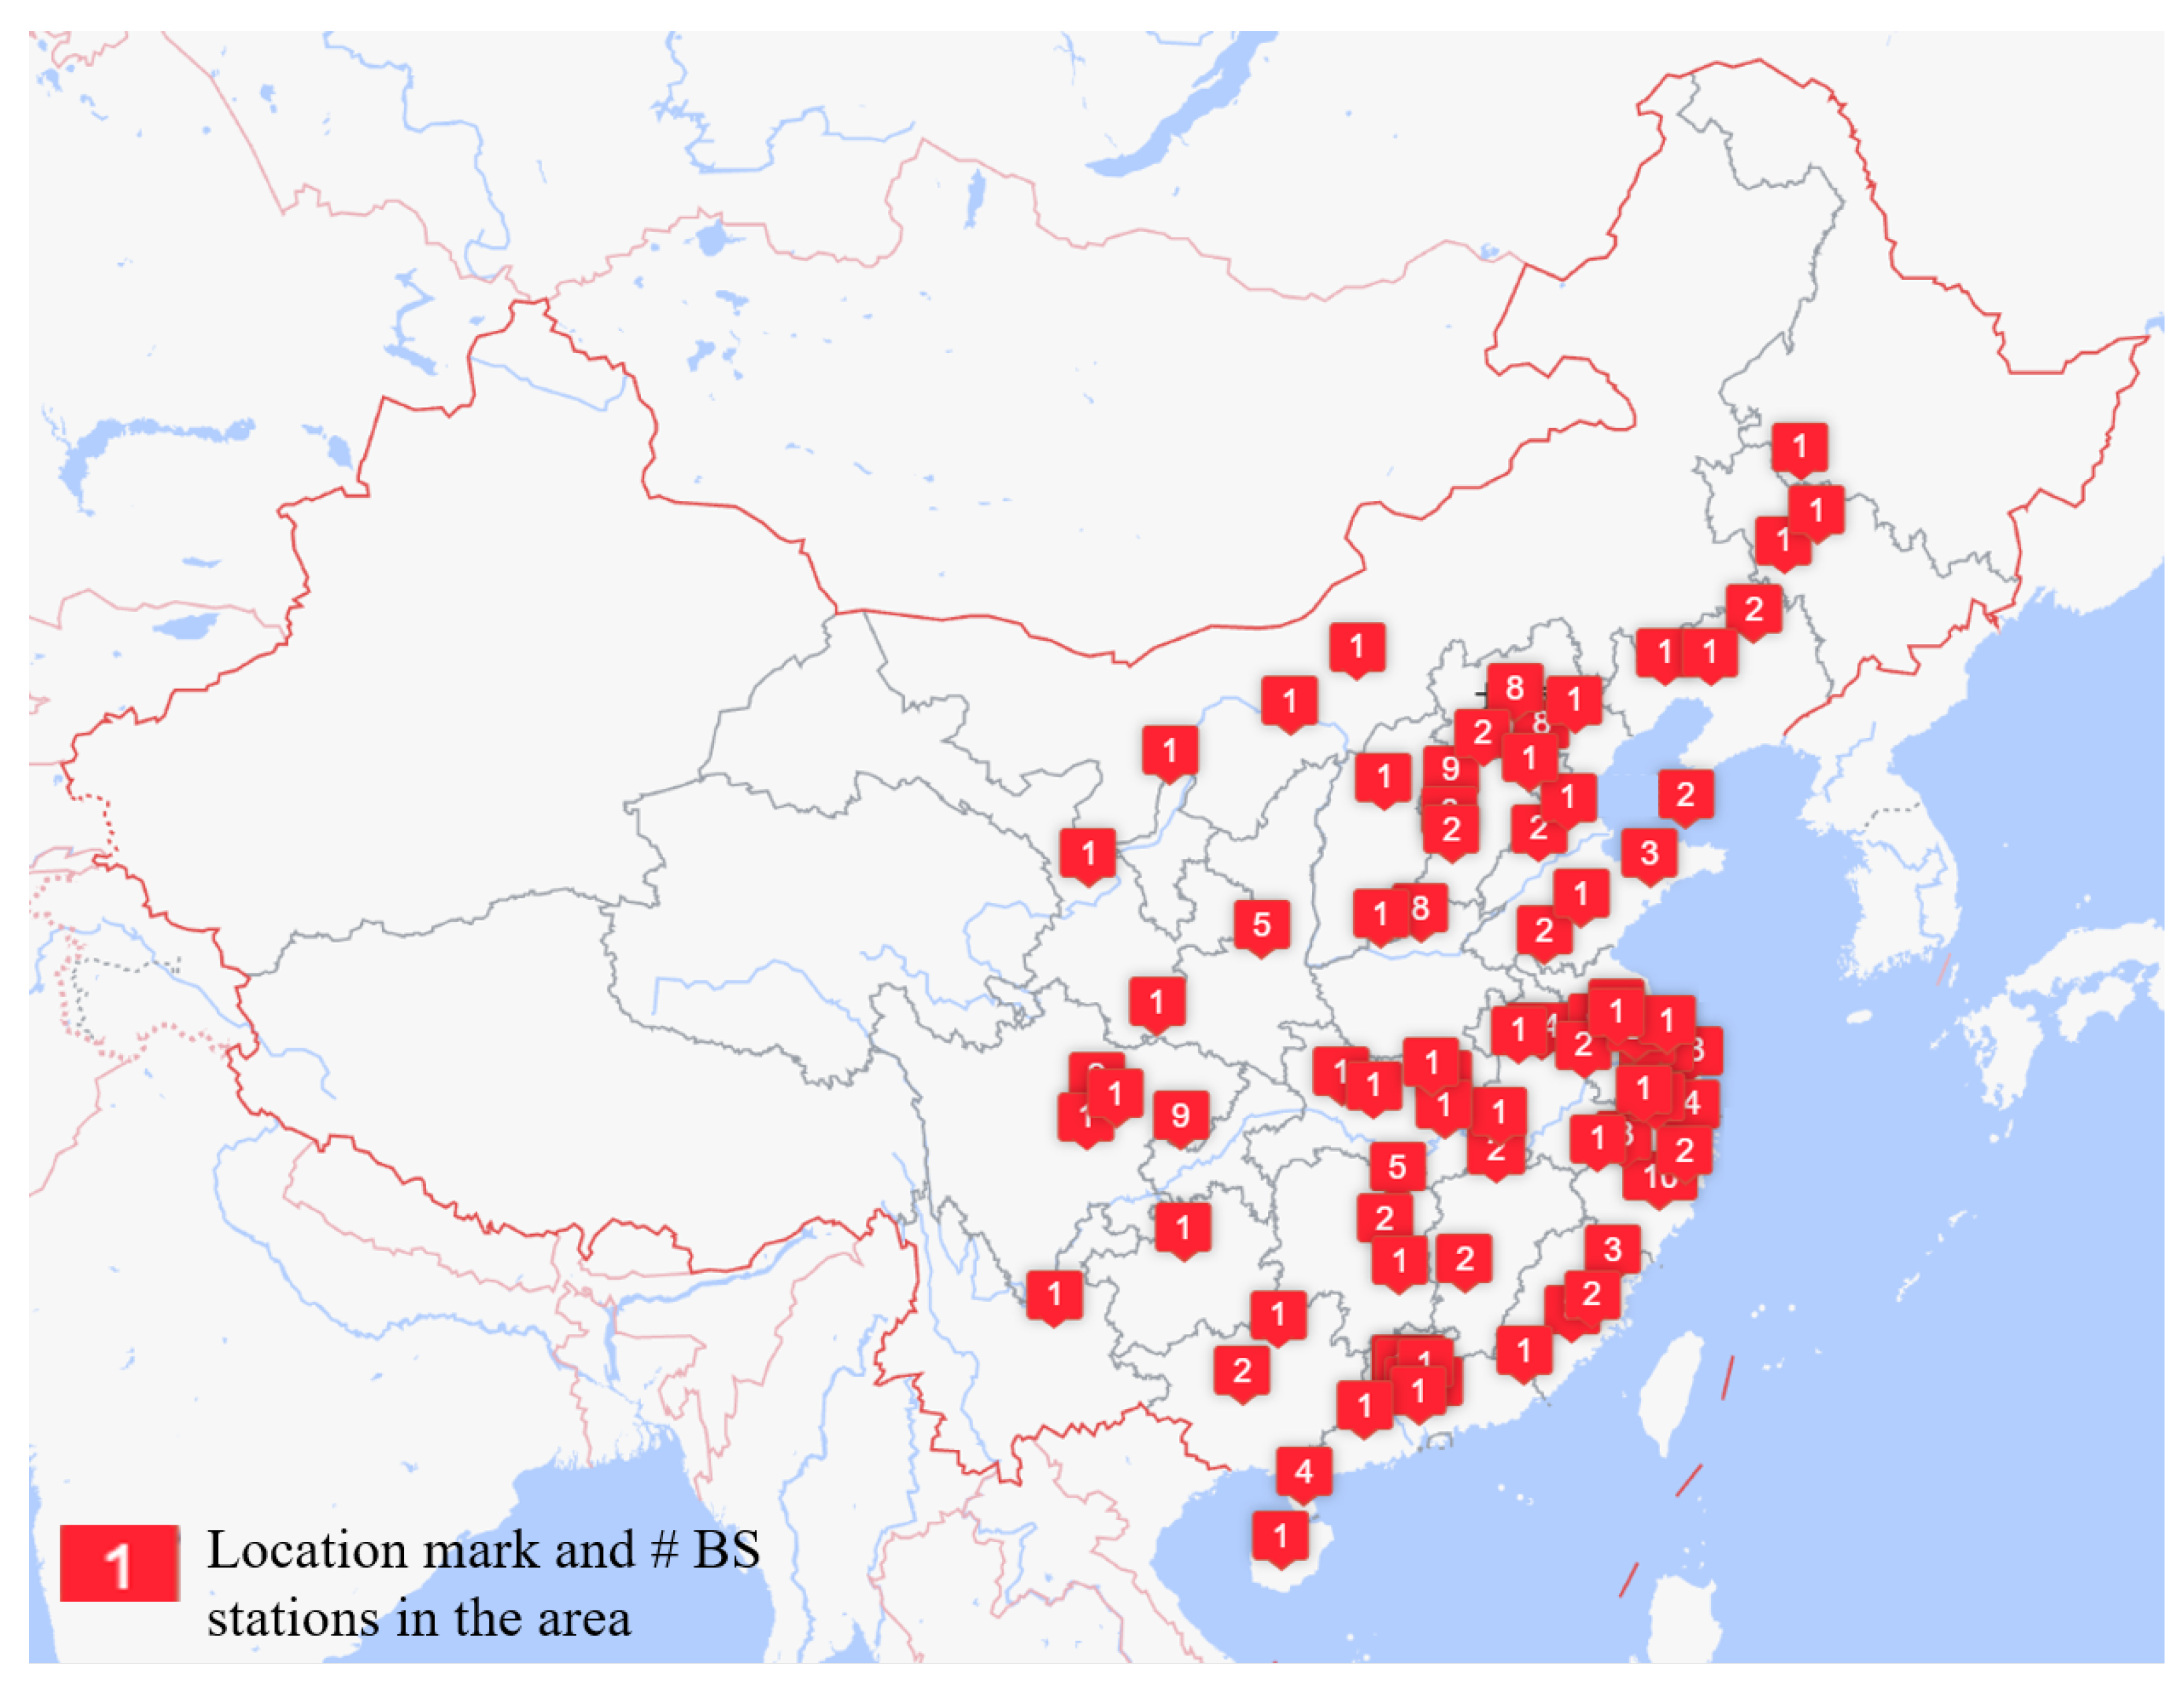
Although the past attempts failed, the Chinese government recently decided to jointly organize a pilot project on the application of the BS mode for new energy vehicles with the aim of implementing the New Energy Vehicle Industry Development Plan (2021–2035). Hence, the research on BS stations has become a hot spot in the industry again. In China, NIO is perhaps the first car company to support the BS mode for general consumers. Since the first BS station established in Shenzhen in 2018, NIO has developed more than 300 BS stations over the whole country (as shown in
Figure 1).
As NIO continues building its iconic BS stations, more customers can access such energy recharge facilities in the neighborhood. By the end of July 2021, according to data released by NIO, about 30.86% users can reach a BS station within a 3-km radius from their residences. However, the service is not convenient enough. For many cities, less than 10 BS stations can be used, and each of them only covers a small region due to the consideration of land cost. In particular, because the distances of BS stations, most EV users have to spend a round-trip journey for accessing the services. What is more, the BS procedure actually takes about 20 min with a series of safety inspections, which increases the associated waiting time.
This paper aims to examine the overall viability of BS service for the EV industry by evaluating the costs and benefits of implementing the BS service. Then, one can establish potential solutions to improve the viability of the BS service. In particular, the BS system is characterized as a standard service system with customer arrivals and service rates. To deal with the problem systematically, we established discrete event simulation models. Real industrial data from Guangzhou city were collected and adopted in the following analysis.
Our simulation results show that the average waiting time is positively correlated with the utilization and significantly deteriorates when the utilization exceeds a certain threshold. Therefore, the maximum utilization for a BS station can only guarantee a limited service level. With limited investment, there exists a trade-off between the total number of batteries and the total number of stations while maximizing the overall service utility.
The rest of this paper is organized as follows.
Section 2 briefly reviews the related literature. The methodology and details of the simulation models are proposed in
Section 3.
Section 4 details the experiments and presents the corresponding results. Finally,
Section 5 discusses the key findings and concludes the work.
2. Literature Review
Replacing traditional gasoline cars with EVs can be viewed as an effective way to encounter environmental and energy issues. To facilitate a wider adoption of EVs, the battery charging infrastructures have to be set up in advance. Apparently, as the backbone of the EV industry, establishing a feasible and effective charging infrastructure network is one of the most important tasks in the era of EV technology [
4]. The large-scale development of EVs inevitably enlarges the need of building charging infrastructures. In practice, the EV charging demands show clear randomness in both time and space dimensions, because the EV users exhibit diversity and variability in driving behavior, charging choices, and traffic conditions. As a result, the design of charging infrastructure becomes an attractive and important research topic.
Currently, several commonly-seen charging methods include conventional slow charging, fast charging, and BS. However, only the first two methods have received intensive and extensive attention. It is difficult for EV companies to make a profit with a cheaper charging price when adopting BS. The main reasons include charging demand, availability of resources, optimum scheduling, various costs, and complexity of the market structure. Therefore, the size and optimization of the charging station must ensure a sustainable transportation-based system.
Xie et al. [
5] proposed a comprehensive two-stage method for sizing stand-alone EV charging stations on highway networks. Wang et al. [
6] introduced a four-step method to deploy normal and fast-charging stations that can satisfy the demand of private EVs in a mature city. Gan et al. [
7] discuss two important aspects for deploying fast-charging stations, i.e., placement and size decisions, to maximize the total profit as well as provide the best quality service to the EV users. Asna et al. [
8] developed an optimal fast charging station planning model to optimize user satisfaction and improve the station utilization.
Though considerable research on charging facilities for EVs can be found, the research and practice based on the BS still lag behind the mode of charging. One underlying reason may be that the failure of early attempts in industry discourages the scholars and practitioners to spent further efforts in implementing this approach. Based on an analysis of Better Place, Olleros [
9] argued that a high-technology start-up in an emerging industry needs to find the market where its value proposition stands the best chance of being scalable, fertile, and lasting, and Better Place failed to accomplish this.
Noel and Sovacool [
3] analyzed the failure of BS mode proposed by Better Place and indicated that mileage anxiety is not the reason for users to refuse pure EVs. Sovacool et al. [
10] suggested that Better Place stretched too far beyond its niches to be compatible with both user expectations and functionality, due to the high upfront prices for EVs and high monthly costs for BS service. In addition to cost control, there are more issues to tackle for BS mode than charging mode, such as standardization, limited user scale, and service capacity.
Islam et al. [
11] studied an optimal location and sizing problem with the consideration of transportation losses, grid power loss, and build-up loss. Zhang et al. [
12] made an attempt to design an EV charging network where BS and supercharging are jointly coordinated.
However, specific research that focused on the BS system is irreplaceable. In practice, building a BS station requires a higher fixed cost and a larger space. Liang et al. [
13] developed a linear programming model to maximize the daily operation profits of a BS station by considering the constraints of user demand and the charging/discharging balance of batteries.
Amiri et al. [
14] formulated the problem as a multi-objective programming model in which cost-based and technical-based objectives are taken into account, such as voltage profile flattening and network capacity releasing.
Sun et al. [
15] proposed a periodic fluid model to describe charging operations at a BS station facing time-varying demand and price. Their objective was to find an optimal battery purchasing and charging policy that can balance the battery investment and operating cost. Their results show that each additional battery can help mitigate the trade-off, but the marginal gain decreases in the number of batteries. By considering long recharge times and battery degradation, Asadi and Pinkley [
16] modeled the corresponding scheduling, allocation, and inventory replenishment problem as a Markov decision process, in which the charging, discharging, and replacement decisions can be made for the BS station over time.
On the other hand, under the current passive BS mode, users must drive to the stations by themselves to access the services. However, these stations are often sparsely distributed and the numbers of batteries are limited, which causes waiting and significantly affects the service satisfaction [
2]. Shen et al. [
17] indicated that BS mode faces a dilemma that it can be generalized only if the number of users increases while, on the contrary, only the number of stations can attract more prospective EV customers. Therefore, to take the initiative in business competition, BS service providers have to deliver outstanding service.
Some researchers have quantitatively analyzed the service performance of BS stations. Zhang et al. [
18] used the Monte Carlo simulation method to evaluate the service capacities of charging and BS stations. Their results show that, under the same service capacity, the BS station can bring more economic and social benefits than that of a charging station. Mahoor et al. [
19] developed a mathematical model for an uncertainty-constrained BS station whose optimal operation covers the random customer demands of fully charged batteries. Another group of scholars are focused on the BS operation mode.
Shao et al. [
20] studied an approach for providing BS service by a mobile van and proposed a minimum waiting time based on priority and a satisfaction scheduling strategy. Wu et al. [
21] focused on the operation policy that the BS station offers a price discount to entice drivers to send advanced swapping notice, based on which the station can maintain a high level of battery stock and provide better service.
To deal with the uncertain demand, Cao et al. [
22] constructed a communication framework to support charging and BS services, under which the service providers can publish information and the users can subscribe. Seitaridis et al. [
23] proposed a negotiation scheme for a set of BS stations, with which the EVs can announce their requests to the stations and each station computes an optimal solution to maximize the number of charged EVs.
Indira [
1] introduced a business model based on the database of users and batteries maintained at a centralized BS management system, including a smart battery rapid-tester, a local load management system, a battery bank, and a solar photo-voltaic grid integrated/standalone system.
However, the previous research was mainly applied to electric buses, electric taxis, and vehicles with special purpose (e.g., the special Olympic vehicle). Han and Zhang [
24] built a discrete event model for the operation of a bus BS station to optimize the configuration of the station based on Anylogic. Imani et al. [
25] developed discrete event simulation programs to verify and validate the queuing effect of swapping and on-board charging processes with Arena.
Maïzi et al. [
26] used a simulation approach to model realistic charging demands and verify the EV charging infrastructure considering both power and transportation networks. Wang et al. [
27] studied the management strategy of an EV charging station and use simulation to evaluate its performance.
Lopez, N.S. et al. [
28] presented a discrete event model that can describe the characteristics of individual EV users and discuss a few potential implications on EV charging policy. Nevertheless, these types of vehicle fleets preserves the characteristics of large scale, uniform battery standard, and stable charging demand, which make it suitable and easier to coordinate.
Though BS stations for passenger vehicles have gained more and more investments in recent years, the research related to this part is still rare. Thus, this article is proposed for addressing the issues appeared in BS stations for passenger vehicles, whose service system will be mainly affected by random user arrivals, state of charge, and service time.
3. Methodology and Data Collection
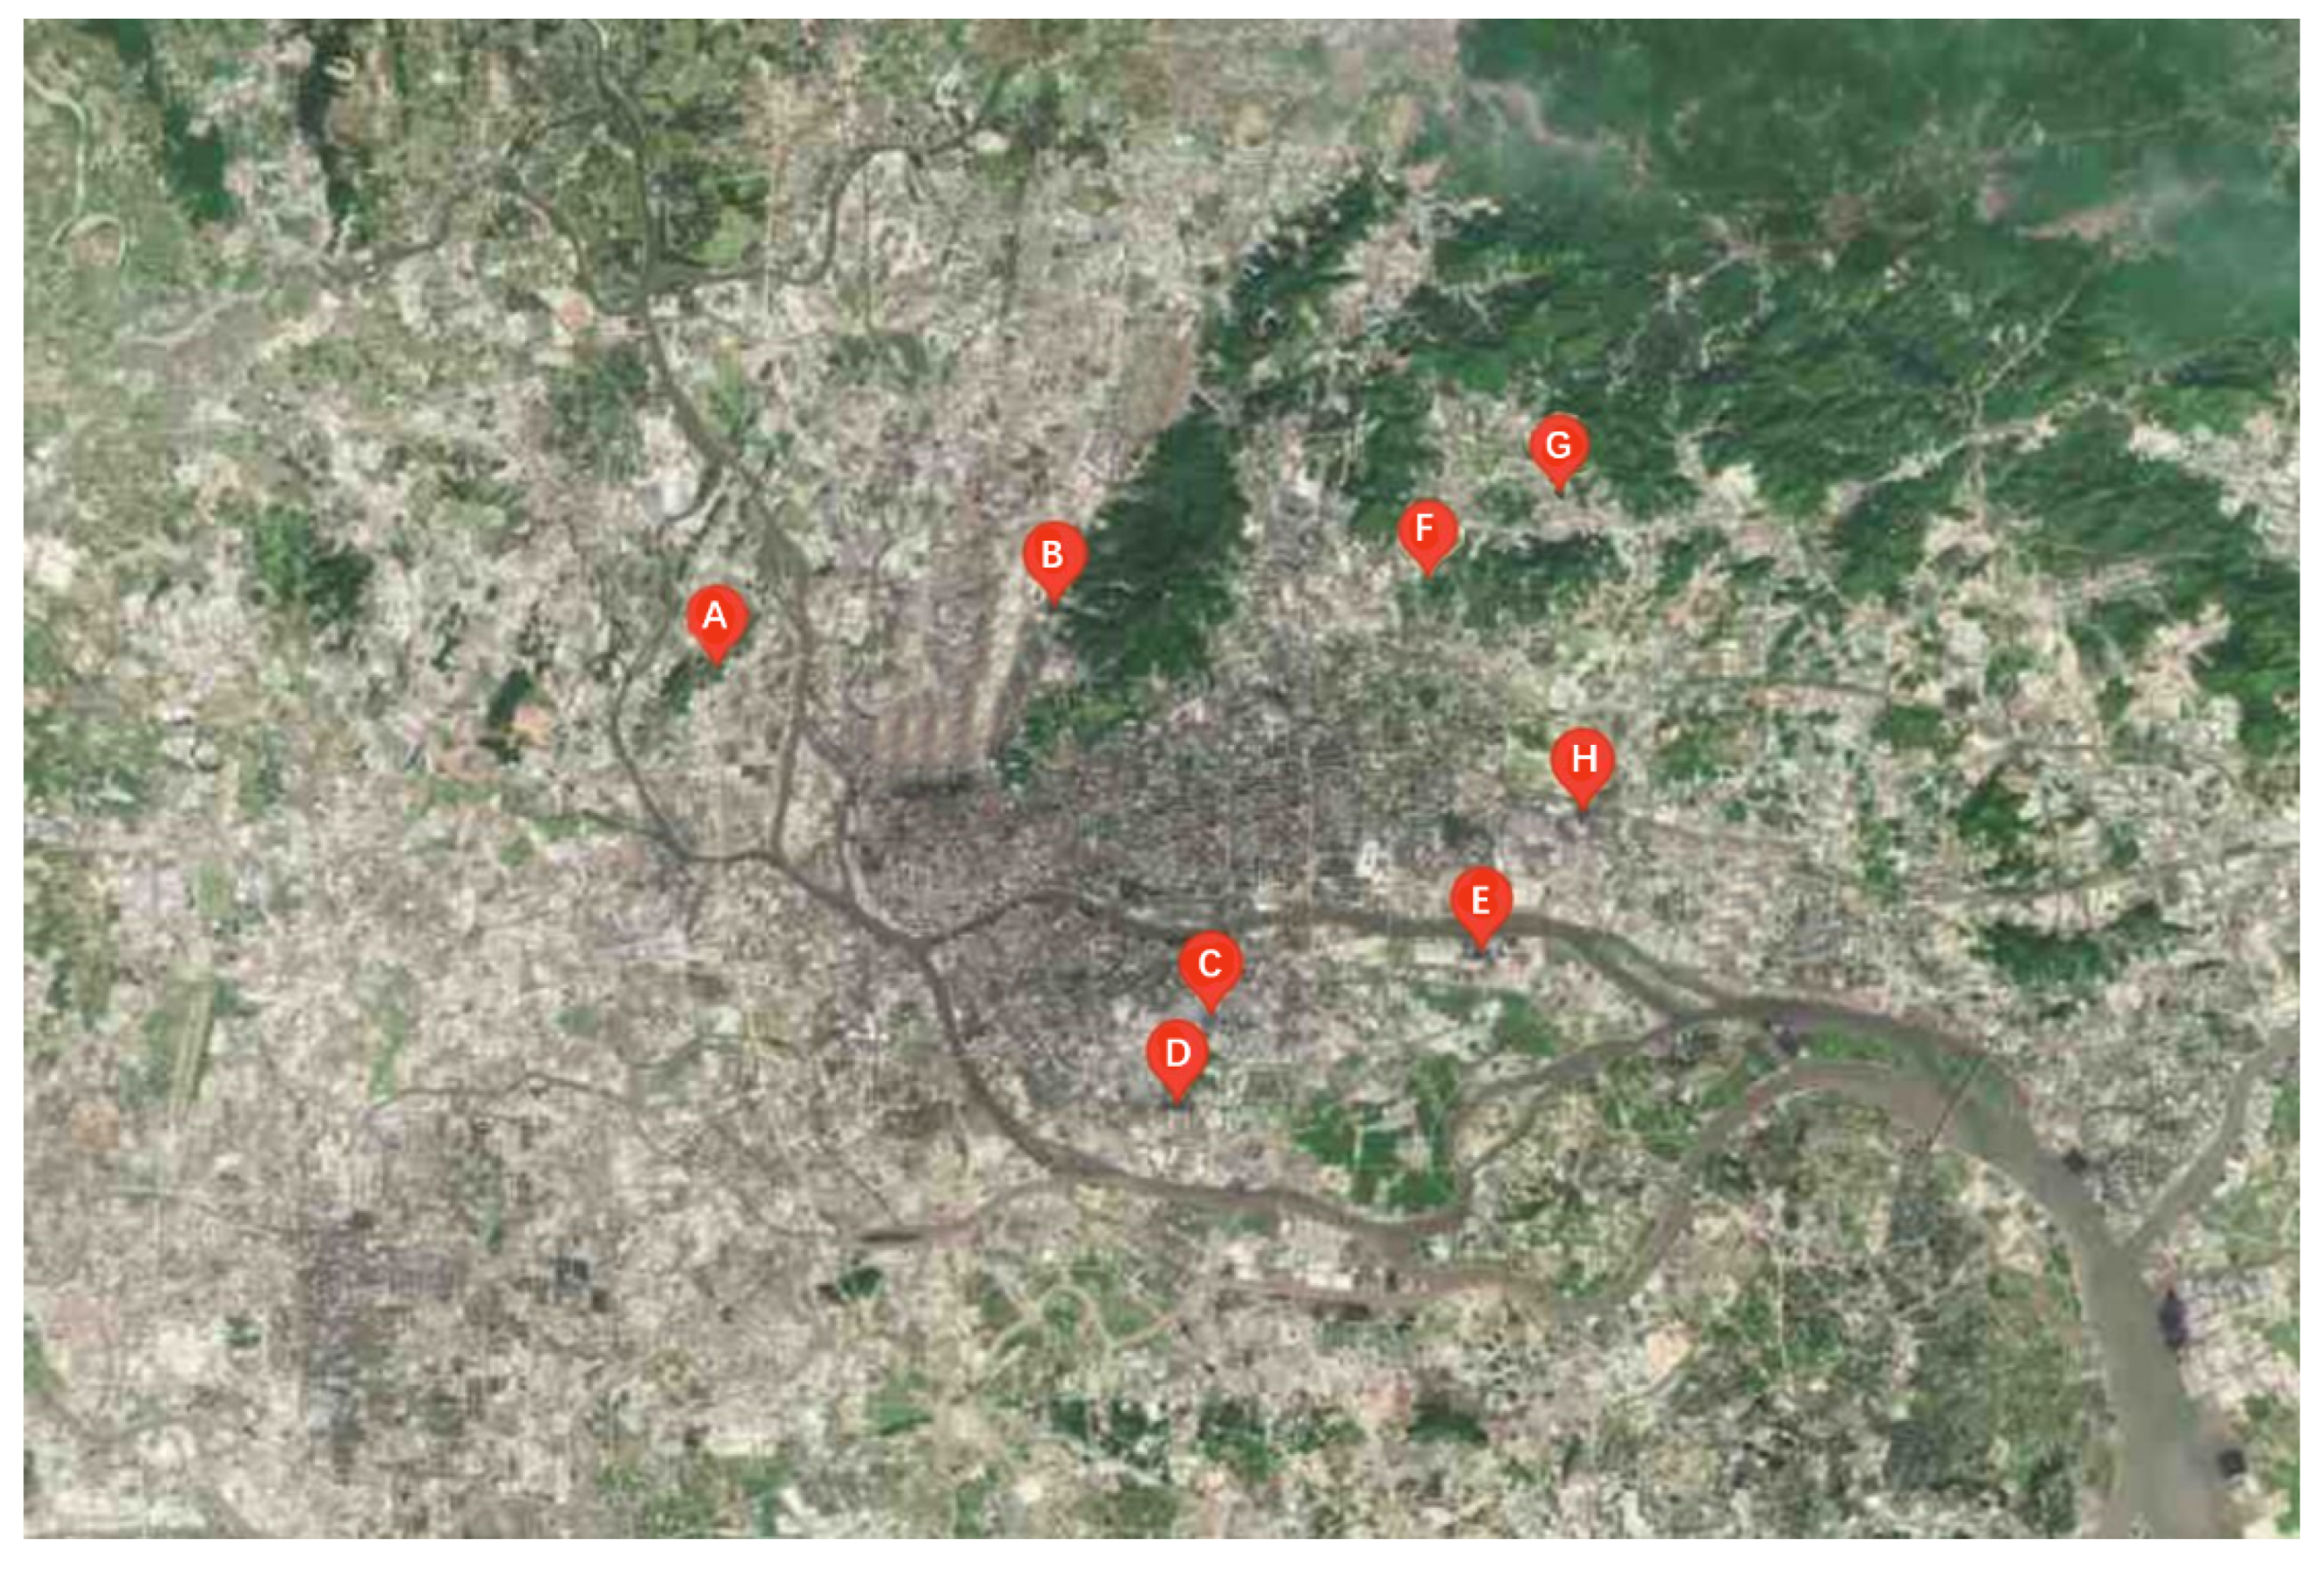
In this paper, we conduct discrete event simulation models to analyze a city-level BS network that consists of multiple stations facing varying service capacity (number of exchange batteries) and uncertain demands. Real-world monitoring data of BS network in Guangzhou city were collected via NIO’s mobile app, including the number of stations, station capacities, and historical customer arrivals. Currently, there are eight NIO BS stations in Guangzhou as can be observed in
Figure 2. For performance data, we recorded the daily information of the eight NIO BS stations during December 2020.
3.1. Assumptions and Modeling
To realize model functions, global variables and entity attributes are defined. Apart from realistic data, the model parameters were initialized according to the following assumptions.
Average BS time is obtained and we assume the data follow the same probability distribution.
The remaining capacity of the returned battery or the battery initial state of charge (SOC) is not fixed and assumed to follow the same probability distribution. The batteries in the BS stations can be used only if they are fully charged.
Customers randomly arrive at the stations every hour under a certain probability based on the pattern of collected data, and they leave as soon as the service finishes.
No restrictions on queue length and waiting time.
The model variables and descriptions are shown in
Table 1.
Note that t ∈ {1, 2, …, 24} is the index of a period of time lasting for 1 h (there are 24 time intervals). P(i,t) can be calculated based on collected data (not shown). Moreover, we take each EV as an entity with assigned attributes shown in
Table 2.
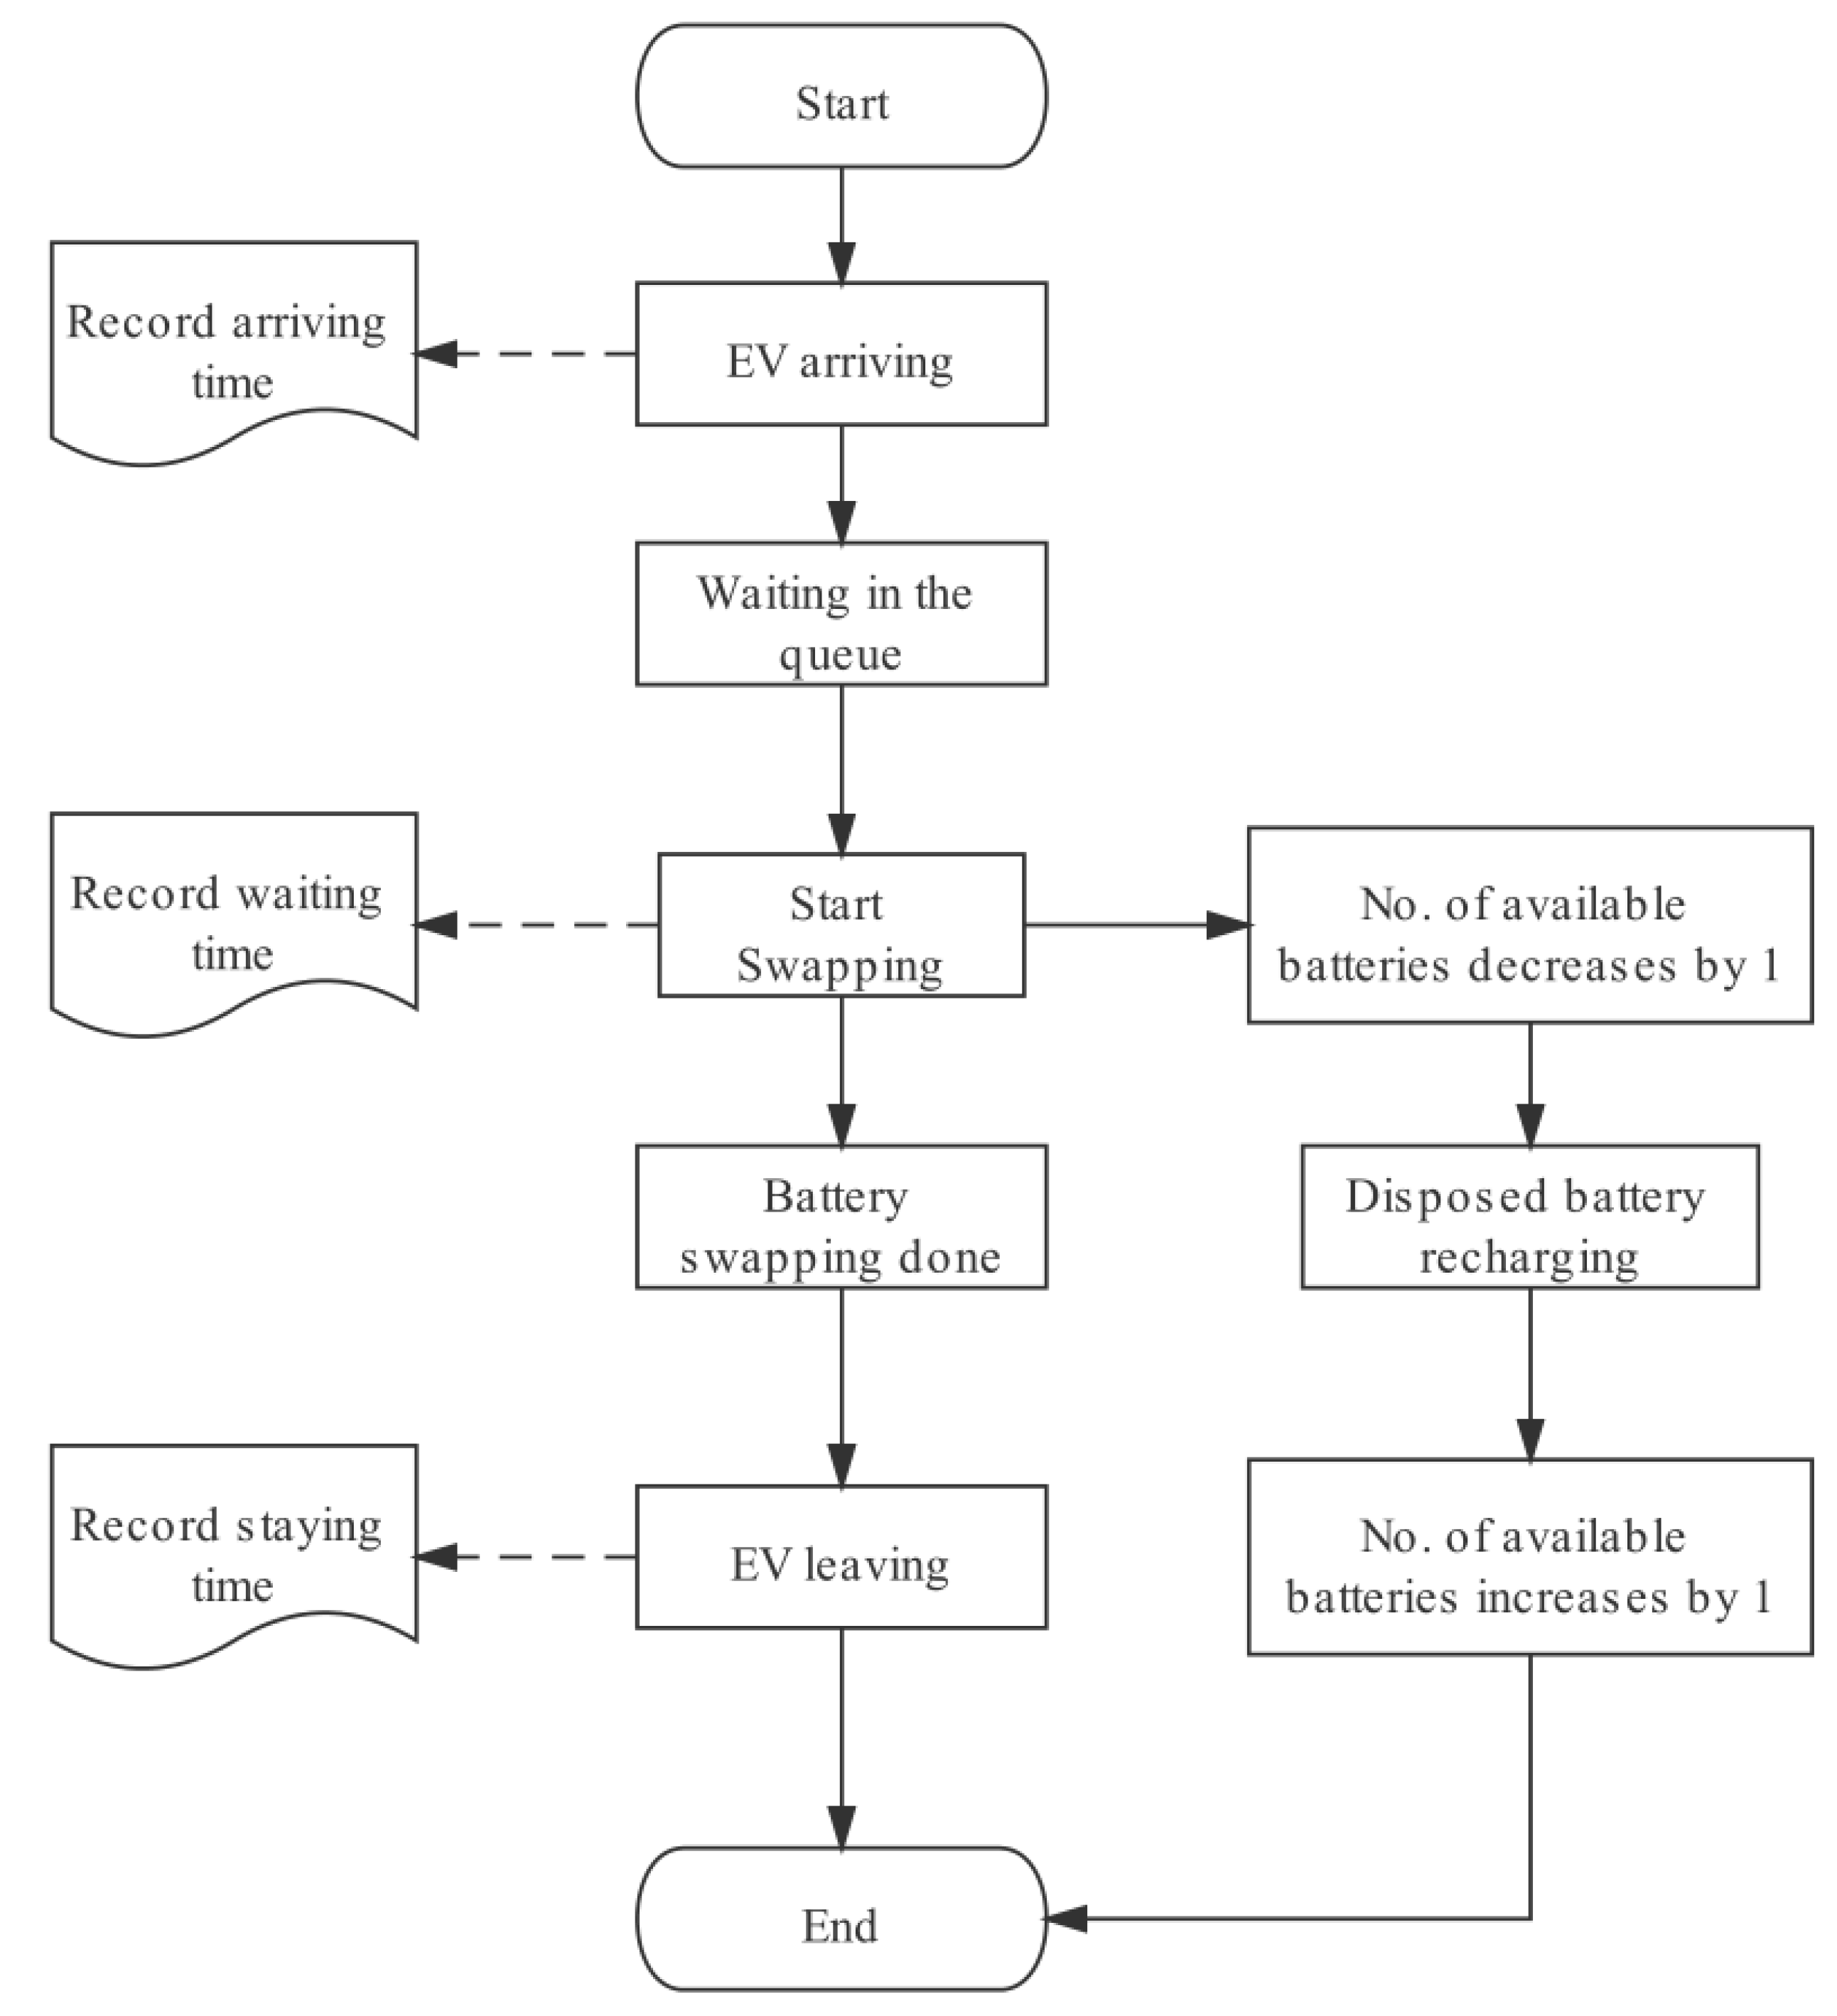
For each BS station, the simulated process is depicted in the
Figure 3. EVs arrive at the station with a certain rate, and the arriving time of an EV is recorded as T_arrive. Each EV may need to wait in the queue until a fully charged battery is available and for its turn. When it enters the station and starts to swap a battery, the waiting time is recorded as T_wait. After the EV receives the swapping service, (this process takes a certain time denoted as Swapping_time), the depleted battery needs to be charged and will be available for swapping after being fully recharged, (the charging power is denoted as Power). When the EV leaves the station, the staying time is recorded as T_stay. During these simulation processes, the queue length, Queue_length_i, and the number of available batteries, Available_batteries_i, will change and be recorded.
Based on the proposed simulation procedure, the corresponding discrete event model was built in Arena (version 16.0). In particular, the simulation optimization engine “OptQuest” enhances the analysis capabilities of Arena, which is able to search for optimal solutions for the proposed models.
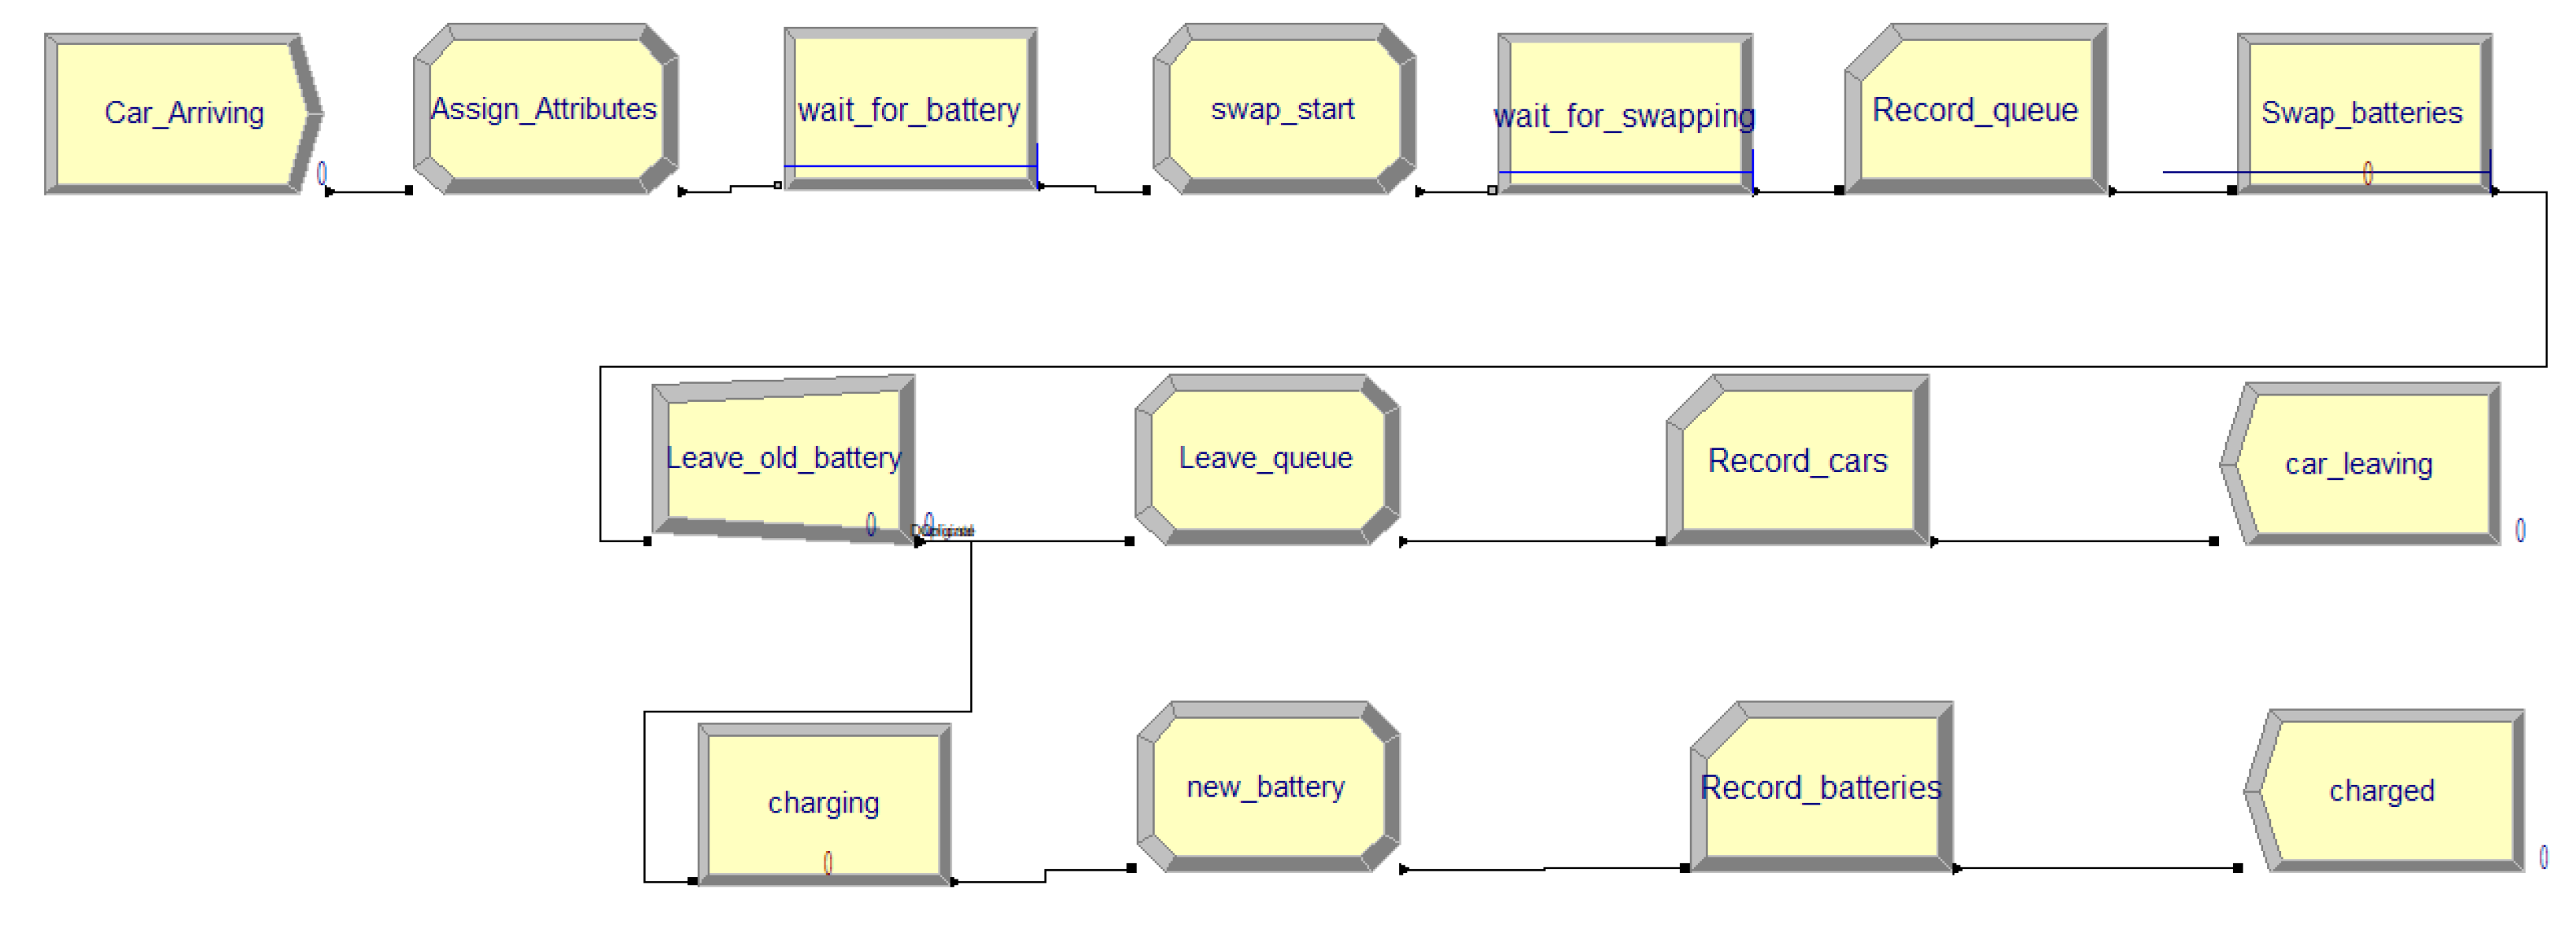
The logic of simulation is presented in
Figure 4. The simulation process and functions of related block are described as follows.
As the starting point, the user calls on a swapping service and the create module “Car_Arriving” creates arriving users at the set rate. Each EV is at a different state and the module “Assign_Attributes” initiates the EV’s attributes such as capacity, T_arrive, and SOC. Meanwhile, the current queue length will be updated. Next, the user needs to wait until there is at least one fully-charged battery available, that is, the module “Wait_for_Battery” holds the EV in queue to do so.
Once an EV is able to receive service, it occupies a fully-charged battery, and the simulation model updates current number of available batteries. Each EV also needs to wait until the only car slot is available to swap batteries, and the total waiting time “T_wait” is recorded by the Record_queue module. After the station performed the BS process, the EV leaves the car slot (separate with its depleted battery), and the model updates the current queue length for the swapping car slot.
Correspondingly, the total time an EV stays in this system is recorded as “T_stay”, and the model calculates the number of EVs served. After the EV leaves the system, the depleted battery enters the charging process, and the number of available batteries increases as soon as it is fully-charged. The total time of charging is also recorded.
3.2. Data Collection
The customer arrival data at the eight BS stations in Guangzhou were collected. The users’ arrival rate is calculated as below.
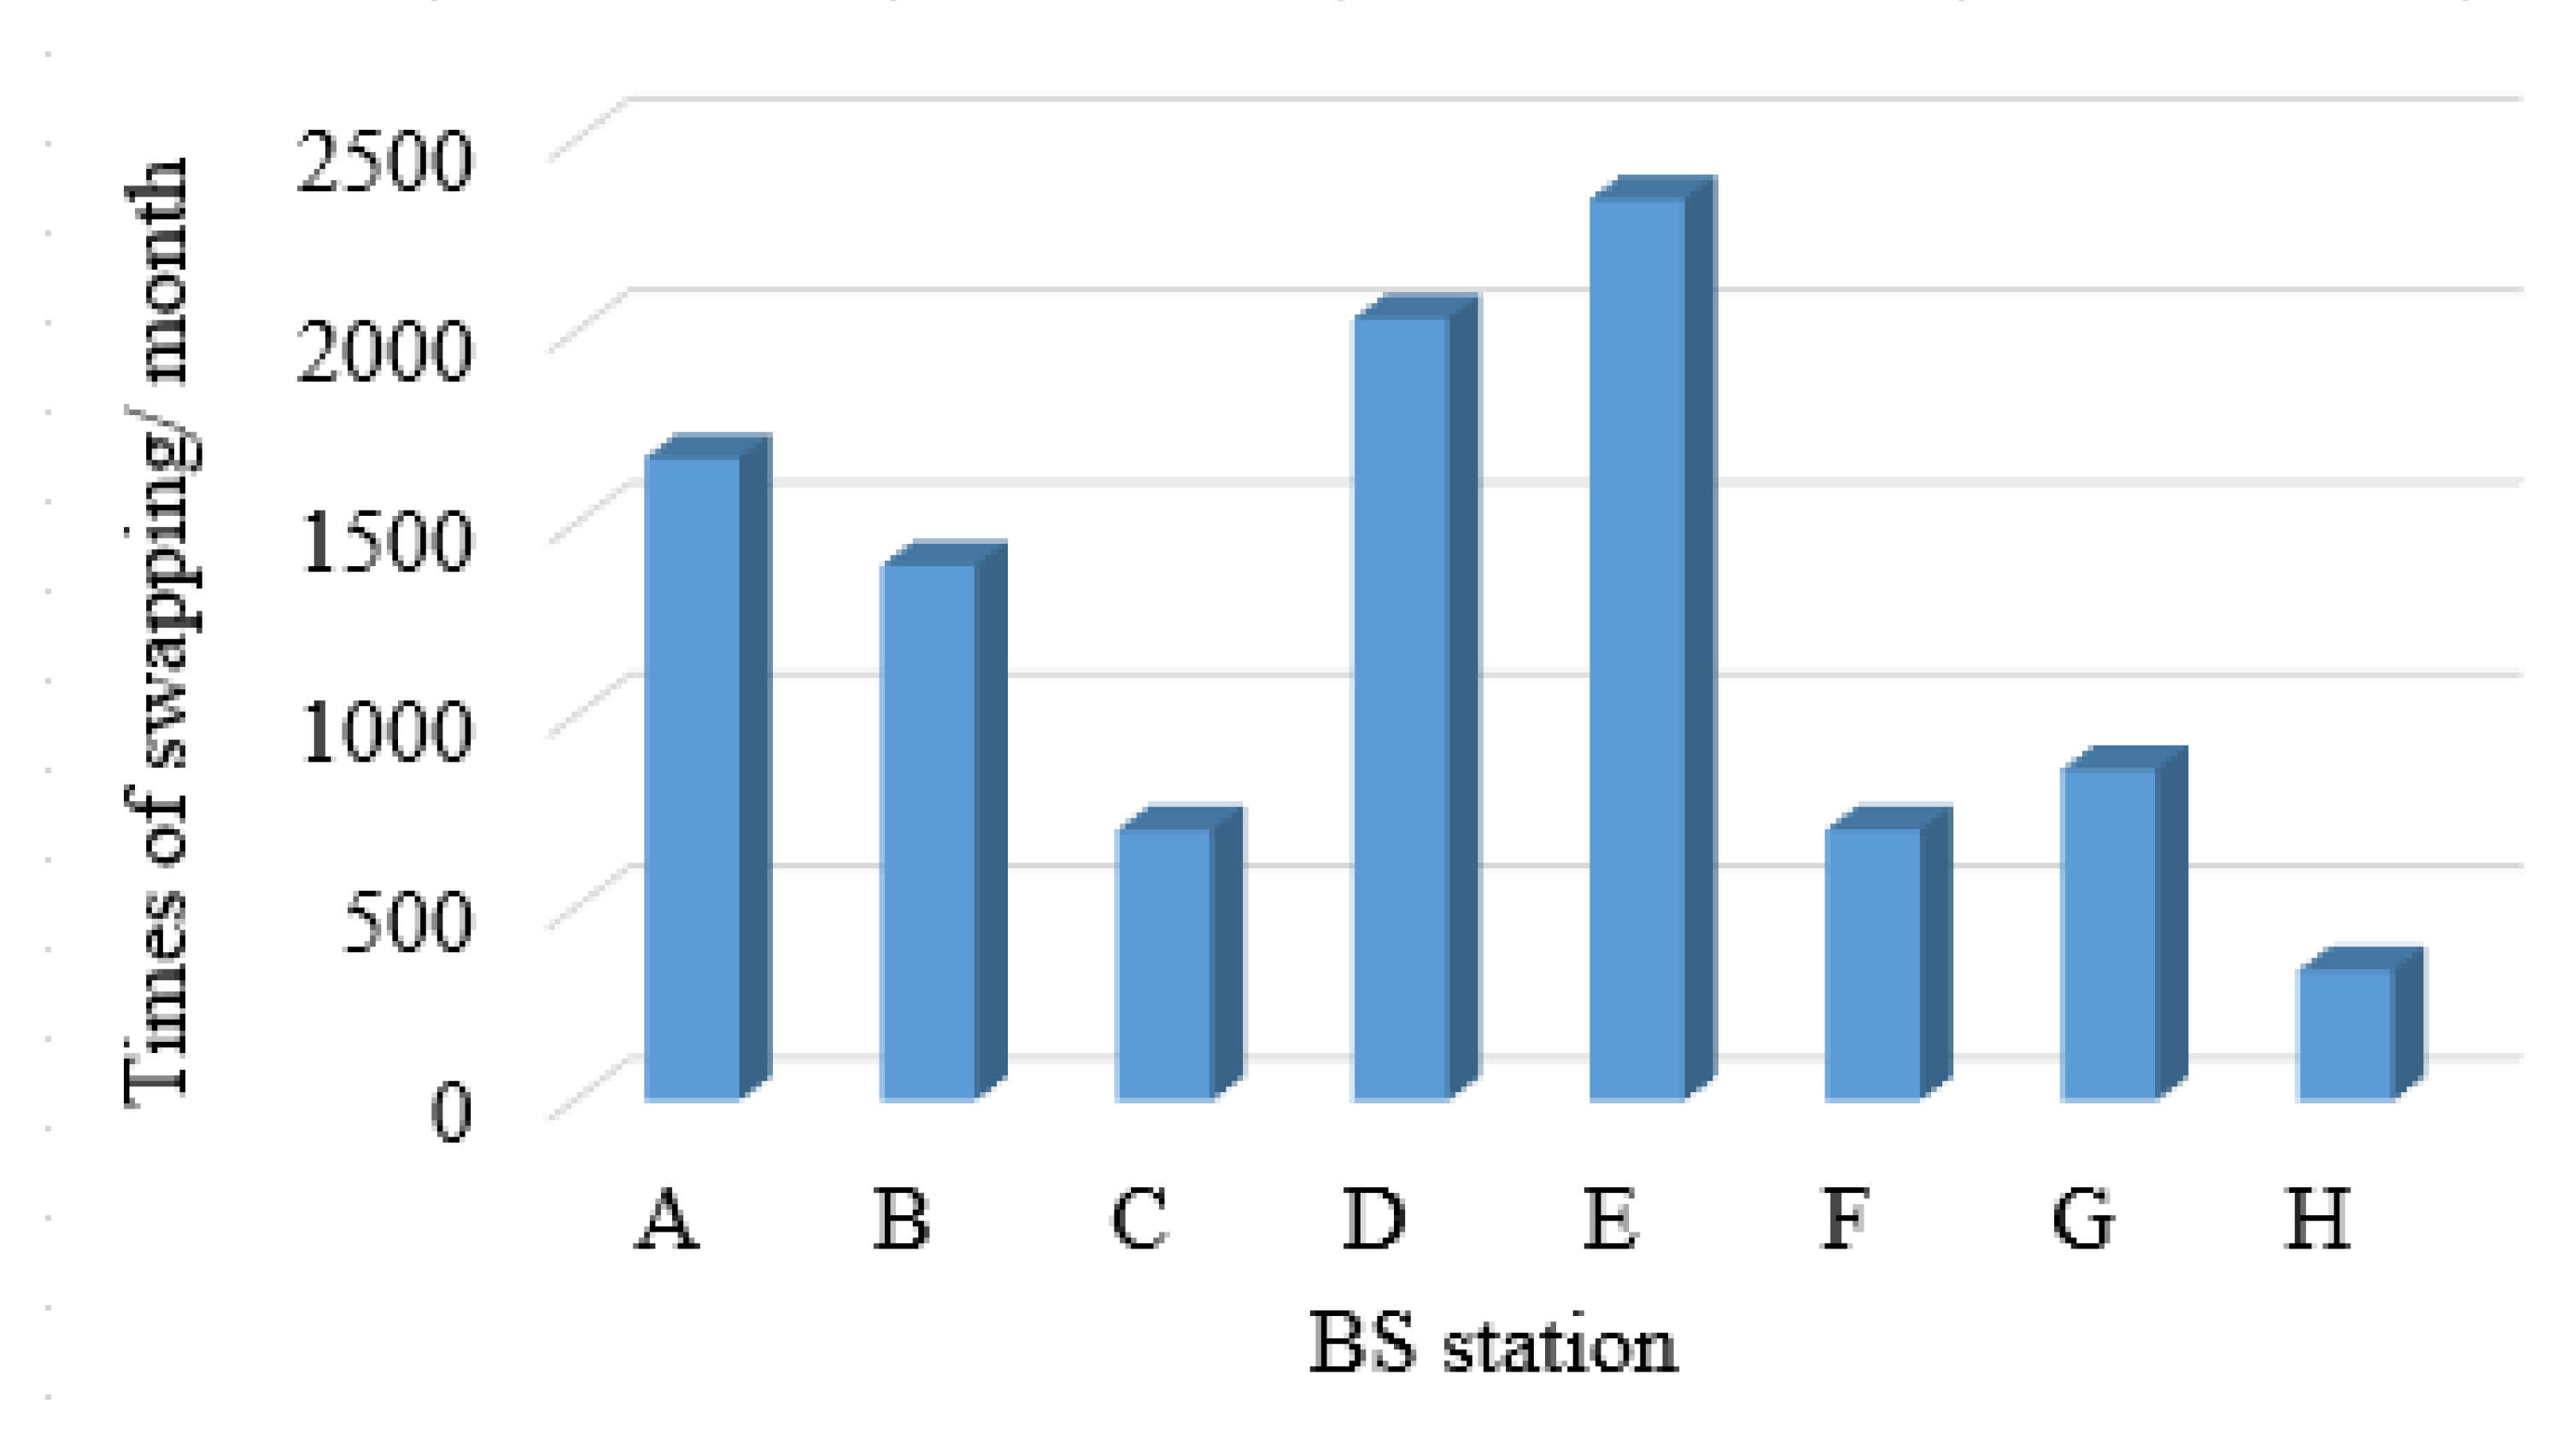
Among these parameters, times_per_day is 0.14 for each potential user (assume an EV requests a service weekly). The number of potential users num_of_users is an adjustable variable in the model. P(i,t) varies with both time and the specific station and is calculated by dividing the number of users arriving at station i during t by the total number of arrivals. We collected the user arrival data for each station separately and found the associated arrival rates vary significantly for different stations (shown in
Figure 5).
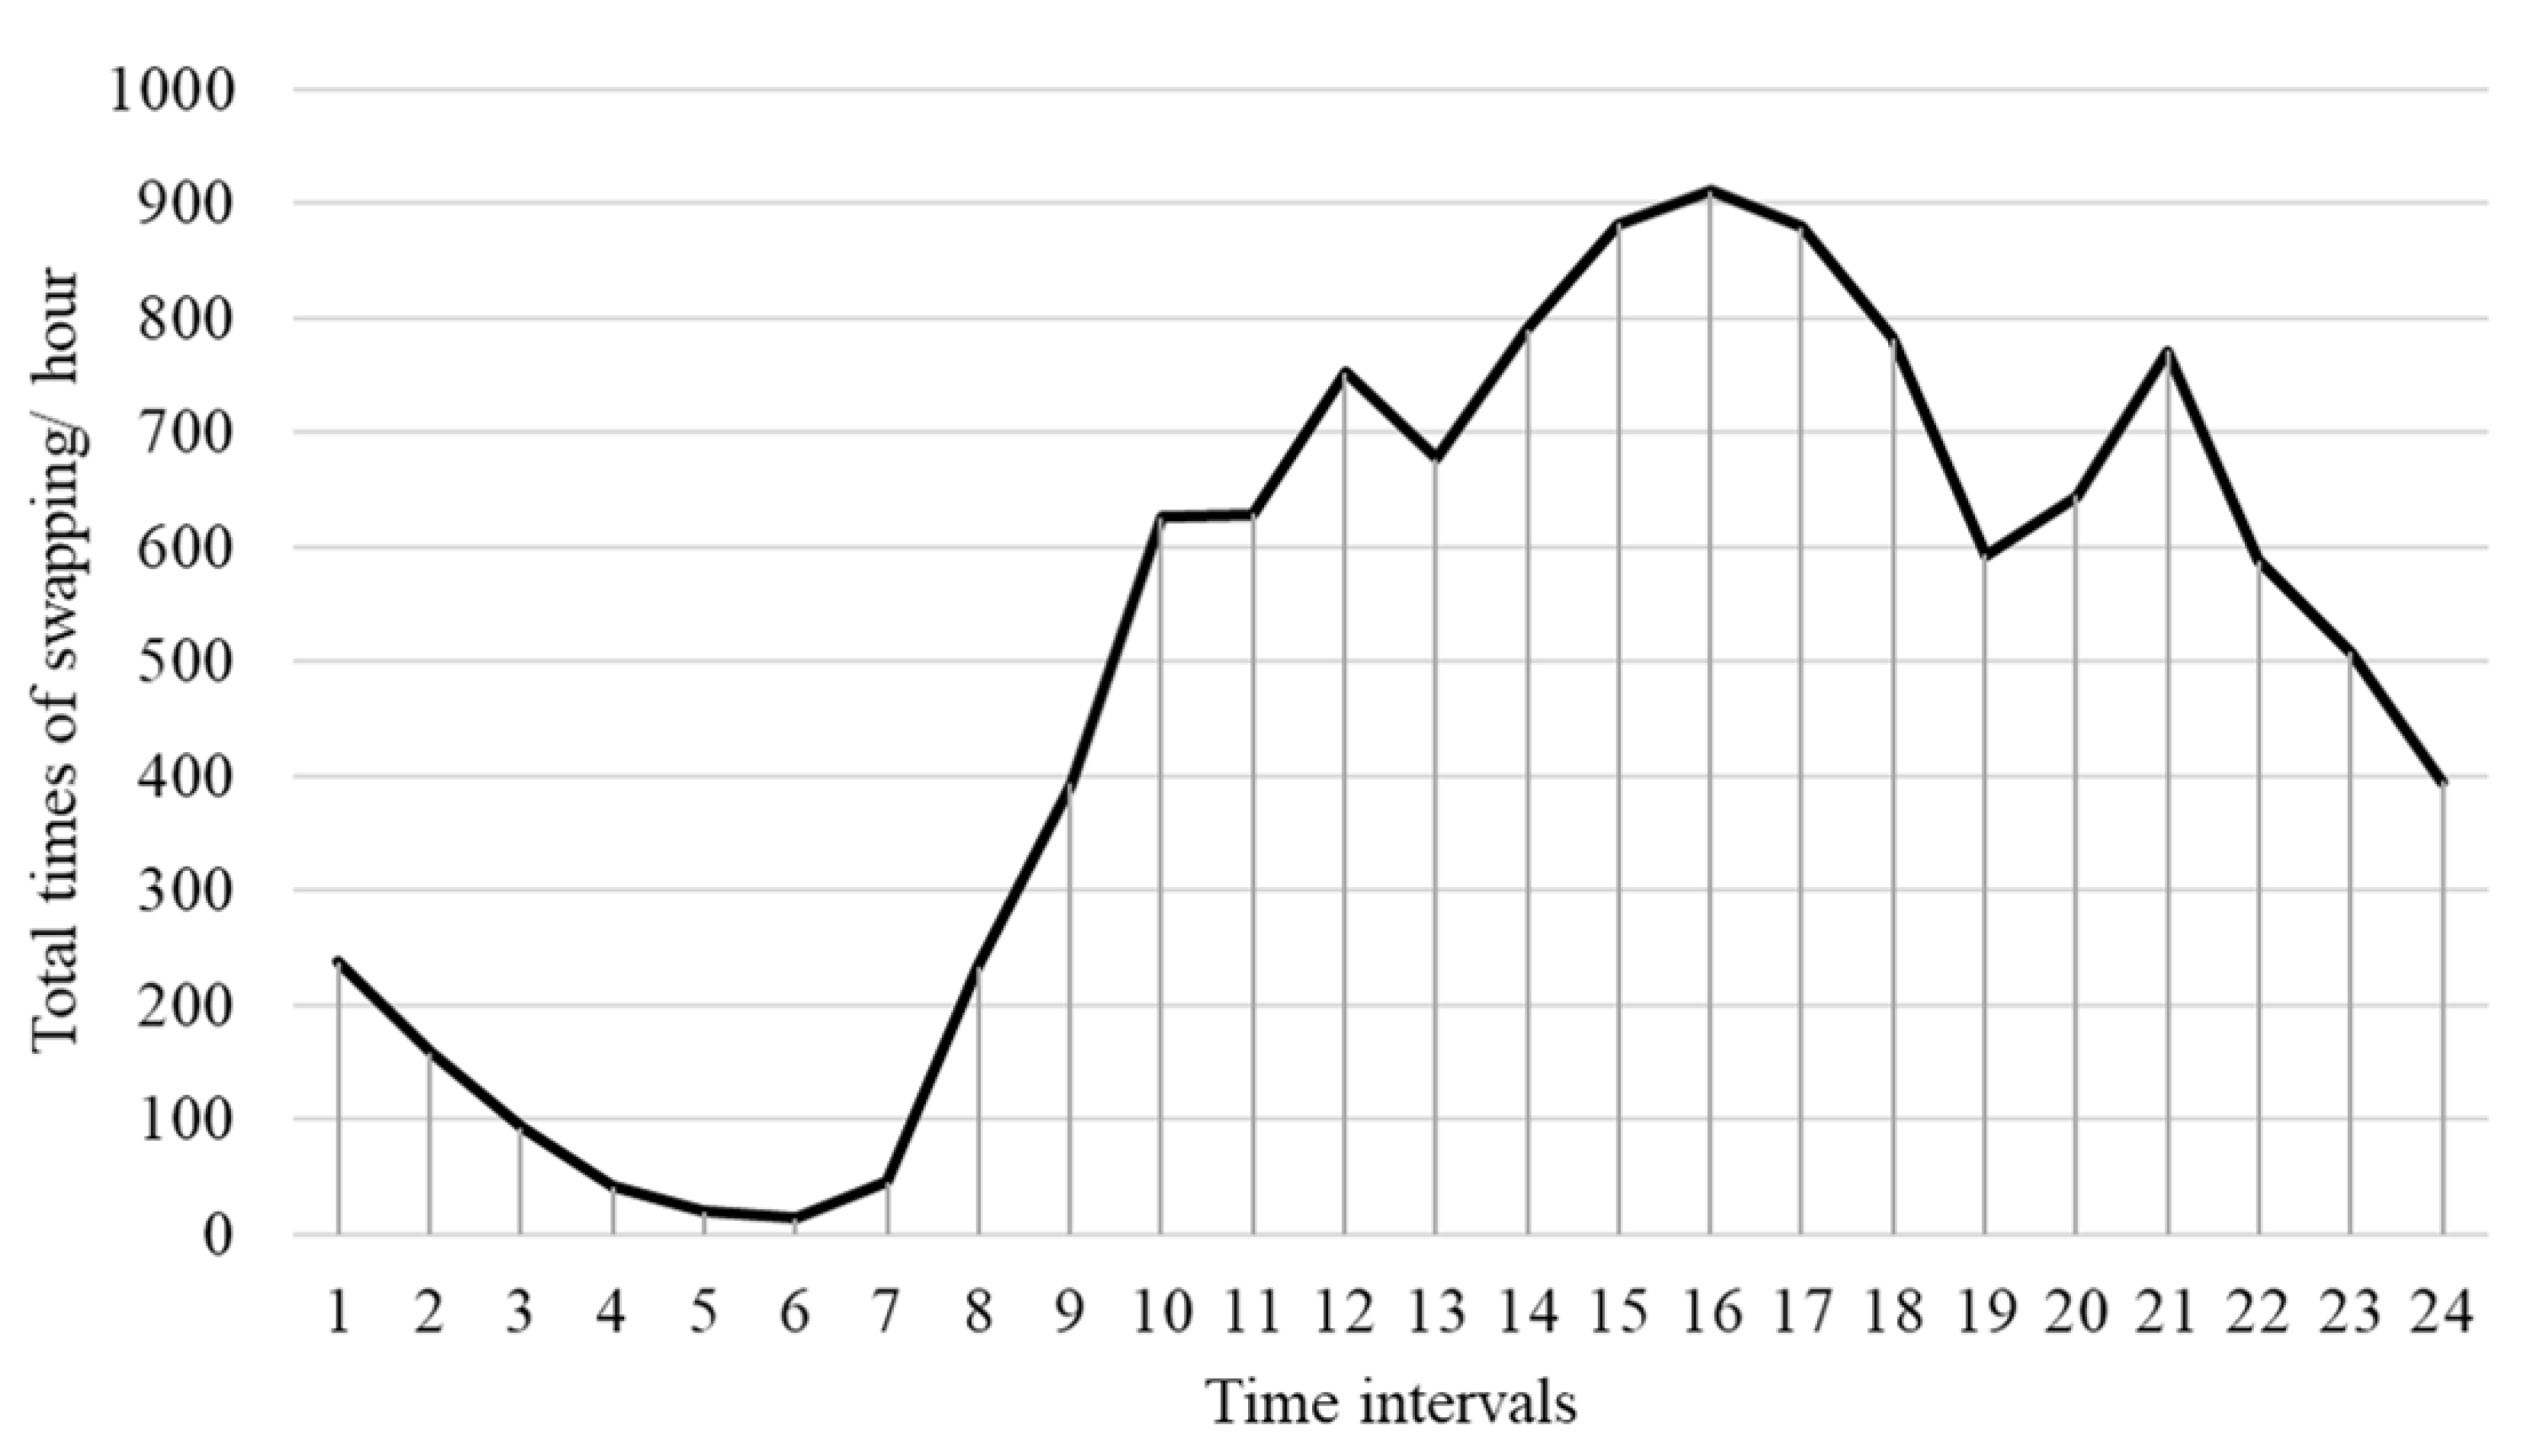
On the other hand, we subdivided the arrival information into 24 different time periods, since the usage of stations varies significantly during different periods of the day.
Figure 6 shows the total number of services given by all of BS stations in 24 time periods, and similar data of each single station are input to our simulation model.
Clearly, the user arrival changes over time with the maximum in the afternoon and the minimum in the morning. Due to the fluctuations, the service performance is bound to be affected. To analyze the effects, simulation experiments were conducted based on these data.
4. Experiments and Results
Since the model was constructed and validated, it was able to perform experiments, and we analyzed the system in different scenarios and discuss the simulation results.
4.1. Assessment of Existing Service Level
For NIO, the opinions on the service level of the existing BS stations are conflicted. Although the usage data of NIO BS service is available, the service level is still unknown. However, some users have complained that, with the increasing demand of BS service, the waiting time is longer, which reduces the associated service level. According to the established simulation model, the service level can be evaluated via service time, waiting time, and queue length. As shown in
Table 3, the results indicate that observable differences exist among the eight BS stations.
Corresponding Indicators
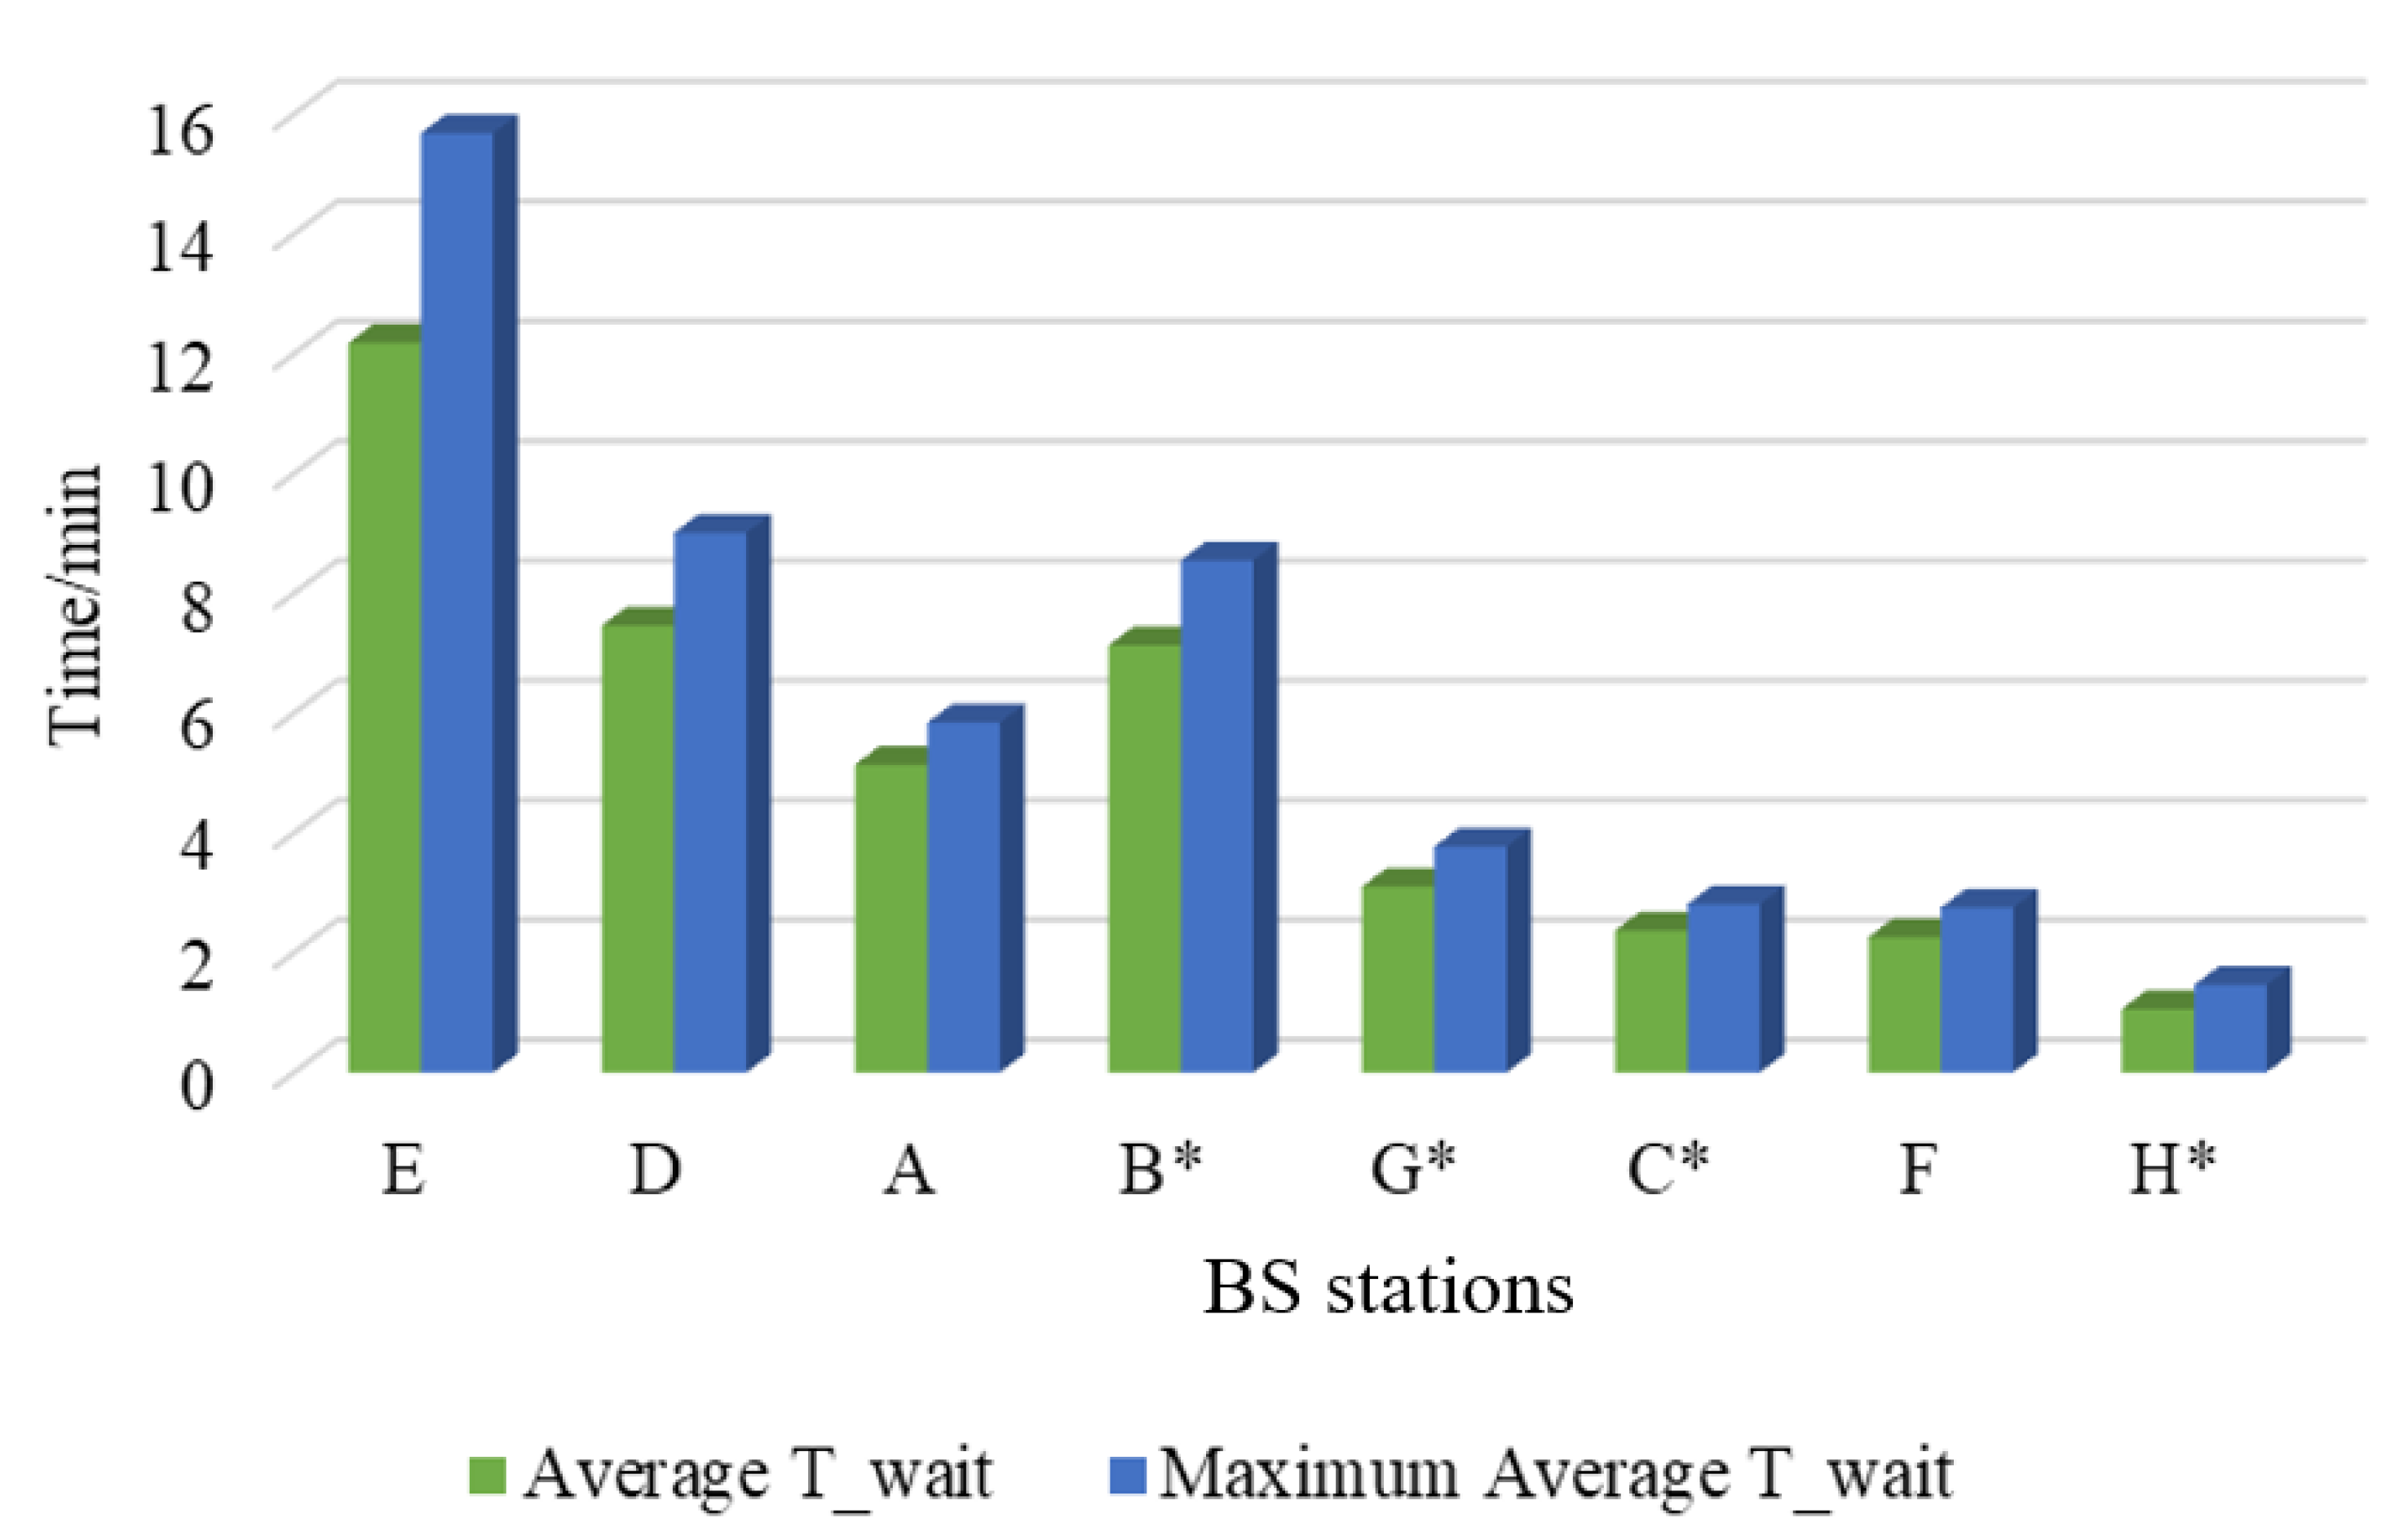
Note that ”*” implies the working time of associated BS station is only 12 h per day. The results are listed in descending order by utilization. The higher utilization, the more people received service. In addition, the car waiting time also increases accordingly, though the average waiting time is acceptable. In particular, at the extreme situation, a customer may have to wait for more than 2 h. However, the extreme situation never actually happens in reality, for which the trend of max average waiting time is similar to the average waiting time as shown in
Figure 7.
Based on the results, the service levels of different stations vary significantly. The utilization of some existing BS stations, especially Station E, have reached a level where a significant waiting time may occur.
4.2. Correlation of Demand and Average Waiting Time
With increasing number of EV users, the service level of BS network will lower. Thus, we next examine the effect of market size on the service level by changing the number of potential users in the network. The results are shown in
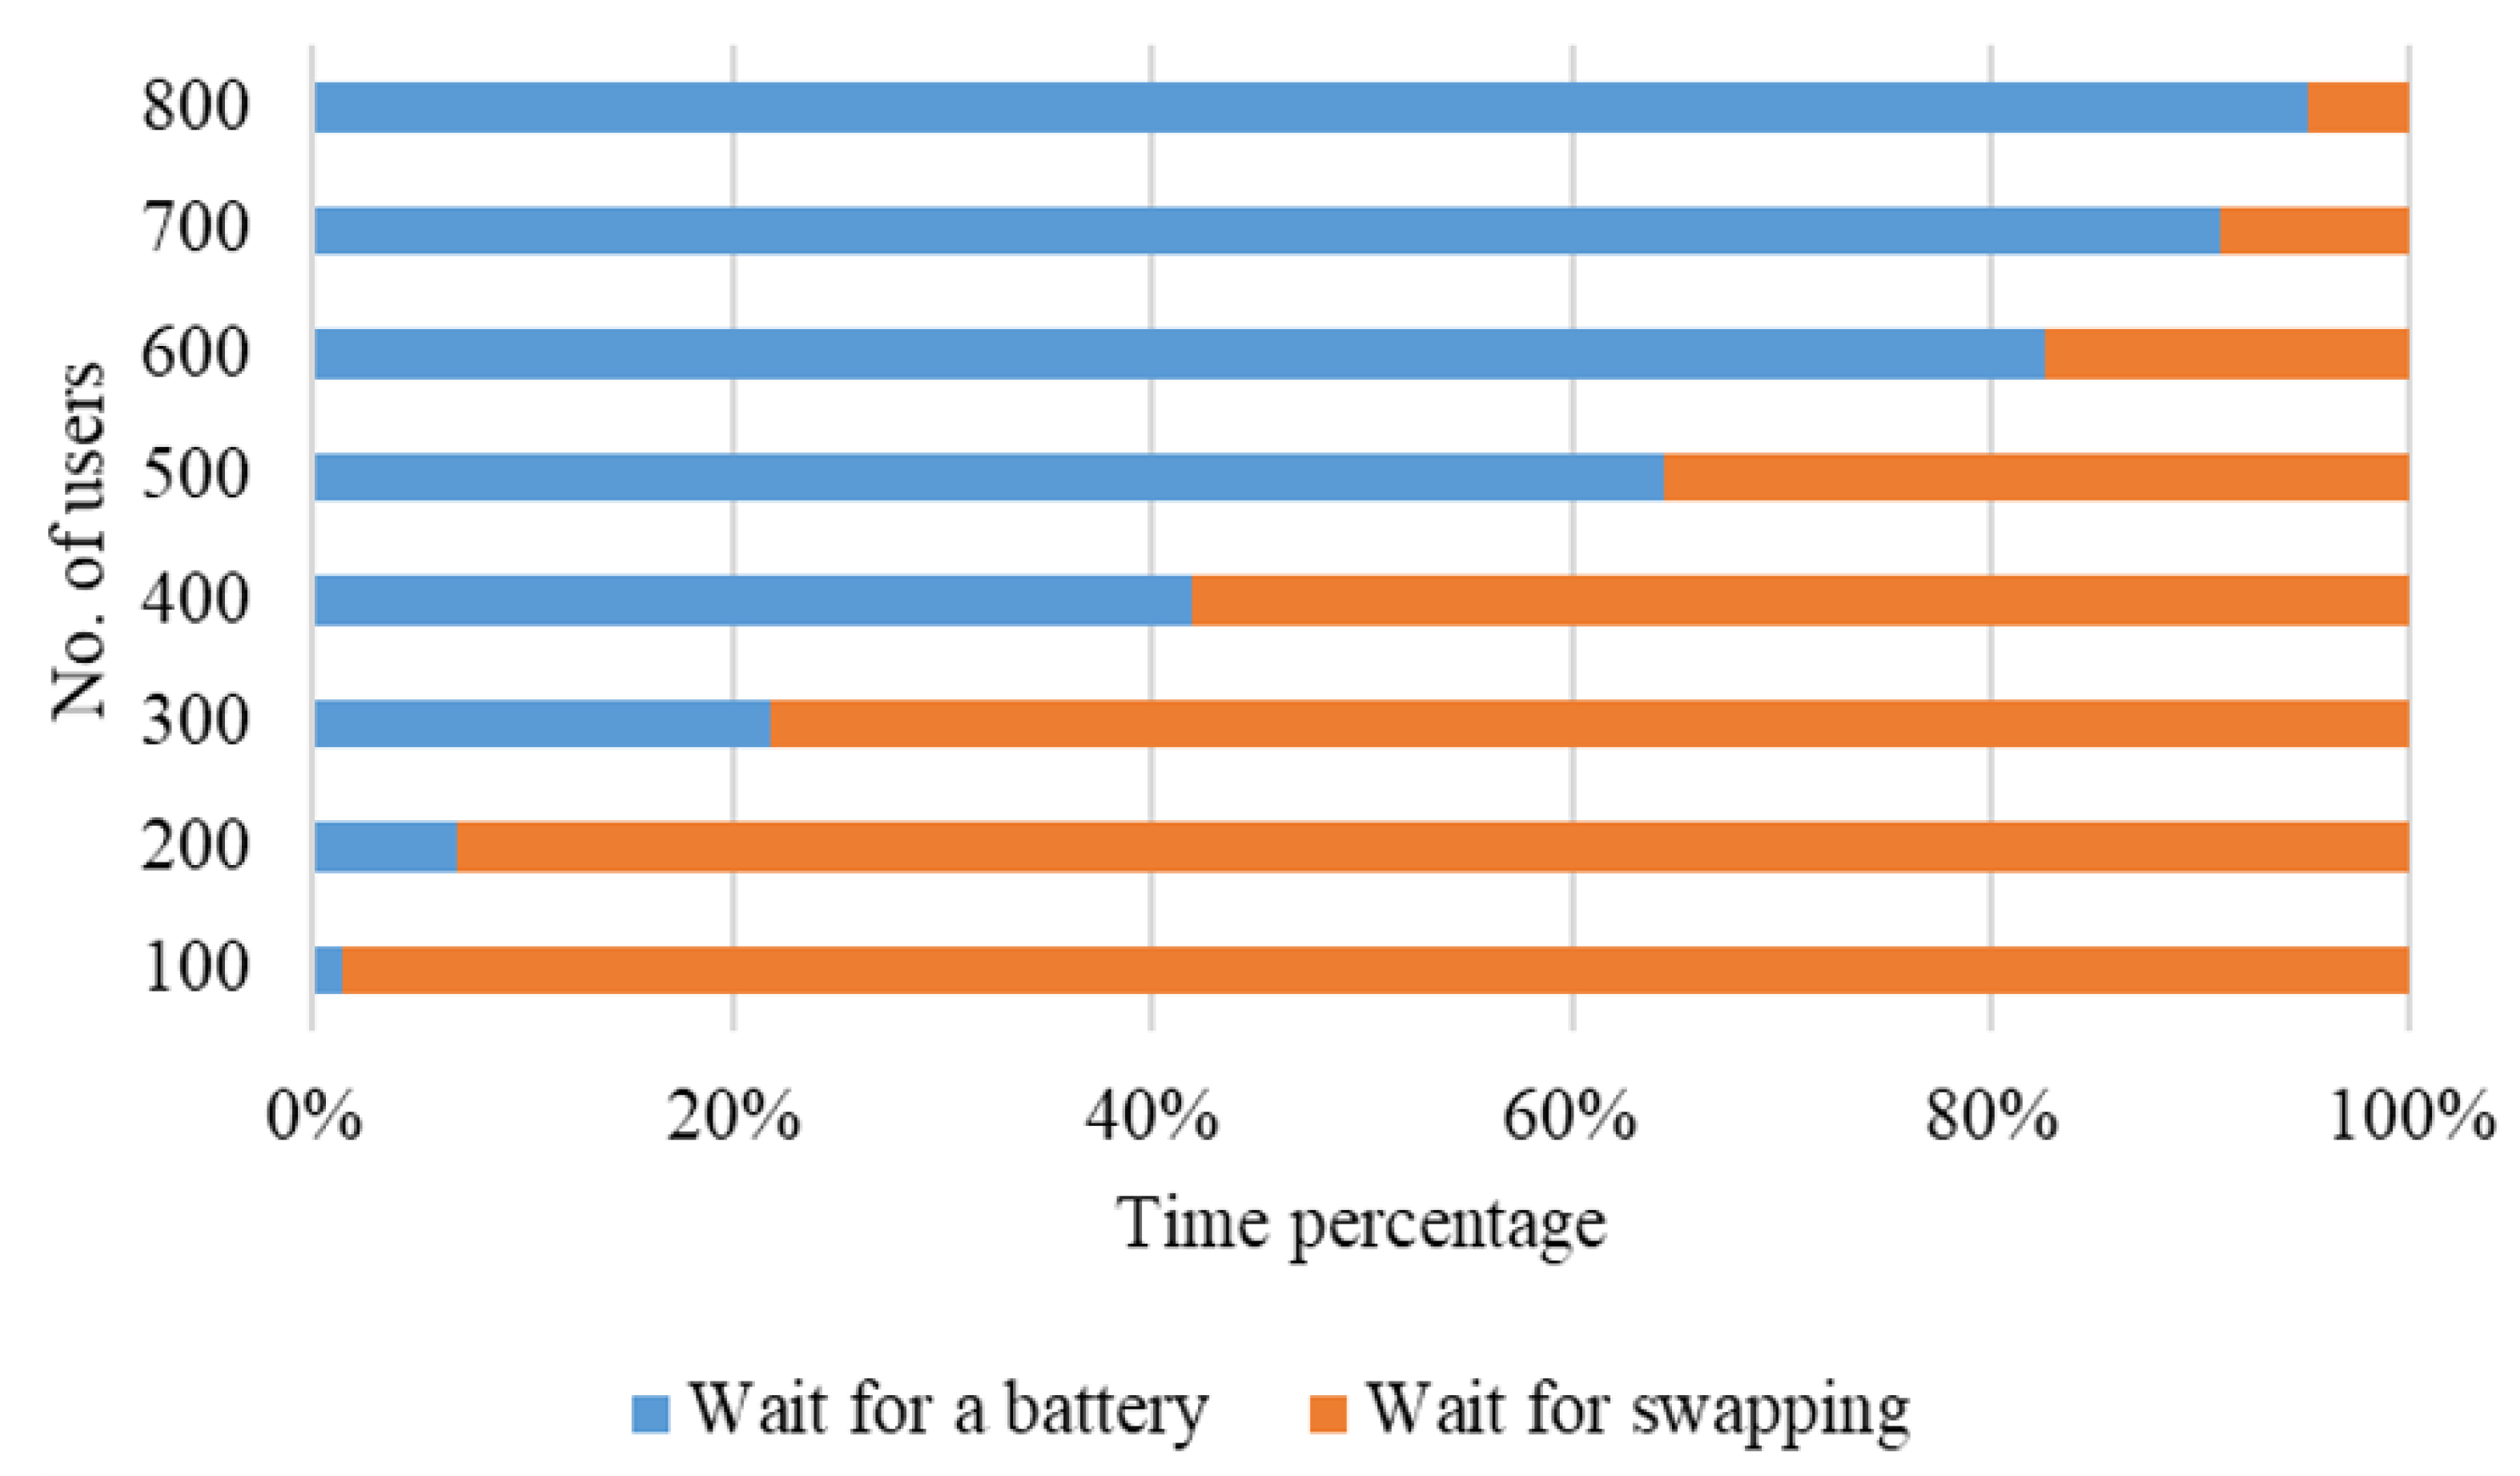
Table 4, in which the waiting time for battery refers to the time interval that the user is in queue while no batteries are available and the waiting time for swapping refers to the time interval that a battery can be assigned to the user but the swapping system is occupied by another user.
Compared with the waiting time for swapping, we found that the waiting time for battery significantly increases as the number of users grows. These results can also be analyzed by a 100% stacked bar chart in
Figure 8.
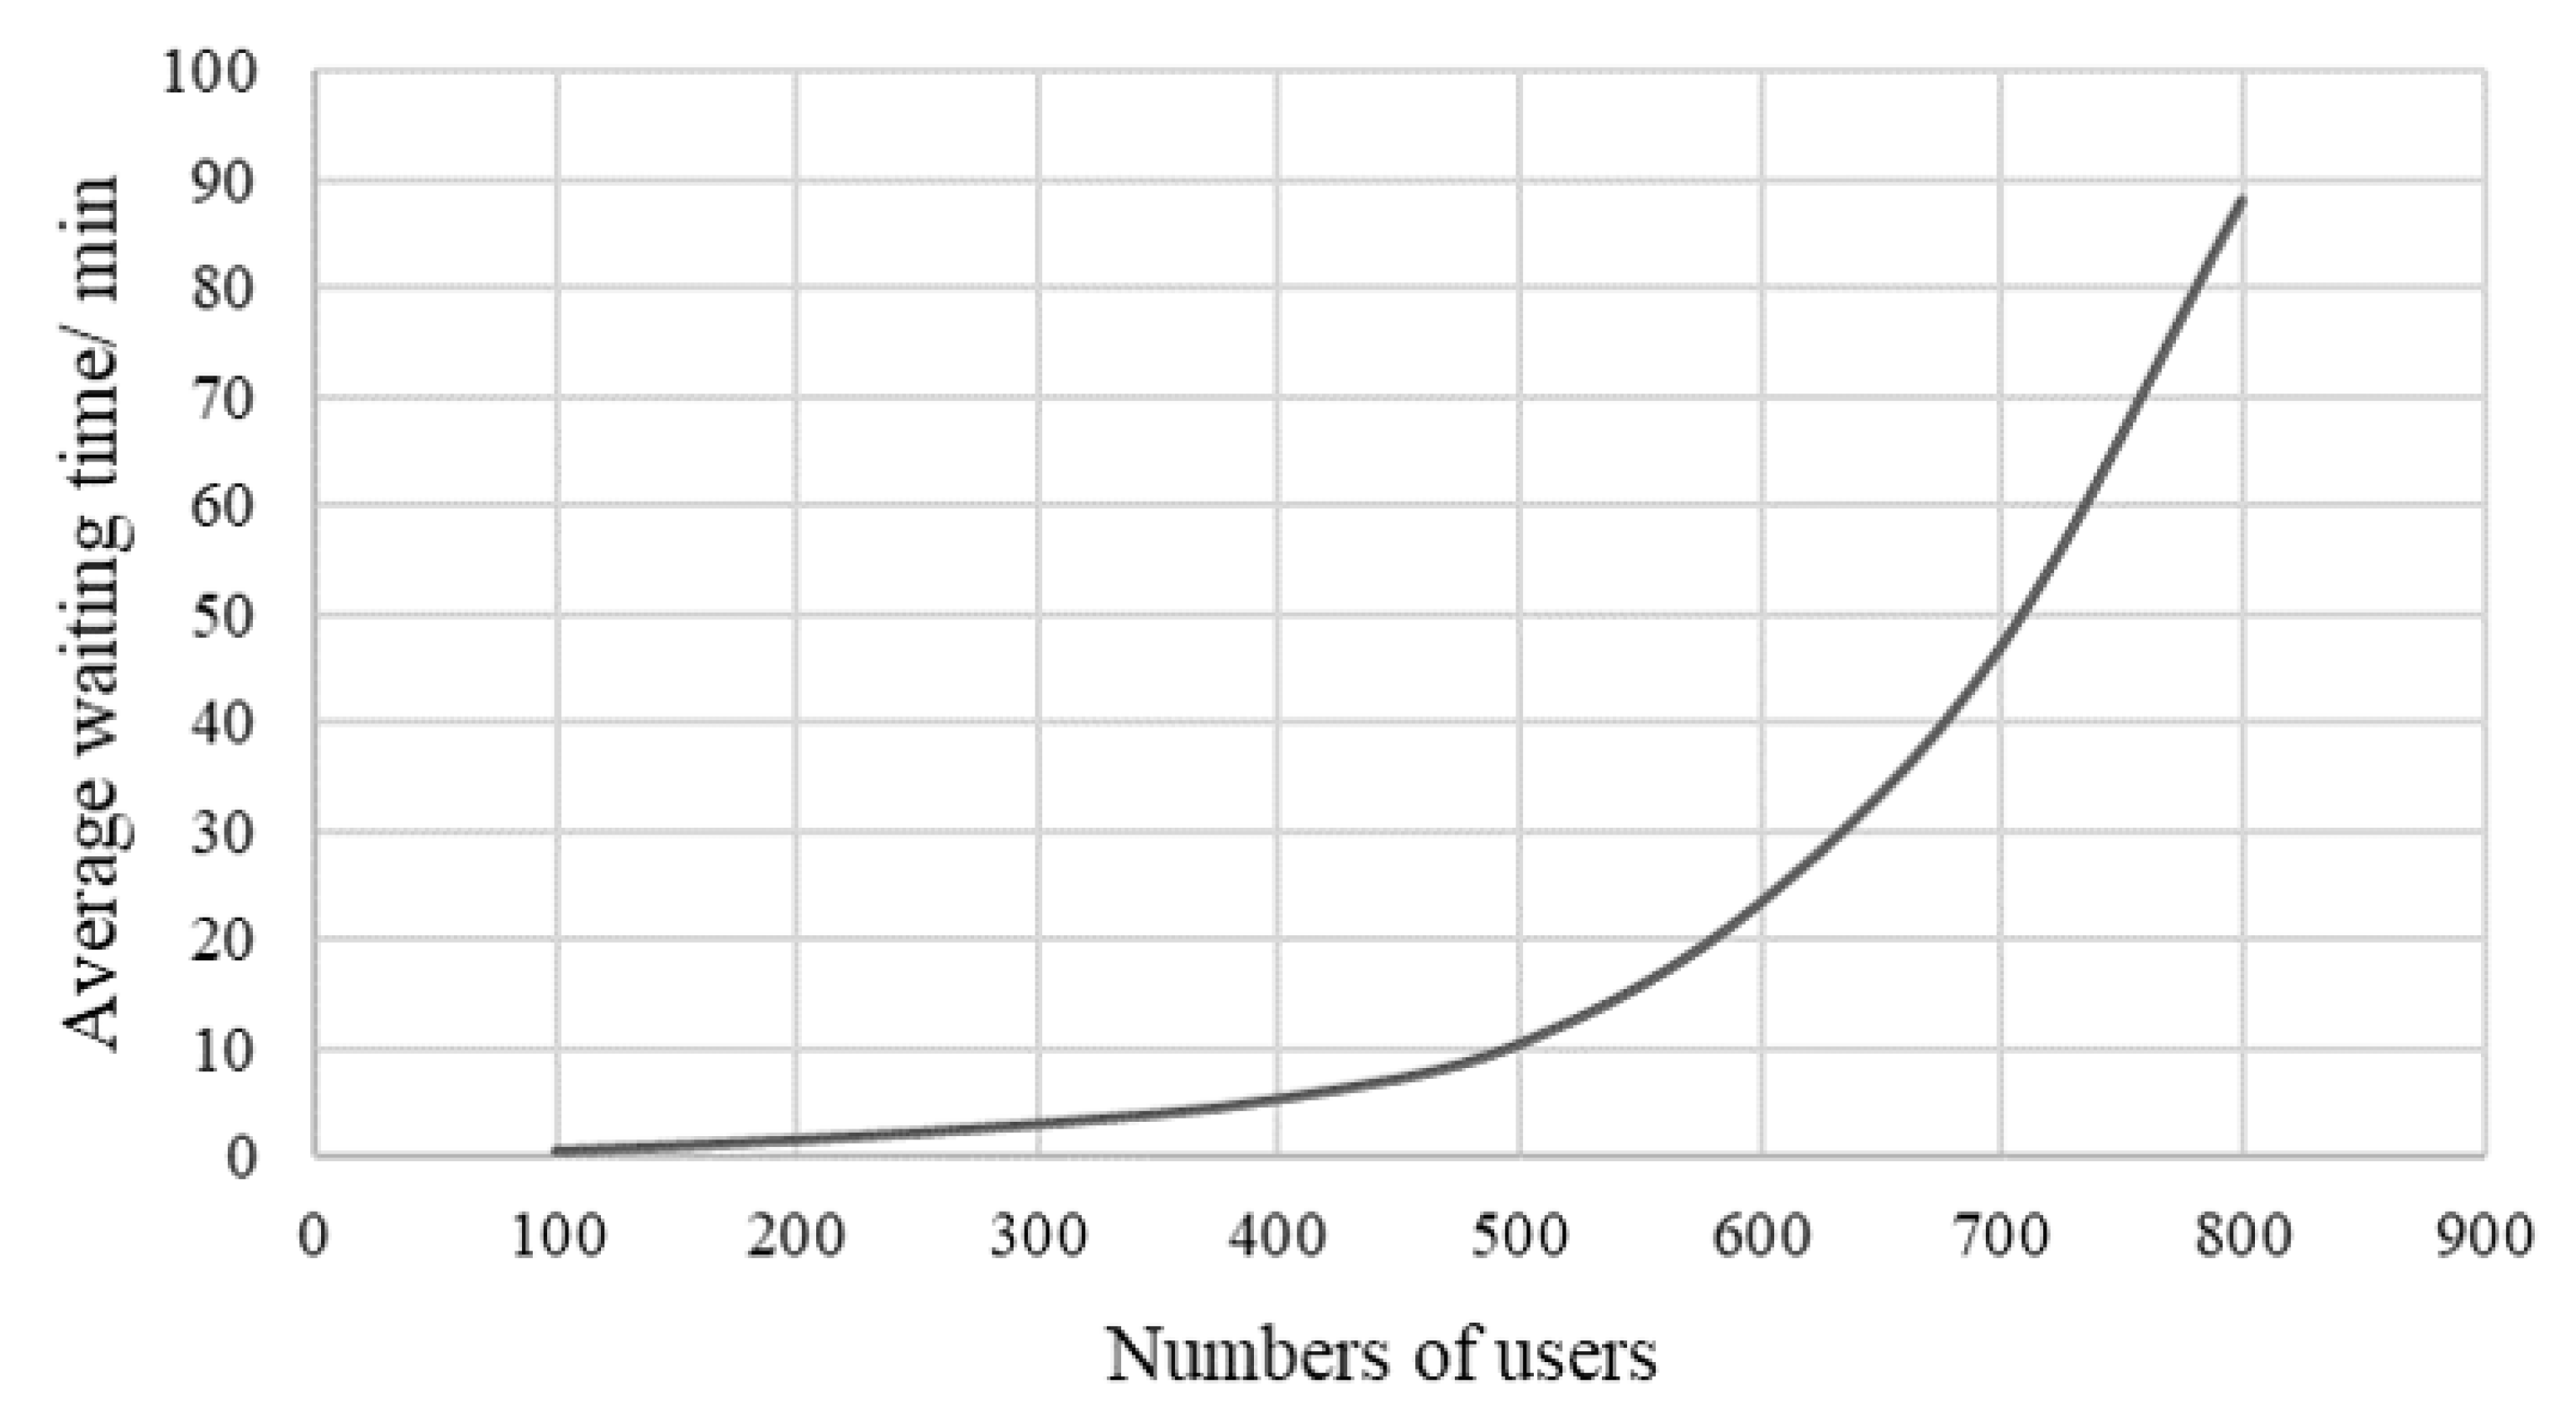
The waiting time for battery suggests that a battery shortage has occurred. As shown in
Figure 8, the waiting time for a battery starts to dominate the total waiting time when the number of users reaches 500. Due to the battery shortage, a sharp rise in the average time appears in
Figure 9.
These results suggest that the theoretical service ability of an NIO BS station is around 500 users, although this number depends on the assumption on the usage frequency of the users. In a normal service system, the customers merely need to wait for their turns, while in the BS service systems they have to wait for the battery charging process as well, which requires the system to have a higher service level. This service level can likely be improved via increasing the number of equipped batteries.
4.3. The Optimal Number of Equipped Batteries
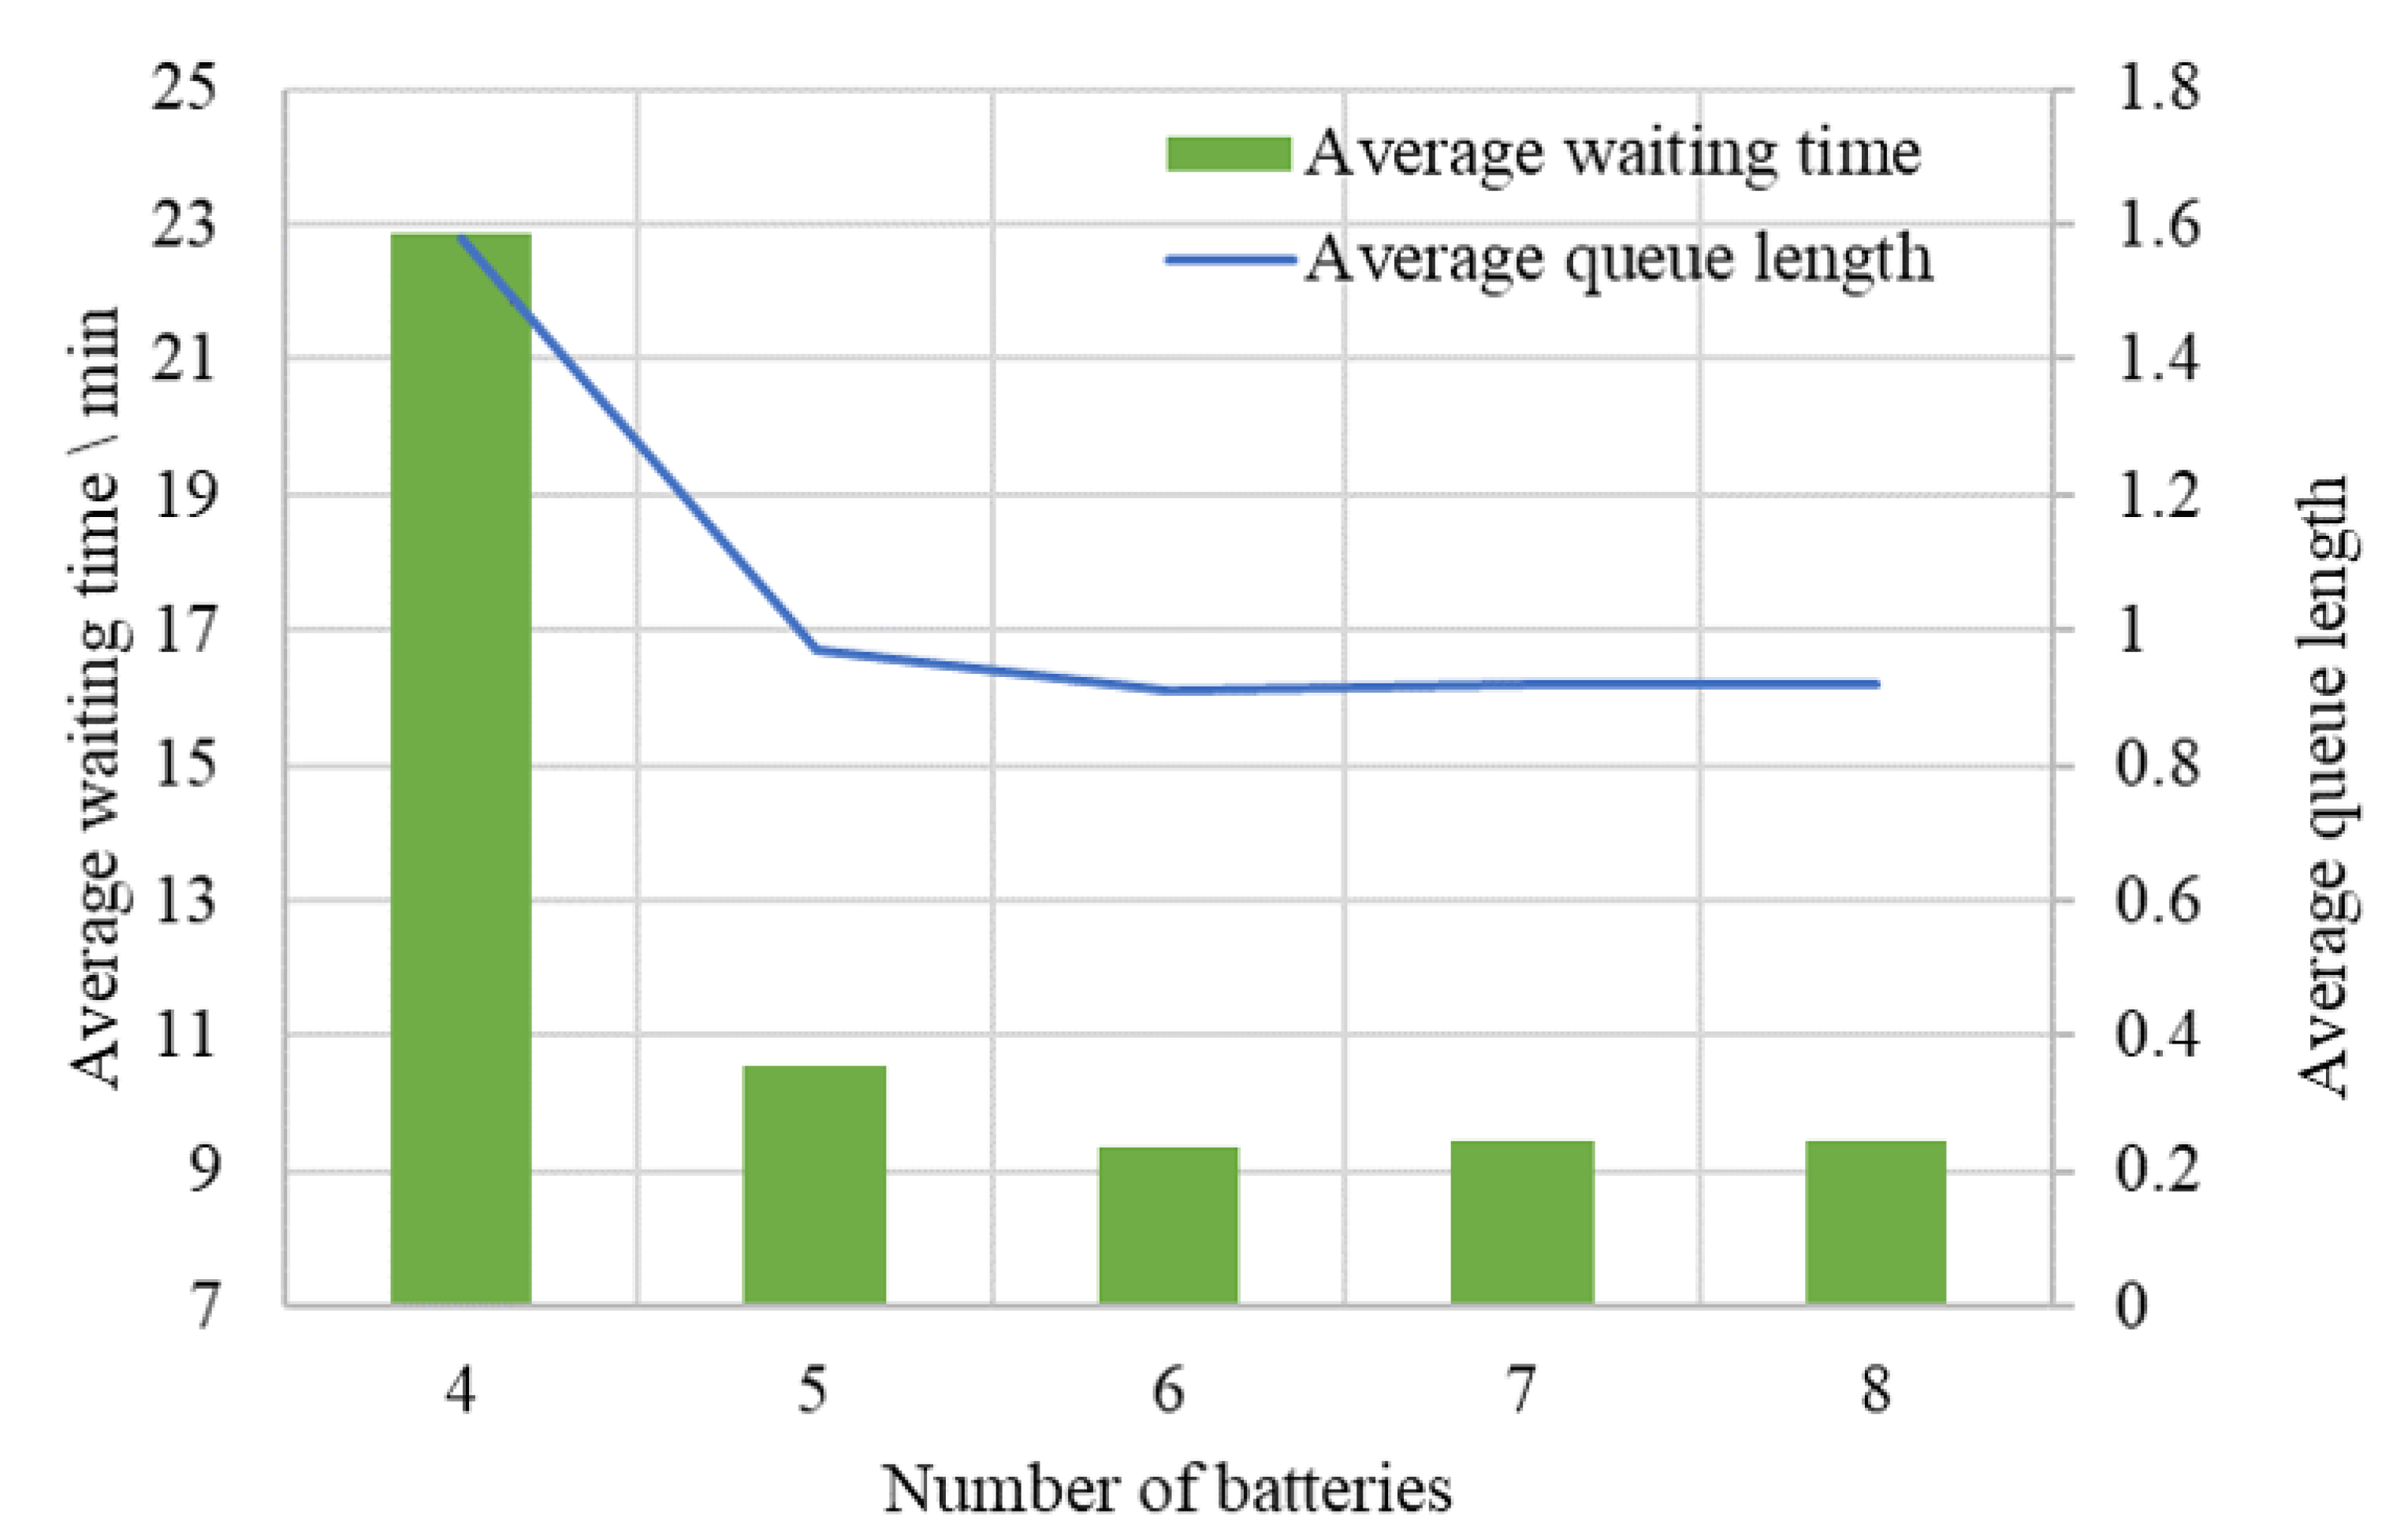
To determine the optimal number of equipped batteries under different user scales, we use the same simulation model to analyze the impact of battery quantity on the associated service level. We first conduct a group of experiments, which include the average waiting time and average queue length, to analyze this effect for the scenario of 500 users and one BS station (shown in
Figure 10).
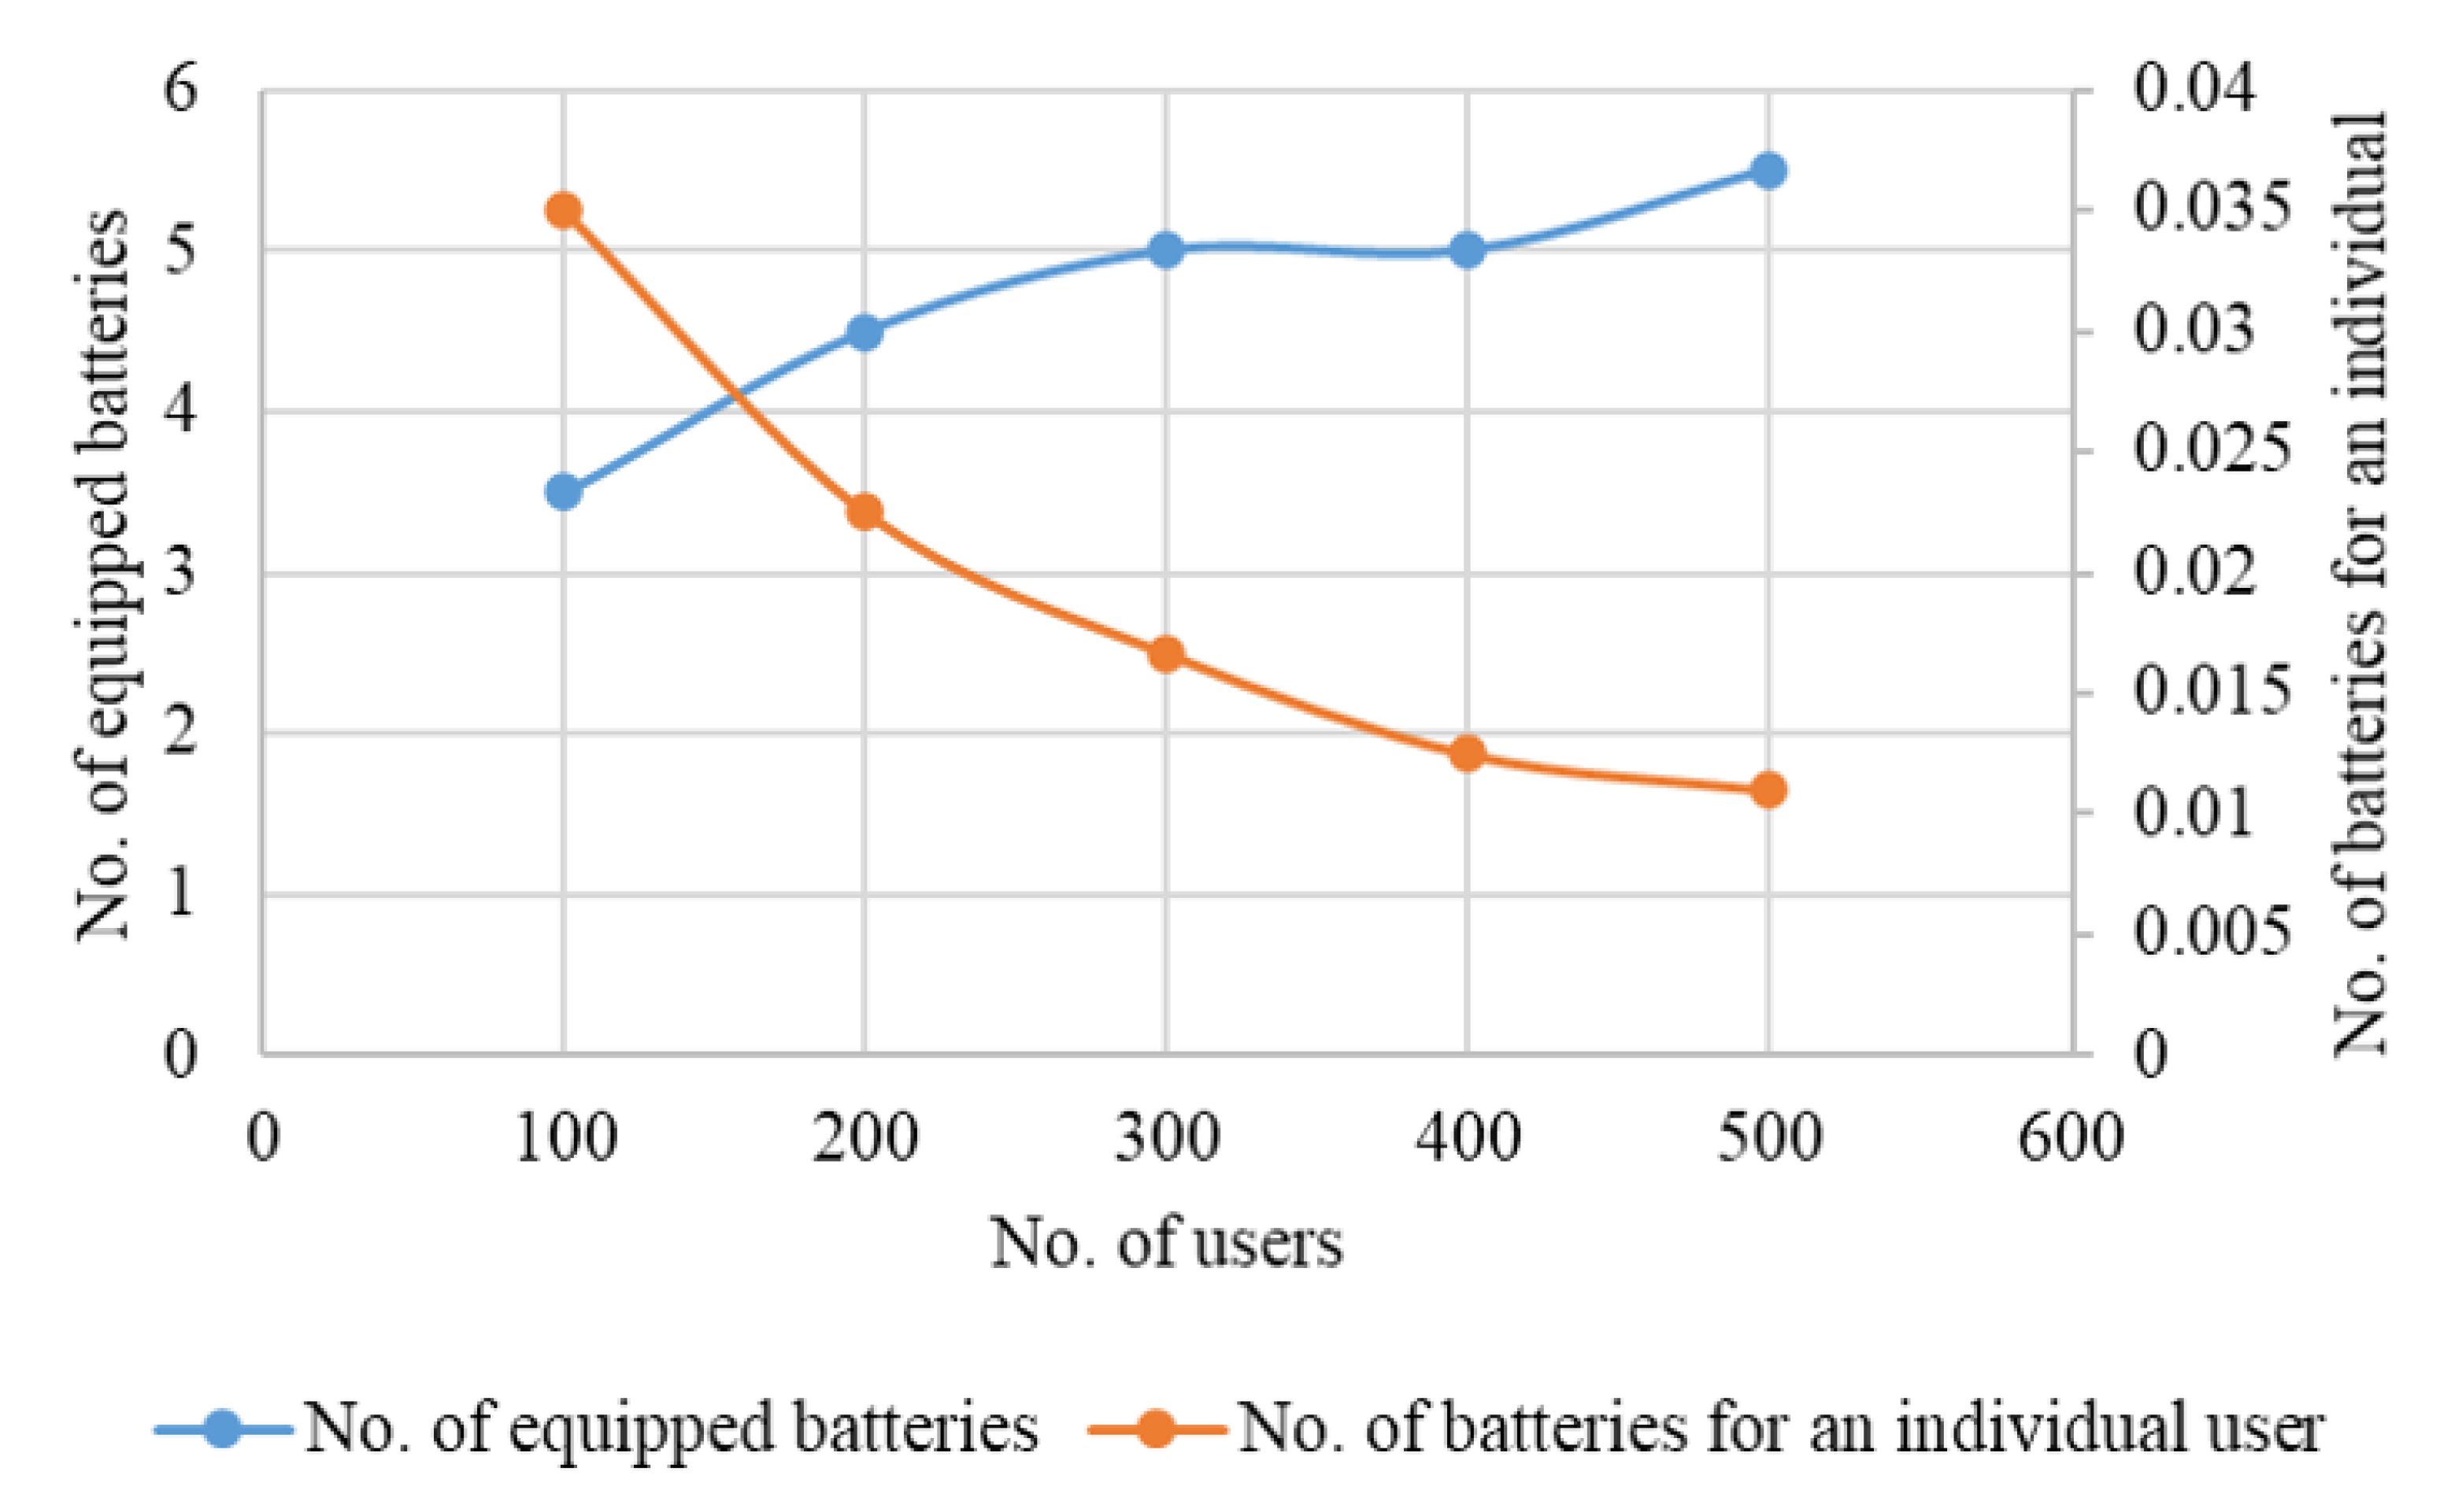
Clearly, the average waiting time and queue length both decrease with the number of batteries. The above results show that the service level generally increases with the number of batteries equipped at the BS station. Nevertheless, the marginal effect of increasing battery quantity will diminish. Usually the general expectation on waiting time is within 10 min, we analyze the number of batteries required at each station under different demand levels (as shown in
Figure 11). For instance, when there are 100 users requiring regular swapping service, the preferred number of batteries is around 3.5.
In this figure, we also calculate the number of batteries per user, i.e., the number of batteries divided by the total number of users. It is interesting to find that, although the total number of batteries increases as the demand increases, the number of batteries per user declines. This phenomenon indicates that there is an economy of scale for the BS service. With the increased demand, the cost of batteries shared by each user decreases. For example, assume the cost of each battery is around RMB 50,000, 3.5 batteries, or RMB 175,000, are required to satisfy 100 users (or RMB 1750 per user). When the user scale increases to 500, the shared cost per user decreases to only RMB 55 per user.
It is noted that the above costs do not include the capital investment of the construction of BS stations. Currently, NIO company provides the BS service for free but charge a premium price of its EVs in the market. Such costs in BS service will ultimately be included in the price to customers. Therefore, the customer scale is the key factor that affects the viability of the BS service.
4.4. The Impact of Station Number in a Region
With limited investment amount, the company needs to determine the optimal number of BS stations in a particular region, e.g., a city. Consider multiple BS stations in an area, potential EV users may choose to access the nearest one. Therefore, the users always want to minimize the total time spent, including travel time and waiting time. In addition, some EV users may not use the BS service at all. Therefore, the problem faced by the company is to maximize the utilities of BS service.
In this section, the proposed simulation model is expanded to consider customers’ choice behavior in the network. The optimal design strategy of the BS network is discussed. As the user distribution in a city is generally unknown, the analysis is made in a circle area with evenly distributed users. According to an online database, Souche (
https://zhiyun.souche.com/dataQuery), (accessed on 15 January 2022) there were 4445 NIO EVs in Guangzhou by 2020. The BS stations are mainly located in four districts covering an area of 279.63 square kilometres. Therefore, as the prospective users in this study, we assume that 5000 users are evenly distributed in the circle area with a radius of 10 km. Further, the coordinate pairs of users are generated randomly based on the uniform distribution (shown in
Figure 12). In addition, the following assumptions are adopted.
The number of prospective users in a certain area is fixed.
Prospective users are evenly distributed in the circle with fixed radius.
The circle can be divided into several identical fan-shaped areas, the specific number equals the number of stations, and stations are located at the centroid of each fan-shaped area.
Batteries are evenly distributed in each BS station. According to previous analysis, the theoretical service ability of a station with five batteries is around 500 users. Since we assume that there 5000 users, 10 stations with altogether 50 batteries are applicable in this case. Thus, the 50 batteries are assigned to each station as shown in
Table 5, corresponding to different numbers of stations.
Users tend to choose the nearest station with available batteries.
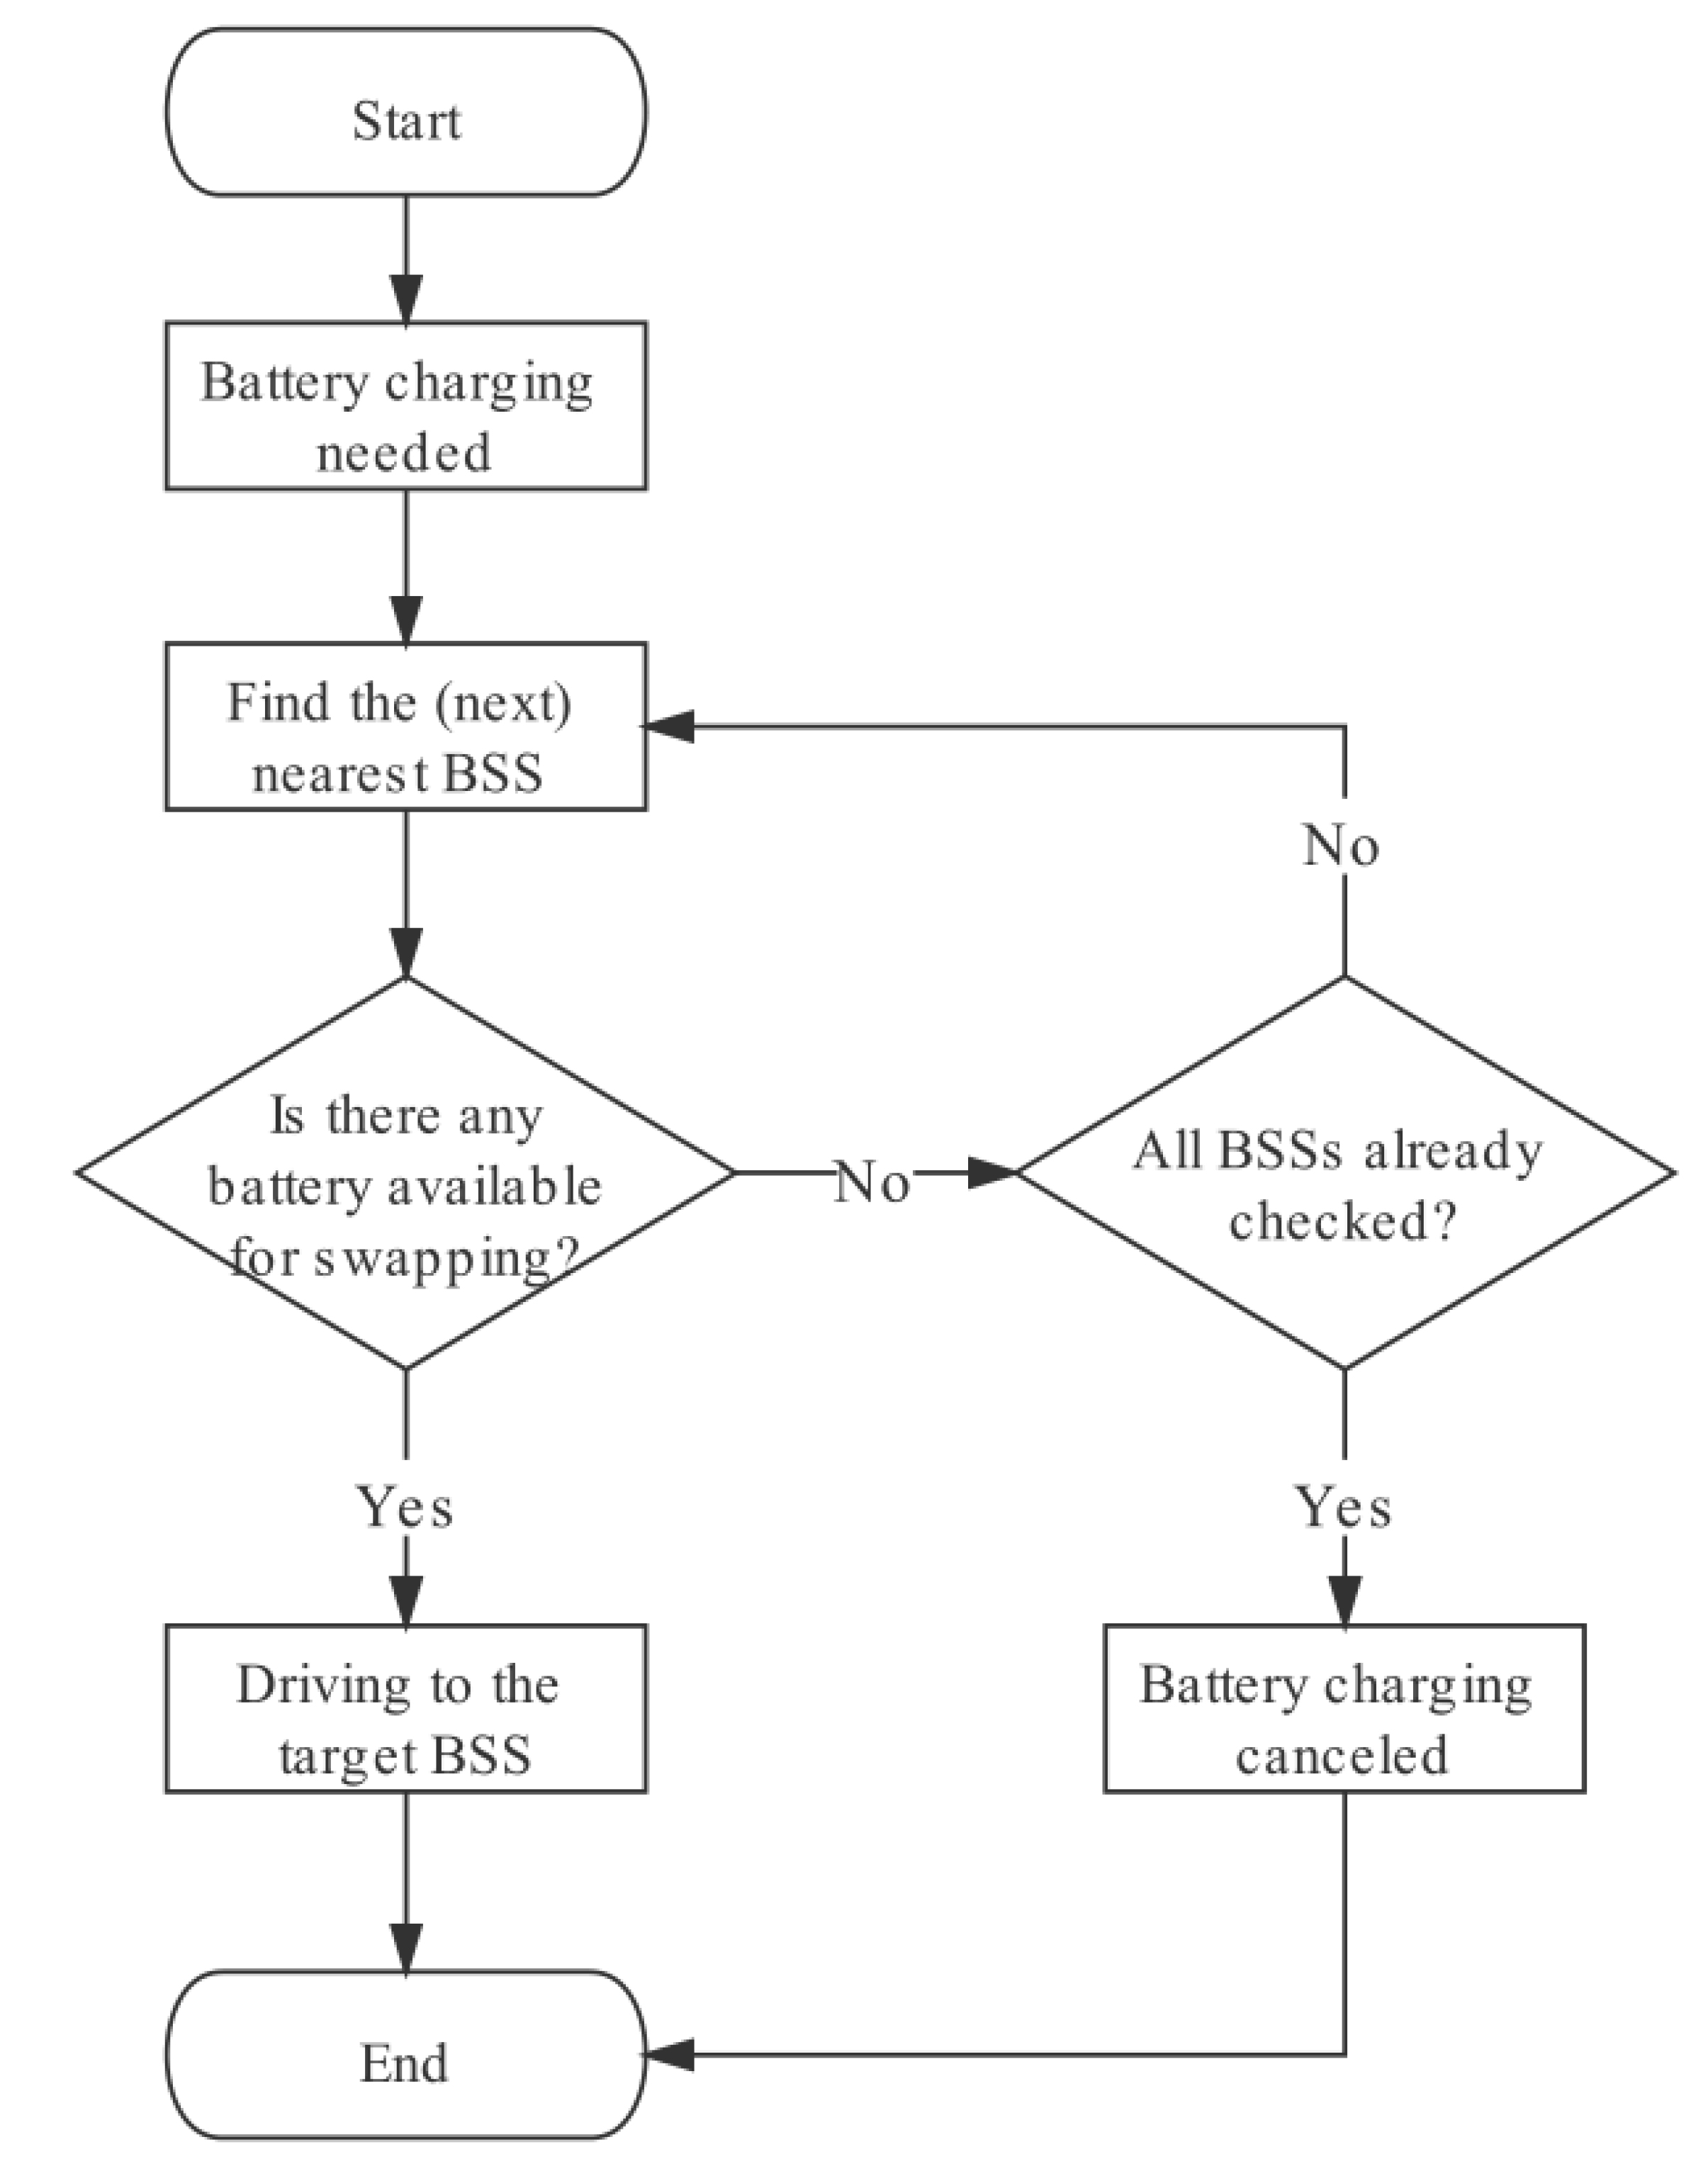
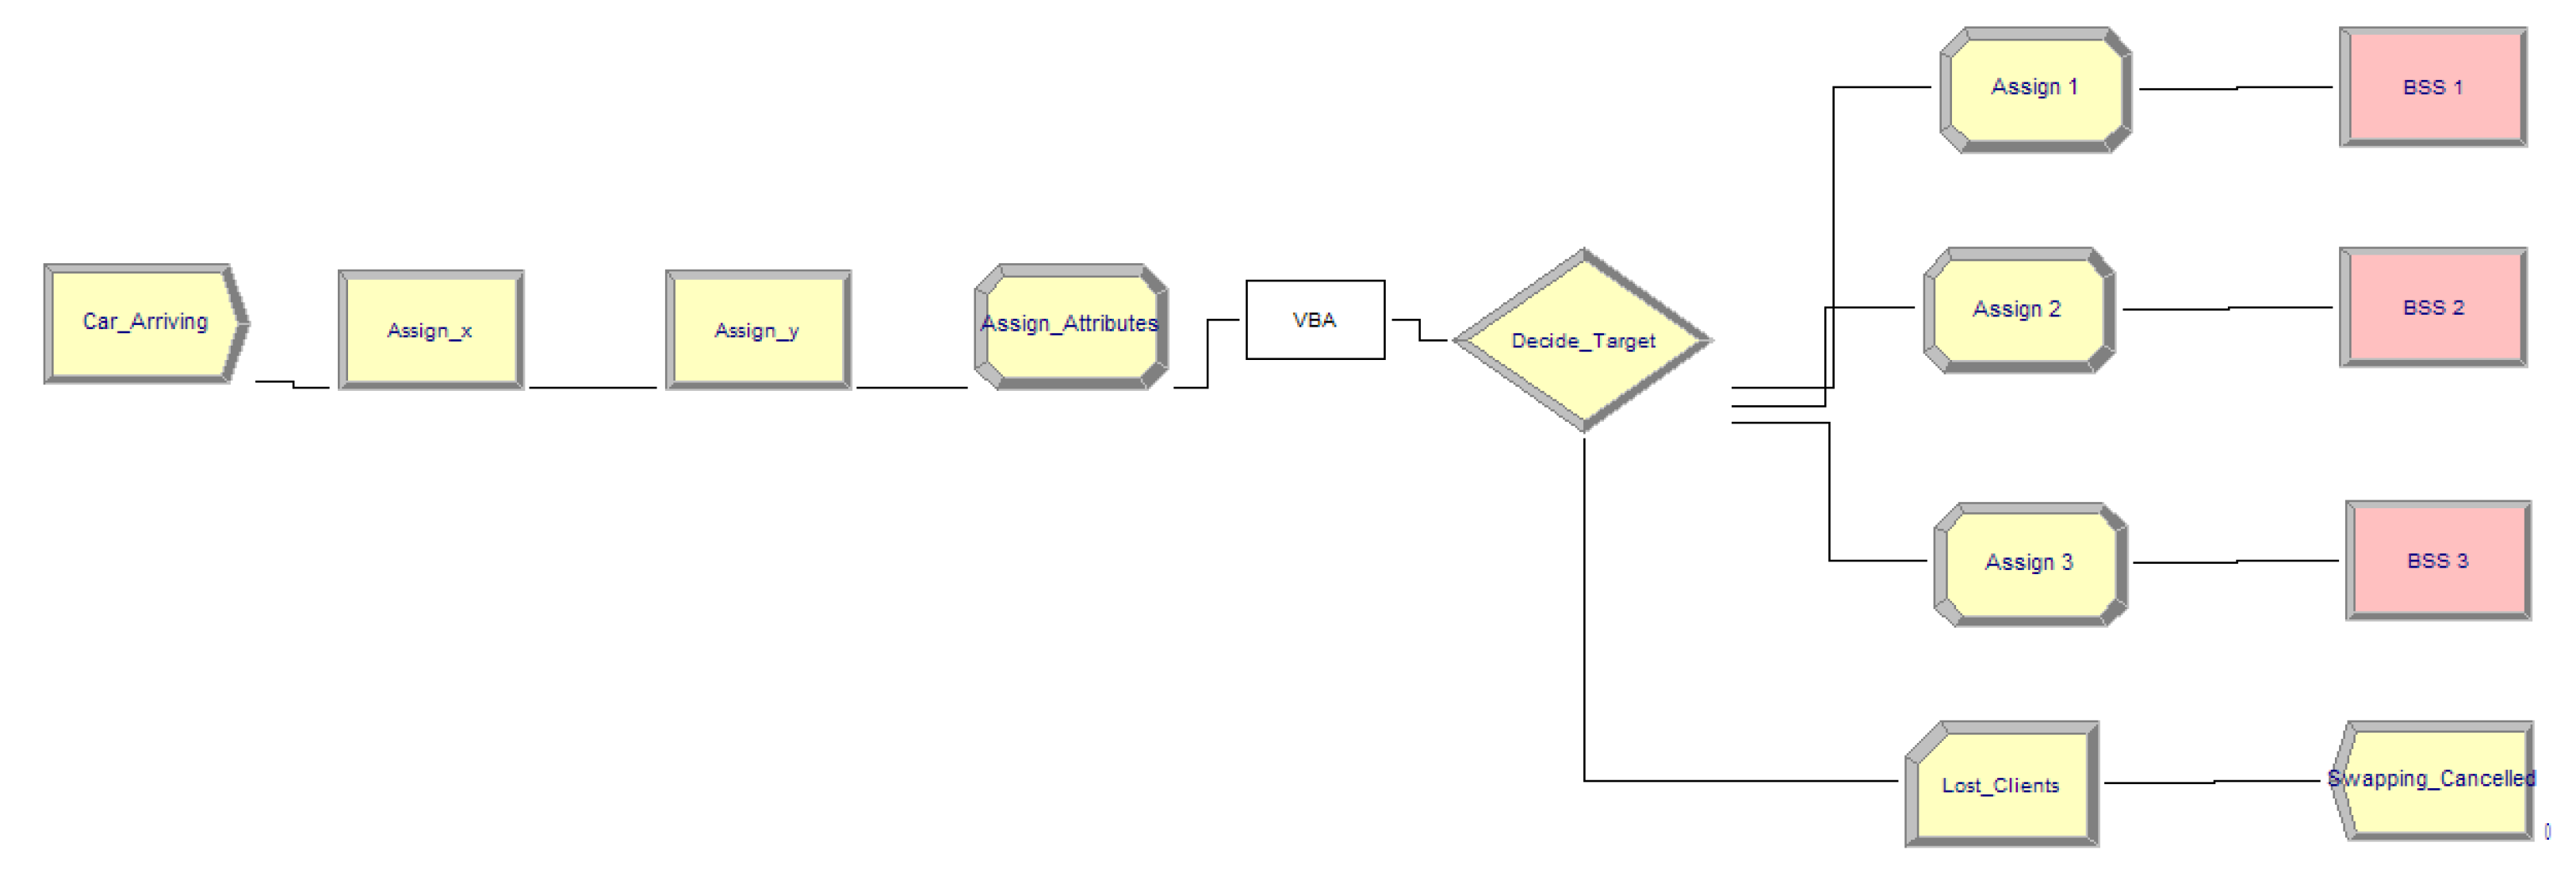
Accordingly, the simulation model is adjusted to simulate the choice behavior of prospective users. The processes of users’ decision-making are shown in
Figure 13.
Before selecting a certain destination, the user first checks the number of fully charged batteries in the nearest station. If no battery is available, it keeps checking the next nearest station until a fully charged battery occurs. If all BS stations are short of fully charged batteries, this customer is defined as a lost client. Then, the revised simulation model can be split into two parts, including user decision making process and BS process. The model of decision-making is shown in
Figure 14.
This is an instance of three BS stations, most of this part is aligned with the previously discussed logic and some adjustments to the model are described as below.
The locations of each station are recorded by coordinates (X_i, Y_i). First, the coordinates (denoted as X_pos and Y_pos) to current EV are assigned to the entity. Apart from assigning SOC and capacity, the distances between current user location and each station (D_i) are calculated. Next, we use a VBA block to realize the decision-making logic, which can find out the nearest BS station with available batteries and return the target station of an EV. According the target station, the distance between the user location and the target is calculated and the EV follows a specified route, named BSS i. Last, for those EVs that cannot find a station with an acceptable queue length, the user abandons the service and a variable, Lost_Clients, records how many customers have cancelled their services.
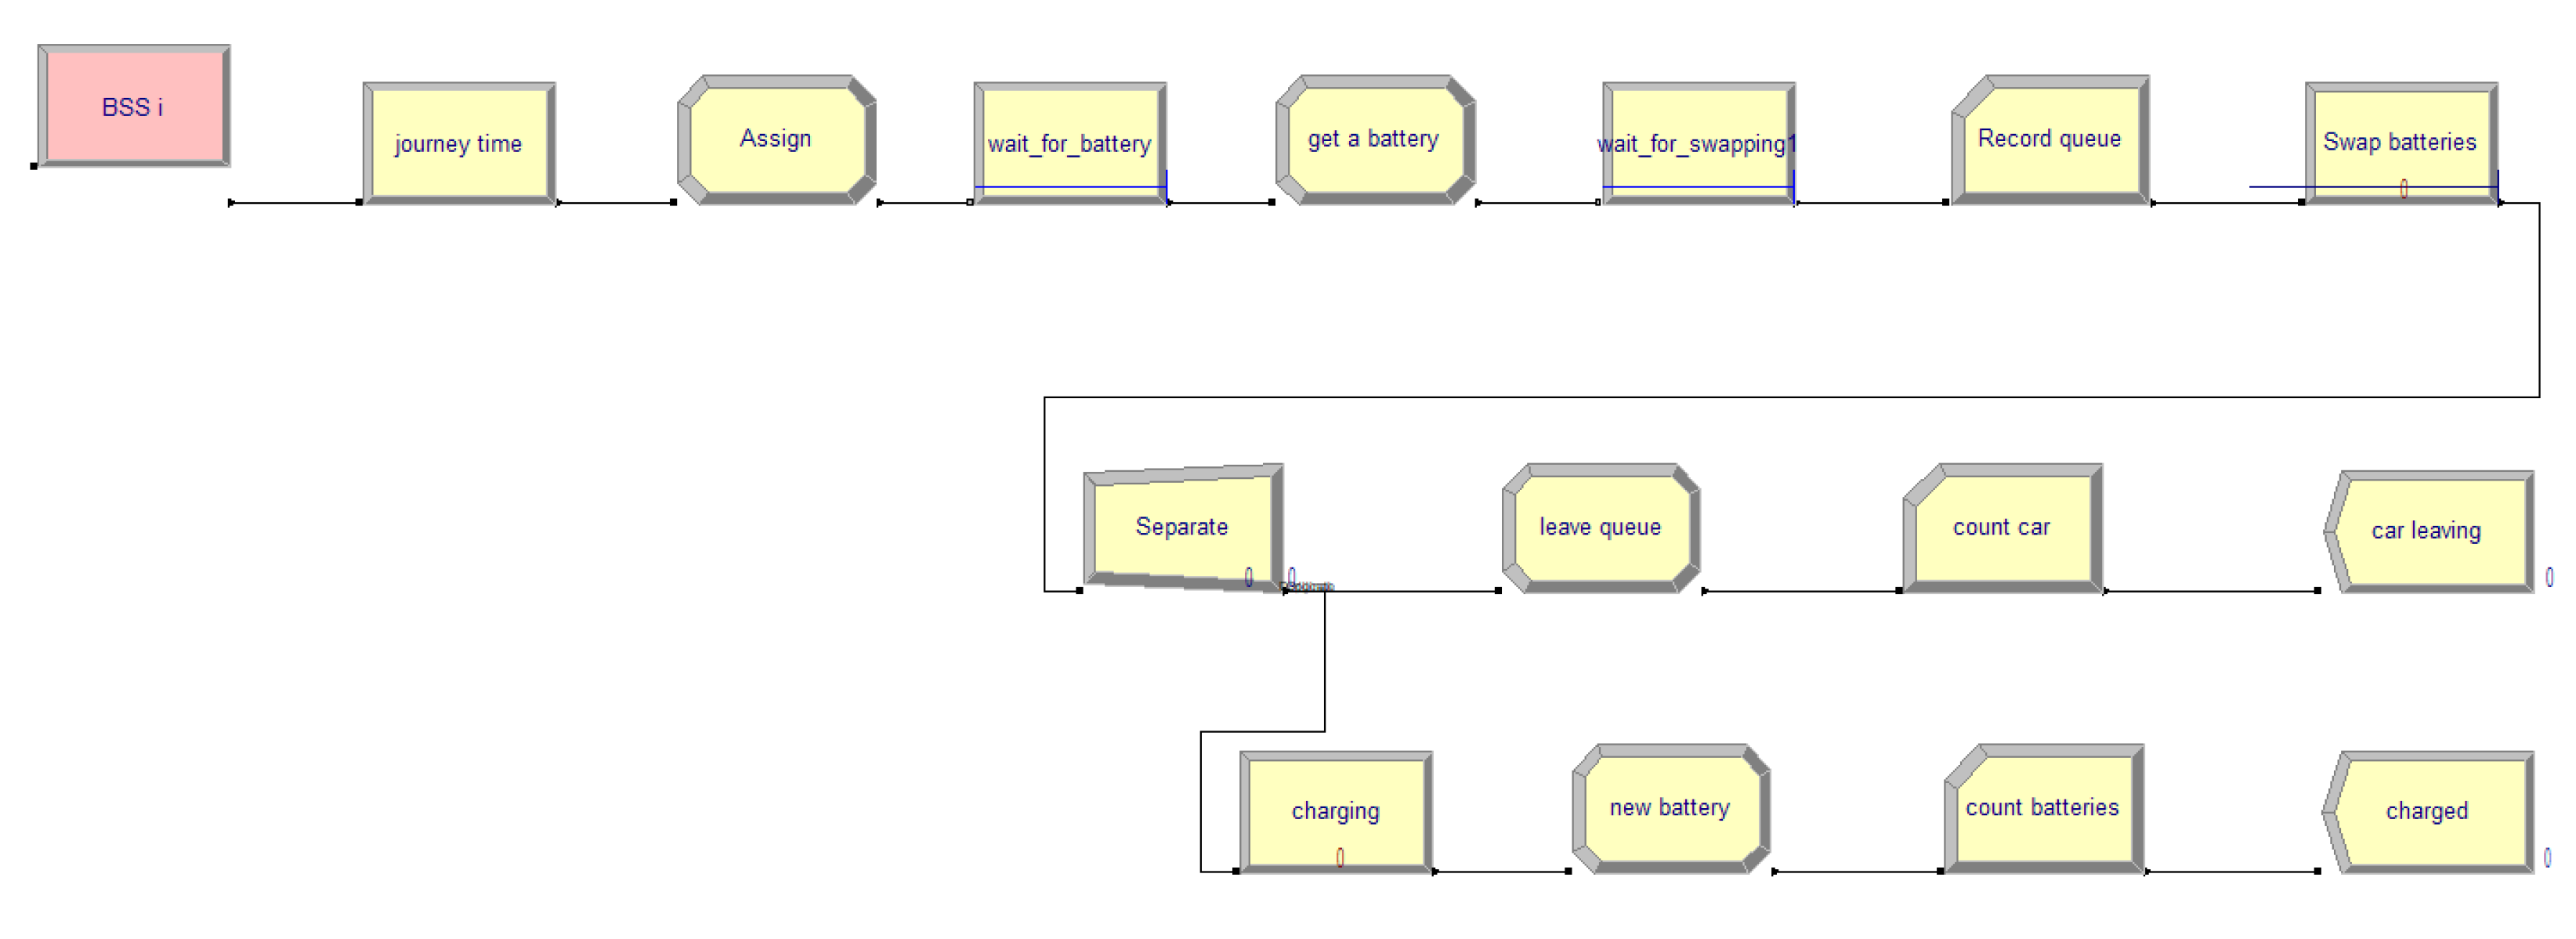
In addition to the process in a BS station, the model considers the journey time between the user position and the station. The whole process is shown in
Figure 15.
Notice that there are different two blocks compared to the original model. First, BSS i is a station block linking with a route block. Next, Journey_Time realizes the function delaying a certain time to simulate journey time. We assume that the trave time of the EV in the city area is 30 km/h; hence, we have
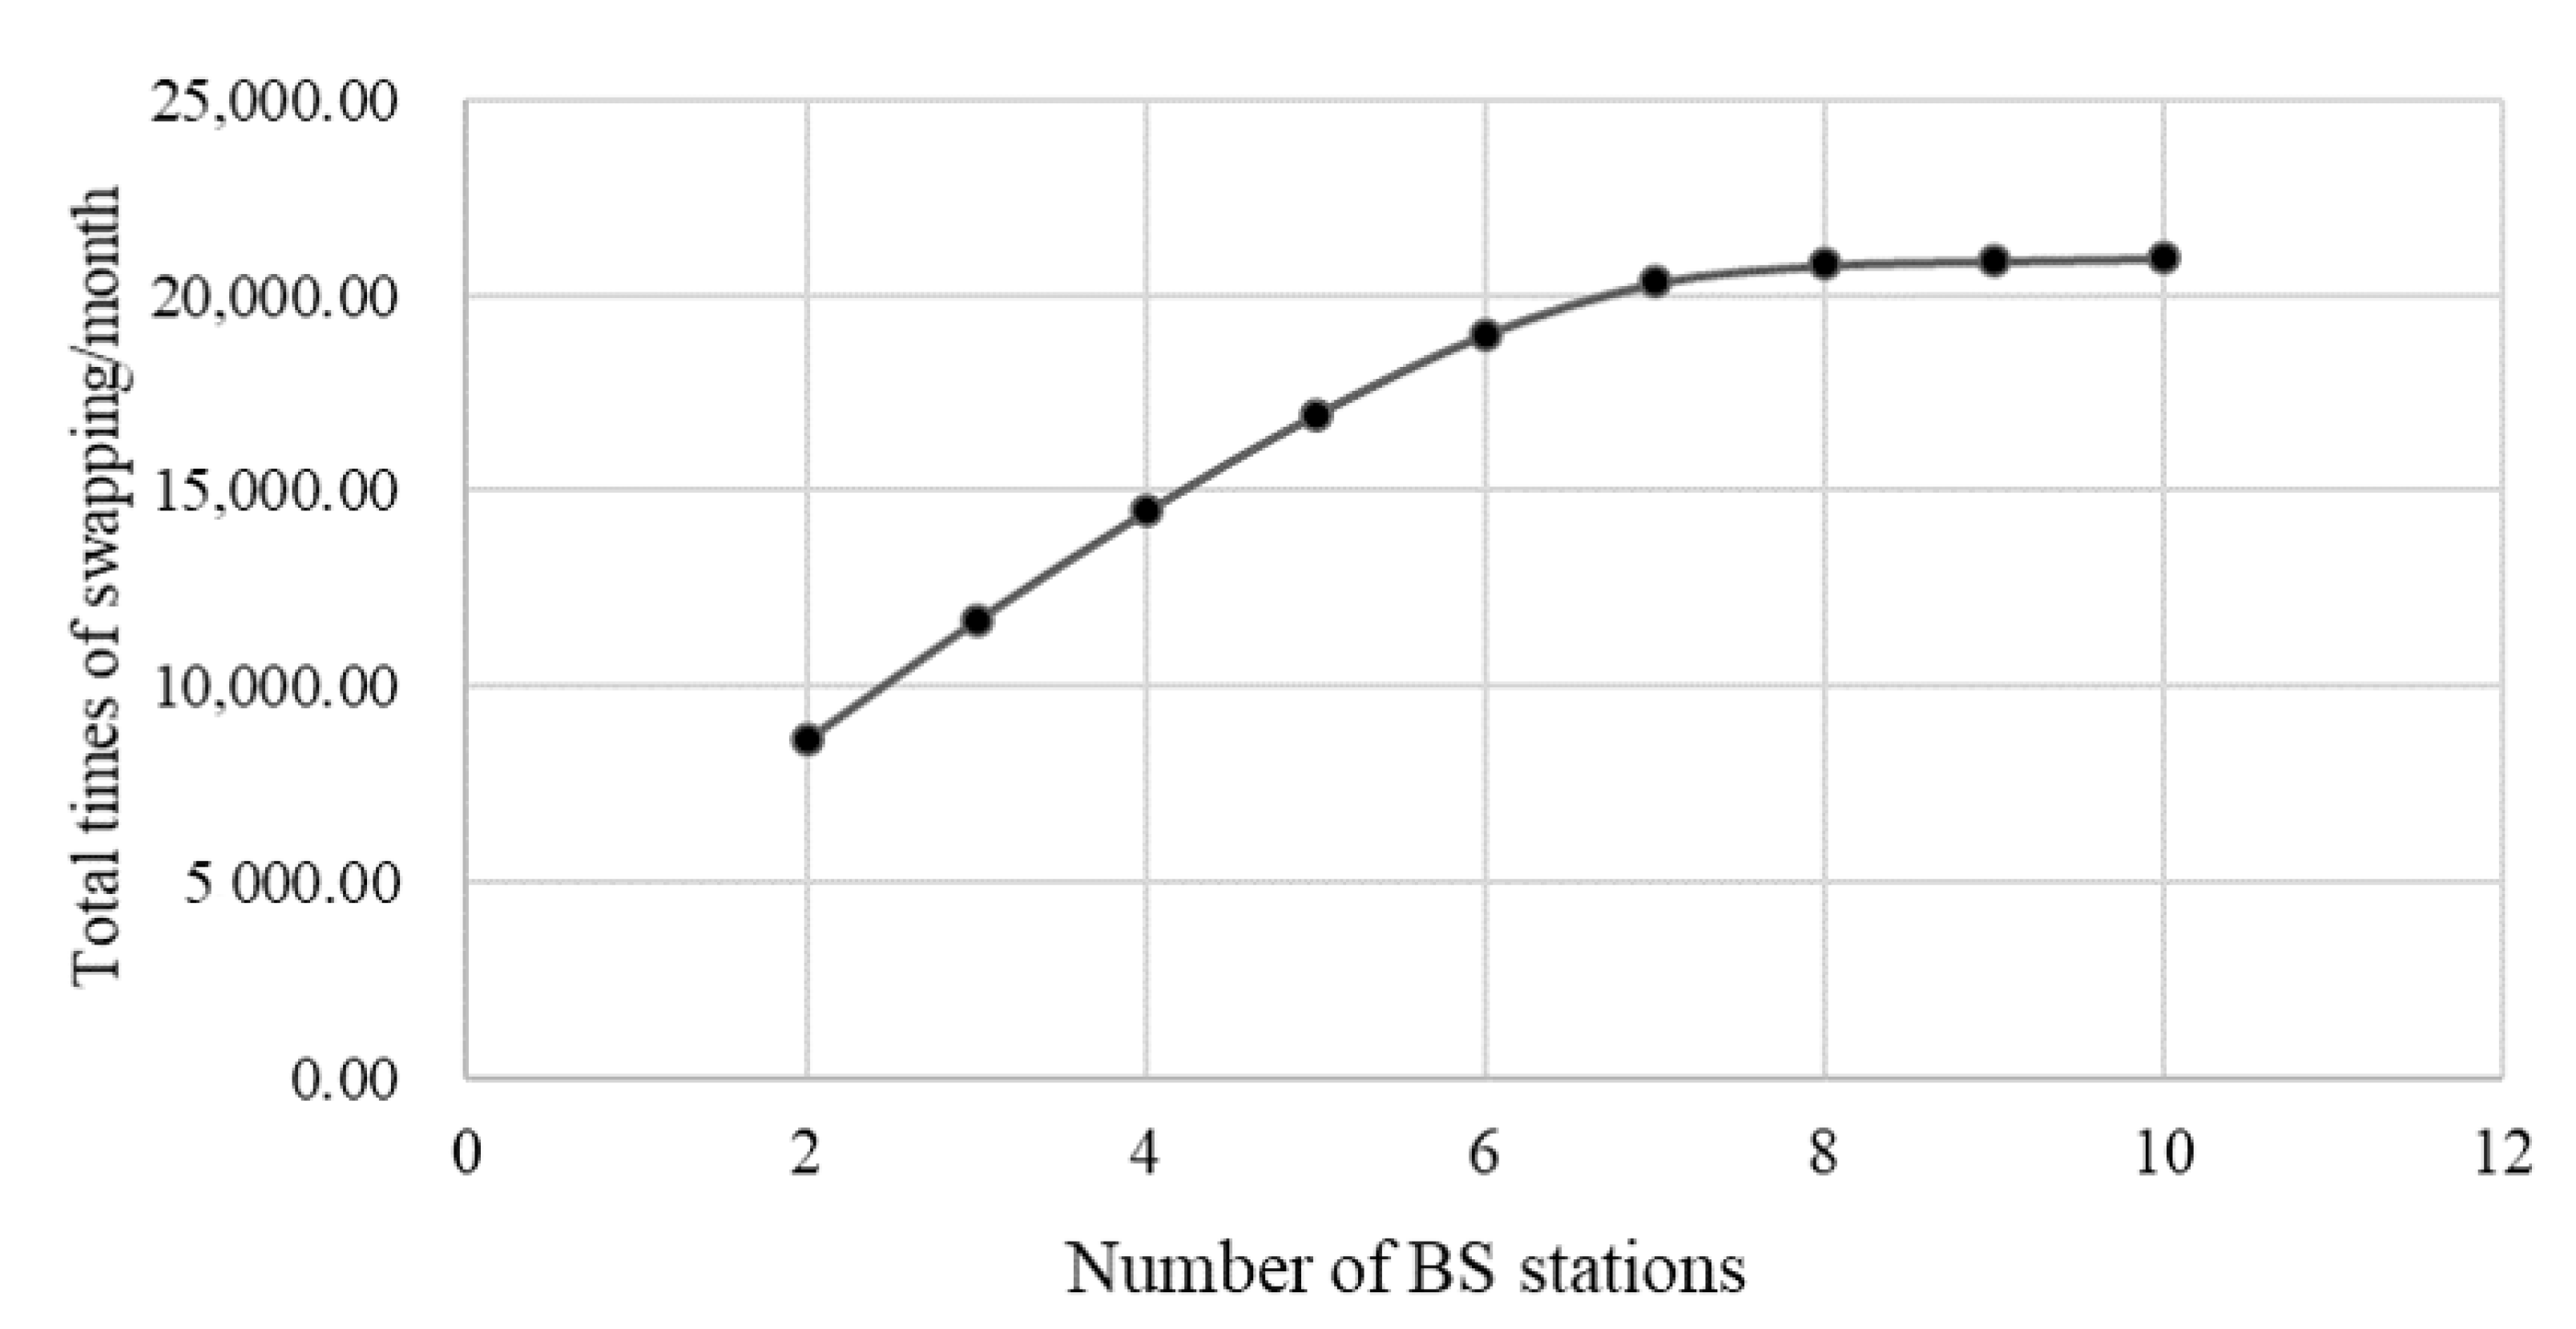
In particular, we should view multiple BS stations as a system to analyse the effects of BS network layout. We quantify the numbers of swapping service that the entire network can attract based on different number of stations, as shown in
Figure 16.
In
Figure 16, the total number of swapping represents the total number of BS service accessed in the network in a month, which is the total attracted demand of the system. The results show that the total demand increases significantly when the station number changes from 2 to 7. However, the additional demand introduced by the eighth station is just marginal. It indicates that, for an area with given number of prospective users, the benefit of network scale diminishes and there exists an optimal number of stations for the BS service.
4.5. Econometric Analysis of BS Network
With limited investment, there will be a trade-off between the number of stations and the capacity of each station, which will affect the travel time and the waiting time, respectively. Accordingly, the planning of BS network can take two strategies, i.e., the centralization strategy (with fewer stations and more batteries at each station) and the decentralisation strategy (with more stations and fewer batteries at each station).
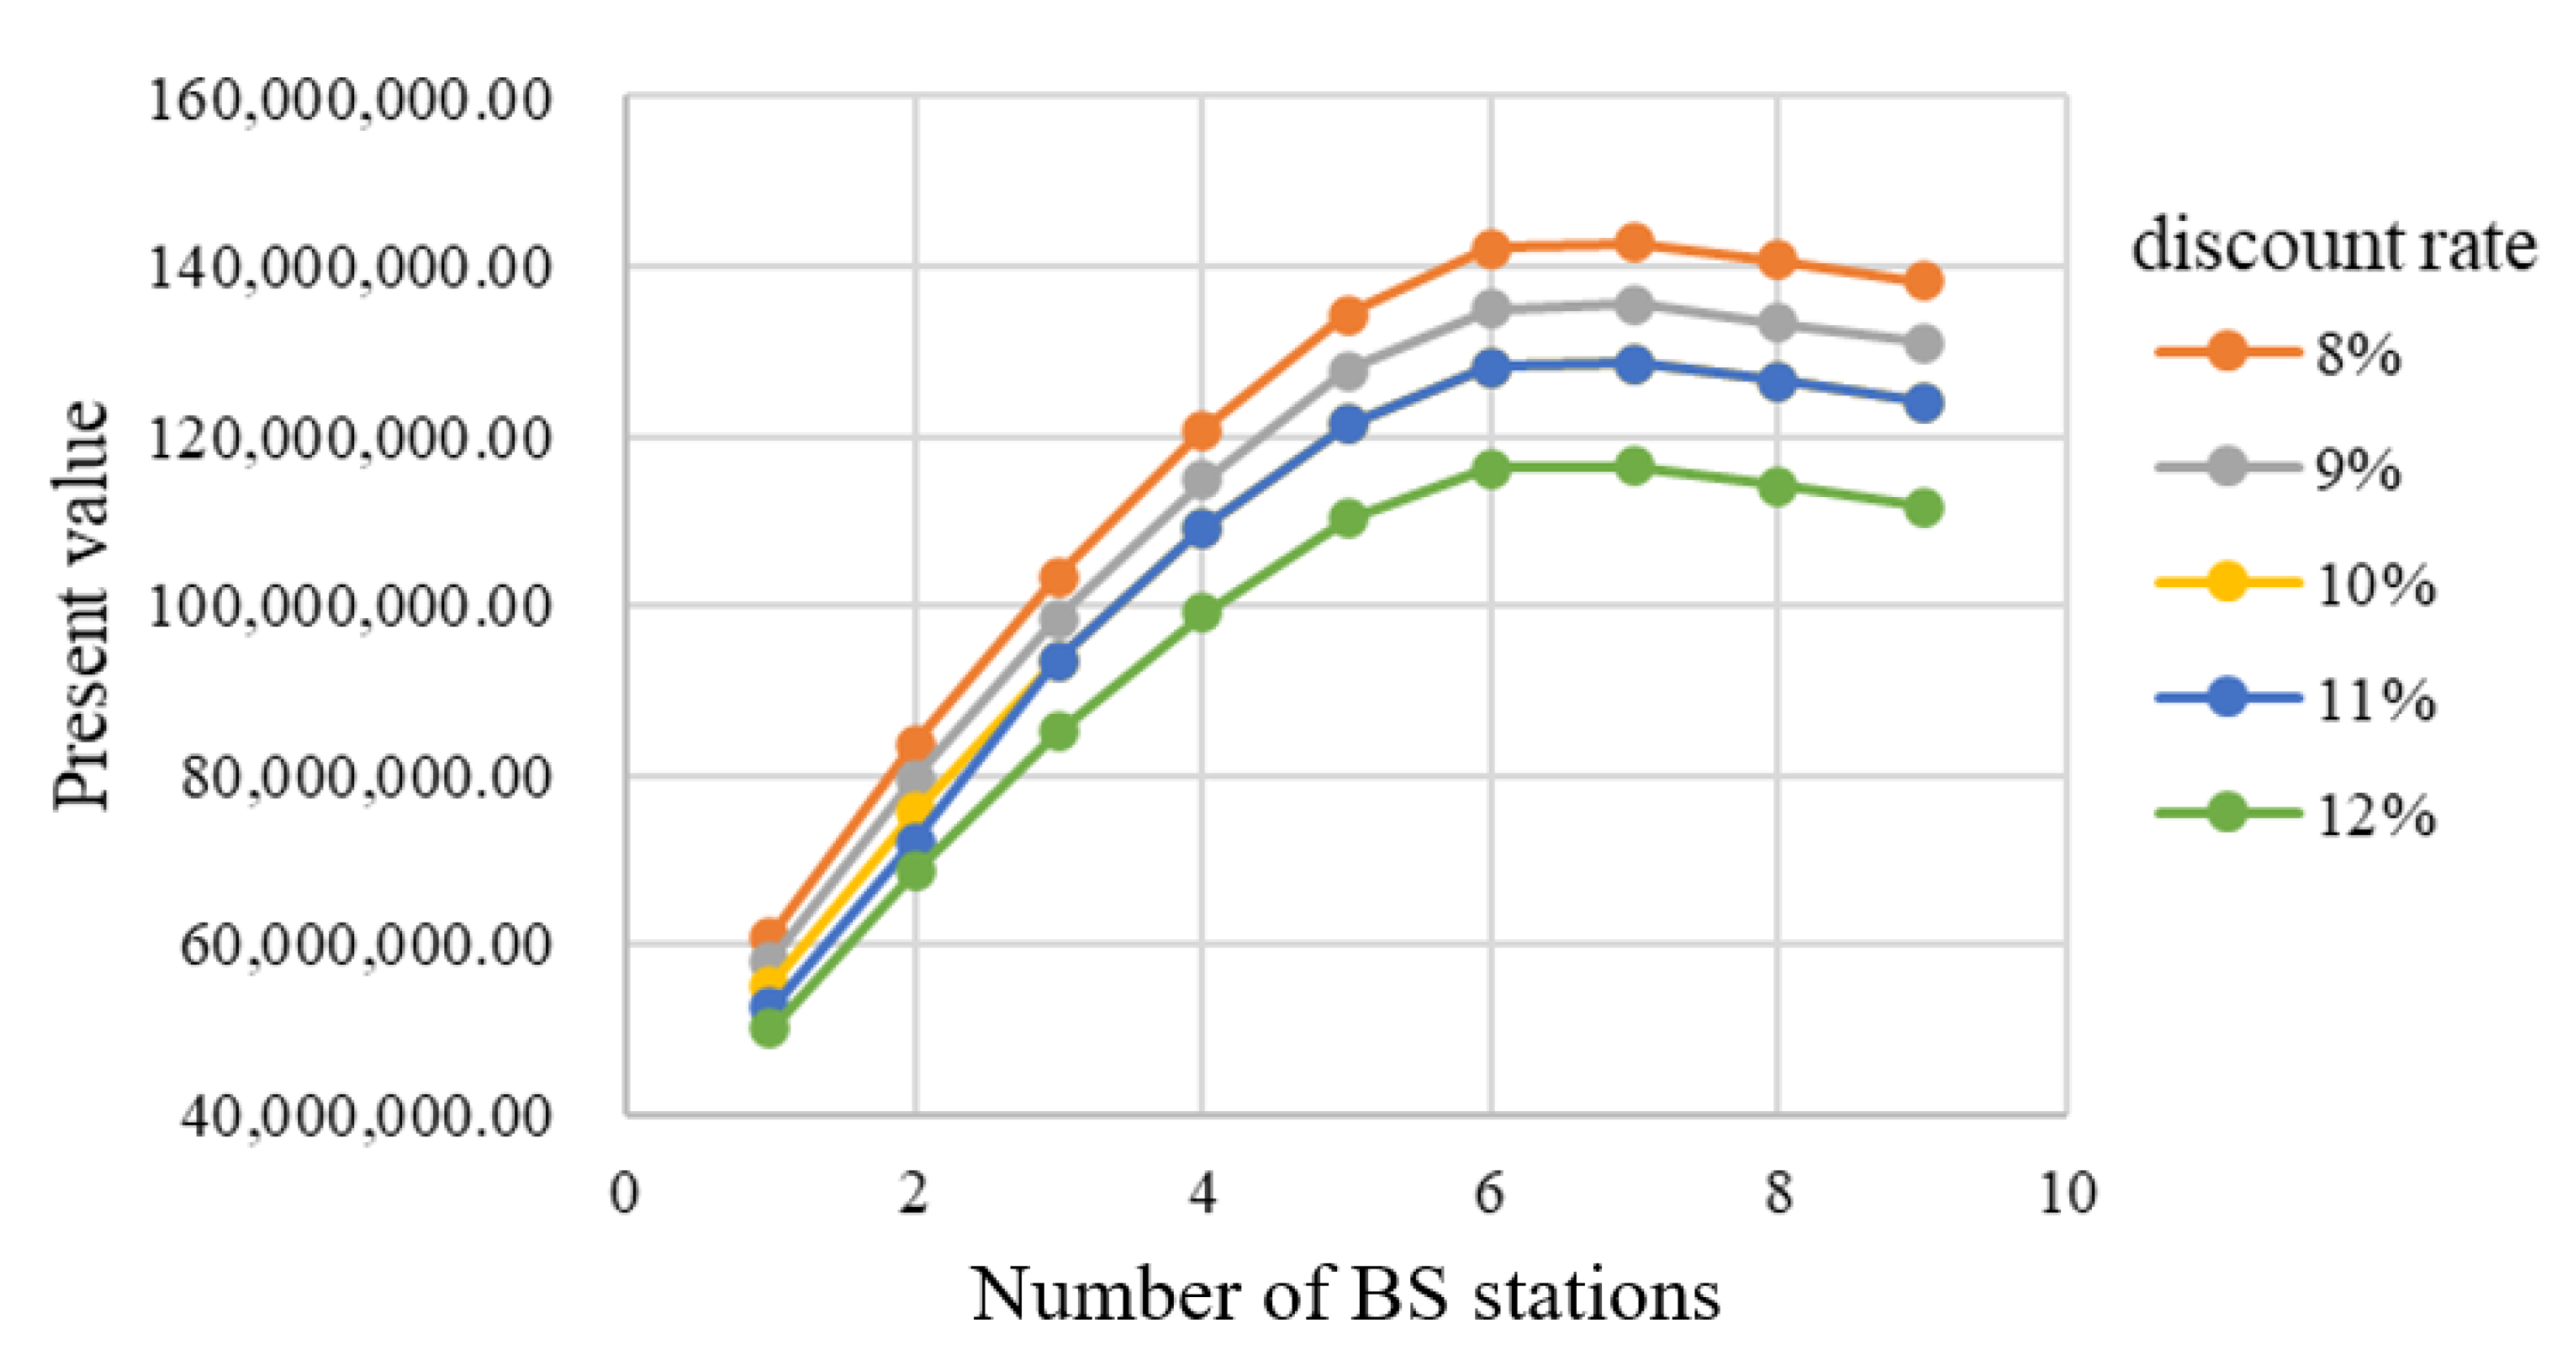
Based on the established model, we are able to conduct a cost-benefit analysis using discounted cash flow method. Given that the design life of the BS station is 10 years, the fixed cost of a set of swapping equipment is RMB 3,000,000, the unit price of a set of battery pack with the related charger is RMB 100,000, the net profit of per service is RMB 100, and different discount rates are tested, with a range from 8% to 12%, which are the average discount rates commonly used in the industry. Graphs are plotted for different discount factors, as shown in
Figure 17.
Figure 17 suggests that, for the studied problem instance, the optimal number of stations is 6 to 7. This result shows that, for a region with a fixed number of prospective users, the number of stations and the capacity of each station can be balanced to maximize the profit of BS service.
It is noted that the input data was collected in December 2020, when the surface temperature was relatively lower than the average of the year. The surface temperature may affect the results because the battery efficiency is relatively low under cold weather and the EV users have to swap their battery more frequently. Nonetheless, this study mainly focus on the general relation between the economics of battery swapping and the demand scale rather than the optimal design of a BS service system. The key findings and implications derived from this study may still be valid.
5. Conclusions
Due to the increasing global concerns in environmental sustainability, the trend of switching from fossil fuel cars to electric vehicles is inevitable. Nonetheless, the inconvenience caused by the battery charging process still prevents the general use fo electric vehicles. As a result, a battery swapping service, which is strongly promoted by the Chinese government and industrial players, has become a promising and practical candidate to help increase future electric vehicles adoptions. The battery swapping network is considered as a service system with trade-offs in costs and service levels. With real data collected from the industry, we built simulation models to analyze the associated costs and service level. In particular, relevant experiments were conducted, and interesting results for decision makers were found.
First, the service level of battery swapping stations may deteriorate with an increasing number of users. For example, the average wait time at certain existing NIO stations in Guangzhou were shown to be significant, which indicates that the stocked batteries may be insufficient. The established simulation model is thus useful to evaluate the maximum number of users at a battery swapping station with a given number of batteries.
Then, our experiments also discovered that the effect of economy of scale exists for the battery swapping service. When the number of users increased, the cost of batteries shared by each user decreased. Although the electric vehicle companies (like NIO) can provide a battery swapping service for free, they charge a premium price from the electric vehicles sold to the market—that is, such costs will ultimately be paid by the customers. Therefore, the customer scale is the key factor that affects the viability of the battery swapping service.
Further analysis suggests that, for a region with a given number of prospective users, the benefit of increasing the number of battery swapping stations diminishes. There is a trade-off between the number of stations and the station capacity, and this can be optimized to maximize the utility and economic return of the battery swapping network.
In sum, the main findings suggest that the battery swapping service may be a viable alternative to the battery charging service. Nonetheless, the user scale is the key to ensure the viability. At the same time, the simulation models established in this paper can be viewed as guidance for the practitioners in designing a battery swapping service system.
Finally, the development of battery swapping in the future may significantly depend on the growth of the market demand. This paper only considered the economics under different demand scale scenarios. A techno-economic analysis of the future development of battery replacement systems considering market growth and demand forecasts may be of particular interest in future studies.


