Article

Testing of a Falling-Film Evaporator for Adsorption Chillers

1
Department of Energy, Politecnico di Milano, Via Lambruschini 4, 20156 Milan, Italy
2
CNR—ITAE, Consiglio Nazionale delle Ricerche-Istituto di Tecnologie Avanzate per l’Energia ‘‘Nicola Giordano’’, 98126 Messina, Italy
3
Sorption Technologies GmbH, 79144 Freiburg, Germany
4
CNR ICCOM—Consiglio Nazionale delle Ricerche Istituto di Chimica dei Composti Organometallici, 56124 Pisa, Italy
*
Author to whom correspondence should be addressed.
Energies 2022, 15(5), 1709; https://doi.org/10.3390/en15051709
Submission received: 11 January 2022 / Revised: 10 February 2022 / Accepted: 15 February 2022 / Published: 24 February 2022
(This article belongs to the Special Issue Advances on Adsorption Heat Pumps, Stores and Systems)

Abstract

:
In this work, the performance of an innovative evaporator based on water falling film was investigated. The studied evaporator has been equipped with a recirculation system to maximise the wetted surface. Tests have been carried out in a lab-scale adsorption unit connected to a test bench recently realised at Politecnico di Milano labs for evaluating heat transfer performances under realistic operating conditions. Several ad/desorption cooling cycles were performed, setting different liquid refrigerant initial contents (0.9–1.5 kg), different chilled water inlet temperatures (7–20 °C) and flow rates (200–1000 L/h) and different adsorbent bed temperatures (25–30 °C). Evaporation performance has been determined in delivered cooling capacity. Moreover, the experimental data were used to calculate the overall evaporator heat transfer conductance (UA). Experiments showed how the heat duty peaks are mainly due to the thermal level of the chilled water that enters the evaporator, not the water content inside it because this value only affects the duration of the process. Instead, the UA value does not depend on the evaporator inlet chilled water temperature and initial mass content inside the evaporator. UA is 540–570 W/K for temperatures of chilled water entering the evaporator, equal to 10–20 °C, and mass of refrigerant of 0.9–1.5 kg.

1. Introduction

Adsorption cooling technology is especially interesting in applications where waste heat drives the adsorption chiller as a widely available energy source (<90 °C). Commercial adsorption chillers are based on fixed silica gel beds, which leads to a larger adsorber. This disadvantage can be compensated by employing novel evaporation concepts that enhance the overall efficiency of the adsorption chiller and allow for a compact design [1,2]. Generally, water is considered the best working fluid for adsorption chillers and heat pumps, thanks to the high evaporation enthalpy and low environmental impact. On the other hand, water use at a low evaporation temperature implies low saturation vapor pressure that requires a special evaporator design to maximize the evaporation rate during the adsorption phase. Some studies have demonstrated that the efficient evaporation of water at sub-atmospheric pressure is challenging [3,4,5]. Indeed, its low saturation pressure at the typical operating conditions of adsorption chillers limits high heat transfer rates due to the nucleate boiling. The nucleate boiling process starts at the heated surface where the temperature of saturation is higher than at the surface of the water pool, and the static head of the water above the exchanger increases the pressure. This increase is not negligible at the typical operating conditions of adsorption chillers; thus, nucleate boiling at low pressure occurs with exchanger wall temperature fluctuations and at high superheat [6]. However, high superheat is inefficient and increases the evaporator temperature and leads to a consequent performance reduction [7]. To avoid such a phenomenon, different types of evaporation processes can be adopted in the evaporators of adsorption devices. Among the different types of evaporator (flooded, capillary tubes), the falling-film concept appears to be the most suitable thanks to the superior global heat transfer coefficient [8,9].
A literature survey revealed that the research in the field of adsorption chillers has mainly focused on the adsorption bed, and there are very few reports on the impact of the evaporator and condenser on the chiller performance. For example, most of the published papers dealing with the modelling of adsorption chillers rigorously modelled the adsorption bed, which is the key component in such a system, while they did not model the evaporator or condenser, assuming they were ideal [10,11].
However, the few available studies have been devoted to investigating the sub-atmospheric evaporation process in simplified heat exchanger configurations such as smooth tubes [12] and flat plates [13]. These studies focused on falling film [14] and capillary-assisted [14] evaporation processes and, in general, demonstrated the sensitivity of the evaporation rate to different influencing parameters, such as filling level, operating conditions and heat exchange surface type [15,16,17]. However, information about the characteristics of the evaporation at pressures lower than 30 mbar (corresponding to a saturation temperature of 24 °C) is still lacking. In [18], Yu et al. introduced experimental research on the heat transfer of water boiling on a horizontal copper rod surface at pressures ranging from 18 to 33 mbar. The authors provide the regression equations of the boiling heat transfer coefficient validated by means of the experimental data, thus providing a useful tool for practical application. However, only a few studies have been addressed to investigate a full evaporator employing a real-scale test bench to simulate the adsorption chiller operational mode. Palomba and Frazzica [19] tested an aluminium fin-and-tube heat exchanger through a test bench capable of achieving evaporation under a partially flooded configuration against a condenser. They found that the heat transfer fluid temperature and orientation of the heat exchanger significantly affect the evaporation rate. Volmer et al. [20] tested real-size copper tube-fin heat exchangers both in thin-film and partially flooded evaporation modes. The results showed that some geometric and process parameters (fin density, fluid flow rate, filling level) strongly influence evaporation performance. Thimmaiah et al. [14] tested a flooded evaporator in a real adsorption heat pump employing AQSOA FAM-Z02 as an adsorbent. They found that the utilisation of turbulent flow generators inside evaporator tubes and a porous coating on the external surface of evaporator tubes can improve the flooded evaporator performance. Giraud et al. [21] tested a smooth stainless-steel plate evaporator in a real adsorption heat pump employing silica gel as an adsorbent. The results of the experiments indicated a strong influence of the height of the liquid level on the cooling capacity obtained during the adsorption cycle. Li et al. [22] tested falling-film evaporation on tube bundles in a vacuum, and evaporation was obtained against a condenser.
According to previous literature research, no falling-film evaporators have been exhaustively tested in a real-scale adsorption heat pump or chiller. Accordingly, in this work, an innovative falling-film evaporator, equipped with a recirculation system to maximize the wetted surface, was tested in a lab-scale adsorption test bench for evaluating heat transfer performances. Tests have been carried out under realistic operating conditions typical of an adsorption chiller. Evaporation performance has been determined in delivered cooling capacity at different refrigerant charges, chilled water flow rates and evaporation and adsorption temperatures. Additionally, from the experimental data, the calculation of the overall evaporator heat transfer conductance has been performed.

2. Methodology

The experimental investigation of the falling-film evaporator has been carried out in an experimental set-up at Politecnico di Milano, aimed at testing adsorption units and their components. In this section, the experimental set-up is described. Moreover, the test procedure and the approach to the data analysis are also presented, together with the accuracy of the measures of the main quantities.

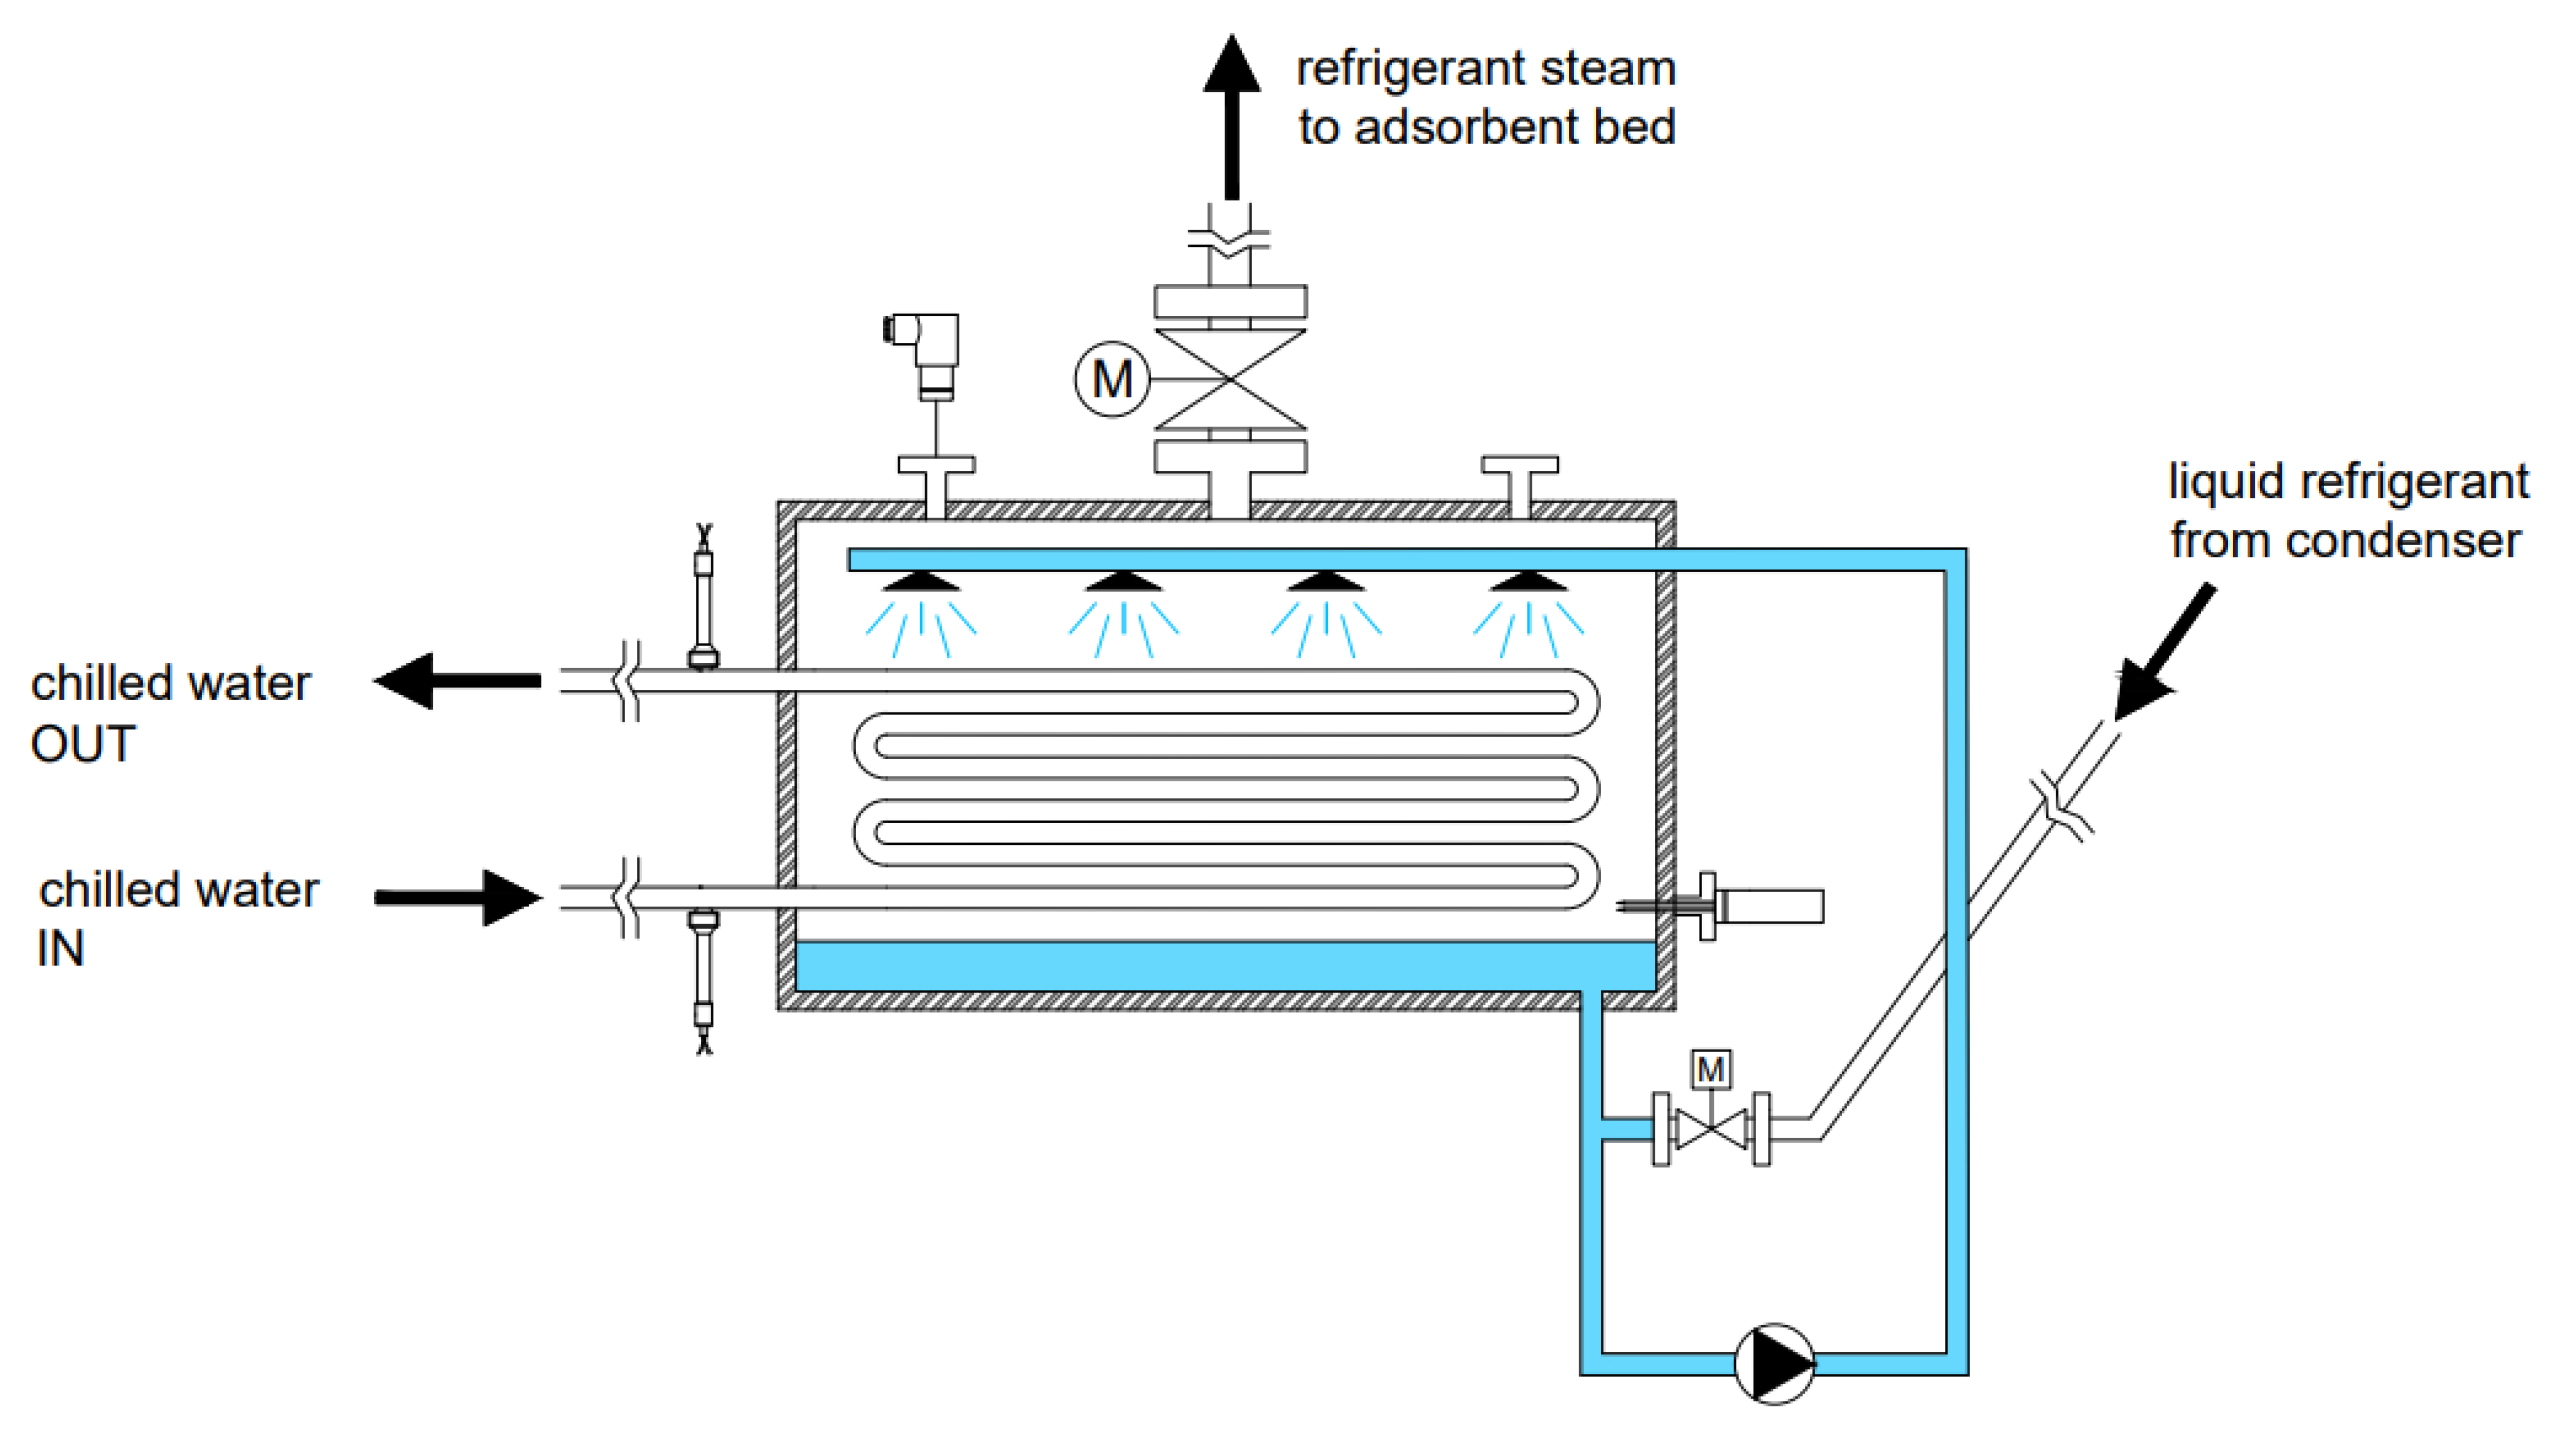
2.1. The Experimental Set-Up

The experimental set-up used for this work consists of a vacuum circuit made of a single packed-bed adsorber, an evaporator and a condenser, connected with three hydraulic circuits which provide water flows at the required temperature and flow rates.
The adsorbent bed was made of granular RD silica gel embedded in a finned heat exchanger and was oversized to assure stable working conditions at the evaporator for long periods. The condenser was made of stacked corrugated pipes connected in series. A photo and a schematic design of the set-up can be found in Figure 1a,b.
The evaporator, i.e., the component investigated in this work, is a falling-film evaporator made of a corrugated stainless-steel tube, where the chilled water flows in the pipe and the refrigerant falling film on the outer surface. The refrigerant is circulated employing a pump and distributed on the top of the heat exchanger. The use of corrugated tubes helps the falling film to remain well-distributed across the lengths of the tubes as it flows downwards. A schematic representation of the evaporator is shown in Figure 2 and its main geometrical features are reported in Table 1. The three components are connected by two electrically actuated valves (V1 and V2 in Figure 1a) to allow the passage of water vapor, enabling the ad/desorption phases.
The external sinks/sources consist of three hydraulic circuits (cold-water, hot-water and intermediate circuits) with nominal capacities of 2 kW for the evaporator and condenser and 5 kW for the adsorber, with flow rates between 200 and 1000 L/h. The mass flow rates and supply temperatures of the three circuits can be set independently based on the required conditions. A schematic layout of the hydraulic and vacuum circuits is shown in Figure 3. The sensor position is reported in the figure and indicated with the label “P” in the case of a pressure transducer, “T” for the temperature sensors and “F” for the flow meters.
Being a single-bed adsorption cycle, the test bench can work in two modalities: adsorption–evaporation and desorption–condensation. When carrying out the test in the adsorption–evaporation mode, the cold-water circuit provides the needed heat for the evaporation. At the same time, the medium-temperature water loop operates as a heat sink, allowing heat rejection during the adsorption phase. On the other hand, when working in the desorption–condensation mode, the medium temperature circuit allows the rejection of condensation heat, while the hot-water circuit provides the desorption heat to the adsorbent bed. The switching between the phases of the cycle is achieved through two electric actuated valves (indicated as “V1” and “V2” in Figure 1b).
The test bench is also equipped with Pt 100 temperature sensors, pressure transducers and flow meters, for which the uncertainties and operating ranges are reported in Table 2. Real-time control and data acquisition software for the test bench were realised by means of the LabVIEW™ language.

2.2. Test Procedure

The experimental data have been collected following a test procedure to ensure repeatability and comparability of the test results. The test procedure is described as follows:
-
Phase 1: Heating up. Keeping both the valves V1 and V2 closed, the adsorption bed was heated up to 90 °C, while the condenser was maintained at a temperature of 25–30 °C by the medium-temperature circuit. This phase was terminated when the pressure in the bed reached the pressure in the condenser.
-
Phase 2: Desorption–condensation. The temperatures of the high- and medium-temperature circuits were maintained constant and valve V1 was kept closed, while valve V2 was opened to allow the vapor desorbed from the bed to flow toward the condenser, where the condensate water accumulates on the bottom of the condenser.
-
Phase 3: Cooling down. Once the desorption was completed, valve V2 was closed and the adsorber was cooled down by the intermediate circuit at temperatures of 25 or 30 °C, based on the required test conditions. At the same time, the water stored at the bottom of the condenser was discharged to the evaporator by gravity and the low-temperature circuit was activated to prepare the evaporator.
-
Phase 4: Adsorption–evaporation. At first, the pump circulating the refrigerant in the evaporator was activated. Then, valve V1 was opened to start the adsorption process, which induces evaporation in the evaporator, heated by the low-temperature circuit at temperatures ranging from 7 to 25 °C, based on the required conditions.
To ensure optimal and repeatable operation, before starting the procedure, non-condensable gases were removed from the vacuum circuit by means of a vacuum pump. The valves V1 and V2 were opened to connect the adsorption bed with the evaporator and condenser, respectively, when the bed was close to equilibrium conditions. This has been practically implemented by opening the valve when the temperature difference between the inlet and the outlet of the bed reached 0.2 °C.

2.3. Data Analysis and Uncertainty

The chilled water inlet and outlet temperatures (Tchw,in and Tchw,out) and the mass flow rate ( m ˙ chw ) are used to calculate the heat transfer rate from the chilled water flowing inside the evaporator tubes, as in Equation (1):
Q ˙ evap = m ˙ chw   Cp chw   ( T chw ,   in   T chw , out )
where Cp chw is calculated as a function of the chilled water mean temperature between the inlet and the outlet.
The overall evaporator heat transfer conductance (UA) is given by Equation (2):
UA = Q ˙ evap Δ T LMTD
where Δ T LMTD is the logarithmic mean temperature difference between the chilled water and the saturated liquid refrigerant, as follows:
Δ T LMTD = T chw , in   T chw , out ln   ( T chw , in   T sat T chw , out   T sat )
The refrigerant saturation temperature ( T sat ) is calculated from the saturation pressure ( P sat ) inside the evaporator, measured by a pressure transducer.
The overall evaporator heat transfer conductance (UA) can also be defined utilizing the thermo-electric analogy, as:
UA   = 1 ( 1 h ext A ext ) + ( ln ( D ext / D int ) 2 π L   k steel ) + ( 1 h int A int )
The denominator of Equation (4) is the sum of the internal thermal resistance (referring to the surfaces of the tubes in contact with the chilled water), the conductive thermal resistance for cylindrical geometry and the external thermal resistance (referring to the surfaces of the tubes in contact with the falling film of refrigerant). The tubes are corrugated to obtain a finned external surface. For a thorough approach to the calculation, the efficiency of the fins has been calculated and found to be about 99%. Thus, to simplify the discussion, the fin efficiency has been considered unitary, and as A ext , the overall surface (tube plus fins) has been considered. The convective internal heat transfer coefficient ( h int ) has been calculated using the Gnielinski correlation (Equations (5) and (6)) for internal single-phase flow, suitable for Reynolds numbers between 2300 and 5 × 10 6 [23]:
Nu int = ( f 2 ) ( Re int 1000 )   Pr int 1 + 12.7   ( f 2 ) 0 , 5 ( Pr int 2 / 3 1 )
with
  f = 0.078   ( Re int ) 1 / 4
The convective internal thermal resistance depends on the chilled water properties and flow rate, while the conductive thermal resistance depends on the geometry of the evaporator tubes and the thermal conductivity of the metal they are made of; therefore, they are easily calculable from the input data of the systems. Knowing the UA coefficient from Equation (2), Equation (4) can be used to calculate the external heat transfer conductance:
h ext A ext = 1 ( 1 UA ) ( ln ( D ext / D int ) 2 π L   k steel ) ( 1 h int A int )
The heat-transfer external coefficient ( h ext ) cannot be separated from the h ext A ext parameter obtained by Equation (7) because the actual wetted area contributing to the falling-film evaporation process is unknown. Since the direct measurement of the mass flow rate of the evaporating refrigerant is challenging to implement without interfering with the system and the evaporation process, this quantity is derived from Q ˙ evap :
m ˙ evap = Q ˙ evap Δ H l v
where the enthalpy of vaporisation Δ H l v is calculated as a function of the saturation pressure of the refrigerant. This choice introduces some uncertainty in the measure. In particular:
-
The capacity of the evaporator creates a delay between the evaporation process and the resulting heat transfer at the chilled water. This is more relevant during rapid transient conditions, such as at the beginning of the evaporation process, but does not significantly impact steady-state conditions or slow variations.
-
Similar consideration can be performed for the time required by the chilled water to flow across the evaporator pipes and reach the temperature sensor. This causes a delay of up to 8 s between what happens in the evaporator and the moment the sensor measures this.
-
Heat losses through the evaporator casing create an imbalance between the actual heat of evaporation and the heat transfer from the chilled water to the refrigerant. The evaporator has been insulated, reducing the losses to a value of about 10 W, estimated based on the surface of the evaporator casing (0.46 m2) and the recirculation circuit, the insultation thickness (2.5 cm) and thermal conductivity (0.04 W m   K ).
Based on the accuracy of the sensors used in the system, the compound uncertainty has been calculated for both Q ˙ evap and UA. The uncertainty has been calculated for the quasi steady-state phase, which characterizes both the quantities after the first rapid transient condition at the beginning of the tests. Moreover, given that the uncertainty of the temperature measurement is directly dependent on the value of the temperature difference itself, the results of the calculations are reported for four representative cases. As the difference between inlet and outlet chilled water temperature depends on the mass flow rate, m ˙ chw , the highest and lowest values of this quantity have been considered. Moreover, as discussed in Section 3, the chilled water inlet temperature also has an impact on the heat duty, and consequently on the temperature difference. Thus, two extreme temperature values have been considered for T chw , in : 7 and 20 °C. The resulting composed uncertainty for the heat transfer rate and overall heat transfer conductance are reported in Table 3. The relatively high uncertainty found for the condition with Tchw,in = 7 °C and m ˙ chw = 1000 L/h is explained by the very low temperature difference between the chilled water inlet and outlet due to the combination of low heat duty and high flow rate.

3. Results and Discussion

Several tests were carried out to evaluate the impact of different parameters on the evaporator performance. In particular, the influence of the initial water content in the evaporator, the chilled water mass flow rate and the adsorbent bed temperature on the overall heat transfer coefficient and heat duty were explored. Moreover, the variation of the recirculated water mass flow rate along the evaporation process was also investigated to explain the variation of the heat transfer coefficient.

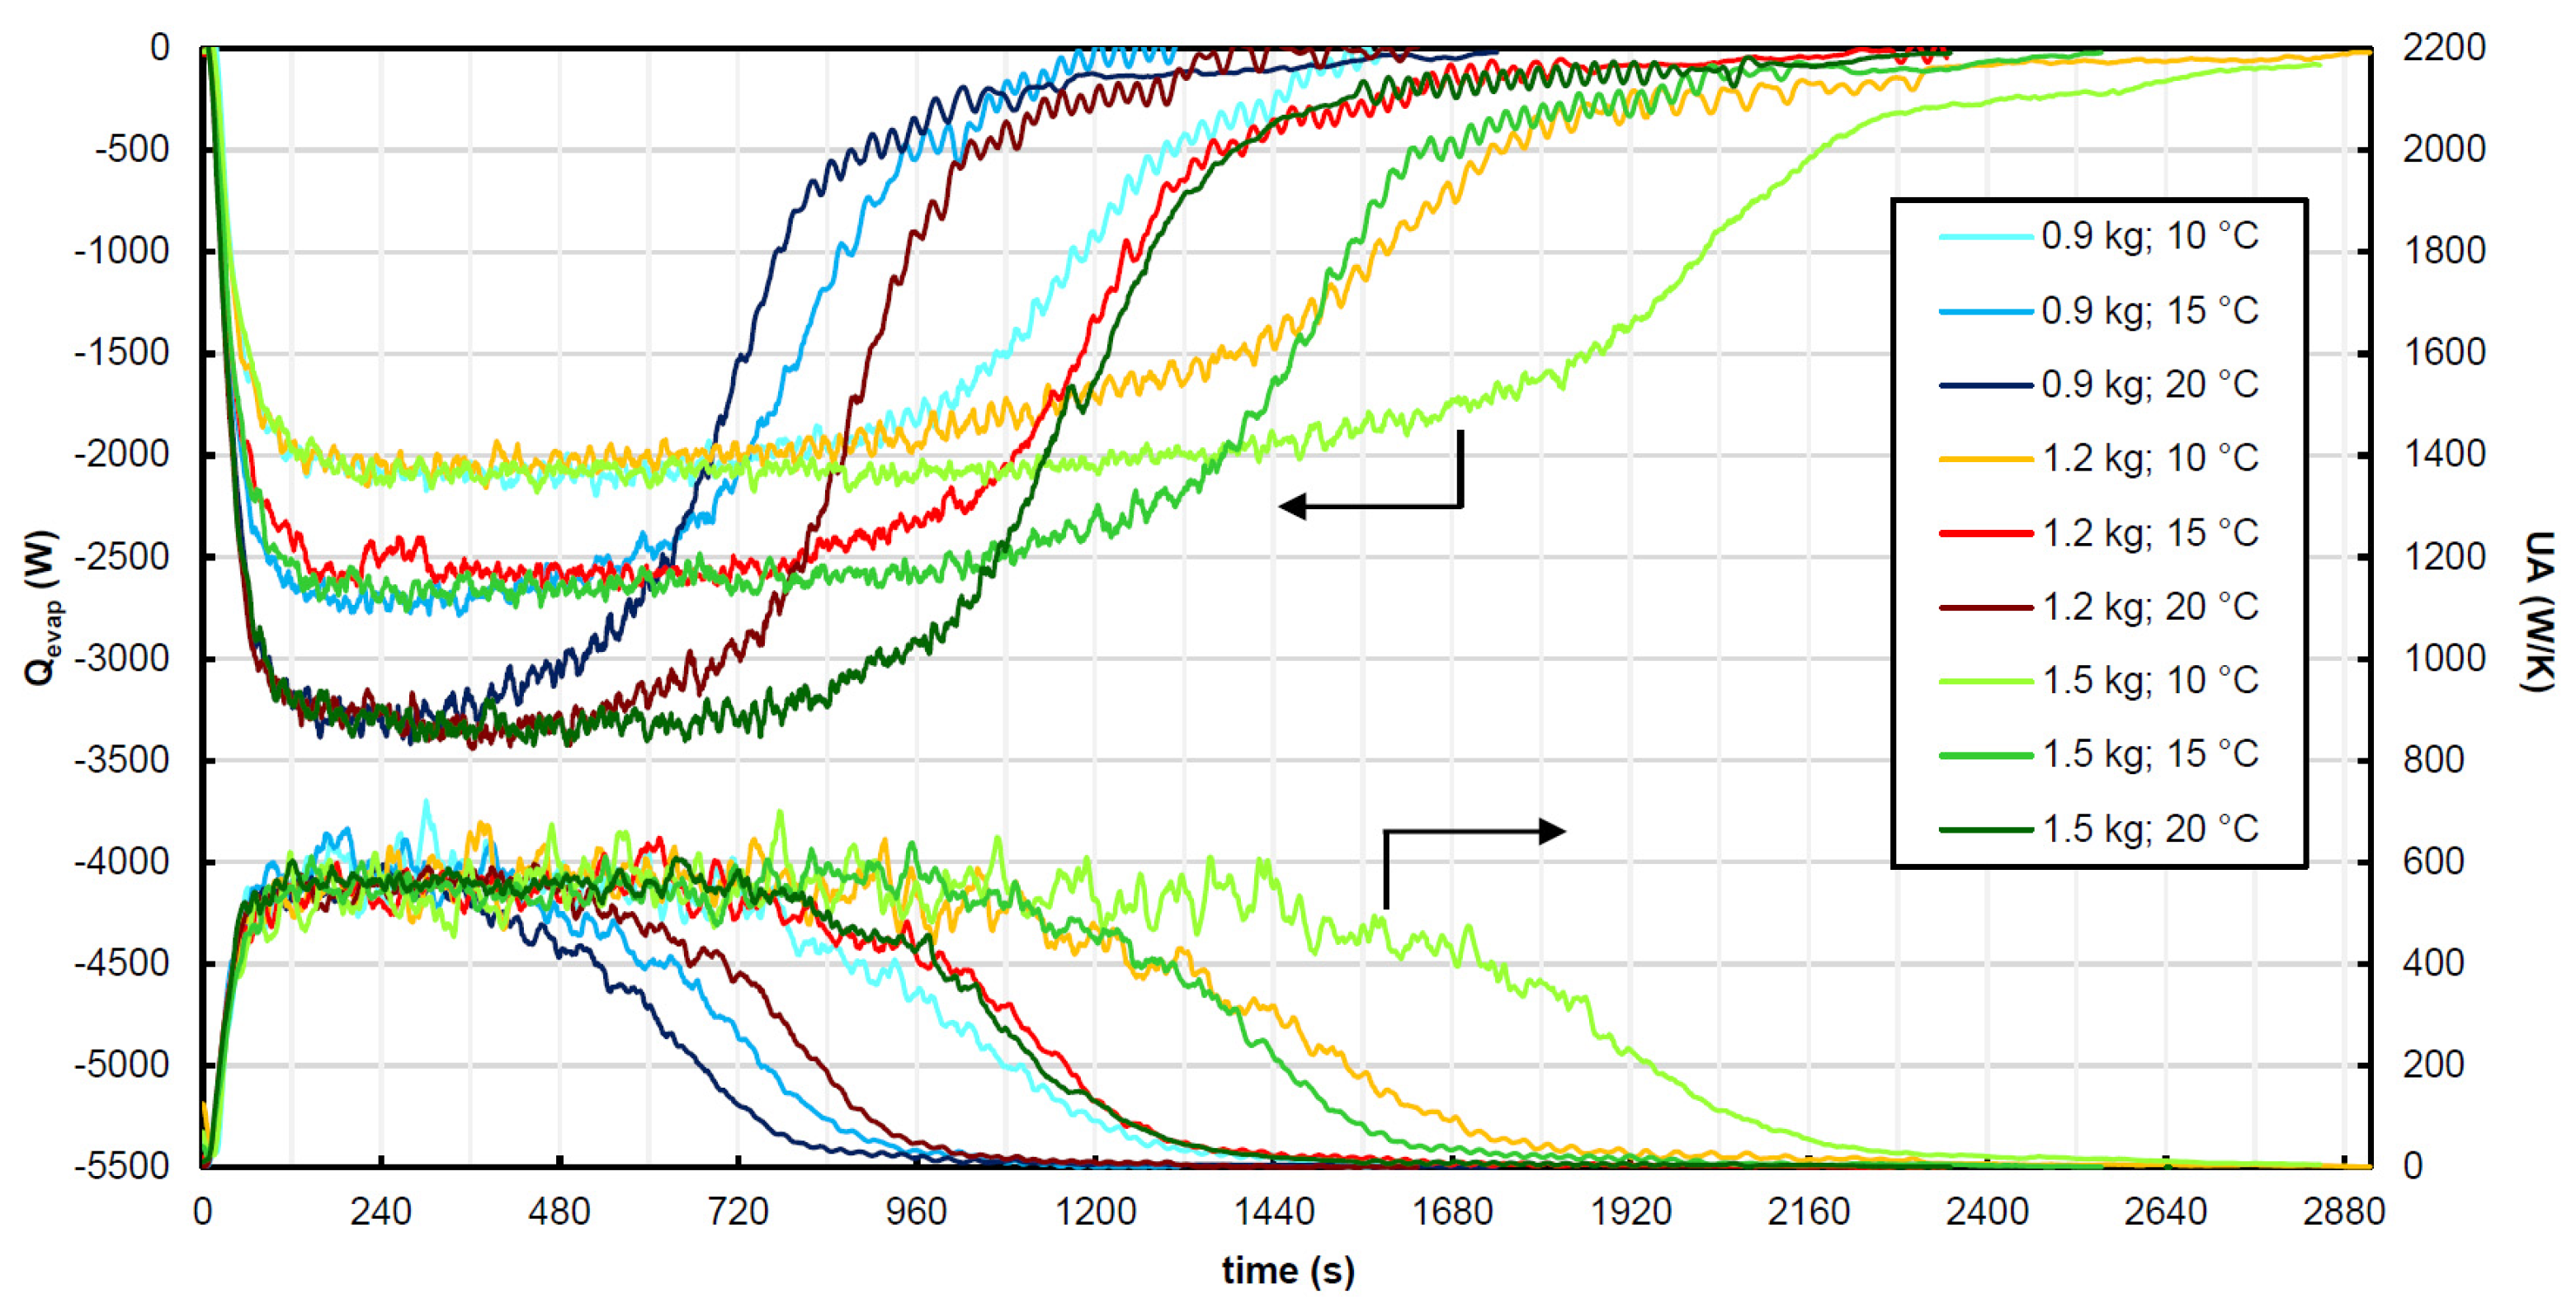
3.1. Impact of the Initial Water Content Inside the Evaporator

To evaluate the impact of the initial water content in the evaporator on the evolution of the UA and the heat duty along with the evaporation, process tests with 0.9, 1.2 and 1.5 kg of initial refrigerant content have been performed. The upper limit of 1.5 kg of initial water content in the pool assures that no tubes of the heat exchanger are submerged and, as a result, that no pool boiling but only film evaporation takes place. Moreover, three different chilled water inlet temperatures (10, 15 and 20 °C) have been used for each initial water quantity. The heat duty and the overall heat transfer coefficient during the evaporation are reported in Figure 4 for the nine resulting cases. For these tests, the cooling water at the absorption bed and chilled water flow rates have been set at 650 and 400 L/h, respectively. Looking at the trends, both the exchanged thermal power and the UA coefficient trends had an initial steep increase when valve V1 between the adsorber and the evaporator was opened, and the evaporation process began. As discussed, during this transient condition, the actual evaporation rate was not well-represented by the measured heat duty due to the system’s inertia, so, most likely, the actual mass flow rate of vapour experiences an even steeper increase. After the first transient phase, both the monitored quantities experienced a plateau, which can be considered a quasi-steady-state condition, with a duration proportional to the initial refrigerant content. In the last phase, UA and heat duty decreased smoothly until the process was completed. This behaviour can most likely be explained considering that the plateau represents a decreasing amount of refrigerant in the evaporator, but where the remaining quantity is still enough to assure a steady supply of refrigerant to the recirculation pump, which supplies the refrigerant to the falling film. However, below a certain level, the water at the bottom of the heat exchanger is not sufficient anymore to fully maintain the suction pipe, resulting in a decreasing flow rate. A lower flow rate translates in a more irregular and less distributed falling film, which affects the UA and the heat duty. This hypothesis will be better discussed in Section 3.4, where the results on the measure of recirculated mass flow rate will be reported. Looking at the values reached by the two quantities during the plateau, Q ˙ evap depends on the chilled water inlet temperature, while it was unaffected by the initial water content, which, in turn, affected the duration of the process. For the same initial refrigerant content, the higher the chilled water inlet temperature, the higher the exchanged power and the lower the duration of the evaporation process. On the other hand, with the same inlet chilled water temperature, the magnitude of Q ˙ evap was independent of the initial water content, which influences only the duration of the process. Neither the initial water content nor the chilled water inlet temperature impacts the UA value during the plateau. This can be appreciated both in Figure 4 and in Table 4, where the average values of Q ˙ evap and UA are reported in a timeframe corresponding to the plateau. While heat duty changed from about 2000 to 3200 W with the chilled water inlet temperature, the UA value remained at about 540–570 W/K for all the explored conditions.

3.2. Impact of the Chilled Water Flow Rate

To verify that the UA value during the plateau phase was unaffected by the initial refrigerant content and by the chilled water temperature, in this section, the influence of the chilled water flow rate is explored. Keeping the initial water content constant at 1.4 kg, tests have been performed with a chilled water inlet temperature of 7, 12 and 20 °C and with a flow rate of 200, 400 and 1000 L/h. The adsorbent bed temperature was equal to 30 °C for all of the tests. To keep the discussion compact, in this section, the evaporator performances will be analysed during 5 min of the plateau, which is the most relevant part of the evaporation process. The results of the nine tests can be found in Table 5, where it is confirmed that the average UA was not affected by the chilled water inlet temperature. On the other hand, an increase of m ˙ chw for the same T chw , in test generated a bigger UA ¯ value. This was expected and can be justified with the increase of the Reynolds number. In the table, the average internal heat transfer conductance ( h int A int ) was calculated from the average Re int using the Gnielinski correlation (see Equations (6) and (7) in Section 2.3), showing that the higher flow rate translates into a higher hint. As a further step, from the UA and h int A int , the heat transfer conductance on the film side ( h ext A ext ) was also calculated, finding relatively constant values.

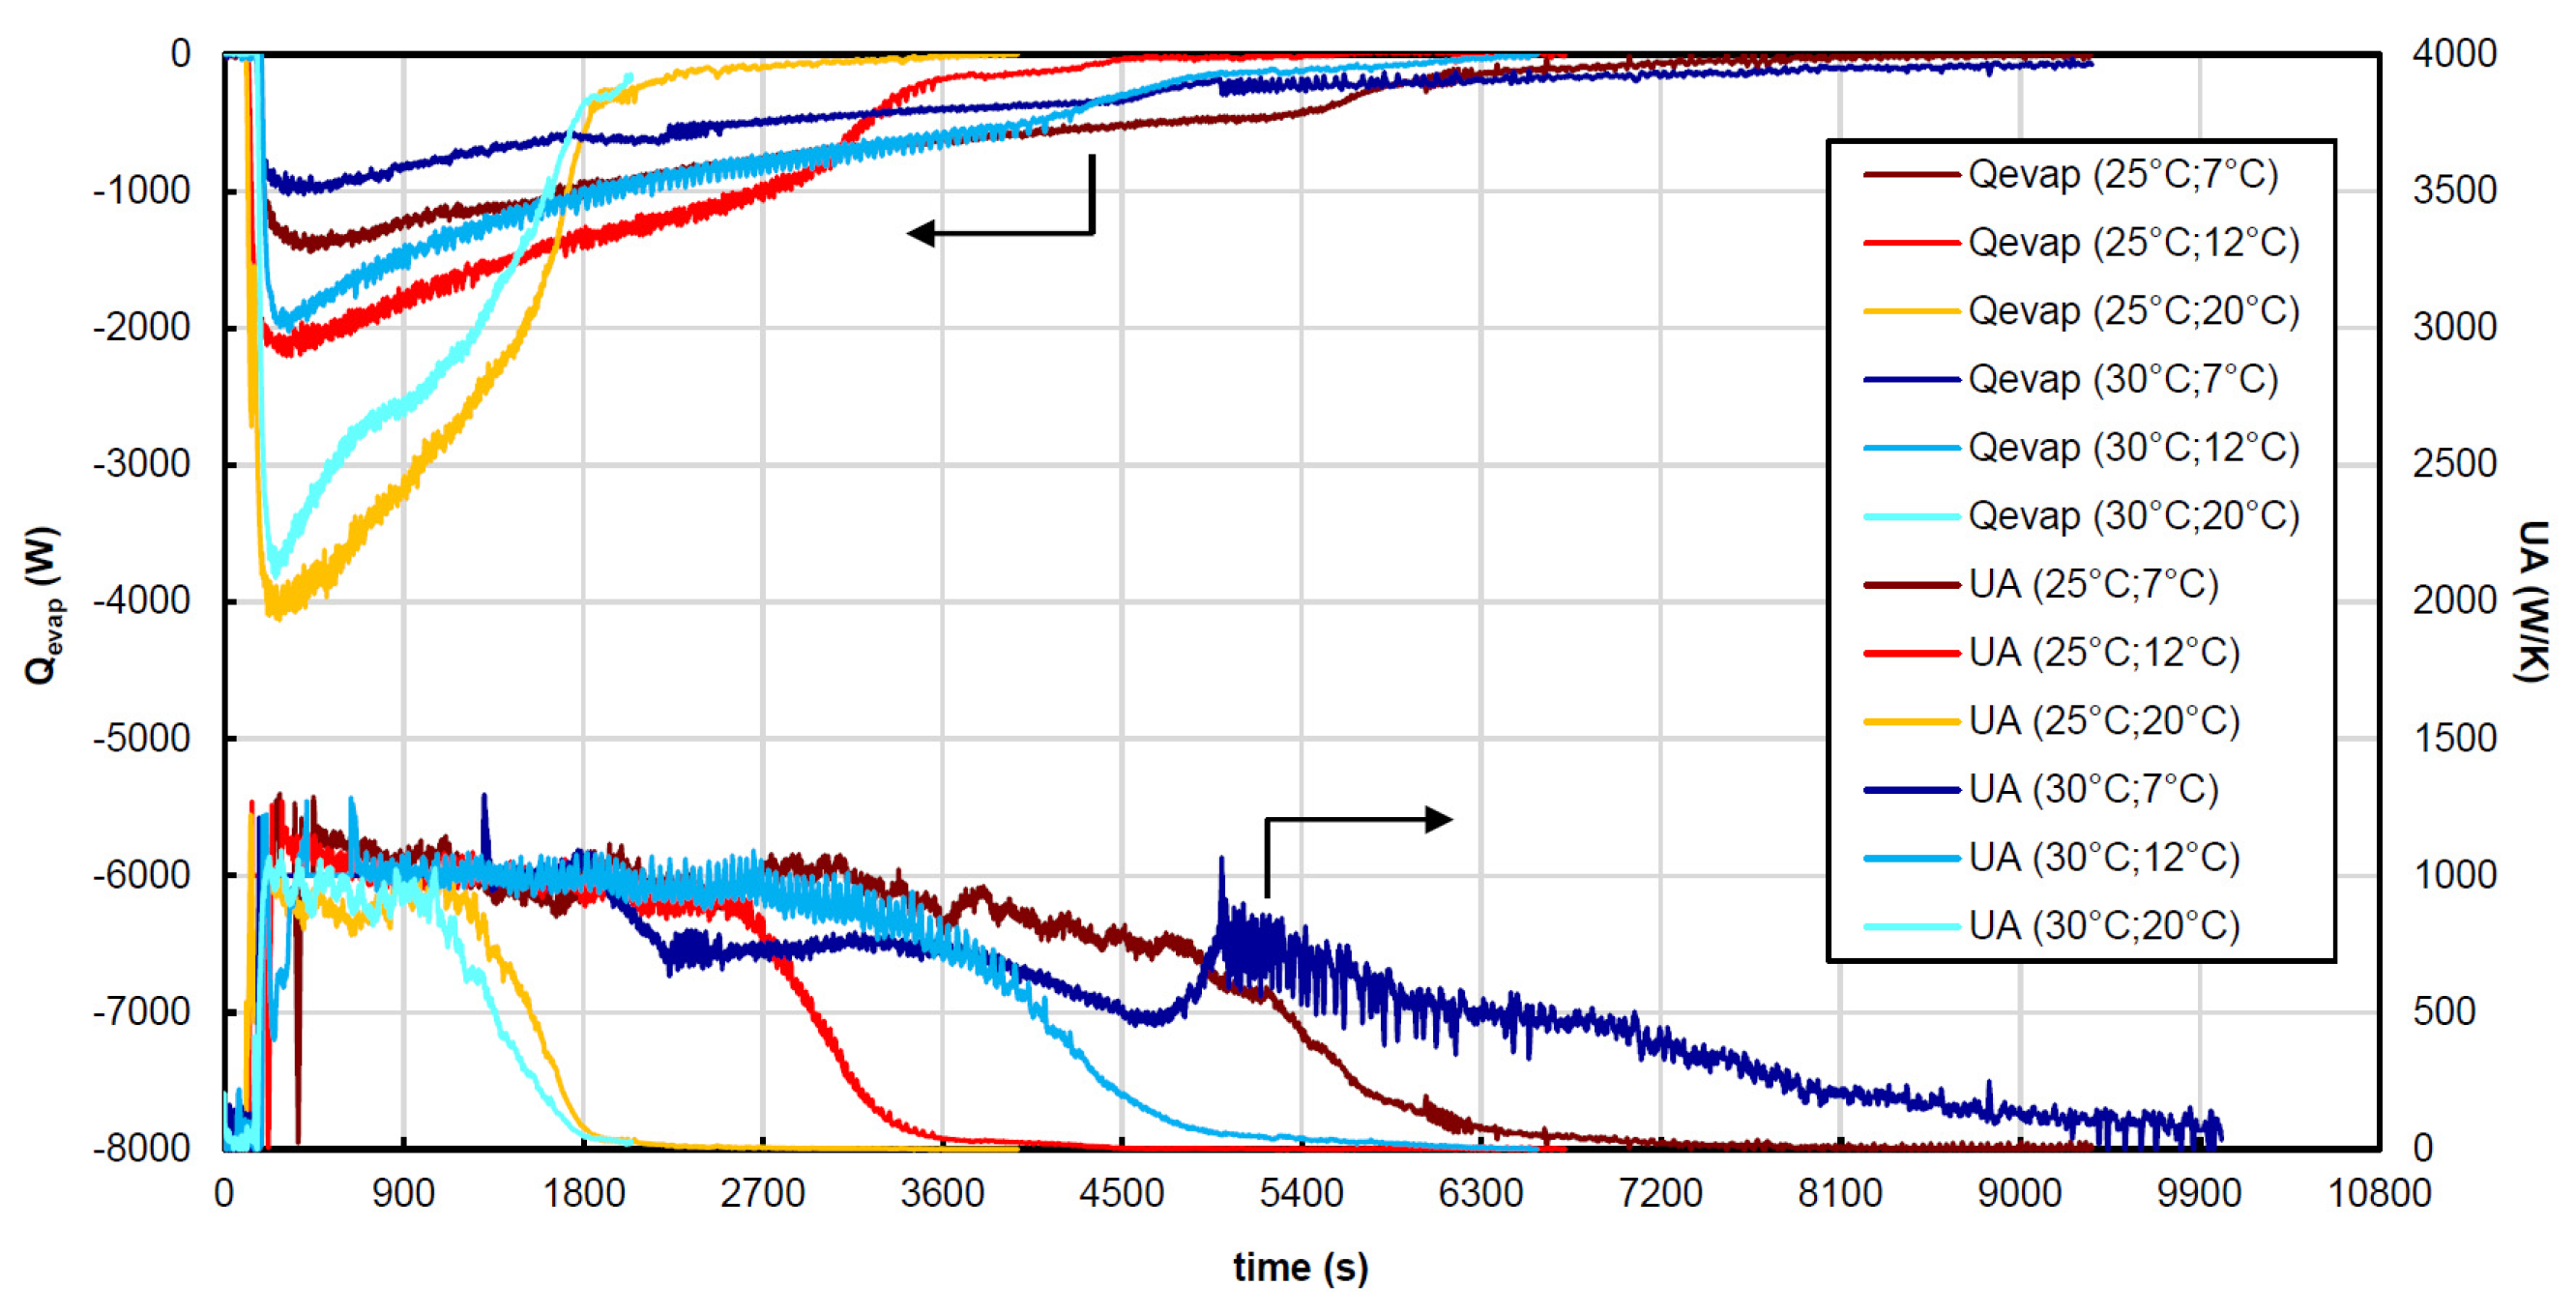
3.3. Impact of the Cooling Water Temperature

Tests have been carried out to evaluate whether the water inlet temperature at the adsorption bed has an impact on the evaporator performance. In fact, the bed temperature is directly related with the driving force of the evaporation process, i.e., the pressure difference between the saturation pressure at the evaporator and the equilibrium pressure at the adsorber. Consequently, it is expected that the evaporation process will be enhanced by a low cooling waterbed temperature. Tests have been run with two adsorbent bed inlet temperatures (25 or 30 °C) and for three chilled water inlet temperatures (7, 12 and 20 °C), keeping the water flow rates constant in the two heat exchangers of the components (1000 L/h for the evaporator and 650 L/h for the adsorber). The Q ˙ evap and UA profiles of the six tests are shown in Figure 5. From the charts, it can be seen that the heat duty was mainly affected by the chilled water inlet temperature, as already observed in Section 3.1, and that the absorbent inlet temperature on the Q ˙ evap   was high at a low T chw , in while it was almost negligible at 20 °C. The UA value was quite uniform for all the conditions and close to the values found in Section 3.1 and Section 3.2. The two tests with a 20 °C evaporation temperature confirmed a lower UA value than the other conditions. This fact is due to the temperature difference between the chilled water and the saturation temperature of the refrigerant inside the evaporator.

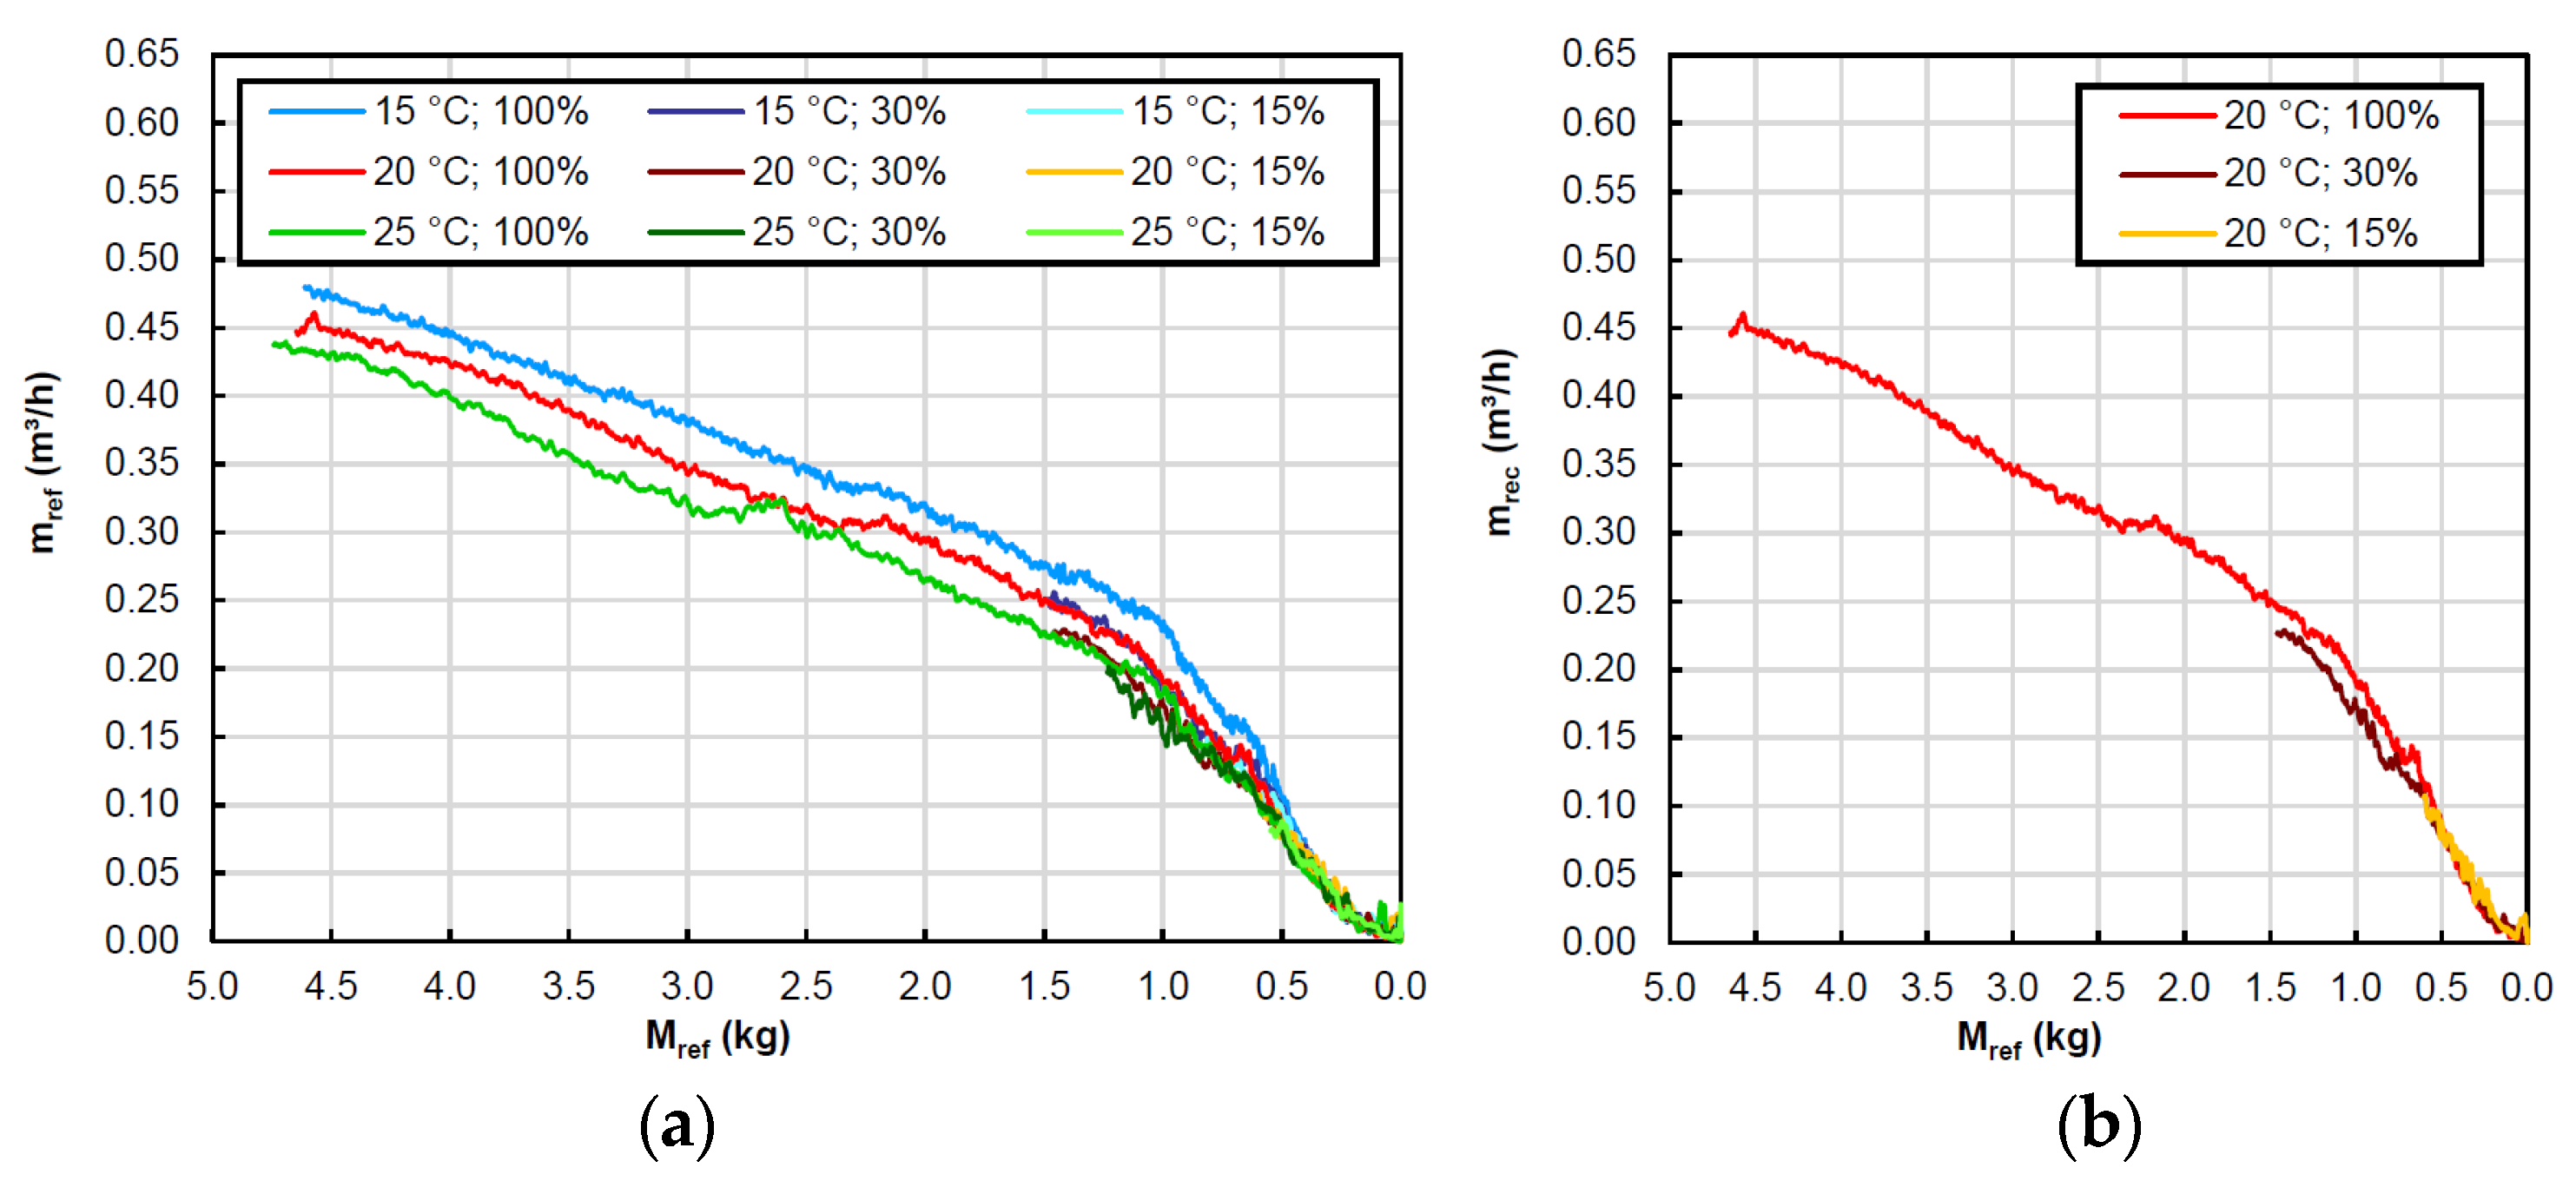
3.4. Impact of the Recirculated Water Mass Flow Rate

In Section 3.1, it was assumed that the reduction of the UA value while the evaporation process proceeds was due to the decrease in the falling-film mass flow rate, which resulted in a lower wetted area and in a consequently lower overall heat transfer coefficient. To confirm this hypothesis, the mass flow rate of water recirculated by the refrigerant pump was measured under various conditions, i.e., changing T chw , in (15, 20 and 25 °C) and the initial refrigerant content in the evaporator ( M ref ) . The refrigerant content was measured in terms of percentage (100%, 30% and 15%) compared to a full charge, corresponding to 4.5 kg. It has been found that the mass flow rate decreased during the evaporation process. This reduction can be explained considering that as the refrigerant evaporated, its level decreased, causing a decrease of the heat at the pump suction. This caused the saturation temperature at the pump inlet to approach the refrigerant temperature, promoting cavitation. To visualise this effect, in Figure 6, the recirculated flow rate is plotted against the hydrostatic pressure at the pump suction. In the chart, two different trends can be identified. The first phase (over 8950 Pa) spans from the beginning of the evaporation process until the moment when there is no more water in the pool at the bottom of the evaporator and the remaining water fills the pipe which connects the evaporator to the circulation pump. In this phase, for which the details are provided in Figure 6b, the flow rate decreased as the hydrostatic pressure decreased, due to the progressive increase of the cavitation. In the second phase, under 8950 Pa, the pipe was progressively emptied as the remaining water evaporated. This phase covered a larger range of pressure differences but lasted for significantly less time than the previous part due to the small amount of water left. Here, the reduction of the flow rate was slower, but the absolute value was already very small. Moving to Figure 7, where the circulated flow rate is plotted against the water content in the evaporator, it can be appreciated that most of the evaporation process took place in the first phase, while only the last 0.4 kg of refrigerant was evaporated during the second phase. This suggests that in an adsorption chiller operating in a real environment, it is not recommended to extend the evaporation until the water is fully evaporated, but the process has to be stopped when there is still some refrigerant in the pool. Figure 6b suggests that the evaporator temperature has an impact on the mass flow rate of recirculated refrigerant, with higher values when T chw , in is lower. This can be explained by the changes in the water density with the temperature, which affects both the hydrostatic pressure and the mass flow rate at a given volumetric flow. On the contrary, no impact on the mass flow rate has been found for the initial water content in the evaporator. In fact, the lines of the tests at the same T chw , in and different M ref overlap (see Figure 7a).

4. Conclusions

A falling-film evaporator for adsorption chillers has been tested to assess its performance under various operating conditions. The tests have been performed with different initial liquid refrigerant contents (0.9–1.5 kg), different chilled water inlet temperatures (7–20 °C) and different flow rates (200–1000 L/h). Moreover, two adsorbent bed temperatures (25–30 °C) have been used to induce different evaporation rates. The main outcomes of the experimental activity can be summarised as follow:
-
Given the transient nature of the adsorption process, the heat transfer rate was not constant during the evaporation, but after an initial phase it reached a plateau before declining towards the end of the process. A similar trend was found for the overall heat transfer conductance.
-
The heat transfer rate ranged from about 1000 to 4000 W, while the overall heat transfer conductance ranged from 400 to 1000 W/K.
-
The initial heat amount of refrigerant affected neither the maximum heat transfer rate achieved during the evaporation process nor the overall heat transfer conductance. However, it had an impact on the duration of the evaporation process.
-
The chilled water inlet temperature and the cooling water inlet temperature at the adsorber impacted the maximum heat transfer, while they did not have any impact on the overall heat transfer conductance. In particular, the heat transfer rate increased when the chilled water temperature increased and when the cooling water temperature was reduced.
-
The overall heat transfer conductance depends on the chilled water flow rate, which impacts the Reynolds number inside the tubes and, consequently, the heat transfer coefficient.
-
The reduction of the overall heat transfer conductance in the last phase of the evaporation process was due to a reduction of the film mass flow rate, i.e., the flow rate recirculated by the refrigerant pump. In fact, the recirculated flow rate decreased throughout the process due to a reduction of the refrigerant content in the evaporator, which in turn led to a lower hydrostatic pressure at the pump inlet and to a higher cavitation. This suggests that to ensure proper operation of the evaporator in a real application, the evaporation amount of refrigerant in the evaporator has to be maintained above a certain limit.
-
The experimental data resulting from this work will be used to develop and calibrate a numerical model able to predict the evaporator performance given the operating conditions and the recirculated mass flow rate.

Author Contributions

Conceptualisation, T.T., W.M. and A.F.; methodology, T.T., A.F., W.M. and S.V.; investigation, T.T., A.F., W.M., S.V. and T.V.; data curation, T.V.; writing—original draft preparation T.T., A.F. and T.V.; writing—review and editing, T.T., S.V., A.F. and W.M. All authors have read and agreed to the published version of the manuscript.

Funding

This research received no external funding.

Informed Consent Statement

Not applicable.

Conflicts of Interest

The authors declare no conflict of interest.

Nomenclature

A Area, m2
DDiameter, m
LLength, m
CpSpecific heat, J/(kg K)
m ˙ Mass flow rate, kg/s
Q ˙ Heat transfer rate, W
TTemperature, °C
∆TTemperature difference, °C
U Overall heat transfer coefficient, W/(m2 K)
UAOverall evaporator heat transfer conductance, W/K
h Heat transfer coefficient, W/(m2 K)
hA Heat transfer conductance, W/K
kThermal conductivity, W/(m K)
fFriction factor
ReReynolds number
NuNusselt number
Subscripts
in inlet
out outlet
int internal
ext external
steelsteel
chw chilled water
sat saturation

References

  1. San, J.Y.; Tsai, F.K. Testing of a lab-scale four-bed adsorption heat pump. Appl. Therm. Eng. 2014, 70, 274–281. [Google Scholar] [CrossRef]
  2. Lanzerath, F.; Bau, U.; Seiler, J.; Bardow, A. Optimal design of adsorption chillers based on a validated dynamic object-oriented model. Sci. Technol. Built Environ. 2015, 21, 248–257. [Google Scholar] [CrossRef] [Green Version]
  3. Kazemi, M.A.; Nobes, D.S.; Elliott, J.A. Experimental and numerical study of the evaporation of water at low pressures. Langmuir 2017, 33, 4578–4591. [Google Scholar] [CrossRef] [PubMed] [Green Version]
  4. Guo, R.F.; Zhang, L.; Mo, D.M.; Wu, C.M.; Li, Y.R. Study on Evaporation Characteristics of Water in Annular Liquid Pool at Low Pressures. ACS Omega 2021, 6, 5933–5944. [Google Scholar] [CrossRef] [PubMed]
  5. Eames, I.W.; Marr, N.J.; Sabir, H. The evaporation coefficient of water: A review. Int. J. Heat Mass Transf. 1997, 40, 2963–2973. [Google Scholar] [CrossRef]
  6. Giraud, F.; Rullière, R.; Toublanc, C.; Clausse, M.; Bonjour, J. Experimental evidence of a new regime for boiling of water at subatmospheric pressure. Experimetal Fluid Sci. 2015, 60, 45–53. [Google Scholar] [CrossRef]
  7. Lee, W.S.; Park, M.Y.; Duong, X.Q.; Cao, N.V.; Chung, J.D. Effects of Evaporator and Condenser in the Analysis of Adsorption Chillers. Energies 2020, 13, 1901. [Google Scholar] [CrossRef] [Green Version]
  8. Ribatski, G.; Jacobib, A.M. Falling-film evaporation on horizontal tubes—Accritical review. Int. J. Refrig. 2005, 28, 635–653. [Google Scholar] [CrossRef]
  9. Seiler, J.; Lanzerath, F.; Jansen, C.; Bardow, A. Only a wet tube is a good tube: Understanding capillary-assisted thin-film evaporation of water for adsorption chillers. Appl. Therm. Eng. 2019, 147, 571–578. [Google Scholar] [CrossRef]
  10. Xia, Z.Z.; Yang, G.Z.; Wang, R.Z. Experimental investigation of capillary-assisted evaporation on the outside surface of horizontal tubes. Int. J. Heat Mass Transf. 2008, 51, 4047–4054. [Google Scholar] [CrossRef]
  11. Freni, A.; Bonaccorsi, L.; Proverbio, E.; Maggio, G.; Restuccia, G. Zeolite synthesised on copper foam for adsorption chillers: A mathematical model. Microporous Mesoporous Mater. 2009, 120, 402–409. [Google Scholar] [CrossRef]
  12. Mahdavikhah, M.; Niazmand, H. Effects of plate finned heat exchanger parameters on the adsorption chiller performance. Appl. Therm. Eng. 2013, 50, 939–949. [Google Scholar] [CrossRef]
  13. Giraud, F.; Toublanc, C.; Rullière, R.; Bonjour, J.; Clausse, M. Experimental study of water vaporisation occurring inside a channel of a smooth plate-type heat exchanger at subatmospheric pressure. Appl. Therm. Eng. 2016, 106, 180–191. [Google Scholar] [CrossRef]
  14. Thimmaiah, P.C.; Sharafian, A.; Rouhani, M.; Huttema, W.; Bahrami, M. Evaluation of low-pressure flooded evaporator performance for adsorption chillers. Energy 2017, 122, 144–158. [Google Scholar] [CrossRef]
  15. Lanzerath, F.; Seiler, J.; Erdogan, H.; Schreiber, M.; Steinhilber, A. Bardow The impact of filling level resolved: Capillary-assisted evaporation of water for adsorption heat pumps. Appl. Therm. Eng. 2016, 102, 513–519. [Google Scholar] [CrossRef] [Green Version]
  16. Schnabel, L.; Witte, K.; Kowol, J.; Schossig, P. Evaluation of different evaporator concepts for thermally driven sorption heat pumps and chiller. In Proceedings of the Sorption Heat Pump Conference, Padova, Italy, 6–8 April 2011; pp. 525–543. [Google Scholar]
  17. Cheppudira, T.P.; Sharafian, A.; Huttema, W.; Bahrami, M. Effects of capillary-assisted tubes with different fin geometries on the performance of a low-operating pressure evaporator for adsorption cooling systems. Appl. Energy 2016, 171, 256–265. [Google Scholar] [CrossRef]
  18. Yu, L.H.; Xu, S.X.; Ma, G.Y.; Wang, J. Experimental Research on Water Boiling Heat Transfer on Horizontal Copper Rod Surface at Sub-Atmospheric Pressure. Energies 2015, 8, 10141–10152. [Google Scholar] [CrossRef] [Green Version]
  19. Palomba, V.; Frazzica, A. Experimental study of a fin-and-tube heat exchanger working as evaporator in subatmospheric conditions. Appl. Therm. Eng. 2020, 175, 115336. [Google Scholar] [CrossRef]
  20. Volmer, R.; Eckert, J.; Füldner, G.; Schnabel, L. Evaporator development for adsorption heat transformation devices–Influencing factors on non-stationary evaporation with tube-fin heat exchangers at sub-atmospheric pressure. Renew. Energy 2017, 110, 141–153. [Google Scholar] [CrossRef]
  21. Giraud, F.; Toublanc, C.; Rullière, R.; Bonjour, J.; Clausse, M. Experimental study of water vaporisation occurring inside the channel of a smooth-plate type heat exchanger connected to an adsorber and comparison with trends observed in absorption configuration. Int. J. Refrig. 2017, 77, 60–74. [Google Scholar] [CrossRef]
  22. Li, W.; Wu, X.Y.; Luo, Z.; Webb, R.L. Falling water film evaporation on newly-designed enhanced tube bundles. Int. J. Heat Mass Transf. 2011, 54, 2990–2997. [Google Scholar] [CrossRef]
  23. Bergman, T.L.; Lavine, A.S.; Incropera, F.P.; DeWitt, D.P. Fundamentals of Heat and Mass Transfer; John Wiley and Sons: New York, NY, USA, 2011. [Google Scholar]
Figure 1. Photo (a) and functional scheme (b) of the test rig.
Energies 15 01709 g001
Figure 2. Schematic representation of the evaporator.
Energies 15 01709 g002
Figure 3. Hydraulic and vacuum circuits scheme (F = flow meter, T = thermo-resistance, P = pressure transducer).
Energies 15 01709 g003
Figure 4. Evaporation power and UA trends by varying inlet chilled water temperature and water content inside the evaporator.
Energies 15 01709 g004
Figure 5. Evaporation exchanged power and UA trends by varying T bed , in and T chw , in .
Energies 15 01709 g005
Figure 6. Flow rate variation by varying hydrostatic pressure for the whole evaporation process (a) and only for the initial phase (b).
Energies 15 01709 g006
Figure 7. Flow rate variation by varying water content inside the evaporator for all tested conditions (a) and only for T c h w , i n = 20 °C tests (b).
Energies 15 01709 g007
Table 1. Evaporator geometrical data.
ParameterValueDescription
a (m)0.503evaporator casing width
b (m)0.113evaporator casing depth
c (m)0.283evaporator casing height
Lpipe (m)5.4191total length of the evaporator internal pipe
N°C (-)2number of coils
N°L (-)6number of levels for each coil
dext,pipe (m)0.016external base pipe diameter
dint,pipe (m)0.015internal base pipe diameter
h (m)0.003fin height
p (m)0.004space between consecutive fins
Ksteel  W m   K 17Thermal conductivity of the corrugated pipe
Aext (m²)0.7619external exchange surface of the evaporator internal pipe
Aint (m²)0.6124internal exchange surface of the evaporator internal pipe
Vref (m³)0.0136internal volume of the exchanger occupied by the liquid refrigerant
Table 2. Sensors’ range and accuracy.
Test Bench SensorsMeasured ParameterRangeAccuracy
Resistance temperature detector (Pt 100 1/10 DIN class)water temperature at inlet/outlet of the component−10–100 °C±0.03 °C at 0 °C
Pressure transmitterpressure inside the component0–20 kPa0.25% of reading
Magnetic flow meterwater flow rate through the component200–1000 L/h<0.5% of reading
Ultrasonic flow meterrecirculated water flow rate in the evaporator0–600 L/h±3% of reading
Table 3. Relative composed uncertainty average values for the evaporation process plateau.
m ˙ chw   ( L / h ) 2001000
T chw , in   ( ° C ) 720720
( δ Q ˙ evap Q ˙ evap ) 2.55%2.54%12.80%1.06%
( δ UA UA ) 6.40%4.18%16.13%2.85%
Table 4. Evaporation exchanged power and UA average plateau values.
Water Content (kg)Time Range (s) Q ˙ e v a p ¯ (W) U A ¯ (W/K)
Tchw,in = 20°C0.9180–280−3296561
1.2180–280−3267547
1.5180–280−3292561
Tchw,in = 15°C0.9180–480−2688573
1.2180–480−2549544
1.5180–480−2656545
Tchw,in = 10°C0.9180–780−2070562
1.2180–780−2026573
1.5180–780−2081551
Table 5. Evaporation heat transfer conductance average plateau values.
T c h w , i n (°C) 7 12 20
m ˙ c h w (L/h) 200400100020040010002004001000
U A ¯ (W/K)420638940438631948476653945
R e i n t ¯ (-)3356650916,8493794763820,006487710,30726,595
h i n t A i n t ¯ (W/K)696147736237761651398995719964641
h e x t A e x t ¯ (W/K)122312941492114811601454114410941375
Publisher’s Note: MDPI stays neutral with regard to jurisdictional claims in published maps and institutional affiliations.

