Article

The Estimation of Lightning Impulses Superimposed onto Pre-Stressed DC Breakdown Voltages Using the Leader Propagation Method

Department of Electrical Engineering, College of Engineering, King Saud University, Riyadh 11421, Saudi Arabia
*
Authors to whom correspondence should be addressed.
Energies 2022, 15(5), 1708; https://doi.org/10.3390/en15051708
Submission received: 30 December 2021 / Revised: 31 January 2022 / Accepted: 8 February 2022 / Published: 24 February 2022

Abstract

:
The impulse breakdown attributes are of rudimentary importance in the insulation coordination in the gas-insulated switchgear (GIS). The critical voltage waveshape for the insulation is the surge over voltages. Usually, such over-voltages will emerge on the electrical equipment while these are burdened under DC or AC working voltages. Therefore, during relatively small-time intervals, the undermined devices are exposed to surge voltages that are superimposed upon the already running DC or AC voltages. From a safety point of view, and for providing reliable power to the consumer, we need to study the breakdown characteristics under such over-voltages, with reference to normal operating voltages (DC or AC). The breakdown mechanism of the GIS under compressed SF6 gas is known to be controlled by a stepped leader propagation method. Although different experimental studies have been conducted by many researchers for different experimental conditions under DC, AC, or impulse high voltages alone, not much research has been performed, in a systematic way, to model and estimate the breakdown voltages of the GIS under such superimposed conditions. This paper presents a systematic model, using a leader propagation technique for the estimation of breakdown voltages for complex voltage conditions, i.e., a lightning impulse (LI) superimposed on pre-stressed DC for different experimental conditions. The estimated values are in good agreement with the measured experimental results.

1. Introduction

The use of compact GIS has enabled the closed-packed modeling of switchgears and substations. However, the conducting protrusion contaminations in gas-insulated equipment can remarkably damage the robustness of the insulation. In order to ameliorate the dependability of the GIS, many studies have been produced, presuming the particle motion behavior, as well as particle-activated breakdown attributes in various gas gaps, with and without spacers, under several administered voltage wave shapes [1,2,3,4,5,6,7,8,9].
The impulse breakdown attributes are of rudimentary significance in the insulation coordination in the GIS. The critical voltage wave shapes for the insulation are surge over voltages. Usually, such surges include lightning and switching impulse voltages, and they emerge on the electrical apparatus while it is burdened under DC or AC working voltages. Therefore, during relatively small-time intervals, the undermined devices are exposed to surge voltages superimposed upon the already running DC or AC voltages. In some cases, the amplitude of superimposed voltage is too high, and may cause the malfunction of protection relays, causing tripping. Therefore, from safety point of view, and to provide reliable power to the consumer, we need to study the breakdown characteristics under such over-voltages, with reference to normal operating voltages (DC or AC).
There has been much research on coronas, as well as the partial discharge and breakdown voltage estimations of standalone DC, AC, and LI on various GIS gas gaps [10,11,12,13,14,15,16]. For example, the association of PD and its phase has been examined under AC voltages, as a way to discern distinct types of faults. Additionally, the PD magnitude and repetition rates are studied to identify the severity of insulation aging. Although PD attributes, with lightning impulses and switching impulses, have also been investigated broadly to inspect the discharge characteristics [1,17,18,19,20], prior studies have mainly concentrated on a single class of voltage, i.e., the DC voltage or impulse voltages, which have been exerted alone, without considering the consequences of a superimposed AC or DC and impulse voltage. Some researchers studied the combined effect experimentally [21,22,23,24,25] but they lack the mathematical modelling that can easily estimate and predict the breakdown under such superimposed voltage conditions. Therefore, it will be meaningful to investigate, systematically, the breakdown activities, with impulse voltages superimposed on a pre-stressed DC voltage for the GIS insulation.
Under residual DC voltages, metallic particles can find their way into the space between the disconnectors [26,27,28,29,30]. As a result, the electric field is distorted, and the charge accumulation intensifies. This distortion of the electric field is greatest if the metallic particle is in contact with the high-voltage electrodes. As a result, there is a non-homogenous electric field in the region between the electrodes. These defects in the GIS have the possibility of causing damage to the insulation.
Many researchers have performed experimental studies [21,22,23,24,25,31] in order to find the breakdown characteristics under the superimposed lightning impulses on the pre-stressed DC high-voltages. However, no mathematical modelling was available in the literature in order to estimate and/or validate these experimental results. This highlights the need to design a mathematical model which can estimate and validate the superimposed lightning impulses on the pre-stressed DC breakdown values presented by different researchers [21,31]. Hence, this research is motivated to design an accurate mathematical model that estimates the breakdown of the GIS under superimposed voltages.
In this paper, a mathematical model is developed and presented for the estimation of the breakdown voltage in a typical GIS gas gap under LI, superimposed on pre-stressed DC voltages. The model accurately estimates the breakdown under various combined overvoltage waveforms. The effect of a spacer (without and with contaminating particles) between the electrode gap is also considered. The simulation results are then compared with recent experimental data available in the literature [21,31] and are found to be in good agreement.
Although there are models that estimate the breakdown characteristics of various standalone voltages, such as DC, AC, or impulse voltages only, no mathematical model that estimates the breakdown of the GIS under superimposed voltages is available in the literature. This research has contributed to designing a mathematical model that can accurately estimate the breakdown voltage under such superimposed voltage conditions.
Section 2 of the paper explains the simulation model/experimental setup. Section 3 and Section 4 explain the developed mathematical model and its flowchart, respectively. The results and discussion are discussed in Section 5.

2. Simulation Model Setup

Although the basic configuration of the electrode system in the GIS is commonly co-axial, in order to simplify the calculation and to easily estimate and compare the estimated breakdown voltages with the experimental values, in this paper, a pair of parallel plain electrodes commonly found in the GIS are used, as shown in Figure 1a. The breakdown voltage estimation model presented in this paper consists of three experimental setups:
  • Case 1 (i.e., gas gap with contaminating particle): A pair of plain electrodes (with a gap length of D = 50 mm) with particles (with a particle length of L = 10 mm) but without spacers. The simulations were conducted with the gap filled with SF6 gas at different pressure values of 0.1 MPa, 0.2 MPa, 0.3 MPa, and 0.4 MPa. LI voltages were superimposed onto pre-stressed DC voltages to the HV electrode;
  • Case 2 (i.e., gas gap with a spacer without contaminating particles): A pair of plain electrode gaps (with a gap length of D = 15 mm) without particles but with a spacer (εr = 5.93). The simulations were conducted with the gap filled with SF6 gas at a pressure value of 0.4 MPa. LI voltages were superimposed onto pre-stressed DC voltages to the HV electrode;
  • Case 3 (i.e., gas gap with a spacer and contaminating particles): Aair of plain electrode gaps (with a gap length of D = 15 mm) with particles (particle length L = 3 mm) and with a spacer (εr = 5.93). These simulations were also conducted with the gap filled with SF6 gas at a pressure value of 0.4 MPa. LI voltages were superimposed onto pre-stressed DC voltages to the HV electrode.
Different unipolar and bipolar superimposed impulse stresses are usually generated in the power systems, as shown in Figure 1b, i.e., positive lightning impulses superimposed on (±) pre-stressed DC voltages. Moreover, negative lightning impulses, superimposed on (±) pre-stressed DC voltages, can also be generated. UDC is the amplitude of the pre-applied DC voltage and Uimp is the peak value of the lightning impulse. U0 is the algebraic sum of the (±) LI and (±) pre-stressed DC voltages. Table 1 covers the main notations used in this paper. A brief description about the notations, along with their values and units (if any), are also mentioned.

3. Mathematical Model

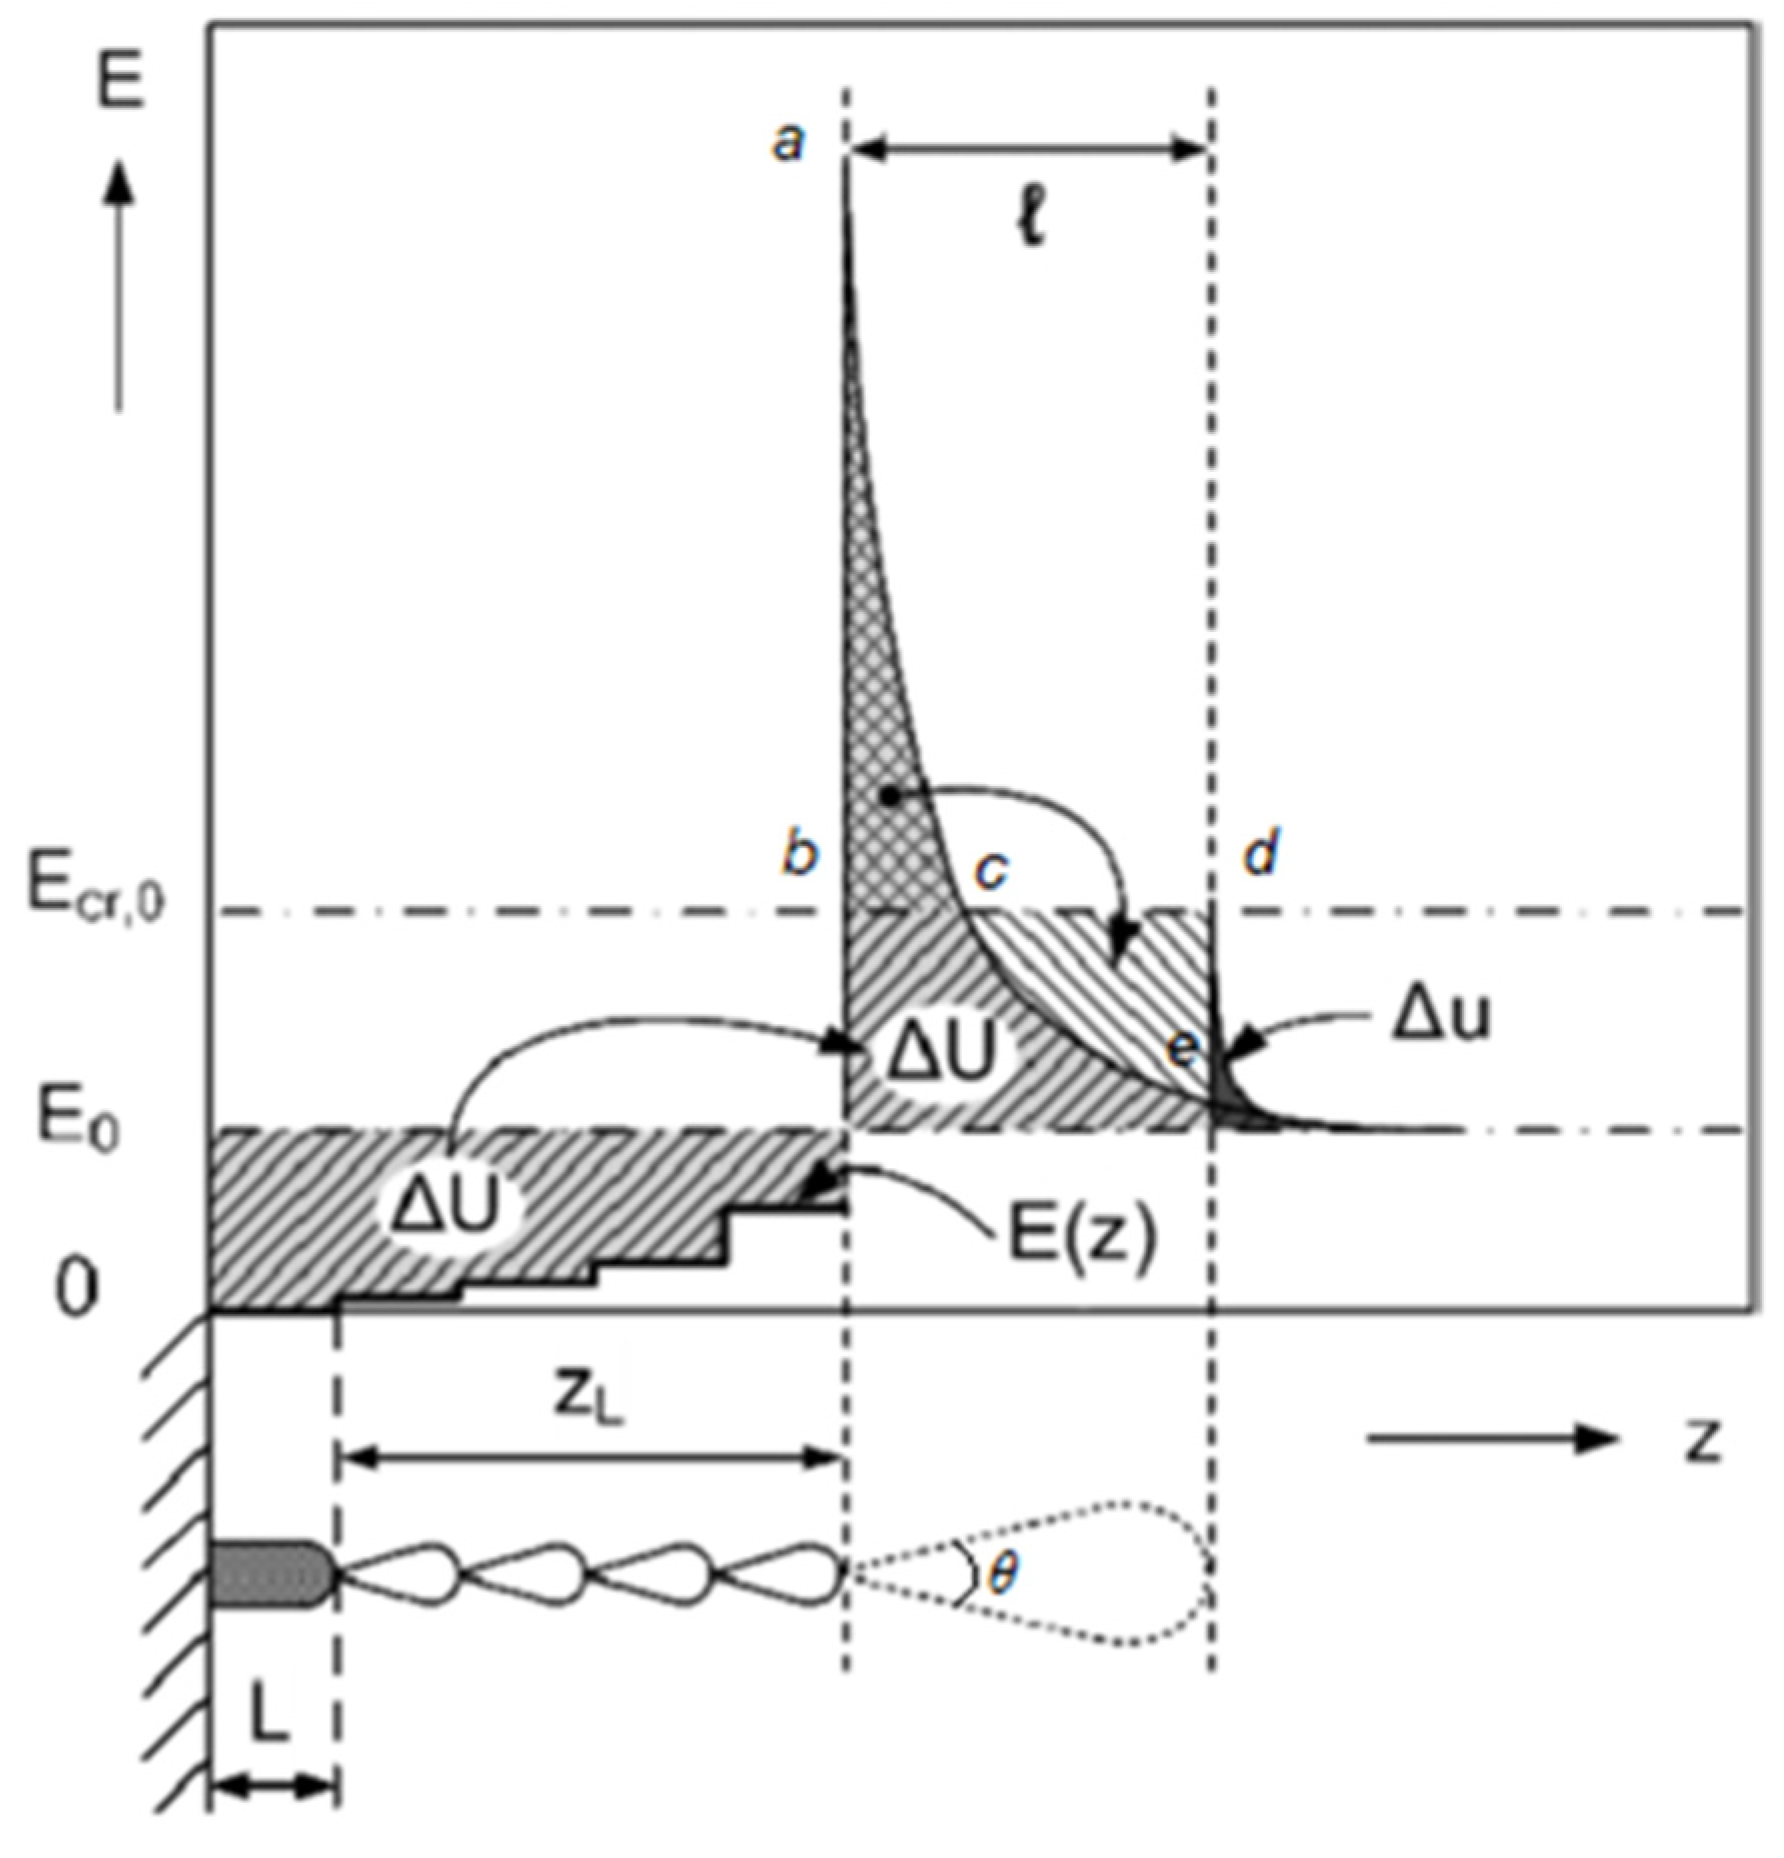
Let us consider that the voltage U0 is applied to the simulation model indicated in Figure 2. The uniform electric field in the space between the electrodes is Eo = U (DC or Imp)/D, where D is the distance between the electrodes. A discharge channel is formed in the gap, due to a metallic protrusion aligned in the direction of the electric field. In this discharge channel, the field increases to E(z) at every iteration step. As can be observed in Figure 2, the protrusion distributes the field in such a way that an enhancement is produced in front of it. This field can be integrally characterized by the voltage difference ΔU as [32]:
Δ U = E o · ( L + z L ) 0 ( L + z L ) E ( z ) · d z
where L is the length of the protrusion and zL is the length of the discharge channel.
The voltage difference ΔU in the enhancement zone can be redistributed, such that [32]:
Δ U = l · ( E cr , 0 E o )
where Ecr,0 is the critical electric field of the gas at an ambient temperature (e.g., the critical electric field of SF6 gas (at atmospheric pressure and T0 = 27 °C) is 90 kVcm−1). In these calculations, it is assumed that Δabc = Δcde, as shown in Figure 2 above. The length l defines the streamer channel length scale of the streamer corona and can be rearranged to get:
l = Δ U ( E cr , 0 E o )
For the special case of the first corona pulse, which starts from the protrusion tip, the Equation (1) gives us ΔU = Eo·L and the length of the first corona comes out to be:
l = L · E o ( E cr , 0 E o )
The charge of the streamer corona [33] can be approximately calculated using:
Q DC = 0.5 · ε o · E cr , 0 · l 2 · ( 1 E o E cr , 0 )
After the charge QDC is fed to the channel, the enthalpy h of the channel, with the initial temperature T0, changes in such a way that [33]:
h = C Δ h · f ( T ) · T 0 T · p 2 C s 2 · Q DC
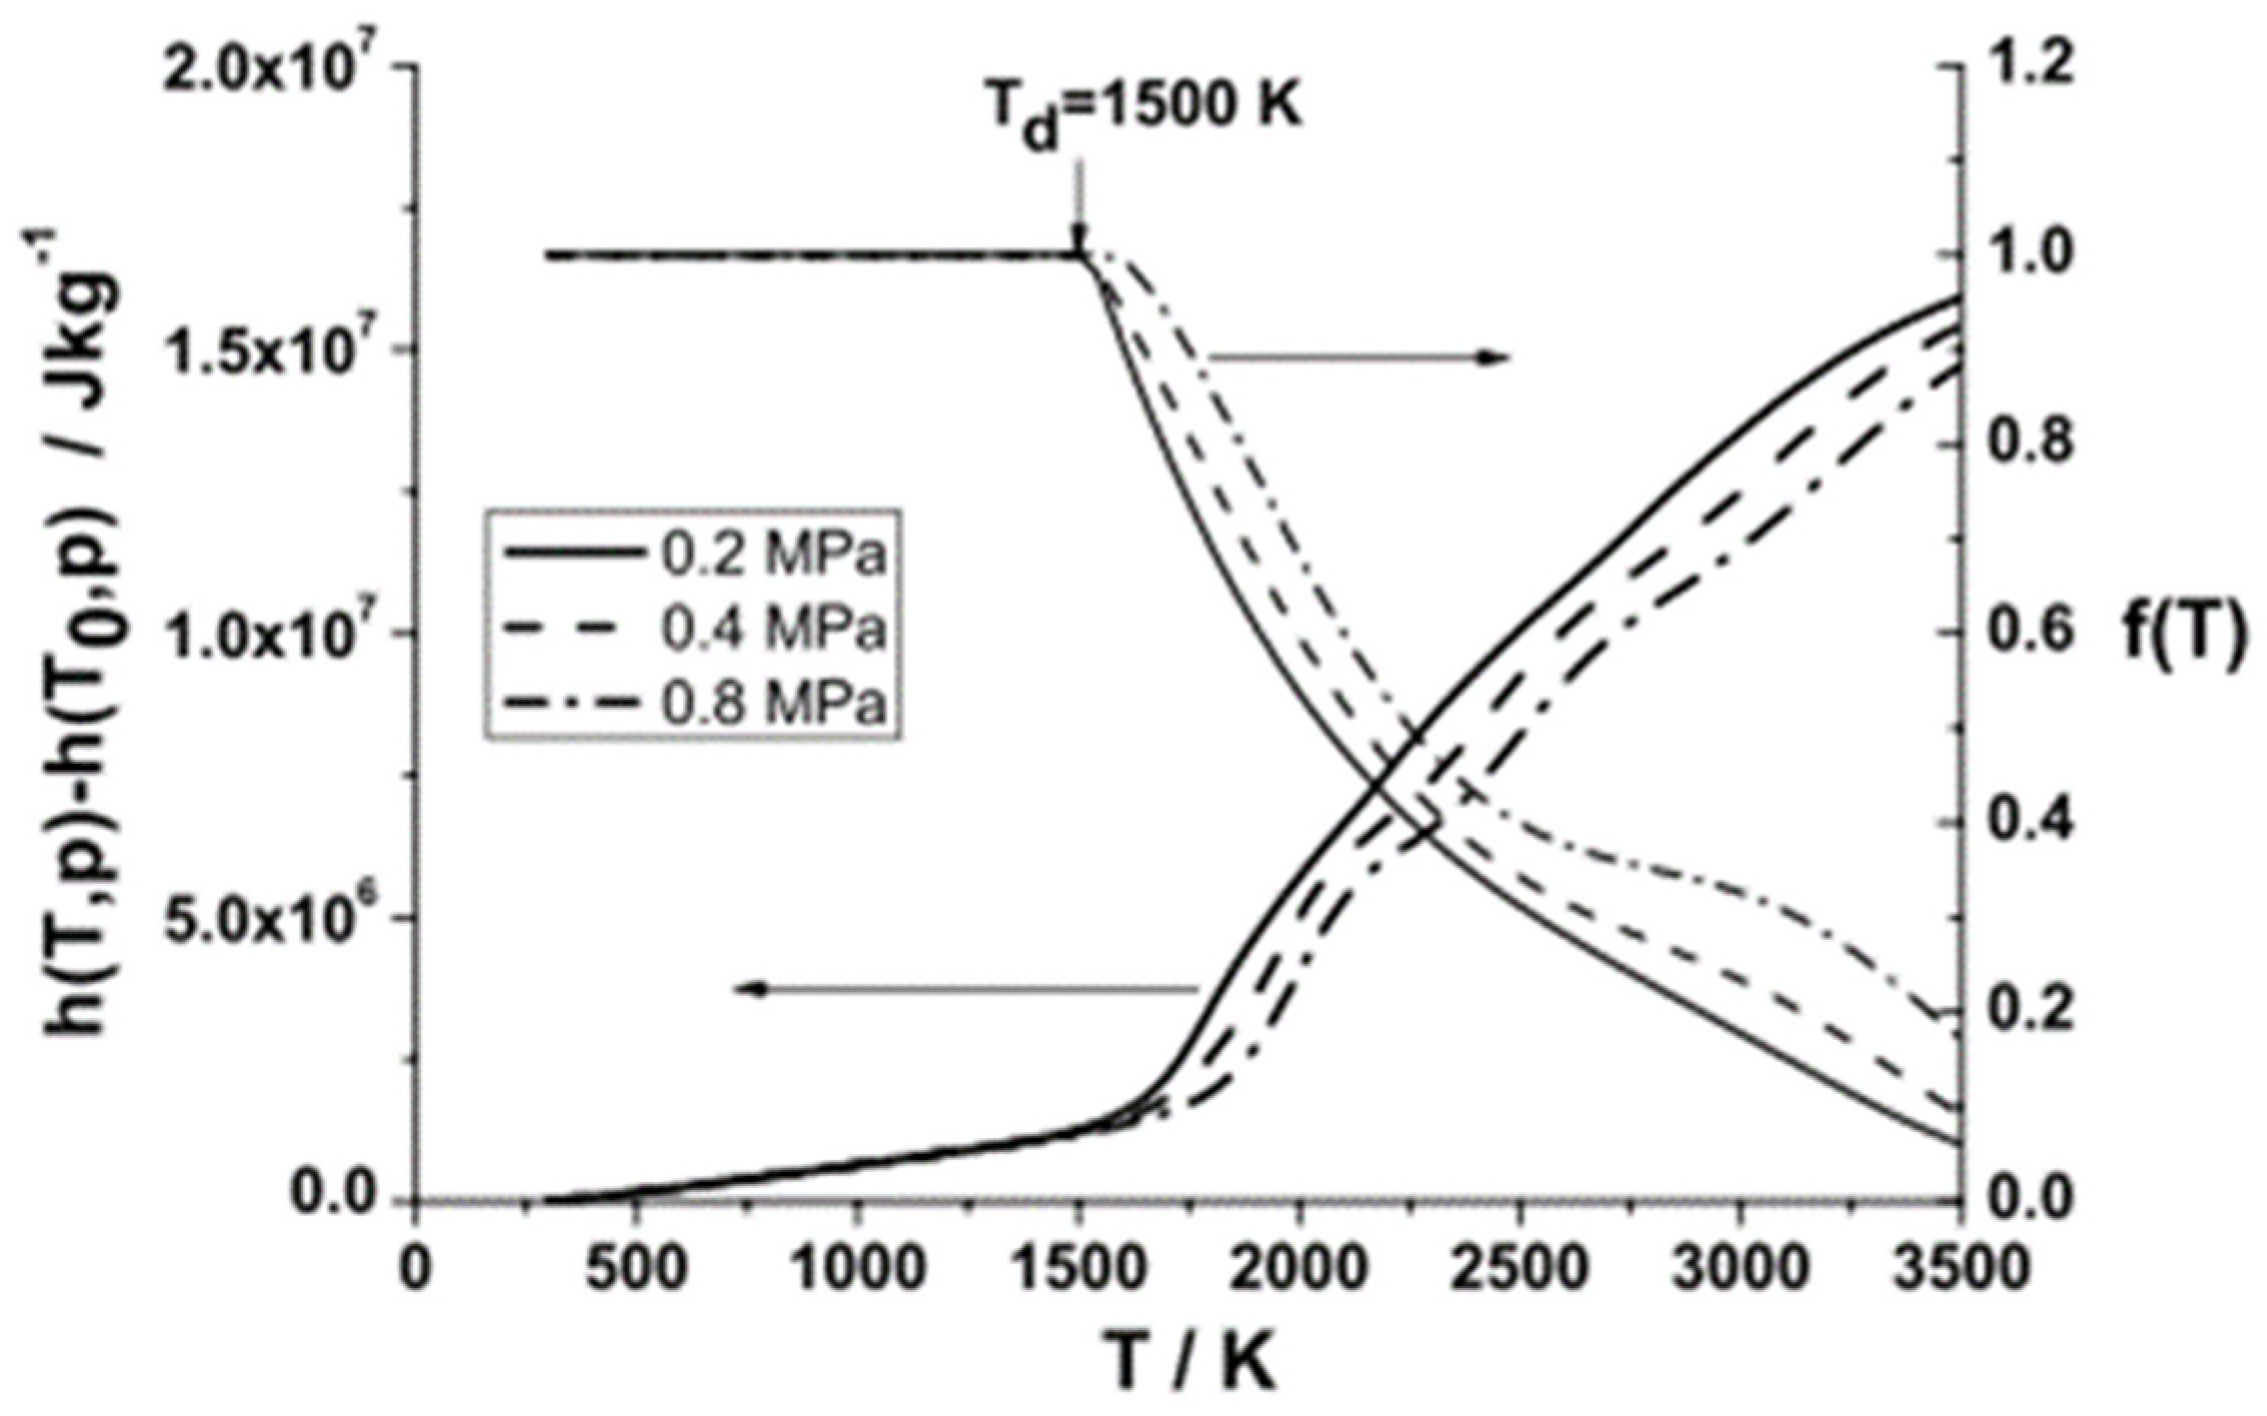
where CΔh is a material constant of SF6, which has the value of 4.8 × 10⁵ Vm2kg−1. Cs relates the leader channel radius with the pressure and has approximate values of 2 and 3 for positive and negative polarities, respectively [34]. The other material functions f(T) and h(T,p) for SF6 gas are given in Figure 3 [35]. After a certain temperature, Td, the critical electric field of the gas is affected by thermal dissociation. This reduction of the critical electric field is adjusted by introducing f(T). The function has no dimensions and varies with temperatures, from 0 to unity. H(T,p) is the enthalpy function of SF6 gas and it is directly proportional to the temperature. From h, in Equation (6), the temperature increase T can be determined using the material function h(T,p) [36], as shown in Figure 3.
The variation in temperature T can be fed into the following equation to find the new value of E(z) ahead of the protrusion.
E ( z ) = ( E p ) cr , 0 ·   p ·   T 0 T · f ( T )
The pressure normalized critical field (E/p)cr,0 is 89 Vm−1pa−1 for SF6 and T0 is 27 °C. This value of the electric field E(z) at the tip of the first corona pulse is then substituted back into Equation (1) to calculate ΔU for the next iteration step, along with the streamer length l. The next iterations continue in the same manner using Equations (1)–(7). The model considers that breakdowns occur when the length l approaches the gap length D.
There are two mechanisms, namely, the stem and the precursor mechanism [37], that are identified in SF6. The stem mechanism [38] relates to the DC voltage case in which there are multiple branches of the streamer, which feed their charge to the common stem. An example of the stem mechanism can be seen in Figure 4a [32]. In a precursor mechanism, a long streamer is observed, as shown in Figure 4b [32]. In a short duration of voltage application (i.e., a lightning impulse voltage), a portion of the total charge enters the main leader channel. This corresponds to αQDC where α << 1. This relates to the impulse voltage case, and a portion of the charge αQDC, i.e., Equation (5), is fed to the leader channel, such that the value of α is 1 for the DC case, whereas it is approximately 0.02 for the lightning impulse voltage.

3.1. Case 1: A Gas Gap without a Spacer

In case of a gas gap without a spacer, the leader channel charge will have the effect of a lightning impulse voltage superimposed on the DC voltage. The superimposed channel charge will be calculated by adding the charge of the streamer corona under DC, as given in Equation (5), above, and the portion of the charge under the lightning impulse will be given as:
Q ( gas   gap ) = Q DC + α Q DC
Q ( gas   gap ) = 0.5 ε 0 l 2 [ ( 1 + α ) E cr , 0 ( E DC + E imp ) ]
where Q(gas gap) is the total corona charge due to the electric fields EDC and Eimp for the applied DC and superimposed impulse voltages, respectively. Equation (9) will be used in place of Equation (5) for the case of superimposed voltages in the gas gap without a spacer.

3.2. Case 2 (i.e., a Gas Gap with a Spacer and without Particles) and Case 3 (i.e., a Gas Gap with a Spacer and with Particles)

Equation (9), above, gives the approximate corona charge of the streamer channel in free space. If a spacer is added to the electrode gap in the proposed simulation model, the surface charge will be considered as well [39], in addition to all calculations mentioned in Equations (1)–(9), above. According to Gauss’s law, the surface charge density ρ of the spacer can be calculated as:
ρ = ε 0 ε SF 6 E ( z ) ε 0 ε r E ep
where εr = 5.93 is the relative permittivity of the epoxy resin insulator. Qsurf = ρ·A represents the surface charge within the conical area A = θl2/2 of the streamer, as shown in Figure 2. The surface charge on the spacer can be calculated as:
Q surf = ε 0 ( ε SF 6 E ( z ) ε r E ep ) · θ l 2 2
Therefore, in the case of a spacer, Qsurf will be added to the Q(gas gap), i.e., the approximate corona charge of the streamer channel in free space is calculated in Equation (9). Hence, with superimposed voltages across the electrodes, the total leader channel charge, in the presence of a spacer, can be calculated as:
Q Spcr = 0.5 ε 0 l 2 [ ( 1 + α ) E cr , 0 ( E DC + E imp ) + θ ( ε SF 6 E ( z ) ε r E ep ) ]
where QSpcr is the channel’s total charge with a spacer, which corresponds to Case 2 and Case 3, the details of which are mentioned in Section 2, above.

4. Simulation Flowchart

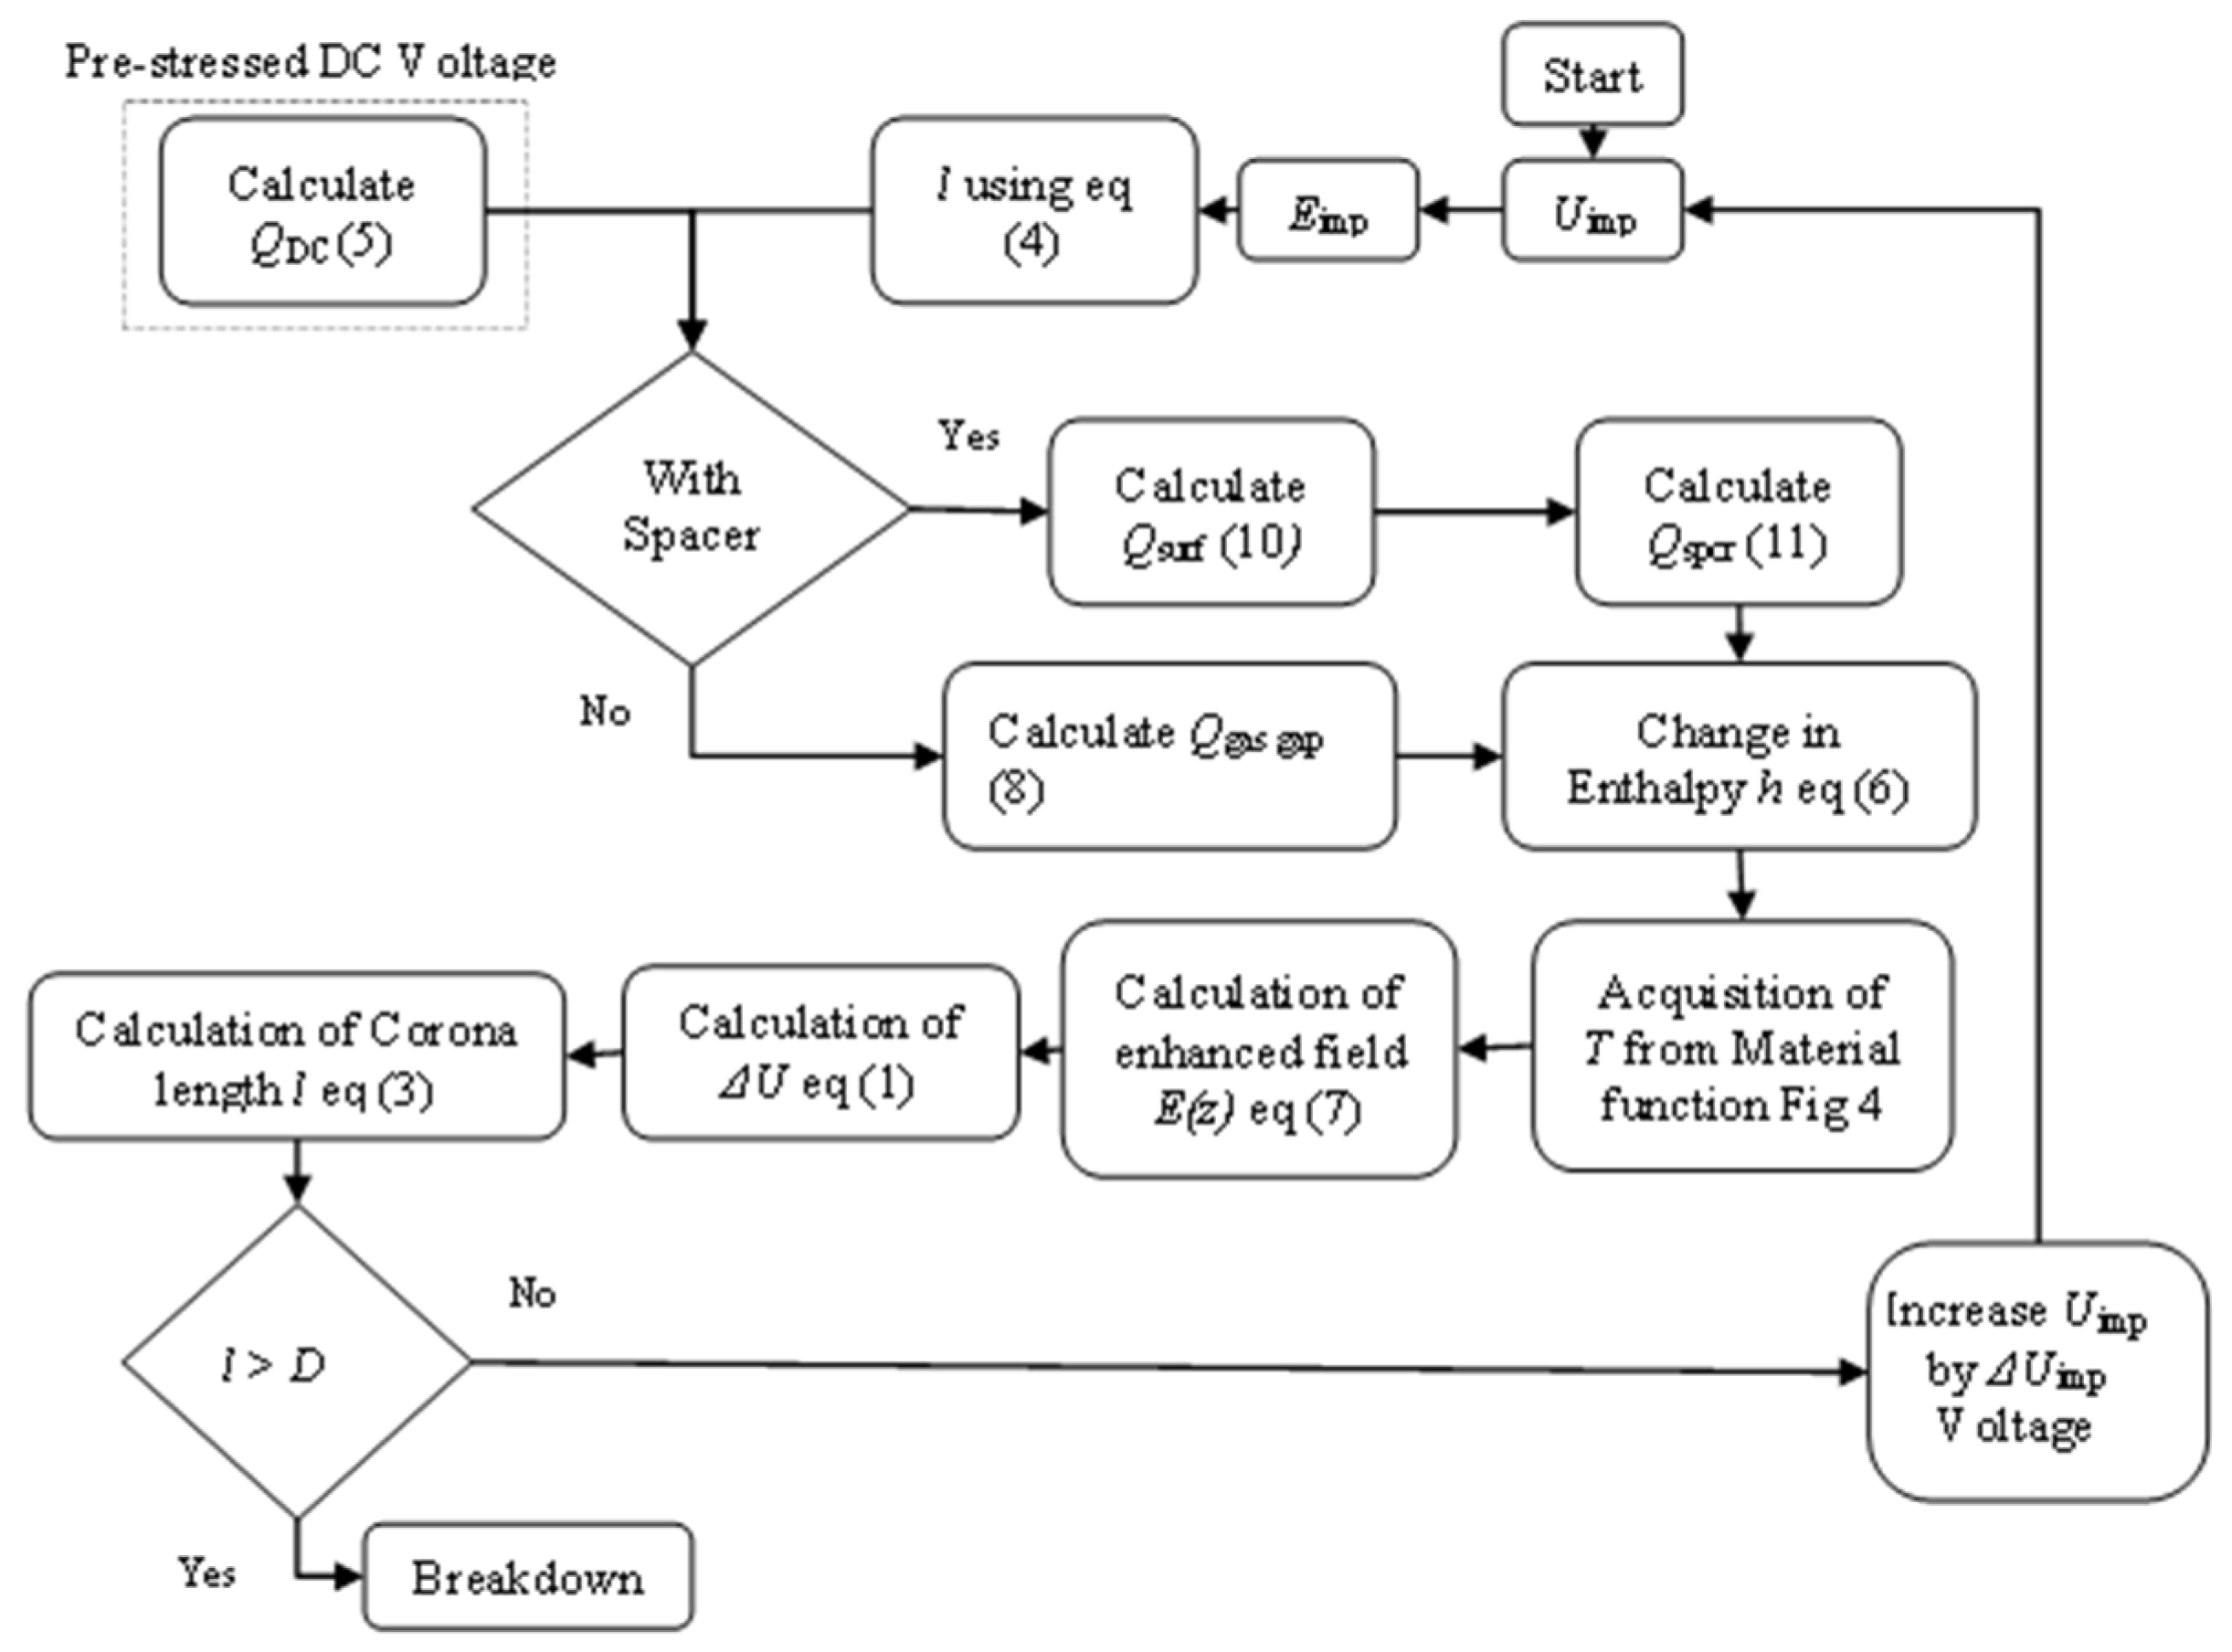
The leader inception is simulated, step by step, using the above Equations (1)–(12) for all the three cases under consideration that were mentioned in Section 2. A suitable pre-stressed DC voltage UDC is decided, and the first corona length is calculated using Equation (4). The streamer corona charge QDC is calculated using Equation (5).
The change in enthalpy h is calculated using Equation (6). For the calculated value of h, the temperature increase T is found using the material function mentioned in Figure 4. T is used to calculate the electrical field value in the streamer channel E(z) using Equation (7). The E(z) value is used in Equation (1) to find the change in potential ΔU. This ΔU is used in Equation (3) to get the length of the streamer l for the next simulation step.
In this way, the above-mentioned steps are repeated until either the streamer length l reaches the gap distance D, or it stops increasing after covering a certain distance in between the electrodes.
For a specific applied voltage, if the streamer length l overcomes the gap distance D, it is considered that the breakdown has occurred. On the other hand, if the streamer length l is unable to cross the gap distance D, it is considered as an arrested leader, and the simulation is repeated with a slightly higher applied voltage UDC until breakdown occurs.
The same steps are followed in the case of lightning impulse voltages superimposed on DC. The only difference is that for the leader channel charge calculation, Equation (9) is used instead of Equation (5), which has the effects of both voltage waveforms incorporated in it.
Now, if the spacer is to be added to this setup, the surface charge is calculated using Equation (11). The leader channel’s total charge can now be calculated using Equation (12). These procedures are depicted in the flow chart, shown in Figure 5.

5. Results and Discussion

5.1. Case 1: The Gas Gap without a Spacer

In order to compare the simulation results obtained using the above-mentioned methodology with the experimental results in recent literature [27], a pair of electrode gaps (with a gap length of D = 50 mm) with particles (with a particle length of l = 10 mm) but without a spacer, was used. The simulations were conducted with a gap filled with SF6 gas at different pressure values of 0.1 MPa, 0.2 MPa, 0.3 MPa, and 0.4 MPa. LI voltages were superimposed on pre-stressed DC voltages to the HV electrode.
As an example, let us consider the case of a lightning impulse, with no pre-stressed DC voltages, with 10 mm of particle contamination. The simulation keeps applying LI impulses, starting from smaller voltages, up until 149 kV. We can see that the charge does not cross the electrode gap of 50 mm, and it is arrested at around 15 mm, as shown in Figure 6a. However, if the applied LI impulse voltage is increased to 151 kV, Figure 6b shows that the charge has crossed the gap length and it is considered as a breakdown voltage. zL is the length of the discharge channel (shown in Figure 2, above) in mm, drawn on the x-axis in Figure 6.
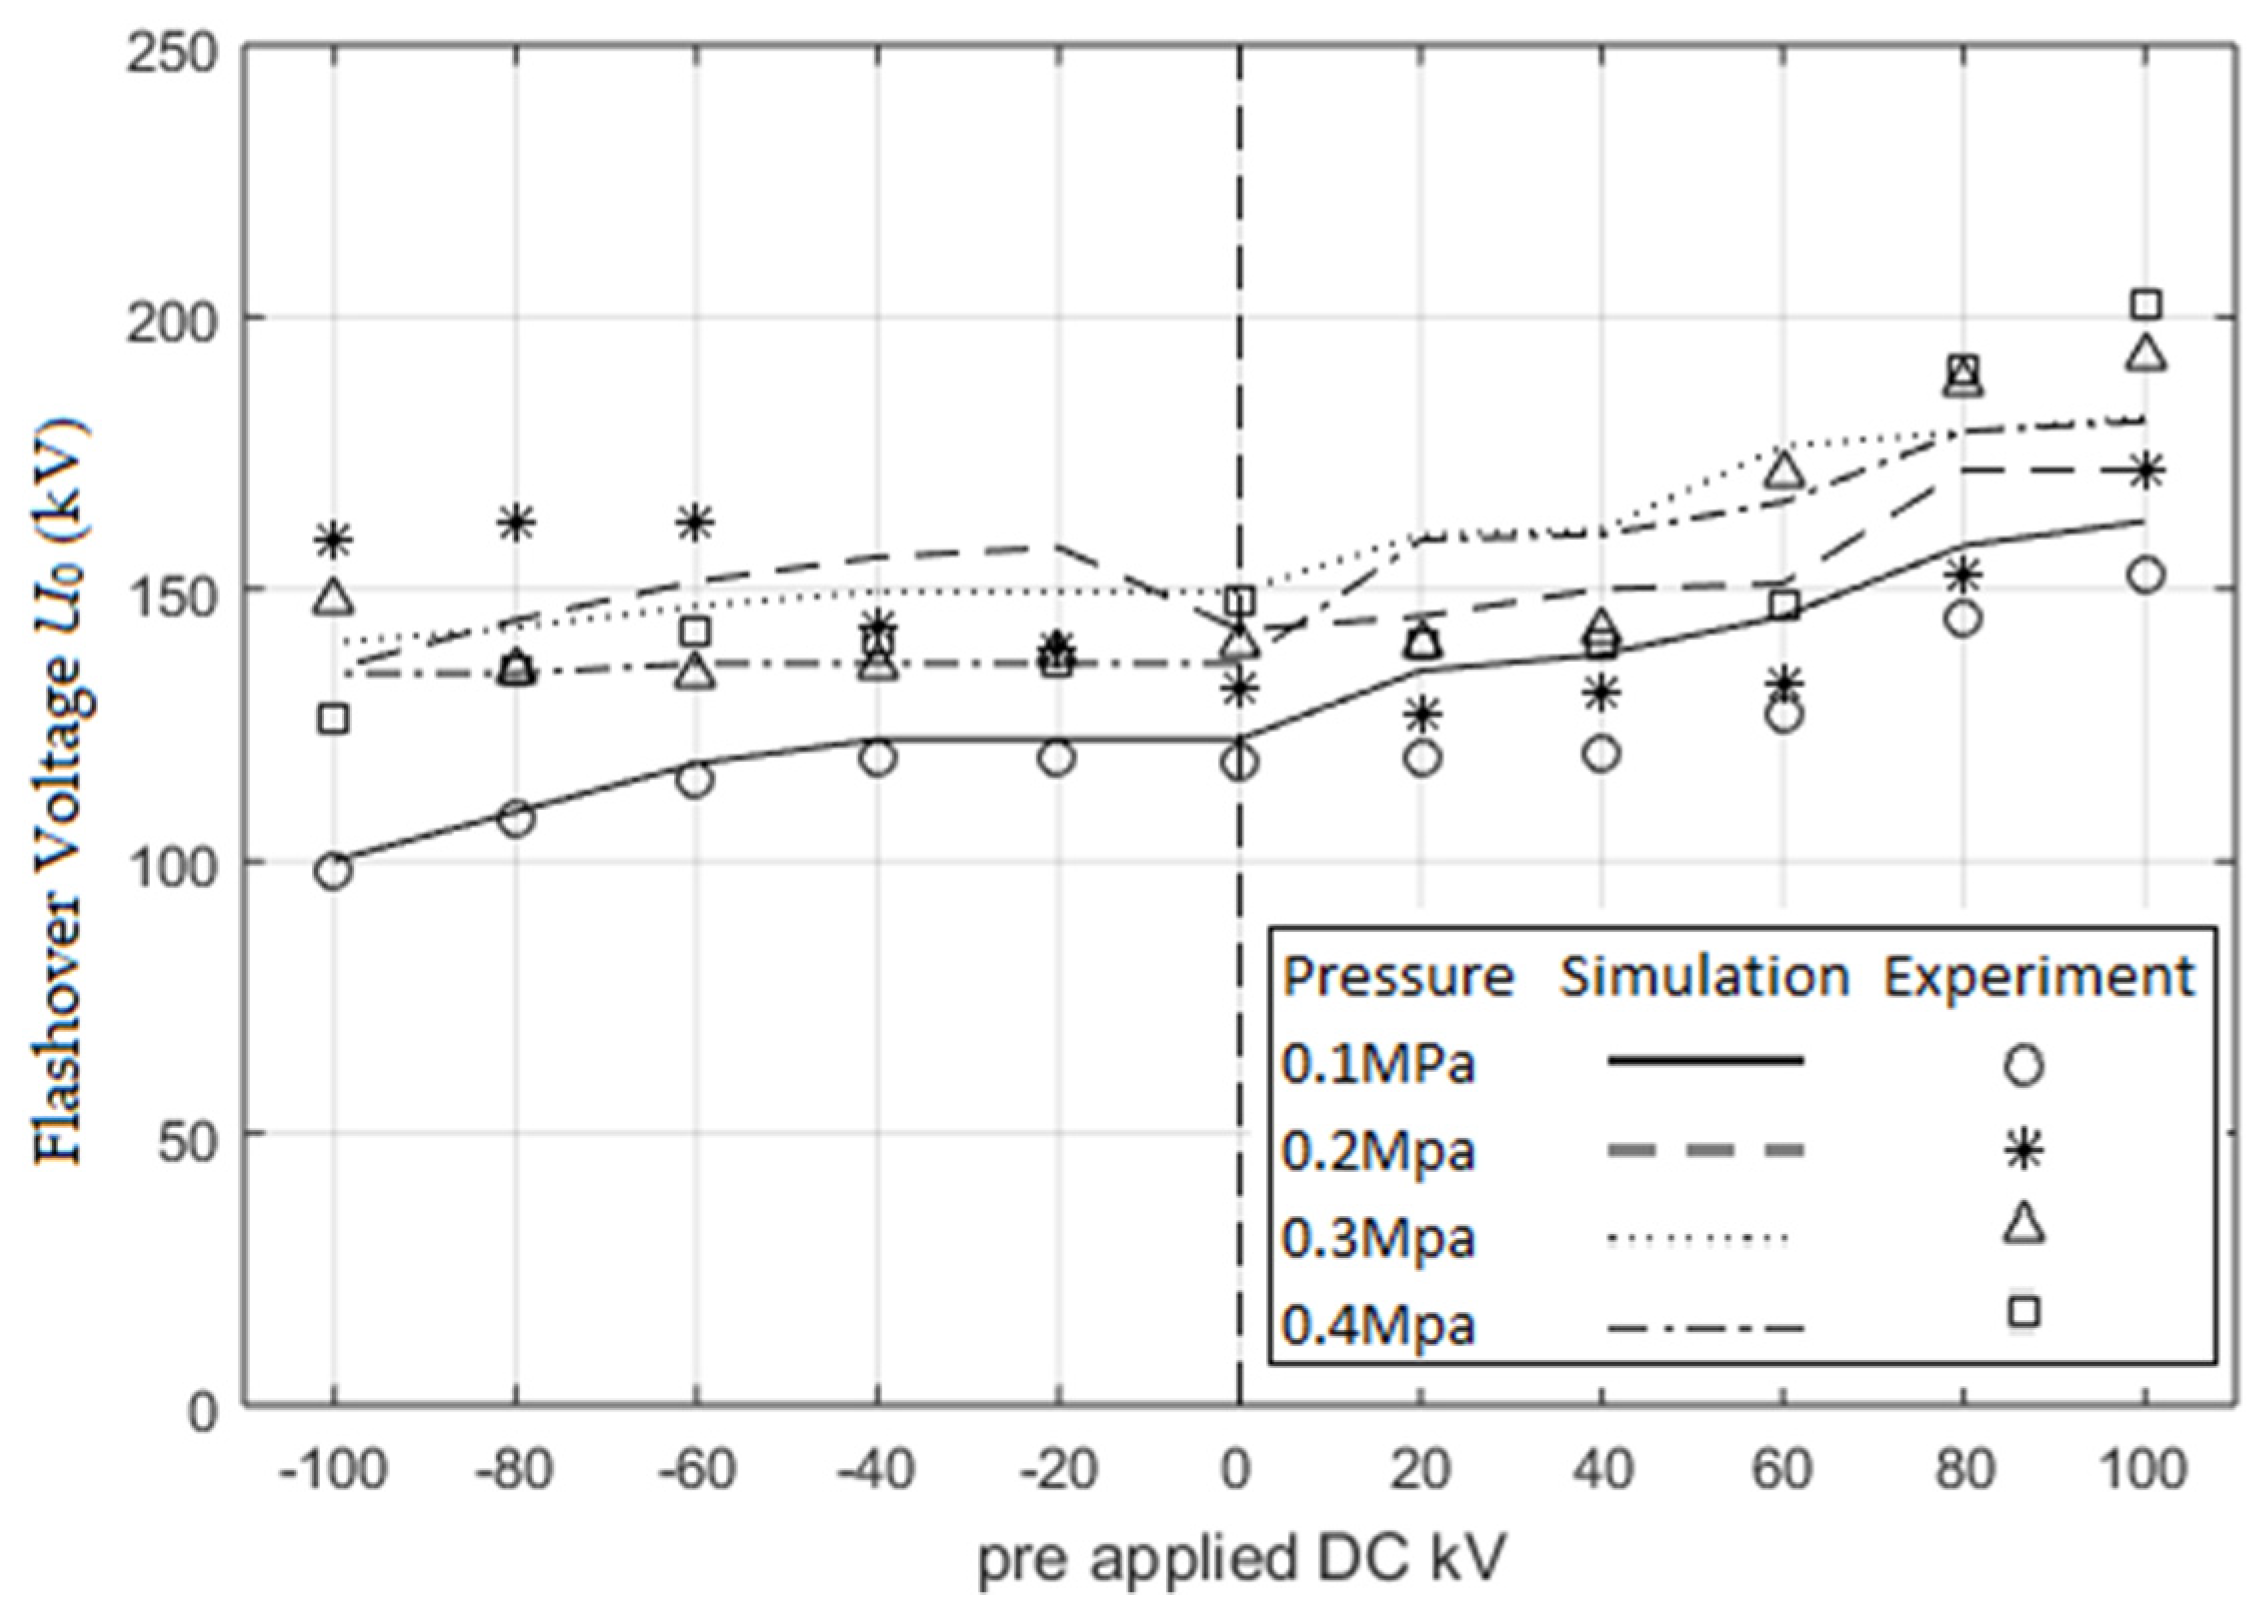
Figure 7 shows the comparisons of simulation results with experimental data [31] for pressure values of 0.1 MPa, 0.2 MPa, 0.3 MPa, and 0.4 MPa. The setup in these figures is without a spacer and with a particle contamination of size 10 mm. It can be seen that with a small variation, the simulation results are in accordance with the experimental data. It may be noted that the flashover voltage, shown in Figure 7, indicates the applied positive lightning impulse voltage only, that is superimposed on pre-stressed ± DC high voltages.

5.2. Case 2: A Gas Gap with a Spacer and without Particles

In order to find the breakdown voltage for Case 2, simulations were conducted with a pair of electrode gaps (with a gap length of D = 15 mm) with a spacer (εr = 5.93) mounted between the two electrodes. The gap was filled with SF6 gas at pressure value of 0.4 MPa. The LI voltage was superimposed on the pre-stressed DC voltage to the HV electrode. The simulation takes the side’s surface area of the epoxy resin for the complete gap distance.
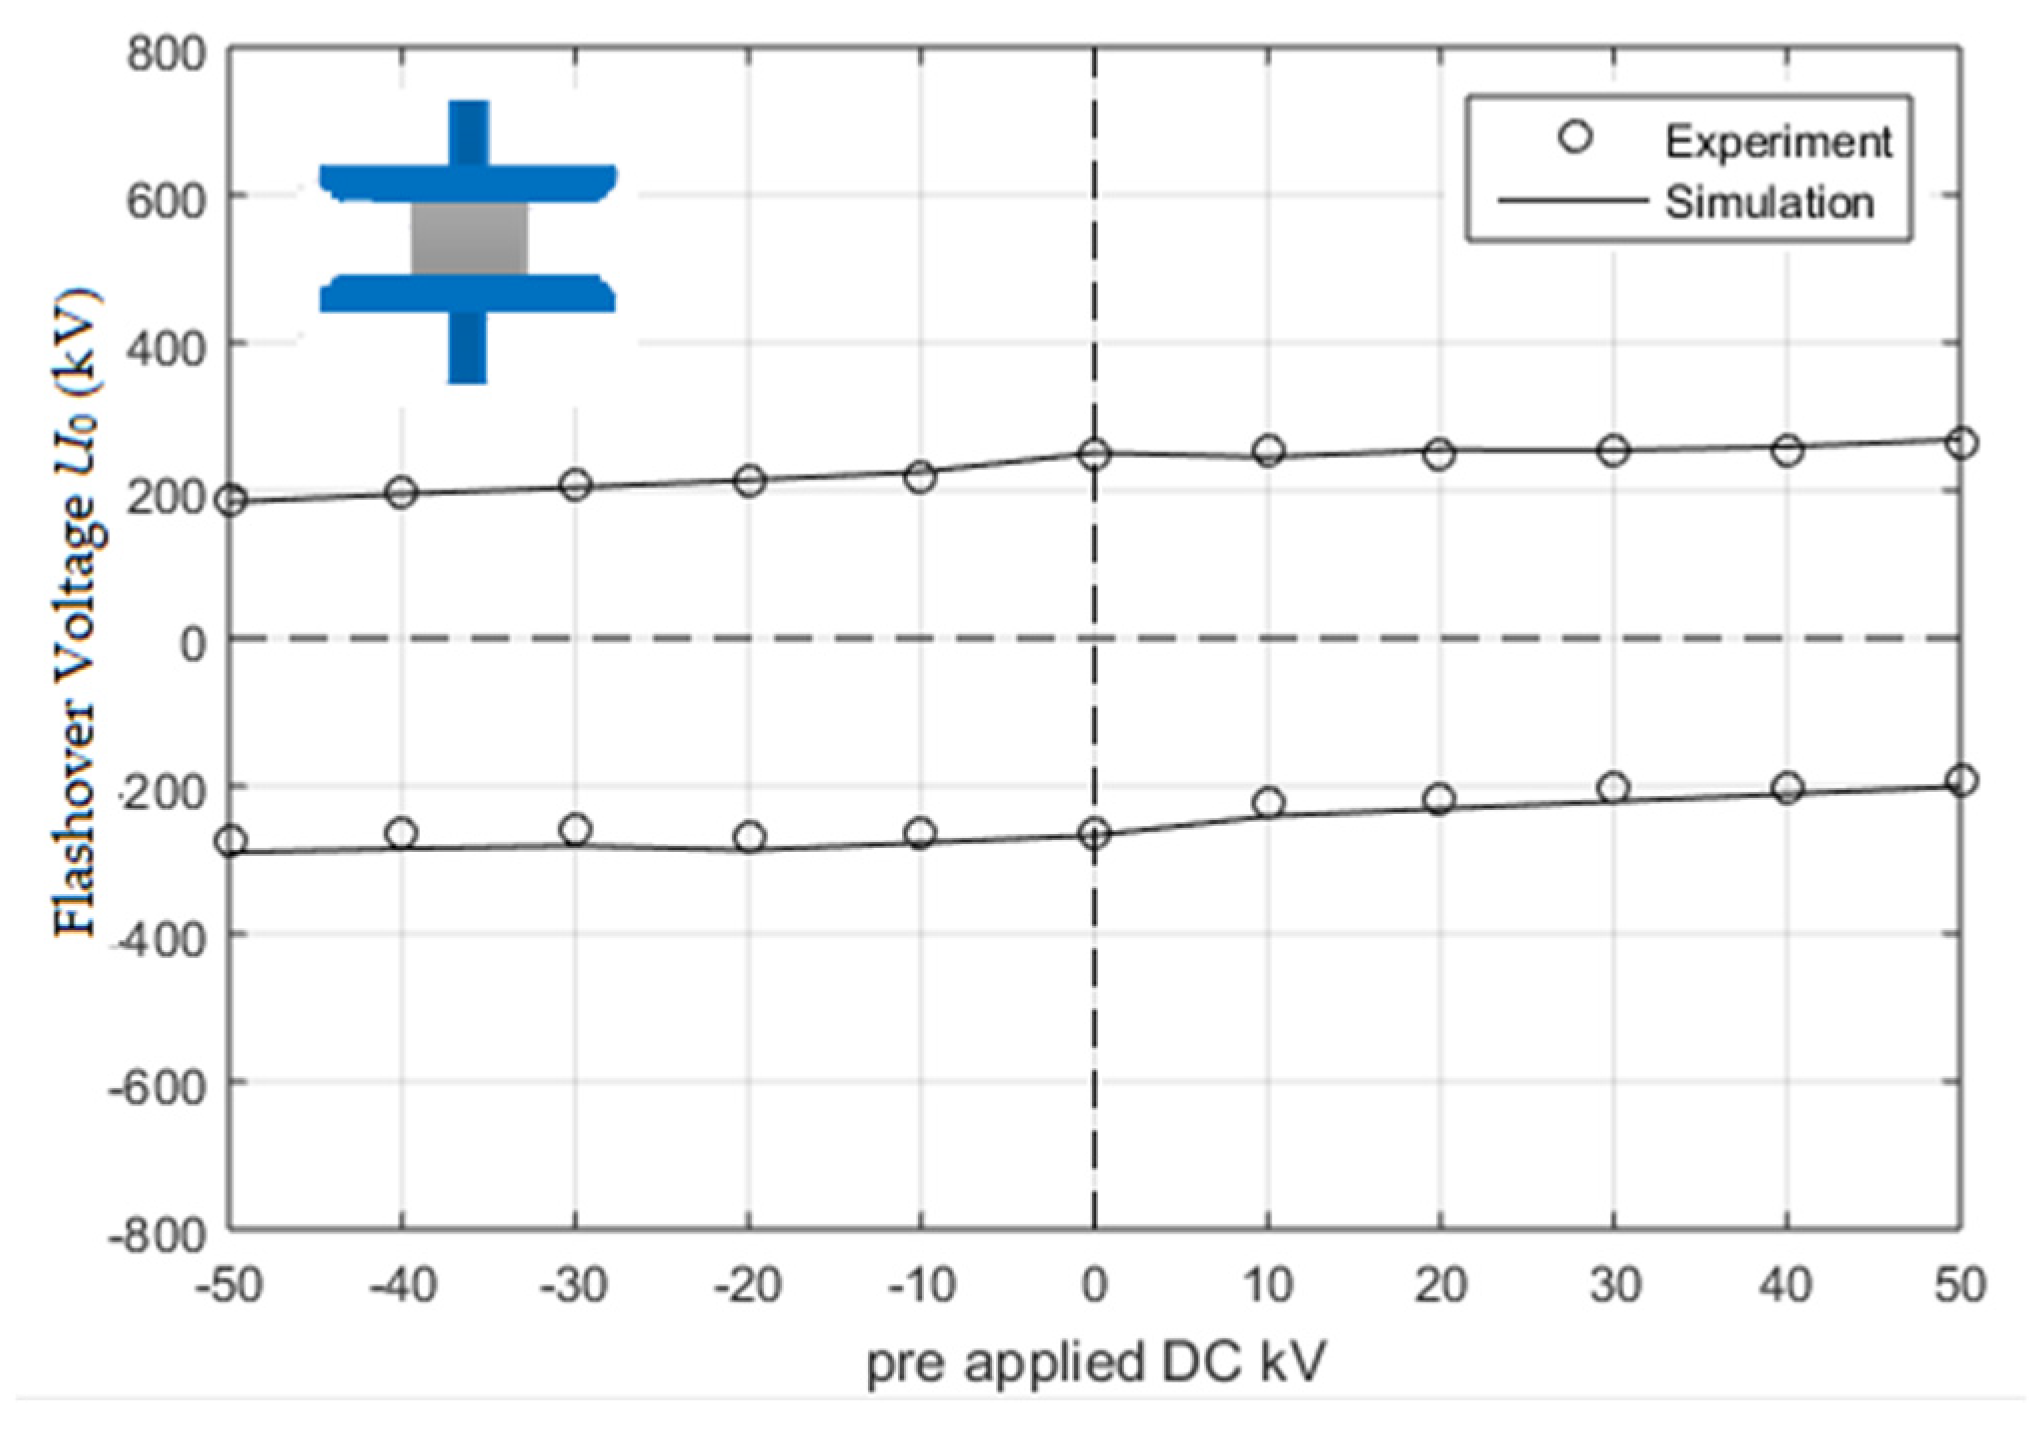
Figure 8 shows the estimated values of the breakdown voltage with the spacer mounted between the electrodes. The pressure is kept at 0.4 MPa. It can be seen that the simulation results of proposed mathematical model are in good agreement with the experimental results [21].

5.3. Case 3: A Gas Gap with a Spacer and with Particles

A pair of electrode gaps (with a gap length of D = 15 mm) were simulated with particles (with a particle length of l = 3 mm) and with a spacer (εr = 5.93). The gap was filled with SF6 gas at a pressure value of 0.4 MPa. The LI voltage was superimposed on pre-stressed DC voltages to the HV electrode.
Figure 9 shows the estimated values of the breakdown voltage with the spacer mounted between the electrodes in the presence of contaminating particles. It can be seen that the simulation results of the proposed mathematical model are in good agreement with the experimental results [21].
The particle size in Case 1 is 10 mm, and in Case 3, it is 3 mm. In the same way, the gap distance in Case 1 is 50 mm, and in Case 3, it is 15 mm. The reason for this is that both of these experimental setups are from different research papers [21,31]. However, it can be noted that the gap-to-particle ratio is 5 in both cases (i.e., Case 1 and Case 3). It can be seen by comparing Figure 7 (Case 1) and Figure 9 (Case 3) that the breakdown values with the spacer are lower than those without the spacer, due to the particle-generated space/surface charges on the insulator surface.
As can be seen in all three cases, the breakdown occurs at a lower voltage if the pre-stressed DC voltage is of a reverse polarity to the administered LI voltage. The breakdown voltage is also low in the existence of a metallic contamination, as the charge is heavily accumulated on the tip of the contamination. As can be observed in Figure 7, low voltage breakdowns occur at lower pressure levels for opposite polarities. The model accurately estimates that LI, applied on the opposite polarity of the existing system voltage, will greatly affect the insulation properties of the undermined GIS.
The proposed framework/model is new, and is applied to simple GIS gas gap geometry for the first time. This model was validated in this research, with experimental results obtained by different researchers [21,31] in the literature. Regarding the benefit of the proposed model, the breakdown voltage values can easily be calculated for simple gaps in the presence of contaminating particles, as well as in presence of simple shaped spacers, etc. However, further study is needed to apply the proposed model to complex geometries usually found in practical GIS gas gaps.

6. Conclusions

In this paper, a mathematical simulation model, using a leader propagation technique, is proposed to estimate the breakdown voltage of lightning impulse voltages superimposed on pre-stressed DC high voltages. The simulations were carried out for different scenarios, keeping in mind the practical gas gaps filled with SF6 gas. The simulation results show that they are in good agreement with the available experimental data in the literature. Furthermore, a strong effect of the polarity of the applied voltages on the breakdown voltage values was observed in the bipolar superimposed voltages, whereas higher breakdown values were obtained in the case of the unipolar superimposed voltage application, as compared to the bipolar case. A strong effect on the breakdown voltage was also noticed, due to the surface charge on the insulator surface.

Author Contributions

Conceptualization, R.M. and Y.K.; methodology, R.M.; software, R.M.; validation, Y.K., N.R.W. and A.A.A.-A.; formal analysis, A.A.A.-A.; writing—original draft preparation, R.M.; writing—review and editing, Y.K.; supervision, Y.K., A.A.A.-A.; project administration, Y.K., A.A.A.-A.; funding acquisition, Y.K. All authors have read and agreed to the published version of the manuscript.

Funding

This research and APC was funded by King Saud University, DSR Graduate Students Research Support (GSR).

Conflicts of Interest

The authors declare no conflict of interest.

References

  1. Laghari, J.R.; Qureshi, A.H. Surface Flashover of Spacer in Compressed Gas Insulated Systems. IEEE Trans. EI 1981, 16, 373–387. [Google Scholar] [CrossRef] [Green Version]
  2. Hara, M.; Adachi, K.; Tobata, H.; Akazaki, M. Particle Initiated Breakdown Characteristics of Conical Insulator in N2 Gas and N2/O2 Mixture under DC Voltage. IEEE Trans. EI 1987, 22, 431–438. [Google Scholar]
  3. Haseqawa, T.; Fujiwara, T.; Ooi, H.; Yanabu, S.; Ayogi, H.; Kanno, Y. The Influence of Charging of GIS Epoxy Insulator on DC/Impulse Superimposed Breakdown Characteristics. Gaseous Dielectric VII; Springer: Boston, MA, USA, 1994; pp. 511–517. [Google Scholar]
  4. Sarathi, R.; Krishnamurthi, M. Breakdown Characteristics of a Short Air Gap with Conducting Particle under Composite Voltages. Gaseous Dielectric VIII; Springer: Boston, MA, USA, 1998; pp. 411–416. [Google Scholar]
  5. Okabe, S.; Okada, T.; Yuasa, S.; Utsami, T.; Endo, F.; Saitoh, K. Effect of DC Pre-stress on Dielectric Characteristics of an Insulator in SF6 Gas. In Proceedings of the 12th international symposium on high voltage engineering, Bangalore, India, 20–24 August 2001; pp. 351–354. [Google Scholar]
  6. Sakai, K.; Tsuru, S.; Abella, D.L.; Hara, M. Conducting Particle Motion and Particle Initiated Breakdown in DC Electric Field between Diverging Conducting Plates in Atmospheric Air. IEEE Trans. EI 1999, 6, 43–50. [Google Scholar] [CrossRef]
  7. Khan, Y.; Sakai, K.; Lee, E.K.; Suehiro, J.; Hara, M. Motion Behavior and Deactivation Method of Free-conducting Particle around Spacer between Diverging Air Gap. IEEE Trans. EI 2003, 10, 444–457. [Google Scholar]
  8. Khan, Y.; Oda, A.; Okabe, S.; Suehiro, J.; Hara, M. Wire Particle Motion Behavior and Breakdown Characteristics around Different Shaped Spacers within Diverging Air Gap. IWHV 2003, 1, 89–94. [Google Scholar] [CrossRef] [Green Version]
  9. Khan, Y.; Lee, E.K.; Oda, A.; Sakai, k.; Zhang, Q.; Okabe, S.; Suehiro, J.; Hara, M. Characteristics of Corona and Surface Flashover Triggered by Free-conducting Particle around Simple Shaped Spacer under DC Voltage. Proc. Jpn. Korea Jt. Sypo. EDHVE 2001, 1, 101–104. [Google Scholar]
  10. Cherukupalli, S.E.; Tsurta, K.; Srivastava, K.D. Mechanism of pre-breakdown spacer charging in non-uniform field under unidirectional voltages. IEEE Trans. Electr. Insul. 1990, 25, 642–654. [Google Scholar] [CrossRef]
  11. Nakanishi, K.; Yoshida, A.; Arahata, Y.; Shibuya, Y. Surface charge on epoxy spacer at DC stress in compressed SF 6 gas. IEEE Trans. Power App. Syst. 1983, 102, 3919–3927. [Google Scholar] [CrossRef]
  12. Zhu, F.; Fouracre, R.A.; Farish, O. Investigations of surface charging of DC insulator spacers. In Proceedings of the Conference on Electrical Insulation and Dielectric Phenomena—CEIDP’ 96, Millbrae, CA, USA, 23–23 October 1996; pp. 149–152. [Google Scholar]
  13. Nitta, T.; Nakanishi, K. Charge accumulation on insulating spacers for HVDC GIS. IEEE Trans. Elctr. Insul. 1991, 26, 418–427. [Google Scholar] [CrossRef]
  14. Sato, S.; Zaengl, S.W.; Knecht, A. A numerical analysis of accumulated surface charge on DC epoxy resin spacer. IEEE Trans. Electr. Insul. 1987, 22, 333–340. [Google Scholar] [CrossRef]
  15. Okabe, S.; Ueta, G.; Utsumi, T.; Nukaga, J. Insulation characteristics of GIS insulators under lightning impulse with DC voltage superimposed. IEEE Trans. Dielectr. Electr. Insul. 2015, 22, 3269–3277. [Google Scholar] [CrossRef]
  16. Cooke, C.M. Charging of insulator surfaces by ionization and transport in gases. IEEE Trans. Electr. Insul. 1982, 17, 172–178. [Google Scholar] [CrossRef]
  17. Ren, M.; Dong, M.; Xiao, Z.G.; Qiu, A.C. Partial discharge pulses at artificial protrusions in SF6 under negative IEC 60060-3 standard impulses. IEEE Trans. Dielectr. Electr. Insul. 2014, 21, 273–283. [Google Scholar] [CrossRef]
  18. Zhao, X.F.; Yao, X.; Guo, Z. Partial discharge characteristics and mechanism in voids at impulse voltage. IET Proc. Meas. Sci. Technol. 2011, 22, 035704. [Google Scholar] [CrossRef]
  19. Zhang, L.; Han, X.T.; Li, X.J.H. Partial discharge detection and analysis of needle-plane defect in SF6 under negative oscillating lightning impulse voltage based on UHF method. IEEE Trans. Dielectr. Electr. Insul. 2017, 24, 296–303. [Google Scholar] [CrossRef]
  20. Ren, M.; Dong, M.; Liu, Y.; Miao, J.; Qiu, A. Partial discharges in SF6 gas filled void under standard oscillating lightning and switching impulses in uniform and non-uniform background fields. IEEE Trans. Dielectr. Electr. Insul. 2014, 21, 138–147. [Google Scholar] [CrossRef]
  21. Ma, J.; Zhang, Q.; You, H.; Wu, Z.; Wen, T.; Guo, C.; Wang, G.; Gao, C. Study on insulation characteristics of GIS under combined voltage of DC and lightning impulse. IEEE Trans. Dielectr. Electr. Insul. 2017, 24, 893–900. [Google Scholar] [CrossRef]
  22. Ma, J.; Zhang, Q.; Wu, Z.; Wen, T.; Guo, C.; Du, Q.; Wang, G.; Gao, C. Study on flashover characteristics of insulators in SF6 under combined voltage of DC and lightning impulse. In Proceedings of the 2017 IEEE Electrical Insulation Conference (EIC), Baltimore, MD, USA, 11–14 June 2017; pp. 62–65. [Google Scholar]
  23. Ma, J.; Zhang, Q.; Wu, Z.; Guo, C.; Wen, T.; Wang, G.; Gao, C. Breakdown characteristics of particle-contaminated HVDC GIL under superimposed voltage of DC and impulse. IEEE Trans. Dielectr. Electr. Insul. 2018, 25, 1439–1447. [Google Scholar] [CrossRef]
  24. Wang, Y.; Zhou, H.Y.; Lu, S.J.; Li, C.R. Insulation Characteristics of SF6/N2-Filled GIS Spacers under Lightning Impulse with DC Voltage Superimposed. In Proceedings of the 2018 IEEE 2nd International Conference on Dielectrics (ICD), Budapest, Hungary, 1–5 July 2018; pp. 1–4. [Google Scholar]
  25. Ma, G.; Zhou, H.; Wang, Y.; Zhang, H.; Lu, S.; Tu, Y.; Wang, J.; Li, C. Flashover behavior of cone-type spacers with inhomogeneous temperature distribution in SF6/N2-filled DC-GIL under lightning impulse with DC voltage superimposed. CSEE J. Power Energy Syst. 2020, 6, 427–433. [Google Scholar]
  26. Zhou, H.Y.; Ma, G.M.; Wang, Y.; Li, C.R.; Tu, Y.P.; Ye, S.P.; Zhang, B.; Guo, X.F.; Yan, X.L. Surface charge accumulation on 500kV cone-type GIS spacer under residual DC voltage. IEEE Trans. Dielectr. Electr. Insul. 2018, 25, 1230–1237. [Google Scholar] [CrossRef]
  27. Tenbohlen, S.; Schroder, G. The influence of surface charge on lightning impulse breakdown of spacers in SF6. IEEE Trans. Dielectr. Electr. Insul. 2000, 7, 241–246. [Google Scholar] [CrossRef]
  28. Imano, A.M. The influence of the dielectric strength of the N 2 /SF 6-insulation by conducting particle on the spacer surface. IEEE Trans. Dielectr. Electr. Insul. 2003, 10, 483–490. [Google Scholar] [CrossRef]
  29. Qi, B.; Li, C.R.; Hao, Z.; Geng, B.B. Surface discharge initiated by immobilized metallic particles attached to gas insulated substation insulators: Process and features. IEEE Trans. Dielectr. Electr. Insul. 2011, 18, 792–800. [Google Scholar] [CrossRef]
  30. Jun, X.; Chalmers, I.D. The influence of surface charge upon flashover of particle-contaminated insulators in SF6 under impulse-voltage conditions. J. Phys. D 1997, 30, 1055–1063. [Google Scholar] [CrossRef]
  31. Siodla, K.; Kuffel, E.; Fujinami, H. Breakdown of SF/sub 6/ in non-uniform field gaps under combined DC fast oscillating impulse and standard lightning impulse voltages. IEEE Trans. Electr. Insul. 1993, 28, 253–260. [Google Scholar] [CrossRef]
  32. Seeger, M.; Niemeyer, L.; Bujotzek, M. Leader propagation in uniform background fields in SF6. J. Phys. D Appl. Phys. 2009, 42, 185205. [Google Scholar] [CrossRef]
  33. Landau, L.D.; Lifshitz, E.M.; Pitaevskii, L.P. Electrodynamics of Continuous Media. In Landau and Lifshitz Course of Theoretical Physics, 2nd ed.; Elsevier/Butterworth-Heinemann: Amsterdam, The Netherlands; Volume 8.
  34. Niemeyer, L.; Ullrich, L.; Wiegart, N. The mechanism of leader breakdown in electronegative gases. IEEE Trans. Electr. Insul. 1989, 24, 309–324. [Google Scholar] [CrossRef]
  35. Seeger, M.; Niemeyer, L.; Bujotzek, M. Partial discharges and breakdown in SF6 at protrusions in uniform background fields. J. Phys. D Appl. Phys. 2008, 41, 185204. [Google Scholar] [CrossRef]
  36. Speckhofer, G.; Gilles, R.; Smith, W.; Bures, M. A consistent set of thermodynamic properties and transport coefficients for high temperature plasmas. In Proceedings of the 14th International Symposium on Plasma Chemistry (ISPC-14), Prague, Czech Republic, 2–6 August 1999; Volume 1, pp. 269–274. [Google Scholar]
  37. Gallimberti, I.; Wiegart, N. Streamer and leader formation in SF6 and SF6 mixtures under positive impulse conditions: II. Streamer to leader transition. J. Phys. D Appl. Phys. 1986, 19, 2363–2379. [Google Scholar] [CrossRef]
  38. Gallimberti, I.; Ullrich, L.; Wiegart, N. Experimental investigation of the streamer to leader transition in SF6 under negative polarity Gaseous Dielctrics V. In Proceedings of the Fifth International Symposium on Gaseous Dielectrics, Knoxville, TN, USA, 3–7 May 1987; pp. 126–133. [Google Scholar]
  39. Iwabuchi, H.; Matsuoka, S.; Kumada, A.; Hidaka, K.; Hoshina, Y.; Yasuoka, T.; Takei, M. Influence of tiny metal particles on charge accumulation phenomena of GIS model spacer in high-pressure SF6 gas. IEEE Trans. Dielectr. Electr. Insul. 2013, 20, 1895–1901. [Google Scholar]
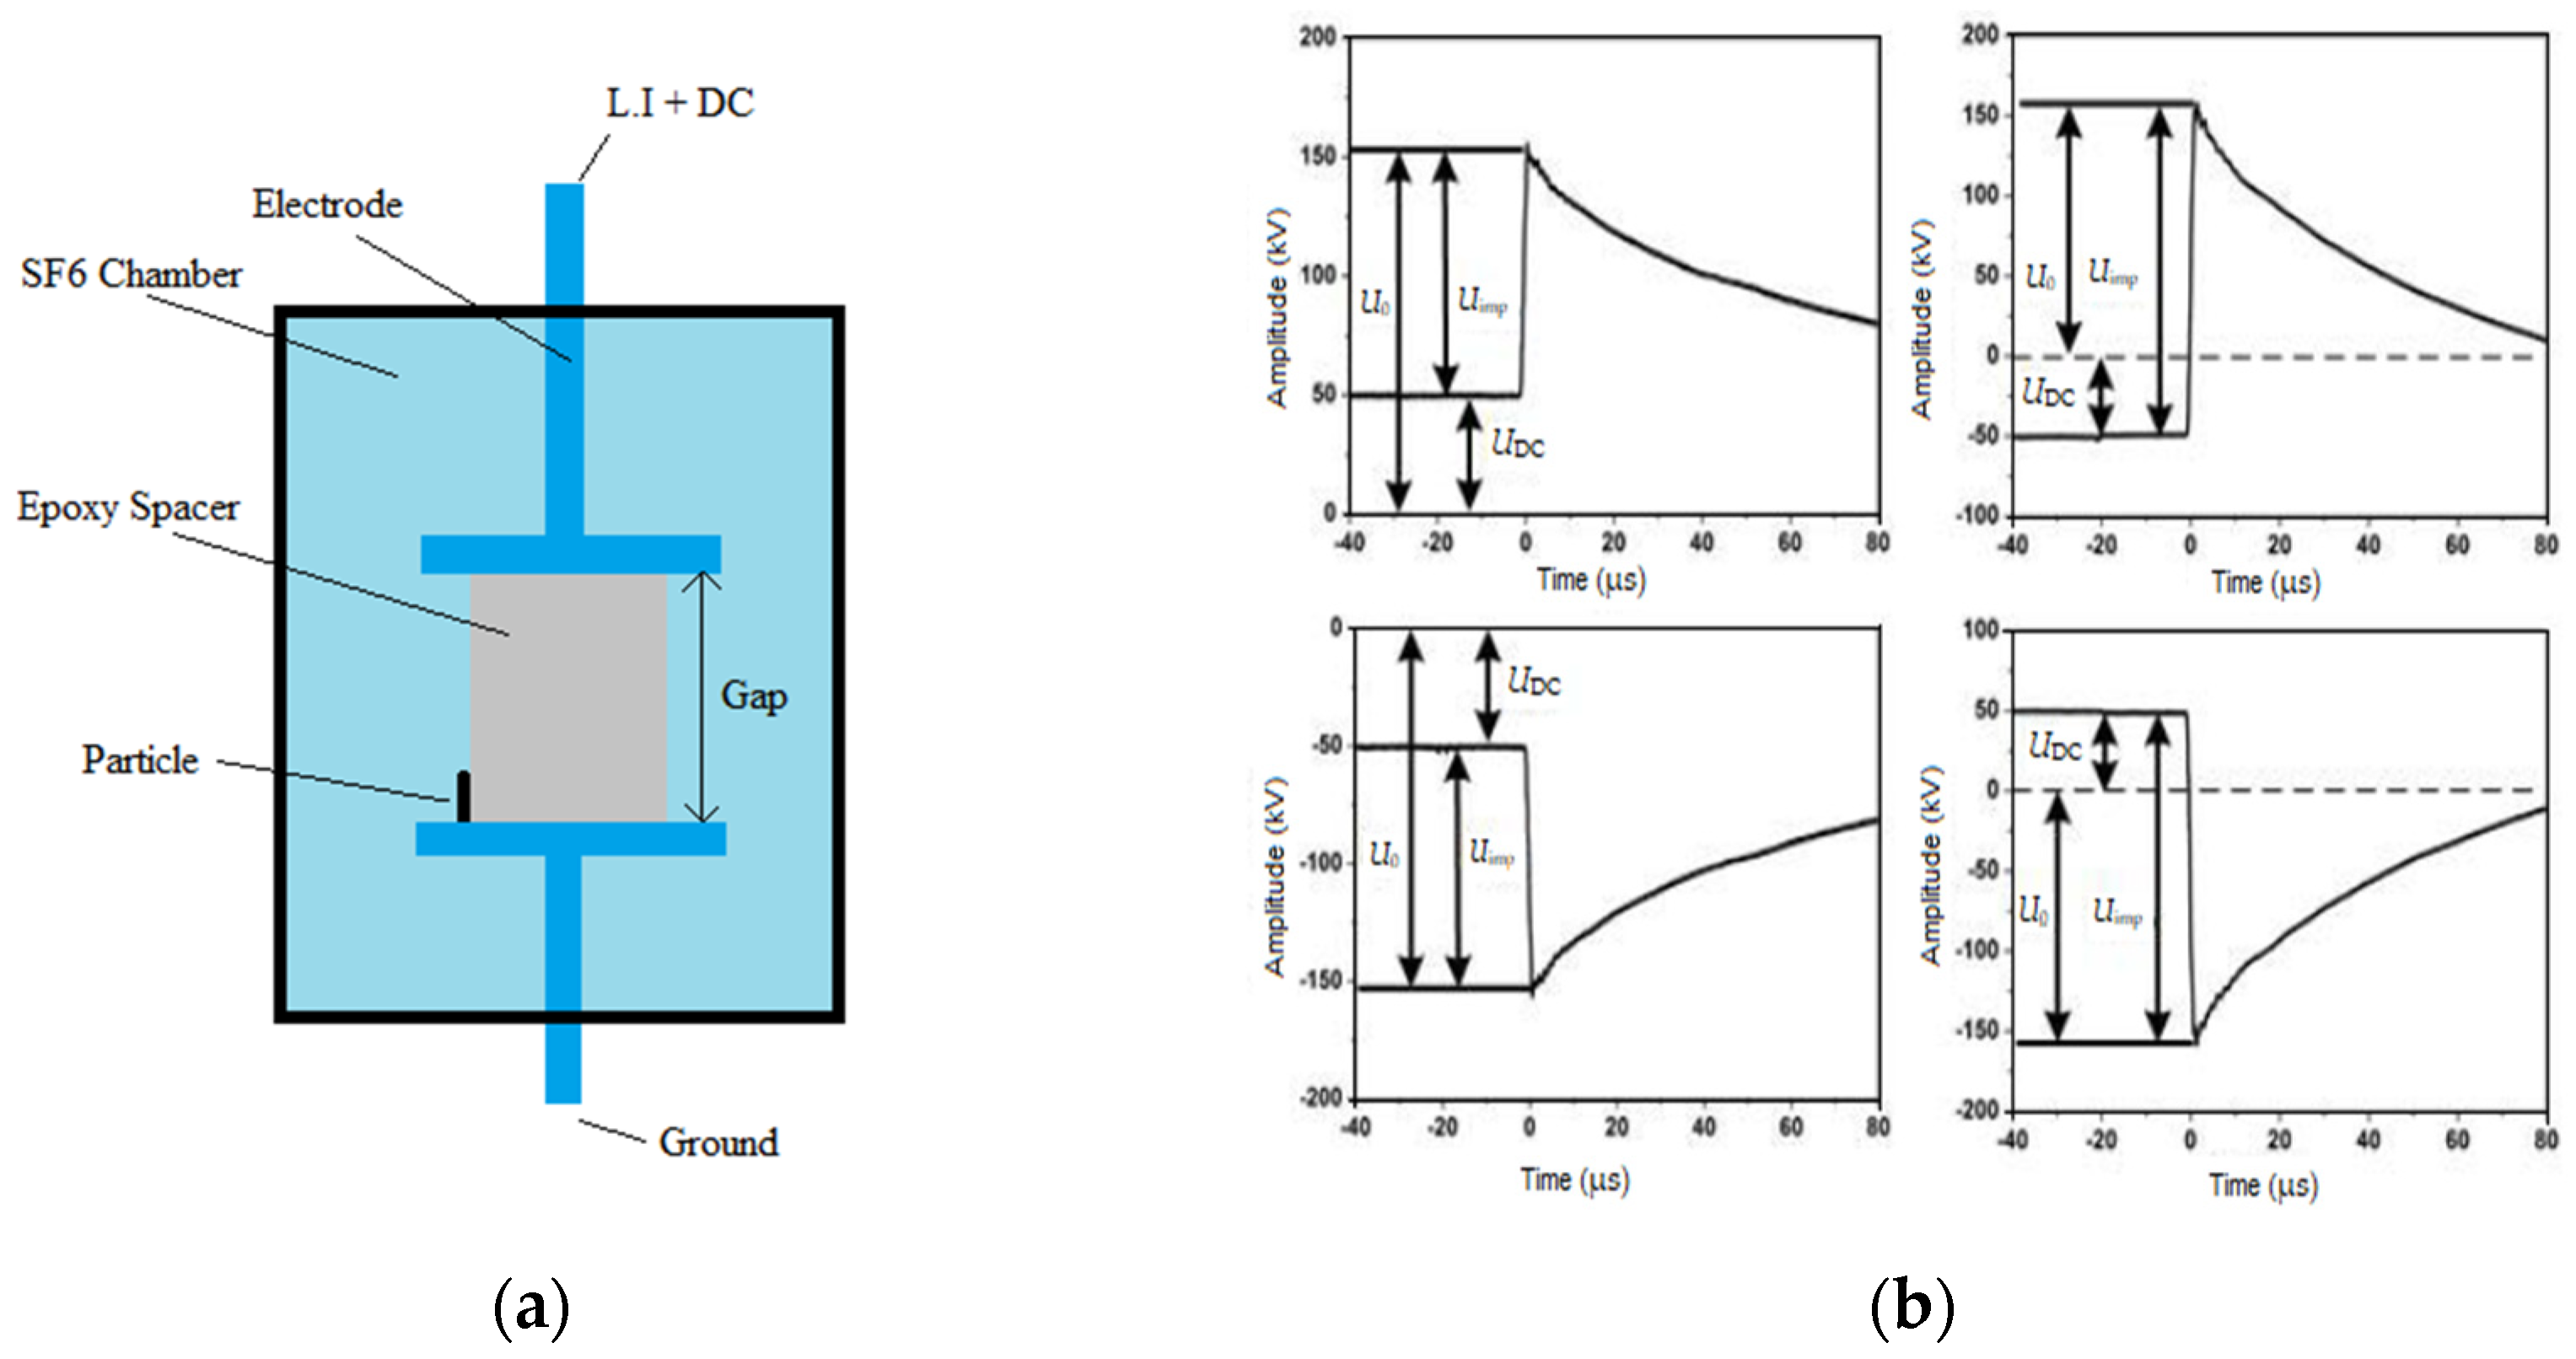
Figure 1. (a) Experimental setup with spacer and particle contamination in SF6 gas chamber; (b) applied superimposed voltage waveforms.
Energies 15 01708 g001
Figure 2. Field redistribution caused by protrusion of length L [32].
Energies 15 01708 g002
Figure 3. Material functions f(T) and h(T,p) for SF6 gas [32].
Energies 15 01708 g003
Figure 4. (a) Stem mechanism, α = 1, high probability in DC; (b) precursor mechanism, α = 0.02, high probability in LI.
Energies 15 01708 g004
Figure 5. Simulation steps flowchart.
Energies 15 01708 g005
Figure 6. (a) Arrested leader for 50 mm gap with 10 mm particle at 149 kV (LI), P = 0.4 MPa; (b) breakdown leader for 50 mm gap with 10 mm particle at 151 kV (LI), P = 0.4 MPa.
Energies 15 01708 g006
Figure 7. Breakdown characteristics of superimposed flashover voltages without spacer (Case 1), particle size l = 10 mm, D = 50 mm.
Energies 15 01708 g007
Figure 8. Breakdown characteristics of superimposed flashover voltages without particle contamination (Case 2), D = 15 mm, P = 0.4 MPa, εr = 5.93.
Energies 15 01708 g008
Figure 9. Breakdown characteristics of superimposed flashover voltages with particle (Case 3) contamination size 3 mm, D = 15 mm, P = 0.4 MPa, εr = 5.93.
Energies 15 01708 g009
Table 1. Notations used in the paper.
NotationDescriptionValueUnit
LParticle length3, 10mm
DGap distance15, 50mm
εrSpacer permittivity5.93-
Ecr,0Critical electric field90kV/cm−1
CΔhMaterial constant of SF64.8 × 105Vm2kg−1
CsPolarity constant2+, 3-
f(T)Thermal dissociation function0 to 1-
Publisher’s Note: MDPI stays neutral with regard to jurisdictional claims in published maps and institutional affiliations.