Article

Depositional Structures and Their Reservoir Characteristics in the Wufeng–Longmaxi Shale in Southern Sichuan Basin, China

1
PetroChina Research Institute of Petroleum Exploration Development, Beijing 100083, China
2
National Energy Shale Gas R & D (Experiment) Center, Langfang 065007, China
*
Author to whom correspondence should be addressed.
Energies 2022, 15(5), 1618; https://doi.org/10.3390/en15051618
Submission received: 10 January 2022 / Revised: 16 February 2022 / Accepted: 18 February 2022 / Published: 22 February 2022

Abstract

:
This paper documents depositional structures and their reservoir characteristics in the Wufeng–Longmaxi shale from outcrops and cores using thin sections, X-ray powder diffraction (XRD) analysis, carbon–sulfur analyzer, helium porosimeter, decay permeameter, and focused ion beam scanning electron microscope (FIB-SEM). In the study area, clayey and silty laminae abound in the shale. Clayey laminae are rich in bedding parallel fractures, microfractures, and organic pore networks. Silty laminae are rich in isolated inorganic pores and limited amounts of bedding non-parallel fractures. Various inter-lamination of clayey and silty laminae form five depositional structure types which are closely related to the ancient hydrodynamics, paleoredox condition, and sedimentation rate and have significant impacts on shale fractures, microfractures, pore types, pore-size distribution, and porosity. For the paper lamination (PL) and grading lamination composed of siltstone and claystone (GL-SC), organic pores account for 71.6% and 61.4% of the total, and dense bedding parallel and non-parallel fractures intersect to form connective networks. In the interlaminated lamination composed of siltstone and claystone (IL), grading lamination composed of claystone (GL-C) and structureless beds (SB), organic pores merely account for 20% to 51.8% of the total and minor isolated bedding parallel fractures occur. Among five depositional structure types, the PL and GL-SC have the highest porosity, permeability, TOC content, siliceous content, organic pore proportions, and ratios of horizontal to vertical permeability, which help them become shale gas exploration and development targets.

1. Introduction

Depositional structures have an important influence on pore types, pore-size distribution, porosity, and permeability of shales [1,2]. During the past decades, numerous studies have focused on the nomenclature of shale [3,4], depositional structures [5,6,7,8,9], depositional environments [10,11], hydrodynamic conditions [12,13], and their implications for shale gas exploration and development [14].
Depositional structures of shale are the key characters of sedimentary rocks for reservoir characteristics and involve bedding and lamination. Lamination differs from bedding with respect to bed thickness. In general, sedimentary rocks with lamination have a bed thickness below 1 cm, while those with bedding have a bed thickness above 1 cm [15]. Lamination and bedding consist of laminae, laminasets, and beds. Campbell and Lazar proposed descriptions of lamination and bedding using two essential attributes [3,4]: (i) geometry and shape of bed boundaries and (ii) continuity, shape, and geometry of laminae between the boundaries. Laminae in shale can be subdivided into several types, such as organic-rich lamina, organic-bearing lamina, clay-rich lamina, tuff-rich lamina, and silty lamina based on mineral content [16,17], silty lamina, and clayey lamina based on grain size [14,18,19]. Many black shale units show lenticular lamination consisting of lenses of variable composition that are arranged in wavy layers [20]. Several factors control lamination formation, including transport processes [7], depositional environment energy, biologic activity [21], algal blooms [7], and seasonal terrestrial input [22].
Depositional structures are commonly related to grain size, texture, porosity, permeability, and pore type of shale reservoirs. These properties play an important role in the generation, distribution, migration, and development of shale gas [23,24,25]. Clay minerals and organic matter (OM, [26]) are abundant in darker laminae, whereas quartz and calcite are commonly abundant in brighter laminae. Therefore, darker laminae often display greater total porosity and organic porosity, permeability, producing higher hydrocarbon storage potential than brighter laminae [26]. In contrast, Rokosh and Liu found that brighter laminae are dominated by discrete grain edge dissolved pores of plagioclase with relatively good connectivity while darker laminae are dominated by dense interlayer pores of clay minerals with relatively weak connectivity [2,27]. Lei found that mesopores and macropores are common in silty lamina while micropores are common in clayey lamina [14]. Wang found that the clayey lamina abounds in organic pores and the silty lamina abounds in inorganic pores and the excessive development of silty lamina is not conducive to organic matter accumulation, resulting in an adverse impact on the formation of complex artificial fractures during hydraulic fracturing [28]. Shi found that the clayey laminae have abundant bedding parallel fractures and organic pores which can connect with each other to form an effective network because of the high content of organic matter [19]. In contrast, the silty laminae have less bedding parallel fracture and organic pores which can not connect with each other because of the lower content of organic matter. Depositional structures control the ratio of horizontal to vertical permeability. For the Longmaxi shale of Fuling area, the horizontal permeability is generally higher than 0.01 × 10⁻³ μm2 (average 1.33 × 10⁻³ μm2), which is much higher than the vertical permeability at the same depth (generally lower than 0.001 × 10⁻³ μm2, 0.0032 × 10⁻³ μm2 on average), with a gap of three orders of magnitude [29]. The lower vertical permeability of gas-bearing shale is conducive to gas preservation while the higher horizontal permeability of shale is good for the improvement of lateral percolation capacity [30].
Recently, shale gas exploration of the Wufeng–Longmaxi Formation intervals has spurred the publication of numerous studies, which mainly focused on sedimentary environments [30], organic content and maturity [31], pore type and porosity [32], fracture characteristics and origin [31], mineral composition [33], shale facies [34,35,36,37], and especially, natural gas enrichment mechanisms and resource evaluations [32,38,39]. Further systematic observations indicate the common occurrence of lamination, which suggests its important role in shale gas accumulation and production [19]. However, there are few published detailed analyses and discussions on the structures and lamination and their roles in shale gas accumulation. Hence, a study on structures and lamination and their mineralogy, porosity, permeability, and pore types of the Wufeng–Longmaxi shale will provide insights into the generation, migration, and accumulation of shale gas.
The goal of this study is to examine the depositional structures as they relate to the shale reservoir character of the Wufeng–Longmaxi shale in the southern Sichuan Basin, SW China. Specific objectives include: (i) identification of depositional structure types on the basis of the observation of lamina, laminasets, beds, and their stacking patterns; (ii) analysis of the mineral compositions and total organic carbon (TOC) contents of various depositional structures; (iii) comparison of pore types and their distribution patterns among different depositional structures; and (iv) comparison of porosity and permeability among different depositional structures. The results provide the basis for an in-depth discussion on the role of depositional structures in shale gas migration and accumulation.

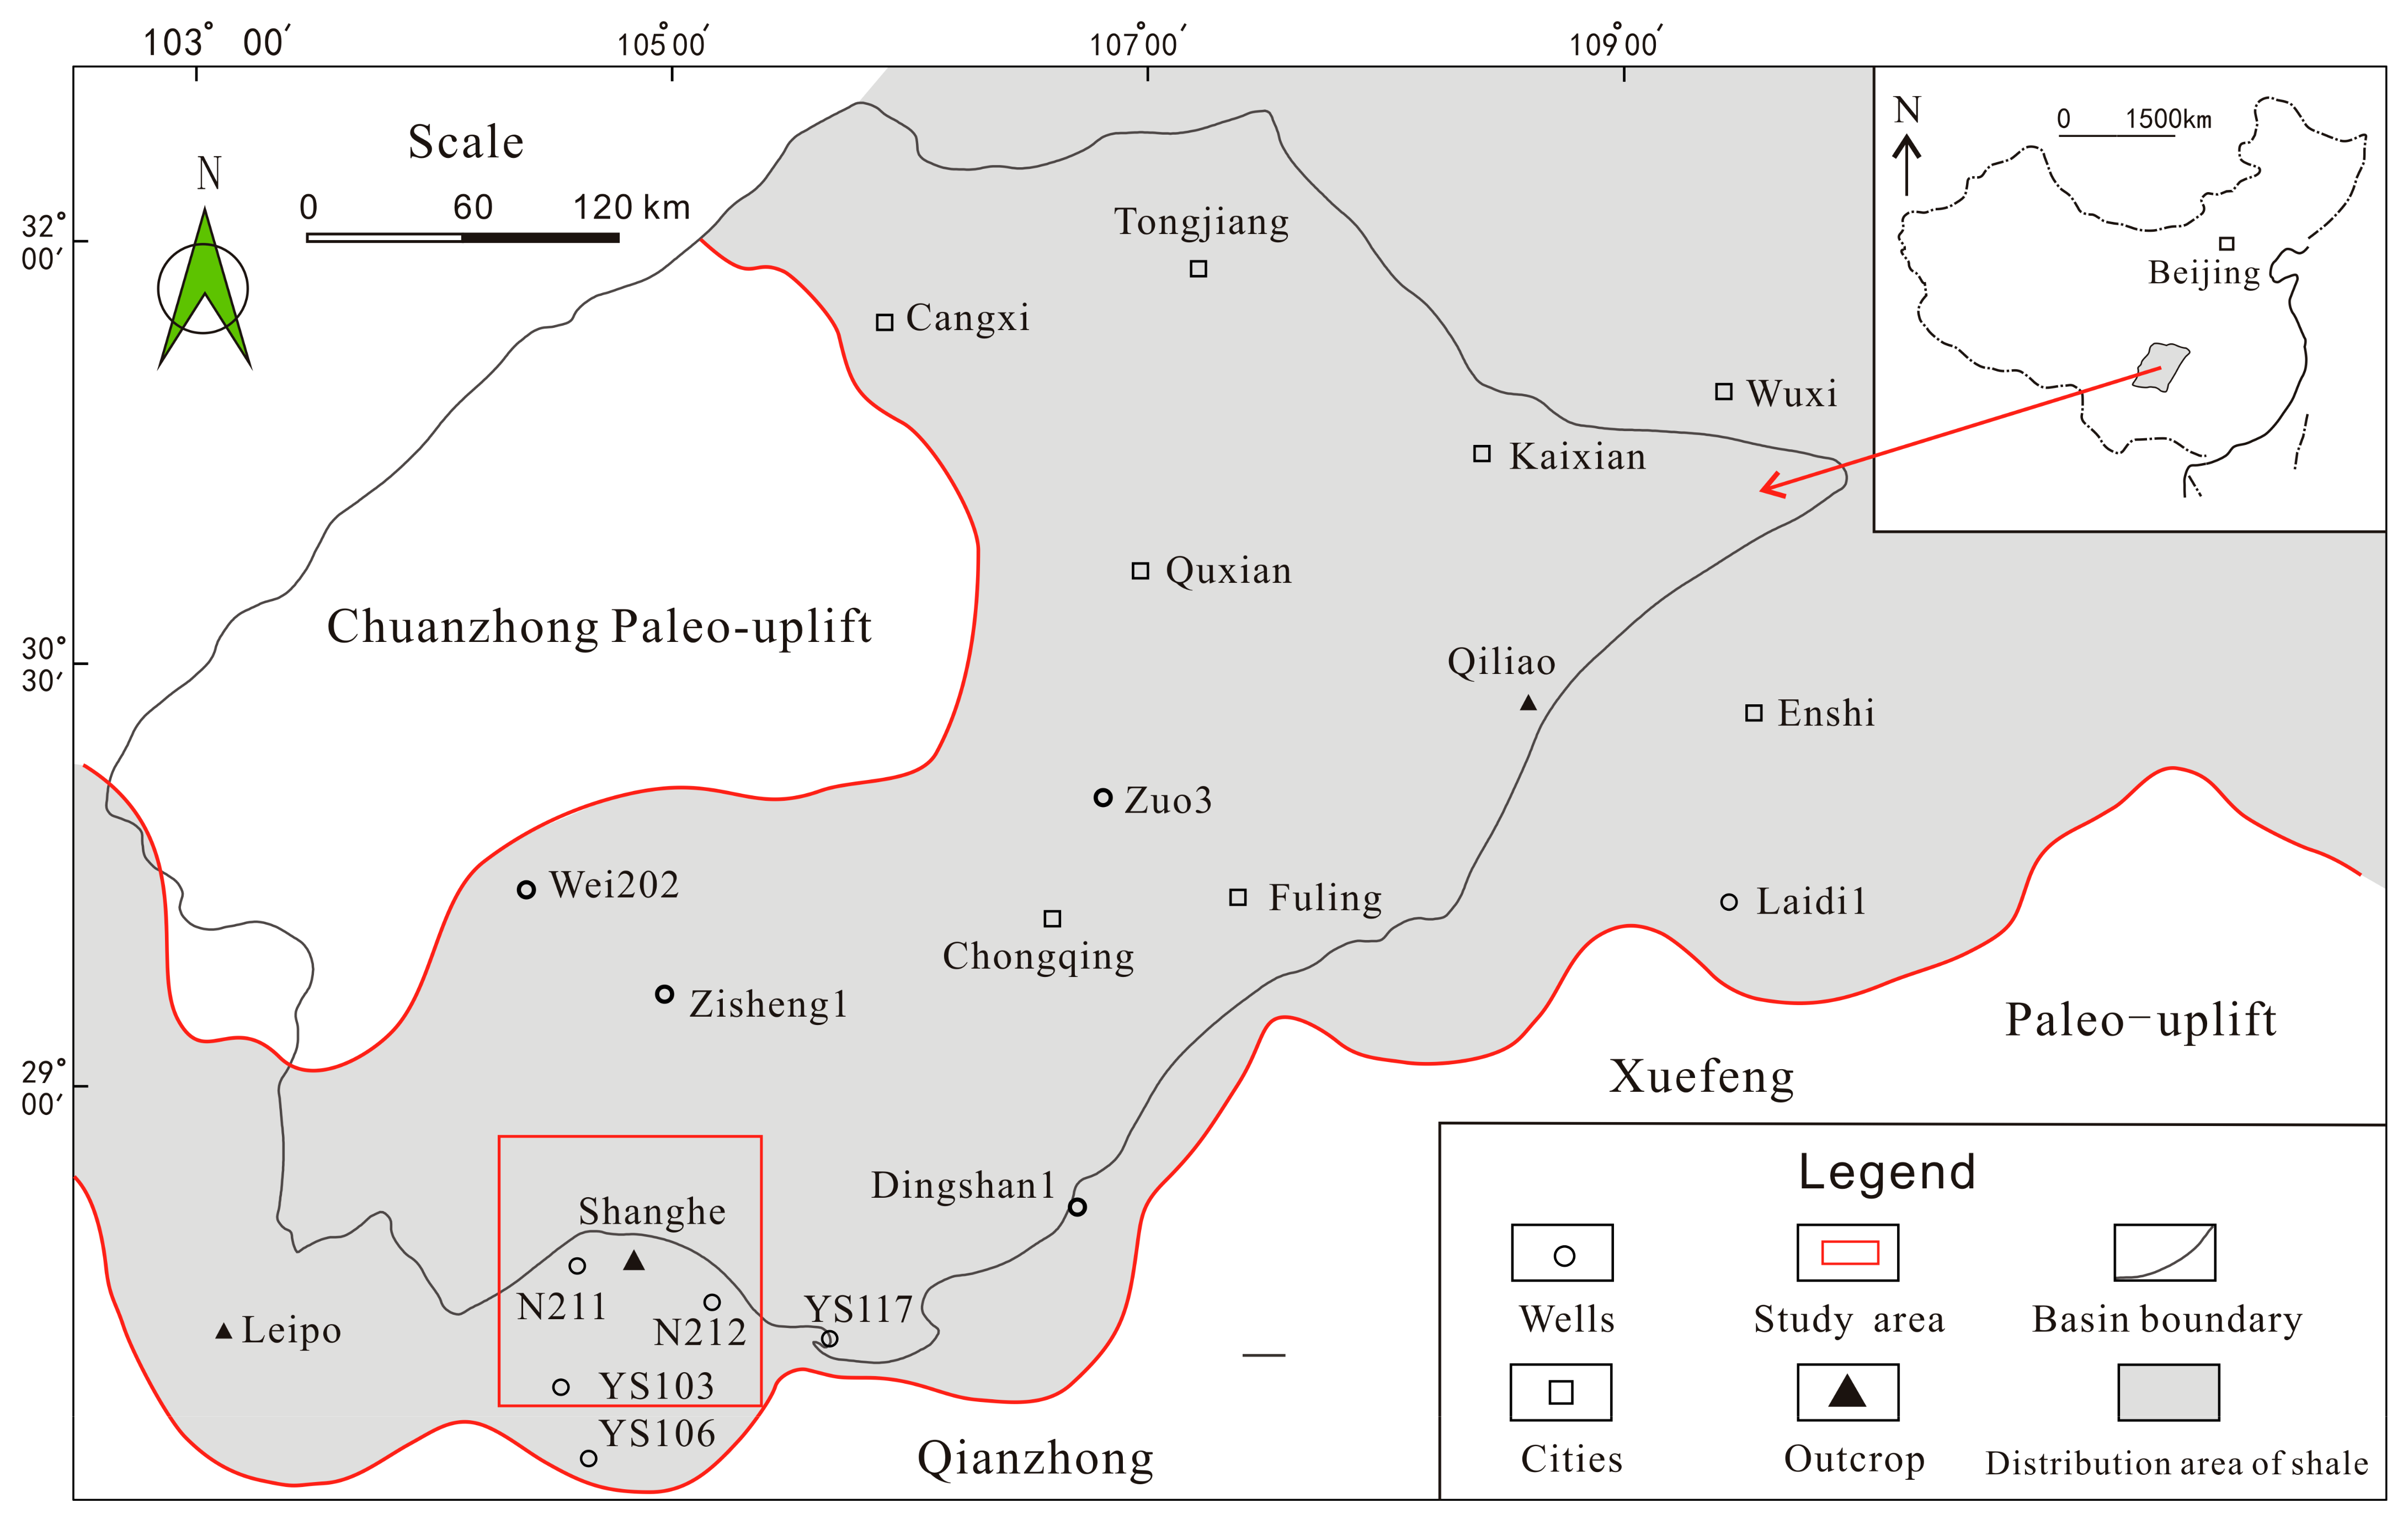
2. Geological Setting

The Sichuan Basin, with an area of approximately 180,000 km2, is located in the southwestern part of China [40]. As shown in Figure 1, the Daba Mountains bound the basin to the northeast, the Daloushan mountain, the Daliang mountain to the southwest, the Qionglai and Longmen mountains to the west, and the Micang mountain to the north [41].
The Sichuan Basin is a large superimposed basin developed on the pre-Sinian metamorphic basement (before 850 Ma). The basin’s formation and evolution can be subdivided into four tectonic stages [42]. The Chuanzhong paleo-uplift in the southwest and Qianzhong–Xuefeng uplift in the south formed from the Wufeng period in the Late Ordovician to the Longmaxi period in the Early Silurian, due to structural compression in the southeast (Figure 1, [40,43]). During this period, the Sichuan Basin was a silled marine basin, with the basement high in the southeast and low in the north and water depths gradually deepening from the southeast to the north [44].
The Wufeng–Longmaxi Formation intervals were formed in the Katian stage in the Upper Ordovician to the Telychian stage in the Lower Silurian and had a total thickness ranging from 240 to 410 m (Figure 2). Currently, the intervals constitute the most important shale gas exploration and development targets in China [30]. The Wufeng Formation, which underlies the Baota Formation at a parallel unconformity and has a thickness ranging from 0.5 to 10 m, is in conformable contact with the overlying Longmaxi Formation, which is successively overlain by the Shiniulang Formation [45]. Within the Wufeng Formation, thick black shales intercalated with multiple thin volcanic ash layers dominate the middle-to-lower regions [46]; limestones/marls with abundant Hirantian fauna fossils dominate the uppermost part of the formation [47]. Within the Longmaxi Formation, black, grayish thin-layered shales or massive shales dominate the lower regions, and grayish-green, to yellow-green shales occasionally intercalated with siltstone and argillaceous limestones comprise the upper regions of the formation [48].
On the basis of graptolite correlations, eustatic cycles, and electrical logging characteristics of the outcrops and drills from the study area, Zhao classified the Wufeng Formation as Members W1 and W2 and the Longmaxi Formation as Members L1 and L2: Member L1 can be divided into sub-Members L1-1 and L1-2, where sub-Member L1-1 consists of layers L1-11, L1-12, L1-13, and L1-14 [49]. Fan showed that the Wufeng and Longmaxi formations have developed four and nine graptolite zones, respectively [50]. Within the Longmaxi Formation, graptolite zones LM1, LM2-3, LM4, and LM5 correspond to layers L1-11, L1-12, L1-13, and L1-14, respectively. The Wufeng Formation and layers L1-11-4 of the Longmaxi Formation are the main producers of shale gas in this study area. Layer L1-11 of the Longmaxi Formation is the most important target shale for the current shale gas exploration and development in China [30,51,52,53].

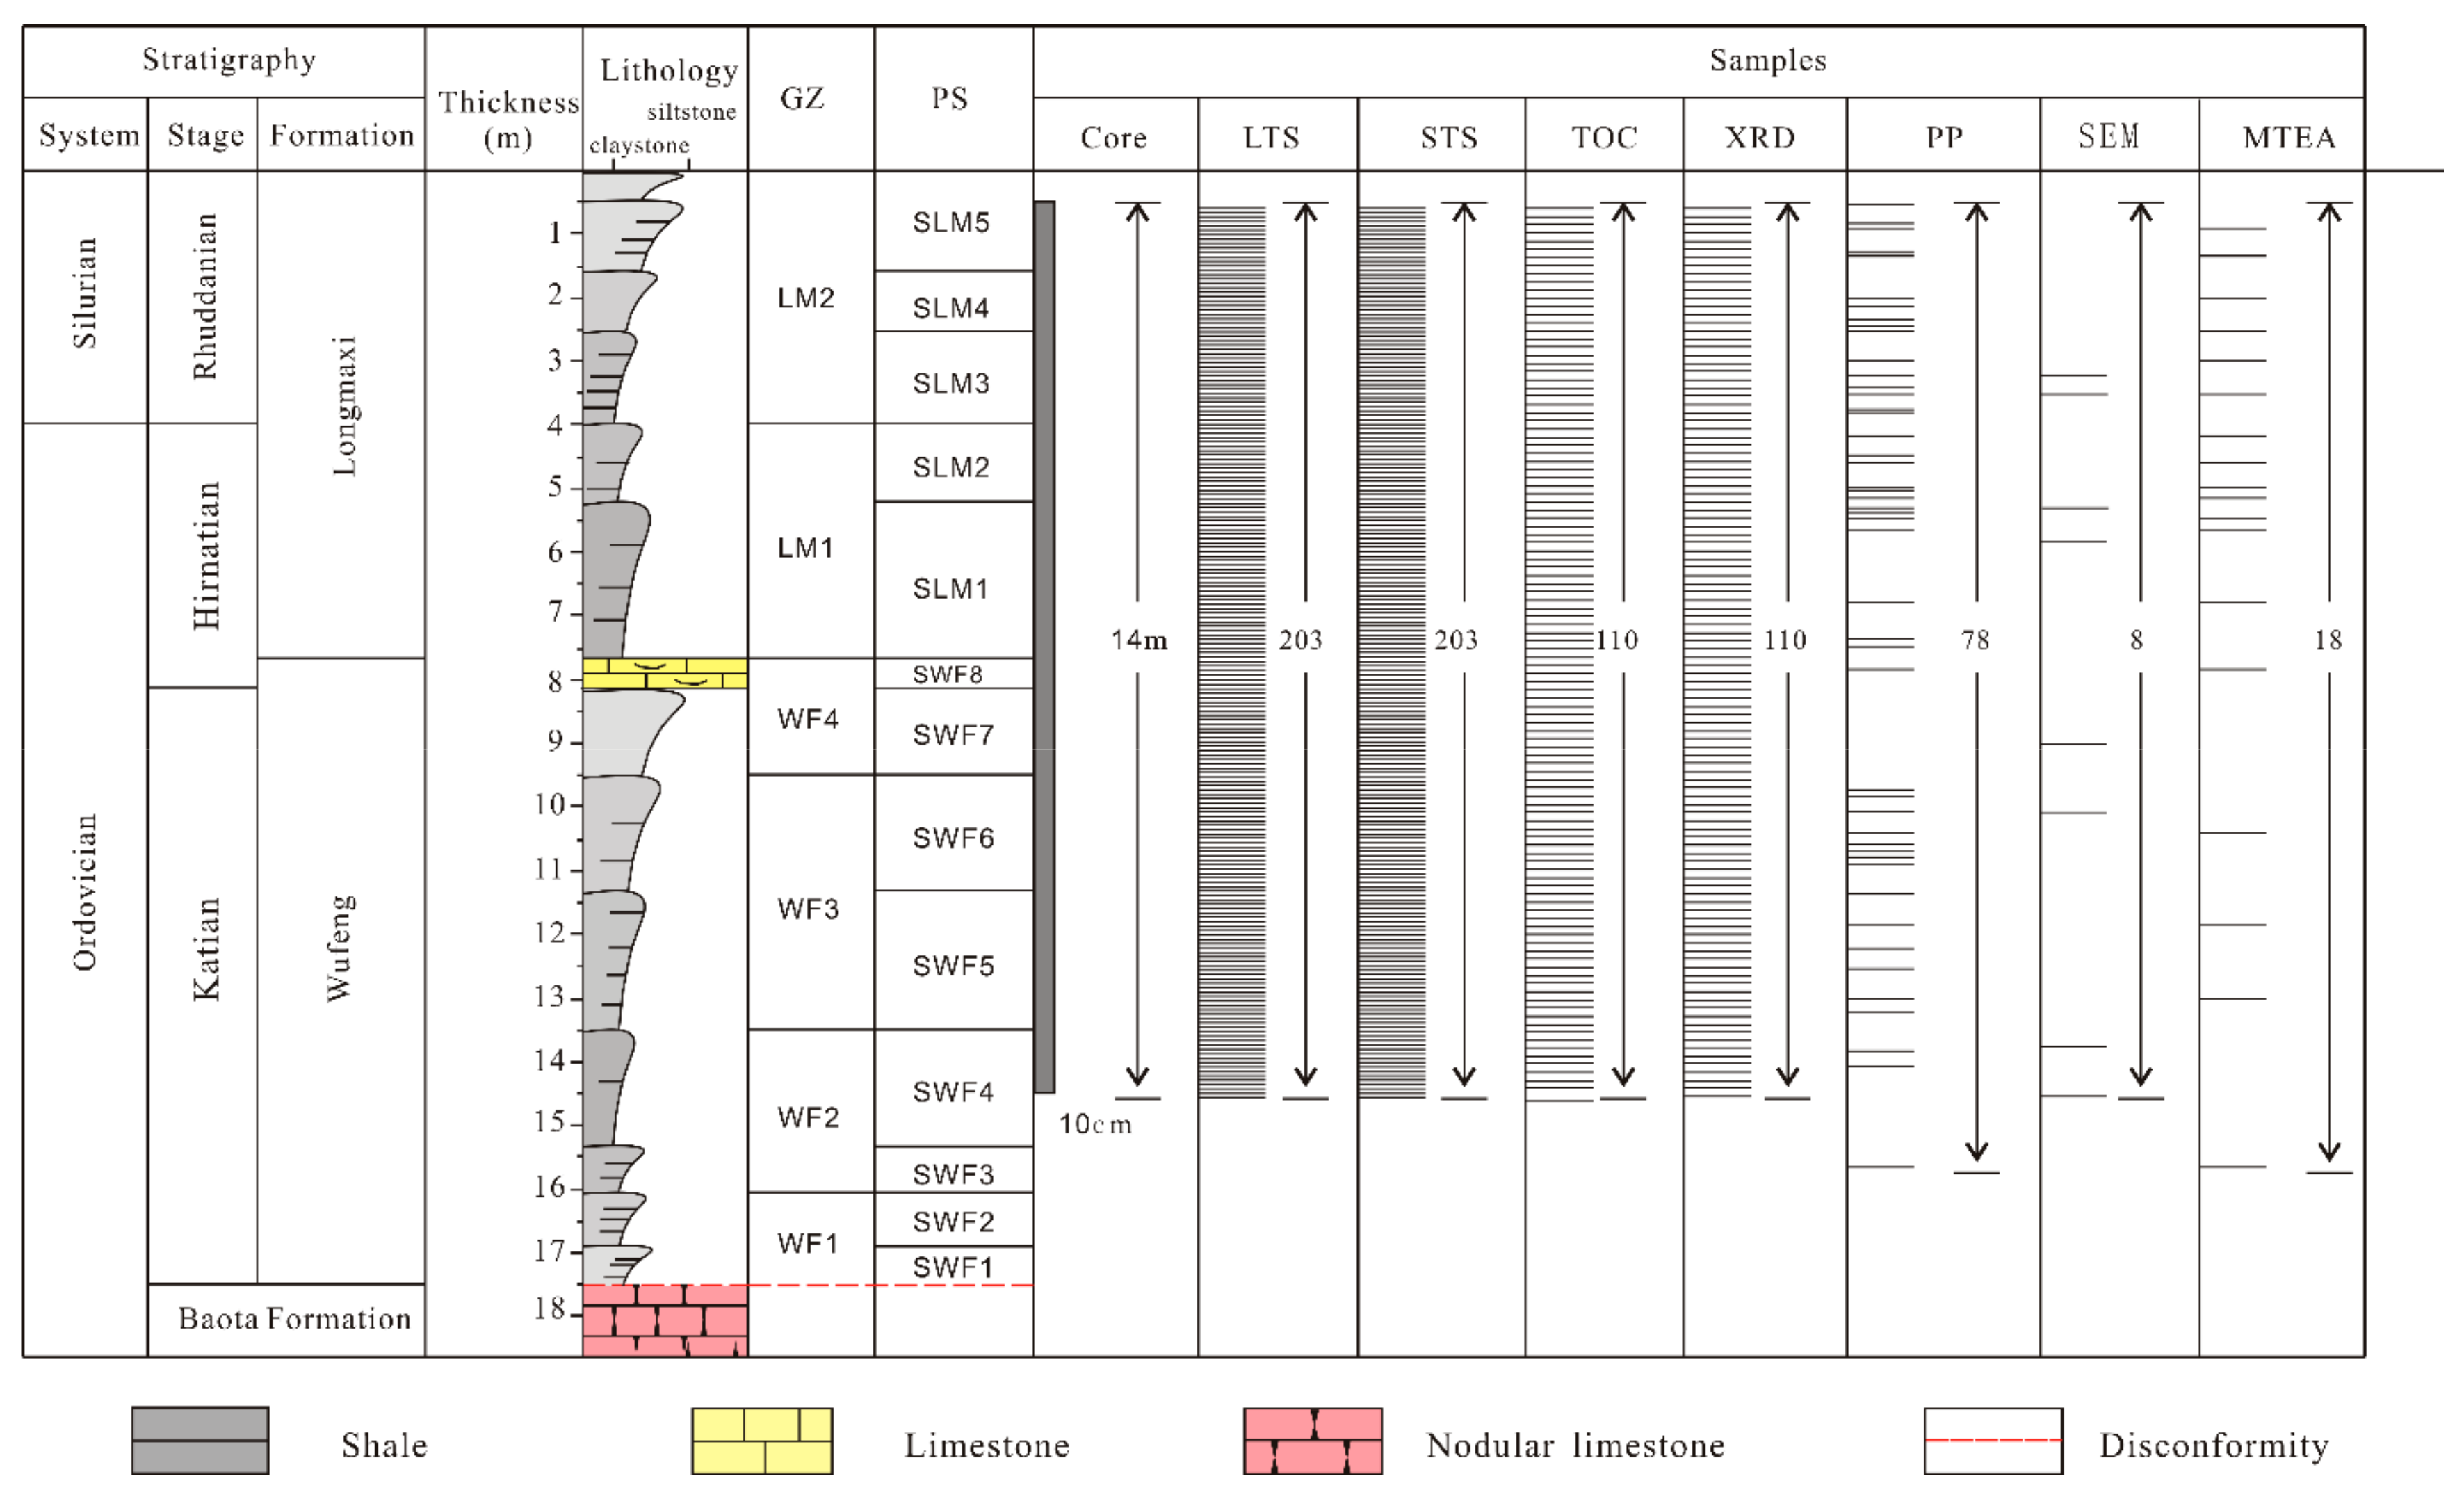
3. Samples and Methods

3.1. Sampling and Imaging

Samples were mainly collected from the Wufeng Formation and the Member L1 of the Longmaxi Formation from the Shuanghe outcrop in Changning County, with a minor amount of sample from cores of boreholes Ning 211, Ning 212, and YS 103. In order to make sure that the studied samples are representative and effective, we chose samples from each graptolite zones from the base to the top. The samples were taken from the position at which the large thin sections were cut to perform XRD, porosity, permeability, FIB-SEM, and TOC analyses. Analytical testing was conducted at the National Energy Shale Gas R & D (Experimental) Center in China.
For the Shuanghe outcrop, all samples were continuously collected and spaced equivalently from the base to the top, which provided up to 203 large polished thin sections and 203 standard thin sections.
Samples were recovered from deeper than 5 cm into exposures to avoid collection from the weathered, fissile veneer that covers most outcrops. Three series of large cores with a width of 7 cm and thickness of 5 cm were prepared cut perpendicular to the shale lamination surface from the base to the top. The first series was used for a macroscopic description of lamination after cutting, polishing, and imaging. The second series was used for the preparation of large thin sections, standard thin sections, and related tests. The third series was used for porosity and permeability sampling and testing. Rock samples for macroscopic lamination description were prepared with standard dimensions of 7 cm width and 5 cm thickness, while large thin sections were prepared with standard dimensions of 5 cm length and 7 cm width. Standard thin sections were developed with standard dimensions of 2 cm width and 2 cm length. The thickness of the large and standard thin sections was about 15–20 microns, and the maximum thickness was less than 30 microns. The actual thickness should meet the following requirements: (i) black minerals have good light transmission under orthogonal polarized light, (ii) shale lamination is clear, and (iii) interference color of the transparent mineral feldspar or quartz reaches first-order gray-white.
Depositional structures were mainly described with full-size large thin-section imaging and polarized light microscopy.

3.2. Organic Geochemistry

We performed a TOC test and an XRD analysis on 110 samples, porosity and permeability analyses on 78 samples, and main and trace element analyses on 18 samples; eight samples were tested using field-emission scanning electron microscopy (FE-SEM, Figure 3).
The TOC tests were performed using a LECO CS-200 carbon and sulfur analyzer, with an accuracy within 0.5%. Crushed samples were immersed in a 5% HCl solution for two days to eliminate all carbonate minerals. The samples were then dried in a stoving oven at 65 °C for two days.

3.3. Sedimentary Petrography

3.3.1. Thin Sections and X-ray Diffraction Analysis

For borehole Ning 211, 11 large polished thin sections were prepared and analyzed for rock fabric, texture, biotic content, and mineralogy, as well as 11 samples for X-ray diffraction whole rock component analysis and X-ray diffraction clay mineral analysis. For borehole Ning 212, only 2 large polished thin sections were prepared and analyzed for rock fabric, texture, biotic content, and mineralogy, as well as 2 samples for X-ray diffraction whole rock component analysis and X-ray diffraction clay mineral analysis.
The XRD tests were carried out using an RINT-TTR3 X-ray spectrometer (Japan, Tokyo, Rigaku). The mineral composition was quantitatively analyzed on the basis of the Chinese standard (SY/T 5163-2010) “X-ray diffraction analysis method for clay minerals and common non-clay minerals in sedimentary rocks”. Samples were crushed and sieved to 200 mesh size (74 μm) and dried at 50 °C for 5 h. Scanning range was 3–85°; aperture 1 mm, and speed 4°/min.

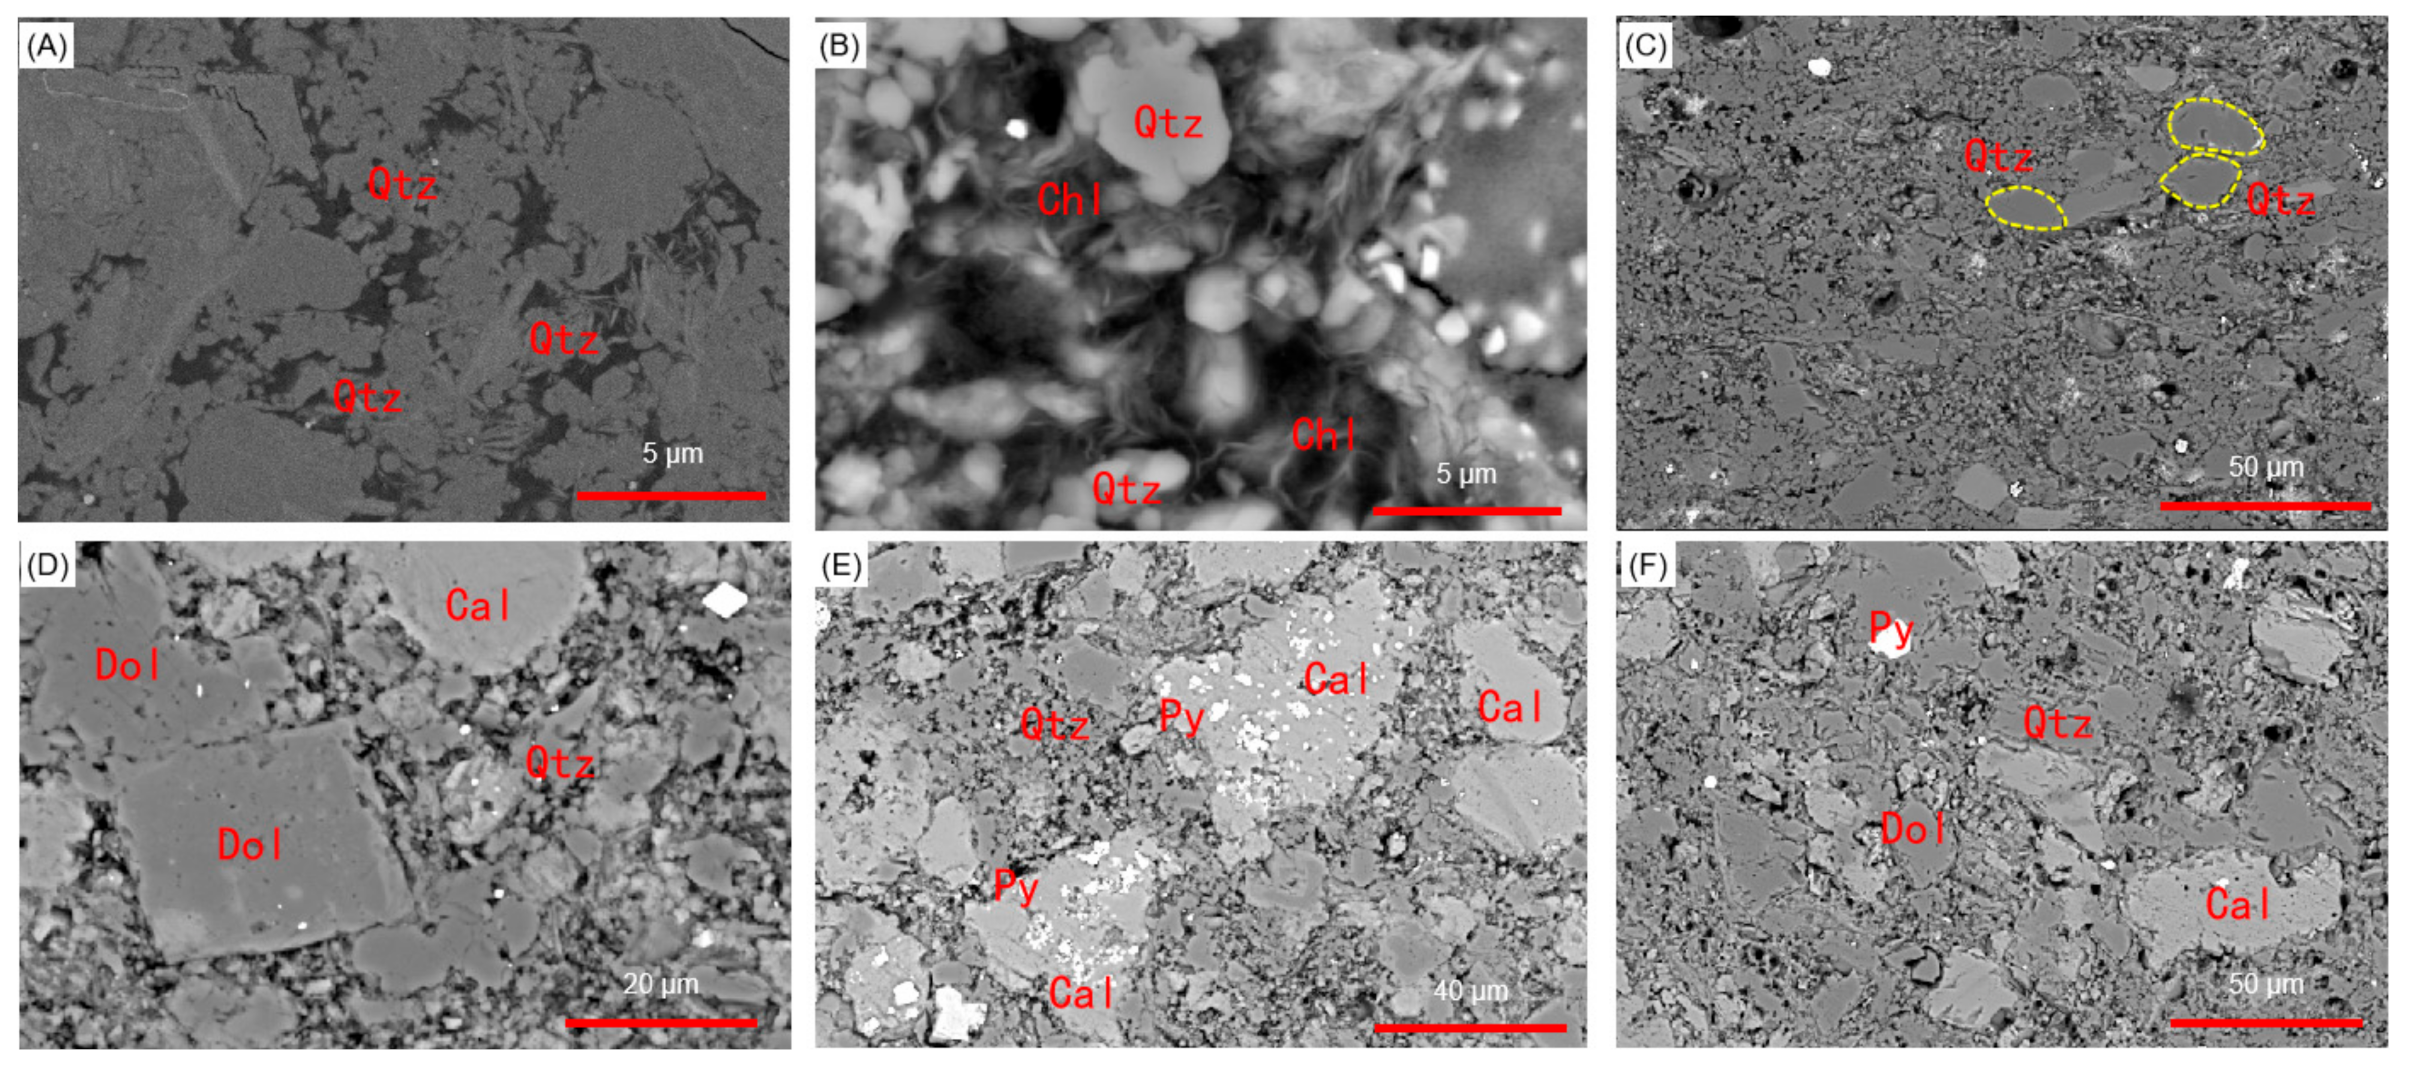
3.3.2. Scanning Electron Microscopy and Pore Analysis

The pore types and pore-size distribution were observed using Ar ion-polished chips and a field-emission scanning electron microscope (FE-SEM). The samples were cut into 8 mm × 6 mm × 2 mm chips and polished to a thickness of 0.1 mm using helium ion beams. The polished area had a semi-elliptical shape of 1500 μm × 500 μm with Pt coating at a thickness of 20 nm. Twenty-five scanning areas were randomly selected on the polished chips, each having a size of 6.88 μm × 12.3 μm, and observed in the backscattering magnification mode of 30 K. For each area, imaging software grains (Pores) and Cracks Analysis System (PCAS) was used to automatically identify all pores. Then, their pore types were identified artificially based on the classification of organic pores, inorganic pores, and microfractures and we did not differentiate the organic pores further. The number of different pore types, pore size, and porosity of a single pore were counted to obtain the cumulative area and porosity.

3.3.3. Helium Porosity and Permeability

Helium porosity and permeability sampling and analysis were carried out after the depositional structures determination of each sample. Core plugs with a diameter of 2.54 cm and length of 2.5–5 cm were drilled for the porosity and permeability analysis. The porosity was measured using a helium porosimeter (Coreval 700) (Vinci Technologies, Nanterre, France) at a pore and confining pressure of 200 psi and 1000 psi (89 MPa). Permeability was analyzed using a pulse decay permeameter (PDP-200) (Porous Materials Inc., Ithaca, NY, USA) at a pore and confining pressure of 600 psi and 1000 psi (89 MPa) using nitrogen.

3.3.4. Major and Trace Element Analysis and Sedimentation Rate

For borehole YS 103, 22 samples were prepared for main and trace element analysis. Major elements were determined by XRF spectrometer on fused glass discs. The precision of the major element analysis is ≤3%. The sample splits (100 mg) for trace element analysis were digested in a tightly sealed Teflon screw-cap beaker with ultrapure 0.5 mL HNO3 + 2.5 mL HF + 0.5 mL HClO4, digested again with 1 mL HNO3 + 3 mL H2O. The solution was diluted to 1:1000 by mass and analyzed on a VG PQ2 turbo inductively coupled plasma source mass spectrometer (ICP—MS). Precision for trace elements is better than 5%.
The indices of CIA, U/Th, Ni/Co, and V/Cr are calculated based on major and trace element data. CIA is expressed as: CIA = 100 × Al2O3/[(Al2O3 + CaO* + Na2O + K2O)]. Among them, the values are all expressed by mole fraction. CIA was proposed to express chemical weathering intensity and associated climate conditions [54]. Sediments deposited in a hot and humid tropic climate generally have CIA values in the range 85 to 100, those in a warm and humid climate in the range 65 to 85, and those in a cold and arid climate in the range 50 to 65. The ratios of U/Th, Ni/Co, and V/Cr are utilized to indicate palaeoredox conditions in this study. Commonly, the ratios of U/Th, Ni/Co, and V/Cr are below 0.75, 5, and 2 in the oxic water column, 0.75–1.25, 5–7, and 2–4.25 in the dysoxic water column, and above 1.25, 7, and 4.25 in the suboxic or anoxic water column, respectively [55].

4. Results

4.1. Layering

Clayey laminae and silty laminae are observed in the Wufeng–Longmaxi shale (Table 1, Figure 4A). Clayey laminae, consisting mainly of claystone, is dominantly composed of quartz (70~90%), OM (10~20%), clay minerals (3~5%), dolomite (2~3%), calcite (1~2%), and other minerals (1~2%) based on SEM calculation (Figure 5A–C). For clayey laminae, quartz is dominantly clay-sized with grain size less than 3.9 μm (Figure 5A–C). Silty laminae, consisting mainly of siltstone, are dominantly composed of dolomite (25~35%), calcite (25~35%), quartz (10~20%), pyrite (3~5%), and OM (5~10%) based on SEM calculation (Figure 5D–F). For the silty laminae, quartz is dominantly silt-sized with grain size in the range 4 φ to 8 φ. Clayey laminae have a grayer color under polarized light and are often termed gray laminae, whereas silty laminae have a brighter color under polarized light and are often termed bright laminae [16].
Quartz is dominantly clay- to silt-sized crystalline quartz. The shale that is rich in total quartz is often accompanied by a significant quantity of siliceous sponges (Figure 6A,B) and radiolaria [16]. Carbonate minerals mainly consist of calcite (average 22.3%) (Table A1) and dolomite (average 15.5%), and shales rich in carbonate minerals abound in dispersed or concentrated calcareous bioclasts (Figure 6C,D). Pyrite, which is rich in OM and pores, mostly occurs as framboids with diameters ranging from 3.5 to 8 μm (average 5.2 μm, [56]). Clay minerals are mainly illite (average 61.3%), illite-smectite layer-mixed minerals (average 26.9%), and chlorite (average 11.4%), with minor kaolinite (average 1%). The TOC content ranges from 1.5% to 12%, with an average of 5.6%. OM is dominantly dispersed among quartz, carbonate minerals, and pyrite grains, with minor OM combined with clay minerals forming organomineralic aggregates.
The vertical inter-lamination of clayey and silty laminae form two types of laminasets and four types of beds, i.e., clayey laminaset, silty laminaset, normally graded bed composed of claystone (NGB-C), inversely graded bed composed of claystone (IGB-C), normally graded bed composed of siltstone grading into claystone (NGB-SC), and inversely graded bed composed of siltstone grading into claystone (IGB-SC) (Table 1).
Silty laminasets, which are usually in discontinuous or lenticular shapes (Figure 4F), consist mainly of silty laminae interlaminated with tiny clayey laminae. Clayey laminasets, which usually have a discontinuous or lenticular shape (Figure 4F), consist mainly of clayey laminae interlaminated with tiny silty laminae. NGB-C, with a continuous, wavy, or planar base and an abrupt contact with the underlying unit, is mainly composed of clayey laminae. The lower part of the bed has a relatively higher content of silt. From the base to the top, silt content gradually decreases and the color becomes grayer (Figure 4B,G,H). IGB-C, with continuous, wavy or planar top and an abrupt contact with the overlying unit, is mainly composed of clayey laminae. The upper part of the bed has a relatively higher content of silt. From the top to the base, silt content gradually decreases and the color becomes grayer (Figure 4C). NGB-SC is composed of silty laminae and clayey laminae. Within a single bed, silty laminae that form a silty laminaset grade into clayey laminae that form a clayey laminaset from the base to the top (Figure 4D–E). In some cases, the silty laminasets that are interlaminated with clayey laminasets become thinner from the base to the top within a single bed. Beds are usually continuous, wavy or planar, parallel, and have a sharp base contact with the underlying units. IGB-SC is composed of silty laminae and clayey laminae. Within a single bed, clayey laminae that form a clayey laminaset grade into silty laminae that form silty laminaset from the base to the top. The bed is usually continuous, wavy or planar, parallel, and has a sharp top contact with the overlying units.

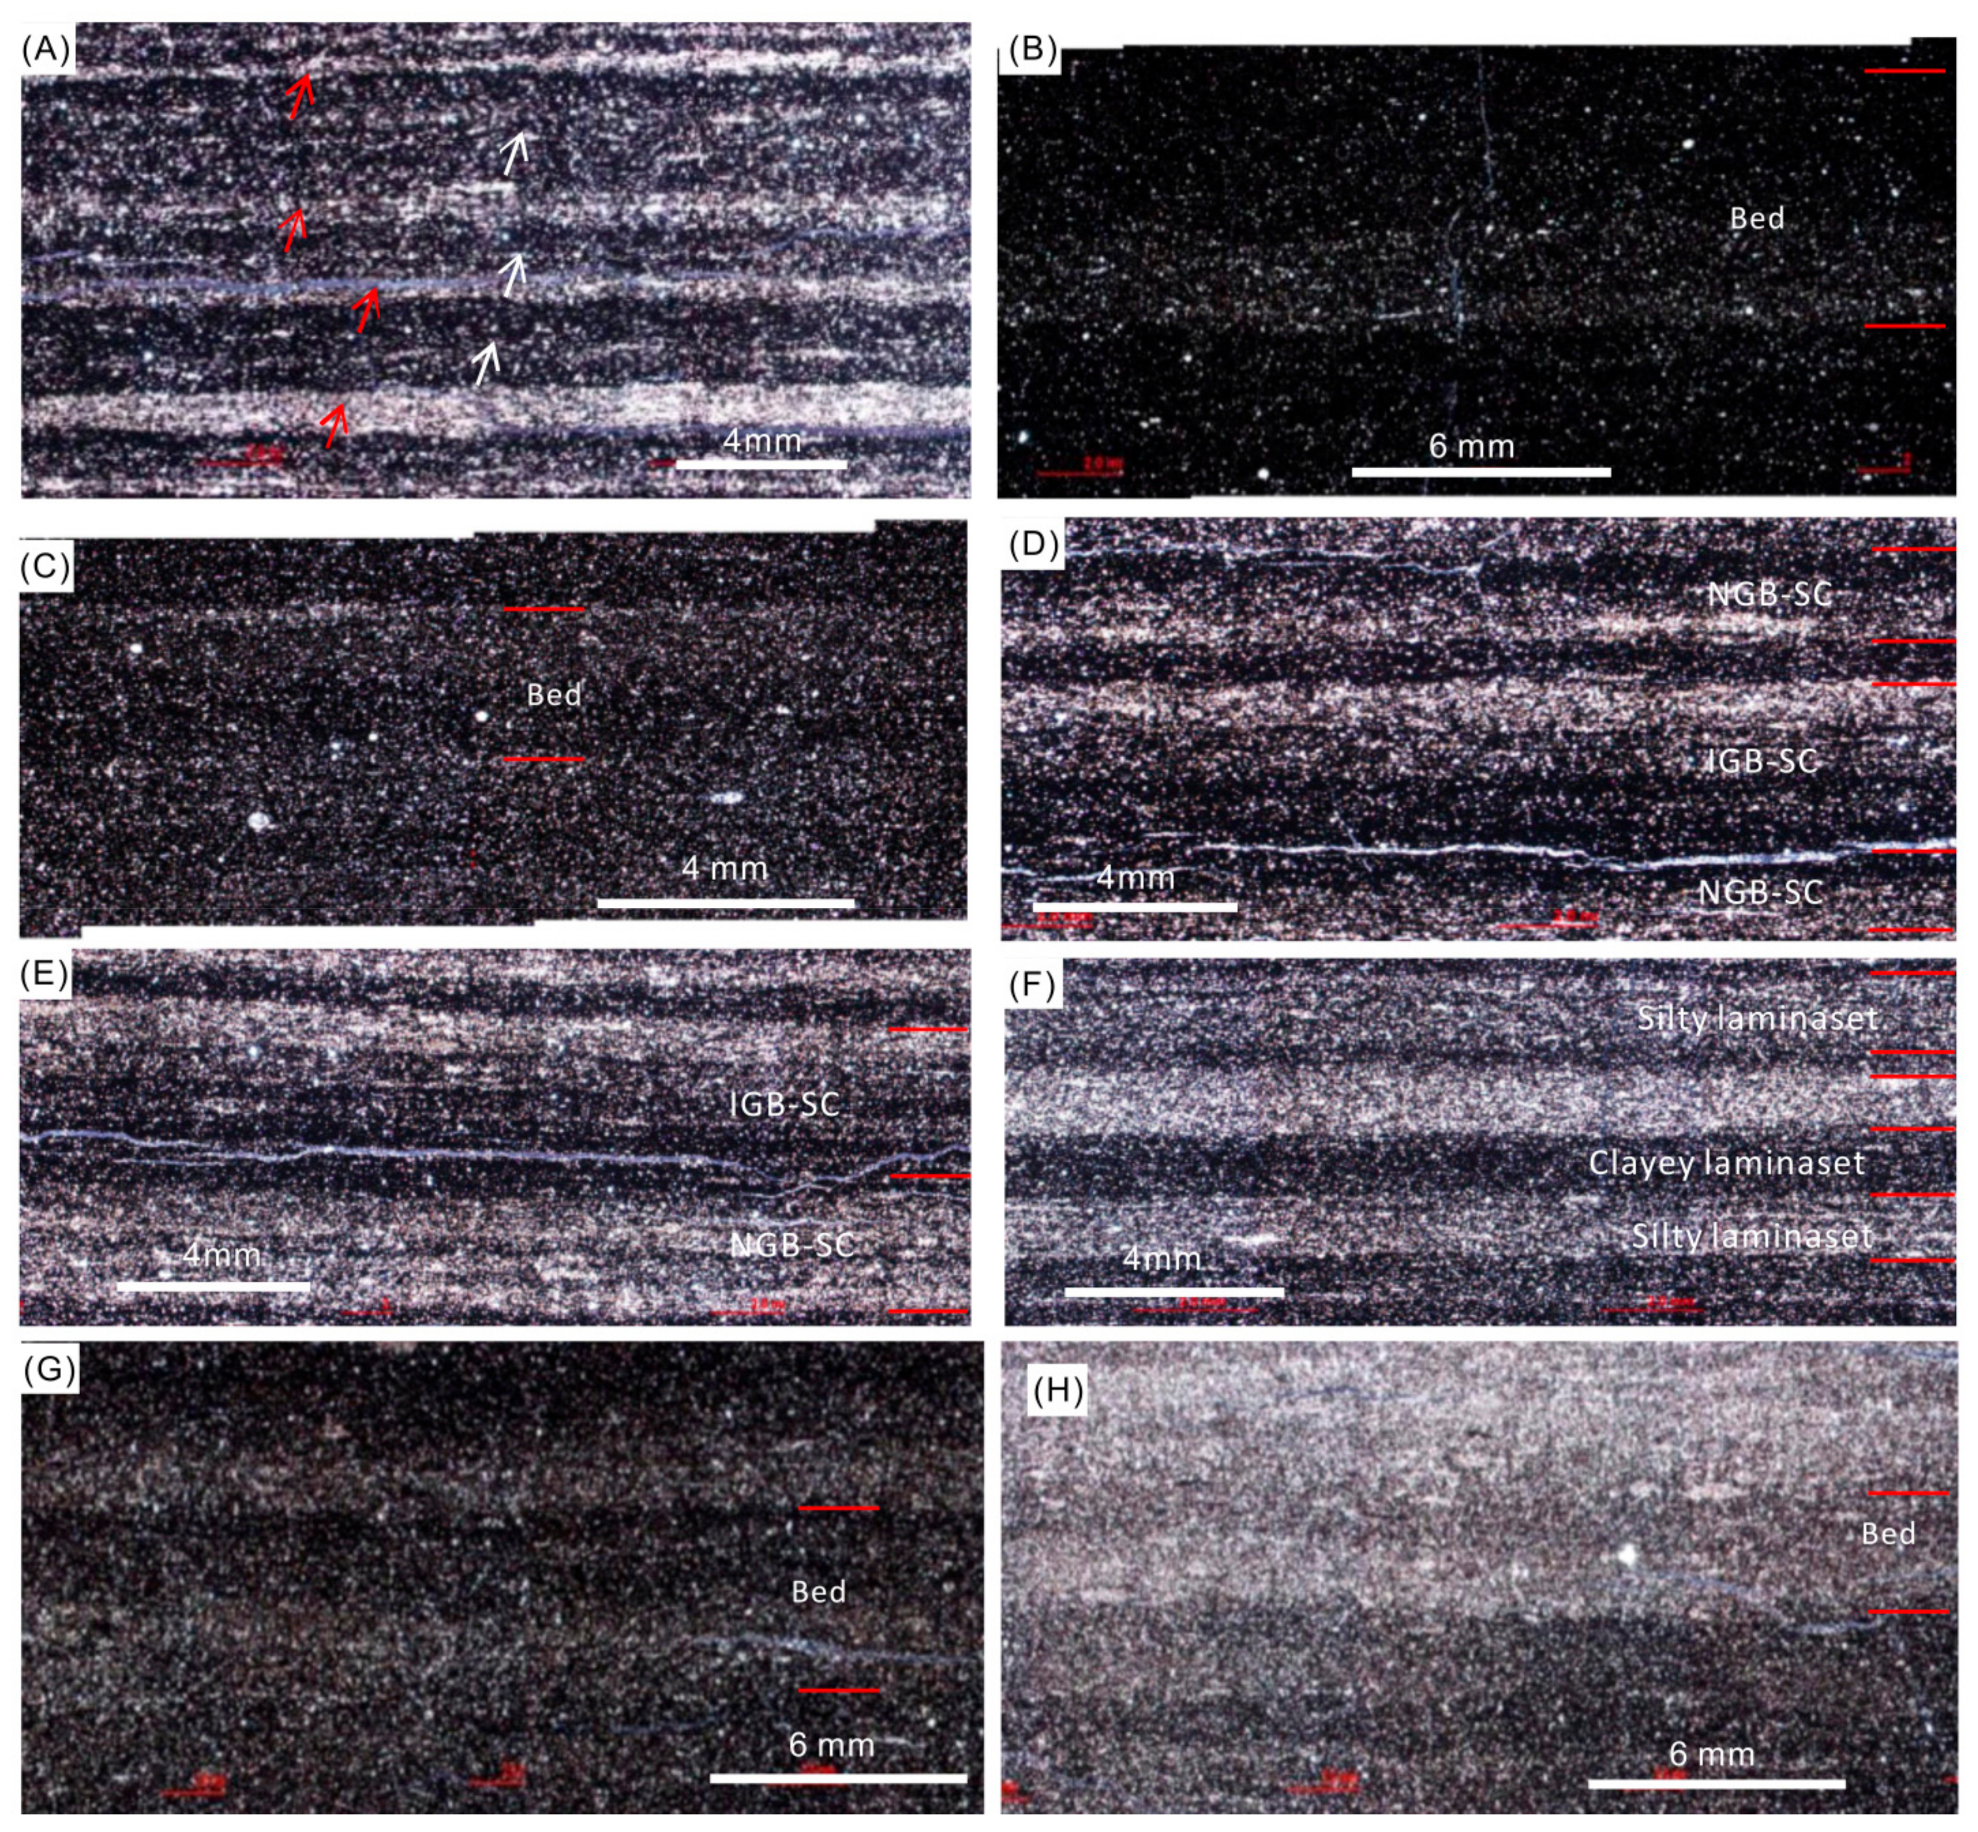
4.2. Depositional Structures

The vertical inter-lamination of lamina, laminasets, and beds forms two types of depositional structure, namely, parallel lamination and structureless beds (Table 1). The lamination can be subdivided into four sub-types, i.e., paper lamination composed of claystone (PL), grading lamination composed of claystone (GL-C), grading lamination composed of siltstone and claystone (GL-SC), and interlaminated lamination composed of siltstone and claystone (IL). In the Wufeng–Longmaxi shale, these structures are intergradational and are usually of small scale in vertical distribution.

4.2.1. Paper Lamination (PL)

The PL is constituted mainly of quartz, clay minerals, dolomite, calcite, and OM, and the average content of each component is 69.68%, 16.18%, 7.62%. 1.95% and 9.77%, respectively, based on the XRD test of 13 samples (Table A1). Traces of silt of biogenic and biochemical origin are common in the PL because of the blooming of siliceous organisms resulting from warm weather and limited clastic influx. The shale can split down to layers of a particular thickness on weathered outcrops and cores. In addition, the individual sequences of the PL shale range from 33 to 83 cm in thickness, and across adjacent sequence boundaries, siltstone changes into claystone abruptly. On freshly cut surfaces perpendicular to the lamination, linear lighter color banding reflecting grain-size differences commonly occurs alternated with darker layers (Figure 7A).
The PL consists of clayey laminasets intercalated with linear silty laminae (Figure 8A). The thickness ratio of clayey laminaset to silty laminae is generally greater than 3. Silty laminae range from 0.05 to 0.75 mm with an average of 0.26 mm in thickness, whereas clayey laminasets are approximately 0.1 to 6.6 mm with an average of 1.1 mm in thickness. Silty laminae usually have linear, diffuse, or discontinuous shapes and are locally lenticular. The interfaces between clayey laminasets and silty laminae are abrupt and mostly exhibit discontinuous, planar, and parallel shapes with occasional continuous, planar, and parallel shapes.

4.2.2. Grading Lamination Composed of Claystone (GL-C)

The GL-C is constituted mainly of quartz, calcite, dolomite, clay minerals, and OM. The average content of each component is 41.23%, 24.05%, 15.20%, 14.88%, and 4.59%, respectively, based on XRD and TOC tests of 65 samples (Table A1). On outcrops and cores, the colors of the adjacent beds often show slight differences (Figure 7B), which leads to great difficulty in distinguishing them from each other. The individual sequences of the GL-C shale, which are often separated from others by a bentonite seam (0.3–4 cm thick), usually range from 26 to 129 cm in thickness with an average of 52 cm. Across adjacent sequence boundaries, siltstone abruptly changes into claystone.
The GL-C consists of beds NGB-C and/or IGB-C (Figure 8B,C), which are characterized by abrupt changes in grain size and color across the bed surface. Within the shale with GL-C, the bed thickness of NGB-C ranges from 0.8 to 12 mm with an average of 5 mm, whereas that of IGB-C ranges from 2 to 9.7 mm with an average of 5.3 mm. Bed surfaces are mostly continuous, planar, and parallel, with minor interfaces that have continuous, wavy, and parallel shapes.

4.2.3. Grading Lamination Composed of Siltstone and Claystone (GL-SC)

The GL-SC is constituted mainly of quartz, calcite, dolomite, clay minerals, and OM. High intensities of illite show that illite is relatively enriched in the GL-SC. The average content of each component is 51.94%, 11.84%, 12.06%, 19.2%, and 7.74%, respectively, based on XRD and TOC tests of 5 samples (Table A1). On outcrops and cores, the individual sequences of the shale range from 24 to 53 cm with an average of 42 cm in thickness, and across adjacent sequences, siltstone abruptly changes into claystone. The shale has a distinct “striped” appearance of alternating lighter and darker layers as well as intermittent bright calcite beds (Figure 7C,D).
The GL-SC consists of beds NGB-SC and/or IGB-SC with a tiny amount of clayey lamina (Figure 8D). The bed NGB-SC, with a sharp base and gradational top, ranges from 1 to 2.85 mm with an average of 1.87 mm in thickness. The clayey laminae are approximately 0.45 to 0.75 mm thick with an average of 0.56 mm. The bed IGB-SC is approximately 1.8 to 2.1 mm in thickness with an average of 1.95 mm. Within an individual layer of the GL-SC, beds are predominantly continuous, planar, parallel or continuous, wavy, and parallel in shape.

4.2.4. Interlaminated Lamination Composed of Siltstone and Claystone (IL)

The IL consists mainly of quartz, calcite, dolomite, clay minerals, and OM, and the average content of each component is 43.67%, 21.48%, 15.53%, 13.77%, and 4.93%, respectively, based on XRD and TOC tests of 9 samples (Table A1). XRD pattern exhibits that the intensity of the dolomite crystal plane (104) is high, demonstrating high content of dolomite developed in the IL due to a Ca-rich depositional environment. On outcrops and cores, the individual sequences of the IL have thicknesses ranging from 22 to 97 cm with an average of 34.7 cm, and across adjacent sequences, siltstone changes into claystone abruptly. Within an individual sequence of the IL, paler beds alternate with darker beds and the paler beds become thicker relative to the GL-SC (Figure 7E).
The IL has stacking patterns of silty laminae interbedded with clayey laminasets (Figure 8E) and silty laminasets interbedded with clayey laminasets (Figure 4F). For the first stacking pattern, silty laminae have a predominantly linear shape and thickness ranging from 0.05 to 2.4 mm with an average of 0.35 mm, and clayey laminasets have a thickness ranging from 0.1 to 1.7 mm with an average of 0.58 mm. Except for a few discontinuous, planar, and parallel laminae, silty laminae have an abrupt contact with the clayey laminasets and have mainly continuous, planar, and parallel shapes. For the second stacking pattern, the thickness of silty laminasets ranges from 0.35 to 4.5 mm with an average of 1.57 mm, whereas that of clayey laminasets ranges from 0.6 to 3.1 mm with an average of 1.35 mm. The top and base of all beds have an abrupt contact and are predominantly continuous, planar, and parallel or discontinuous, wavy and parallel.

4.2.5. Structureless Beds (SB)

The SB is constituted mainly of quartz, calcite, dolomite, clay minerals, and OM. The intensity of the calcite crystal plane (104) is obviously higher than other depositional structures. The average content of each component is 35.12%, 29.30%, 16.28%, 15.38%, and 5.99%, respectively, based on XRD and TOC tests of 18 samples (Table A1).
The SB consists of massive siltstone (Figure 8F) embedded with dispersed bioclasts (Figure 6). On outcrops and cores, the shale shows no obvious lamination, bedding, or fissility, irrespective of their weathering state (Figure 7F). Previous studies have shown that the bioclasts originate from the biotic community of the Hirantian stage [57]. The individual sequences of the SB, with a thickness ranging from 28 to 156 cm (average of 77 cm), usually have an erosive base with noticeable depositional termination.
In the Wufeng–Longmaxi shale, the GL-C occurs during the graptolite zone WF1-3 of the Wufeng Formation, the SB during the graptolite zone WF4 of the Wufeng Formation (the so-called Guanyingqiao Bed), the PL during the graptolite zone LM1, the GL-SC during the graptolite zone LM2-3 and the IL during the graptolite zone LM4-9 of the Longmaxi Formation (Figure 9).

4.3. Geochemical Parameters and Sedimentation Rate

4.3.1. Geochemical Parameters

The CIA values fluctuate from the Late Ordovician to Early Silurian (Table A2). The CIA values of the GL-C (graptolite zone WF1-3) range from 74.72 to 67.54 with a mean value of 71.07. The CIA value of the SB sample (graptolite zone WF4) is only 45.51. Upwards, the CIA values of the PL (graptolite zone LM1) return to be higher (67.09–75.08), then fluctuating between 61.79 and 70.59 for the GL-SC and IL with a very slight downward trend.
The U/Th values of the GL-C (graptolite zone WF1-3) range from 0.36 to 1.76 with an average of 1.22 (Table A2). The value of the SB (graptolite zone WF4) is 0.46. Upwards, the U/Th values of PL (graptolite zone LM1) elevate significantly and reach the peak of 4.39 (average = 2.40), then returning to the average value of 2.40 for the GL-SC (graptolite zone LM2-3) and 0.63 for the IL (graptolite zone LM4-9).
The Ni/Co values of the GL-C (graptolite zone WF1-3) range from 13.14 to 49.7 with an average of 33.7 (Table A2). The value of the SB (graptolite zone WF4) is 8.93. Upwards, the Ni/Co values of the PL (graptolite zone LM1) are increased to the range between 5.91 and 18.45 (average = 13.38), then decreasing gradually to the average of 9.57 for the GL-SC (graptolite zone LM2-3) and 4.74 for the IL (graptolite zone LM4-9).
The V/Cr values of the GL-C (graptolite zone WF1-3) range from 1.81 to 3.45 with an average of 2.93 (Table A2). The value of the SB (graptolite zone WF4) is 8.08. Upwards, the values of the PL (graptolite zone LM1) increase abruptly, reaching the peak of 21.11 and then decreasing continuously to the average of 4.09 for the GL-SC (graptolite zone LM2-3) and 2.16 for the IL (graptolite zone LM4-9).

4.3.2. Sedimentation Rate

Sedimentation rates are calculated based on shale thickness (m) and duration time (Ma). Here, shale thickness (m) directly refers to the current shale thickness (m) without compaction restoration. Duration time refers to the time span of the corresponding shale thickness.
The sedimentation rates of the GL-C, SB, PL, GL-SC, and IL increase progressively (Figure 9). During the formation period of the GL-C (graptolite zone WF1-3), the shale thickness ranges from 1.5 to 13 m and the duration is 2.46 Ma [58], therefore the sedimentation rate fluctuates between 0.6 and 5.3 m/Ma. During the formation period of the SB (graptolite zone WF4), the shale thickness ranges from 0.5 to 1.5 m and the duration is 0.73 Ma, therefore the sedimentation rate fluctuates between 0.7 and 2.1 m/Ma. During the formation period of the PL (graptolite zone LM1), the shale thickness ranges from 1 to 4.5 m and the duration is 0.6 Ma, therefore the sedimentation rate fluctuates between 1.7 and 7.5 m/Ma. During the formation period of the GL-SC (graptolite zone LM2-3), the shale thickness ranges from 2 to 10 m and the duration is 1.36 Ma, therefore the sedimentation rate fluctuates between 1.5 and 7.4 m/Ma. The sedimentation rates of ILrange from 2.2 to 1416.7 m/Ma (graptolite zones LM4-9). In detail, the shale thickness ranges from 2 to 14.5 m, the duration is 0.9 Ma, and the sedimentation rate varies between 2.2 and 16.1 m/Ma (graptolite zone LM4). The shale thickness ranges from 4 to 25 m and the duration is 0.8 Ma and the sedimentation rate varies between 5.0 and 31.2 m/Ma (graptolite zone LM5). The shale thickness ranges from 20 to 160 m and the duration is 2.28 Ma, and the sedimentation rate varies between 8.8 and 70.2 m/Ma (graptolite zone LM6-8). The shale thickness ranges from 50 to 510 m and the duration is 0.36 Ma, and the sedimentation rate varies between 138.9 and 1416.7 m/Ma (graptolite zone LM9). Therefore, the sedimentation rate of the IL ranges from 2 to 1416.7 m/Ma.

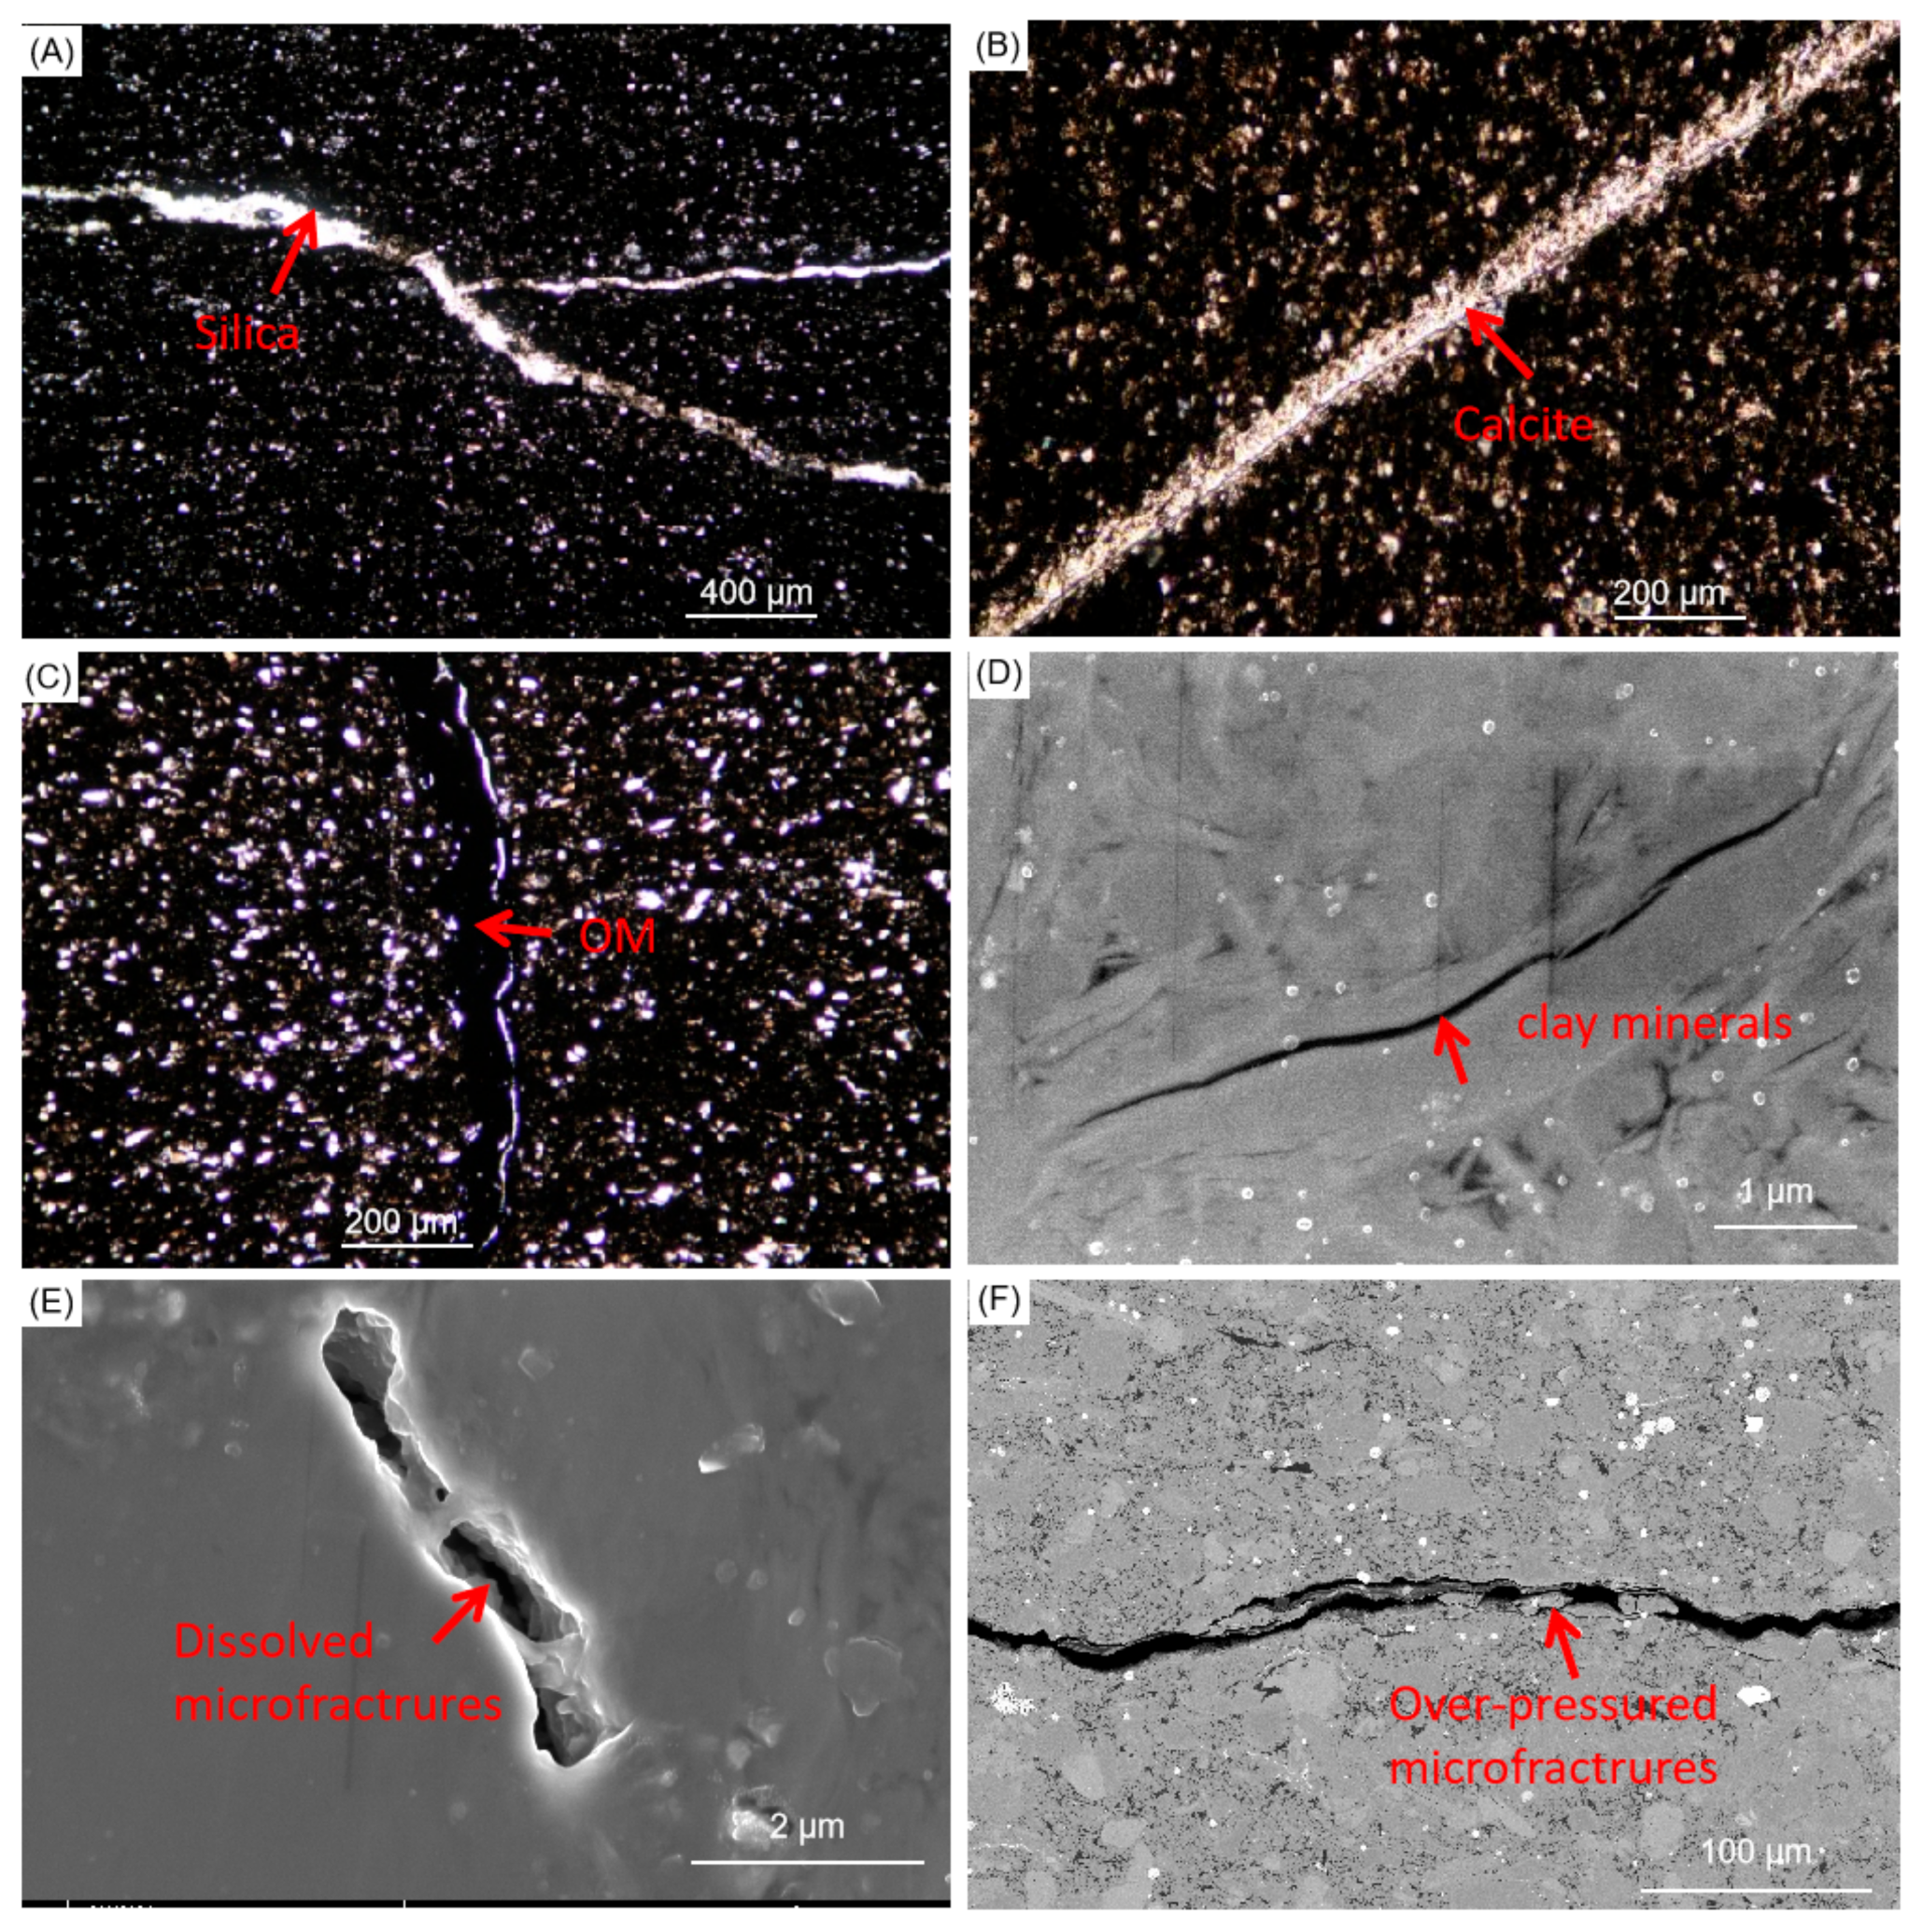
4.4. Fractures and Microfractures

Fractures refer to structures having lengths >10 μm and microfractures having lengths ranging from 100 to 500 nm. Fractures can be divided into bedding parallel and non-parallel fractures (Figure 8). Bedding parallel fractures are parallel to or intersect the lamination plane at low angles, whereas bedding non-parallel fractures intersect the lamination plane either at high angles or are perpendicular to it. Microfractures can be subdivided into dissolved microfractures, shrinkage microfractures, and over-pressured microfractures.
In the Wufeng–Longmaxi shale, bedding parallel fractures commonly propagate from within clayey laminae (Figure 8A,C,D) or from along clayey–silty laminae interfaces (Figure 8B). Most bedding parallel fractures are filled with silica (Figure 10A), calcite (Figure 10B), or OM (Figure 10C), and fewer than 15% are filled with clay minerals or pyrite crystallites. Bedding parallel fractures generally connect with each other to form an effective pathway horizontally (Figure 8C), although locally they occur as isolated structures. The length of bedding parallel fractures is commonly 1–4 cm and positively correlated with lamina continuity and thickness. Bedding non-parallel fractures are commonly perpendicular to lamination (Figure 8A,D) and filled with OM or silica. Few are open or contain nothing but crystallites. Vertically, bedding non-parallel fractures can cut through multiple laminae to form networks with bedding parallel fractures (Figure 8A,D). Shrinkage microfractures appear to have propagated from among clay mineral grains (Figure 10D), dissolved microfractures from between carbonate mineral grains (Figure 10E), and over-pressured microfractures from along OM-mineral interfaces (Figure 10F), and their length and abundance are influenced by TOC of the host lamina [59].
In the Wufeng–Longmaxi shale, depositional structures have a significant impact on fracture types and abundance of shale. For the PL and GL-SC, bedding parallel and non-parallel fractures have an abundance of 25.5 strips/cm and 10.6 strips/cm, respectively, and commonly intersect with each other to form dense networks (Figure 8A,D). For the IL, the abundances of bedding parallel and non-parallel fractures are 3–7 strips/cm and 2–4 strips/cm, respectively. Bedding parallel fractures commonly occur as isolated structures (Figure 8E). For the GL-C, the abundances of bedding parallel and non-parallel fractures are 2–4 strips/cm and 1–2 strips/cm, respectively. Commonly, bedding parallel fractures are connected with each other or occur as isolated structures (Figure 8B,C). For the SB, fractures are sparse and commonly occur as isolated structures (Figure 7F).

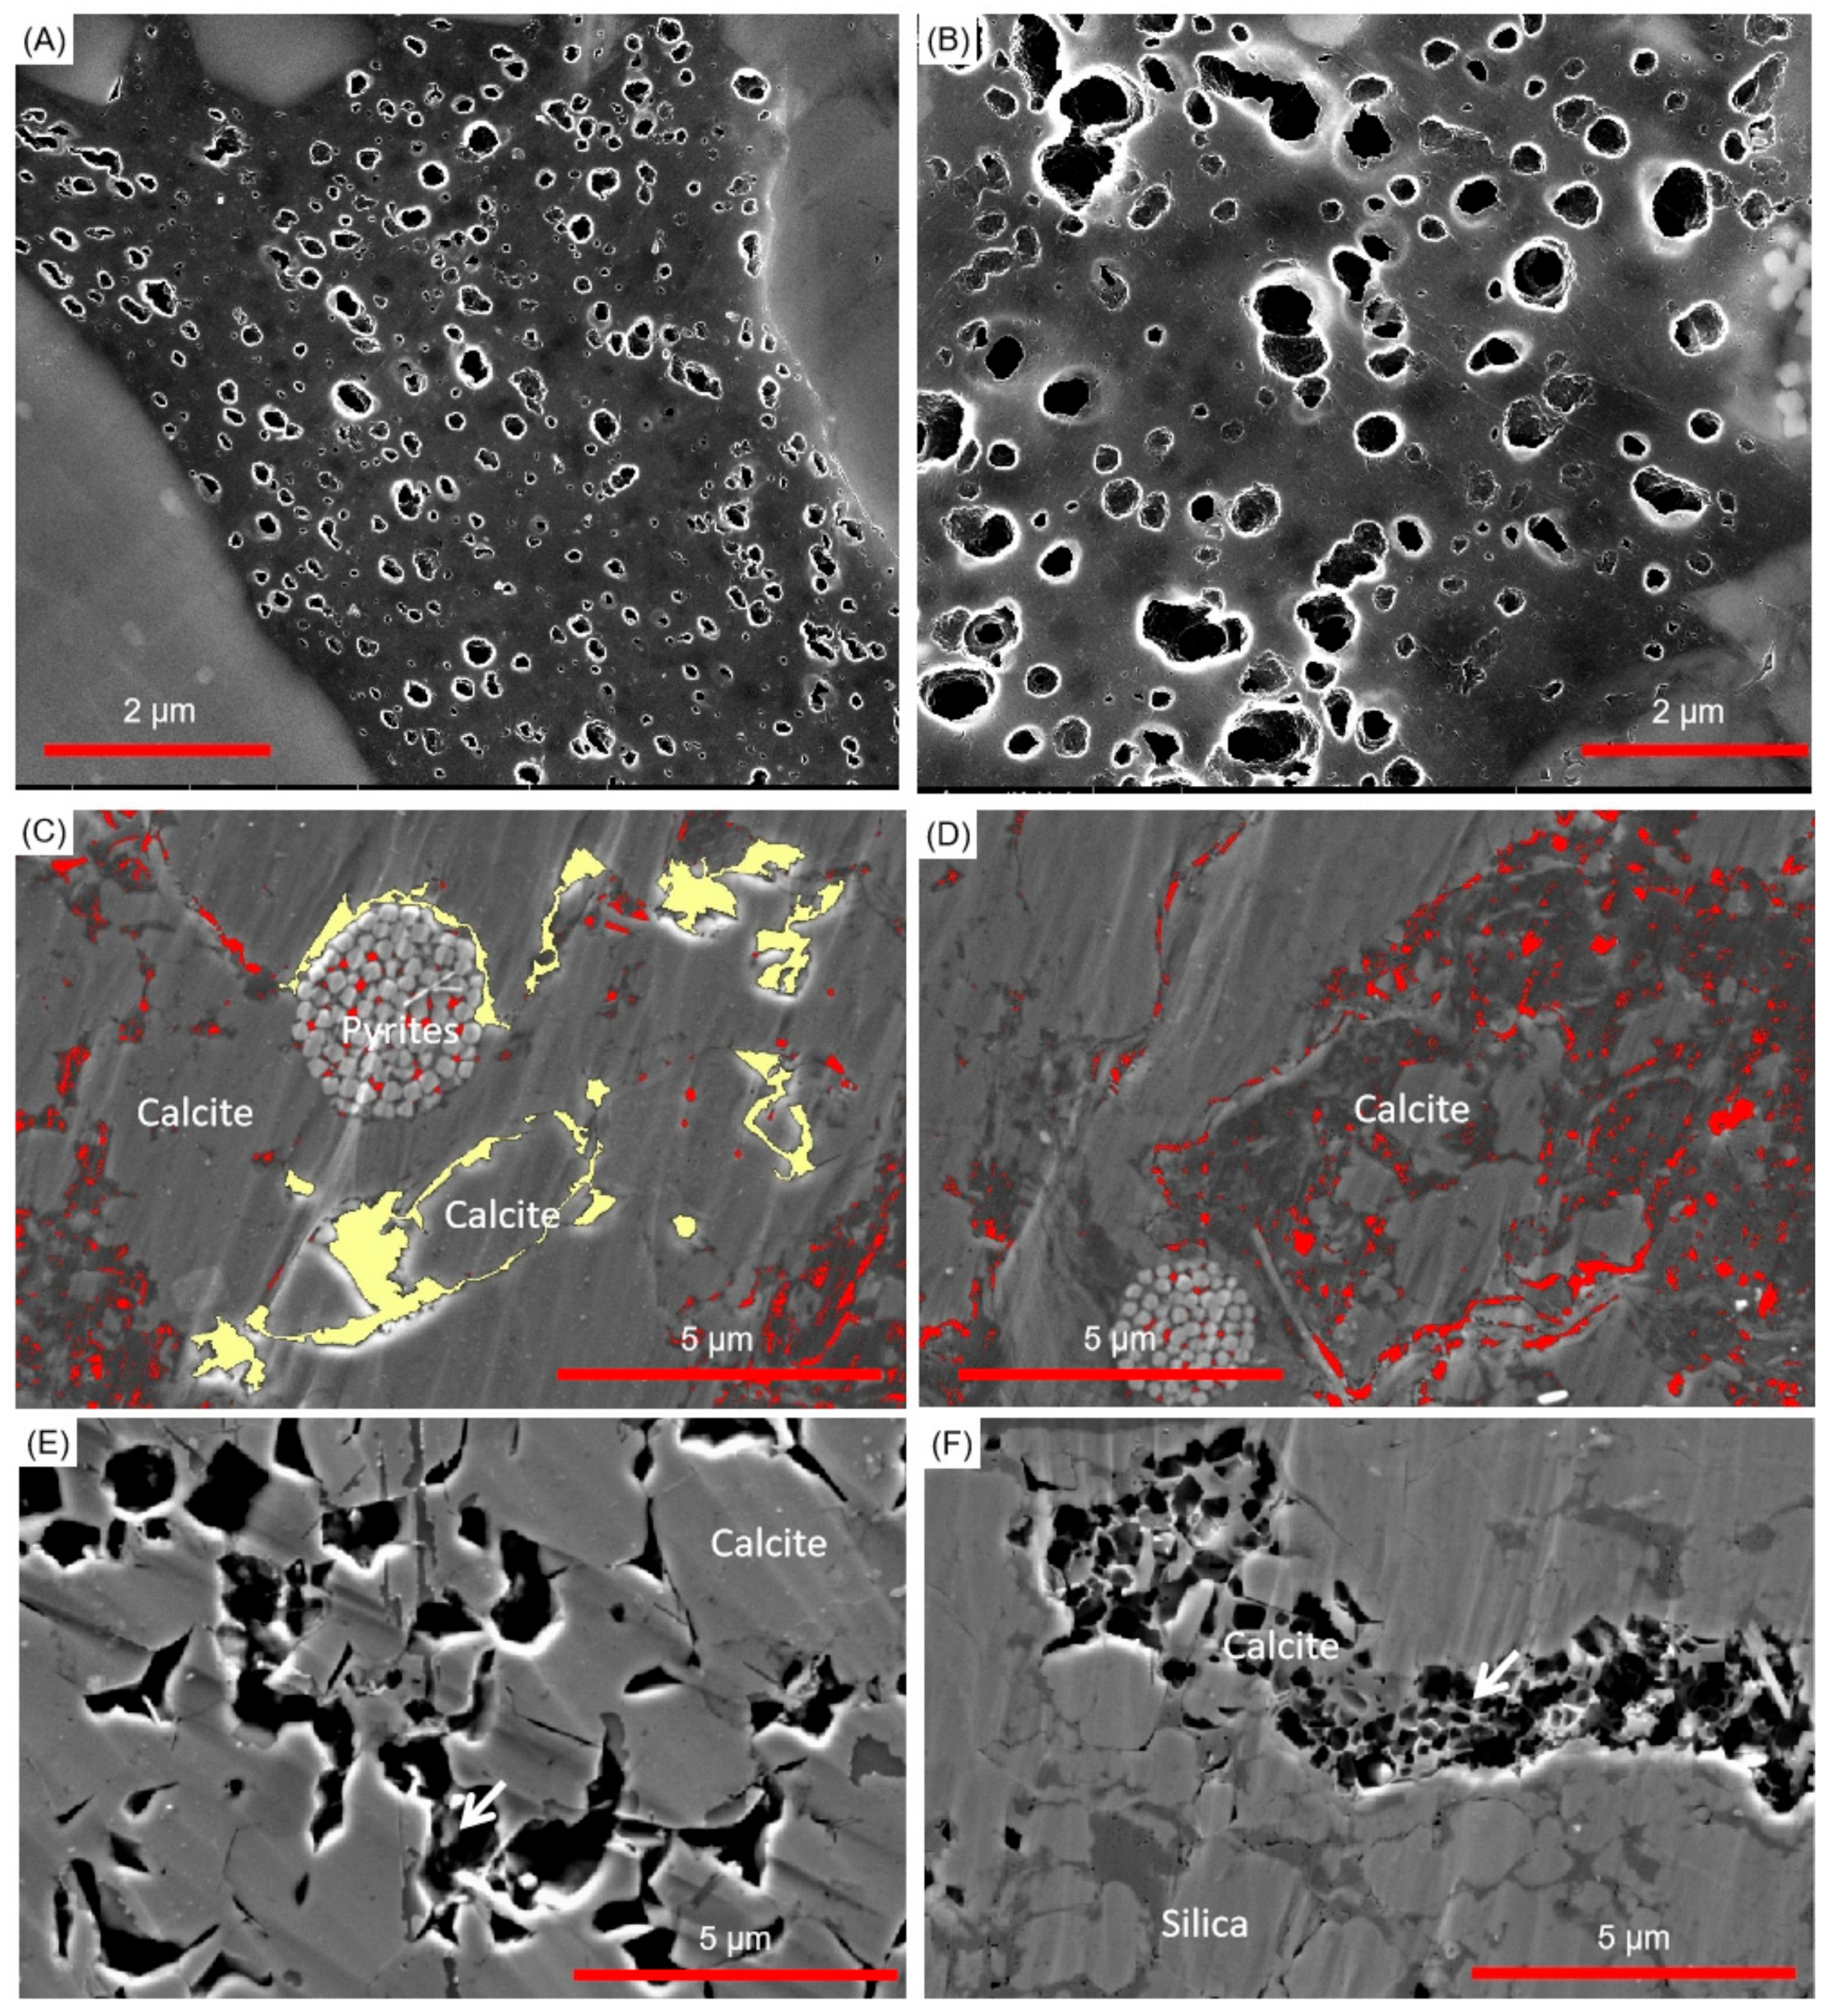
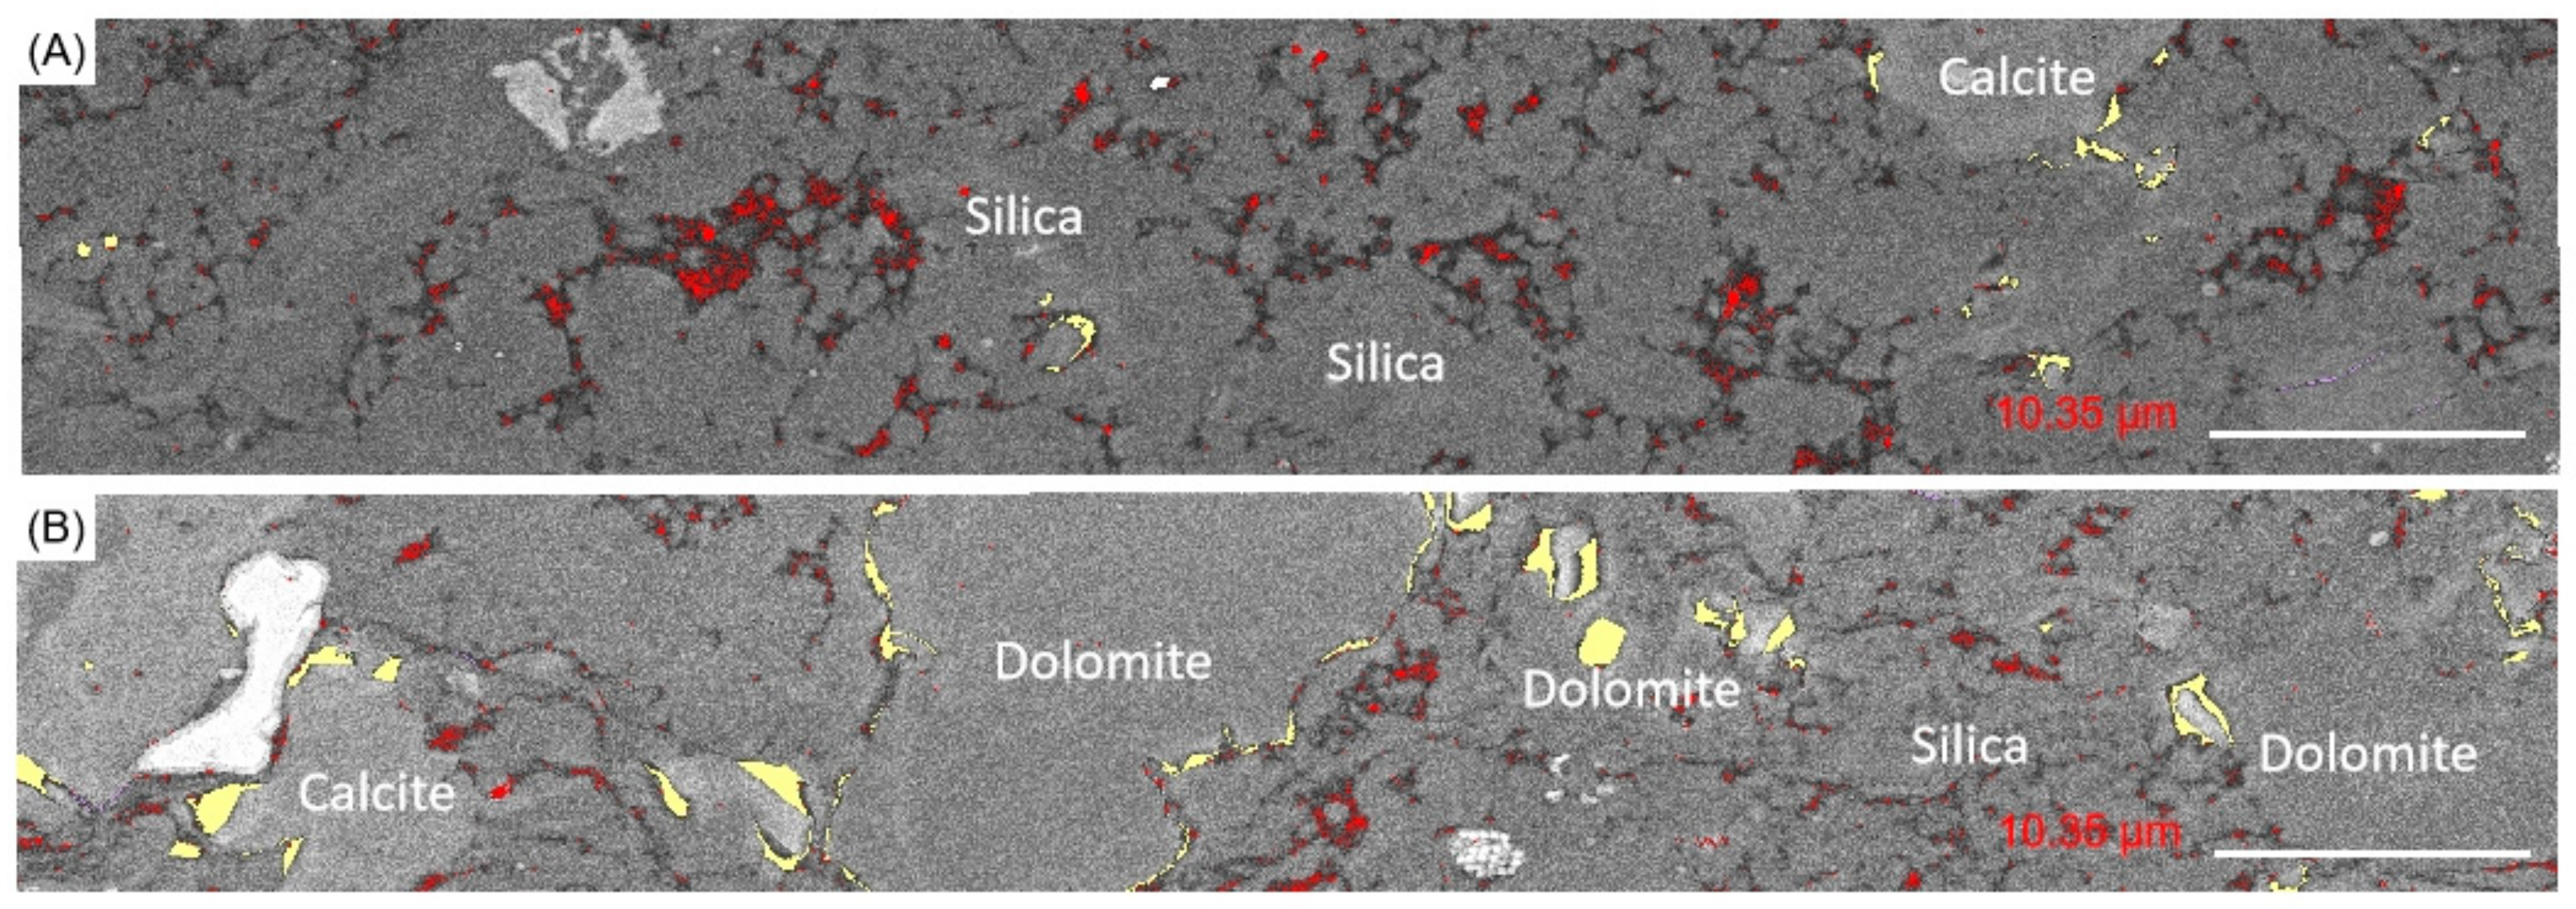
4.5. Nanopores and Porosity Distribution

Nanopores can be categorized into organic pores and inorganic pores (Figure 11). Organic pores commonly propagate along organic matters to form dense networks. Some organic pores are round or semi-circular shaped, others are mostly bubble-like as well as elongated, triangular, or irregular shaped. Inorganic pores can be subdivided into inter-particle pores and inter-particle dissolved pores [39,60,61,62]. Inter-particle pores commonly occur isolated among or between clay, quartz, and carbonate mineral particles and have irregular or elongated edges (Figure 11C,D). Inter-particle dissolved pores mainly occur among or between easily dissoluble minerals such as calcite and dolomite possibly generated during hydrocarbon generation (Figure 11E,F), and particle edges are dissolved to form a harbor shape. Unlike the centralized distribution pattern of organic pores, inorganic pores commonly are isolated with poor connectivity. Pyrites occur in the matrix, which can cause pore disconnection and has limited contribution to shale porosity and permeability [63].
On the basis of FE-SEM observations of imaging area with a length of 82.8 μm and width of 16.344 μm (Figure 12), clayey laminae abound in organic pores whereas silty laminae abound in inorganic pores. In detail, organic pores of clayey laminae are 2–3 times more than silty laminae, whereas silty laminae have 3–4 times more inter-particle pores and 1–2 times more inter-particle dissolved pores than clayey laminae. Furthermore, clayey laminae have relatively fewer microfractures than silty lamina. Clayey laminae commonly have effective pore networks as the result of their higher OM contents (Figure 12A), whereas silty laminae have poor pore networks as the result of their limited OM contents (Figure 12B). Across clayey–silty lamina interfaces, pore networks are commonly interrupted as a result of abrupt termination of OM and inhibition of larger mineral grains.
In the Wufeng–Longmaxi shale, the samples are tested to have a total porosity ranging from 2.68% to 4.36%. Among these samples, the organic pore porosity accounts for >50% of the total porosity in the PL, GL-SC, and IL, while the percentage is less than 30% in the GL-C and SB (Figure 13). The ratios of microfracture porosity to total porosity are 7.4% and 8.2% in the GL-C and SB, respectively, which are apparently higher than that in the PL, GL-SC, and IL. According to the above SEM photos (Figure 12), there were a large number of organic matter pores in the pyrobitumen of the Wufeng–Longmaxi shale, with a large diameter and strong connectivity, and solid kerogen had a few organic matter pores. Pores developed in organic matter contributed more to the total organic porosity.

4.6. Physical Properties

In the Wufeng–Longmaxi shale, porosity distribution and permeability are apparently influenced by depositional structures.

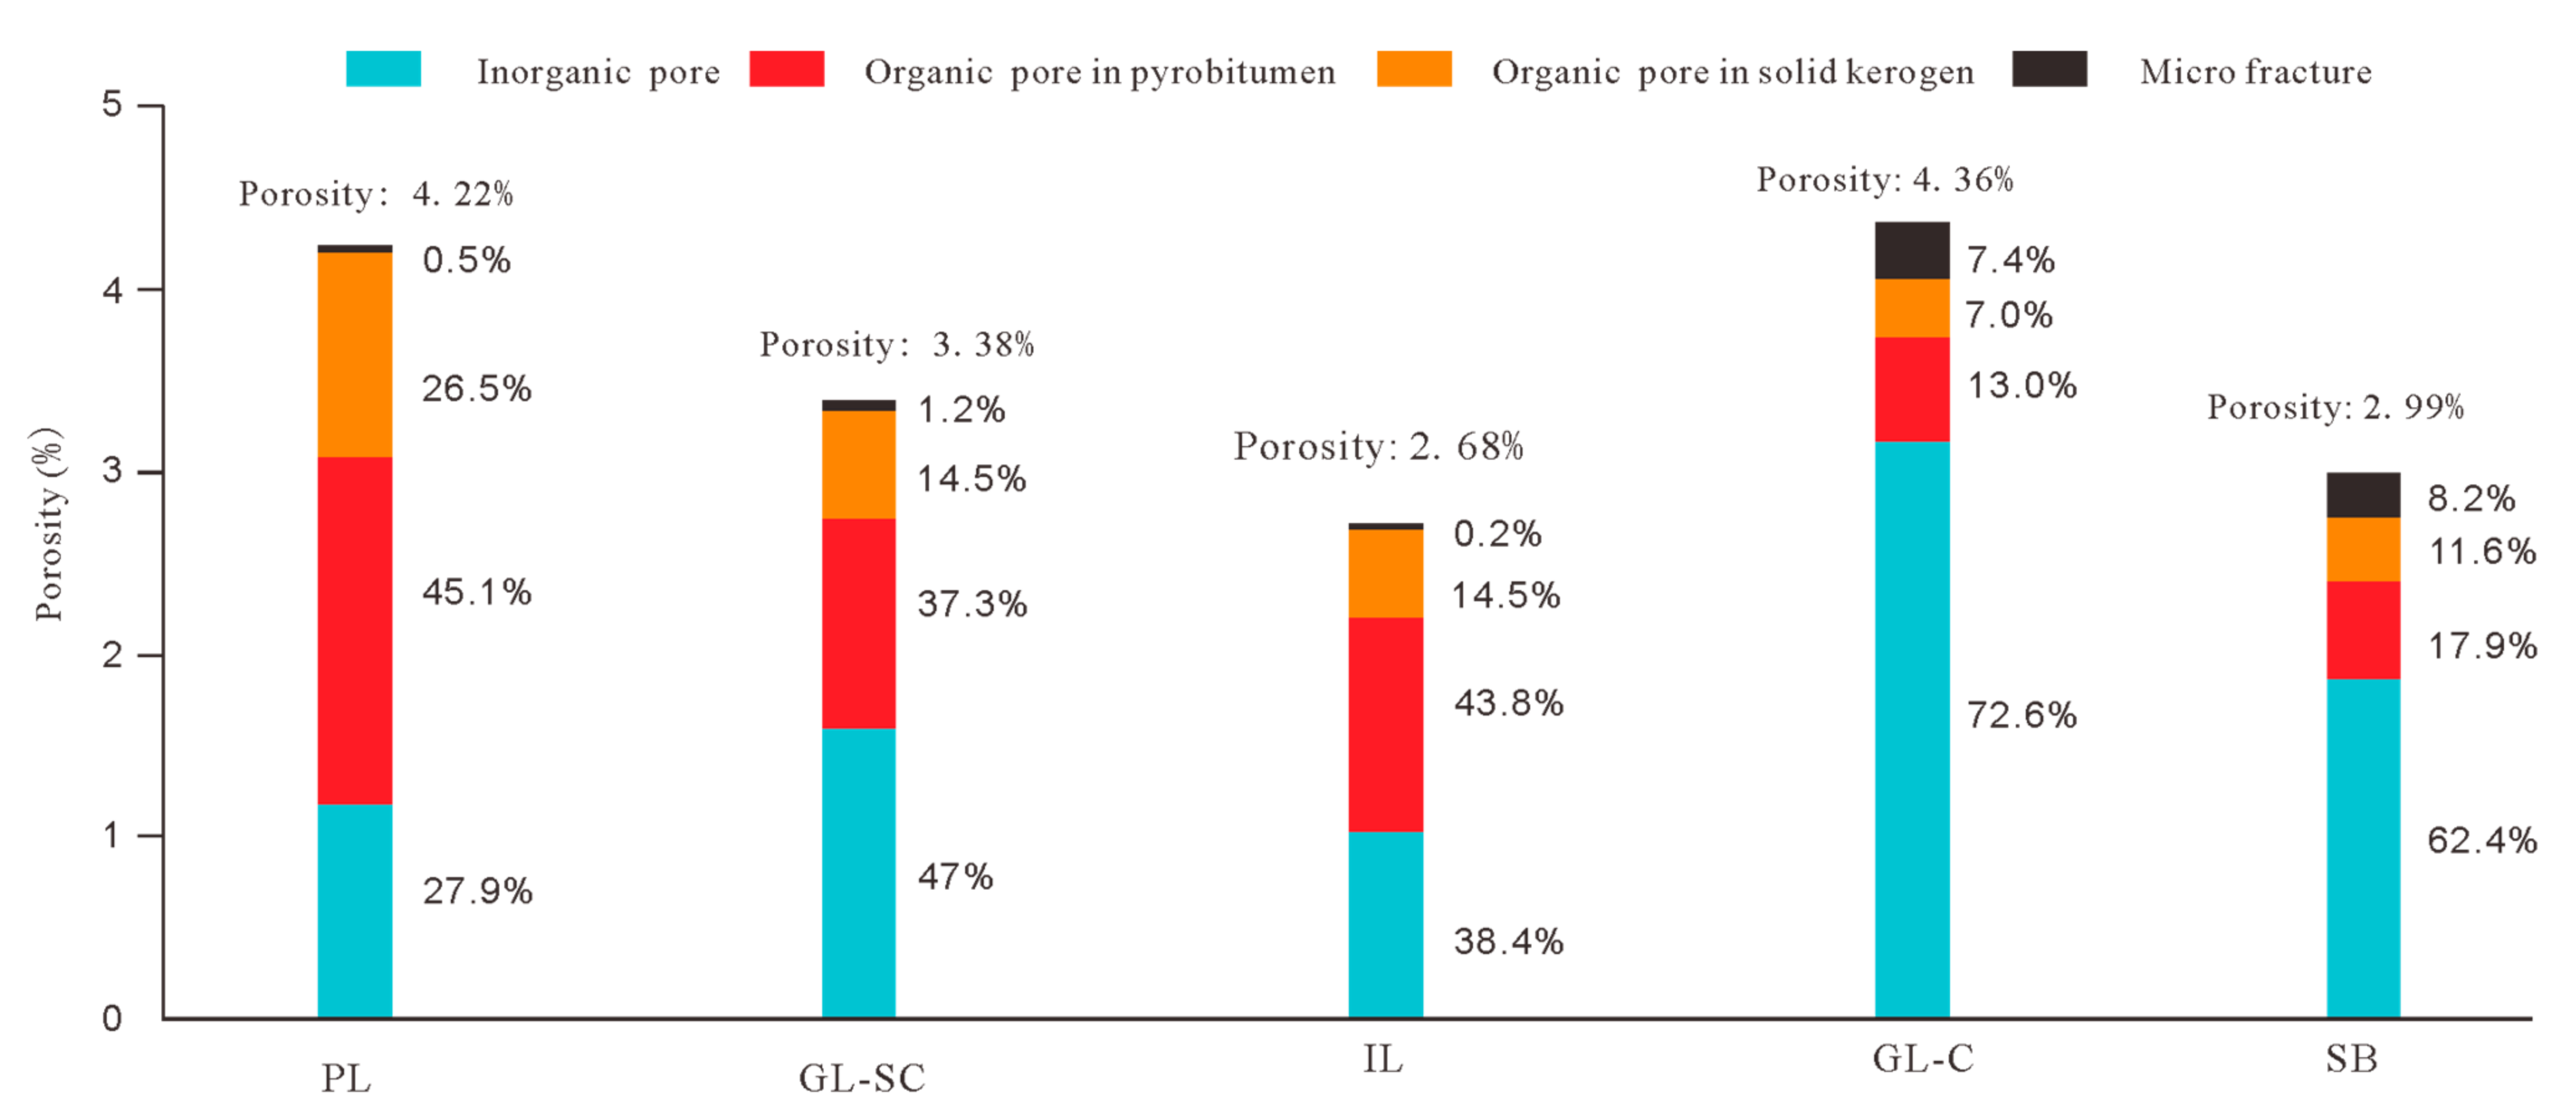
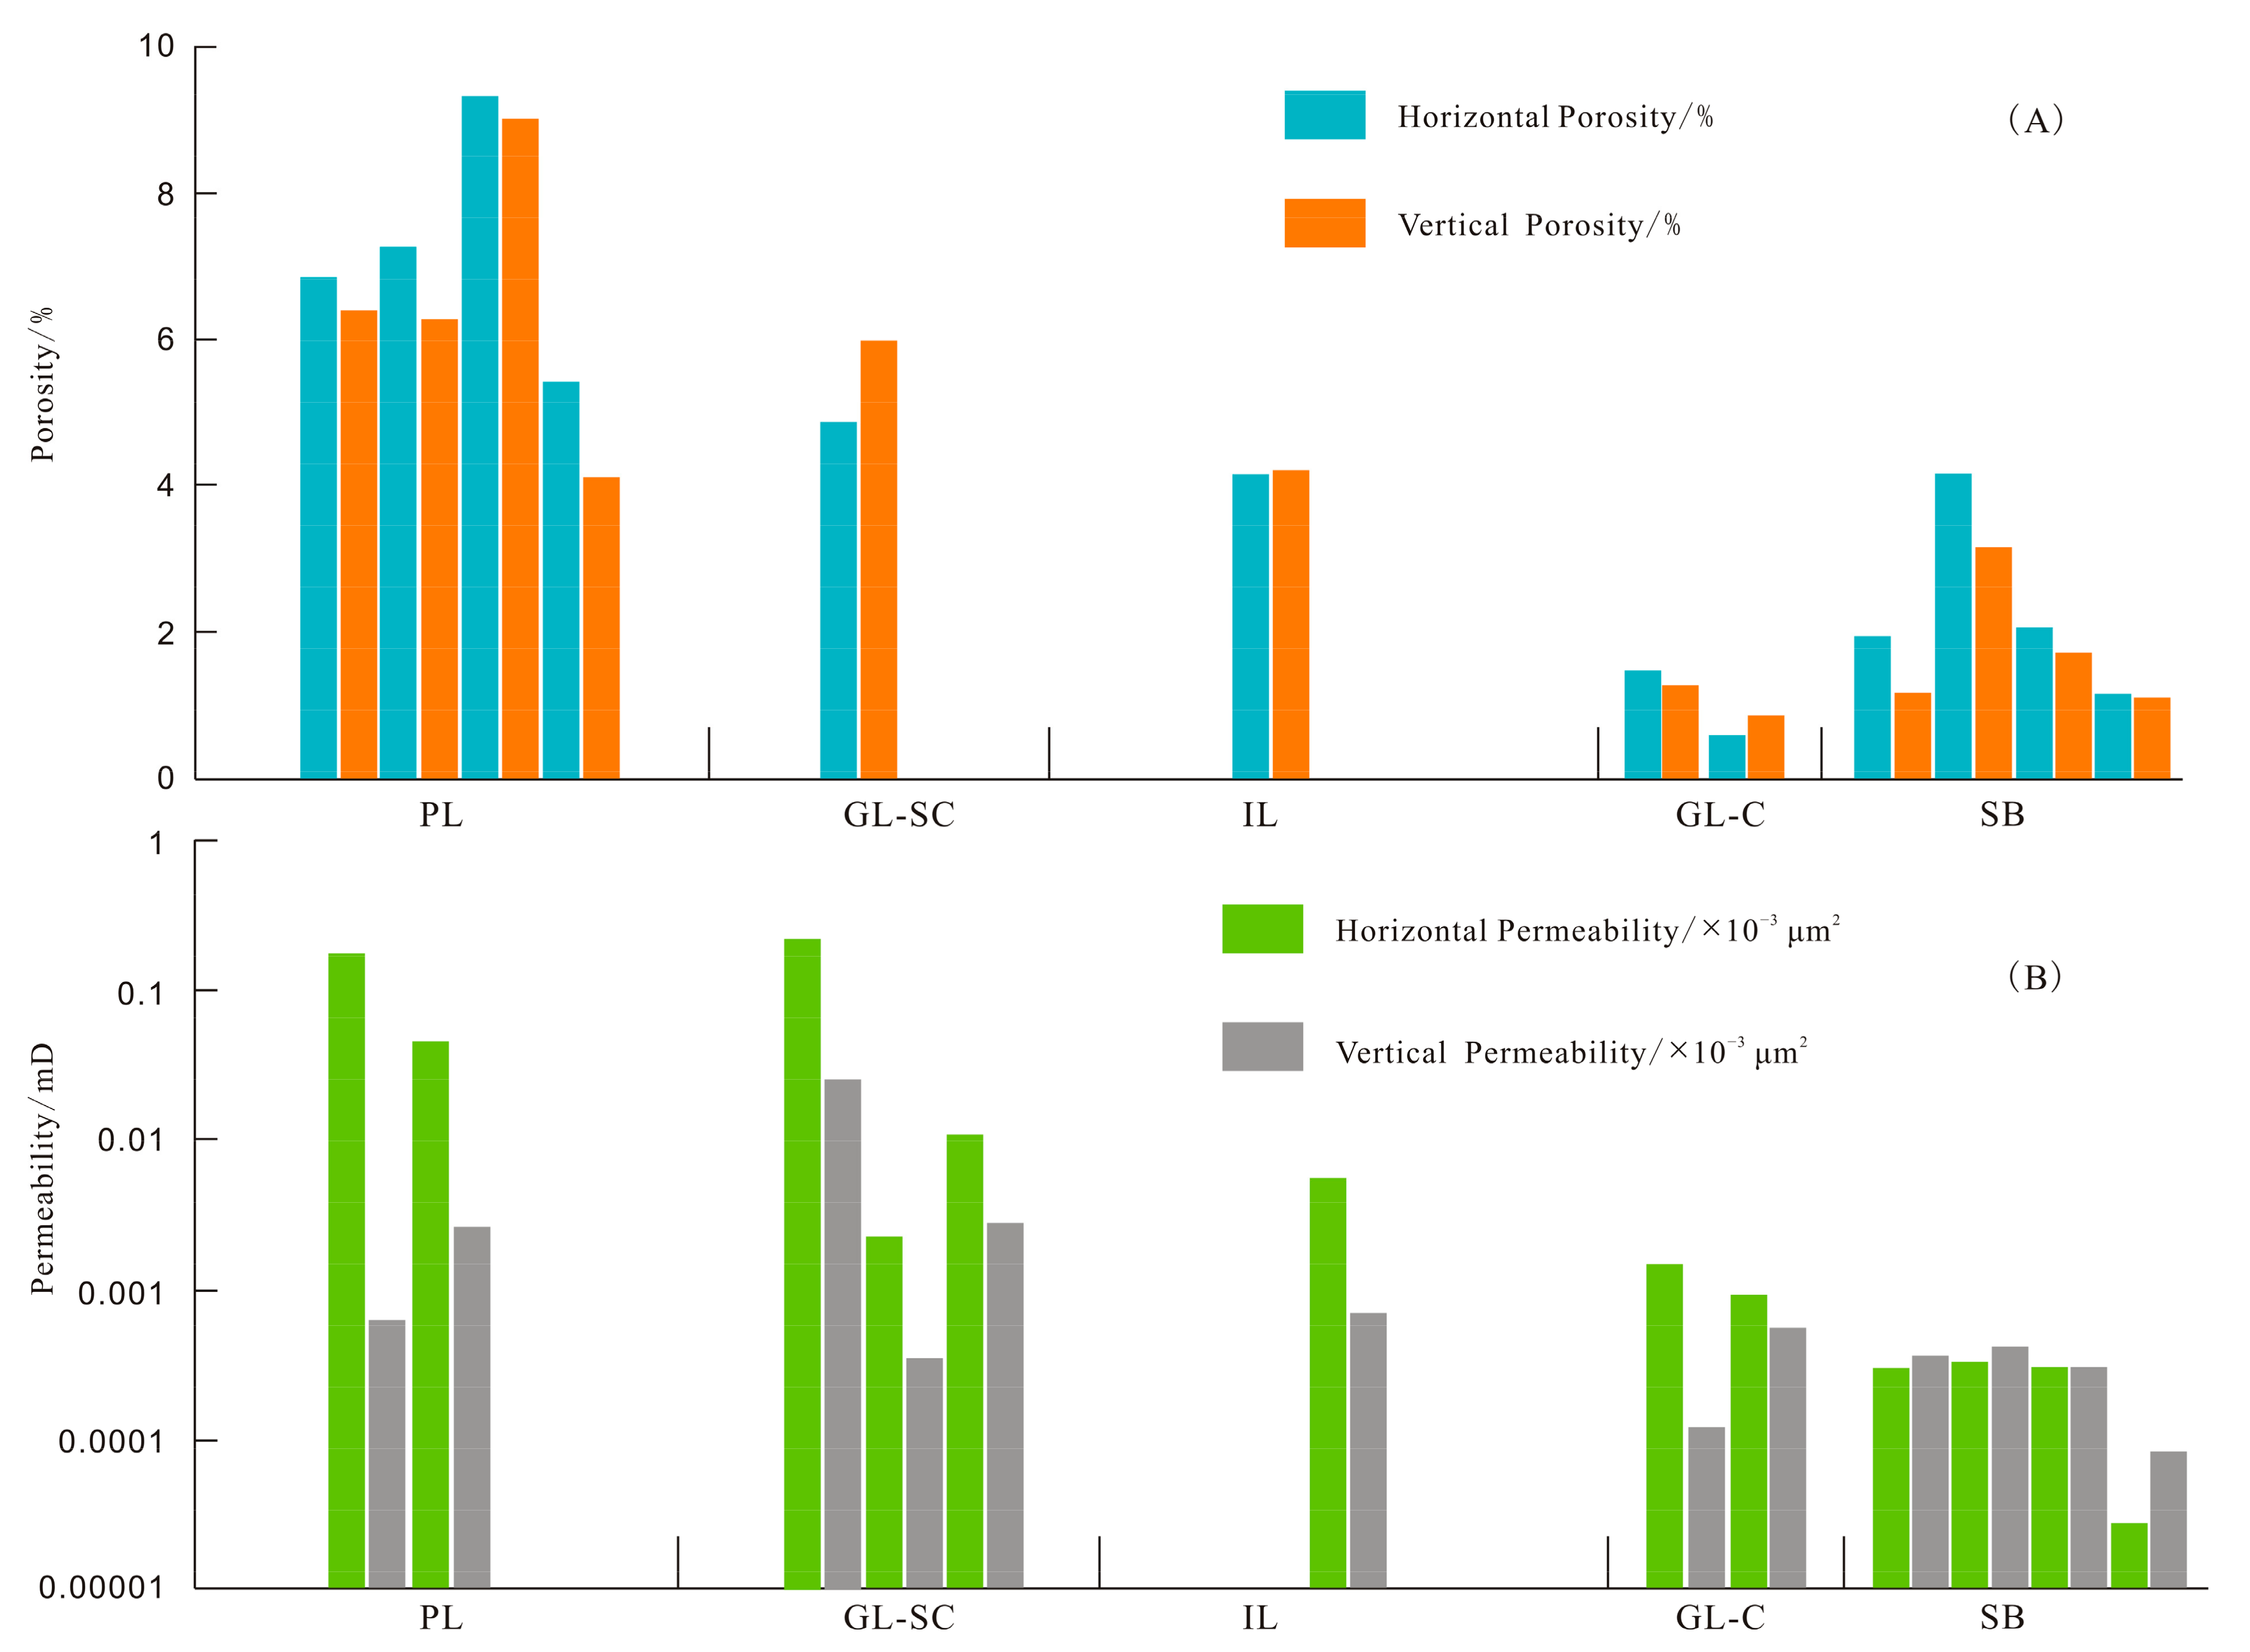
4.6.1. Porosity Distribution

The shale samples analyzed in this study have a horizontal porosity ranging from 0.6% to 9.35%, with an average of 4.11% (Table 2, Figure 14A). Among these samples, the PL and GL-SC have relatively higher porosity compared to the others. The PL has a horizontal porosity ranging from 5.43% to 9.35%, with an average of 7.22%. The porosity value is nearly 2- and 7-fold that of the IL and GL-C, and 3-fold that of the SB. For the GL-SC, the horizontal porosity is 4.90%. The porosity value is nearly 1.2- and 5-fold that of the IL and GL-C, and 2-fold that of the SB.
The shale samples analyzed in this study have a vertical porosity that ranges from 0.88% to 9.04%, with an average of 3.78% (Table 2, Figure 14A). Similarly, shale samples from the PL and the GL-SC have higher porosity compared to the others. In detail, shale samples of the PL have a vertical porosity ranging from 4.13% to 9.04% (average = 6.47%), which is nearly 1.5-, 6-, and 3-fold that of the IL, GL-C, and SB, respectively. The shale sample of the GL-SC has a vertical porosity of 5.98%, which is as much as 1.5-, 6-, and 2.6-fold that of the IL, the GL-C, and SB, respectively.

4.6.2. Permeability

The shale samples analyzed in this study have a horizontal permeability ranging from 0.000028 to 0.22354 × 10⁻³ μm2, with an average of 0.039849 × 10⁻³ μm2 (Table 2, Figure 14B). Among the samples, the PL and GL-SC have the highest horizontal permeability. For example, the shale sample of the PL has a horizontal permeability of 0.184285 × 10⁻³ μm2, which is nearly 32-, 124-, and 589-fold that of the IL, GL-C, and SB, respectively. For IL sample, the horizontal permeability is 0.010954 × 10⁻³ μm2, which is 1.9-, 7.4-, and 35-fold that of the IL, GL-C, and SB, respectively.
Shale samples analyzed in this study have a vertical permeability ranging from 0.000083 to 0.025925 × 10⁻³ μm2, with an average of 0.002930 × 10⁻³ μm2 (Table 2, Figure 14B). Among the samples, the PL and GL-SC have the highest vertical permeability. For example, the vertical permeability of the PL is 0.000655 × 10⁻³ μm2, which reaches 0.9-, 5.3-, and 1.8-fold that of the IL, GL-C, and SB, respectively. For the IL, the vertical permeability is 0.002876 × 10⁻³ μm2, which is 4-, 23.2-, and 7.9-fold that of the IL, GL-C, and SB, respectively.

5. Discussion

5.1. Climatic Condition and Paleoredox Condition

The climatic condition was fluctuating from the Late Ordovician to Early Silurian. During the GL-C formation period (graptolite zone WF1-3), the CIA value ranges from 74.72 to 67.54 with a mean value of 71.07, manifesting fairly warm and humid weather. Then, the weather became cooling and arid and reached its peak during the SB formation period (graptolite zone WF4) with a CIA value of only 45.51 (Figure 9). Further upwards, the climate returned to be warm and humid during the PL and GL-SC formation period (graptolite zone LM1-3) with CIA value ranging from 67.09 to 75.08, then becoming fairly cooling and arid progressively during the IL formation period (graptolite zone LM4-9). In terms of the climatic conditions of the Wufeng–Longmaxi shale formation period in the southern Sichuan Basin, Rong, Mou, and He conducted systematic studies, and the results were consistent with this conclusion [60,64,65,66,67].
The paleoredox condition was fluctuating from the Late Ordovician to Early Silurian as well (Figure 9). During the GL-C formation period (graptolite zone WF1-3), the average value of U/Th is 1.22, manifesting a temporarily oxic to suboxic water column. During the SB formation period (graptolite zone WF4), the average U/Th value is 0.46, indicating that the water column was dysoxic gradually and reached its peak of oxic. Further upwards, the U/Th value reaches the peak of 4.39 and returns to the average value of 2.40. Correspondingly, the water column became suboxic and anoxic quickly during the PL and GL-SC formation period (graptolite zone LM1-3). The average value of U/Th is 0.63 and the water column became suboxic to oxic upwards during the IL formation period (graptolite zone LM4-9). Regarding the paleoredox condition, systematic studies had been conducted in such areas as Wuxi, Changning, Zhaotong, and Weiyuan, and the results were consistent with this conclusion [68,69,70].

5.2. Genesis of Various Depositional Structures

The formation of depositional structures is closely related to the ancient sedimentary environment, the paleoclimate, and the tectonic activity (O’Brien, 1989, [72]; Yawar and Schieber, 2017, [18]). Generally, the ancient sedimentary environment influences water paleoredox conditions, hydrodynamic conditions, and benthic activities. The weathering and climatic conditions influence water stratification [71], water convection [10], and biological activities of surface water [7]. The tectonic activity has a significant impact on the sedimentation rate [72].
The PL was deposited in a semi-enclosed bay sedimentary environment which was helpful to the deposition of mainly biogenic and biochemical components with a trace of detrital components [73]. During the PL formation period, the global paleoclimate was warm and humid and the sedimentation rate was very lower (Figure 9), resulting in anoxic bottom water condition and products of predominant clay with a trace of silt of biogenic and biochemical origin ([74]). In addition, warm and humid paleoclimate and lower sedimentation rate contributed to the flourishing of diatoms and siliceous sponges in common [57], producing a great amount of claystone rich in OM and biogenic silica [75]. Possible changes in water depth and water properties destroyed the development of the siliceous organism and the carbon equilibrium of the water column, thereby inducing periodical carbonate precipitation and the resulting formation of silty laminae.
The GL-C was commonly formed in a semi-enclosed lagoonal sedimentary environment with a lower sedimentation rate. During the formation period, the paleoclimate was relatively warm and humid and tectonics were inactive [57]. The lagoon commonly had stable stratification, lower sedimentation rate, and a dysaerobic paleoredox condition, and the sediment was dominated by clay, resulting in abundant clayey laminae and limited silty laminae [71]. In addition, seasonal fluctuations of sediment supply produced NGB-C and IGB-C. During the relatively humid seasons, increased water influx brought massive sediment supply, nutrients, and relatively coarser grains, forming sediments of higher TOC content and water column of abundant aquatic organisms. During the relatively arid seasons, waning water influx resulted in limited discharge and relatively finer grains, forming sediments with lower TOC content and a water column of poor aquatic organisms. Alternations of humid and arid seasons caused periodic fluctuations of TOC content and grain size, forming beds NGB-C and/or IGB-C.
The GL-SC and IL predominantly occurred in neritic shelf sedimentary environments with increased sediment supply induced by intensified tectonics. In addition, the global paleoclimate became relatively cool and arid and the paleoredox conditions became suboxic to oxic (Figure 9). Increased sedimentation rate contributed to the formation of silt-sized sediment discharge dominated by feldspar, quartz, calcite, and clay minerals, resulting in increased silty laminae and silty laminasets. Suboxic to oxic paleoredox condition was favorable to the colonization of benthic organisms and the decomposition of organic matter, leading to the reduction of TOC content of the shale together with the dilution of increased sedimentation rate. In addition, water pollution resulting from increased sedimentation rate caused mass death of the diatoms and siliceous sponges, forming clayey laminae with lowered content of OM and biogenic silica [76]. For this shale type, claystone was formed under waning high-discharge episodes characterized by relatively lower sedimentation rate and quiescent water, whereas siltstone was mostly formed under increasing high-discharge episodes characterized by relatively higher sedimentation rate and turbulent water. The alternation of sedimentation rates produced the various couplets of clayey and silty laminae forming NGB-SC, IGB-SC, silty laminasets, and clayey laminasets. During the period of graptolite zone LM2-9 of the Wufeng–Longmaxi shale, the clayey laminae reduced and the silty laminae increased because of the gradually increasing sedimentation rate (Figure 9), thus forming GL-SC and IL in turn. In the GL-SC and IL, abrupt bottom surfaces of silty laminae commonly manifest strong scouring of bottom flow, the occurrence of beds NGB-SC and IGB-SC commonly manifest gradational change of flow intensity and the frequency alternations of clayey laminae and silty laminae manifest fluctuations of sedimentation rates and high energy.
The SB was deposited in a neritic shelf sedimentary environment. During the formation period, the global paleoclimate became cool and the water depth became shallower. The cooled water column intensified the vertical circulation of the water body (Figure 9, Table A2), producing oxic bottom water and directly leading to the extinction of masses of organisms [10,77]. As every coin has two sides, the oxic bottom water was beneficial to the bloom of the Hirnantia–Dalmanitina community [57,78], resulting in plentiful dispersed bioclasts in this shale. The bloom of the Hirnantia–Dalmanitina community and the shallow water produced silty sediments dominated by quartz, calcite, dolomite, clay minerals. Under bottom flow and bioturbation of burrowing organisms, primary sedimentary structures were destroyed to form structureless mud. Under long-term compaction and cementation, the structureless mud formed the SB.

5.3. Influence of Depositional Structures on Porosity and Permeability

In the Wufeng–Longmaxi shale, interlayering styles of clayey and silty laminae differ among various depositional structures, resulting in different porosity and permeability.

5.3.1. Porosity

In the Wufeng–Longmaxi shale, clayey laminae are rich in OM, total quartz, and fossil fragments, which are beneficial to the formation of porosity. As mentioned earlier, a large amount of organic pores occur in OM. The pores communicate with each other to form effective pore networks in a three-dimensional space [79,80]. Porosity is correlated positively with the TOC content in shale [81]. In the Wufeng–Longmaxi shale, the total quartz is rich in siliceous radiolarian skeletons and siliceous sponge bone needles, indicating a biologic origin [82]. The total quartz has a strong anti-compaction ability to reduce porosity loss during burial diagenesis. In addition, the fossil fragments, such as radiolaria and siliceous sponges, have vast quantities of small pores and cavities [82,83], yielding large quantities of pores subsequent to compaction [25]. In contrast, silty laminae are poor in OM, total quartz, and fossil fragments, resulting in relatively lower porosity of shale. The various interlayering of clayey laminae and silty laminae is apparently conducive to the heterogeneity of mineral components and porosity of shale, having a huge impact on shale gas migration vertically.
In the Wufeng–Longmaxi shale, the PL and GL-SC have a relatively higher proportion of clayey laminae rich in OM and a lower proportion of silty laminae. As mentioned earlier, their organic pore porosity reaches over 50% of the total porosity (Figure 13). The higher proportion of clayey laminae is beneficial to the increase in porosity. In comparison, the IL, GL-C, and SB have a relatively lower proportion of clayey laminae rich in OM, resulting in relatively lower porosity.
For most samples, the ratios of the horizontal to vertical porosity range from 1.04 to 1.68 (Table 2, Figure 14A) and are slightly larger than 1. Among the various shale types, the average ratios for the PL and IL are 1.11 and 1.18, respectively, whereas those for the IL, the GL-C, and SB are 0.99, 1.05–1.68, and 1.16. We argue that the reason for the relatively high horizontal porosity with respect to the vertical porosity is, possibly, that the test of porosity, using the helium porosimeter to represent the effective porosity, is seriously influenced by pore connectivity. As shown by Dong [26], the microfracture abundance is controlled by the biogenic silicon content. The higher the biogenic silicon content, the higher the microfracture abundance. Under the effect of ground stress, microfractures preferentially appear along the lamination interfaces. For this reason, the abundance of microfracture parallel to bedding is remarkably higher than those tilting with bedding, which results in the enhancement of extensive horizontal connectivity.

5.3.2. Permeability

In the Wufeng–Longmaxi shale, clayey laminae have relatively higher permeability than silty laminae. This results from the higher abundance of organic pore networks, fractures, and microfractures of clayey laminae. As mentioned earlier, clayey laminae are rich in organic pores whereas silty laminae are rich in inorganic pores. In overmature shale, organic pores commonly connect with each other to form effective networks in a three-dimensional space and effectively increase permeability. In contrast, inorganic pores commonly occur as isolated structures and prohibit the migration of shale gas. In addition, clayey laminae have abundant bedding parallel fractures and microfractures relative to silty laminae. The bedding parallel fractures and microfractures generally intersect with each other horizontally to significantly improve horizontal permeability, forming effective migration pathways for shale gas horizontally.
In the Wufeng–Longmaxi shale, the ratio of horizontal permeability to vertical permeability of the PL and GL-SC is extremely large, whereas the ratios of the GL-C and SB are relatively small (Table 2, Figure 14B). For these samples, the ratios of the PL and GL-SC are 281.35 and 8.62, respectively, whereas those of the IL and GL-C are only 8.04 and 1.62, respectively. For the SB, the value is approximately 1. In shale with various depositional structures, the stacking patterns, and continuity of clayey lamina and silty lamina cause differences in the horizontal and vertical permeability. In the Wufeng–Longmaxi shale, the PL and GL-SC have a relatively higher proportion of clayey laminae rich in OM and a minor proportion of silty laminae together with excellent continuity. This results in an increase in the horizontal permeability and a corresponding decrease in vertical permeability. For the horizontal direction, due to relatively uniform mineral compositions, abundant organic pores as well as horizontal fractures and microfractures, the horizontal permeability significantly increases. For the vertical direction, due to the termination of pore networks together with an abrupt change of minerals, the vertical permeability greatly decreases. Sun showed that gas-bearing shale has lower permeability, which favors natural gas preservation [84]. According to Wei and Jin [85,86], high ratios of horizontal to vertical permeability favor the formation of complex fracture networks after hydraulic fracturing in horizontal wells, thus increasing shale gas production. Compared with the PL and GL-SC, the horizontal heterogeneity of minerals of the IL, GL-C, and SB are relatively higher because of poor lamina continuity. Simultaneously, the structures are lacking fractures and microfractures because of the lower content of clayey lamina. The two factors result in limited differences between horizontal and vertical permeability in the structures.

5.4. Influence of Depositional Structures on Target Shale

The focus interval of shale gas exploration and development is called the target shale. The requirements of target shale include high percentages of TOC and total quartz, high porosity and permeability, high organic pore proportion, and high ratio of horizontal permeability to vertical permeability [56].
In the Wufeng–Longmaxi shale, the PL and GL-SC meet the requirements and form the target shales. Firstly, the PL and GL-SC have average TOC contents of 9.77% and 7.74% and average total quartz contents of 69.68% and 51.94%, respectively, which are much higher than those of the non-target shales (Table A1). Guo and Zhang and Jin showed that the average total quartz is 67–90% in the equivalent sequences in the Jiaoshiba shale gas field [29,38,86]. Comparatively, the average total quartz is only 42–53% in the non-target shale and mainly originates from terrestrial products. Yawar showed that algae-origin OM, such as planktonic algae, acritarch, bacteria, and solid bitumen, comprises 70–80% of the macerals in the target shale, whereas non-algae-origin OM, such as graptolites and chitinozoans, comprises 47–76% of the macerals in the non-target shale [18]. Secondly, the PL and GL-SC have several orders of magnitude greater porosity and permeability compared to the non-target shale. In addition, the ratio of horizontal permeability to vertical permeability in the target shale is several orders of magnitude greater compared to the non-target shale. Zhang showed that samples collected from the equivalent stratigraphic unit in the Fuling area in eastern Sichuan have horizontal permeability that is generally higher than 0.01 × 10⁻³ μm2 (average 1.33 × 10⁻³ μm2), which can even reach thousands of vertical permeability (generally below 0.001 × 10⁻³ μm2, with an average of 0.0032 × 10⁻³ μm2 for some samples, [29]). Third, the organic pore porosity comprises 71.6% and 51.8% of the total porosity in the PL and GL-SC, whereas that is less than 50% in the non-target shale.

5.5. Future Research

(1) Classification of shale laminae. Currently, the lamina is subdivided predominantly based on grain size or mineral components of shale. Both classifications have their own advantages. Grain size classification can effectively reflect the hydrodynamic conditions of laminae formation whereas mineral components classification can effectively reflect provenance characteristics. In the future, grain size and mineral components classifications should be integrated to solve problems according to the particularity of the study area.
(2) Assemblage styles of the lamina and their influences on porosity and permeability of shale. Lamina assemblage styles involve factors including inter-layering types of lamina, thickness of single lamina, lamina continuity, lamina inclination, and so on. Subtle changes in their factors will have a great impact on shale reservoir quality. Therefore, it is necessary to carry out systematic numerical simulations to explore the influence of their factors on the porosity and permeability of shale.
(3) Depositional structure types and their genetic mechanism. Shale is widely distributed on earth and depositional structures are of great significance to discussing the formation environment of shale. Therefore, depositional structure types are very important for future research. Based on flume and numerical simulations, the process of erosion, transport, and deposition of fine-grained sediments is reproduced to interpret the formation conditions and environments of various depositional structures.

6. Conclusions

The observations, analyses, and interpretation of the structures and lamination, pore types and pore-size distribution, and physical properties in the Wufeng–Longmaxi shale of the Upper Ordovician–Lower Silurian in the Sichuan Basin can be summarized as follows:
(1) Clayey laminae and silty laminae occur in the Wufeng-Longmaxi shale. Clayey laminae are rich in biogenic silica, clay minerals, and OM while silty laminae consist mainly of carbonate minerals and quartz. Various inter-lamination of clayey laminae and silty laminae form silty and clayey laminasets, four types of beds of NGB-C, IGB-C, NGB-SC, and IGB-SC, and four types of depositional structures of GL-C, SB, PL, GL-SC, and IL. The formation of depositional structures is closely related to the ancient sedimentary environment, the paleoclimate, and the tectonic activity.
(2) Clayey laminae are rich in organic pore networks and have large amounts of bedding parallel fractures and microfractures. Silty laminae are rich in isolated inorganic pores together with minor amounts of bedding non-parallel fractures. Depositional structures have significant impacts on fractures, microfractures, pore types, pore-size distribution, and porosity because of their different proportions of clayey and silty laminae. In the PL and GL-SC, organic pores account for 71.6% and 61.4% of the total porosity, and dense bedding parallel and non-parallel fractures intersect with each other to form effective networks. In the IL, GL-C, and SB, organic pores merely account for 20% to 51.8% of the total, and limited amounts of isolated bedding parallel fractures exist.
(3) Depositional structures have significant impacts on porosity and permeability. The PL and GL-SC have the highest porosity, permeability, and ratios of horizontal to vertical permeability. The high TOC (reaching 9.77%) and siliceous contents (reaching 69.68%), high porosity (reaching 9.35%) and permeability (reaching 0.22354 × 10⁻³ μm2), high ratios of horizontal to vertical permeability (reaching 281.35), together with the high organic pore proportions (reaching 71.6%), help the PL and GL-SC to become the shale gas exploration and development targets.
(4) The following three topics may become the focus of future research. First, lamina types and their classification; second, assemblage styles of the lamina and their influences on porosity and permeability of shale; third, depositional structure types and their genetic mechanism.

Author Contributions

Conceptualization, Z.S.; methodology, Z.S.; software, Z.S.; investigation, H.W.; resources, H.W.; data curation, T.Z.; writing—original draft preparation, Z.S.; writing—review and editing, T.Z.; visualization, S.S.; funding acquisition, H.W. All authors have read and agreed to the published version of the manuscript.

Funding

This research is funded by the National Science Foundation of China (41572079) and the National Science and Technology Major (2017ZX05035-001).

Institutional Review Board Statement

Not applicable.

Informed Consent Statement

Not applicable.

Data Availability Statement

The data relevant to this study can be accessed by contacting the corresponding author.

Conflicts of Interest

The authors declare no conflict of interest.

Appendix A

Table A1. Mineral components and total organic carbon content (%) of shale with various depositional structures from the Wufeng–Longmaxi shale at the Shuanghe outcrop in the Sichuan Basin of southwestern China. The location of the outcrop is shown in Figure 1 and the sample depth is shown in Figure 2 (See annex).
Depositional StructuresSampleQuartz/%Potash Feldspar/%Plagioclase/%Calcite/%Dolomite/%Pyrite/%Clay Minerals/%TOC/%
PL8-7-165.00 1.00 2.80 4.80 8.60 0.00 16.60 10.00
PL8-8-170.90 1.30 2.50 2.40 6.90 0.00 16.00 9.10
PL8-8-259.00 0.00 4.00 2.60 8.70 2.50 21.70 10.00
PL8-9-171.20 0.00 2.80 1.70 8.10 0.00 16.20 12.00
PL8-10-173.40 0.00 1.90 1.60 6.30 1.70 15.10 11.00
PL8-10-268.10 0.00 2.50 2.40 8.20 1.50 17.30 9.60
PL8-11-173.80 0.00 2.30 1.30 6.10 3.20 14.00 10.00
PL8-12-170.80 0.00 2.50 1.90 6.60 1.90 15.00 11.00
PL8-12-271.10 0.00 3.10 1.20 6.70 1.60 16.30 9.10
PL8-13-172.60 2.20 2.00 0.00 5.40 1.70 16.10 9.60
PL8-14-169.60 0.00 1.90 2.40 9.00 3.30 13.80 9.30
PL8-14-265.00 0.00 1.70 3.10 12.60 1.50 15.40 8.70
PL8-31-175.30 0.00 2.00 0.00 5.80 0.00 16.90 7.60
Average69.68 0.35 2.46 1.95 7.62 1.45 16.18 9.77
GL-C4-2-125.00 0.00 0.00 27.00 34.00 2.20 12.00 2.70
GL-C4-2-228.30 0.00 0.00 25.20 33.10 1.90 11.50 2.70
GL-C4-3-130.00 0.00 0.00 25.00 35.00 0.00 10.00 2.50
GL-C4-3-227.00 0.00 2.00 24.00 35.00 2.00 10.00 2.40
GL-C4-4-133.00 0.00 1.40 19.20 34.20 1.20 11.70 2.50
GL-C4-6-137.00 0.70 0.70 20.00 27.00 1.50 12.40 3.30
GL-C4-7-140.00 0.00 0.00 19.70 26.40 1.20 12.70 3.60
GL-C4-8-133.00 0.00 1.40 28.20 16.40 1.00 21.10 4.00
GL-C4-10-142.00 0.00 0.00 24.70 19.40 1.20 12.70 3.70
GL-C4-11-147.00 0.00 0.90 23.10 16.00 0.90 12.10 2.80
GL-C4-12-141.80 0.00 1.00 24.40 19.10 1.20 12.50 3.00
GL-C4-13-142.00 1.00 0.80 22.60 19.90 1.10 11.50 3.40
GL-C4-16-137.40 0.70 0.90 18.60 25.80 2.40 14.20 3.10
GL-C4-18-155.90 0.00 1.10 14.00 13.10 1.50 14.40 4.10
GL-C4-19-140.70 1.10 1.30 22.70 16.00 2.20 16.00 3.20
GL-C4-19-251.00 0.00 1.00 22.10 9.50 1.60 14.30 4.60
GL-C4-20-158.00 0.00 0.00 19.00 8.50 0.90 12.50 2.60
GL-C4-21-151.00 0.00 0.90 21.90 10.70 0.00 14.50 3.50
GL-C4-22-147.00 0.00 1.40 22.00 17.90 0.00 11.70 3.00
GL-C4-24-150.00 1.20 0.80 19.10 14.50 1.80 12.00 3.10
GL-C4-25-155.30 0.00 0.00 16.70 14.80 0.00 13.20 3.20
GL-C4-27-158.00 0.00 1.10 17.80 9.20 1.50 11.70 3.10
GL-C4-27-257.10 0.00 1.00 18.70 10.50 1.40 11.30 3.90
GL-C4-28-154.00 0.00 0.90 15.60 11.70 1.70 14.90 3.90
GL-C4-31-158.00 0.00 1.60 11.60 9.50 1.00 16.50 4.40
GL-C4-32-171.00 0.00 1.20 6.30 7.20 0.00 15.00 4.20
GL-C4-36-165.30 0.00 1.70 8.00 10.60 0.00 14.40 4.30
GL-C4-36-260.00 0.00 1.10 16.10 9.20 1.90 12.40 3.70
GL-C4-40-133.50 1.30 2.60 21.00 17.00 0.80 23.10 3.90
GL-C5-5-152.80 0.00 0.90 22.40 9.00 2.10 12.80 4.10
GL-C5-5-248.00 0.00 1.30 25.80 10.60 0.00 13.70 3.90
GL-C5-6-147.30 0.00 1.20 25.00 10.40 0.00 17.20 4.70
GL-C5-8-150.00 0.00 1.10 25.70 9.80 0.00 12.90 1.70
GL-C5-12-144.00 0.00 1.20 31.10 9.60 0.00 13.60 5.00
GL-C5-19-141.00 0.80 0.80 31.10 13.20 1.30 12.40 4.00
GL-C5-20-142.00 0.00 0.90 30.00 10.70 1.60 14.30 4.00
GL-C5-21-136.10 0.00 0.80 33.40 13.10 1.90 14.70 4.30
GL-C5-22-143.00 0.00 0.90 32.50 9.40 2.00 12.20 5.20
GL-C5-22-240.60 0.00 0.90 35.30 9.30 2.50 11.40 4.70
GL-C5-23-133.70 0.00 3.00 32.00 12.20 5.60 12.80 4.40
GL-C5-24-136.10 0.00 0.90 34.20 13.70 2.20 12.90 4.40
GL-C5-24-238.50 0.00 0.90 31.00 12.60 3.40 12.80 3.90
GL-C5-25-132.40 0.70 1.00 32.30 16.60 2.40 14.60 4.00
GL-C5-26-140.00 0.00 1.10 32.40 12.60 1.30 13.40 4.50
GL-C5-26-239.00 0.70 0.90 32.70 12.10 1.60 11.80 4.10
GL-C5-27-140.50 1.40 1.00 31.00 11.90 1.90 11.60 4.10
GL-C5-28-135.90 0.60 1.10 38.00 10.40 1.60 12.40 3.40
GL-C5-29-137.40 0.00 1.00 36.10 12.10 1.70 11.70 4.10
GL-C5-29-232.00 0.70 1.00 37.00 14.00 2.60 12.10 5.50
GL-C5-30-138.10 0.00 1.10 35.00 13.10 2.00 11.40 6.60
GL-C5-30-226.50 0.00 2.40 33.00 20.60 2.10 14.90 6.20
GL-C5-31-127.80 0.00 0.90 23.00 18.30 18.30 12.30 7.50
GL-C5-35-134.70 1.00 4.20 21.90 17.60 3.20 17.40 7.30
GL-C5-35-232.10 0.00 4.80 20.00 12.20 4.50 26.40 7.80
GL-C5-35-331.30 0.70 4.40 18.70 11.20 2.20 31.50 7.90
GL-C5-35-436.10 1.10 5.20 20.90 10.00 2.30 25.10 7.70
GL-C6-2-136.40 0.00 5.40 18.30 14.70 2.60 22.60 7.50
GL-C6-3-138.00 0.00 5.70 17.00 10.70 5.30 22.70 6.80
GL-C6-4-135.10 1.30 6.50 19.40 13.60 3.30 20.80 8.30
GL-C6-5-137.00 1.30 6.50 18.50 11.20 3.70 20.90 7.80
GL-C6-5-236.40 1.10 6.50 21.10 13.00 3.80 18.10 8.00
GL-C6-7-134.30 1.70 6.20 20.80 14.70 4.00 18.30 7.20
GL-C6-7-234.80 2.70 6.20 21.60 13.20 4.10 17.40 6.40
GL-C6-12-132.70 1.20 7.00 23.70 14.00 4.20 16.60 6.60
GL-C6-16-129.00 1.40 6.80 27.20 15.10 4.20 17.20 6.40
Average41.23 0.38 1.98 24.05 15.20 2.15 14.88 4.59
GL-SC8-6-139.70 1.00 3.20 10.00 13.40 1.70 31.00 10.00
GL-SC8-6-250.10 1.30 3.00 8.10 16.70 2.40 19.20 10.00
GL-SC9-1-159.00 0.00 2.50 12.70 7.60 1.20 16.40 7.60
GL-SC9-15-158.00 0.00 1.80 12.80 9.60 2.10 15.00 5.00
GL-SC9-18-152.90 0.00 2.20 15.60 13.00 1.90 14.40 6.10
Average51.94 0.46 2.54 11.84 12.06 1.86 19.20 7.74
IL9-1-141.60 1.00 3.10 19.30 17.20 2.50 15.30 5.60
IL9-2-149.00 1.30 3.00 21.10 9.70 1.10 14.80 6.20
IL9-3-148.90 0.80 2.20 22.00 11.40 1.10 13.60 6.40
IL9-5-150.90 0.90 1.80 18.00 12.90 1.80 12.70 4.30
IL9-16-246.70 1.10 1.40 19.70 16.20 1.70 13.20 3.90
IL9-19-232.40 0.00 2.80 28.50 20.40 2.30 13.60 4.20
IL10-7-140.70 0.90 3.00 21.90 16.90 2.40 13.60 5.00
IL10-11-142.00 0.00 2.10 23.50 15.10 3.20 14.10 4.50
IL10-14-140.80 1.50 3.30 19.30 20.00 2.10 13.00 4.30
Average43.67 0.83 2.52 21.48 15.53 2.02 13.77 4.93
SM5-31-132.80 0.00 1.00 24.90 20.30 10.10 10.90 5.60
SM5-32-133.40 0.00 2.90 27.70 17.70 6.20 12.10 7.00
SM5-32-225.90 0.00 1.40 29.50 26.80 5.10 10.90 6.60
SM5-32-316.00 0.00 2.20 31.30 36.90 3.20 10.70 6.30
SM5-33-229.80 0.00 2.30 32.50 21.00 4.00 10.40 7.30
SM5-33-320.40 0.00 3.00 31.10 30.60 5.10 9.80 6.00
SM5-33-414.50 0.00 2.60 32.90 38.00 4.00 7.30 7.00
SM5-34-114.30 0.00 2.80 42.10 30.40 2.90 7.50 7.60
SM5-34-320.30 0.00 2.20 34.10 32.80 2.10 8.50 7.10
SM5-34-425.90 0.00 2.80 31.60 27.40 2.30 10.00 7.50
SM6-19-122.80 0.80 4.00 33.00 16.30 1.90 20.50 6.00
SM6-19-223.10 1.00 5.10 34.70 16.00 2.90 17.20 5.90
SM6-22-122.70 0.80 5.00 31.60 15.20 2.20 21.80 5.90
SM7-1-123.60 1.20 4.10 33.50 14.90 3.30 19.40 4.90
SM7-1-221.80 0.70 4.80 32.00 17.30 6.40 17.00 4.00
SM7-4-124.70 0.60 3.30 32.00 18.40 4.70 15.60 2.40
SM7-4-224.60 0.90 7.00 26.90 17.80 5.30 16.50 2.00
SM8-4-136.00 0.00 1.80 29.30 18.30 2.10 12.50 11.00
Average35.12 0.55 3.05 26.23 16.28 3.25 15.38 5.99
Table A2. CIA, U/Th, Ni/Co, and V/Cr values of samples from the Wufeng–Longmaxi shale in the Sichuan Basin of southwestern China. Abbreviations are shown in Table 1 (See annex).
Depositional StructuresSectionStageFormationGraptolite ZoneSample NumberDepth/mCIAU/ThNi/CoV/Cr
ILYS 103AeronianLongmaxiLM6-9YS103-0011026.19 64.53 0.279 2.750 1.451
ILYS 103AeronianLongmaxiLM6-9YS103-0021031.30 62.03 0.288 3.292 1.337
ILYS 103AeronianLongmaxiLM6-9YS103-0031033.76 62.78 0.281 3.326 1.343
ILYS 103AeronianLongmaxiLM6-9YS103-0041036.24 63.91 0.278 3.627 1.538
ILYS 103AeronianLongmaxiLM6-9YS103-0051038.12 63.27 0.271 3.661 1.500
ILYS 103AeronianLongmaxiLM6-9YS103-0061040.68 65.97 0.352 3.563 1.482
ILYS 103AeronianLongmaxiLM6-9YS103-0071043.17 68.48 0.357 3.713 1.575
ILYS 103AeronianLongmaxiLM6-9YS103-0081045.80 69.61 0.378 3.540 1.655
ILYS 103RhuddanianLongmaxiLM5YS103-0091051.62 70.80 0.695 4.671 1.710
ILYS 103RhuddanianLongmaxiLM5YS103-0101054.80 69.27 0.663 4.913 2.329
ILYS 103RhuddanianLongmaxiLM5YS103-0111058.62 70.07 0.571 5.288 2.193
ILYS 103RhuddanianLongmaxiLM5YS103-0121060.82 69.29 0.672 5.600 1.356
ILYS 103RhuddanianLongmaxiLM5YS103-0131061.95 68.62 0.741 4.242 2.104
ILYS 103RhuddanianLongmaxiLM5YS103-0141063.16 68.31 0.635 4.207 2.062
ILYS 103RhuddanianLongmaxiLM4YS103-0151065.49 67.98 0.929 5.231 2.445
ILYS 103RhuddanianLongmaxiLM4YS103-0161067.14 69.22 0.882 6.103 2.496
ILYS 103RhuddanianLongmaxiLM4YS103-0171067.66 69.79 0.750 6.147 2.898
ILYS 103RhuddanianLongmaxiLM4YS103-0181071.20 68.54 1.008 5.647 3.306
ILYS 103RhuddanianLongmaxiLM4YS103-0191072.30 68.67 0.847 5.912 3.669
ILYS 103RhuddanianLongmaxiLM4YS103-0201073.34 67.84 1.136 6.687 3.292
ILYS 103RhuddanianLongmaxiLM4YS103-0211074.33 68.21 0.947 5.854 2.645
ILYS 103RhuddanianLongmaxiLM4YS103-0221074.86 67.96 1.000 6.307 3.078
GL-SCYS 103RhuddanianLongmaxiLM2-3CN001-011076.28 67.09 0.597 8.838 3.590
GL-SCYS 103RhuddanianLongmaxiLM2-3CN001-021077.19 70.54 1.234 8.643 3.161
GL-SCYS 103RhuddanianLongmaxiLM2-3CN001-031078.17 69.65 0.977 7.769 3.007
GL-SCYS 103RhuddanianLongmaxiLM2-3CN001-041079.44 70.54 1.216 9.102 4.519
GL-SCYS 103RhuddanianLongmaxiLM2-3CN001-051080.42 69.21 1.737 10.896 4.752
GL-SCYS 103RhuddanianLongmaxiLM2-3CN001-061081.17 69.48 2.175 12.187 5.558
PLShuangheHirnatianLongmaxiLM1CN001-075.121 70.23 1.497 11.360 6.362
PLShuangheHirnatianLongmaxiLM1CN001-085.47669.46 1.820 12.370 5.966
PLShuangheHirnatianLongmaxiLM1CN001-096.48670.19 2.085 13.624 6.289
PLShuangheHirnatianLongmaxiLM1CN001-106.516 70.65 3.042 13.789 8.413
PLShuangheHirnatianLongmaxiLM1CN001-116.58673.77 3.005 18.449 9.373
PLShuangheHirnatianLongmaxiLM1CN001-126.83175.05 4.386 18.150 2.486
PLShuangheHirnatianLongmaxiLM1CN001-136.94675.08 0.991 5.915 21.105
SBShuangheHirnatianWufengWF4CN001-147.10645.51 0.458 8.928 8.082
GL-CShuangheKatianWufengWF2-3CN001-157.35667.54 1.760 49.700 3.450
GL-CShuangheKatianWufengWF2-3CN001-168.96169.88 1.890 23.060 4.970
GL-CShuangheKatianWufengWF2-3CN001-1711.37172.14 0.850 13.140 1.520
GL-CShuangheKatianWufengWF2-3CN001-1812.20574.72 0.360 48.900 1.810

References

  1. Chalmers, G.R.; Bustin, R.M.; Power, I.M. Characterization of gas shale pore systems by porosimetry, pycnometry, surface area, and field emission scanning electron microscopy/transmission electron microscopy image analyses: Examples from the Barnett, Woodford, Haynesville, Woodford, Haynesville, Marcellus, and Doig units. AAPG Bull. 2021, 96, 1099–1119. [Google Scholar]
  2. Mastalerz, M.; Schimmelmann, A.; Drobniak, A.; Chen, Y. Porosity of Devonian and Mississippian New Albany Shale across a maturation gradient: Insights from organic petrology, gas adsorption, and mercury intrusion. AAPG Bull. 2013, 97, 1621–1643. [Google Scholar] [CrossRef]
  3. Campbell, V.C. Lamina, laminaset, bed and bedset. Sedimentofogy 1967, 8, 7–26. [Google Scholar] [CrossRef]
  4. Lazar, O.R.; Bohacs, K.M.; Macquaker, J.H.S.; Schieber, J.; Demko, T.M. Capturing Key Attributes of Fine-Grained Sedimentary Rocks in Outcrops, Cores, and Thin Sections: Nomenclature and Description Guidelines. J. Sediment. Res. 2015, 85, 230–246. [Google Scholar] [CrossRef] [Green Version]
  5. Anderson, R.Y.; Dean, W.E. Lacustrine varve formation through time. Palaeogeogr. Palaeoclimatol. Palaeoecol. 1988, 62, 215–235. [Google Scholar] [CrossRef]
  6. Reineck, H.E.; Singh, I.B. Genesis of laminated sand and graded rhythmites in storm-sand layers of shelf mud. Sedimentology 2006, 18, 123–128. [Google Scholar] [CrossRef]
  7. Macquaker, J.H.S.; Bentley, S.J.; Bohacs, K.M. Wave-enhanced sediment-gravity fl ows and mud dispersal across continental shelves: Reappraising sediment transport processes operating in ancient mudstone successions. Geology 2010, 38, 947–950. [Google Scholar] [CrossRef]
  8. Stow, D.A.V. Sedimentary Rocks in the Field—A Colour Guide; CSIRO Publishing: Clayton, Australia, 2010; p. 320. [Google Scholar]
  9. Schieber, J. Reverse engineering mother nature—Shale sedimentology from an experimental perspective. Sediment. Geol. 2011, 238, 1–22. [Google Scholar] [CrossRef]
  10. Melchin, M.J.; Mitchell, C.E.; Holmden, C.; Storch, P. Environmental changes in the Late Ordovician-Early Silurian; review and new insights from black shales and nitrogen isotopes. Geol. Soc. Am. Bull. 2013, 125, 1635–1670. [Google Scholar] [CrossRef]
  11. Bohacs, K.M.; Lazar, O.R.; Demko, T.M. Parasequence types in shelfal mudstone strata; quantitative observations of lithofacies and stacking patterns, and conceptual link to modern depositional regimes. Geology 2014, 42, 131–134. [Google Scholar] [CrossRef]
  12. Stow, D.A.V.; Huc, A.Y.; Bertrand, P. Depositional processes of black shales in deep water. Mar. Petrol. Geol. 2001, 18, 491–498. [Google Scholar] [CrossRef]
  13. Schieber, J. Mud re-distribution in epicontinental basins—Exploring likely processes. Mar. Petrol. Geol. 2016, 71, 119–133. [Google Scholar] [CrossRef] [Green Version]
  14. Lei, Y.; Luo, X.; Wang, X.; Zhang, L.; Jiang, C.; Yang, W.; Yu, Y.; Cheng, M.; Zhang, L. Characteristics of silty laminae in Zhangjiatan Shale of southeastern Ordos Basin, China: Implications for shale gas formation. AAPG Bull. 2015, 99, 661–687. [Google Scholar] [CrossRef]
  15. Blatt, H.; Tracy, R.J.; Owens, B.E. Petrology: Igneous, Sedimentary, and Metamorphic, 3rd ed.; Freeman & Company: New York, NY, USA, 2006; p. 231. [Google Scholar]
  16. Shi, Z.; Qiu, Z.; Dong, D.; Lu, B.; Liang, P.; Zhang, M. Lamina characteristics of gas-bearing shale fine-grained sediment of the Silurian Longmaxi Formation of Well Wuxi 2 in Sichuan Basin, SW China. Pet. Explor. Dev. Online 2018, 45, 358–368. [Google Scholar] [CrossRef]
  17. Xi, K.L.; Li, K.; Cao, Y.C.; Lin, M.R.; Niu, X.B.; Zhu, R.K.; Wei, X.Z.; You, Y.; Liang, X.W.; Feng, S.B. Laminae combination and shale oil enrichment patterns of Chang 7 organic-rich shales in the Triassic Yanchang Formation, Ordos Basin, NW China. Petrol. Explor. Dev. 2020, 47, 1–12. [Google Scholar] [CrossRef]
  18. Yawar, Z.; Schieber, J. On the origin of silt laminae in laminated shales. Sediment. Geol. 2017, 360, 22–34. [Google Scholar] [CrossRef]
  19. Shi, Z.; Dong, D.; Wang, H.; Sun, S.; Wu, J. Reservoir characteristics and genetic mechanisms of gas-bearing shales with different laminae and laminae combinations: A case study of Member 1 of the Lower Silurian Longmaxi shale in Sichuan Basin, SW China. Petrol. Explor. Dev. 2020, 47, 888–900. [Google Scholar] [CrossRef]
  20. Schieber, J.S.J.B. Lenticular shale fabrics resulting from intermittent erosion of water-rich muds-interpretion the rock record in the light of recent flume experiments. J. Sediment. Res. 2010, 80, 119–128. [Google Scholar] [CrossRef] [Green Version]
  21. Schieber, J. Distribution and deposition of mudstone facies in the Upper Devonian Sonyea group of New York. J. Sediment. Res. 1999, 69, 909–925. [Google Scholar] [CrossRef]
  22. Wang, H.Z.; Mei, H.M. Paleolimnological information from the oil shale in the Lower part of sha 3 Formation, in Dongying Depression. J. Tongji Univ. 1998, 26, 315–318. [Google Scholar]
  23. Sutton, S.J.; Ethridge, F.G.; Almon, W.R.; Dawson, W.C.; Edwards, K.K. Textural and sequence-stratigraphic controls on sealing capacity of Lower and Upper Cretaceous shales, Denver Basin, Colorado. AAPG Bull. 2004, 88, 1185–1206. [Google Scholar] [CrossRef]
  24. Hammes, U.; Hamlin, H.S.; Ewing, T.E. Geologic analysis of the Upper Jurassic Haynesville shale in east Texas and west Louisiana. AAPG Bull. 2011, 95, 1643–1666. [Google Scholar] [CrossRef]
  25. Slatt, R.M.; O’Brien, N.R. Pore types in the Barnett and Woodford gas shales: Contribution to understanding gas storage and migration pathways in fine-grained rocks. AAPG Bull. 2011, 95, 2017–2030. [Google Scholar] [CrossRef]
  26. Dong, D.; Shi, Z.; Sun, S.; Guo, C.; Zhang, C.; Guo, W.; Guan, Q.; Zhang, M.; Jiang, S.; Zhang, L.; et al. Factors controlling microfractures in black shale: A case study of Ordovician Wufeng Formation–Silurian Longmaxi Formation in Shuanghe Profile, Changning area, Sichuan Basin, SW China. Petrol. Explor. Dev. 2018, 5, 818–829. [Google Scholar] [CrossRef]
  27. Liu, G.; Huang, Z.; Jiang, Z.; Chen, J.; Chen, C.; Gao, X. The characteristic and reservoir significance of lamina in shale from Yanchang Formation of Ordos Basin. Nat. Gas Geosci. 2015, 26, 408–417. [Google Scholar]
  28. Wang, C.; Zhang, B.; Hu, Q.; Shu, Z.; Sun, M.; Bao, H. Laminae characteristics and influence on shale gas reservoir quality of lower Silurian Longmaxi Formation in the Jiaoshiba area of the Sichuan Basin, China. Mar. Petrol. Geol. 2019, 109, 839–851. [Google Scholar] [CrossRef]
  29. Zhang, S.W.; Meng, Z.Y.; Guo, Z.F.; Zhang, M.Y.; Han, C.Y. Characteristics and major controlling factors of shale reservoirs in the Longmaxi Formation, Fuling area, Sichuan Basin. Nat. Gas Ind. 2014, 34, 16–24. [Google Scholar]
  30. Zou, C.; Qun, Z.; Dazhong, D.; Zhi, Y.; Zhen, Q.; Feng, L.; Nan, W.; Yong, H.; Anxiang, D.; Qin, Z. Geological characteristics, main challenges and future prospect of shale gas. Nat. Gas Geosci. 2017, 28, 1781–1796. [Google Scholar] [CrossRef]
  31. Wang, Y.; Li, X.; Chen, B.; Wu, W.; Dong, D.; Zhang, J.; Han, J.; Ma, J.; Dai, B.; Wang, H.; et al. Lower limit of thermal maturity for the carbonization of organic matter in marine shale and its exploration risk. Petrol. Explor. Dev. 2018, 45, 402–411. [Google Scholar] [CrossRef]
  32. Guo, X.S. Rules of two-factor enrichment for marine shale gas in southern China-understanding from the Longmaxi Formation shale gas in Sichuan Basin and its surrounding area. Acta Geol. Sin. 2014, 88, 1209–1218. [Google Scholar]
  33. Liang, C.; Jiang, Z.X.; Yang, Y.T.; Wei, X.J. Characteristics of shale lithofacies and reservoir space of the Wufeng-Longmaxi Formation, Sichuan Basin. Petrol. Explor. Dev. 2012, 39, 691–698. [Google Scholar] [CrossRef]
  34. Tang, X.; Jiang, Z.; Huang, H.; Jiang, S.; Yang, L.; Xiong, F.; Chen, L.; Feng, J. Lithofacies characteristics and its effect on gas storage of the Silurian Longmaxi marine shale in the southeast Sichuan Basin, China. J. Nat. Gas Sci. Eng. 2016, 28, 338–346. [Google Scholar] [CrossRef] [Green Version]
  35. Zhao, J.; Jin, Z.; Hu, Q.; Hu, Z.; Du, W.; Yan, C.; Geng, Y. Mineral types and organic matters of the Ordovician-Silurian Wufeng and Longmaxi Shale in the Sichuan Basin, China: Implications for pore systems, diagenetic pathways, and reservoir quality in fine-grained sedimentary rocks. Mar. Petrol. Geol. 2017, 86, 655–674. [Google Scholar] [CrossRef]
  36. Li, Y.; Schieber, J.; Fan, T.; Wei, X. Pore characterization and shale facies analysis of the Ordovician-Silurian transition of northern Guizhou, South China: The controls of shale facies on pore distribution. Mar. Petrol. Geol. 2018, 39, 697–718. [Google Scholar] [CrossRef]
  37. Zhang, L.; Li, B.; Jiang, S.; Xiao, D.; Lu, S.; Zhang, Y.; Gong, C.; Chen, L. Heterogeneity characterization of the lower Silurian Longmaxi marine shale in the Pengshui area, South China. Int. J. Coal Geol. 2018, 195, 250–266. [Google Scholar] [CrossRef]
  38. Guo, G.L. Key geological issues and main controls on accumulation and enrichment of Chinese shale gas. Petrol. Explor. Dev. 2016, 43, 317–326. [Google Scholar] [CrossRef]
  39. Zhou, S.; Yan, G.; Xue, H.; Guo, W.; Li, X. 2D and 3D nanopore characterization of gas shale in Longmaxi formation based on FIB-SEM. Mar. Petrol. Geol. 2016, 73, 174–180. [Google Scholar] [CrossRef]
  40. Mou, C.L.; Ge, X.Y.; Xu, X.S.; Zhou, K.K.; Liang, W.; Wang, X.P. Lithofacies palaeogeography of the Late Ordovician and its petroleum geological significance in Middle-Upper Yangtze Region. J. Palaeogeogr. 2014, 16, 427–440. [Google Scholar]
  41. Zhai, G. Petroleum Geology of China (Volume 10); Petroleum Industry Press: Beijing, China, 1988. [Google Scholar]
  42. Yong, L.; Allen, P.A.; Densmore, A.L.; Qiang, X. Evolution of the Longmen Shan foreland basin (western Sichuan, China) during the Late Triassic Indosinian Orogeny. Basin Res. 2003, 15, 117–138. [Google Scholar] [CrossRef]
  43. Mou, C.L.; Wang, X.P.; Wang, Q.Y.; Zhou, K.K.; Liang, W.; Ge, X.Y.; Chen, X.W. Relationship between sedimentary facies and shale gas geological conditions of the Lower Silurian Longmaxi Formation in southern Sichuan Basin and its adjacent areas. J. Palaeogeogr. 2016, 18, 457–472. [Google Scholar]
  44. Guo, Y.H.; Li, Z.F.; Li, D.H.; Zhang, T.M.; Wang, Z.C.; Yu, J.F.; Xi, Y.T. Lithofacies palaeogeography of the Early Silurian in Sichuan area. J. Palaeogeogr. 2004, 6, 20–29. [Google Scholar]
  45. Wang, T.; Yang, K.M.; Xiong, L.; Shi, H.L.; Zhang, Q.L.; Wei, L.M.; He, X.L. Shale sequence stratigraphy of Wufeng-Longmaxi Formation in southern Sichuan and their control on reservoirs. Acta Pet. Sin. 2015, 36, 915–925. [Google Scholar]
  46. Hu, Y.H.; Sun, W.D.; Ding, X.; Wang, F.Y.; Ling, M.X.; Liu, J. Volcanic event at the Ordovician-Silurian boundary: The message from K—Bentonite of Yangtze Block. Acta Petrol. Sin. 2009, 25, 3298–3308. [Google Scholar]
  47. Rong, J.Y.; Chen, X. Proposal of a GSSP candidate section in South China for a new Hirnantian boundary stratotype. J. Stratigr. 2000, 24, 176–181. [Google Scholar]
  48. Liu, S.G.; Ma, W.X.; Jansa, L.; Huang, W.M.; Zeng, X.L.; Zhang, C.J. Characteristics of the shale gas reservoir rocks in the Lower Silurian Longmaxi Formation, East Sichuan basin, China. Acta Petrol. Sin. 2011, 27, 2239–2252. [Google Scholar] [CrossRef]
  49. Zhao, S.X.; Yang, Y.M.; Zhang, J.; Wang, L.S.; Wang, X.Z.; Luo, C.; Tian, C. Micro-layers division and fine reservoirs contrast of Lower Silurian Longmaxi Formation shale, Sichuan Basin, SW China. Nat. Gas Geosci. 2016, 27, 470–487. [Google Scholar]
  50. Fan, J.; Melchin, M.J.; Chen, X.; Wang, Y.; Zhang, Y.; Chen, Q.; Chi, Z.; Chen, F. Biostratigraphy and geography of the Ordovician-Silurian Lungmachi black shales in South China. Sci. China Earth Sci. 2011, 54, 1854–1863. [Google Scholar] [CrossRef]
  51. Zou, C.; Dong, D.; Wang, Y.; Li, X.; Huang, J.; Wang, S.; Guan, Q.; Zhang, C.; Wang, H.; Liu, H.; et al. Shale gas in China: Characteristics, challenges and prospects (I). Petrol. Explor. Dev. 2015, 42, 689–701. [Google Scholar] [CrossRef]
  52. Ma, Y.; Cai, X.; Zhao, P. China’s shale gas exploration and development: Understanding and practice. Petrol. Explor. Dev. Online 2018, 45, 589–603. [Google Scholar] [CrossRef]
  53. Ma, X.H.; Xie, J. The progress and prospects of shale gas exploration and exploitation in southern Sichuan Basin, NW China. Petrol. Explor. Dev. 2018, 45, 161–169. [Google Scholar] [CrossRef]
  54. Young, G.M.; Nesbitt, H.W. Paleoclimatology and provenance of the glaciogenic gowganda formation (paleoproterozoic). Geol. Soc. Am. Bull. 1999, 111, 264–274. [Google Scholar] [CrossRef]
  55. Jones, B.; Manning, D.A. Comparison of geochemical indices used for the interpretation of palaeoredox conditions in ancient mudstones. Chem. Geol. 1994, 111, 111–129. [Google Scholar] [CrossRef]
  56. Zou, C.N.; Qiu, Z.; Wei, H.Y.; Dong, D.Z.; Lu, B. Euxinia caused the Late Ordovician extinction: Evidence from pyrite morphology and pyritic sulfur isotopic composition in the Yangtze area, South China. Palaeogeogr. Palaeoclimatol. Palaeoecol. 2018, 511, 1–11. [Google Scholar] [CrossRef]
  57. Rong, J.Y.; Chen, X.; Wang, Y. Northward expansion of Central Guizhou Oldland through the Ordovician and Silurian transition. evidence and implications. Sci. China Earth Sci. 2011, 10, 1407–1415. [Google Scholar]
  58. Chen, X.; Fan, J.; Wang, W.; Wang, H.; Nie, H.; Shi, X.; Wen, Z.; Chen, D.; Li, W. Stage-progressive distribution pattern of the Lungmachi black graptolitic shales from Guizhou to Chongqing, Central China. Acta Geol. Sin.-Engl. 2017, 60, 1133–1146. [Google Scholar] [CrossRef]
  59. Lash, G.G.; Engelder, T. An analysis of horizontal microcraking during catagenesis: Example from the Catskill delta complex. AAPG Bull. 2005, 89, 1433–1449. [Google Scholar] [CrossRef]
  60. Loucks, R.G.; Ruppel, S.C. Mississippian Barnett Shale: Lithofacies and depositional setting of a deep-water shale-gas succession in the Fort Worth Basin, Texas. AAPG Bull. 2007, 91, 579–601. [Google Scholar] [CrossRef] [Green Version]
  61. Curtis, M.E.; Cardott, B.J.; Sondergeld, C.H.; Rai, C.S. Microstructural investigation of gas shales in two and three dimensions using nanometer-scale resolution imaging. AAPG Bull. 2012, 96, 665–677. [Google Scholar] [CrossRef]
  62. Yang, R.; Jia, A.; He, S.; Hu, Q.; Sun, M.; Dong, T.; Hou, Y.; Zhou, S. Experimental investigation of water vapor adsorption isotherm on gas-producing Longmaxi shale: Mathematical modeling and implication for water distribution in shale reservoirs. Chem. Eng. J. 2021, 406, 125982. [Google Scholar] [CrossRef]
  63. Chen, F.W.; Lu, S.F.; Ding, X. Pore types and quantitative evaluation of pore volumes in the Longmaxi Formation shale of Southeast Chongqing, China. Acta Geol. Sin.-Engl. 2018, 92, 342–353. [Google Scholar] [CrossRef]
  64. Nelson, P.H. Pore-throat size in sandstones, tight sandstones, and shales. AAPG Bull. 2009, 95, 329–340. [Google Scholar] [CrossRef]
  65. Loucks, R.G.; Reed, R.M.; Ruppel, S.C.; Hammes, U. Spectrum of pore types and networks in mudrocks and a descriptive classification for matrix-related mudrock pores. AAPG Bull. 2012, 96, 1071–1098. [Google Scholar] [CrossRef] [Green Version]
  66. Curtis, M.E.; Ambrose, R.J.; Sondergeld, C. Structural characterization of gas shale on the micro- and Nano-scales. In Proceedings of the Canadian Unconventional Resources and International Petroleum Conference, Calgary, AB, Canada, 19 October 2010; Society of Petroleum Engineers: Calgary, AB, Canada, 2010. [Google Scholar]
  67. Katz, B.J.; Arango, I. Organic porosity: A geochemist’s view of the current state of understanding. Org. Geochem. 2018, 123, 1–16. [Google Scholar] [CrossRef]
  68. Rong, J.Y.; Huang, B. Study of Mass Extinction over the past thirty years: A synopsis. Sci. Sin. Terrae 2014, 44, 377–404. [Google Scholar]
  69. He, L.; Wang, Y.P.; Chen, D.F. Geochemical features of sedimentary environment and paleoclimate during Late Ordovician to Early Silurian in southern Sichuan Basin. Geochimica 2019, 48, 555–566. [Google Scholar]
  70. Zou, C.; Qiu, Z.; Poulton, S.W.; Dong, D.; Wang, H.; Chen, D.; Lu, B.; Shi, Z.; Tao, H. Ocean euxinia and climate change “double whammy” drove the Late Ordovician mass extinction. Geology 2018, 46, 535–538. [Google Scholar] [CrossRef]
  71. Ekdale, A.A.; Mason, T.R. Characteristic trace-fossil associations in oxygen-poor sedimentary environments. Geology 1988, 16, 720. [Google Scholar] [CrossRef]
  72. O’Brien, N.R. The origin of lamination in middle and upper Devonian black shales, New York state. Northeast. Geol. 1989, 11, 159–165. [Google Scholar]
  73. Lu, L.F.; Qin, J.Z.; Shen, B.J.; Tenger, T.; Liu, W.X.; Zhang, Q.Z. The origin of biogenic silica in siliceous shale from Wufeng-Longmaxi Formation in the Middle and Upper Yangtze region and its relationship with shale gas enrichment. Earth Sci. Front. 2018, 25, 226–236. [Google Scholar]
  74. Zou, C.; Dong, D.; Wang, Y.; Li, X.; Huang, J.; Wang, S.; Guan, Q.; Zhang, C.; Wang, H.; Liu, H.; et al. Shale gas in China: Characteristics, challenges and prospects (II). Petrol. Explor. Dev. 2016, 43, 182–196. [Google Scholar] [CrossRef]
  75. Ragueneau, O.; Treguer, P.; Leynaert, A.; Anderson, R.F.; Brzezinski, M.A.; DeMaster, D.J.; Dugdale, R.C.; Dymond, J.; Fischer, G.; Francois, R.; et al. A review of the Si cycle in the modern ocean; recent progress and missing gaps in the application of biogenic opal as a paleoproductivity proxy. Glob. Planet. Chang. 2000, 26, 317–365. [Google Scholar] [CrossRef]
  76. Aplin, A.C.; Macquaker, J.H.S. Mudstone diversity: Origin and implications for source, seal, and reservoir properties in petroleum systems. AAPG Bull. 2011, 95, 2031–2059. [Google Scholar] [CrossRef]
  77. Munnecke, A.; Calner, M.; Harper, D.A.T.; Servais, T. Ordovician and Silurian sea—Water chemistry, sea level, and climate: A synopsis. Palaeogeogr. Palaeoclimatol. Palaeoecol. 2010, 296, 329–340. [Google Scholar] [CrossRef]
  78. Harper, D.A.T.; Hammarlund, E.U.; Rasmussen, C.M.Ø. End Ordovician extinctions: A coincidence of causes. Gondwana Res. 2014, 25, 1294–1307. [Google Scholar] [CrossRef]
  79. Ambrose, R.J.; Hartman, R.C. New pore-scale considerations for shale gas in place calculations. In Proceedings of the Society of Petroleum Engineers Unconventional Gas Conference, Pittsburgh, PA, USA, 23–25 February 2010. [Google Scholar]
  80. Sondergeld, C.H.; Ambrose, R.J.; Rai, C.S.; Moncrieff, J. Microstructural studies of gas shales. In Proceedings of the Society of Petroleum Engineers Unconventional Gas Conference, Pittsburgh, PA, USA, 23–25 February 2010; p. 17. [Google Scholar]
  81. Liu, W.P.; Zhang, C.L.; Gao, G.D.; Luo, C.; Wu, W.; Shi, X.W.; Zhang, J.; Li, W.G.; Deng, X.H.; Hu, X.H. Controlling factors and evolution laws of shale porosity in Longmaxi Formation, Sichuan Basin. Acta Pet. Sin. 2017, 38, 175–184. [Google Scholar]
  82. Yang, X.R.; Yan, D.T.; Wei, X.S.; Zhang, L.W.; Zhang, B.; Xu, H.W.; Gong, Y.; He, J. Different formation mechanism of quartz in siliceous and argillaceous shales: A case study of Longmaxi Formation in South China. Mar. Petrol. Geol. 2018, 94, 80–94. [Google Scholar]
  83. Li, W.H.; Mei, Z.C.; Chen, J.W.; Lu, H.Y. Genetic environment of Ordovician radiolarian cherts and volcanic tuffs in Weibei, Shaanxi province. Reg. Geol. China 1997, 16, 422–427. [Google Scholar]
  84. Sun, K.M.; Zhang, S.C.; Xin, L.W. Impacts of bedding directions of shale gas reservoirs on hydraulically induced crack propagation. Nat. Gas Ind. 2016, 36, 45–51. [Google Scholar] [CrossRef] [Green Version]
  85. Wei, Z.H. Late fugitive emission of shale gas from Wufeng-Longmaxi Formation in Sichuan Basin and its periphery. Oil Gas Geol. 2015, 36, 659–665. [Google Scholar]
  86. Jin, Z.J.; Hu, Z.Q.; Gao, B.; Zhao, J.H. Controlling factors on the enrichment and high productivity of shale gas in the Wufeng-Longmaxi Formations, southeastern Sichuan Basin. Earth Sci. Front. 2016, 23, 1–10. [Google Scholar]
Figure 1. Map of the Sichuan Basin showing the distribution of the Wufeng–Longmaxi shale and locations of cored boreholes and outcrops. The base map is generated on Mou [43], and the locations of Chuanzhong paleo-uplift and Qianzhong–Xuefeng paleo-uplift are made based on Dong et al. [28].
Energies 15 01618 g001
Figure 2. Chart showing the chrono- and litho-stratigraphy, lithology, and shale occurrences in the Wufeng–Longmaxi shale in the Sichuan Basin of southwestern China (compiled from [16,26,51]).
Energies 15 01618 g002
Figure 3. Sampling positions from the Wufeng–Longmaxi shale in the Shuanghe outcrop in Changning County in the Sichuan Basin of southwestern China. The large thin sections (LTS) with a width of 7 cm and length of 5 cm were prepared cut perpendicular to the shale lamination surface from the base to the top continuously. The standard thin sections (STS) with a width of 2 cm and length of 2 cm were prepared cut perpendicular to the shale lamination surface from the base to the top with sampling intervals ranging from 5 to 10 cm. GZ: graptolite zone; PS: parasequence; LTS: large thin section; STS: standard thin section; MTEA: main and trace element analysis; PP: porosity and permeability.
Energies 15 01618 g003
Figure 4. Standard thin section photos showing typical characteristics of laminae, laminasets, and beds. (A) Clayey and silty laminae. Red arrows point to silty laminae, which are mainly composed of siltstone and have brighter color. White arrows point to clayey laminae, which consist mainly of claystone and have dark gray color. Samples were collected in the Longmaxi Formation of the Shuanghe outcrop (sample number: 9-15-1); (B) NGB-C, with a continuous, planar base boundary and an abrupt contact with underlying units, is mainly composed of clayey laminae. From the base to the top, the grain size gradually becomes finer and the color becomes grayer. Samples were collected from the Wufeng Formation at the Shuanghe outcrop (sample number: 4-20-1); (C) IGB-C, with a continuous, planar top boundary and an abrupt contact with overlying units, are mainly composed of clayey laminae as well. From the base to the top, the grain size gradually becomes coarser and the color becomes brighter. Samples were collected from the Wufeng Formation at the Shuanghe outcrop (sample number: 4-37-1); (D,E) NGB-SC and IGB-SC. NGB-SC, with sharp, continuous, and plana base, has silty laminasets at the base that grade into clayey laminasets at the top. IGB-SC, with sharp, continuous, and wavy top, has clayey laminasets at the base that grade into silty laminasets at the top. Samples were collected from the Longmaxi Formation of the Shuanghe outcrop (sample numbers are 9-2-1 and 9-3-1, respectively); (F) Silty and clayey laminasets. Silty laminaset consists of silty laminae intercalated with thin lenticular and discontinuous clayey laminae. Clayey laminaset consists of clayey laminae intercalated with lenticular and discontinuous silty laminae. Samples were collected from the Longmaxi Formation of the Shuanghe outcrop (sample number: 9-15-2); (G) NGB-C, with a continuous, planar base boundary and an abrupt contact with underlying units, is mainly composed of clayey laminae. From the base to the top, the grain size gradually becomes finer and the color becomes grayer. Samples were collected from the Wufeng Formation at the Shuanghe outcrop (sample number: 4-8-1); and (H) NGB-C, with a continuous, wavy base boundary and an abrupt contact with underlying units, is mainly composed of clayey laminae. From the base to the top, the grain size gradually becomes finer and the color becomes grayer. Samples were collected from the Wufeng Formation at the Shuanghe outcrop (sample number: 4-14-1). Abbreviations are shown in Table 1.
Energies 15 01618 g004
Figure 5. Backscattered electron images showing minerals and grain size of clayey and silty laminae. (AC) clayey laminae, consisting mainly of claystone, are dominantly composed of quartz (70~90%), OM (15~25%), clay minerals (6~15%), and other minerals. For the clayey laminae, quartz is dominantly clay-sized with grain size less than 8 φ; (DF) Silty laminae, consisting mainly of siltstone, are dominantly composed of carbonate minerals, quartz, pyrite, and OM. For the silty laminae, quartz is dominantly silt-sized with grain size in the range 4 φ to 8 φ. Qtz: quartz; Cal: calcite; Dol: dolomite; Chl: chlorite; Py: pyrite. Sample number is 8-2-1.
Energies 15 01618 g005
Figure 6. Standard thin section photos taken under orthogonal polarized light showing typical shale components from the Wufeng–Longmaxi shale in the Sichuan Basin of southwestern China. (A) Shale with abundant siliceous sponge fossils (Shuanghe outcrop in Changning County); (B) Shale with abundant sponge spicule (orthogonal polarization, Shuanghe outcrop in Changning County); (C) Shale with trilobite fossil fragments (Shuanghe outcrop in Changning County); (D) Shale with dense fossil fragments (Shuanghe outcrop in Changning County).
Energies 15 01618 g006
Figure 7. Core and outcrop photos showing general characteristics under the naked eye of shale with various depositional structures in the Wufeng–Longmaxi shale in the Sichuan Basin of southwestern China. (A) PL, with weakly linear lighter color banding occurring alternated with darker layers (sample number 8-31, Longmaxi Formation); (B) GL-C, the colors of the adjacent beds often show a slight differences (sample number 4-2, Wufeng Formation); (C) GL-SC (sample number: 9-19-1, Longmaxi Formation) and (D) GL-SC (sample number 10-12, Longmaxi Formation), and the shale has a distinct “striped” appearance of alternating lighter and darker layers as well as intermittent bright calcite beds; (E) IL (sample number 2018-12, Longmaxi Formation) from borehole Ning 212, and paler beds alternate with darker beds; (F) SB (sample number 5-29, Wufeng Formation) from Shuanghe outcrop in Changning County, and the shale is massive and shows no obvious lamination, bedding or fissility.
Energies 15 01618 g007
Figure 8. Large thin section images taken under orthogonal polarized light showing typical characteristics and fractures of the various depositional structures. Samples were collected from the Wufeng–Longmaxi shale of the Shuanghe outcrop in the Sichuan Basin of southwestern China. (A) PL, in which the silty laminae are linear, diffuse, discontinuous, or lenticular shaped and have sharp base and top contacts. Bedding parallel fractures commonly propagate from within clayey laminae (sample number 8-31); (B) GL-C, which consists of a series of bed IGB-C and has continuous, planar, and parallel bed boundaries. Bedding parallel fractures commonly propagate from along clayey–silty laminae interfaces (sample number 4-2-1); (C) GL-C, which consists of a series of bed NGB-C and has continuous, planar, and parallel bed boundaries. Bedding parallel fractures commonly propagate from within clayey laminae (sample number 5-29); (D) GL-SC, with continuous, planar, and parallel bed boundary. Bedding parallel fractures commonly propagate from within clayey laminae (sample number 9-15-1); (E) IL, with continuous, planar, and parallel geometry and sharp contact boundaries, is composed of the interbedded silty laminae and clayey laminasets (sample number 9-5-1); and (F) SB, which contains numerous bioclasts of various species (sample number 6-19-1).
Energies 15 01618 g008
Figure 9. Vertical distribution of geochemical characters and sedimentation rate of different depositional structures in the Sichuan Basin of southwestern China.
Energies 15 01618 g009
Figure 10. Backscattered electron and microscopy images showing fractures and microfractures in various depositional structures. (A) Fractures are filled with silica, sample number: WX-1; (B) Fractures are filled with calcite, sample number: WX-2; (C) Fractures are filled with OM, sample number: WX-3; (D) Shrinkage microfractures propagate from among clay mineral grains, sample number: 4-16-1; (E) Dissolved microfractures propagate from between carbonate mineral grains, sample number: 6-22-1; (F) Over-pressured microfractures propagate from along OM-mineral interfaces, sample number: 8-4-1.
Energies 15 01618 g010
Figure 11. Backscattered electron images showing nanopores in shale with various depositional structures from Shuanghe outcrop in Changning County. Organic pores are round, elliptical, or elongated, and inorganic pores are intergranular dissolved pores, irregular, or harbor-like. (A) Organic pores, sample number is 8-4-1; (B) Organic pores, sample number is 8-10-2; (C) Organic pores and inorganic pores. Sample number: 9-16-2; (D) Organic pores. Sample number: 10-14-1; (E) Inter-particle dissolved pores, sample number is 4-28-1; (F) Inter-particle dissolved pores, sample number is 9-16-2. Note that the red color denotes organic pores, the yellow color represents inorganic pores and the lilac color represents microfractures.
Energies 15 01618 g011
Figure 12. Backscattered electron images showing nanopores and microfractures in clayey laminae and silty laminae. (A) In clayey laminae, organic pores are rich and propagate along organic matters to form dense networks; (B) In silty laminae, inorganic pores are abundant but commonly occur isolated. Note that the red color denotes organic pores, the yellow color represents inorganic pores and the lilac color represents microfractures.
Energies 15 01618 g012
Figure 13. Porosity distribution in various lamination shale. For the PL, GL-SC, and IL, organic pores account for more than 50% of the total porosity, whereas for the GL-C and SB, inorganic pores account for more than 50% of the total porosity.
Energies 15 01618 g013
Figure 14. Porosity and permeability of different samples of the five lamination styles. (A) Horizontal and vertical porosity; (B) Horizontal and vertical permeability.
Energies 15 01618 g014
Table 1. Sampling cores and outcrop from the Wufeng–Longmaxi shale in the Sichuan Basin of southwestern China. In the Table, LTS is for large thin section, STS is for standard thin section, TOC is for total organic carbon, XRD is for X-ray diffraction whole rock, PP is for porosity and permeability, MTEA is for main and trace element analysis, and FE-SEM is for field-emission scanning electron microscopy.
Layering and Depositional StructuresDescription
LayeringLaminaeClayey laminaeA layer constructed mainly by claystone dominated by quartz, OM, clay minerals, dolomite, calcite, pyrite, and others
Silty laminaeA layer constructed mainly by siltstone dominated by dolomite, calcite, quartz, pyrite, and OM
LaminasetClayey laminasetA genetically related succession of clayey lamina bearing lenticular or discontinuous silty lamina
Silty laminasetA genetically related succession of silty lamina bearing lenticular or discontinuous clayey lamina
BedNGB-C: Normally graded bed composed of claystoneA genetically related succession of normally graded clayey lamina
IGB-C: Inversely graded bed composed of claystoneA genetically related succession of inversely graded clayey lamina
NGB-SC: Normally graded bed composed of siltstone grading into claystoneA genetically related succession of silty laminaset normally grading into clayey laminaset
IGB-SC: Inversely graded bed composed of claystone grading into siltstoneA genetically related succession of clayey laminaset inversely grading into silty laminaset
Depositional structuresParallel laminationPL: Paper laminationShale constructed by clayey laminaset intercalated with linear silty lamina
GL-C: Grading lamination composed of claystoneShale constructed by NGB-C and/or IGB-C
GL-SC: Grading lamination composed of siltstone and claystoneShale constructed by NGB-SC and/or IGB-SC with minor clayey lamina
IL: Interlaminated lamination composed of siltstone and claystoneShale constructed by silty lamina with clayey laminaset or silty laminaset with clayey laminaset
SB: Structureless bedsShale constructed by siltstone and showing no obvious lamination or bedding
Table 2. Porosity and permeability of shale with various depositional structures from the Wufeng–Longmaxi shale in the Sichuan Basin of southwestern China.
Depositional StructuresSample NumberPorosity/%Permeability/×10−3 μm2
HorizontalVerticalH/VHorizontalVerticalH/V
PL8-31-16.856.41.070.1842850.000655281.35
9-11-17.266.311.150.0479550.00276117.39
8-10-19.359.041.040.223540.0259258.62
8-31-25.434.131.310.0022910.0003516.53
GL-SC9-19-24.905.980.820.0109540.0028763.81
ILSLM4-14.174.210.990.0057430.0007148.04
GL-C4-2-11.471.271.160.001490.00012412.02
M0010.600.880.680.0009310.0005751.62
SB5-26-21.931.181.680.0003130.0003640.86
5-29-24.163.171.320.0003420.0004190.82
SWF6-1-22.081.731.220.00031690.0003161.00
5-34-31.161.111.050.0000280.0000830.34
Publisher’s Note: MDPI stays neutral with regard to jurisdictional claims in published maps and institutional affiliations.

