1. Introduction
As the power equipment around the world ages owing to many years of operation, many power facilities are operating near or beyond their design life. For asset management of old power equipment, a replacement priority technique based on risk management is required [
1]. Risk-based asset management, which is implemented using a risk matrix consisting of probability of failure (PoF) and consequence of failure (CoF), has been applied to reduce costs in combination with shrinking budgets [
2]. For this reason, many power utilities across the world are introducing, or have already started using, asset management systems (AMS) to increase their business value [
2]. Asset management standards are based on the ISO 55000 family, which presents general guidelines and process procedures for asset management [
3,
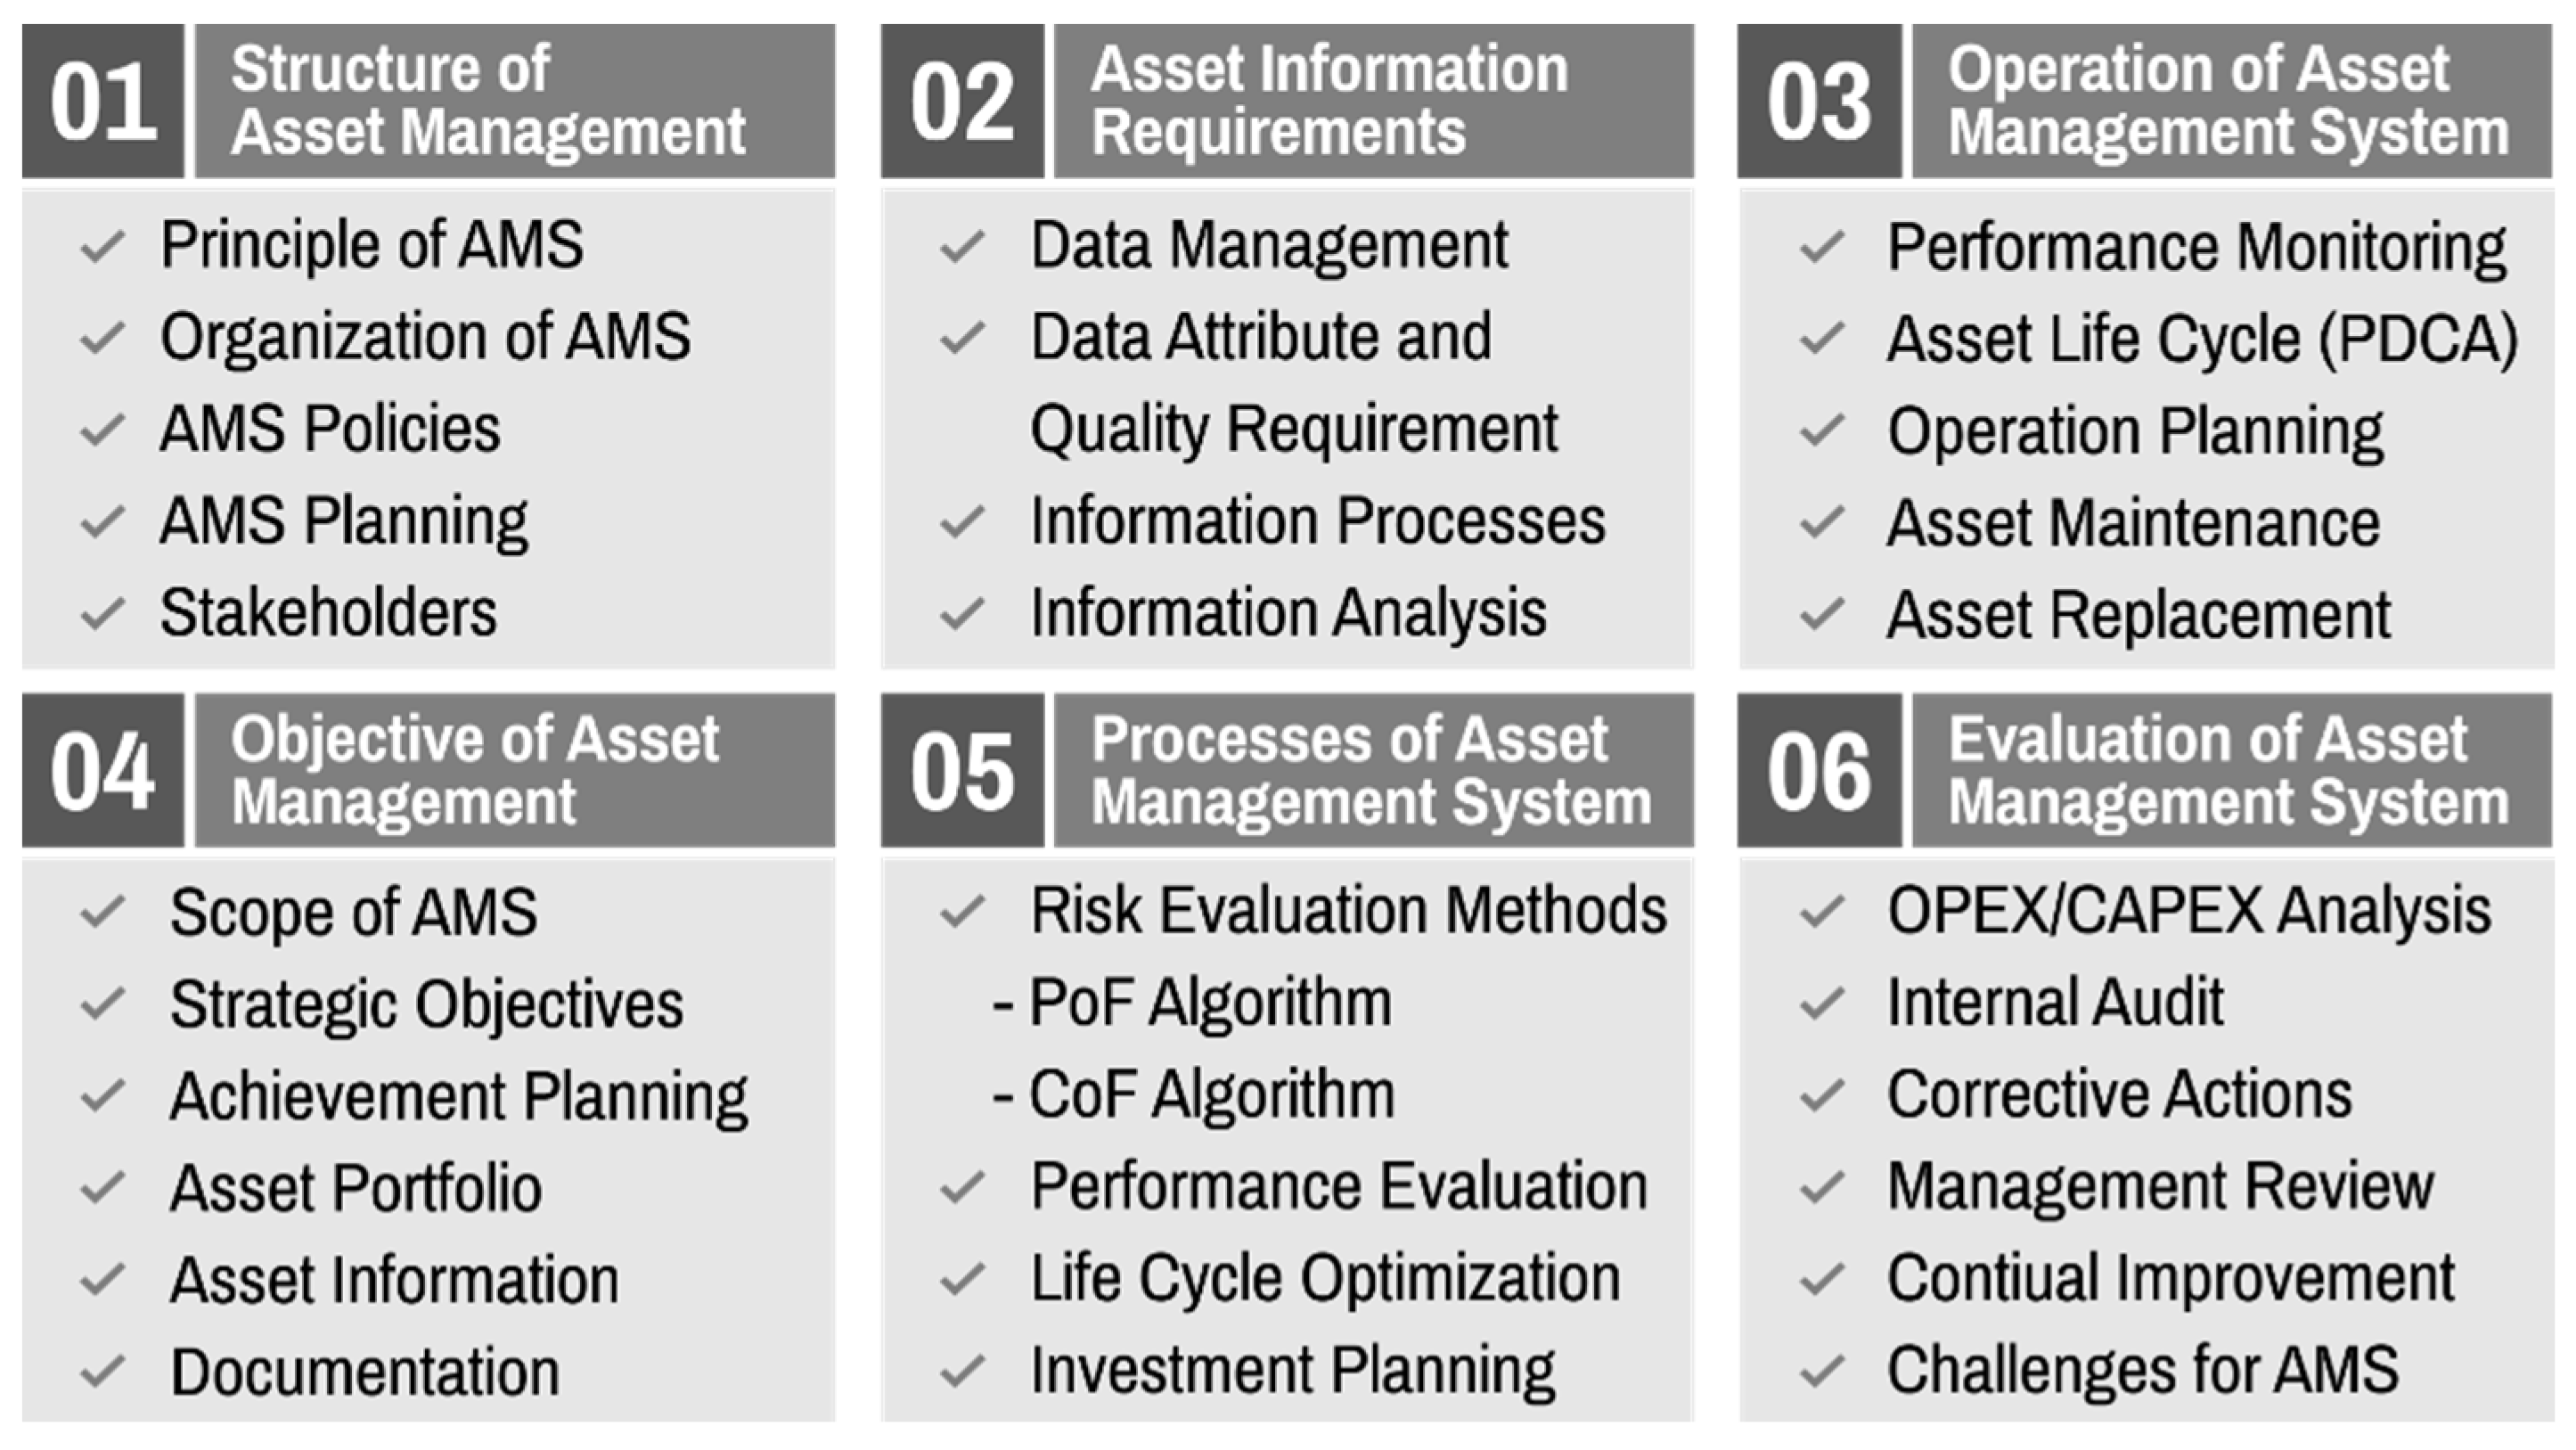
4]. The requirements and processes for asset management are composed of six steps: (1) the structure of asset management, (2) the objective of asset management, (3) asset information requirements, (4) processes of the asset management system, (5) operation of the asset management system, and (6) evaluation of the asset management system, as shown in
Figure 1.
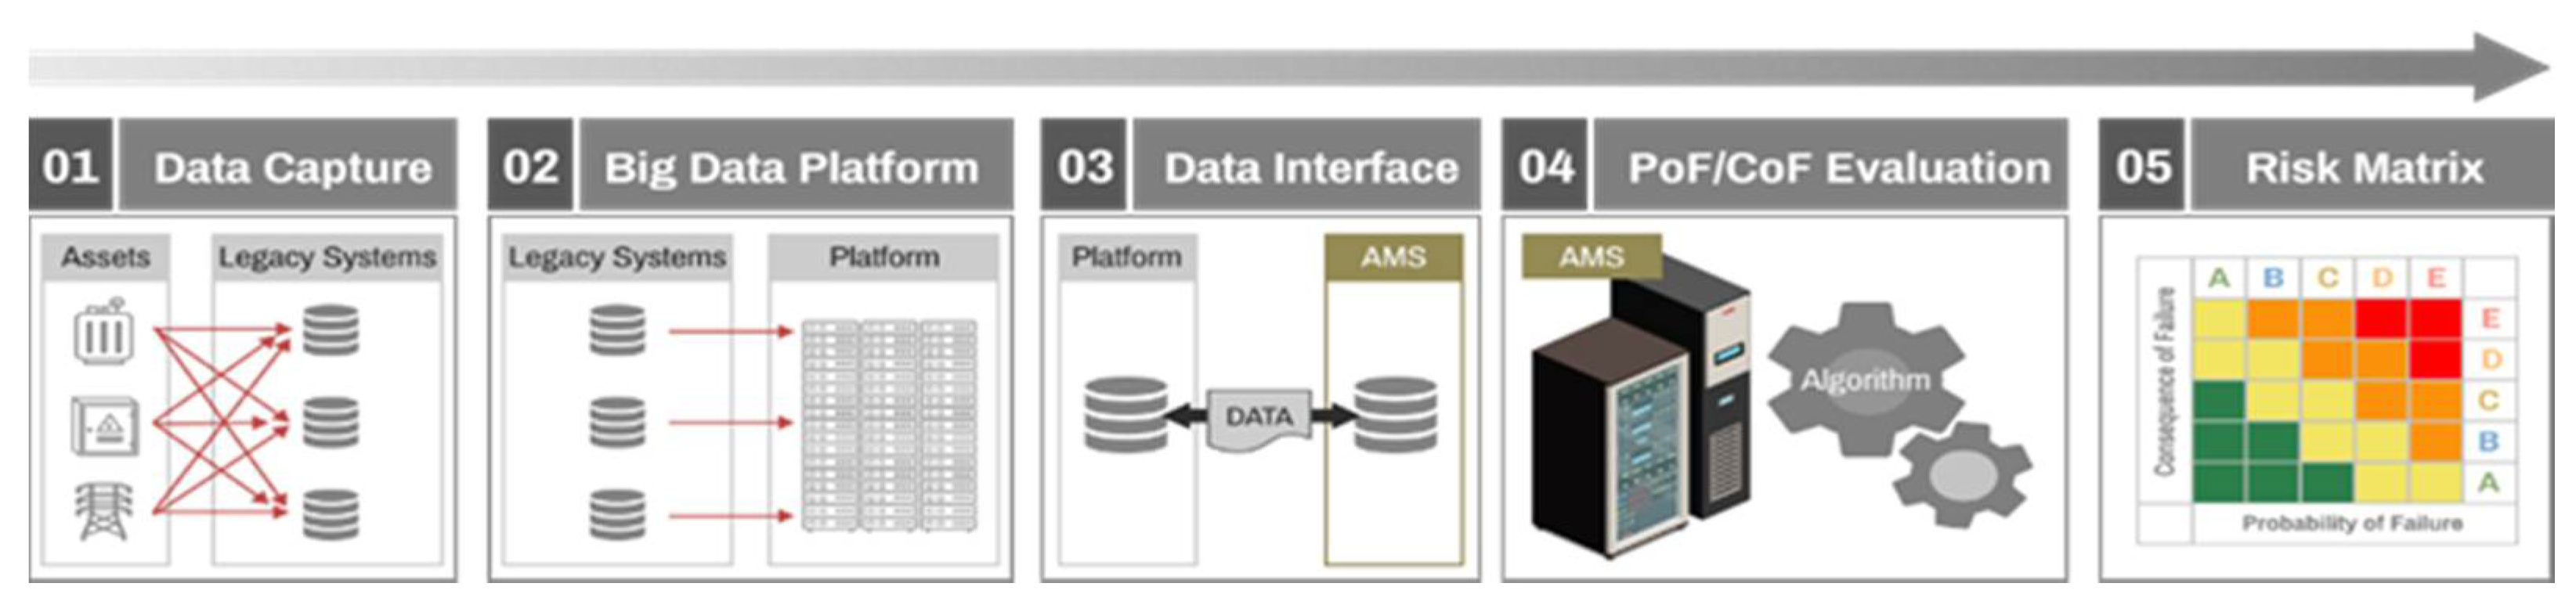
In this process, the technology gap depends on the asset data quality and the accuracy of the risk assessment algorithms for the power equipment. An AMS supports investment decision-making by evaluating the risk of every asset and prioritizing the replacement ranking [
5]. The risk assessment algorithm is processed using asset data from legacy systems [
6,
7]. Currently, asset specifications, inspection and diagnosis, and operation information of power equipment are captured in various legacy systems and stored in a big data platform. Asset datasets in big data platforms can interface with asset management systems and utilize the risk assessment process shown in
Figure 2.
AMS can be described as the life cycle management of physical assets considering the business needs [
8]. For making decisions based on the life cycle of physical assets, it is mainly used to manage various electric devices in conjunction with IoT, which is related to the smart factory and healthcare industries [
8]. A power system, which consists of extremely expensive assets, such as power generators, power transformers, and transmission lines, has been broadly renowned for being a capital-intensive industry [
9]. The power outages, even as short as few seconds, cause a huge ripple effect to economic loss and human life. The fact that most power assets operate outdoors can be a challenge because they can be affected by weather, harsh ambient conditions [
9]. In addition, it is difficult to find out the failure mechanism, because the long lifespan of the power asset makes it difficult to obtain the data from faulty asset with aging. Machine learning (ML) approaches, including supervised, unsupervised, or reinforcement learning have been studied and developed in power systems [
9,
10]. Among power assets including synchronous generator and power transformer, protection of transmission line plays a key role in the power system not only to minimize the equipment damage but also maximize the power grid reliability. Various research projects are being conducted in the field of protection among AMS [
9,
10]. Conventional protection algorithms are mainly developed to localize the fault based on the measured waveforms, including local voltage, local current, and impedance [
9,
10]. The most widely used signal processing methods to extract the features for fault identification are Discrete Wavelet Transform [
11], S-transform [
12] and Mathematical morphology [
13]. Most used fault classification techniques are ANN [
14], Fuzzy Inference System [
15], and SVM [
16]. Most of the previous studies in which AMS is applied to transmission system are fault detection algorithms based on real-time data acquired from sensors, and a system that integrates and manages all data of transmission system including real-time data is proposed for the first time in this paper.
Legacy systems are maintained and linked to each other, but data quality has not been fully estimated and managed. At the initial stage, there are no sustainable data cleaning tools, and the data quality does not generally satisfy the target value. If the legacy data are not reliable, then the results of the risk assessment algorithm could be inaccurate [
17]. As a result, the priorities for replacement may differ, and investment plans may be incorrectly established. Therefore, legacy data quality is very important, which leads directly to the reliability of the asset management system [
18,
19]. Most companies agree that data are the most strategic asset [
20]. Management of asset data quality is essential for operating the asset management system, but it has been reported that data scientists spend 60% of their time in cleaning and organizing data [
21]. Thus, data cleaning and organization tools are required to increase the asset data quality and the reliability of an asset management system.
From classic data cleaning methodologies, it is well known that the data have essential characteristics, including accuracy, completeness, consistency, validity, timeliness, and uniqueness. In practice, various concerns are required including how the normal and dirty data could be classified, how we can clean those dirty data automatically, how we verify the cleaning results, and so on. Data cleaning works are being carried out in various industrial fields, but there is a property that the cleaning algorithm of a specific field cannot be directly applied to other fields. For this reason, it is essential to develop a cleaning algorithm specialized in the electric power field. To deal with missing and outlier data, data cleaning algorithms based on rule-based and domain knowledge have been mainly adopted and utilized [
21,
22,
23]. In case of missing data, the missing data are replaced with average values, most frequent values, or median values. For the outlier data detection, outlier data are classified by checking whether they exceed the first or third quartile value. Here, the first and third quartile are values corresponding to the bottom 25% and top 25% of all data. Recently, artificial intelligence techniques have been investigated and applied to classify the normal and outlier data. For example, support vector machine (SVM) have been adopted for detecting the outliers injected into the measurement data from a power grid [
23]. In another paper, the classic k-nearest neighbor (KNN) technique has been used for identifying the outliers [
24].
Numerical data measured in real time through sensors can be cleaned through ML approaches using the training data, but in the case of power systems, there is a lot of unique data, such as installation date, manufacturer, etc. For example, unique data of an asset, such as keycode, are difficult to clean, because there is no training data for the asset. For this reason, a customized cleaning method based on domain knowledge is required. In particular, the AMS applied to transmission line from the above point of view is a basic stage, and building a practical system based on real data rather than an academic dataset is proposed for the first time in this paper. The target data in this paper are acquired from three different legacy system, and there are 138 types. There is no system yet for cleaning such a vast amount of data types in transmission systems. The data of the transmission system are simply stored by each legacy system and are not integrated and managed. Therefore, it is more urgent to establish an integrated data management system than to develop an algorithm related to failure prediction.
Complying with the needs, each country’s power system operator is building the AMS suitable for each situation. The proposed AMS system can be divided into three systems: (1) data cleaning, integration, and quality check system, (2) data-based statistical method/ML approaches to extract key factors affecting the life of an asset and predict its lifespan, and (3) replacement timing selection system considering the ripple effect and economic value of assets in case of failure. The data cleaning, integration and evaluation system proposed in this paper is a part of the AMS to be applied to all power transmission systems in South Korea.
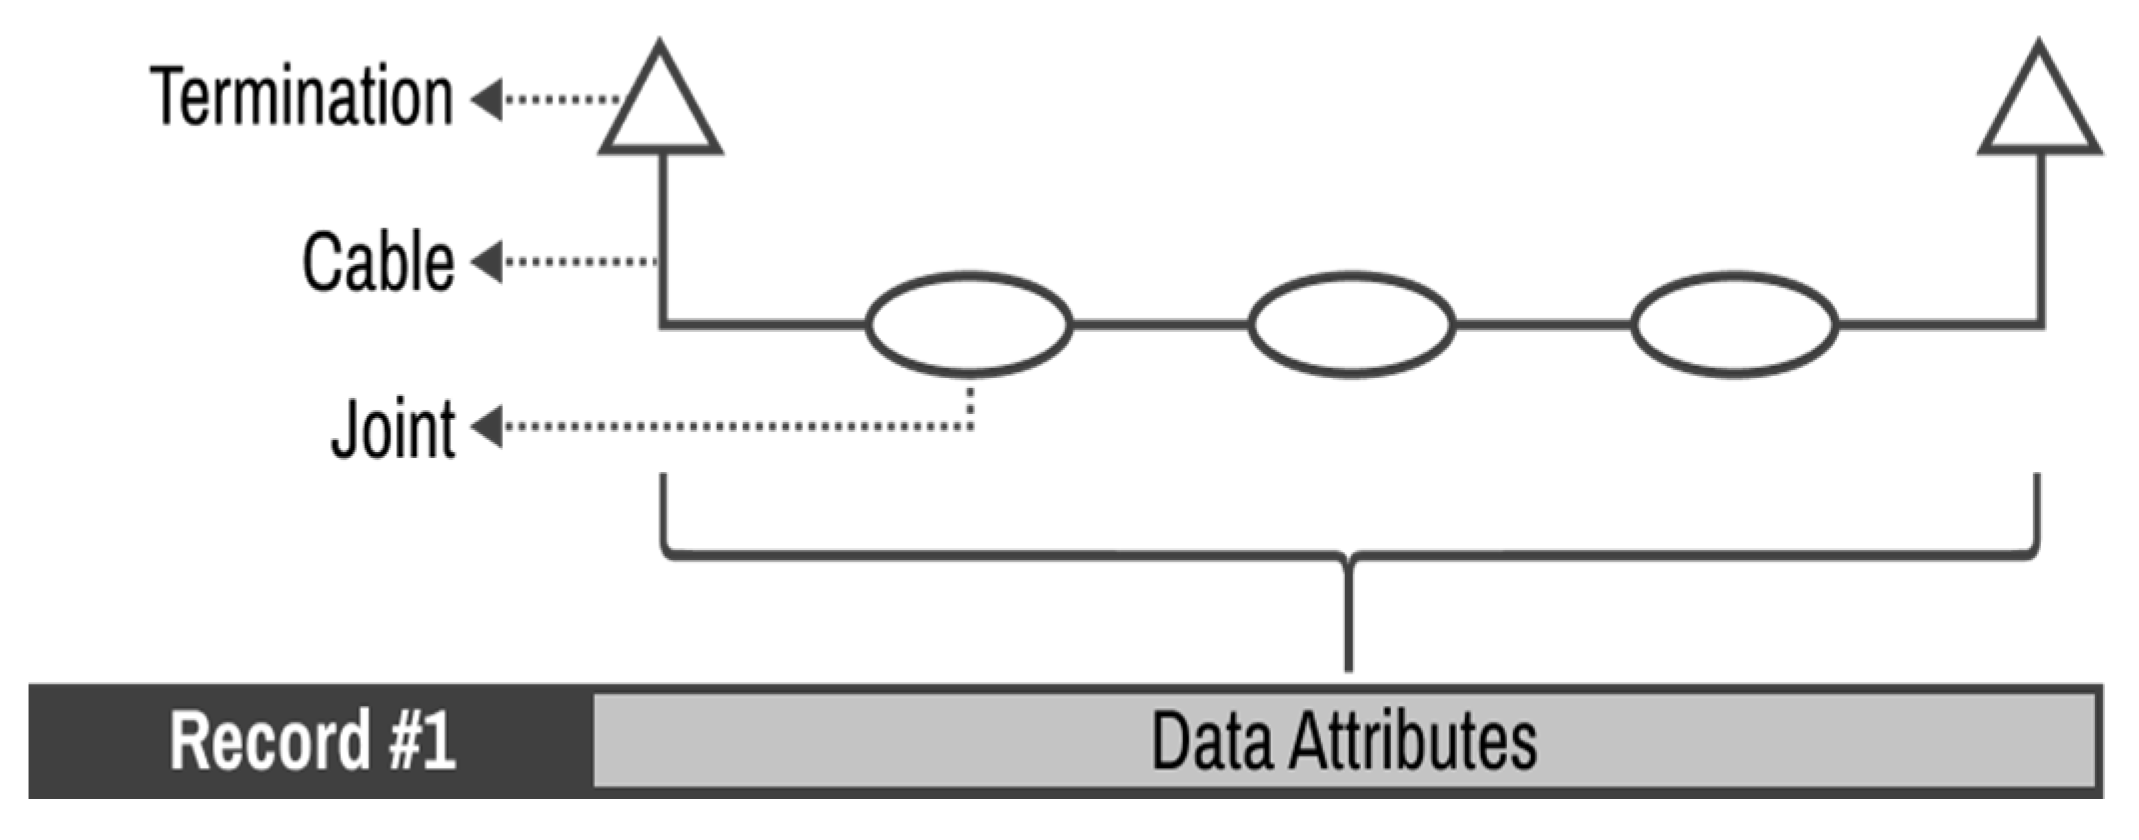
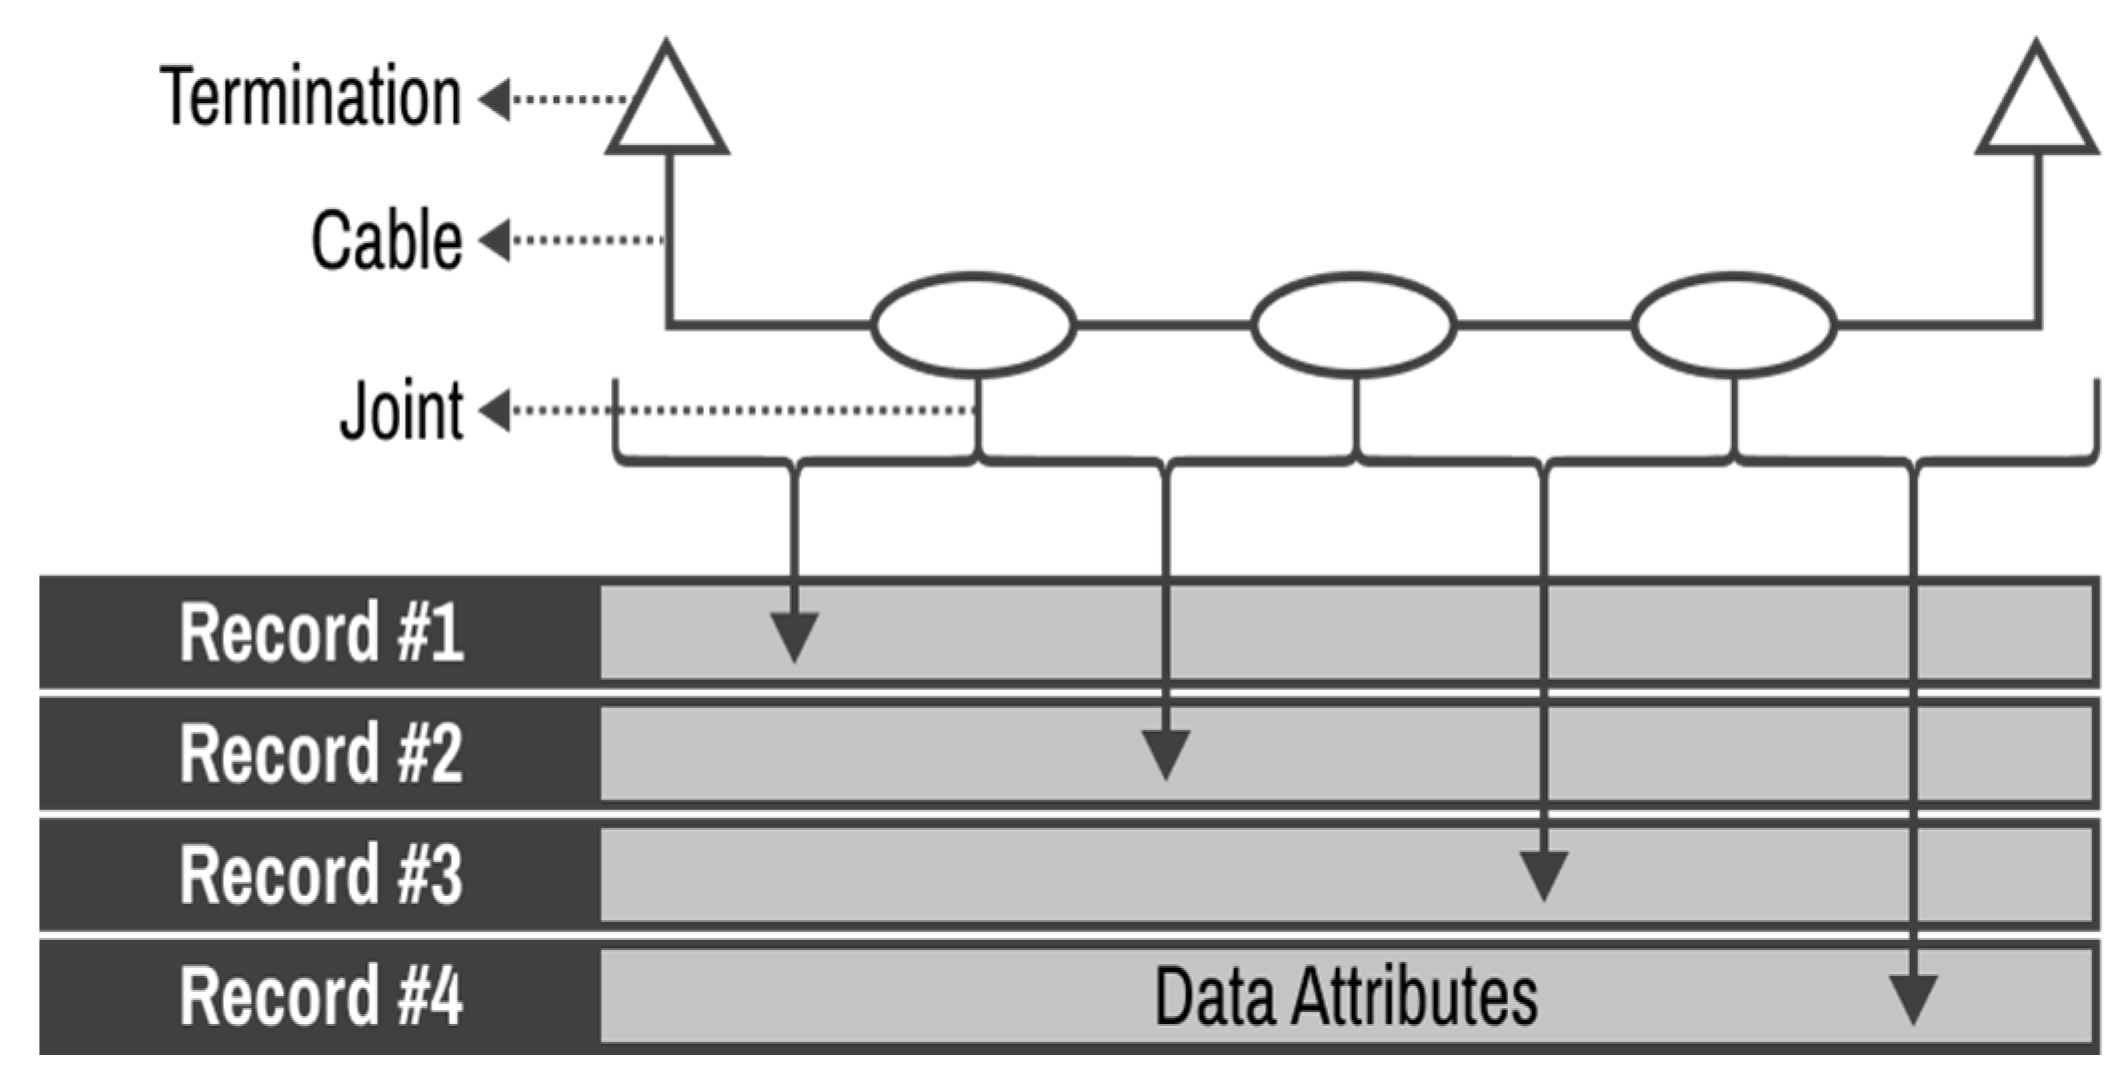
This paper proposes a new asset basic unit of asset for ease of data management. Based on data analysis obtained from 138 data types of three legacy systems, six types of suitable cleaning functions, three types of data integration functions, and data quality evaluation functions are introduced. In addition, the dirty data are automatically cleaned first, and only the dirty data, index, and the results of the cleaning function are sent to the relevant data managers for review. The data verified by experts are integrated with the original data using the index. In particular, through the data quality evaluation function of 15 divisions, each division is promoted to compete well in data management. The accuracy of the proposed algorithm is verified by comparing the automatically cleaned data with the real data instead of comparative analysis with other methods. In addition, we verify the performance of the proposed method based on the analysis results with different risk matrix results before and after using the proposed method. In future works, it is possible to develop an AMS considering installation location and manufacturer, etc., rather than the conventional AMS based on only sensor measurement data. This paper introduces the asset data management algorithm of South Korea’s power transmission system, and it is hoped that it will help other countries to build a system suitable for each country’s electric power system characteristics.
In
Section 2, the data characteristics of linear assets are covered, a method for setting the basic unit of assets that make up the power transmission cable system is introduced, and a method for integrating data acquired from each legacy system is developed. Oil- filled (OF) and cross-linked polyethylene (XLPE) cables are considered only for our data cleaning, which are representative cable types in South Korea. As the type of assets that make up the system are diverse and affect each other, we propose a data processing method that takes this consideration into account according to the type of asset connected. To evaluate asset risk, it is necessary to clean the raw data collected by each legacy system. The data cleaning process can be divided into two steps. The first step determines whether the data contain outliers. Here, an outlier is a data point that differs significantly from other observations. This is accomplished using data pattern analysis or expert opinions. By default, data outside the 95% confidence interval are automatically classified as an outlier, but the system operator can manually set the outliers by inputting the boundary value of the probability distribution function derived based on the acquired data. In step 2, the outliers are extracted and delivered to the user for correction. For the case of data that can be automatically cleaned based on pattern analysis, the cleaning details and index are reported to the user to manage each legacy system after automatic data cleaning. Through pattern analysis, the outlier boundary value of each data point is determined according to the data type.
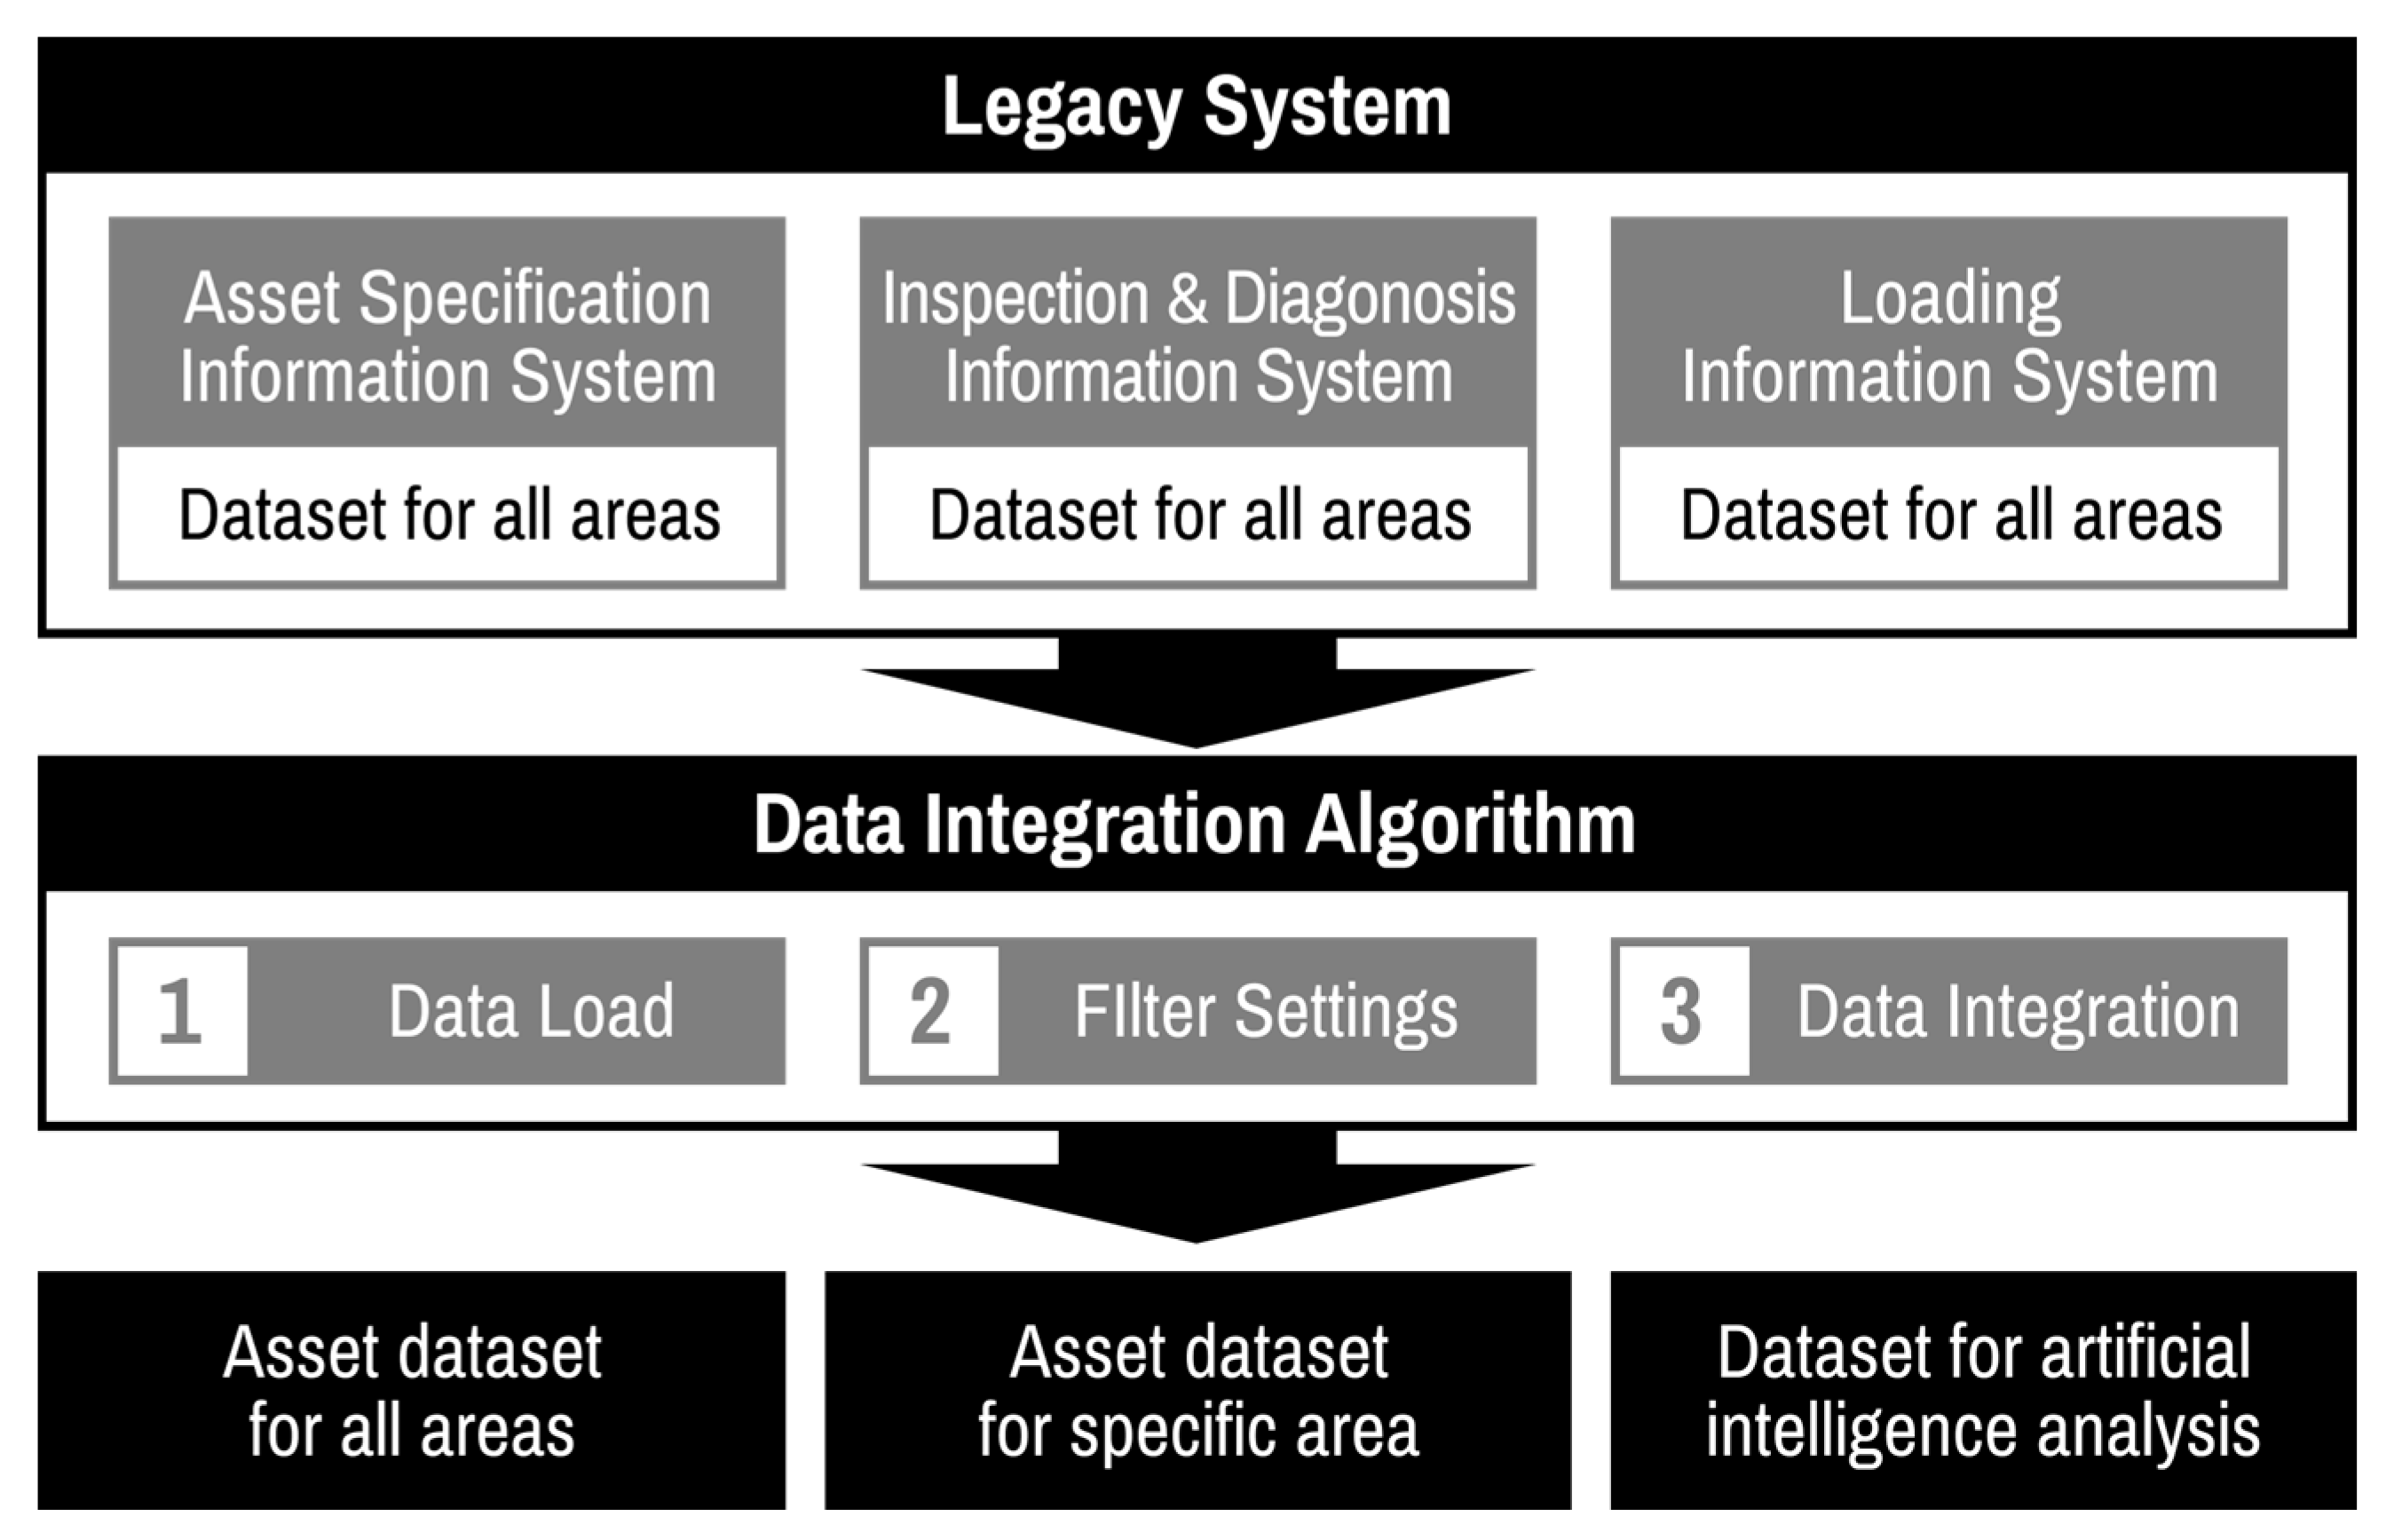
Section 3 describes the development of the data integration system. An integrated dataset from various legacy systems on a basis asset unit is necessary for simulating or processing a risk assessment algorithm. In addition, the process of integrating clean data verified by experts into the data is required. For this reason, an asset data integration algorithm has been developed as described in
Section 4. The main features of the integration algorithm are an integrated dataset with user-friendly filter settings from the distributed legacy data, and output data that can be automatically obtained with guaranteed data quality.
In
Section 5, a developed automatic legacy data cleaning and integration system utilizing these algorithms is described and verified using actual transmission cable data from South Korea. By comparing the risk matrix results before and after using the proposed algorithm, we can confirm the advantages of the developed system. In particular, the system can provide both cleaning and integration functions simultaneously and can be utilized sustainably for practical application cases of electric power utility.
5. Development of Data Cleaning and Integration System
An automatic data cleaning and integration system for asset management was developed based on both cleaning and integration algorithms, as described in
Section 3 and
Section 4. In addition, other applications, such as data loading, data quality assessment, exporting clean and dirty datasets, and feedback, have been implemented in the same system.
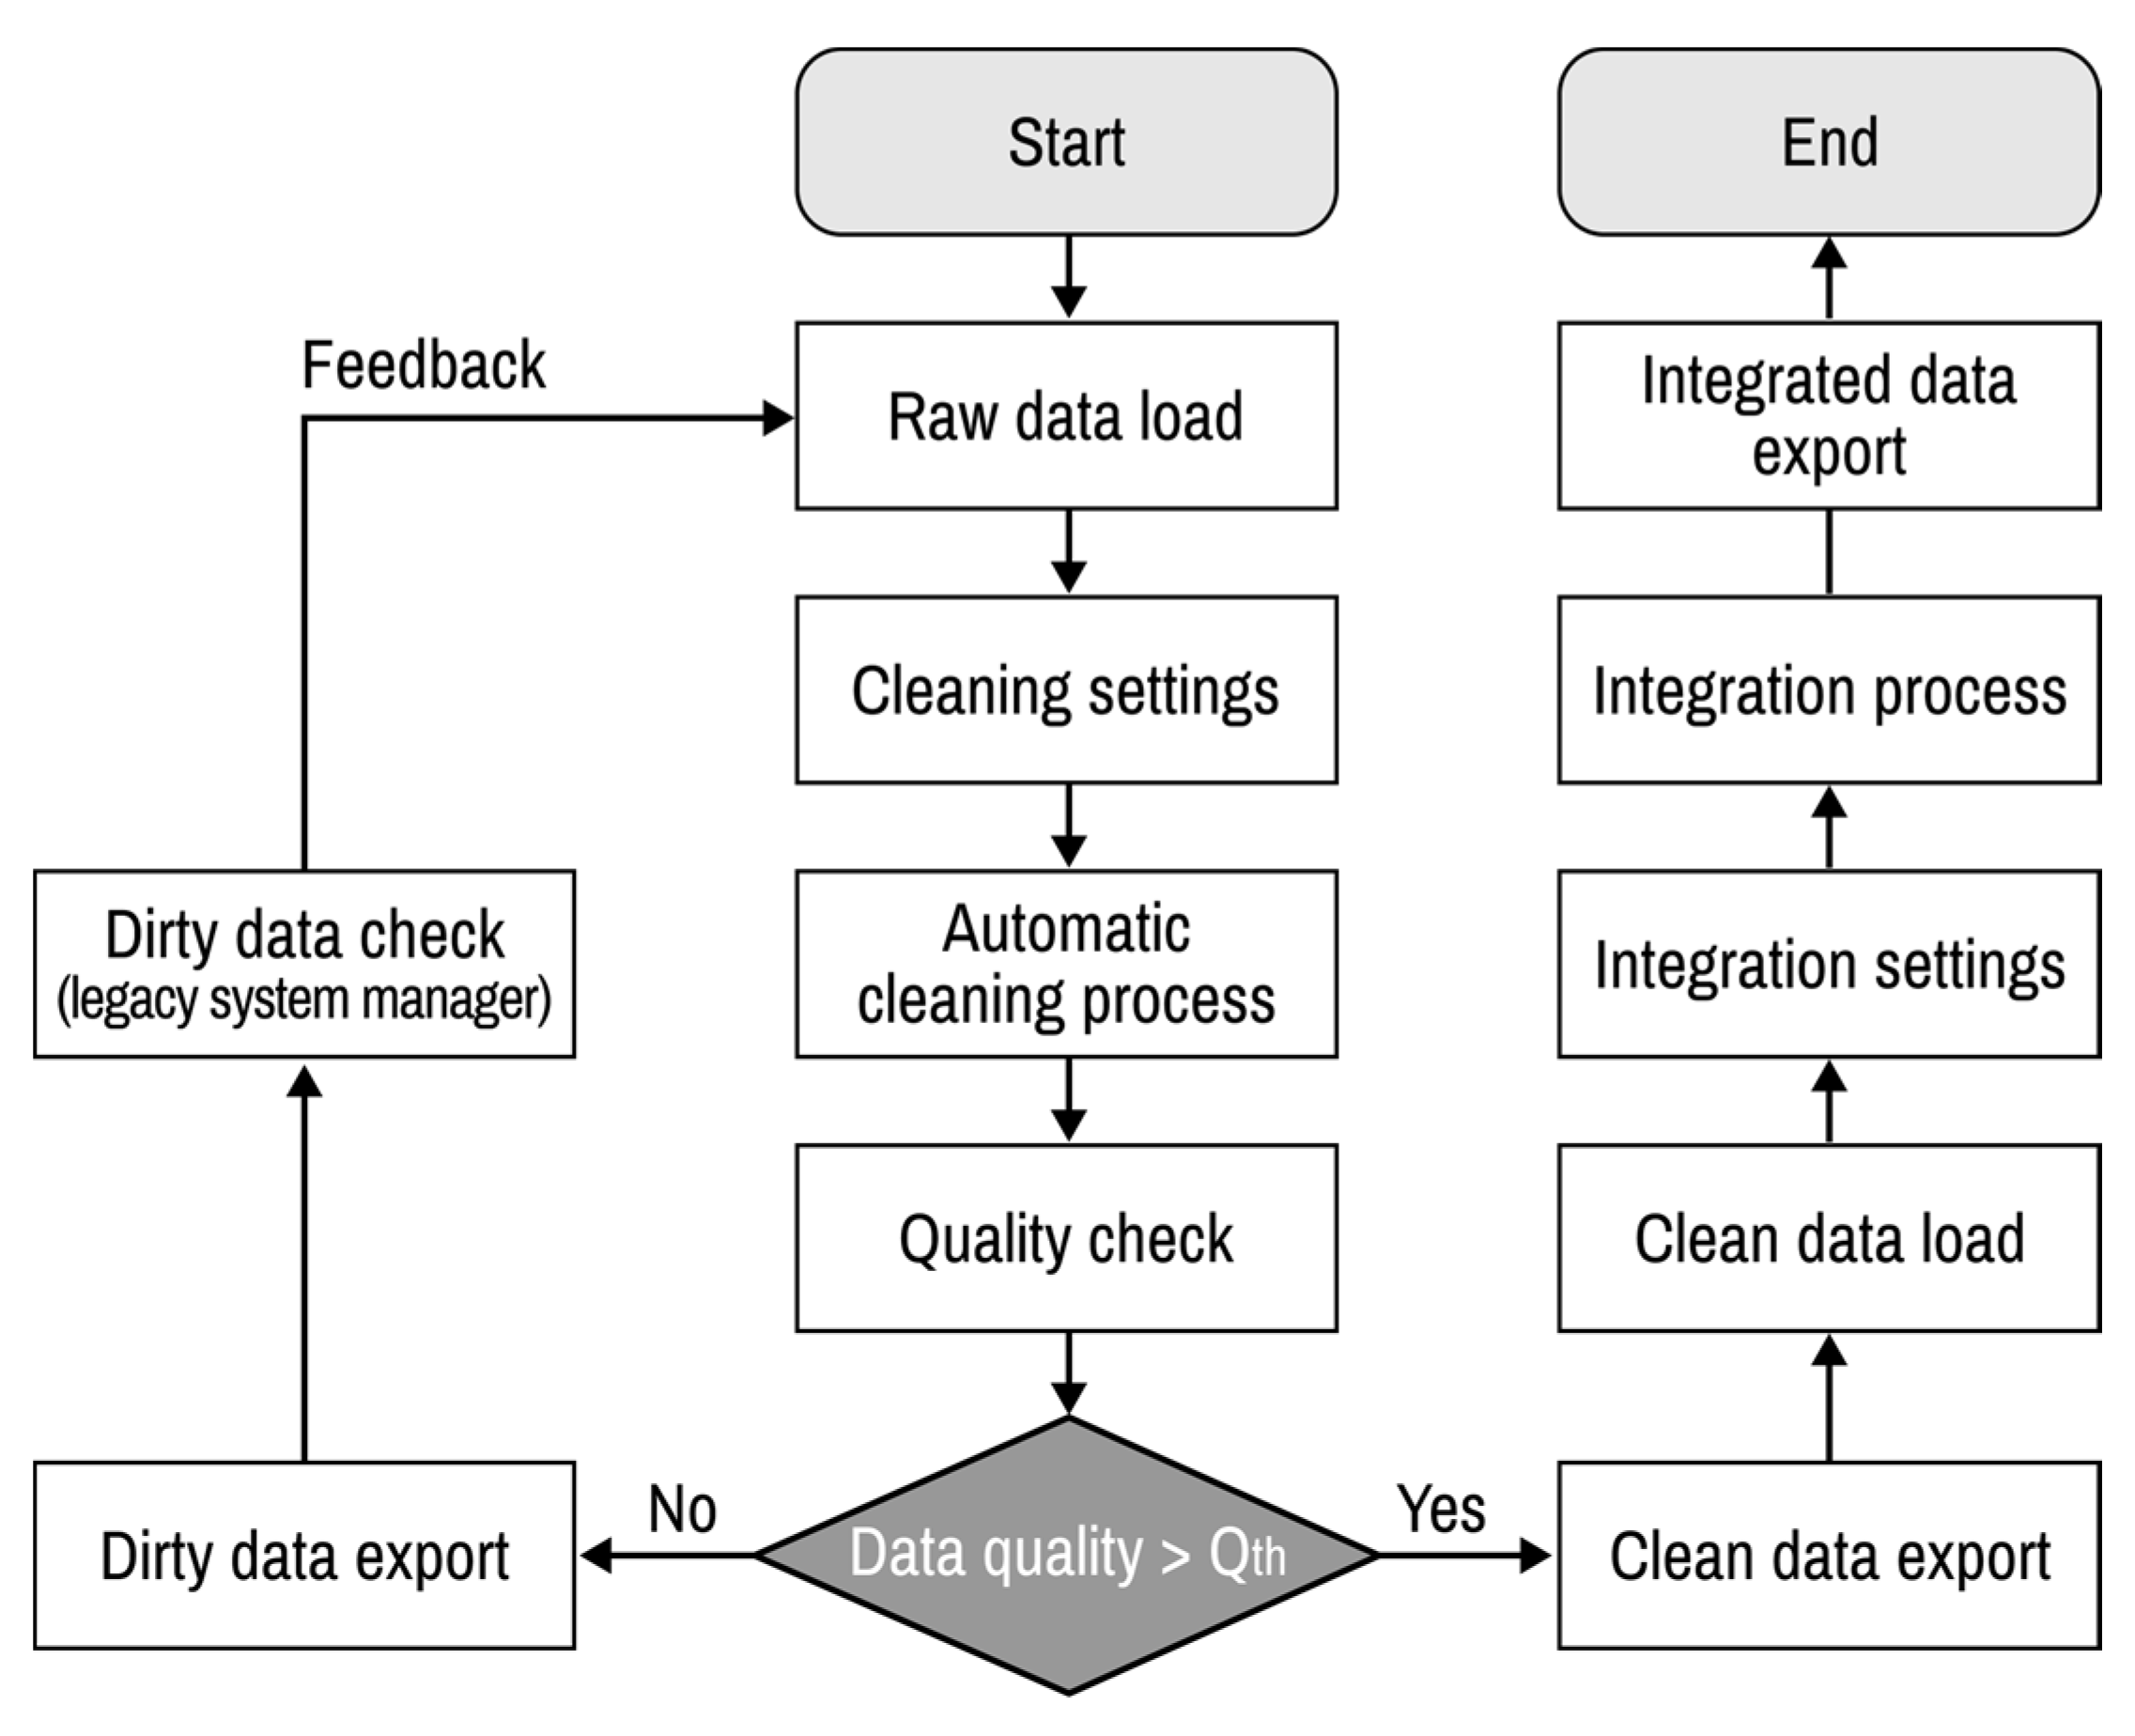
Figure 14 shows the entire process of automatic data cleaning and integration. The parameter
is a threshold for data quality that is determined by the users. Data quality has a maximum limit depending on the degree of contamination and proportion of missing data. The real-time data measured through the sensors can be improved through the ML approach-based signal processing methods. However, among the data handled in this paper, unique data such as installation date, manufacturer, keycode of equipment, not real-time measurement data, have a practical limitation of data quality, because there are no training data. Therefore, the threshold of data quality is set as a system input value so that the user can determine the desired threshold based on degree of data contamination. Until the quality of the clean data after the automatic data cleaning process becomes higher than
, the automatic data cleaning process is continued. Finally, the integrated asset data template file filled with integrated data can be obtained using a cleaned dataset. After the development of this system, it is demonstrated with legacy datasets utilized for the asset management of electric power equipment in South Korea.
5.1. Detailed Functions of Data Cleaning Part
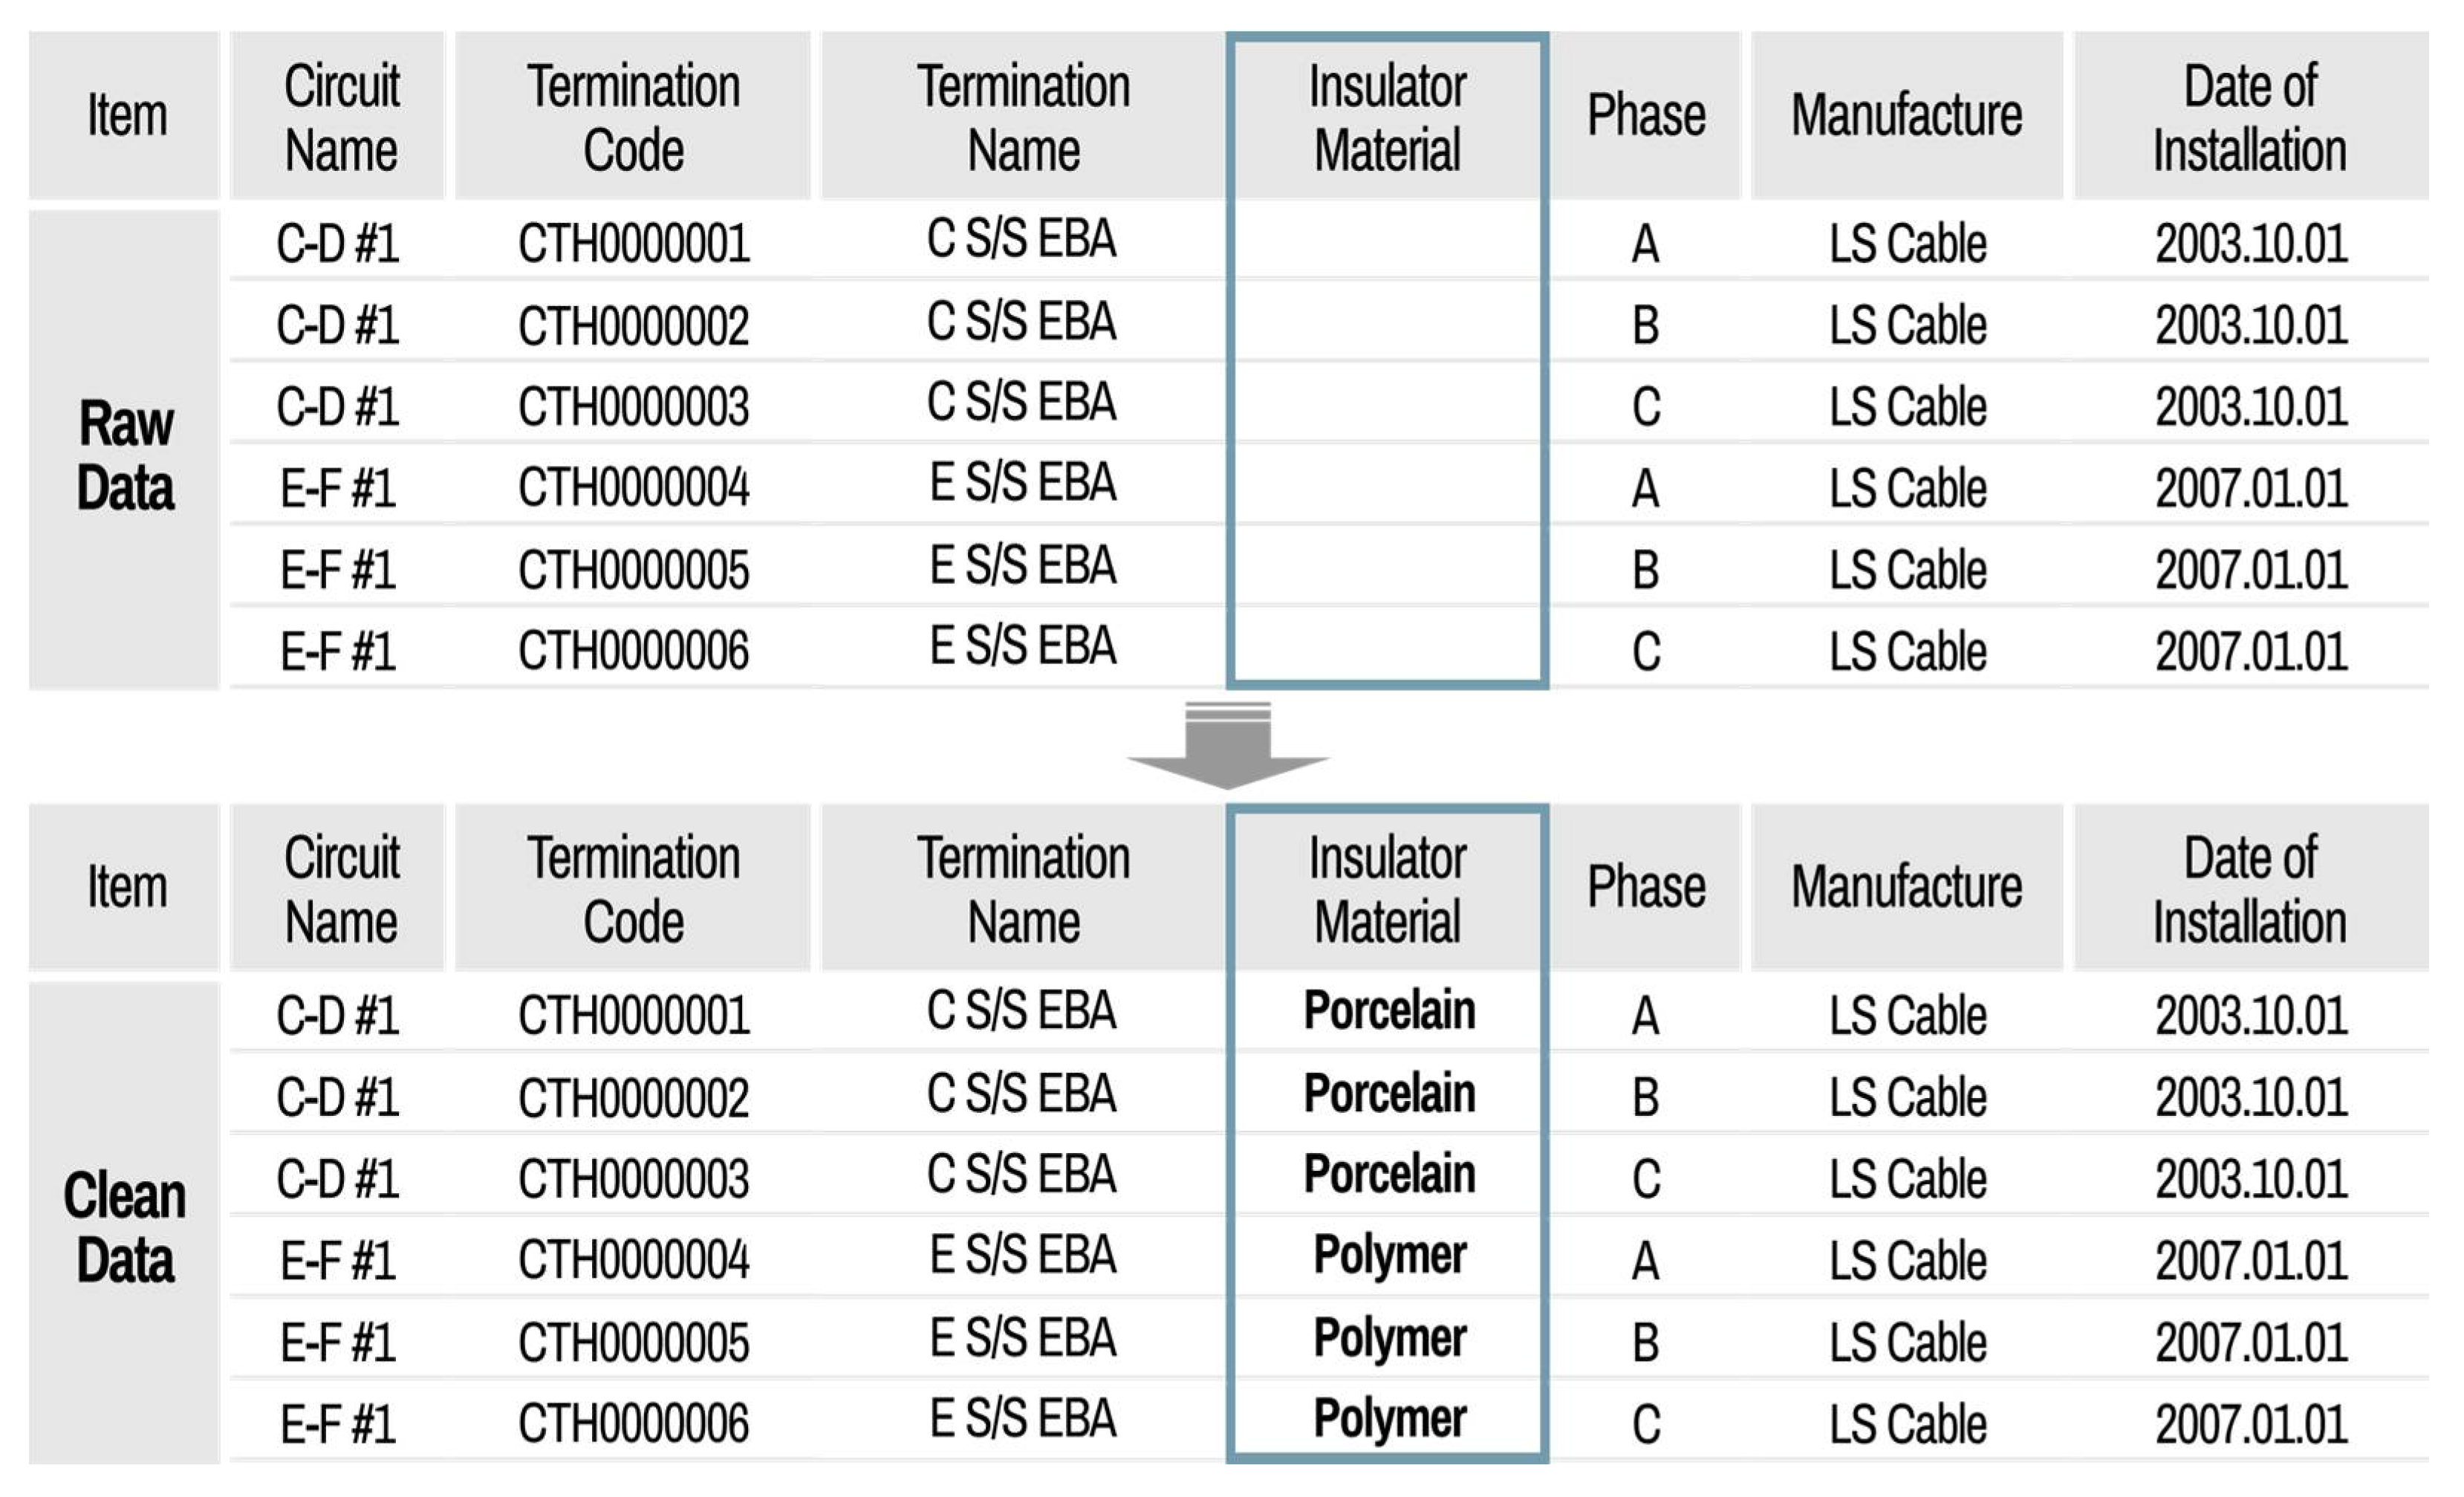
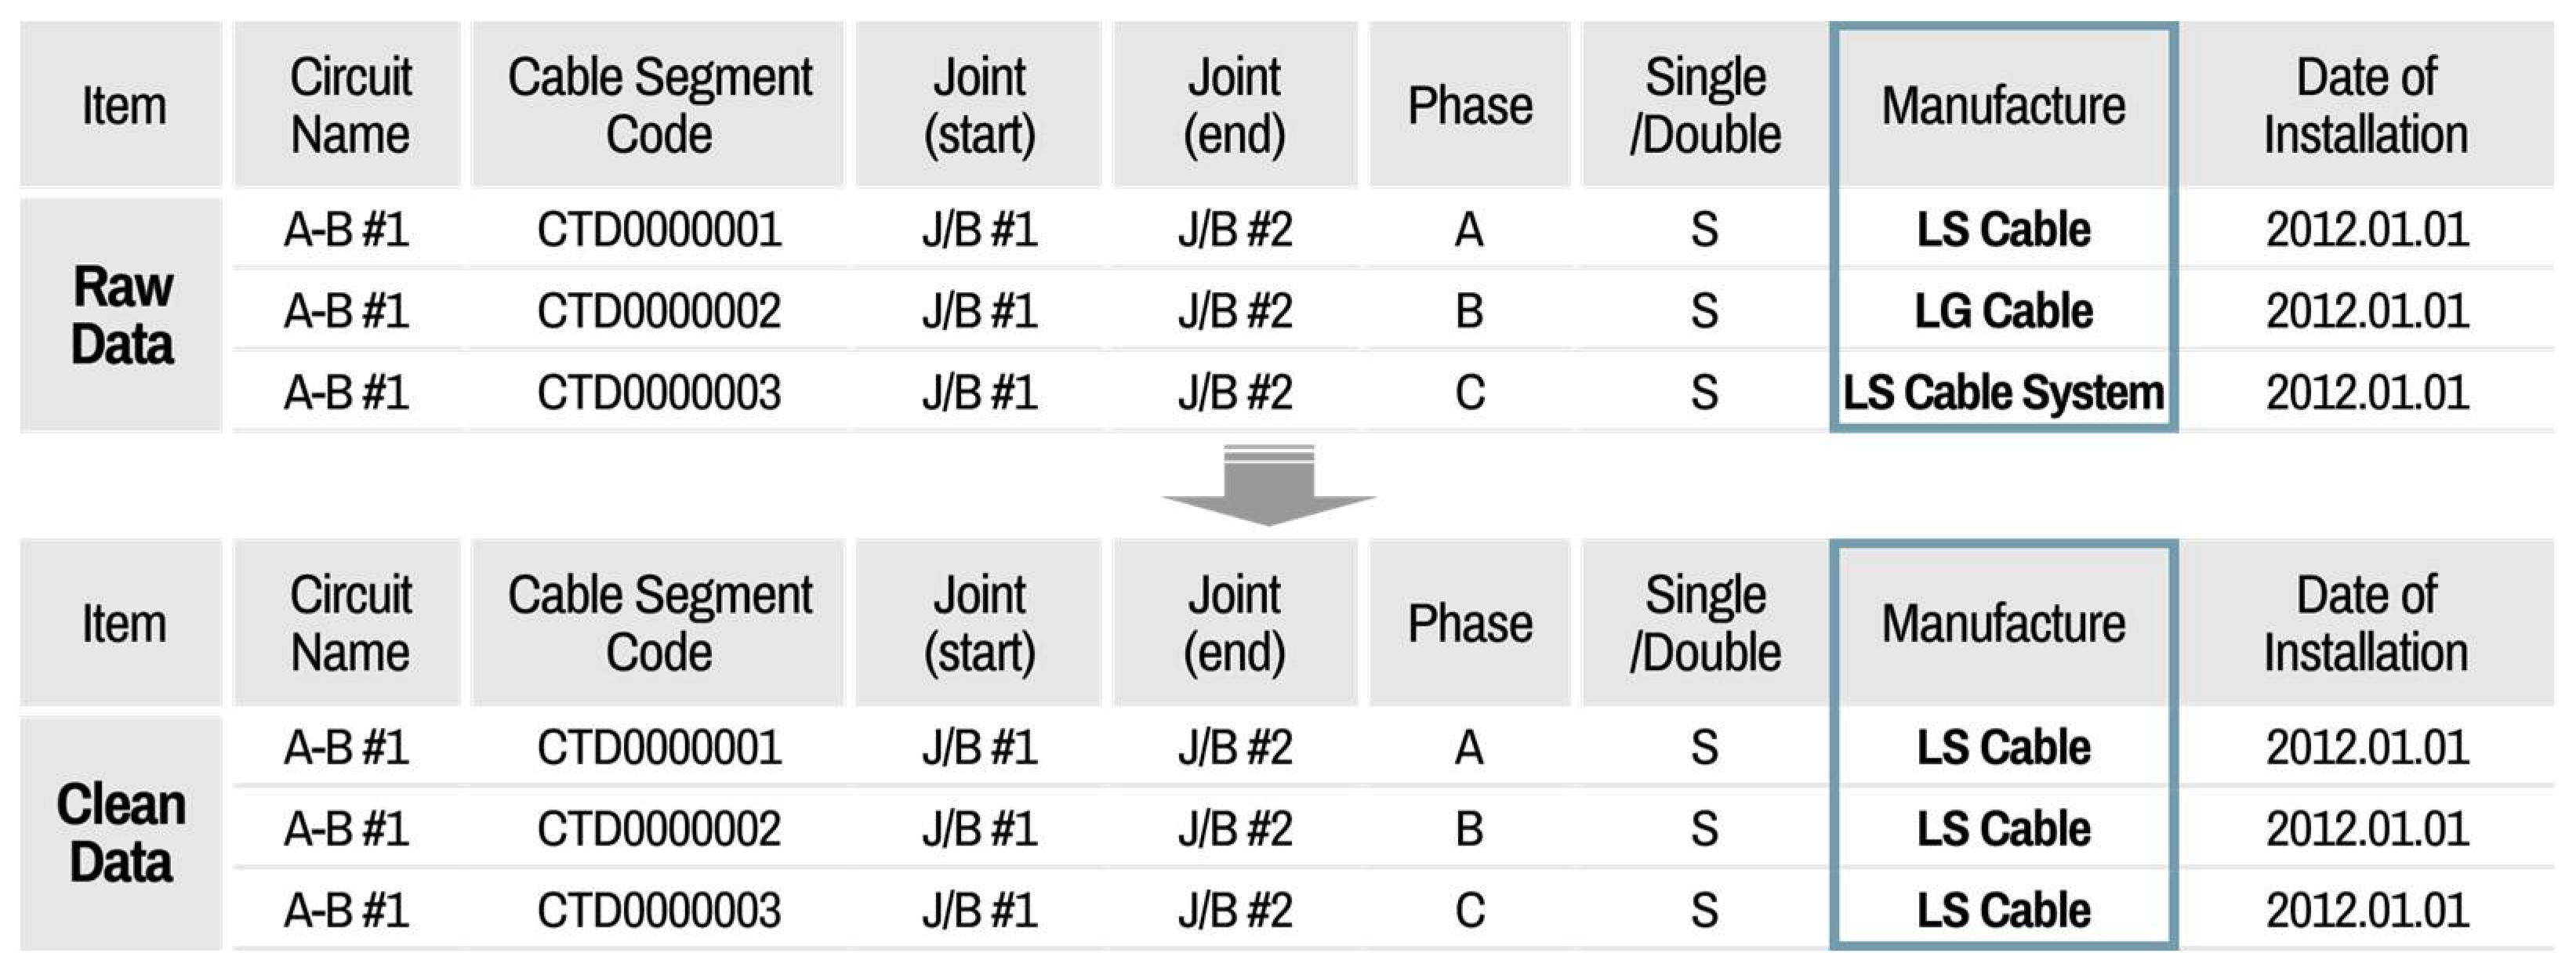
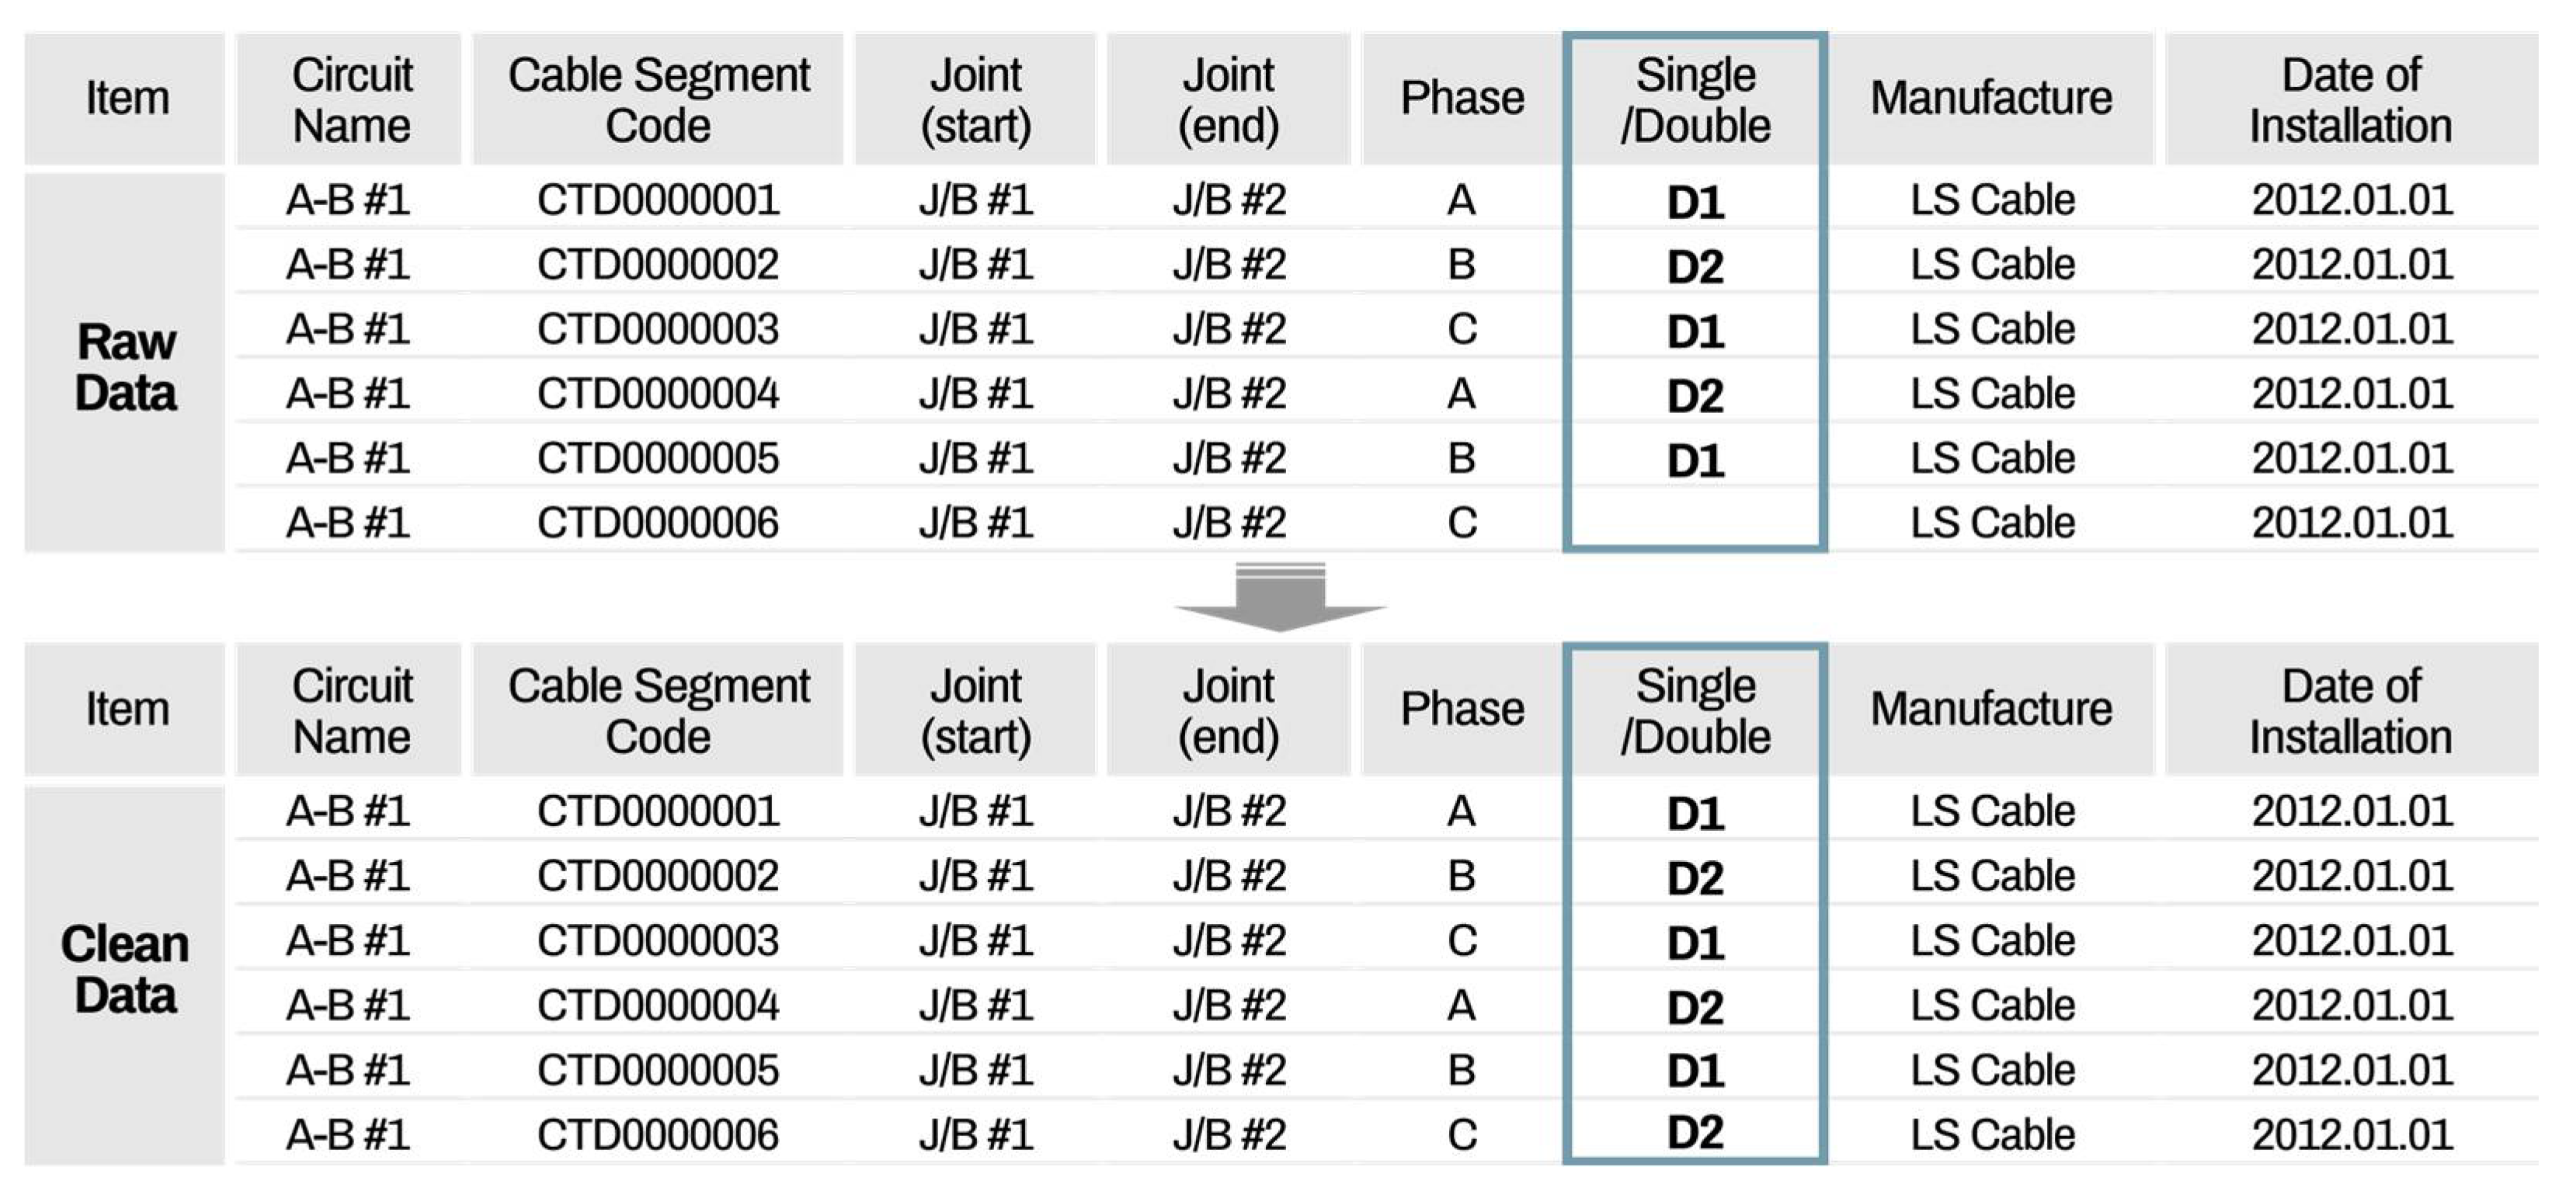
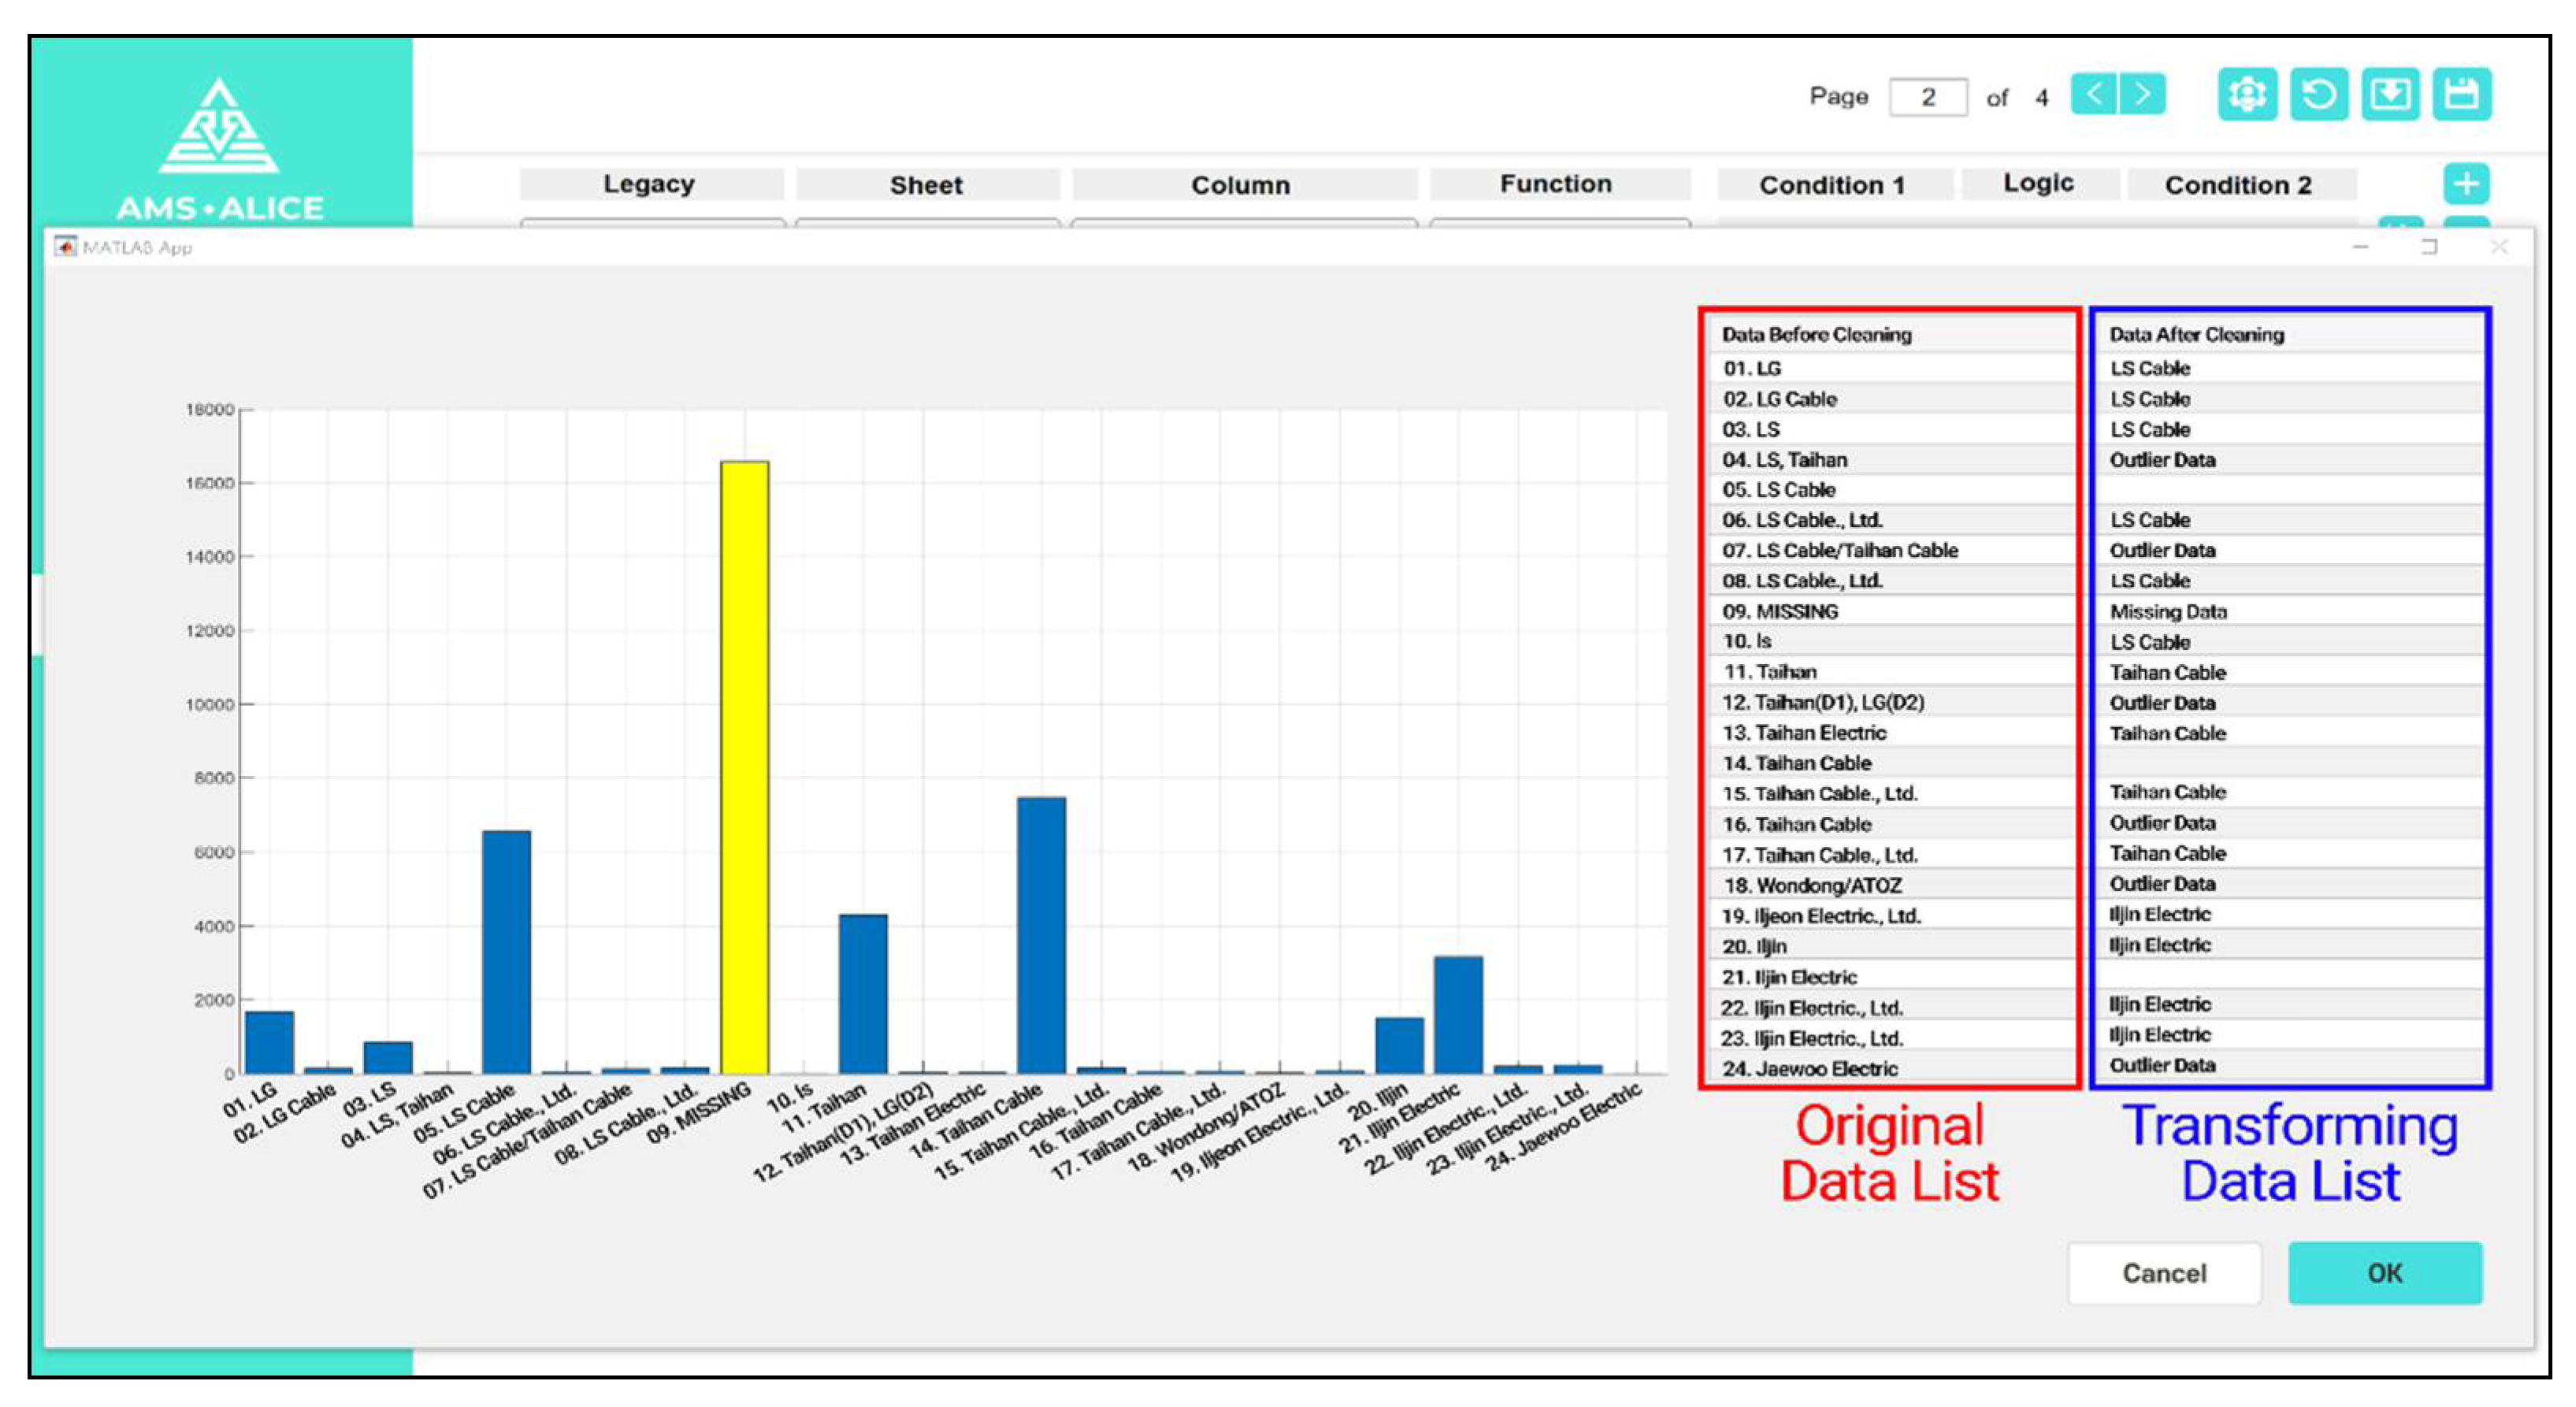
The main functions of the cleaning part include data cleaning, quality evaluation, and quality comparison analysis, before and after cleaning and exporting clean data. After loading all raw datasets from different information systems, a data cleaning setting is first implemented. The default mode, which is predefined by the system manager, can be set in the cleaning setting. If the user wants to have their own cleaning setting, then the properties can be revised by the user and saved as a file setting. This cleaning file setting can be imported at any time. When the default cleaning setting is set, the user can recognize the setting rules for each data attribute. For the manufacturer attribute, the transform function is applied. The present data status is shown in
Figure 15, which illustrates an example of a data cleaning setting using a transform function.
Users can find the histogram chart, including the missing and outlier data, with the naked eye, and then, the cleaning setting can be determined. In
Figure 15, the column displayed on the left indicates the type of data after reading the acquired file, and the column on the right is a location where the user writes the content to be transformed. The content in the original data list is automatically saved as it is transformed when the user enters the desired data in the transforming data list.
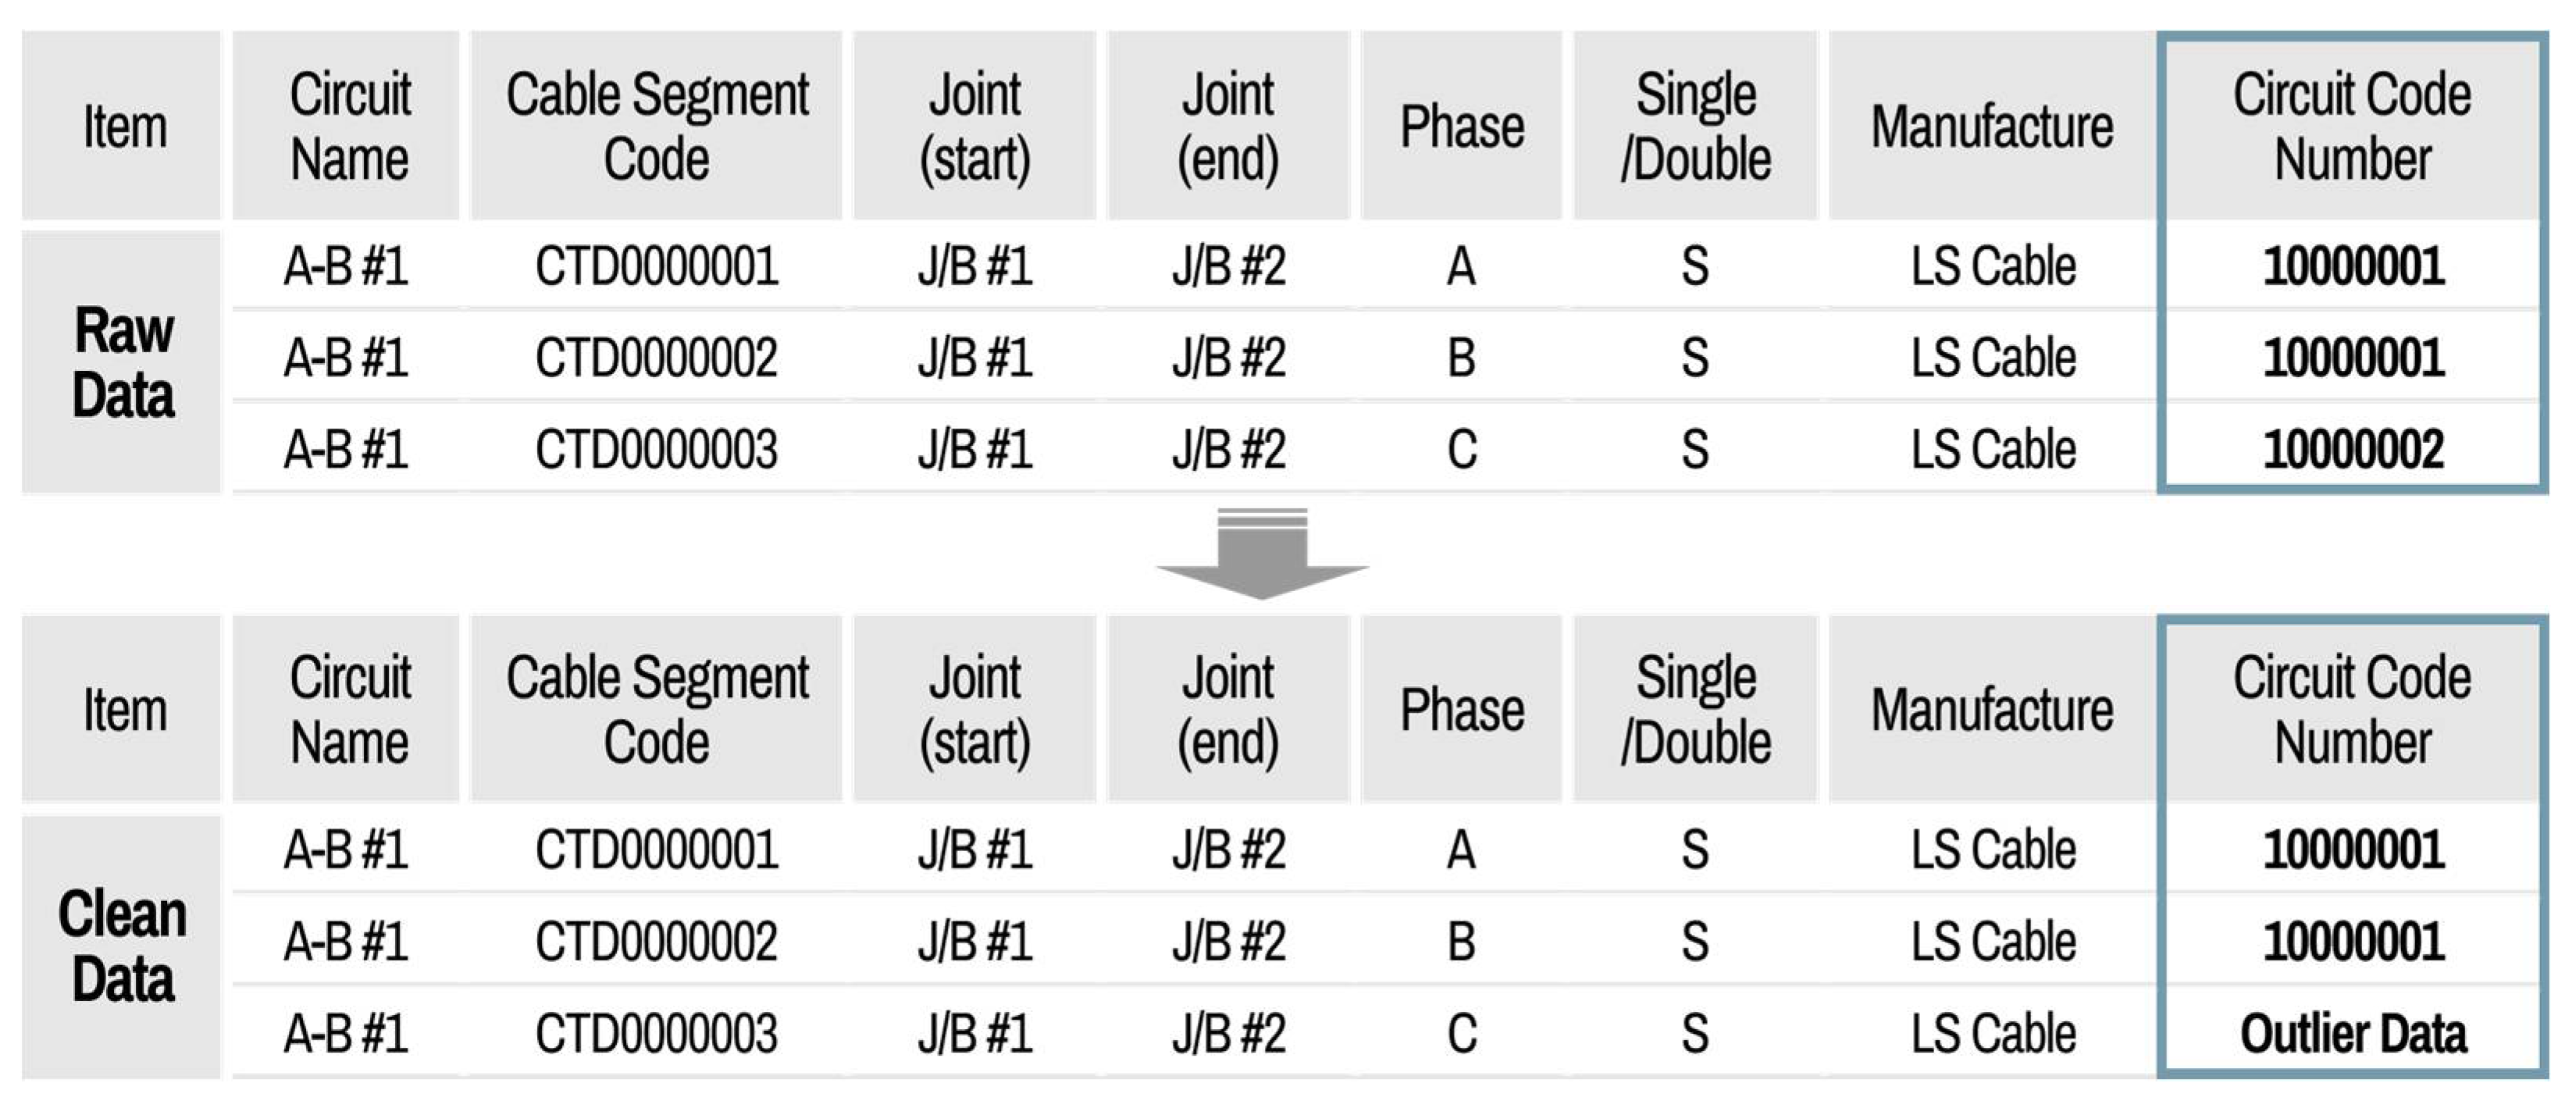
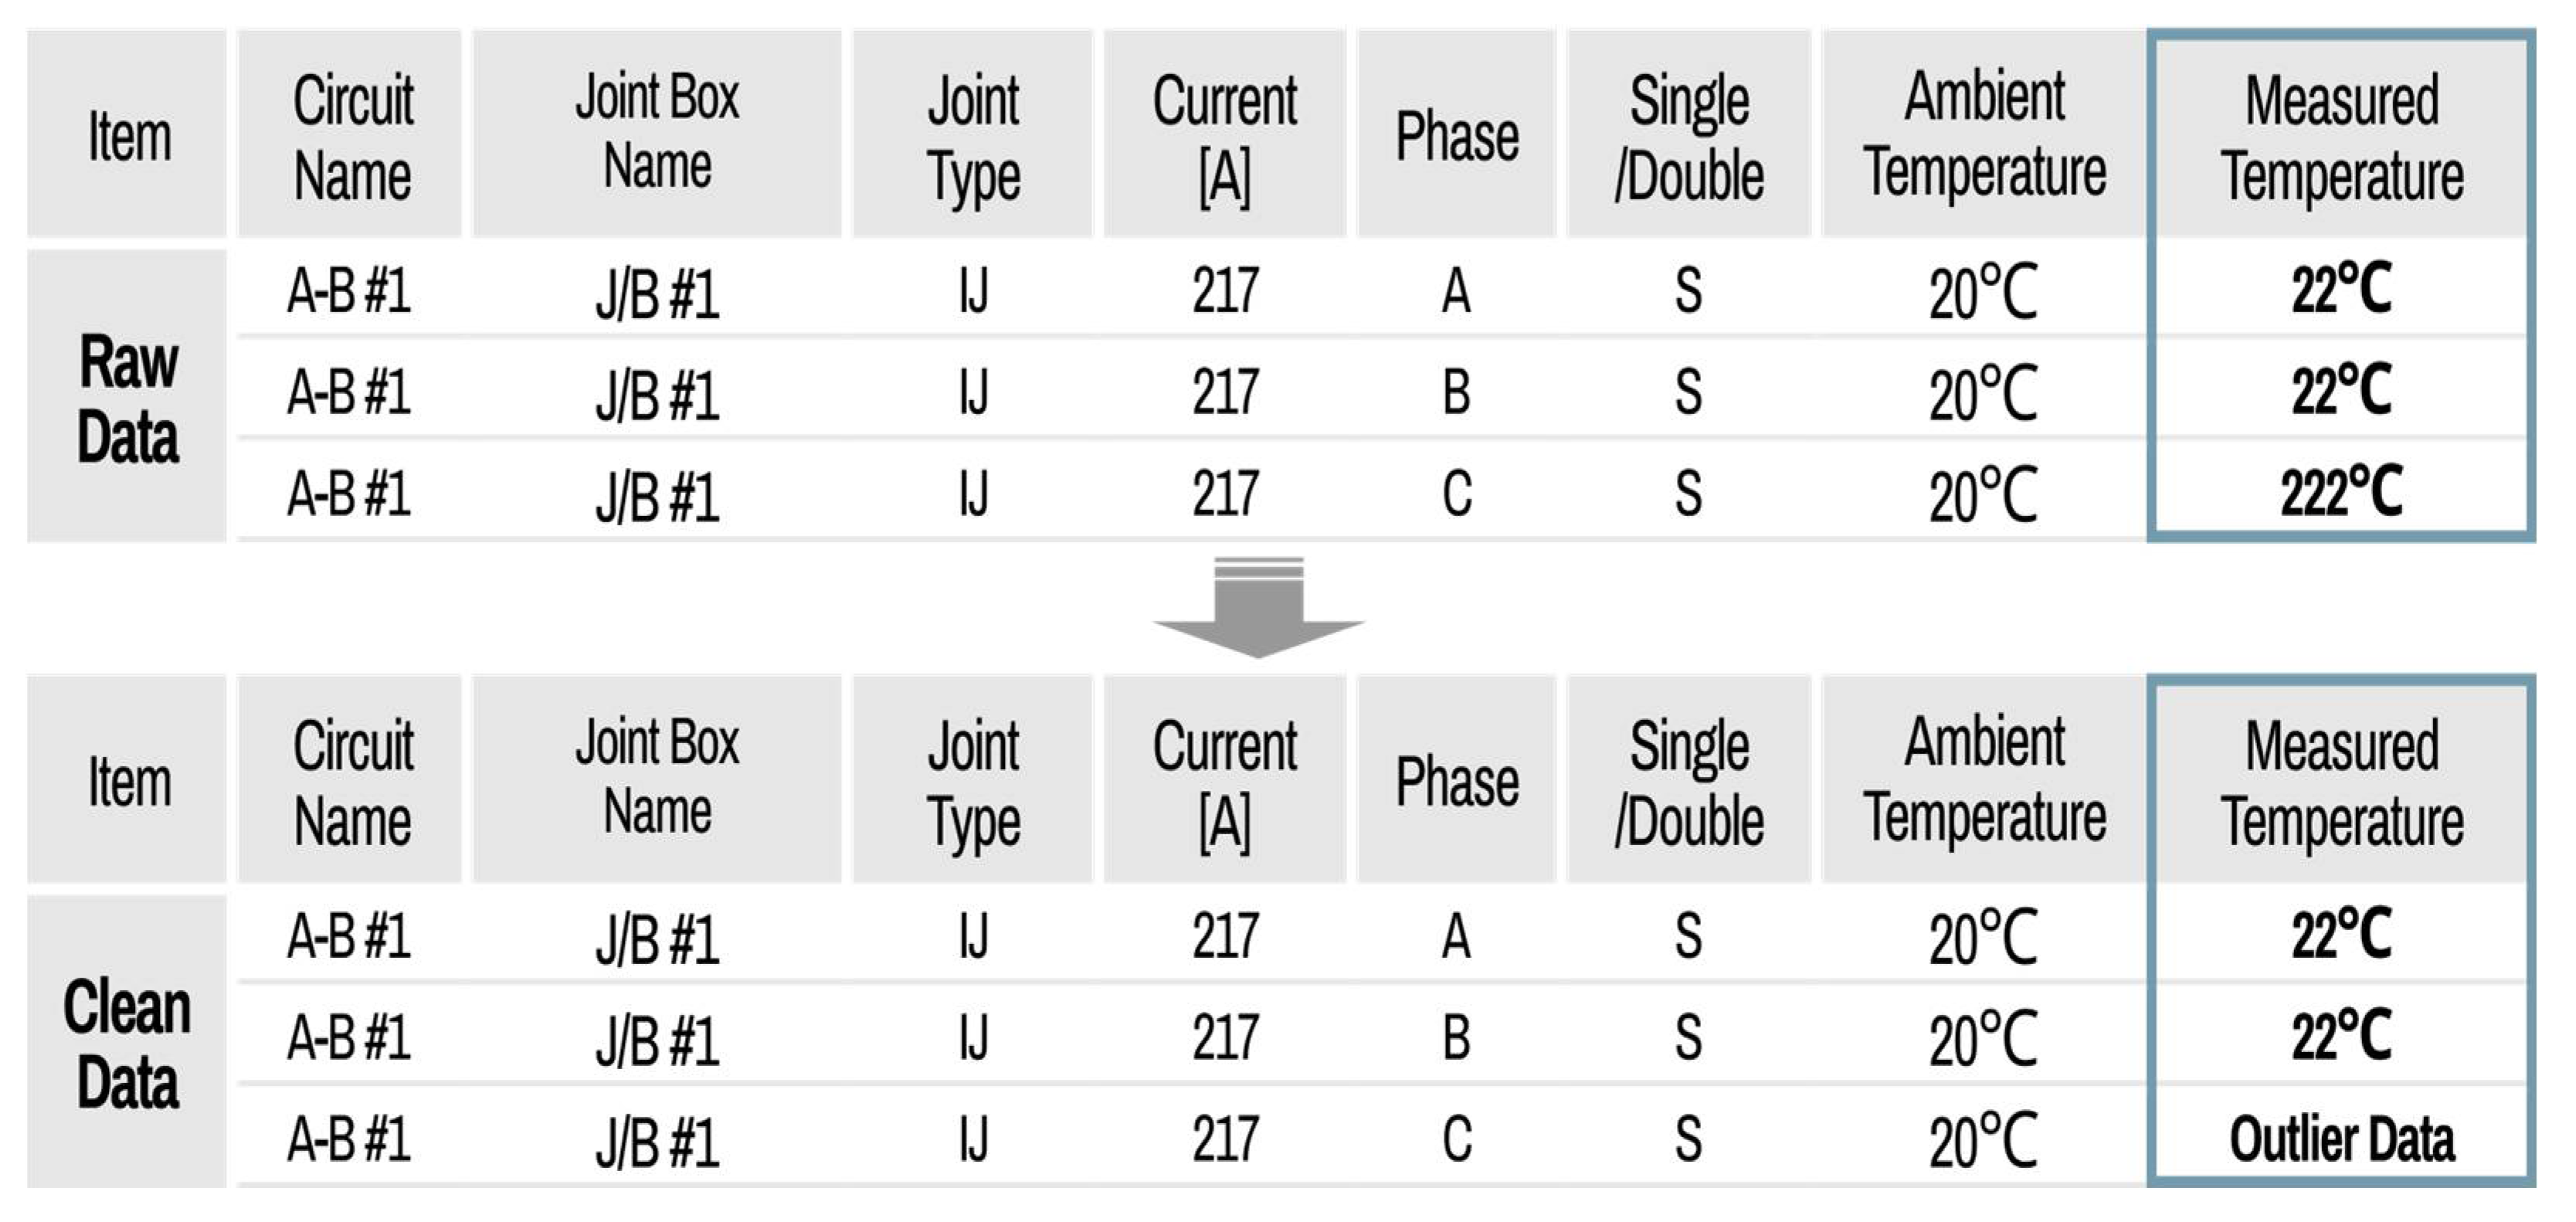
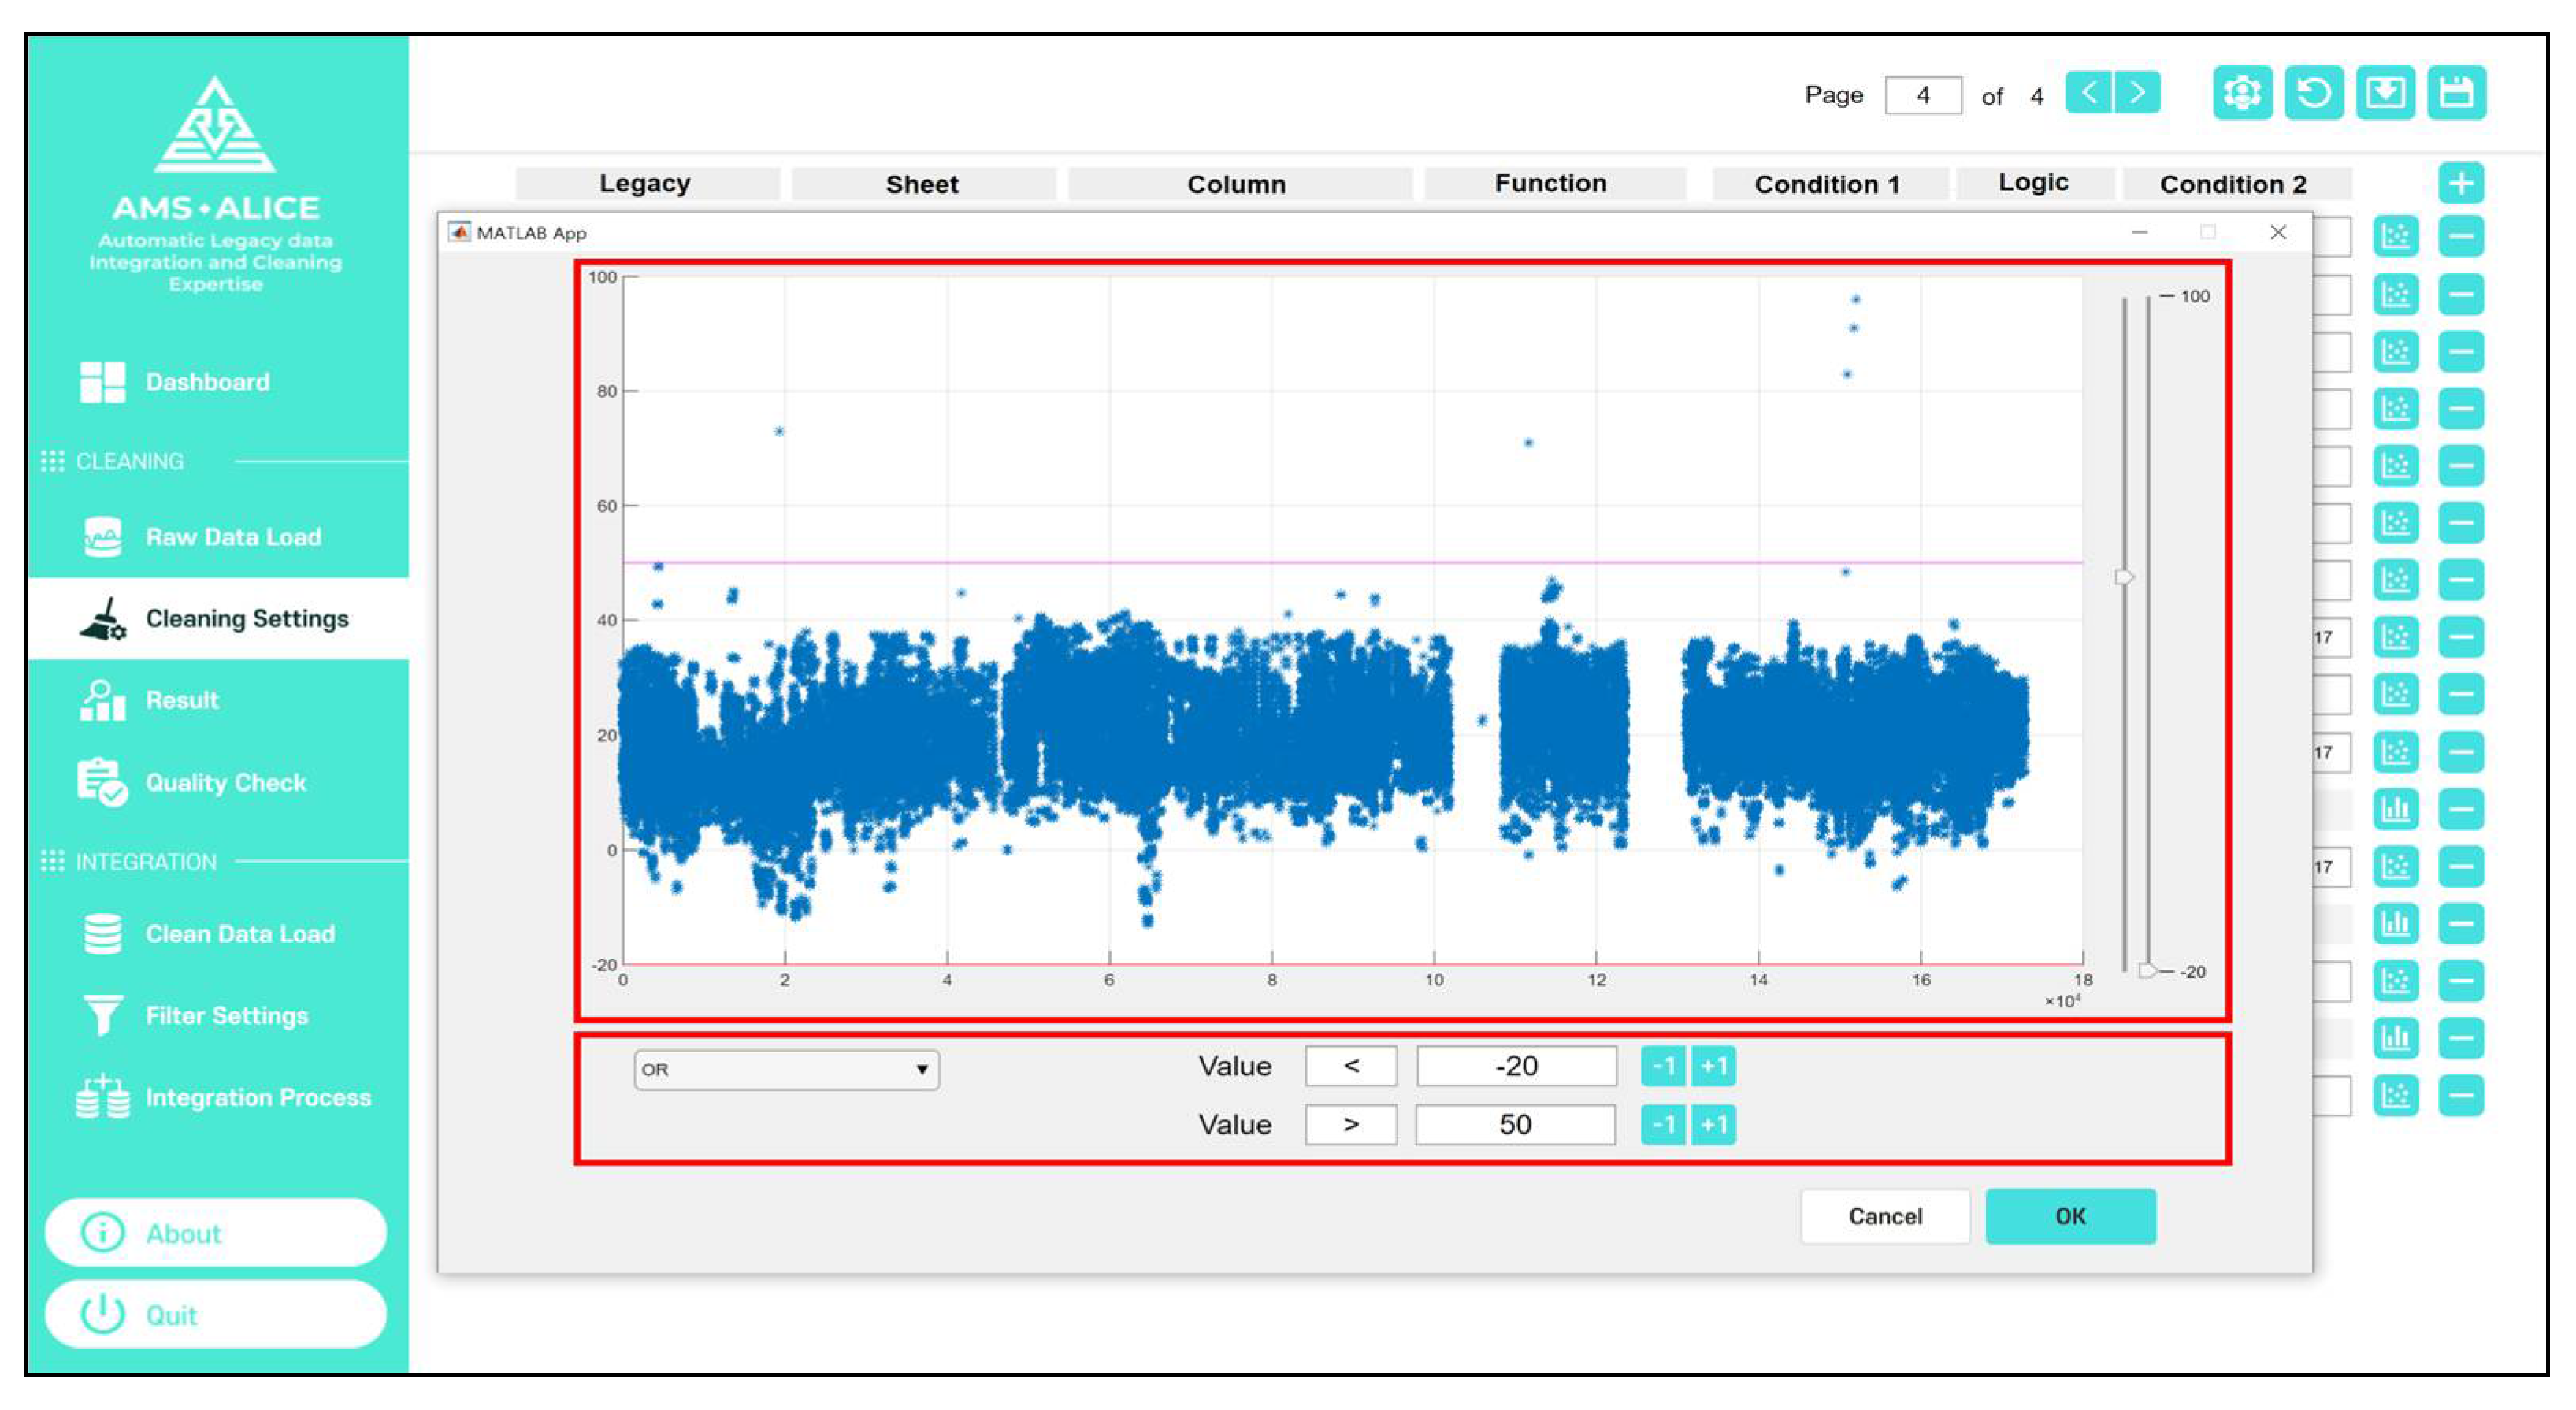
Figure 16 shows an example of a data cleaning setting using the criteria function. In the case of measurement data attributes for cable diagnosis, the criteria function is applied, and a scatter plot is used to define the boundary levels to distinguish the normal and outlier data. The data between boundary levels are recognized with normal data, and the other cases are outlier data.
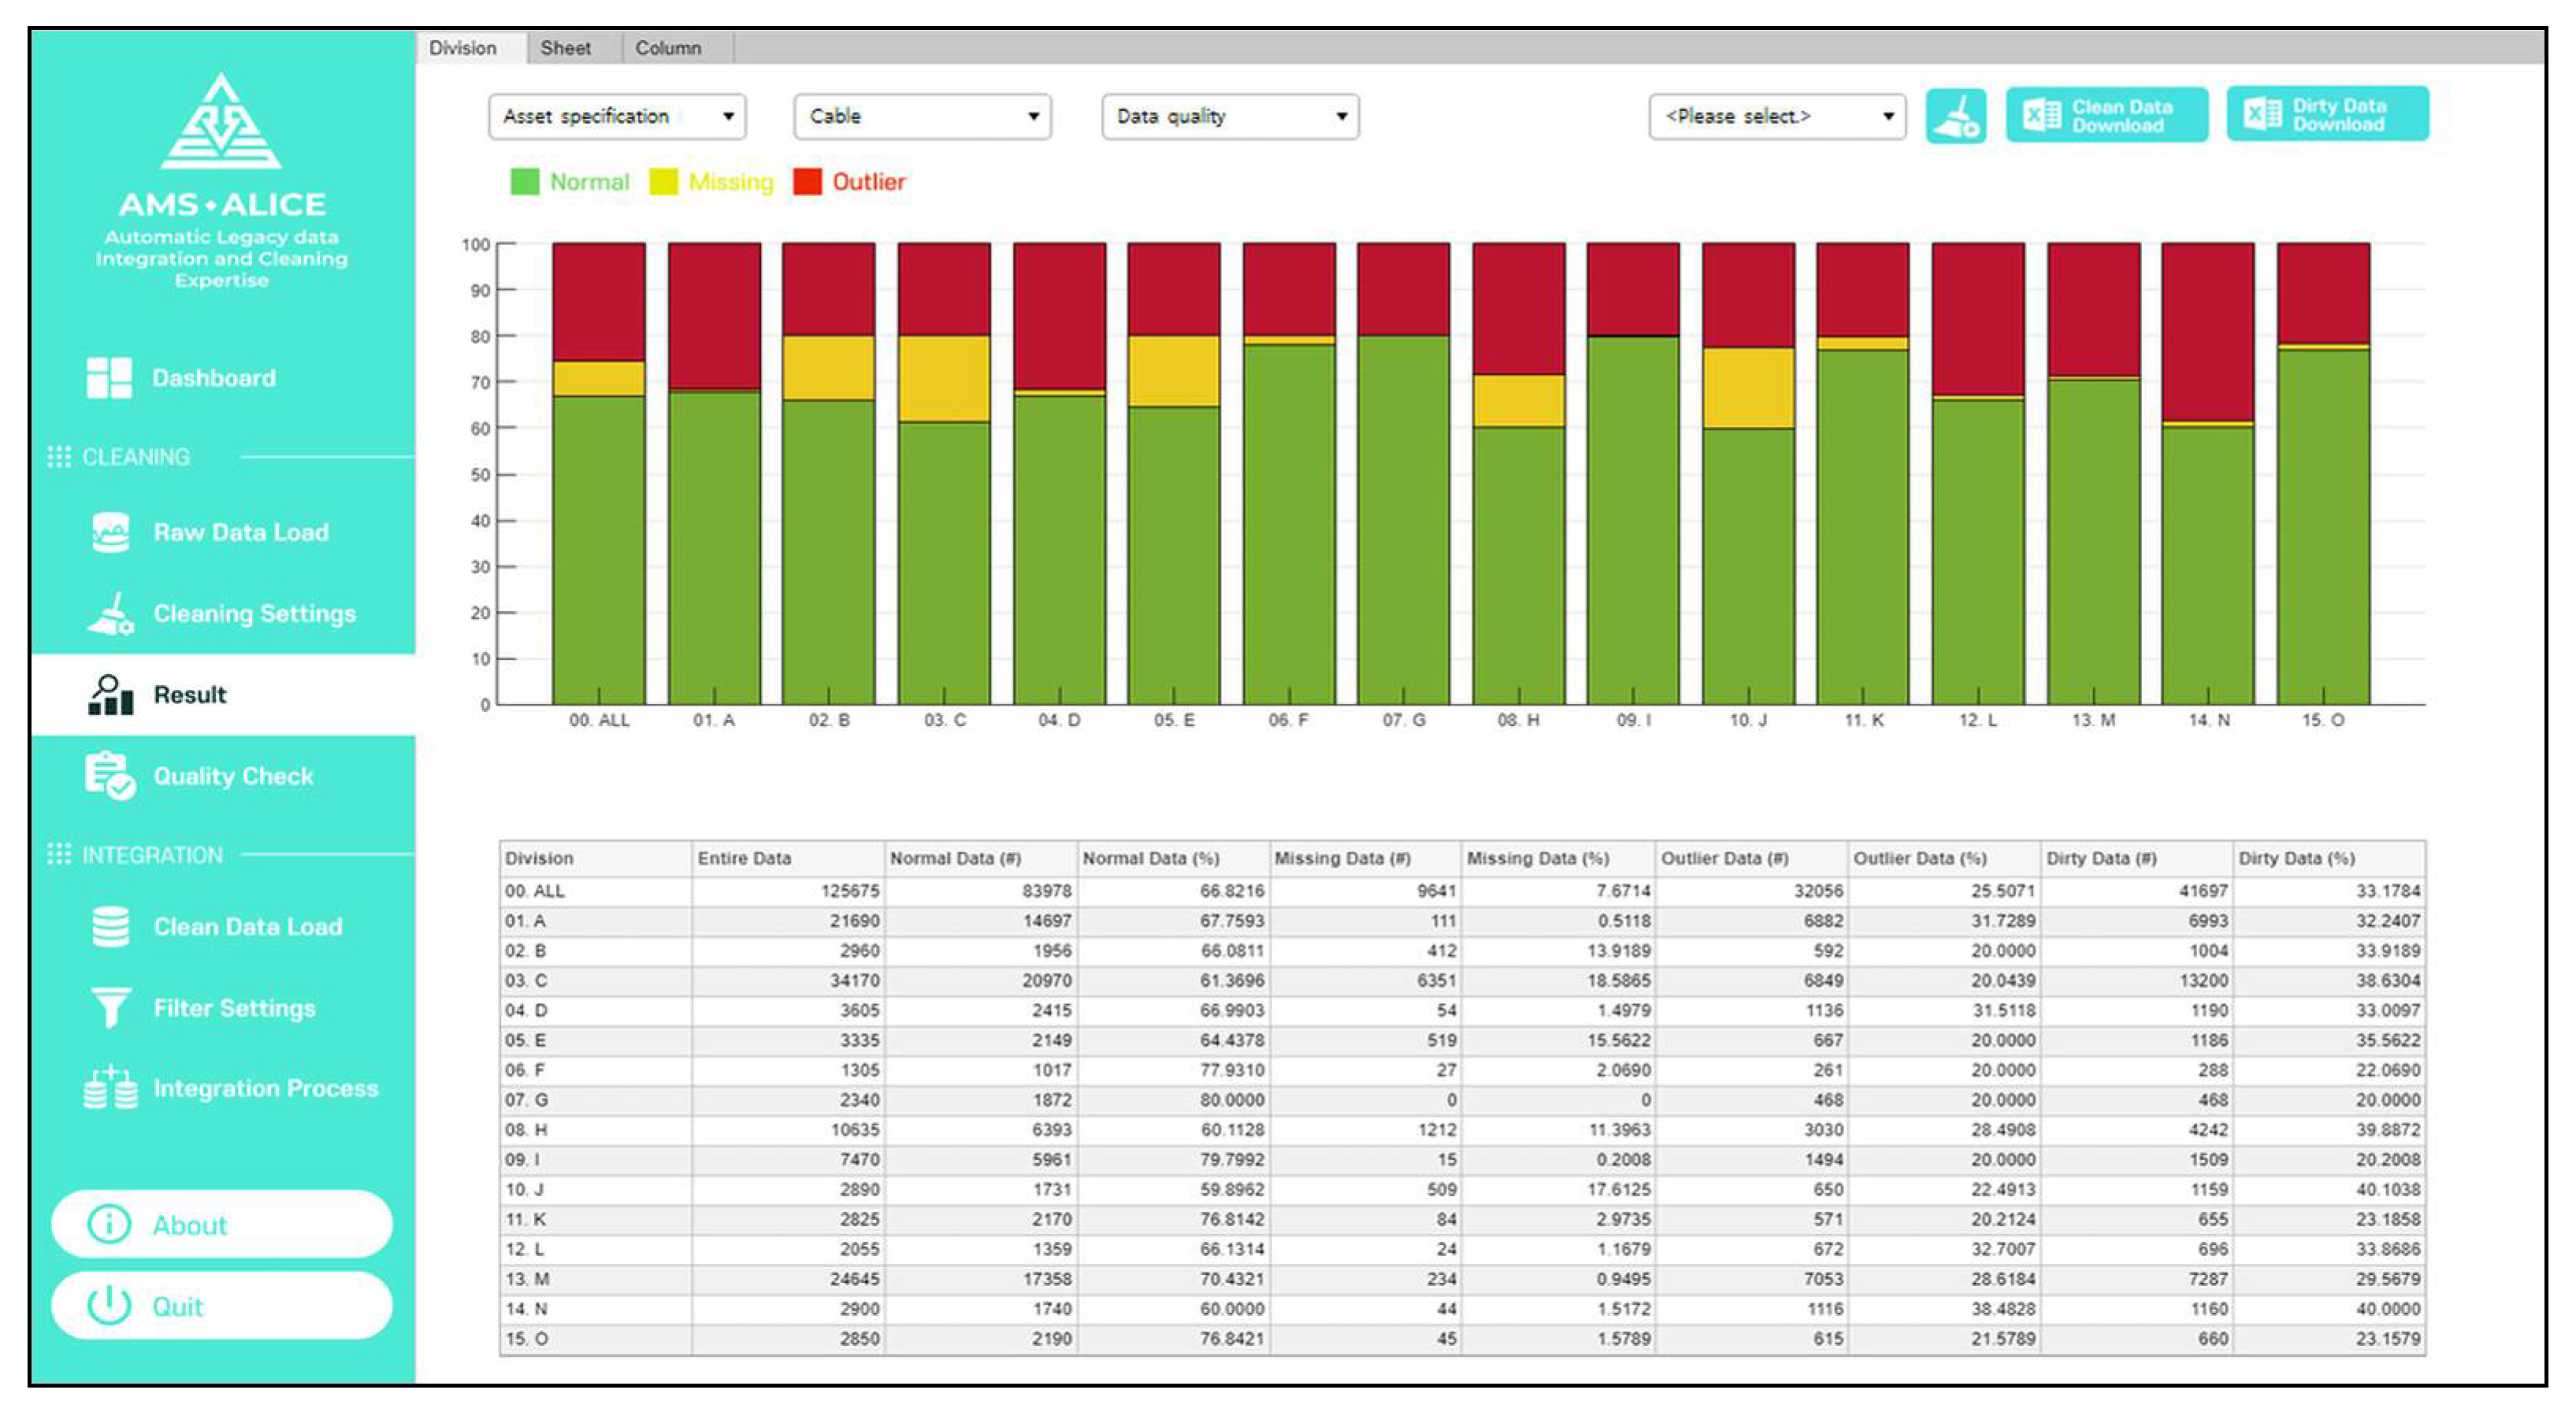
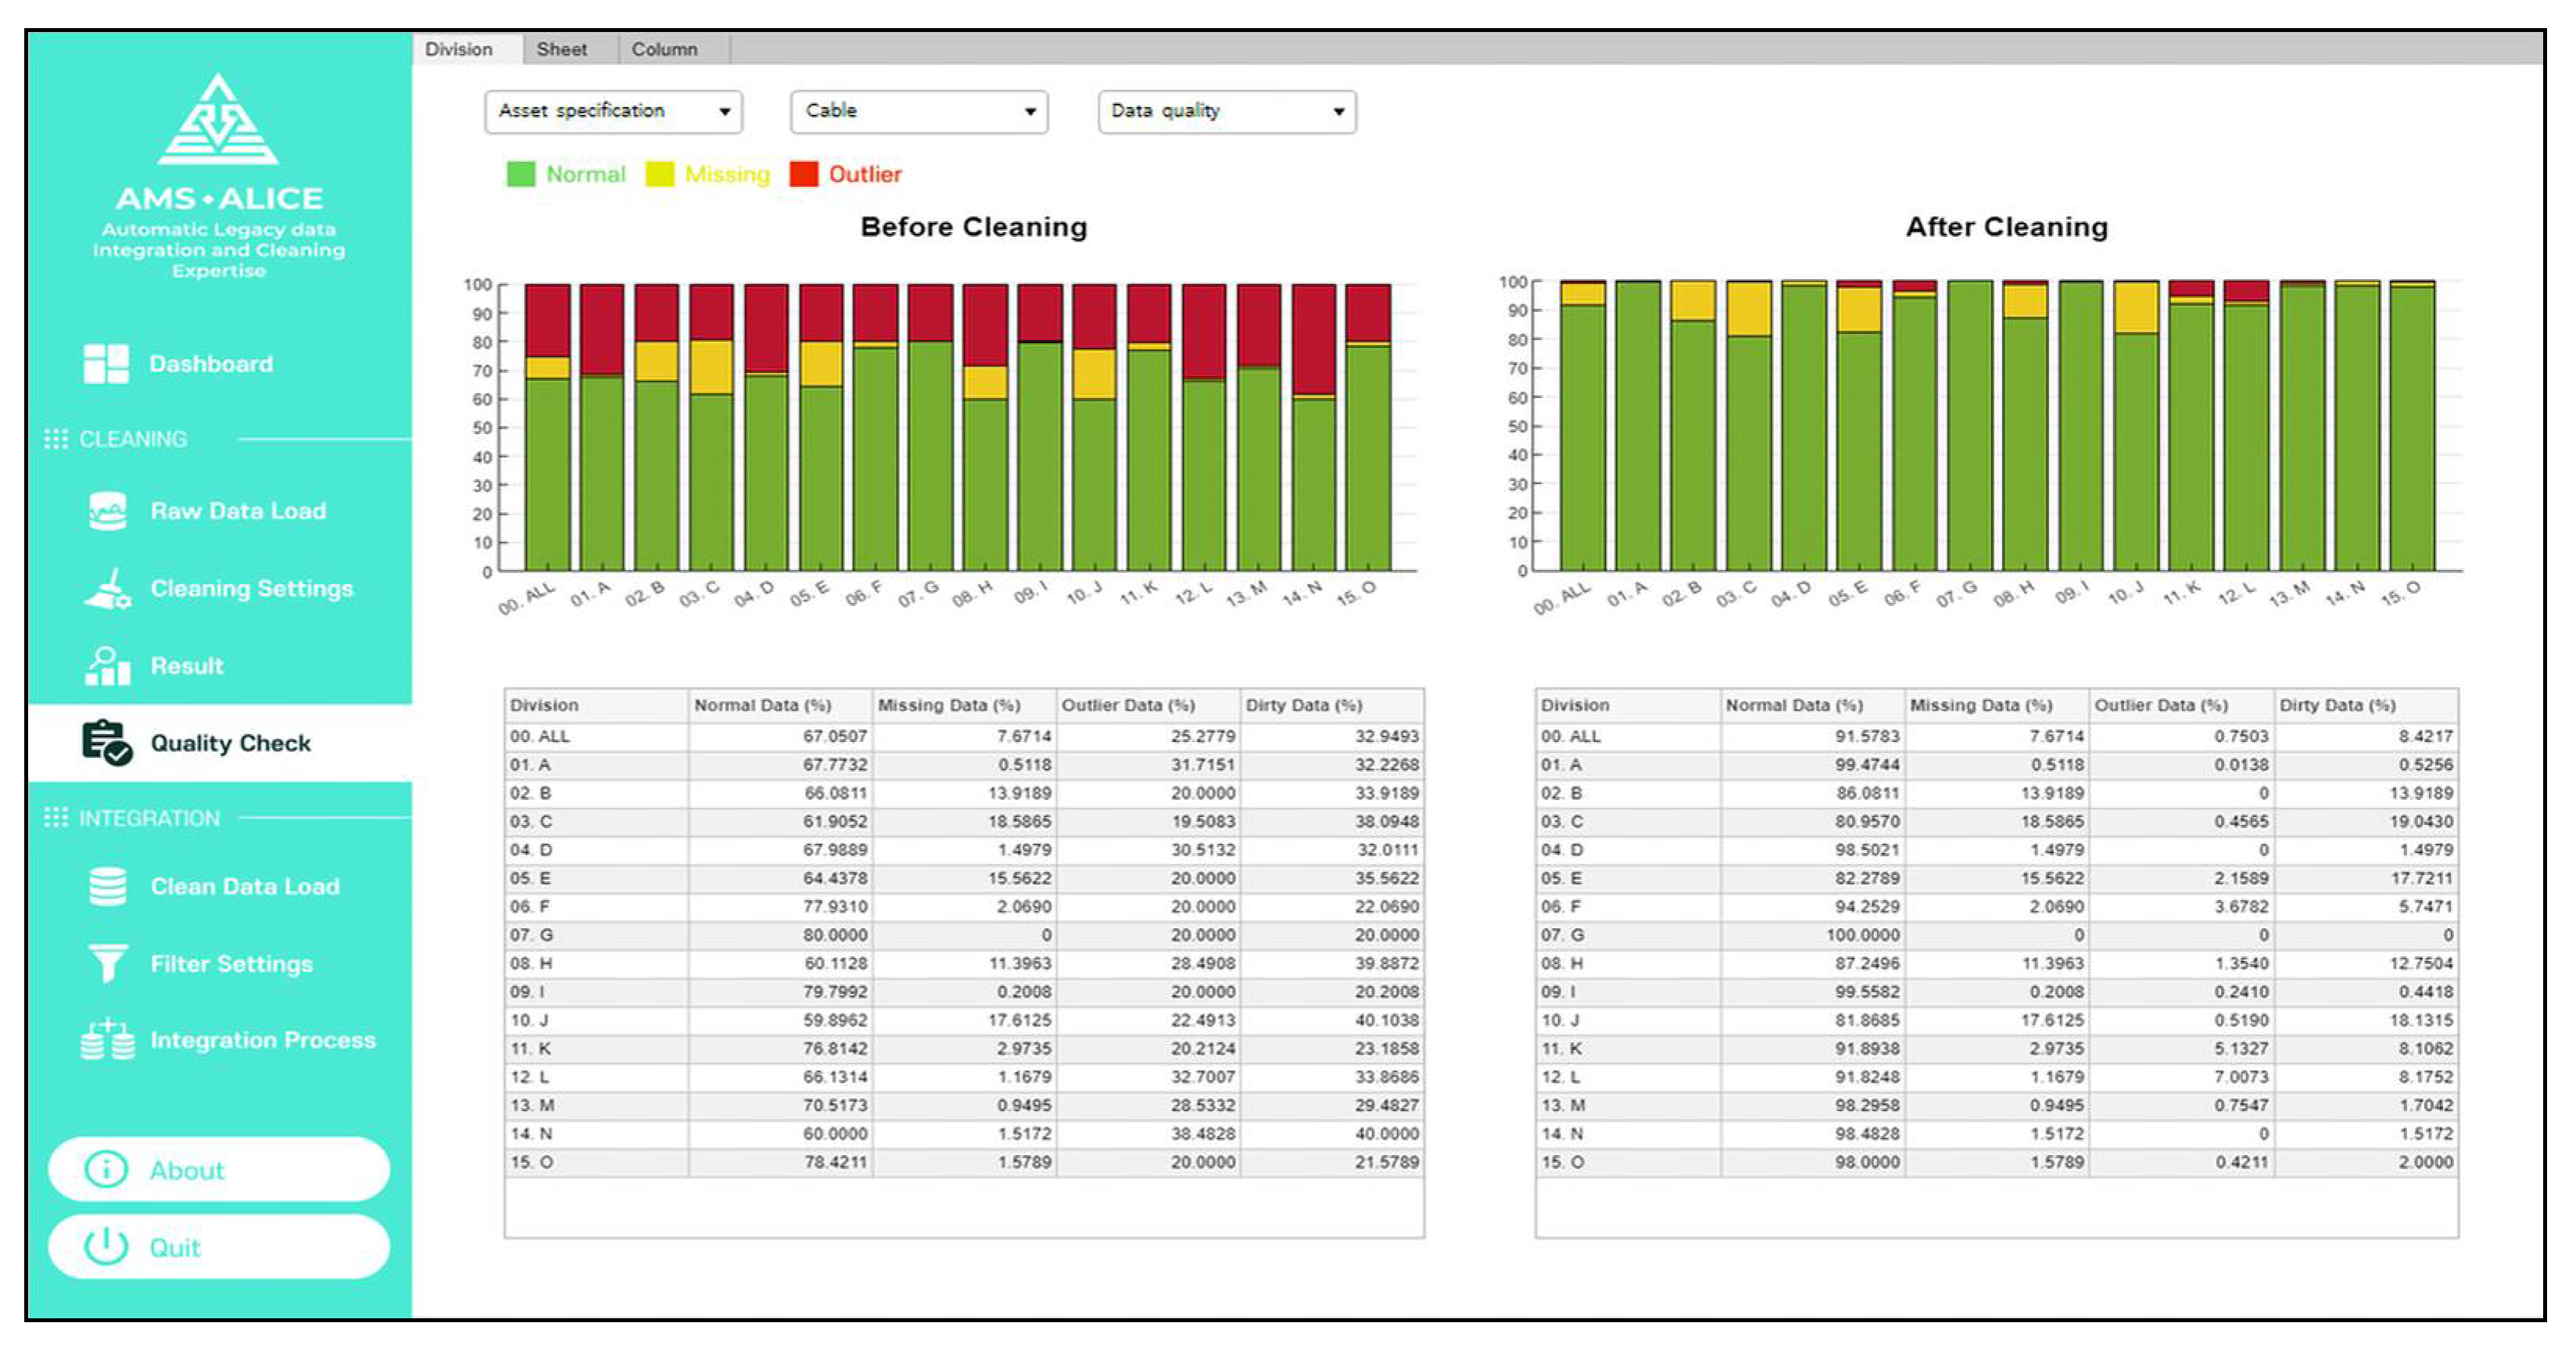
After the setting, the data quality is evaluated as a percentage by processing the cleaning. Visualized data quality checks according to the entire view, different divisions, and data attributes can be determined, as shown in
Figure 17, where the percentages of normal data, missing data, and outliers are 68%, 8%, and 24% of the total data (green, yellow, and red bars, respectively). From the results of data quality, users can find the dirty data list and identify which data attribute should be cleaned quickly from an overall perspective.
To clean the data attribute, the dataset containing only the dirty data and index can be exported to a spreadsheet file. The user can clean the dirty data comprising missing and outlier data in the file. After loading the dirty data, the cleaned data is overwritten at the location of the dirty data among the entire dataset, and then, the cleaning process is repeated. In the quality check, the user can see the quantitative data accuracy changes before and after cleaning, as shown in
Figure 18. If the data quality does not meet the user’s target specification, these processes can be repeated to improve the data accuracy.
5.2. Detailed Functions of Data Integration Part
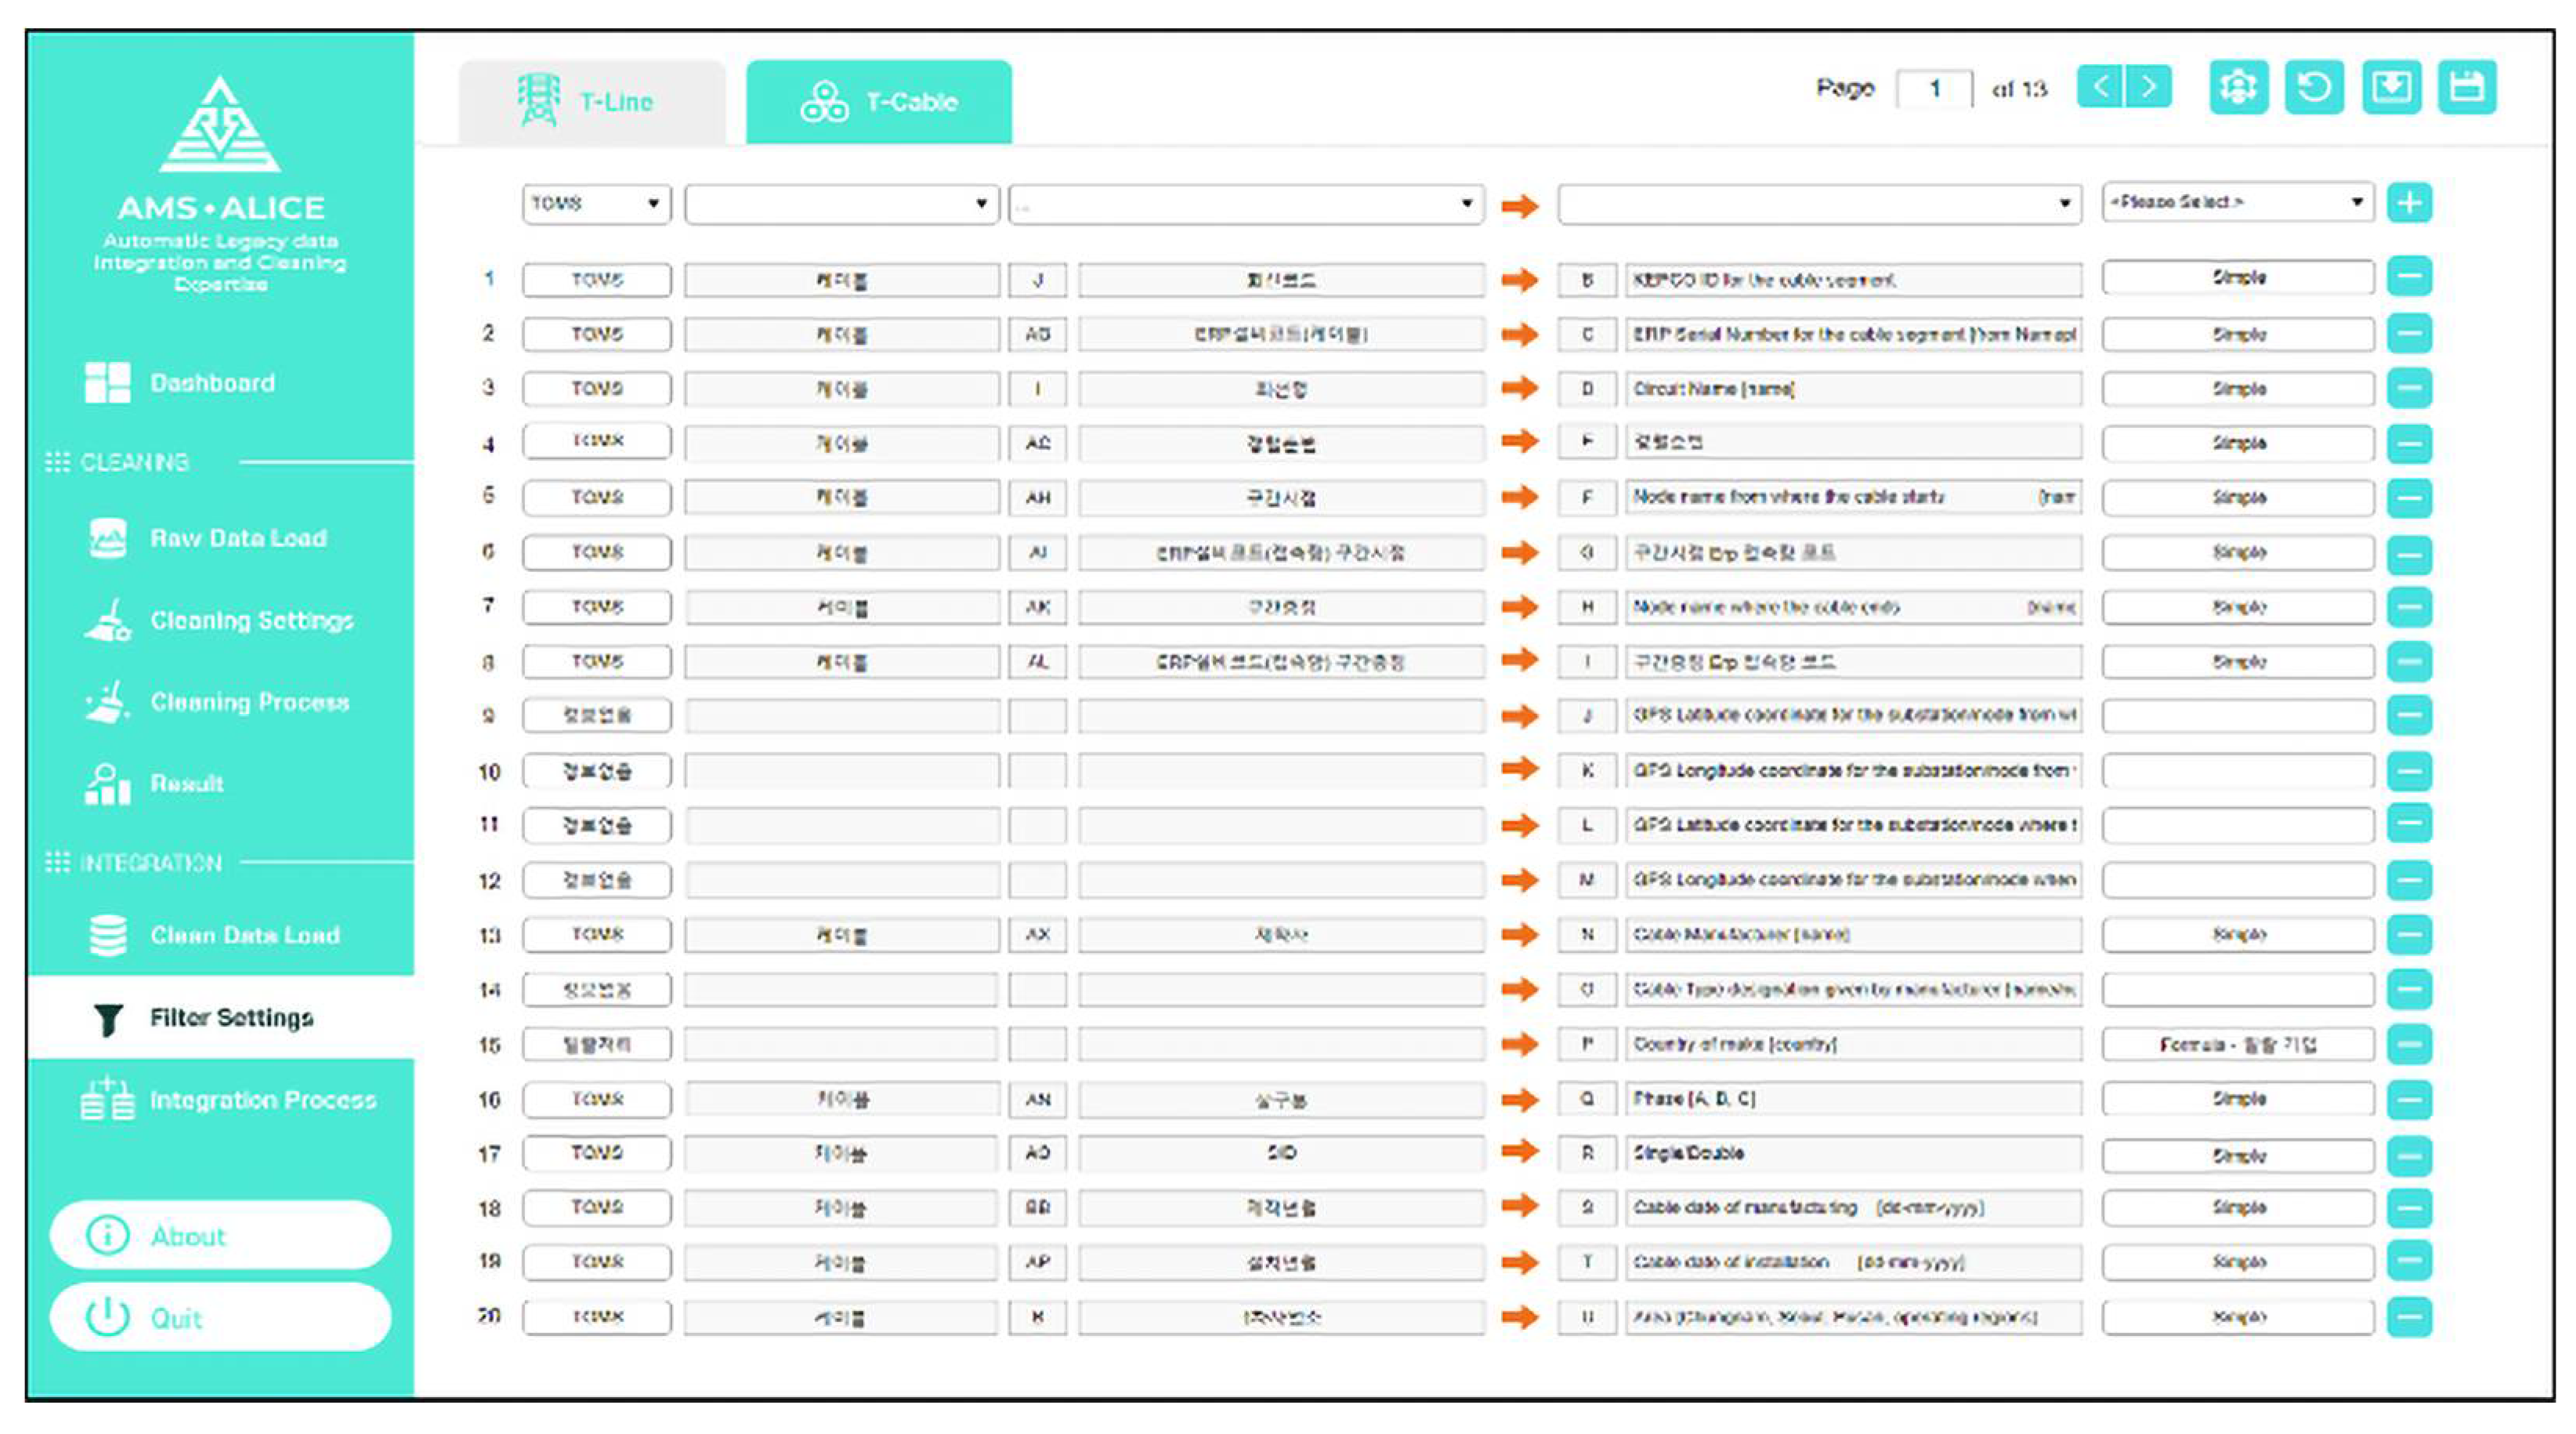
The main functions of the integration part include data filter setting, integration processing, and export of the asset data template. After loading all the clean datasets from different information systems, the filter setting is first carried out. Similar to the cleaning part, the default mode, which is predefined by the system manager, can be set in the filter setting. The filter setting has lists composed of left original data columns and right integration data columns, as shown in
Figure 19; these are from–to the data list.
In this process, the user can select one filter among various filters, such as a simple move, formula, and link function. The user can check the detailed contents of the integration filters. If the user wants to have a customized integration filter setting, then the properties can be modified by the user and saved as a custom setting file. This filter setting file can be called up at any time. When the integration setting is ready, the data integration processes can be executed and exported as an integrated file of the asset data template.
5.3. Demonstration Experience
The advantage of the developed system is that it is possible to output various asset data templates according to the preset filter settings, and it is very efficient in saving time owing to the automation process. When these cleaning and integration tasks are done with automation, the turnaround time can be drastically reduced to within approximately one day, compared to the manual method, which takes several months.
This system has been demonstrated for cleaning and integration in the asset management of electric power equipment. From the demonstration results of data cleaning, the legacy data accuracy increased from approximately 70% to over 91% as seen in
Figure 18. Because the cleaning data with average or regression values without the verification of a manager may lead to different results, it is difficult to clean it with only an automatic cleaning algorithm. For this reason, the legacy system manager has to manually check the cleaned data values derived by the automatic cleaning algorithm.
This system can reduce the turnaround time from several months to within a week. The processing time of these tasks depends on the cleaning time, and correcting the original data depends on on-site operators who need to confirm the data correction, as it is the responsibility of the department of equipment operation. For the case of integration tasks, the asset data templates for 15 area divisions have been integrated easily and quickly, and the turnaround time was reduced from several months to a day. In conclusion, this automatic legacy data cleaning and integration system, though simple, has very powerful functions in increasing the efficiency of data preparation for asset management.
5.4. Data Cleaning Effects on Risk Matrix
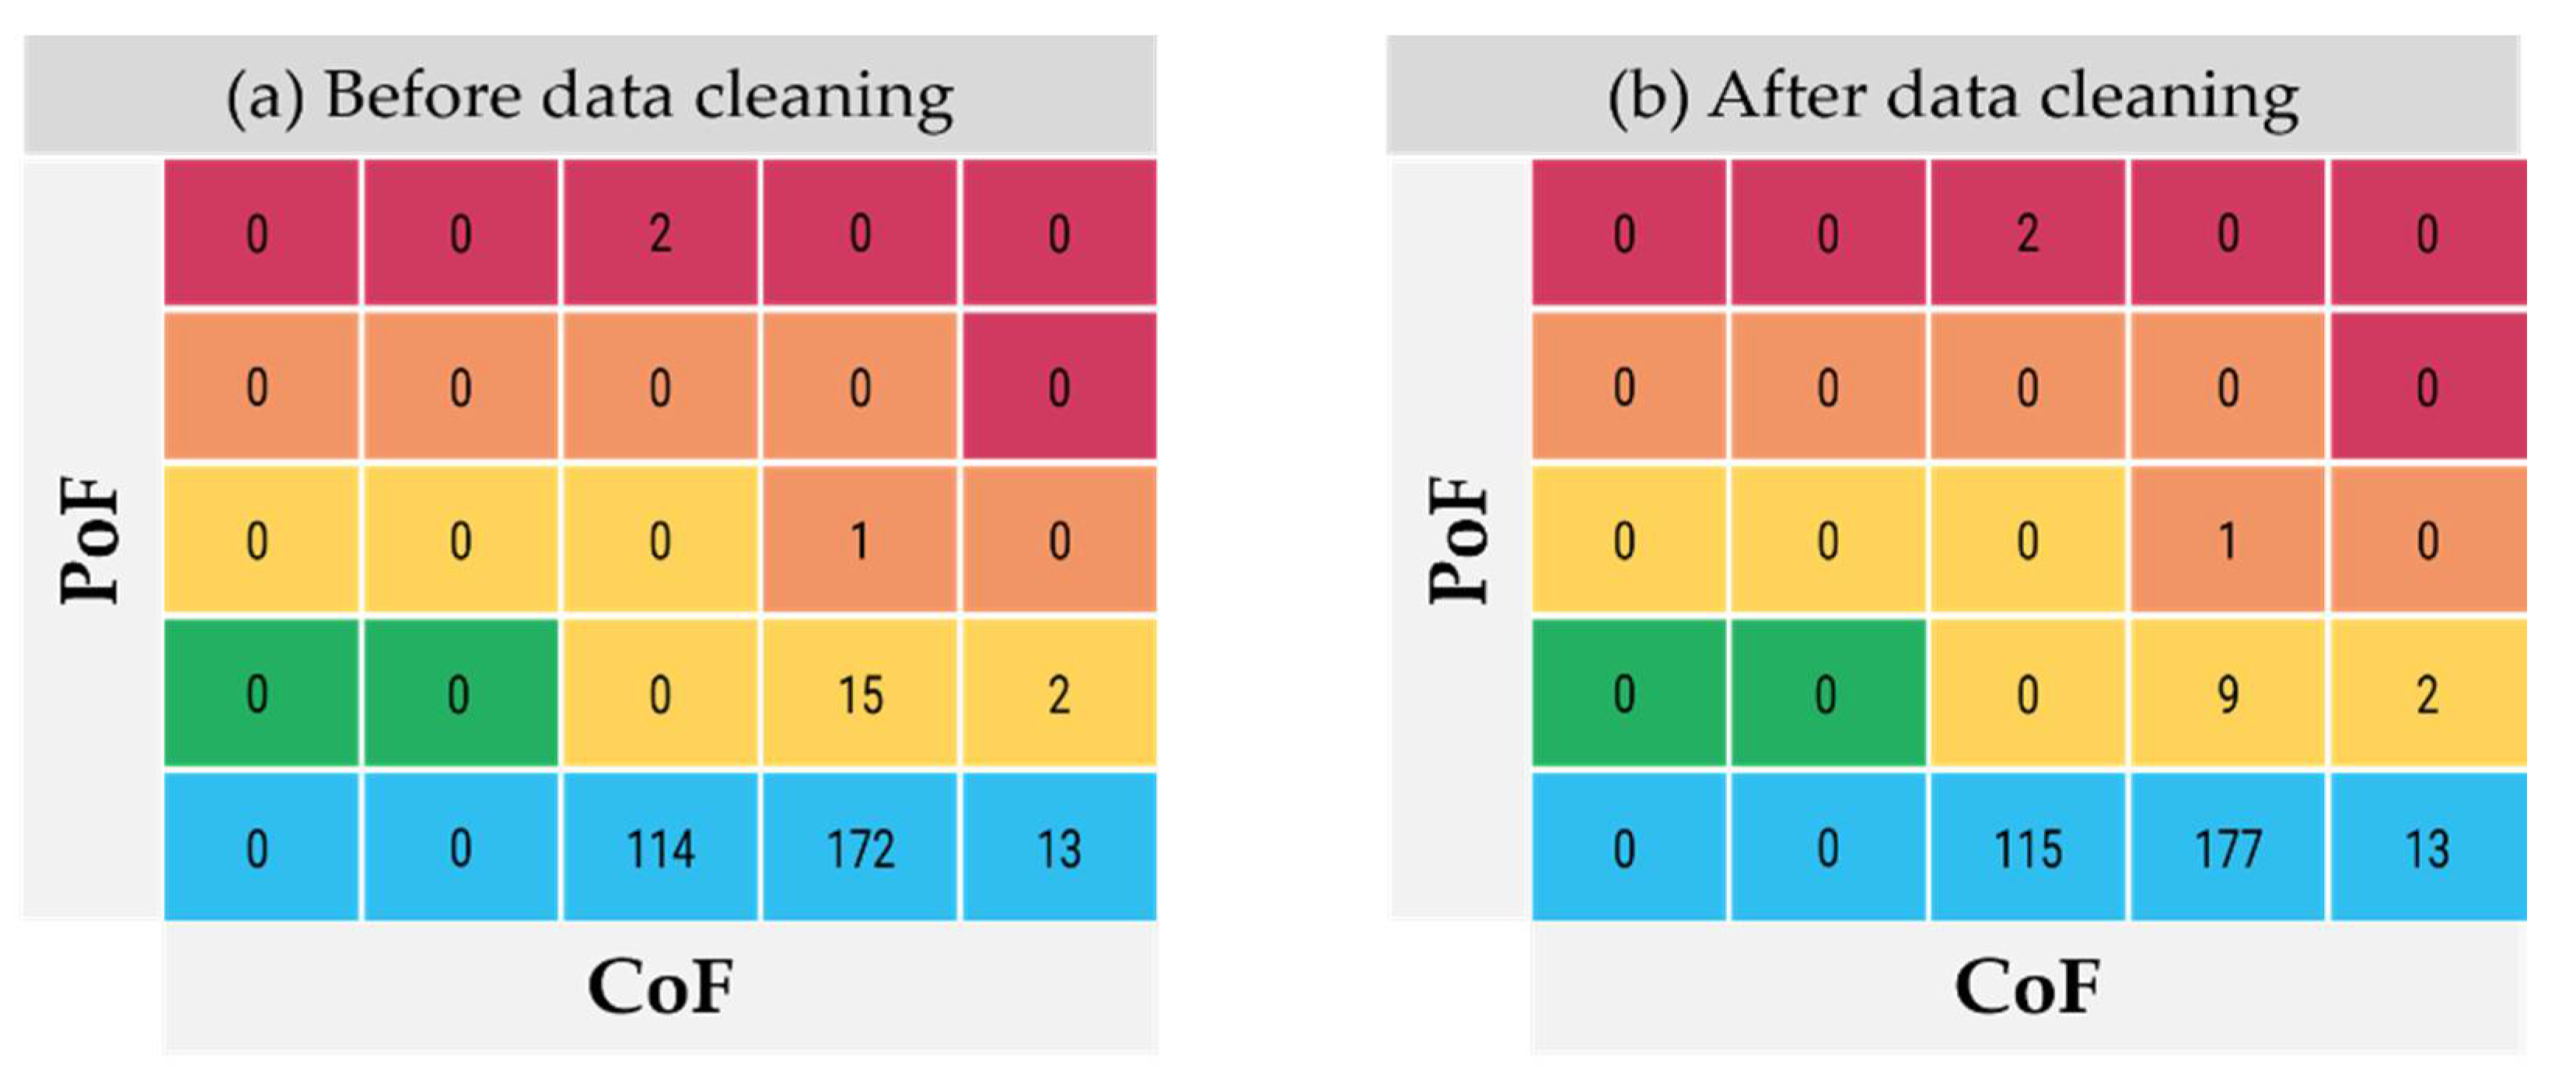
In order to identify the effect of asset data cleaning on risk matrix, which consisted of PoF and CoF axis, the risk assessment algorithm was implemented for three divisions and the results of risk matrix before and after data cleaning are shown in
Figure 20. The total number of cable circuits were the same between them but, the risk distribution is slightly different from each other. Especially, 6 of 15 circuits in the yellow area in the risk matrix before data cleaning were changed because the years of installation were cleaned from 1970 to 2013. In other cases, some data were changed but, the effect on risk matrix was not shown. However, these cleaned datasets contributed to approximately 14% reduction in the total risk value of all circuits. The risk value can be calculated based on a hazard function and probabilistic analysis, and the lower the number, the lower the risk of failure. Since the developed system is introduced to the evaluation of Korean power transmission system, the risk value calculation algorithm installed in the system cannot be disclosed. These results are interfaced to asset investment planning. For this reason, the investment planning could result in a different output.
Thus, data quality is essential, which leads directly to the reliability of the asset management system. From the development of cleaning algorithm and its system, the asset data quality has been secured and these reliable data could contribute to the asset management system for linear assets.


