Article

Optimal Discharge Parameters for Biomedical Surface Sterilization in Radiofrequency AR/O2 Plasma

by
Samira Elaissi
1,
Fatemah. H. Alkallas
1,*,
Amira Ben Gouider Trabelsi
1,
Lamia Abu El Maati
1 and
Kamel Charrada
2
1
Department of Physics, College of Science, Princess Nourah Bint Abdulrahman University, P.O. Box 84428, Riyadh 11671, Saudi Arabia
2
Research Unit of Ionized Backgrounds and Reagents Studies (UEMIR), Preparatory Institute for Engineering Studies of Monastir (IPEIM), University of Monastir, Kairouan Street, Monastir 5019, Tunisia
*
Author to whom correspondence should be addressed.
Energies 2022, 15(4), 1589; https://doi.org/10.3390/en15041589
Submission received: 22 January 2022 / Revised: 11 February 2022 / Accepted: 16 February 2022 / Published: 21 February 2022
(This article belongs to the Special Issue Advanced Materials and Devices for Energy Application)

Abstract

:
Plasma parameters of radiofrequency discharge generated at low pressures in an argon-oxygen mixture addressed for biomedical surface sterilization have been optimized. Numerical results illustrate the density distributions of different species and electron temperatures during the electrical discharge process. The current discharge acting in the abnormal range decreases at higher oxygen gas flow rates. The temperature of electrons drops with pressure while it rises by adding oxygen. Nevertheless, electron density displays an adverse trend, exhibited by the electron’s temperature. The average particle density of the reactive species is enhanced in Ar/O2 compared to He/O2, which ensures a better efficiency of Ar/O2 in sterilizing bacteria than He/O2. The impact of oxygen addition on the discharge mixture reveals raised oxygen atom density and a reduction in metastable oxygen atoms. A pronounced production of oxygen atoms is achieved at higher frequency domains. This makes our findings promising for biomedical surface sterilization and leads to optimal parameter discharges used for sterilization being at 30% of oxygen gas ratio and 0.3 Torr pressure.

1. Introduction

Sterilization of medical supplies and equipment has always been a critical issue in the healthcare field with respect to attaining mandatory safety, effectiveness, and efficiency. However, many current sterilization methods are unable to ensure effective sterilization or even decontaminate medical devices. This is due to the heat deterioration of some materials such as plastic or even to the biomolecule’s resistance to common sterilization methods [1]. Thus, medical device sterilization attracted a lot of interest in the last decades [2,3]. Non-equilibrium plasma discharge is one of the promising solutions for handling inflammation and preventing the spread of diseases derived from microorganisms and other biological substances. This method ensures low temperature operation, non-carcinogen properties, non-flammability chemical, higher efficiency, and lower costs compared to conventional conditions [4,5,6].
Recently, the effectiveness and efficiency of non-thermal plasma relative to inactivated bacteria such as Escherichia Coli have been proved [7,8,9]. Various conditions may highly affect plasma sterilization such as applied pressure, operating power, time, rate of flowing gas, and system geometry. RF Low pressure plasmas (0.9 mTorr to 10 Torr or 0.13 Pa to 1333 Pa) are weakly ionized (degree of ionization 10−6 to 10−1) glow discharge plasmas, and they are abundantly used for the modification of various materials such as metals, polymers, and biomedical surfaces.
Indeed, sterilization methods using low-pressure capacitively coupled RF-driven plasma remain the most promising method. The action mechanism is related to spore etching by atomic oxygen (O), superoxide (O2), ozone (O3), radical’s hydroxyl (OH), and further reactive oxygen species generated during plasma discharge. This induces a direct destruction of spores or a removal of spore-shielding materials due to the interaction between reactive species and macromolecules, such as proteins, lipids, and DNA, causing cell death [10,11].
Helium and argon are generally used as feeding gases. This is due to their high stability performance across a large range of experimental parameters. On the other hand, new chemically active species may emerge by adding a small quantity of reactive gases, such as O2, CF4, and N2 [12,13]. This results in additional technological benefits. For instance, the presence of extra percentages of oxygen may generate numerous reactive oxygen densities that oxidize the material’s surface and induces an oxidative power [14,15]. Therefore, low-pressure oxygen plasmas provide a complex combination of reactive species bombarding the surface of the target, including excited and reactive oxygen species (ROS), ions, and energetic radiations [16,17]. This effect initiates a quick erosion of biological material and has a major role in microbial deactivation, while remaining relatively harmless to the fundamental substrate [18,19].
The mechanisms of spore etching and erosion of electrodes are regulated by radicals and active species generated by plasma discharges. These processes destroy the spore’s membrane and removes the material that shields them from exposure to UV radiation. Together, these effects will accelerate the process of sterilization [20]. In a recent study, H. Dai et al. [21] found that argon–oxygen mixtures cause less damage to electrode surface than air gas, which can reduce material loss due to erosion and improve electrode life.
The high-quality biomedical surface treatment needs further precision with respect to reactive processes monitoring, while plasma interactions with biomolecules and microorganisms remain unexplained. During deposition, cleaning, selective etching, and any other surface modification processes, the energy of ion bombardment as well as ion flux requires accurate control. Several experimental and numerical studies have been interested in Ar/O2 mixture plasmas at low pressure. This is to clarify the complexities of plasma discharges induced by large fluxes of numerous neutral and ionized active species. Khalaf et al. [22] conducted experiments to investigate the electrical properties of Ar/O2 gas mixture glow discharge to determine breakdown voltages for various percentages of O2. Furthermore, Chen et al. [23] examined O2 concentration rate effects as a function of electron energy distribution in Ar/O2 and He/O2 by using a particle collision model. Zhang et al. [24] investigated energy efficiency in producing reactive oxygen species (ROS) in He-O2 dielectric barrier discharge via one-dimensional fluid models. Moreover, Anjum et al. [25] performed time-resolved measurements of several plasma characteristics in an RF pulse-modulated capacity, connecting discharge driven into the Ar/O2 mixture.
In this work, a bidimensional model of radio frequency capacitively coupled discharge in Ar/O2 mixture plasma is performed with COMSOL Multiphysics. The distributions of different reactive species in the discharge among several kinds of chemical reactions and electron temperature are presented at various instants of the discharge period. This will clarify the mechanism governing the processes occurring in the plasma discharge. The influences of discharge parameters (gas pressure, RF power, and gas composition) on electrons, ions and radical species density, and electron temperature were investigated. These showed high dependency relative to microbial inactivation rates that estimate sterilization efficiency. A detailed comparison of He/O2 and Ar/O2 mixtures is provided, as well as their role in sterilizing microorganisms and influence on the material’s surface. This determines the optimum conditions of antimicrobial effects of low capacitively coupled radiofrequency discharge at low pressure via Ar/O2 mixtures in biomedical surface sterilization.

2. Description of the Simulation Model

Figure 1 shows the capacitively coupled plasma (CCP) low-pressure reactor using an Ar/O2 mixture for biomedical surface sterilization. The reactor is symmetrically cylindrical, including two parallel plate electrodes made of stainless steel separated by 0.03 m. The diameters of the upper and the lower electrodes are 0.02 m, while their thickness is equal to 2 × 10⁻³ m. A sinusoidal signal generator delivers RF (13.56 MHz) voltage of 150 V to Ar/O2 mixture plasma source comprising 20% oxygen under 0.3 Torr [26].

2.1. Governing Equations

We studied the discharge in Ar/O2 via a two-dimensional fluid model in COMSOL Multiphysics software by using plasma module® 5.4 [27]. The continuity equation, the energy equation, and the Poisson equation assigned to the distribution of electric potential are used to simulate characteristics of the discharge [28,29].
The time-dependent continuity equation for electrons, ions, and neutral particles is given by the following:
n * t + Γ * = S *
where subscript * indicates electrons I, ions (i), and neutral particles (np). n , Γ , and S represent the density, flux density, and source term correspondingly for different particles.
In drift–diffusion approximation, the particle flux densities are determined by the following.
Γ e = n e μ e E D e n e
Γ i = s g n ( q )   n i μ i E D i n i
Γ n p = D n p n n p
μ and D correspond, respectively, to mobility and diffusion coefficients. s g n ( q ) is (1) for positive ions, and (−1) for negative ions. We are concerned only with the diffusion quantities for neutral particles in flux calculation.
The electric field is written as follows:
E = V
where V is the electric potential that satisfies Poisson’s equation.
2 V = e ε 0 [ n e n i ]
e and ε 0 represent the elementary charge and vacuum permittivity, respectively.
The equation governing the energy density of electrons is as follows:
n ε t + Γ ε = e Γ e . E + S ε
where S ε is the energy lost through inelastic collision, and Γ ε is the electron energy flux given by the following.
Γ ε = 5 3 ( n ε μ ε E D ε n ε )
The electron diffusion coefficient and the energy mobility and diffusion coefficients are determined using electron mobility.
D e = μ e T e ,   μ ε = 5 3 μ e ,   D ε = μ ε T e
The source terms in the above equations are governed by the chemistry of plasma model and deduced through the rate coefficients [30].
S * = j = 1 M ( x j k j N n n e )
Therefore, collisional energy loss overreactions are summed to obtain the electron energy loss term.
S ε = j = 1 P ( x j k j N n n e Δ ε j )
where k j , x j , and Δ ε j indicate the rate coefficient, the species mole fraction, and the energy loss, correspondingly, for a given reaction j. N n represents neutral density.
The temperature of gas Tg is considered constant at 300 K, while the temperature of electrons Te is calculated via the equation of energy. Electron temperature Te, mean electron energy ε , and n ε are correlated with each other:
n ε = ε n e = 3 2 K B n e T e
where K B denotes the Boltzmann constant.
The resolution of this fluid model needs the knowledge of mobility and diffusion coefficients necessary for density and energy flux equations, as well as reaction rates of the creation or losses of charged species under different collision processes (ionisation, attachment, detachment, excitation, elastic, and super elastic collisions) needed for the source term of the continuity equation.
The electron transport coefficients are calculated by solving the zero-dimensional Boltzmann equation by means of the collision cross-sections for electron–Ar and electron–O2 systems. Ion transport coefficients are calculated with the Monte Carlo method that uses certain interaction potentials and collision cross-sections [31].

2.2. Chemical Model

The Ar/O2 model incorporates ground-state species of argon atoms (Ar), oxygen molecules (O2), oxygen atoms (O), and ozone molecule (O3). Furthermore, excited species above the ground state level such as argon atoms (Ar*), oxygen atoms O*(1D), and oxygen molecule O2*(1Δg) at 11.55, 1.97, and 0.977 eV, respectively, have been considered. Moreover, argon ions (Ar+), positive oxygen molecule ions O2+, positive oxygen ions O+, negative oxygen ions O, and electrons (e) have been included. Table 1 lists various species included in the plasma model.
In total, 44 different reactions and 11 various plasma species are intervening in a mixture of oxygen–argon. The chemical reactions used in our model are given by G. Park et al. [32]. A detailed overview of the possible reactions considered for oxygen and argon in the model of Ar/O2 is listed in Table 2 and Table 3 respectively.
A comparative study is conducted in this work between Ar/O2 and He/O2 mixtures to reveal their impact in plasma decontamination. The model of He/O2 considers ion helium He+, dimer ions helium He2+, excited atoms helium He*, dimer excited He2*, and the species of oxygen (Table 2). The chemical reactions of different ions and neutral species considered for helium in He/O2 are listed in Table 4 with their corresponding rate coefficients [32,33].

2.3. Boundary Conditions and Computational Model

Plasma is maintained between two symmetric parallel plate electrodes separated by 0.03 m and measuring 0.01 m in length. One electrode is electrically grounded while the other is powered by an oscillating RF source resulting in a sinusoidal voltage waveform.
V r f = V m sin ( 2 π f t )
V m is the maximum voltage and f is the frequency fixed at 13.56 MHz.
The electron flux normal to electrodes and reactor walls resulting in an overall gain of the number of electrons due to secondary emission effects is introduced.
n · Γ e = ( 1 2 v e , t h n e ) p γ p ( Γ p · n )
While the electron energy flux towards the electrodes and walls is provided by the following.
n · Γ ε = ( 5 6 v e , t h n ε ) p ε p γ p ( Γ p · n )
n represents the normal vector to the surface, γ p represents the secondary emission coefficient, Γ p is the positive ions flux density, ε p the mean energy of secondary electrons, and v e , t h is the thermal velocity [34]. This can be written as follows:
v e , t h = 8 K B T e / π m e
where m e is the mass of the electron.
Herein, the secondary emission coefficient γ p is assumed to 0.05, and the secondary electron temperature on the electrode is set to 1 eV.
Heavy species, i.e., positive ions, atoms, and metastable atoms, are lost to the wall due to surface reactions. For negative ions, no surface reactions are needed due to the incapability of escaping from the ambipolar field or reaching reactor walls. Indeed, negative ions could be removed from the plasma only via recombination with positive ions. The following surface reactions presented in Table 5 are incorporated in the model. The sticking coefficients are provided by COMSOL Multiphysics and are used to calculate the loss coefficient rate for neutral particles to the wall surface [35].
The densities of neutral species of oxygen and argon molecules are initially fixed at fractional values, while the initial electron density in the plasma was fixed at 1015 m−3. Gas temperature is maintained at 300 K. The initial mean electron energy throughout the entire domain is set at 4 eV while the initial electric potential is fixed to 0 V.
To simulate the electrical and energetic characteristics of the RF discharge in the mixture of Ar/O2, a two-dimensional axisymmetric model was adopted. The numerical model was performed using a capacitively coupled plasma module in COMSOL Multiphysics® 5.4. The Galerkin finite element method was used to solve strongly coupled differential equations and the parallel sparse direct solver (PARDISO) was applied for solving the time-dependent solution [36]. The simulation takes 82310 s on an Intel® Core (TM) i7-PC (Windows10, 1.99 GHz, 16 GB RAM, and 64-bit operating system).
Figure 2 shows the computational domain implementing two-dimensional reactor geometry and meshes. In the simulation domain, a nonuniform triangular mesh containing Nz × Nr = 235 × 155 = 36,425 elements is used in the model. Triangular elements vary in axial and radial directions from 268 µm to 2.5 µm close to the anode, cathode, and wall surfaces to improve the stability of the simulation model and to obtain accurate resolution. Mesh quality can be evaluated by COMSOL Mesh Statistics window, which gives us a visual indication of the quality of the mesh and helps us to determine whether we need to adjust the mesh size in any way.

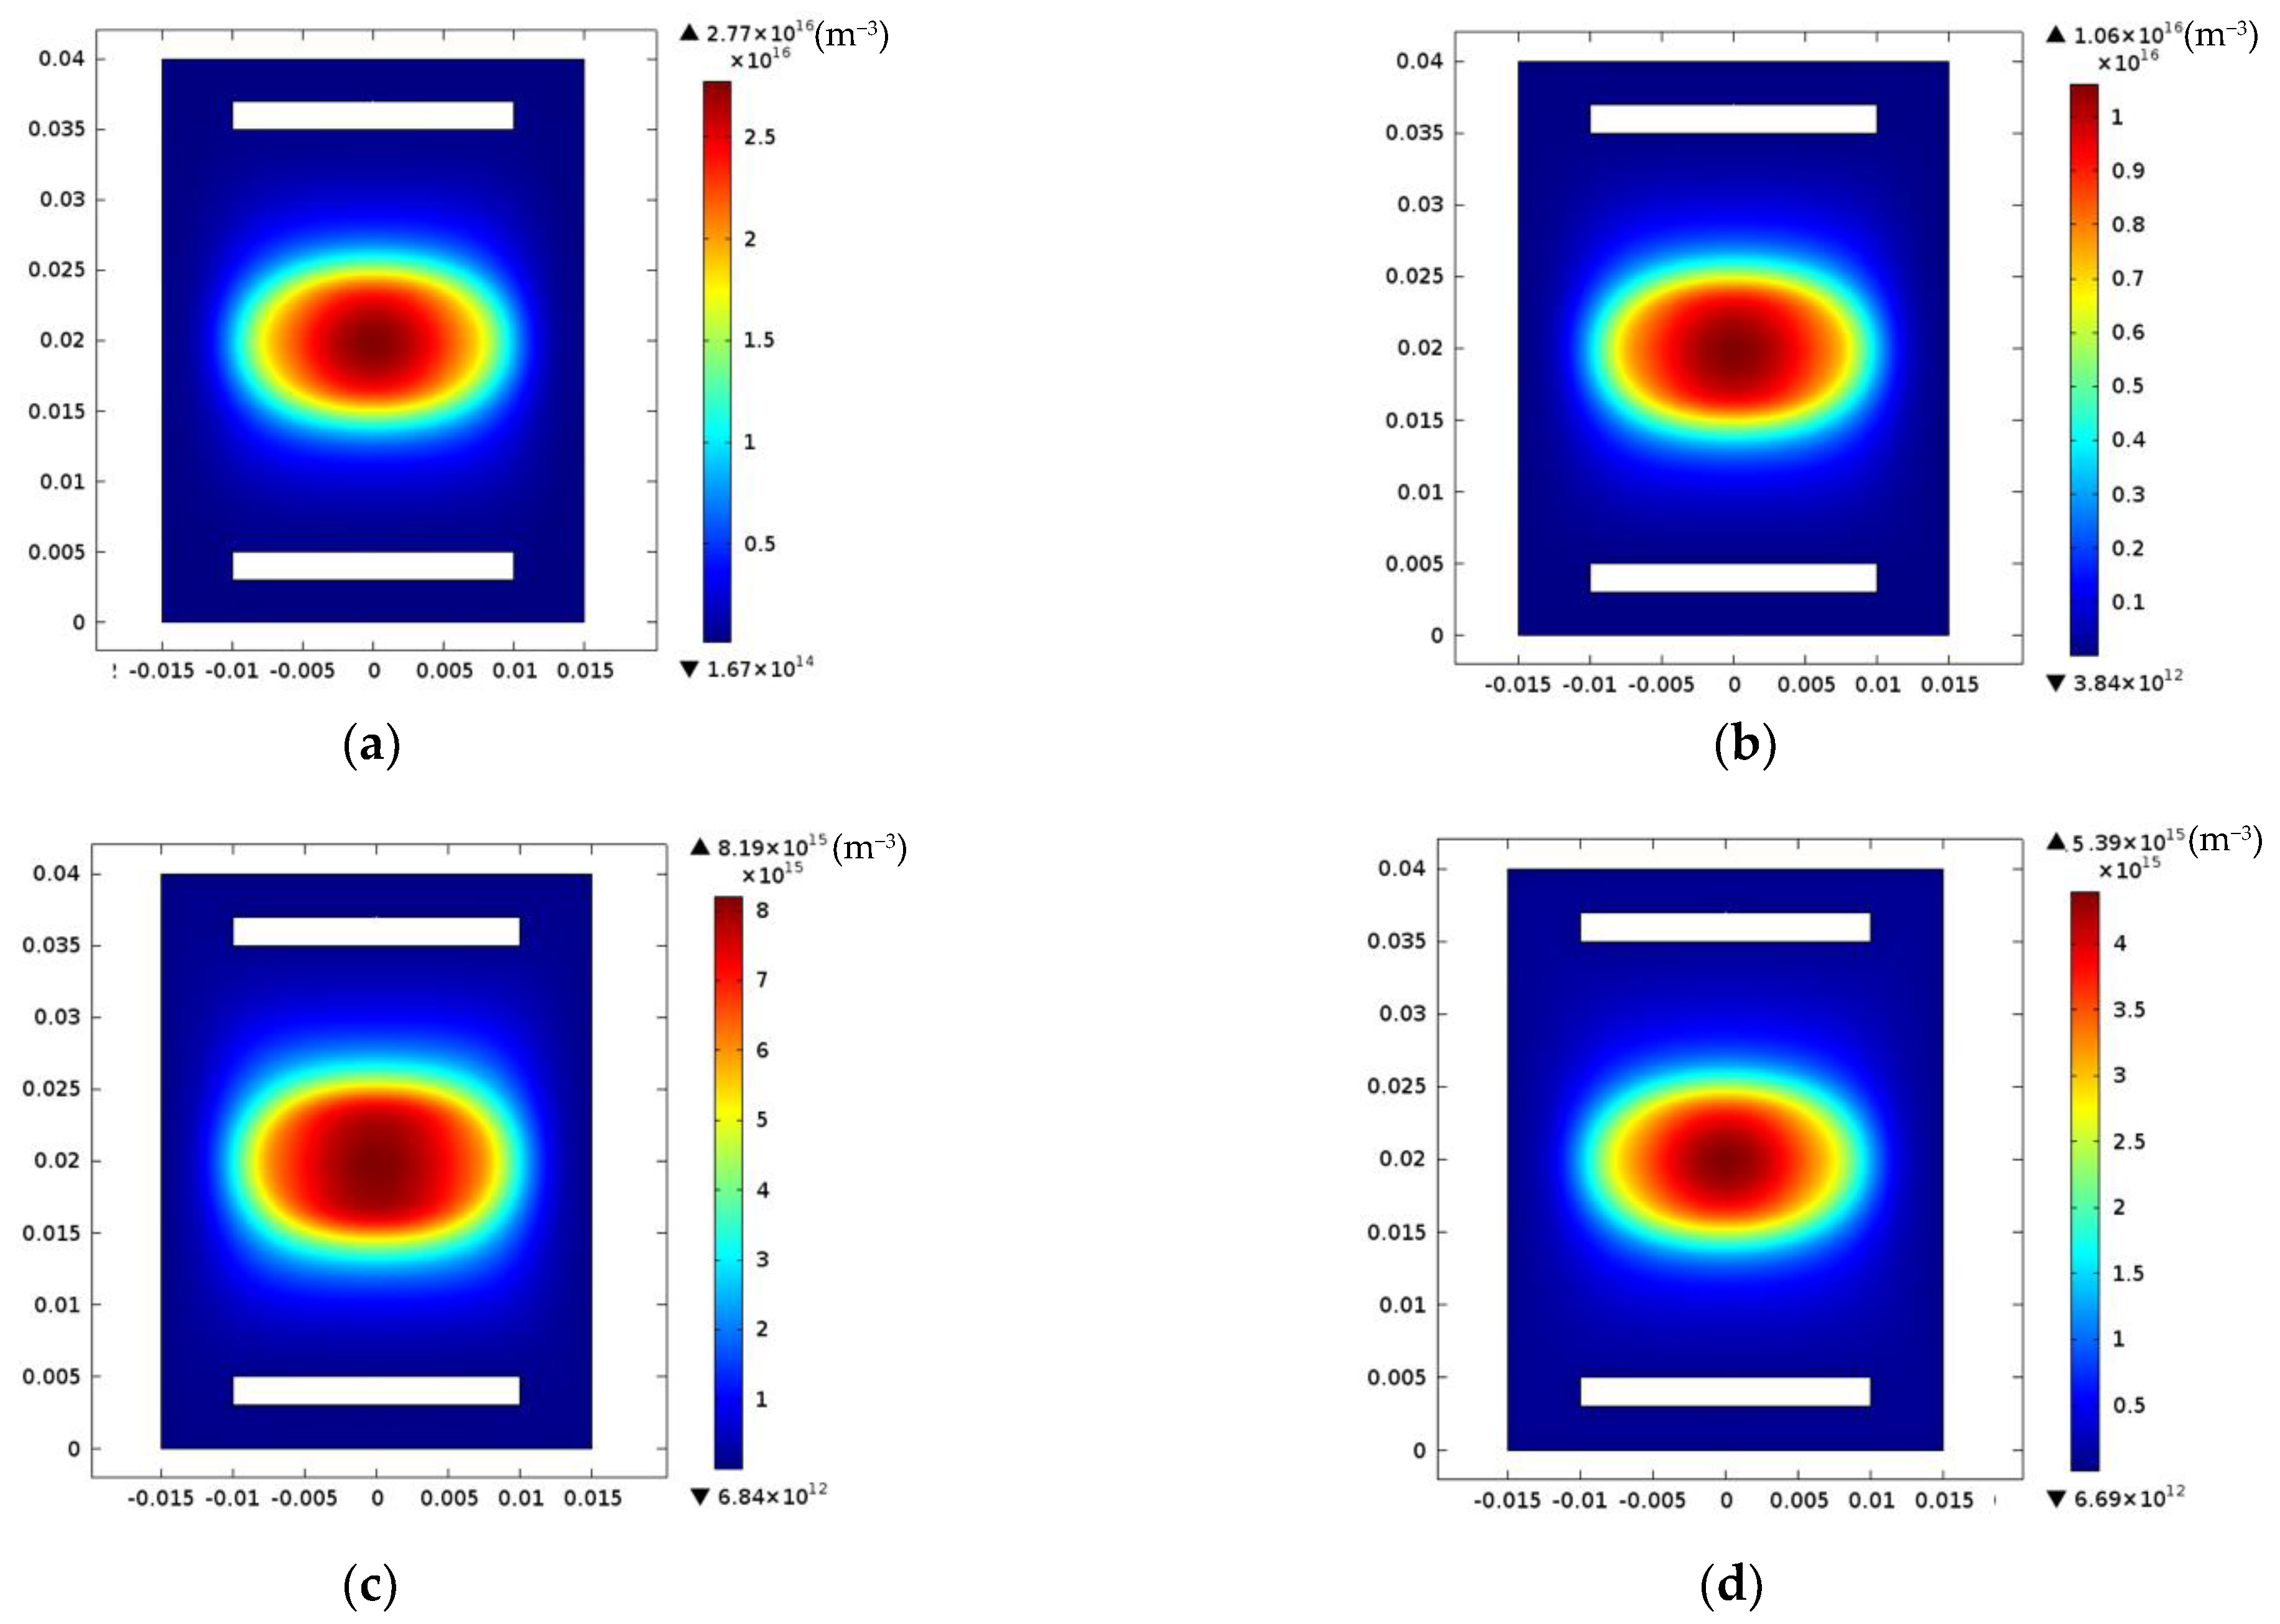
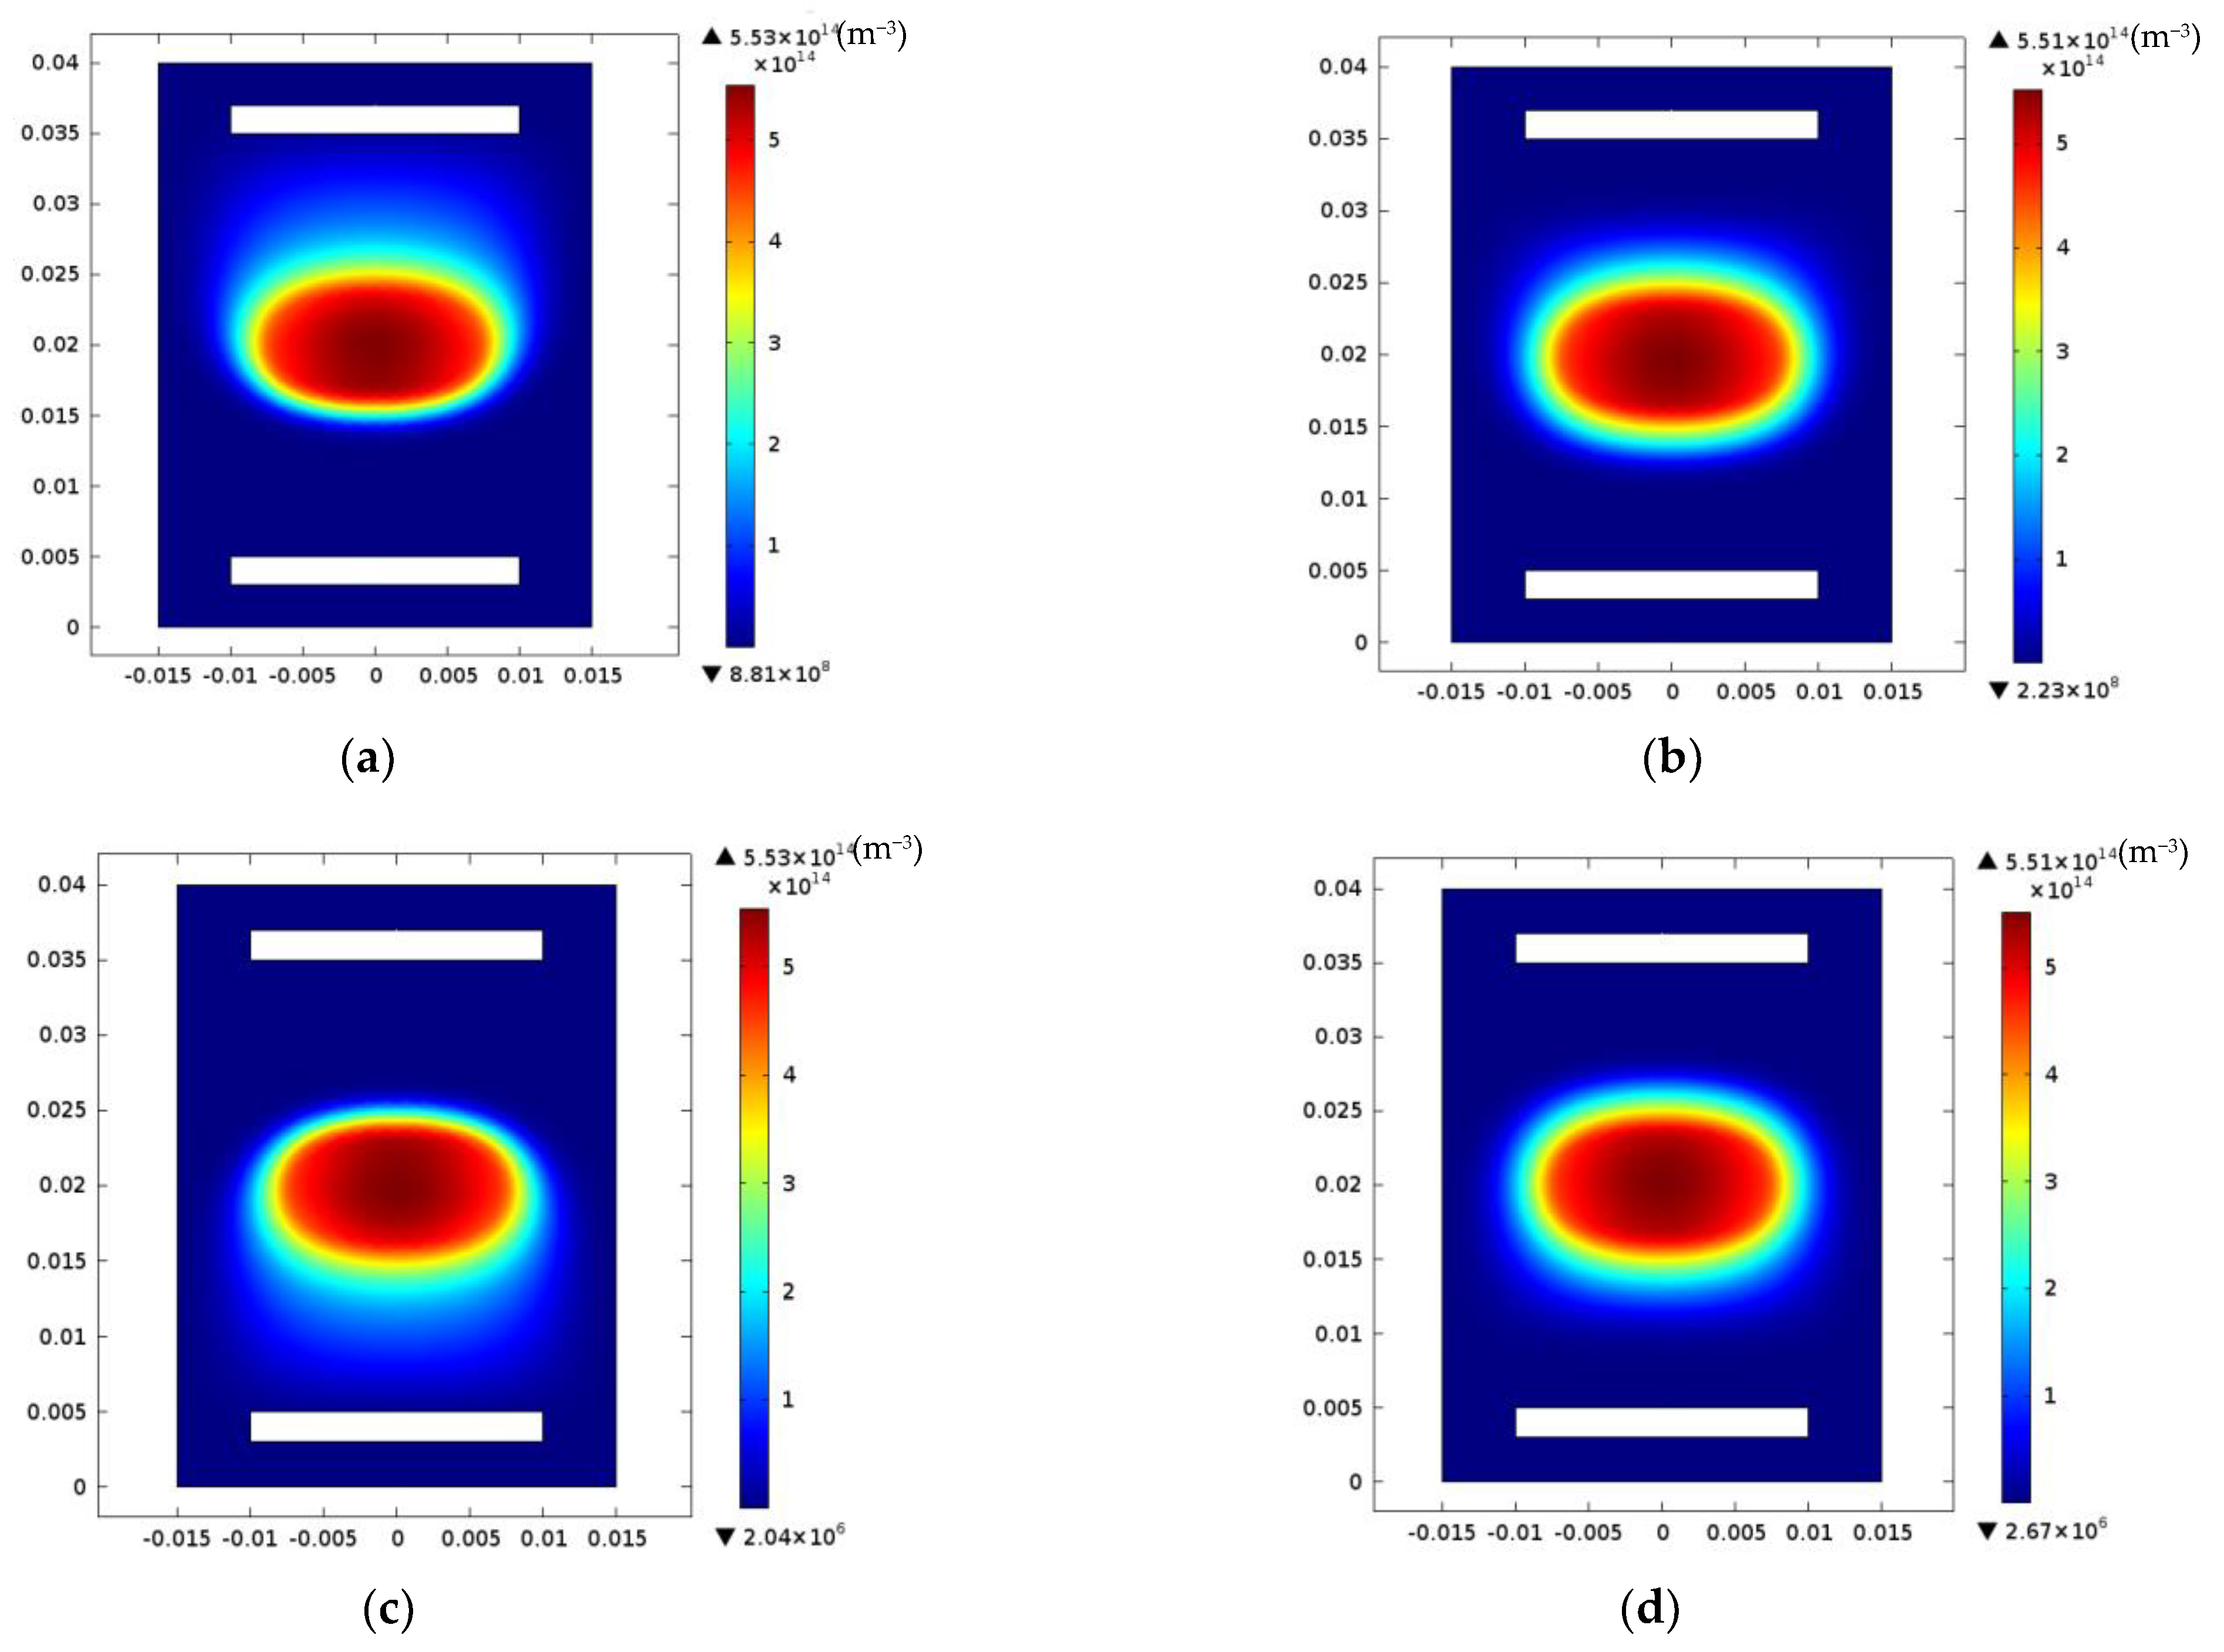
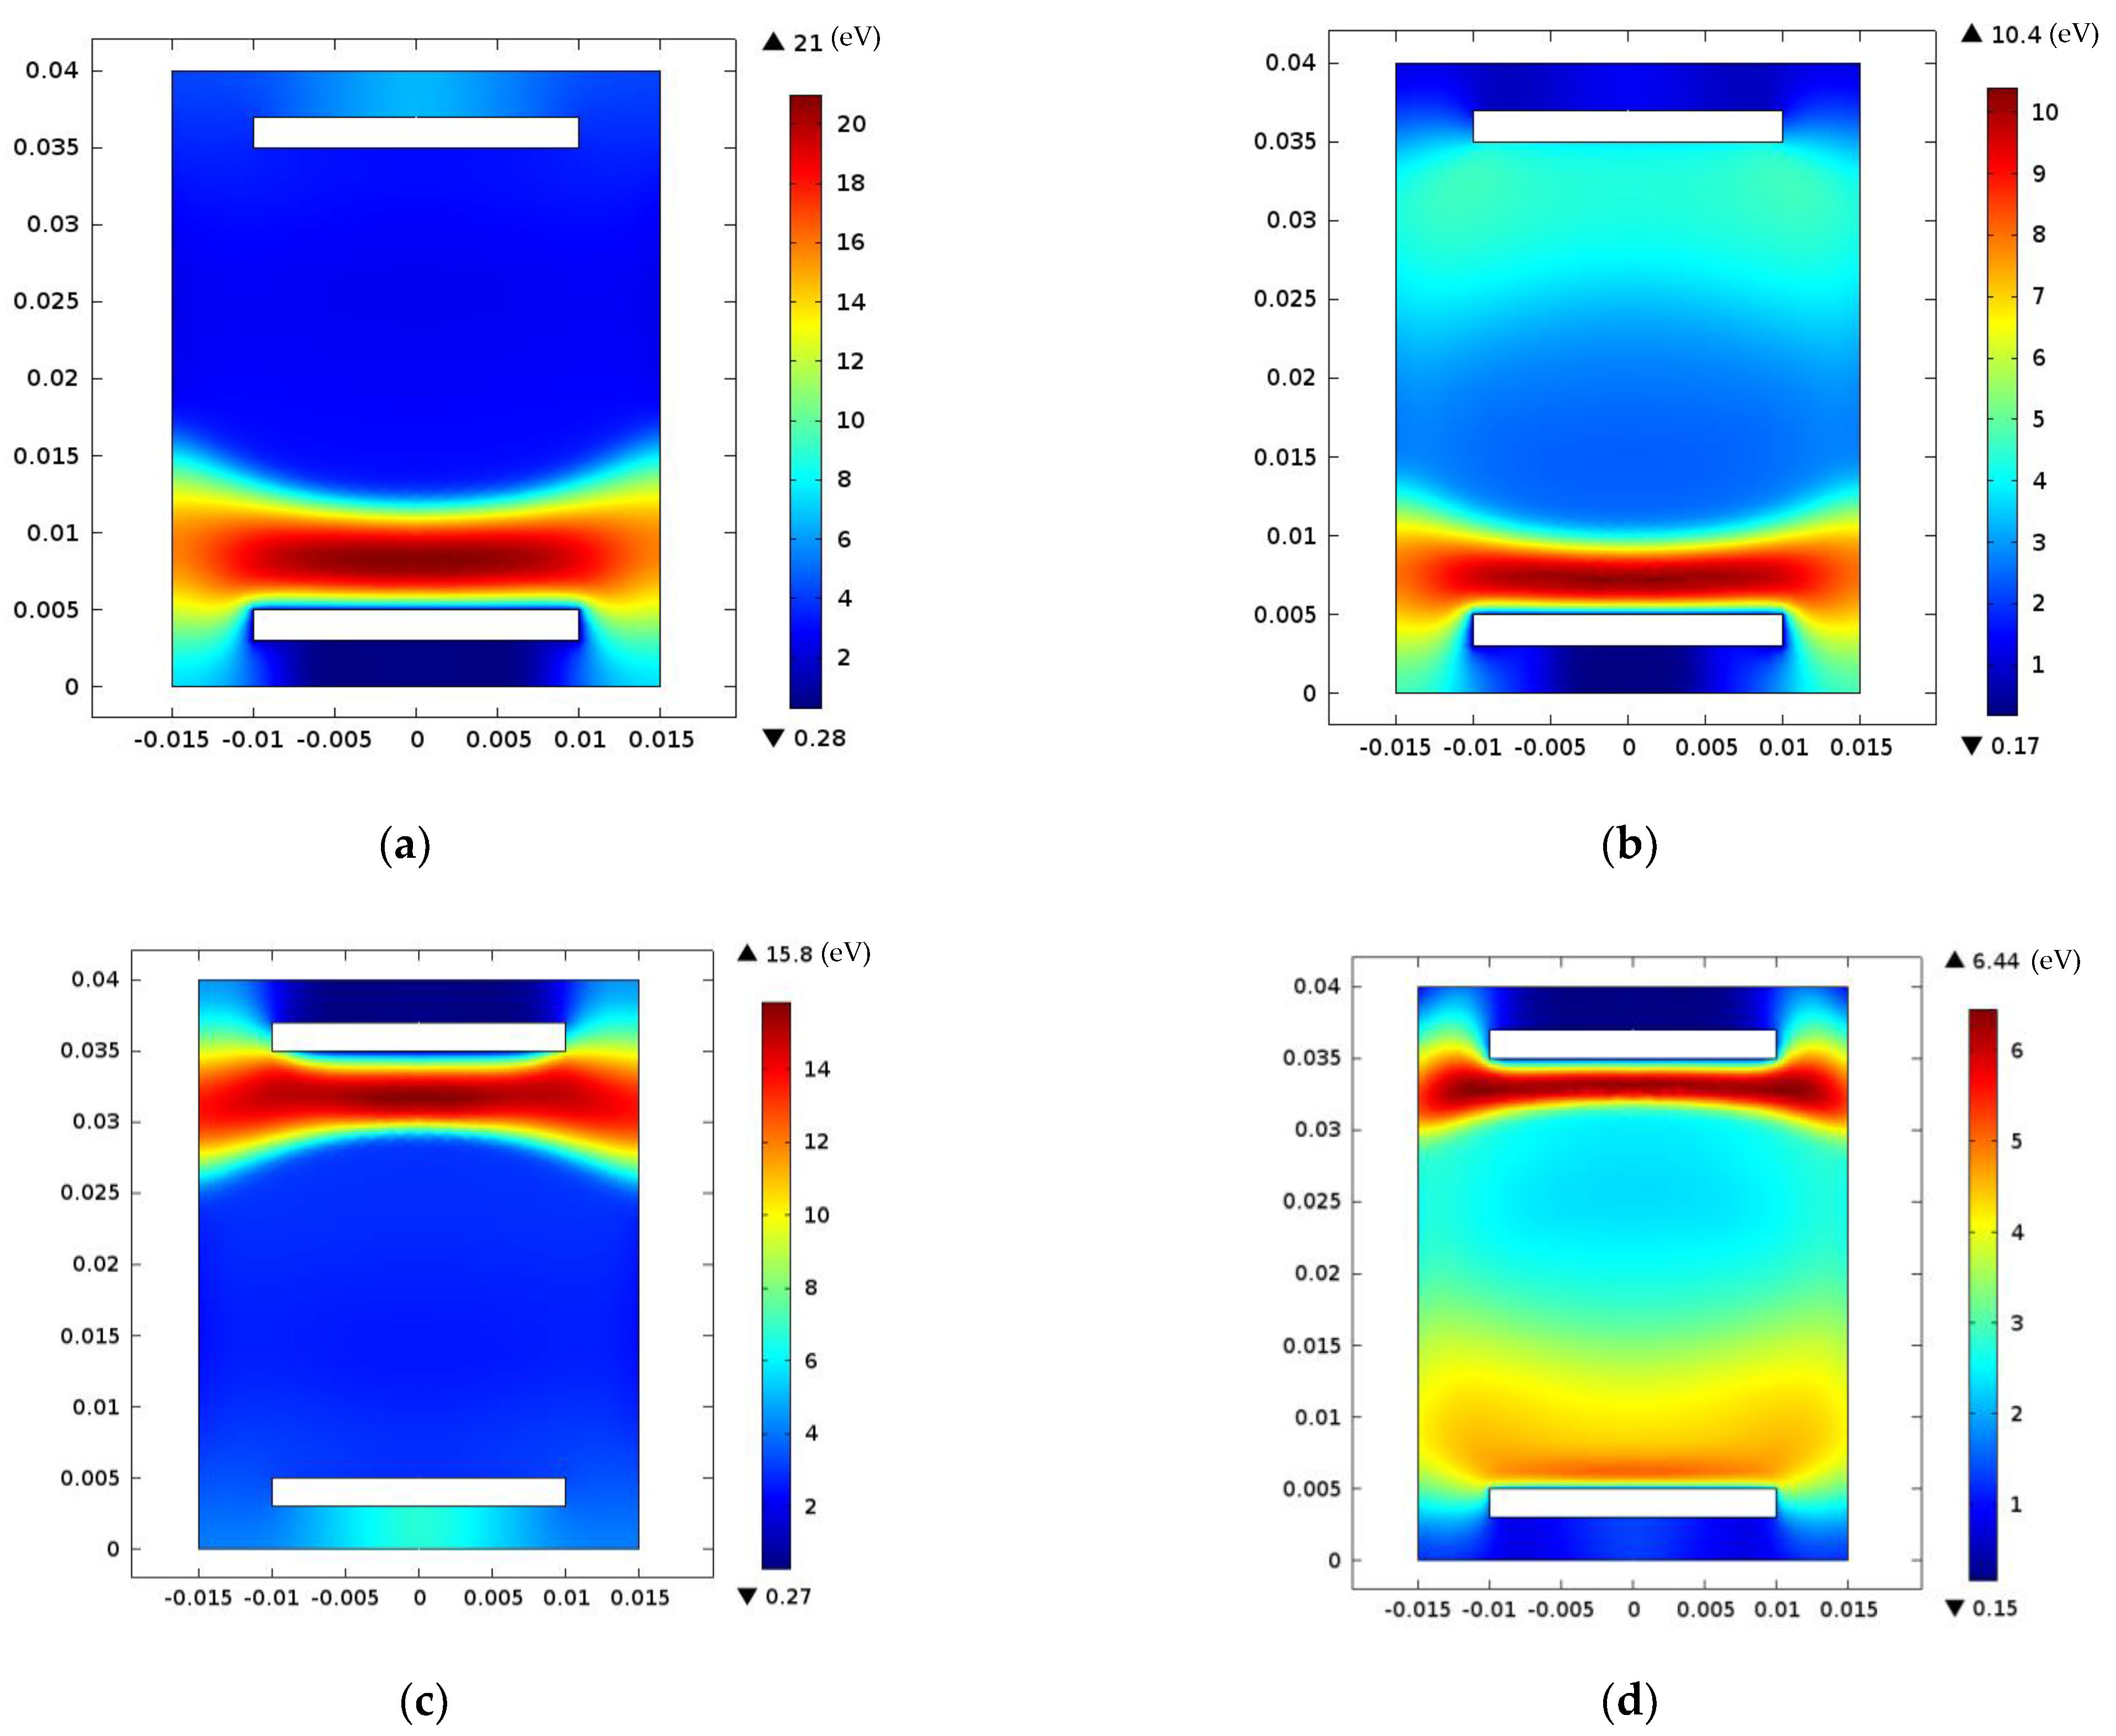
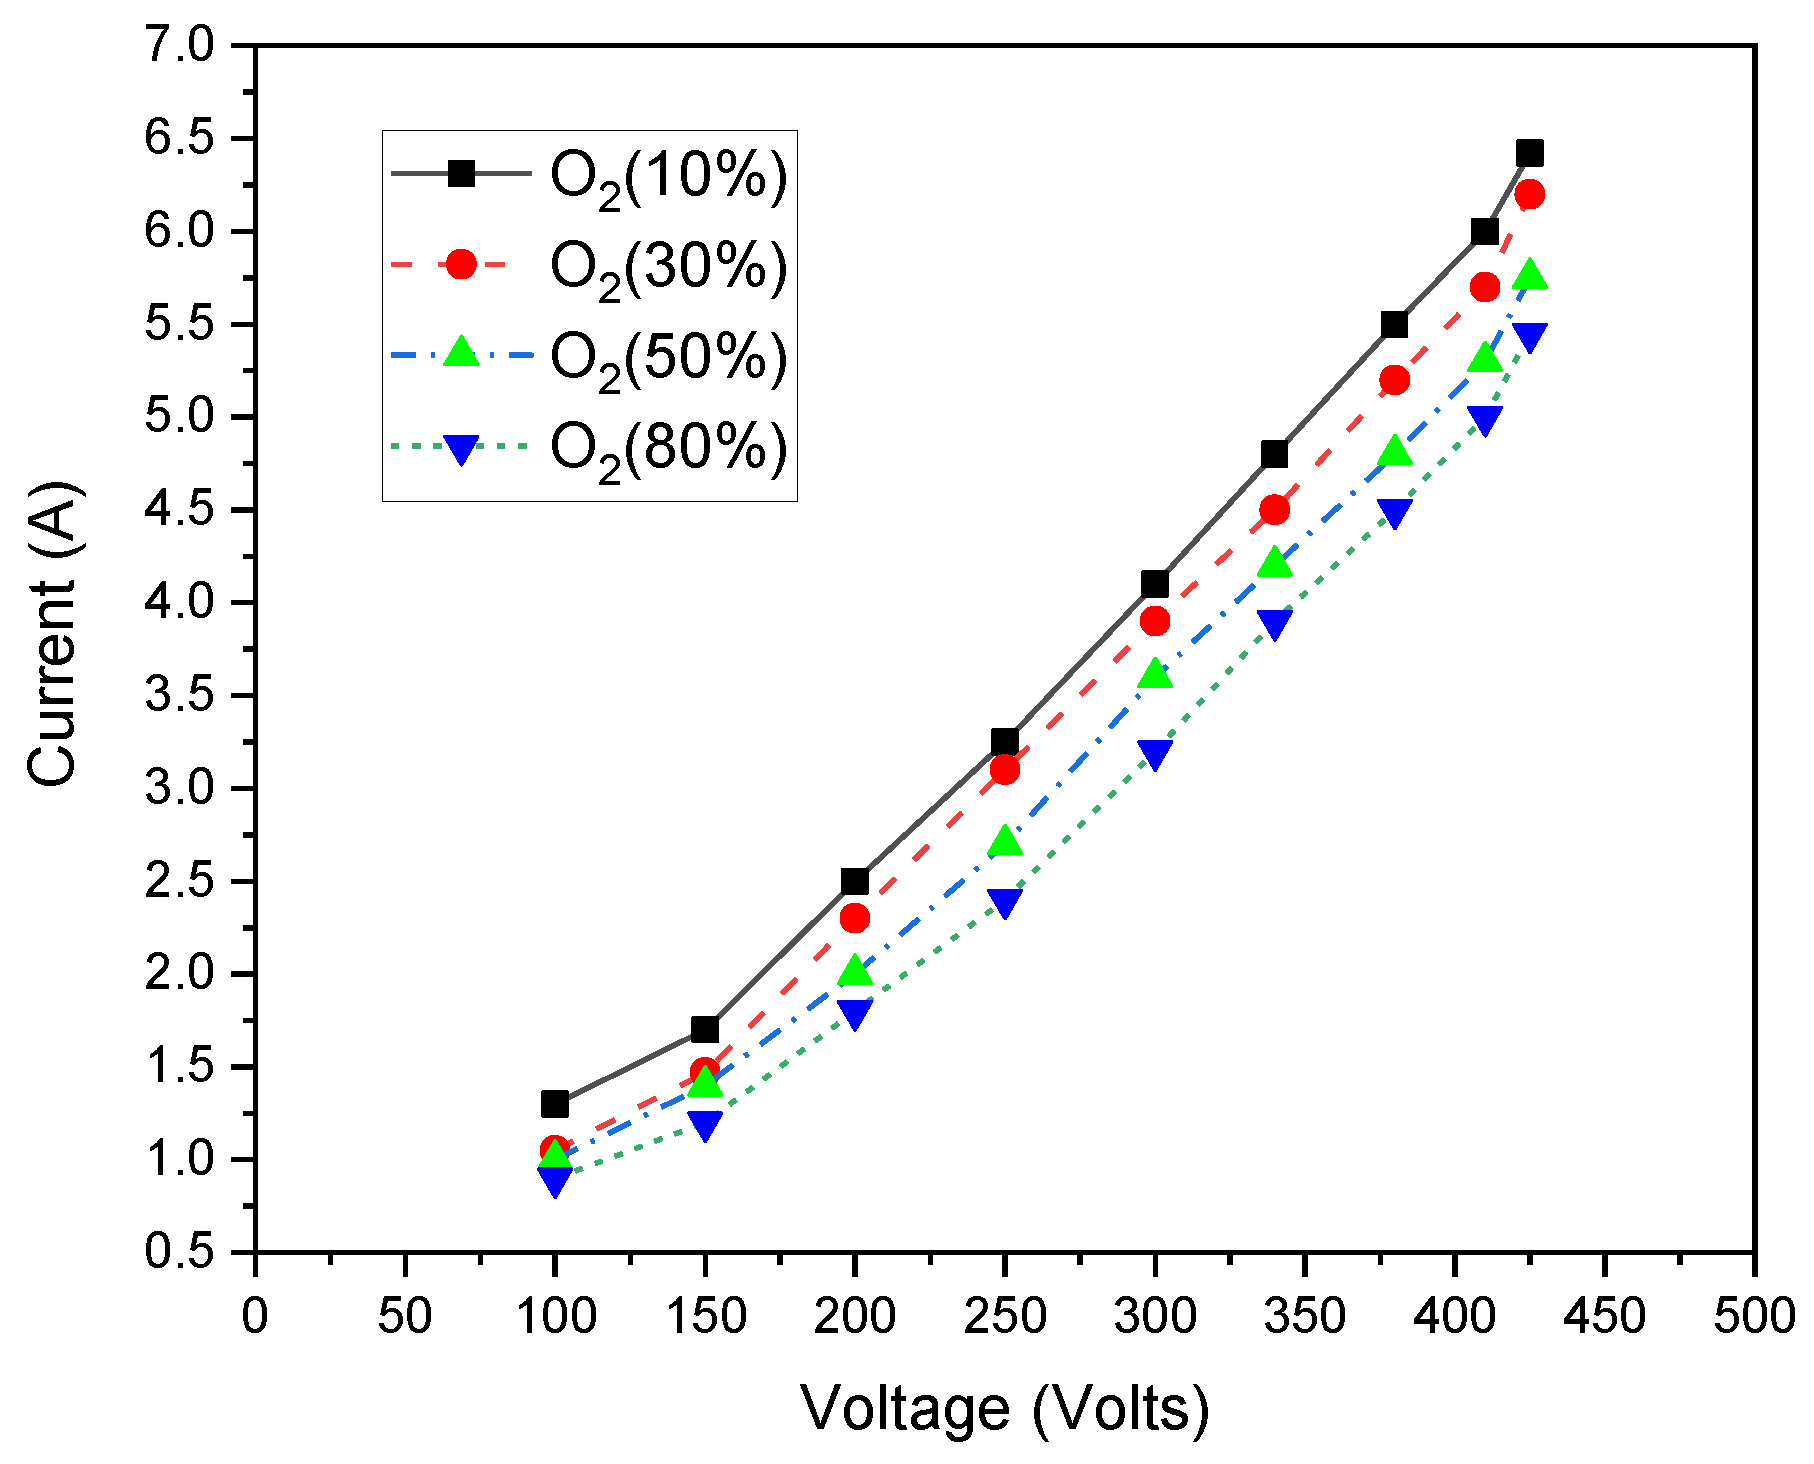
3. Results and Discussions

The following results are obtained for an interelectrode distance of 0.03 m, a 0.3 Torr pressure, and a 150 V radiofrequency voltage. The used oxygen content in the gas mixture is about 20%.
As a first step, we compare model calculations with experimental measurements of electron temperature to explore reaction rates in the discharge and to show the accuracy of the model. Figure 3 shows the calculated and measured electron temperature as a function of pressure in pure argon and in (Ar + 10% O2) mixture with 60 MHz RF generator and 0.06 m interelectrode distances [37]. The numerical results show a great agreement with experimental measurements.
Figure 4 demonstrates the spatial distribution of different species densities. The atomic oxygen, excited argon atom, excited oxygen atom, and ozone are the main dominant species in the discharge [38].
The dissociative attachment reaction (R2: e + O2 ➔ O + O), which is the essential for producing oxygen atom, has a greater rate coefficient than the three-body attachment reaction (R19: e + O2 + O2 ➔ O2 + O2). This demonstrates the high-density number of the oxygen atom O compared to O2 ions in the mixture.
The 2D densities distribution of atomic oxygen, excited oxygen atom and ozone, representing the most important antibacterial agents, and the exited argon atom are illustrated in Figure 5.
The distribution of electron density in different instants of cycle RF is illustrated in Figure 6. The plasma sheaths exhibit a significant temporal dynamic throughout the total RF cycle, and electron density oscillates within these two sheaths. However, ions and excited species can only respond to the average time of the electrical field and remains unable to pursue the associated evolution of the applied RF voltage in time owing to inertia (see, Figure 4).
The distributions of electron temperature at various instants of cycle RF are represented in Figure 7. Significant heating of electrons took place in the sheaths, whereas bulk plasma had comparatively little heating. Indeed, most electrons gain energy during acceleration in the electric field, and the absorption of power occurs when electron velocity increases [39].
The different phases of the RF discharge show that the electron temperature in the positive cycle discharge is higher and larger than in the negative cycle. This can be attributed to the oscillating motion of electrons caused by the electric field. Additionally, the modulation ratio of various species is different in the entire cycle [40].
We studied the characteristics of current–voltage discharge at varying O2 percentages in (Ar/O2) gas mixture (see Figure 8). The discharge current grows as the applied voltage increases, where working pressure remains constant at 0.3 Torr. Consequently, electrical discharge occurs in the abnormal glow zone, where the largest area of electrodes surface is involved [41]. Here, the electrical breakdown voltage (minimum voltage at which the transition from an insulator to a conducting level occurs) increases by increasing O2 in the mixture.
Furthermore, the current of the discharge decreases as the O2 gas rate increases while preserving the gas voltage and pressure constant. Indeed, the enhancement of proportion of O2 raises the quantity of negative ions that consequently reduces electron density during the discharge process. Thus, plasma resistance becomes important, and the discharge current is reduced [42]. An increasingly higher electric field is needed.
The effect of the addition of the O2 ratio to Ar/O2 gaseous mixtures on the electrical characteristics approves that the best current value was at a ratio of 30%.
In Figure 9, the variations of voltage and power as a function of current are represented. As input power increases, the current and voltage rise monotonously until he discharge becomes an arc. The slope of the current–voltage curve is not linear in this region [43].
The impact of the applied voltage on electron density and temperature has been also studied (see Figure 10). Herein, the use of elevated voltage increases electron energy, which enhances ionization and excitation and generates significant electron density. The behavior of the electron temperature under voltage variation is found to be similar to that observed for electron density.
The changes in electron density and electron temperature in an Ar/O2 mixture with RF input power for variable pressure gas were also studied (see Figure 11). The number of electron collisions augments with working pressure. As a result of the energy exchange between the electrons and gas particles, electron density increases with a reduction in electron temperature [44]. Moreover, the electron’s mean free path diminishes with rising pressure.
The electron temperature was found to be decreasing as a function of power. However, as the pressure increased to 0.3 Torr and 0.5 Torr, the electron temperature displayed a slight decrease to about 1.2 eV for 0.3 torr and 0.8 eV for 0.5 torr. This drop in electron temperature with power is assigned to the necessity to balance electron generation and loss, which needs a lower ionization rate and lower electron temperature to compensate for increased density occurring with several electron collisions during oscillation at high power supplies [45]. As pressure increases, the variation of electron density is lower, which results in lower decreases in electron temperature [46].
The dependency of (ne) and (Te) relative to the O2 flow rate is illustrated in Figure 12. Here, the electron’s temperature increases with increasing oxygen percentage in the mixture. This behavior is due to the smaller ionization cross-section of O2 compared to that of Ar. Therefore, the energy lost by electrons via ionizing collisions with O2 molecules is reduced and the electron’s temperature increases. However, the density of electrons decreases for high O2 percentages. This phenomenon could be attributed to the dominantly dissociative electron’s attachment of O2 to form O associated with the augmentation of the electronegativity of gas O2 defined by the density’s ratio ([O]/[e]) at higher oxygen percentages [47,48].
A comparison is made between He/O2 and Ar/O2 mixtures to emphasize their effectiveness in the decontamination and sterilization of biomedical surfaces. Figure 13a shows an increase in the density of electrons in both mixture gases for an input power varying between 0.1 and 1000 W. The higher electron density in Ar/O2 generates reactive species that are essential for initiating antimicrobial activations. This could be assigned to the lower excitation and ionization energy levels of argon gas (11.6 and 15.8 eV, respectively) compared to helium gas (19.8 and 24,6 eV, respectively). Electron temperature decreased for both gases mixtures with increasing power. This behavior is important in He/O2, which displays greater electron temperature than in Ar/O2.
Figure 14 represents the densities of reactive oxygen species (ROS) as a function of input power. As input power increases, the density of atomic oxygen becomes important. This is crucial for ensuring good plasma sterilization. Ar/O2 has higher reactive oxygen species densities than He/O2. This agrees with previous experimental results revealing the high impact of Ar/O2 in sterilizing bacteria than compared to He/O2 [49].
We studied the average particles densities of He/O2 and Ar/O2 for varied oxygen percentages (see, Figure 15). The atomic oxygen and ozone densities of He/O2 and Ar/O2 are augmented by increasing oxygen gas rates, whereas metastable oxygen atoms decrease. The atomic oxygen and ozone of Ar/O2 increased due to the rise of electron temperature (see Figure 9). When the oxygen gas ratio is equal or higher than 30%, the density of atomic oxygen is saturated. Calculated results confirm previous experimental results [50].
The oxygen ratio dependence of electron current density is studied at two frequencies 13.56 MHz and 100 MHz (see Figure 16). Herein, the electron current density drops for elevated oxygen gas rates. This diminution of plasma electron density is associated with a drop in electron current density. This results in larger O atom generatio, which improves plasma sterilization [51].

4. Conclusions

In a radio frequency (RF), low pressure capacitively coupled Ar/O2 mixture, plasma parameters such as average particles densities (ne), and electron temperature (Te) have been examined. The electrical discharge is found located in the abnormal glow discharge zone. The current decreases by increasing O2 gas ratio in Ar/O2 mixtures. Electron temperature (Te) increases with voltage and decreases with higher working pressure. This is contrary to electron density (ne), which is enhanced in both conditions. A pronounced O atom generation rate is found for a higher driving frequency. The atomic oxygen, the ozone, and the excited oxygen atom and molecules, which are efficient for sterilization process, remain the dominant species in the plasma discharge even at 20% O2. As the admixture of oxygen increased, electron density decreased due to attachment reaction mechanisms. The atomic oxygen and ozone densities of Ar/O2 increased, ensuring better sterilization. The effect of the addition of the O2 ratio to the Ar/O2 gaseous mixture on electrical characteristics, electron density, electron temperature, and density of different species in the mixture discharge resulted in an optimal discharge at 30% gas ratio. On the other hand, the average particles densities of the reactive species in He/O2 are nearly one order of magnitude lower than those in Ar/O2. These findings reveal the Ar/O2 has high ability in sterilizing bacteria than He/O2. Calculated results of mixture Ar/O2 are confirmed by previous experimental results in the literature.

Author Contributions

Conceptualization, methodology, software, validation, formal analysis, investigation, resources, data curation, writing—original draft preparation, writing—review and editing, and visualization, S.E., F.H.A., A.B.G.T., and L.A.E.M.; supervision and project administration, K.C. All authors have read and agreed to the published version of the manuscript.

Funding

This research was funded by Princess Nourah bint Abdulrahman University Researchers, Supporting Project number (PNURSP2022R38), Princess Nourah bint Abdulrahman University, Riyadh, Saudi Arabia.

Institutional Review Board Statement

Not applicable.

Informed Consent Statement

Not applicable.

Data Availability Statement

Data are contained within the article.

Acknowledgments

The authors express their gratitude to Princess Nourah bint Abdulrahman University Researchers Supporting Project number (PNURSP2022R38), Princess Nourah bint Abdulrahman University, Riyadh, Saudi Arabia.

Conflicts of Interest

The authors declare no conflict of interest.

References

  1. Rutala, W.A.; Weber, D.J. Disinfection, sterilization, and antisepsis: An overview. Am. J. Infect. Control 2019, 47, A3–A9. [Google Scholar] [CrossRef] [PubMed]
  2. Sakudo, A.; Yagyu, Y.; Onodera, T. Disinfection and Sterilization Using Plasma Technology: Fundamentals and Future Perspectives for Biological Applications. Int. J. Mol. Sci. 2019, 20, 5216. [Google Scholar] [CrossRef] [PubMed] [Green Version]
  3. Barjasteh, A.; Dehghani, Z.; Lamichhane, P.; Kaushik, N.; Choi, E.H.; Kaushik, N.K. Recent Progress in Applications of Non-Thermal Plasma for Water Purification, Bio-Sterilization, and Decontamination. Appl. Sci. 2021, 11, 3372. [Google Scholar] [CrossRef]
  4. Laroussi, M. Cold Plasma in Medicine and Healthcare: The New Frontier in Low-Temperature Plasma Applications. AIP Conf. Proc. 2020, 8, 74. [Google Scholar] [CrossRef]
  5. Chen, Z.; Garcia, G., Jr.; Arumugaswami, V.; Wirz, R.E. Cold atmospheric plasma for SARS-CoV-2 inactivation. Phys. Fluids 2020, 32, 111702. [Google Scholar] [CrossRef]
  6. Mravlje, J.; Regvar, M.; Vogel-Mikus, K. Development of Cold Plasma Technologies for Surface Decontamination of Seed Fungal Pathogens: Present Status and Perspectives. J. Fungi 2021, 7, 650. [Google Scholar] [CrossRef]
  7. Ben Belgacem, Z.; Carré, G.; Charpentier, E.; Le-Bras, F.; Maho, T.; Robert, E.; Pouvesle, J.-M.; Polidor, F.; Gangloff, S.C.; Boudifa, M.; et al. Innovative non-thermal plasma disinfection process inside sealed bags: Assessment of bactericidal and sporicidal effectiveness in regard to current sterilization norms. PLoS ONE 2017, 12, e0180183. [Google Scholar] [CrossRef] [Green Version]
  8. Khlyustova, A.; Cheng, Y.; Yang, R. Vapor-deposited functional polymer thin films in biological applications. J. Mater. Chem. B 2020, 8, 6588. [Google Scholar] [CrossRef]
  9. Rossi, F.; Kylian, O.; Rausher, H.; Gilliland, D.; Sirghi, L. Use of a low-pressure plasma discharge for the decontamination and sterilization of medical devices. Pure App. Chem. 2008, 80, 1939–1951. [Google Scholar] [CrossRef]
  10. Bolshakov, A.A.; Cruden, B.A.; Mogul, R.; Rao, M.V.V.S.; Sharma, S.P.; Khare, B.N.; Meyyappan, M. Radio-frequency oxygen plasma as a sterilization source. AIAA J. 2004, 42, 823–832. [Google Scholar] [CrossRef]
  11. Moisan, M.; Barbeau, J.; Crevier, M.C.; Pelletier, J.; Phillips, N.; Saoudi, B. Plasma sterilization methods and mechanisms. Pure Appl. Chem. 2002, 74, 349–358. [Google Scholar] [CrossRef]
  12. Flores, O.; Castillo, F.; Martinez, H.; Villa, M.; Villalobos, S.; Reyes, P. Characterization of direct current He-N2 mixture plasma using optical emission spectroscopy and mass spectrometry. Phys. Plasmas 2014, 21, 053502. [Google Scholar] [CrossRef]
  13. Younus, M.; Rehman, N.; Shafiq, M.; Zakaullah, M.; Abrar, M. Evolution of plasma parameters in a He-N2/Ar magnetic pole enhanced inductive plasma source. Phys. Plasmas 2016, 23, 023512. [Google Scholar] [CrossRef]
  14. Goree, J.; Liu, B.; Drake, D. Gas flow dependence for plasma-needle disinfection of S. mutans bacteria. J. Phys. D Appl. Phys. 2006, 39, 3479. [Google Scholar] [CrossRef] [Green Version]
  15. Perni, S.; Shama, G.; Hobman, J.; Lund, P.; Kershaw, C.; Hidalgo-Arroyo, G.; Penn, C.; Deng, X.T.; Walsh, J.L.; Kong, M.G. Probing bactericidal mechanisms induced by cold atmospheric plasmas with Escherichia coli mutants. Appl. Phys. Lett. 2007, 90, 073902. [Google Scholar] [CrossRef]
  16. Jazbec, K.; Šala, M.; Mozetič, M.; Vesel, A.; Gorjanc, M. Functionalization of cellulose fibers with oxygen plasma and ZnO nanoparticles for achieving UV protective properties. J. Nanomater. 2015, 16, 25. [Google Scholar] [CrossRef] [Green Version]
  17. Ko, Y.M.; Myung, S.W.; Kim, B.H. O2/Ar Plasma Treatment for Enhancing the Biocompatibility of Hydroxyapatite Nanopowder and Polycaprolactone Composite Film. J. Nanosci. Nanotechnol. 2015, 15, 6048–6052. [Google Scholar] [CrossRef]
  18. Fiebrandt, M.; Lackmann, J.W.; Stapelmann, K. From patent to product? 50 years of low-pressure plasma sterilization. Plasma Process. Polym. 2018, 15, 1800139. [Google Scholar] [CrossRef] [Green Version]
  19. Sharma, S.; Cruden, B.; Rao, M.; Bolshakov, A. Analysis of emission data from O2 plasmas used for microbe sterilization. J. Appl. Phys. 2004, 95, 3324–3333. [Google Scholar] [CrossRef]
  20. Rossi, F.; Kylián, O.; Rauscher, H.; Hasiwa, M.; Gilliland, D. Low pressure plasma discharges for the sterilization and decontamination of surfaces. New J. Phys. 2009, 11, 115017. [Google Scholar] [CrossRef]
  21. Dai, H.; Li, L.; Ren, S.; Gong, X.; Wu, H.; Xiong, J.; Yu, B. Effects of Atmosphere on the Evolution Process of Graphite Electrodes under the Pulsed. In proceeding of the 2019 IEEE Pulsed Power & Plasma Science (PPPS), Orlando, FL, USA, 23–29 June 2019; IEEE: Orlando, FL, USA, 2019. [Google Scholar] [CrossRef]
  22. Khalaf, M.K.; Agool, I.R.; Abd Muslim, S.H. Electrical characteristics and plasma diagnostics of Ar/O2 gas mixture glow discharge. Int. J. Appl. Innov. Eng. Manag. 2014, 3, 113–119. [Google Scholar]
  23. Chen, X.; Tan, Z.; Liu, Y.; Wang, X.; Li, X. Effects of oxygen concentration on the electron energy distribution functions in atmospheric pressure helium/oxygen and argon/oxygen needle electrode plasmas. J. Phys. D Appl. Phys. 2018, 51, 375202. [Google Scholar] [CrossRef]
  24. Zhang, H.; Guo, Y.; Liu, D.; Sun, B.; Liu, Y.; Yang, A.; Wang, X. Effects of oxygen concentration on helium-oxygen dielectric barrier discharge: From multi-breakdowns to single breakdown per half-cycle. Phys. Plasmas 2018, 25, 103511. [Google Scholar] [CrossRef]
  25. Anjum, Z.; Rehman, N.U. Temporal evolution of plasma parameters in a pulse modulated capacitively coupled Ar/O2 mixture discharge. AIP Adv. 2020, 10, 115005. [Google Scholar] [CrossRef]
  26. Jabur, Y.K.; Hammed, M.G.; Khalaf, M. DC glow discharge plasma characteristics in Ar/O2 gas mixture. Iraqi J. Sci. 2021, 62, 475–482. [Google Scholar] [CrossRef]
  27. COMSOL Multiphysics® v. 5.4; COMSOL AB, Stockholm, Sweden. 2019. Available online: http://www.comsol.com (accessed on 1 November 2021).
  28. Li, S.Z.; Wu, Q.; Zhang, J.; Wang, D.; Uhm, H.S. Discharge characteristics of a radiofrequency capacitively coupled Ar/O2 glow discharge at atmospheric pressure. Thin Solid Film. 2011, 519, 6990–6993. [Google Scholar] [CrossRef]
  29. Rabah, T. Influence of Plasma Parameters and Circuit Connecting on Harmonics Generated in Ar/O2 13.56 MHz Plasma Discharge. Adv. Mater. Res. 2011, 227, 181–184. [Google Scholar]
  30. Loureiro, J.; Amorim, J. Kinetics and Spectroscopy of Low Temperature Plasmas; Springer: Berlin/Heidelberg, Germany, 2016; pp. 43–87. [Google Scholar] [CrossRef]
  31. Elaissi, S.; Yousfi, M.; Helali, H.; Kazziz, S.; Charrada, K.; Sassi, M. RF weakly electronegatif gas discharge behavior in parallel plate reactor for material processing. Plasma Devices Oper. 2006, 14, 1. [Google Scholar] [CrossRef]
  32. Park, G.; Lee, H.; Kim, G.; Lee, J.K. Global Model of He/O2 and Ar/O2 atmospheric pressure glow discharges. Plasma Process. Polym. 2008, 5, 569–576. [Google Scholar] [CrossRef]
  33. Pan, G.; Tan, Z.; Pan, J.; Wang, X.; Shan, C. A comparative study on the frequency effects of the electrical characteristics of the pulsed dielectric barrier discharge in He/O2 and in Ar/O2 at atmospheric pressure. Phys. Plasmas 2016, 23, 043508. [Google Scholar] [CrossRef]
  34. Rebiaï, S.; Bahouh, H.; Sahli, S. 2-D Simulation of Dual Frequency Capacitively Coupled Helium Plasma, using COMSOL Multiphysics. IEEE Trans. Dielectr. Electr. Insul. 2013, 20, 5. [Google Scholar] [CrossRef]
  35. COMSOL Multiphysics V5.4, COMSOL AB, COMSOL Multiphysics Reference Manual, Stockholm, Sweden. 2019. Available online: https://scholar.google.com/scholar?hl=fr&as_sdt=0%2C5&=35.%09COMSOL+Multiphysics+V5.4%2C+COMSOL+AB%2C+COMSOL+Multiphysics+Reference+Manual%2C+Stockholm%2C+Sweden%2C+2019&btnG= (accessed on 8 November 2021).
  36. COMSOL Multiphysics V5.4, Plasma Module, User’s Guide, COMSOL AB: Stockholm, Sweden. 2019. Available online: https://scholar.google.com/scholar_lookup?title=Multiphysics+V5.4.+Plasma+Module,+User%E2%80%99s+Guide&author=COMSOL&publication_year=2019 (accessed on 8 November 2021).
  37. Vanja, M.; Damir, V. Experimental study of Ar-O2 low-pressure discharge. Fiz. A 1998, 7, 49–63. Available online: http://fizika.hfd.hr/fizika_a/av98/a7p049.htm (accessed on 8 November 2021).
  38. Jorge, S.C.; Grace, V.; Laura, B.; Rawson-Acuña, F.E.; Asenjo, J.; Mora, J.; Ivan Vargas, V. Effectiveness and Efficiency Optimization Study of Oxygen and Argon DC Low-Pressure Plasma Sterilization. In Proceedings of the IEEE 16th Latin American Workshop on Plasma Physics (LAWPP), Mexico City, Mexico, 4–8 September 2017. [Google Scholar] [CrossRef]
  39. Wilczek, S.; Schulze, J.; Brinkmann, R.P.; Donkó, Z.; Trieschmann, J.; Mussenbrock, T. Electron dynamics in low pressure capacitively coupled radio frequency discharges. J. Appl. Phys. 2020, 127, 181101. [Google Scholar] [CrossRef]
  40. Liu, Z.; Huang, B.; Zhu, W.; Zhang, C.; Tu, X.; Shao, T. Phase-Resolved Measurement of Atmospheric-Pressure Radio-Frequency Pulsed Discharges in Ar/CH4/CO2 Mixture. Plasma Chem. Plasma Process. 2020, 40, 937–953. [Google Scholar] [CrossRef]
  41. Merlino, R.L. Understanding Langmuir probe current-voltage characteristics. Am. J. Phys. 2007, 75, 12. [Google Scholar] [CrossRef] [Green Version]
  42. Rudd, M.E.; DuBois, R.D.; Toburen, L.H.; Ratcliffe, C.A.; Goff, T.V. Cross sections for ionization of gases by 5—4000-keV protons and for electron capture by 5—150-Kev protons. Phys. Rev. A 1983, 28, 6. [Google Scholar] [CrossRef]
  43. Park, J.; Henins, I.; Herrmann, H.W.; Selwyn, G.S. Discharge phenomena of an atmospheric pressure radio-frequency capacitive plasma source. J. Appl. Phys. 2001, 89, 20. [Google Scholar] [CrossRef] [Green Version]
  44. Stadnichenko, A.I.; Kibis, L.S.; Svintsitskiy, D.A.; Koshcheev, S.V.; Boronin, A.I. Application of RF discharge in oxygen to create highly oxidized metal layers. Surf. Eng. 2018, 34, 1. [Google Scholar] [CrossRef]
  45. Zhang, Y.F.; Luo, H.X.; Guo, Z.; Zhen, X.J.; Chen, M.; Liu, J.N. Cleaning of carbon-contaminated optics using O2/Ar plasma. Nucl. Sci. Tech. 2017, 28, 127. [Google Scholar] [CrossRef]
  46. Legorreta, J.R.; Yousif, F.B.; Fuentes, B.E.; Vázquez, F.; Rivera, M.; Valencia, H.M. Characterization of Ar–O2 DC Discharge Employing Langmuir Probe in Conjunction with Photo detachment. IEEE Trans. Plasma Sci. 2016, 44, 1150–1154. [Google Scholar] [CrossRef]
  47. Gudmundsson, J.T.; Thorsteinsson, E.G. Oxygen discharges diluted with argon: Dissociation processes. Plasma Sources Sci. Technol. 2007, 16, 399–412. [Google Scholar] [CrossRef]
  48. Moreira, A.J.; Mansano, R.D.; Pinto, T.J.A.; Ruas, R.; Zambon, L.S.; Silva, M.V.; Verdonck, P.B. Sterilization by oxygen plasma. Appl. Surf. Sci. 2004, 235, 151–155. [Google Scholar] [CrossRef]
  49. Boscariol, M.R.; Moreira, A.J.; Mansano, R.D.; Kikuchi, I.S.; Pinto, T.J.A. Sterilization by pure oxygen plasma and by oxygen–hydrogen peroxide plasma: An efficacy study. Int. J. Pharm. 2008, 353, 170–1752. [Google Scholar] [CrossRef] [PubMed]
  50. Hassouba, M.A.; Galaly, A.R.; Rashed, U.M. Numerical Calculations of Some Plasma Parameters of the Capacitively Coupled RF Discharge. J. Mod. Phys. 2014, 5, 591–598. [Google Scholar] [CrossRef] [Green Version]
  51. Srivastava, A.K.; Garg, M.K.; Ganesh Prasad, K.S.; Kumar, V.; Chowdhuri, M.B.; Prakah, R. Characterization of atmospheric pressure glow discharge in helium using Langmuir probe emission spectroscopy and discharge resistivity. IEEE Trans. Plasma Sci. 2007, 35, 4. [Google Scholar] [CrossRef]
Figure 1. Experimental setup of plasma sterilization using RF capacitively coupled plasma discharge.
Energies 15 01589 g001
Figure 2. Computational domain.
Energies 15 01589 g002
Figure 3. Variation of electron temperature with pressure in RF glow discharge. The solid and dotted lines represent the model calculations in pure argon and in the (Ar + 10% O2) mixture. The experimental measurements were carried out with Langmuir probes [37].
Energies 15 01589 g003
Figure 4. Distribution of different particles density at 0.3 Torr total gas pressure, RF voltage (150 V, 13.56 MHz), and 20% O2. (*) Excited state of atoms.
Energies 15 01589 g004
Figure 5. Density distribution of (a) atomic oxygen (O), (b) excited oxygen atoms O*(1D), (c) exited argon atoms (Ar*), and (d) ozone O3 at 0.3 Torr total gas pressure, RF voltage (150 V, 13.56 MHz), and 20% O2.
Energies 15 01589 g005
Figure 6. Electron density distribution at different instants of cycle RF (t): (a) t = T/4, (b) t = T/2, (c) t = 3T/4, and (d) t = T, at 0.3 Torr total gas pressure, RF voltage (150 V, 13.56 MHz), and 20% O2.
Energies 15 01589 g006
Figure 7. Electron temperature distribution at different instants of cycle RF (t): (a) t = T/4, (b) t = T/2, (c) t = 3T/4, and (d) t = T, at 0.3 Torr total gas pressure, RF voltage (150 V, 13.56 MHz), and 20% O2.
Energies 15 01589 g007
Figure 8. The current–voltage curve at various O2 gas rates, f = 13.56 MHz, and working pressure 0.3 Torr.
Energies 15 01589 g008
Figure 9. The discharge voltage and input power as a function of current at 30% O2 gas rate, f = 13.56 MHz, and working pressure 0.3 Torr.
Energies 15 01589 g009
Figure 10. Density and temperature of electrons as a function of applied voltage in Ar/O2 mixture (O2 = 20%), f = 13.56 MHz, and working pressure 0.3 Torr.
Energies 15 01589 g010
Figure 11. (a) Electron density and (b) electron temperature as a function of input power in Ar/O2 at different working pressures (P = 0.2 Torr, 0.3 Torr, and 0.5 Torr) and (20%) O2.
Energies 15 01589 g011
Figure 12. Density and temperature of electrons in Ar/O2 mixture for different O2 percentages at 0.3 Torr total gas pressure and RF voltage (150 V, 13.56 MHz).
Energies 15 01589 g012
Figure 13. (a) Density and (b) electron temperature as a function of input power in Ar/O2 and He/O2 at (20%) O2 and (0.3 Torr) pressure.
Energies 15 01589 g013
Figure 14. Variations of average particles densities of He/O2 and Ar/O2 with power (P = 0.3 Torr, f = 13.56 MHz). (*) Excited state of atoms.
Energies 15 01589 g014
Figure 15. Average particles densities of Ar/O2 and He/O2 for different O2 percentage at 0.3 Torr pressure and 13.56 MHz frequency. (*) Excited state of atoms.
Energies 15 01589 g015
Figure 16. Dependence of electron current density with oxygen gas ratio at two different frequencies f = 13.56 MHz and f = 100 MHz with working pressure 0.3 Torr.
Energies 15 01589 g016
Table 1. Various species incorporated in the plasma model.
Neutral SpeciesExcited SpeciesIonsElectrons
ArAr* (in metastable level)Ar+e
O2O2*(1Δg)O2+
OO*(1D)O+
O3 O
* Excited state of atoms.
Table 2. List of reactions for Oxygen in Ar/O2 mixture.
No.ReactionRate Coefficient
Principal Reaction for Oxygen
R1e + O2 ➔ O2 + e4.7 × 10−14 Te0.5 (m3 s−1)
R2e + O2 ➔ O + O8.8 × 10−17 exp (−4.4/Te) (m3 s−1)
R3e + O2 ➔ 2O + e4.2 × 10−15 exp (−5.6/Te) (m3 s−1)
R4e + O2 ➔ O2+ + 2e9 × 10−16 Te0.5 exp (−12.6/Te) (m3 s−1)
R5e + O ➔ O + 2e2 × 10−13 exp (−5.5/Te) (m3 s−1)
R6e + O2+ ➔ O + O(1D)2.2 × 10⁻¹⁴ Te−0.5 (m3 s−1)
R7e + O2 ➔ O + O+ + e7.1 × 10−17 Te0.5 exp (−17/Te) (m3 s−1)
R8e + O ➔ O + O+ + 2e5.3 × 10−16 Te0.9 exp (−20/Te) (m3 s−1)
R9e + O ➔ O+ + 2e9 × 10−15 Te0.7 exp (−13.6/Te) (m3 s−1)
R10e + O3 ➔ O2 + O1 × 10−15 (m3 s−1)
R11O + O2+ ➔ O + O22 × 10−13 (200/Tg)0.5 (m3 s−1)
R12O + O ➔ O2 + e5 × 10−16 (m3 s−1)
R13O + O2+ ➔ 3O1 × 10−13 (m3 s−1)
R14O + O ➔ 2O2 × 10−13 (300/Tg)0.5 (m3 s−1)
R15O+ + O2 ➔ O + O2+2 × 10⁻¹⁷ (300/Tg)0.5 (m3 s−1)
R16O + O2 ➔ O3 + e5 × 10−21 (m3 s−1)
R17O3 + O2 ➔ 2O2 + O7.3 × 10−16 exp (−11400/Tg) (m3 s−1)
R18O3 + O ➔ 2O21.81 × 10−17 exp (−2300/Tg) (m3 s−1)
R19e + O2 + O2 ➔ O2 + O22.26 × 10−42 (300/Tg)0.5 (m3 s−1)
R20O + O2 + O2 ➔ O3 + O26.9 × 10−40 (300/Tg)1.25 (m3 s−1)
R21e + O2 ➔ O + O*(1D) + e5.0 × 10−14 Te0.22 exp (−8.4/Te) (m3 s−1)
R22e + O ➔ O*(1D) + e4.2 × 10−15 exp (−2.25/Te) (m3 s−1)
R23e + O*(1D) ➔ O + e8 × 10−15 (m3 s−1)
R24e + O*(1D) ➔ O+ + 2e9 × 10−15 Te0.7 exp (−11.6/Te) (m3 s−1)
R25O*(1D) + O➔ 2O8 × 10−18 (m3 s−1)
R26O*(1D) + O2 ➔ O + O27 × 10−18 exp (67/Tg) (m3 s−1)
R27O*(1D) + O2 ➔ O + O2*(1Δg)1 × 10⁻¹⁸ (m3 s−1)
R28e + O2 ➔ O2*(1Δg) + e1.7 × 10−15 exp (−3.1/Te) (m3 s−1)
R29e + O2*(1Δg) ➔ O2 + e5.6 × 10−15 exp (−2.2/Te) (m3 s−1)
R30O2*(1Δg) + O2 ➔ 2O22.2 × 10−24 (Tg/300)0.8 (m3 s−1)
R31O2*(1Δg) + O ➔ O + O27 × 10−22 (m3 s−1)
R32O + O2*(1Δg) ➔ O3 + e3 × 10−16 (m3 s−1)
R33O + O2*(1Δg) ➔ O2 + O1 × 10−16 (m3 s−1)
R34O2*(1Δg) + O3 ➔ 2O2 + O6.01 × 10−17 exp (−2853/Tg) (m3 s−1)
Tg (K) and Te (eV)
* Excited state of atoms.
Table 3. List of reactions for Argon in Ar/O2 mixture.
No.ReactionRate Coefficient
Principal Reaction for Argon
R35e + Ar ➔ Ar + e3.9 × 10−19 exp (−4.6/Te) (m3 s−1)
R36e + Ar ➔ Ar* + e5.0 × 10−15 exp (−12.64/Te) (m3 s−1)
R37e + Ar ➔ Ar+ + 2e2.3 × 10−14 Te0.59 exp (−17.44/Te) (m3 s−1)
R38e + Ar* ➔ Ar+ + 2e6.8 × 10−15 Te0.67 exp (−4.2/Te) (m3 s−1)
R39e + Ar* ➔ Ar + e4.3 × 10−16 Te0.74 (m3 s−1)
Principal Reaction between Argon and Oxygen
R40O2 + Ar* ➔ O2 + Ar1.0 × 10−15 (m3 s−1)
R41O + Ar* ➔ O + Ar4.1 × 10−17 (m3 s−1)
R42O2 + Ar* ➔ 2O + Ar1.01 × 10−16 (m3 s−1)
R43O2 + Ar+ ➔ O2+ + Ar4.9 × 10−17 (300/Tg)0.78 (m3 s−1)
R44O + Ar+ ➔ O+ + Ar6.4 × 10−18 (m3 s−1)
Tg (K) and Te (eV)
* Excited state of atoms.
Table 4. List of reactions for helium in He/O2 mixture.
No.ReactionRate Coefficient
Principal Reaction for Helium
R1e + He ➔ He* + e4.2 × 10−15 Te0.31 exp (−19.8/Te) (m3 s−1)
R2e + He* ➔ He + e2 × 10−16 (m3 s−1)
R3e + He ➔ He+ + 2e1.5 × 10−15 Te0.68 exp (−24.6/Te) (m3 s−1)
R4e + He* ➔ He+ + 2e1.28 × 10−13 Te0.6 exp (−4.78/Te) (m3 s−1)
R5e + He2* ➔ He2+ + e9.75 × 10−16 Te0.71 exp (−3.4/Te) (m3 s−1)
R6e + He2+ ➔ He* + He5 × 10−15 Te−0.5 (m3 s−1)
R7e + He2+ ➔ He + He2 × 10−14 (m3 s−1)
R8e + He2+ + He➔ 3He2 × 10−39 (m3 s−1)
R9e + e + He2+ ➔ 2He + e5 × 10−29 Te−4.5 (m6 s−1)
R10He* + He* ➔ He+ + He + e2.7 × 10−16 (m3 s−1)
R11He* + 2He ➔ He2* + He1.3 × 10−45 (m6 s−1)
R12He+ + 2He ➔ He2+ + He1 × 10−43 (m6 s−1)
Principal Reaction between Helium and Oxygen
R13e + O2 + He ➔ O2 + He1 × 10−43 (m6 s−1)
R14O2 + He* ➔ O2+ + He + e2.54 × 10−16 (3000/Tg)−0.5 (m3 s−1)
R15O2 + He + O ➔ O3 + He6.27 × 10−46 (m6 s−1)
R16O + O + He ➔ O2 + He1.3 × 10−45 (m3 s−1)
R17O2*(1Δg) + He ➔ O2 + He8 × 10−27 (m3 s−1)
Tg (K) and Te (eV)
* Excited state of atoms.
Table 5. Surface reactions.
ReactionFormulaSticking Coefficient
1O2*(1Δg) ➔ O21
2O2+ ➔ O21
3O*(1D) ➔ O1
4O+ ➔ O1
5O + O ➔ O21 × 10−3
6Ar+ ➔ Ar1
7Ar* ➔ Ar1
* Excited state of atoms.
Publisher’s Note: MDPI stays neutral with regard to jurisdictional claims in published maps and institutional affiliations.

