Article

Bioremediation of Agriculture Soil Contaminated by Organic Pollutants

1
Faculty of Agriculture, University of Zagreb, 10000 Zagreb, Croatia
2
Faculty of Science, University of Zagreb, 10000 Zagreb, Croatia
3
Faculty of Mining Geology and Petroleum Engineering, University of Zagreb, 10000 Zagreb, Croatia
*
Author to whom correspondence should be addressed.
Energies 2022, 15(4), 1561; https://doi.org/10.3390/en15041561
Submission received: 25 January 2022 / Revised: 14 February 2022 / Accepted: 18 February 2022 / Published: 20 February 2022

Abstract

:
Pipeline spills and pollution of the environment by crude oil pose a threat to natural resources, especially soil and water. One such incident occurred on 25 September 2018 in the area of Budrovac (Croatia; 46°00′14.6″ N 17°04′16.8″ E) on agricultural land as a pipeline spill. Bioremediation of the contaminated soil was carried out with organic pollutants using an environmentally safe absorbent Spill-Sorb (Canadian Sphagnum Peat Moss) and a mineral fertilizer—nitrogen. The experiment was conducted in the greenhouse of the Faculty of Agriculture, Croatia, during a six-month (October 2018–April 2019) study. Samples of agricultural soils contaminated with total petroleum hydrocarbons (TPHs) and polycyclic aromatic hydrocarbons (PAHs) were taken after the rupture of the local gas condensate pipeline. The experiment was conducted in five treatments in triplicate: I-control (clean soil); II-100% contaminated soil + organic absorbent + nitrogen; III-100% contaminated soil + organic absorbent; IV-50% clean soil + 50% contaminated soil + organic absorbent + nitrogen; and V-50% clean soil + 50% contaminated soil + organic absorbent. The soil properties studied were pH, organic matter content, carbon and nitrogen content and ratio, and changes in the concentration of potential organic contaminants—TPHs and individual PAHs. The results demonstrated that the mixture of organic absorbent and nitrogen efficiently removed organic pollutants from the contaminated soil within six months. However, the application of Spill-Sorb alone was more effective for the degradation of hydrocarbons. The effectiveness of the absorbent studied was dependent on the concentration of organic pollutants and nitrogen application.

1. Introduction

All phases of crude oil and gas exploration and production, from drilling operations to the manufacture of underground pipeline canals, to transportation, refinement, and storage, involve environmentally hazardous interventions and processes [1]. Even if oil is extracted, delivered, and used, there is a high risk of spill [2]. Although modern technological solutions and appropriate materials used in all segments of the petroleum industry ensure a high level of safety, various incidents are unfortunately not completely excluded. Accidents resulting in pipeline spills and pollution of the environment by crude oil pose a threat to natural resources, especially soil and water, which, for example, make them unusable for crop production [1]. After entering the environment, oil or petroleum products can also have negative impacts on ecosystems, by significantly changing soil pH and soil aeration [2]. Immediately eliminating the consequences of oil spills should be one of the most important assignments of soil remediation after such incidents. This is the main reason why the methods of soil remediation after oil spills are constantly improving. One of the most widely used techniques for cleaning soil contaminated by organic pollutants is bioremediation [2,3]. In this applied method, the proliferation of soil microbes is the main factor for faster degradation of different hydrocarbons. Nowadays, the use of sorbent is considered very important due to their impact on soil pollution control. There are about 200 different sorbents for soil purification on the market [2]. However, the basic criteria for choosing the method to remediate contaminated soils are the type and amount of pollution [4,5], the location (in situ or ex situ), the agro-environmental conditions under which the remediation is to be carried out [6,7,8], and the soil type [9,10,11]. It can be stated that researchers who aim to preserve healthy soil will give preference to bioremediation, soil mixing, or natural attenuation [12,13,14]. Collectively, these methods are referred to as environmentally friendly, cost-effective technologies [15,16], because even after the remediation process, the soil remains as living soil with its edaphone (soil flora and fauna). Bioremediation is an ecologically and economically emerging method that maximizes the degradation of organic pollutants and minimizes the negative impact on soil [17]. In addition, the use of this technology has a relatively affordable price compared to the other methods [18]. However, according to some authors [19], bioremediation is a slow process and requires time for the best effects; therefore, it requires additional costs in the long term. Another very common method is the application of nitrogen fertilization to contaminated soils. Nitrogen improves the efficiency of organic pollutant degradation by serving as an initiator for oil-destroying microorganisms [2,20]. Nitrogen as an essential nutrient maintains the microbial population in the soil and consequently increases the rate of hydrocarbon degradation [17]. When petroleum and crude oil accidentally ends up on soil surface they are manifested as soil contaminants. They are composed of a large number of hydrocarbons, from light, volatile, short-chain to heavy, long-chain, branched components [21]. Soil containing these hydrocarbons can limit the land use [22], and petroleum residues can remain bound to the soils for years [23]. Soil contamination with total petroleum hydrocarbons (TPHs) and polycyclic aromatic hydrocarbons (PAHs) from crude oil is of increasing concern because it can be the cause of soil and groundwater contamination [24,25]. However, the total removal of PAHs and TPHs from soils is not practicable [26]. TPH includes hundreds of hydrocarbon compounds, and is mainly a mixture of alkanes, cycloalkanes, and aromatic hydrocarbons along with a considerable amount of nitrogen and sulphur compounds. TPHs can affect the growth and reproduction of vegetation [27,28]. PAHs are a constitute group of polycyclic hydrocarbons that have one or more benzene rings. PAHs can also be classified as various organic components that contain two or more fused aromatic rings of carbon and hydrogen atoms [29]. In the natural environment, their amount is low, almost negligible. However, due to various anthropogenic activities, their content may easily increase [30]. As PAHs have potential toxicity, the United States Environmental Protection Agency (US EPA) has classified 16 types as major pollutants. According to Patel et al. [31], PAHs are acknowledged as the most significant of all petroleum products. The most effective of the bioremediation measures is the photodegradation of PAHs, i.e., exposure of contaminated soil to natural radiation [31] or degradation by microorganisms [32]. However, there is still a need to consider and explore remediation measures based on different approaches to mitigate soil contamination [17,19].
The objective of this study is to investigate the effects of environmentally acceptable absorbent and nitrogen additions on the success of the ex situ bioremediation of soils contaminated with TPHs and PAHs due to the rupture of a local oil pipeline. The research hypothesis is that biological absorbers would remediate the contaminated soil and that the added nitrogen would enhance the degradation processes of the organic contaminants (TPHs and PAHs) in the soil.

2. Materials and Methods
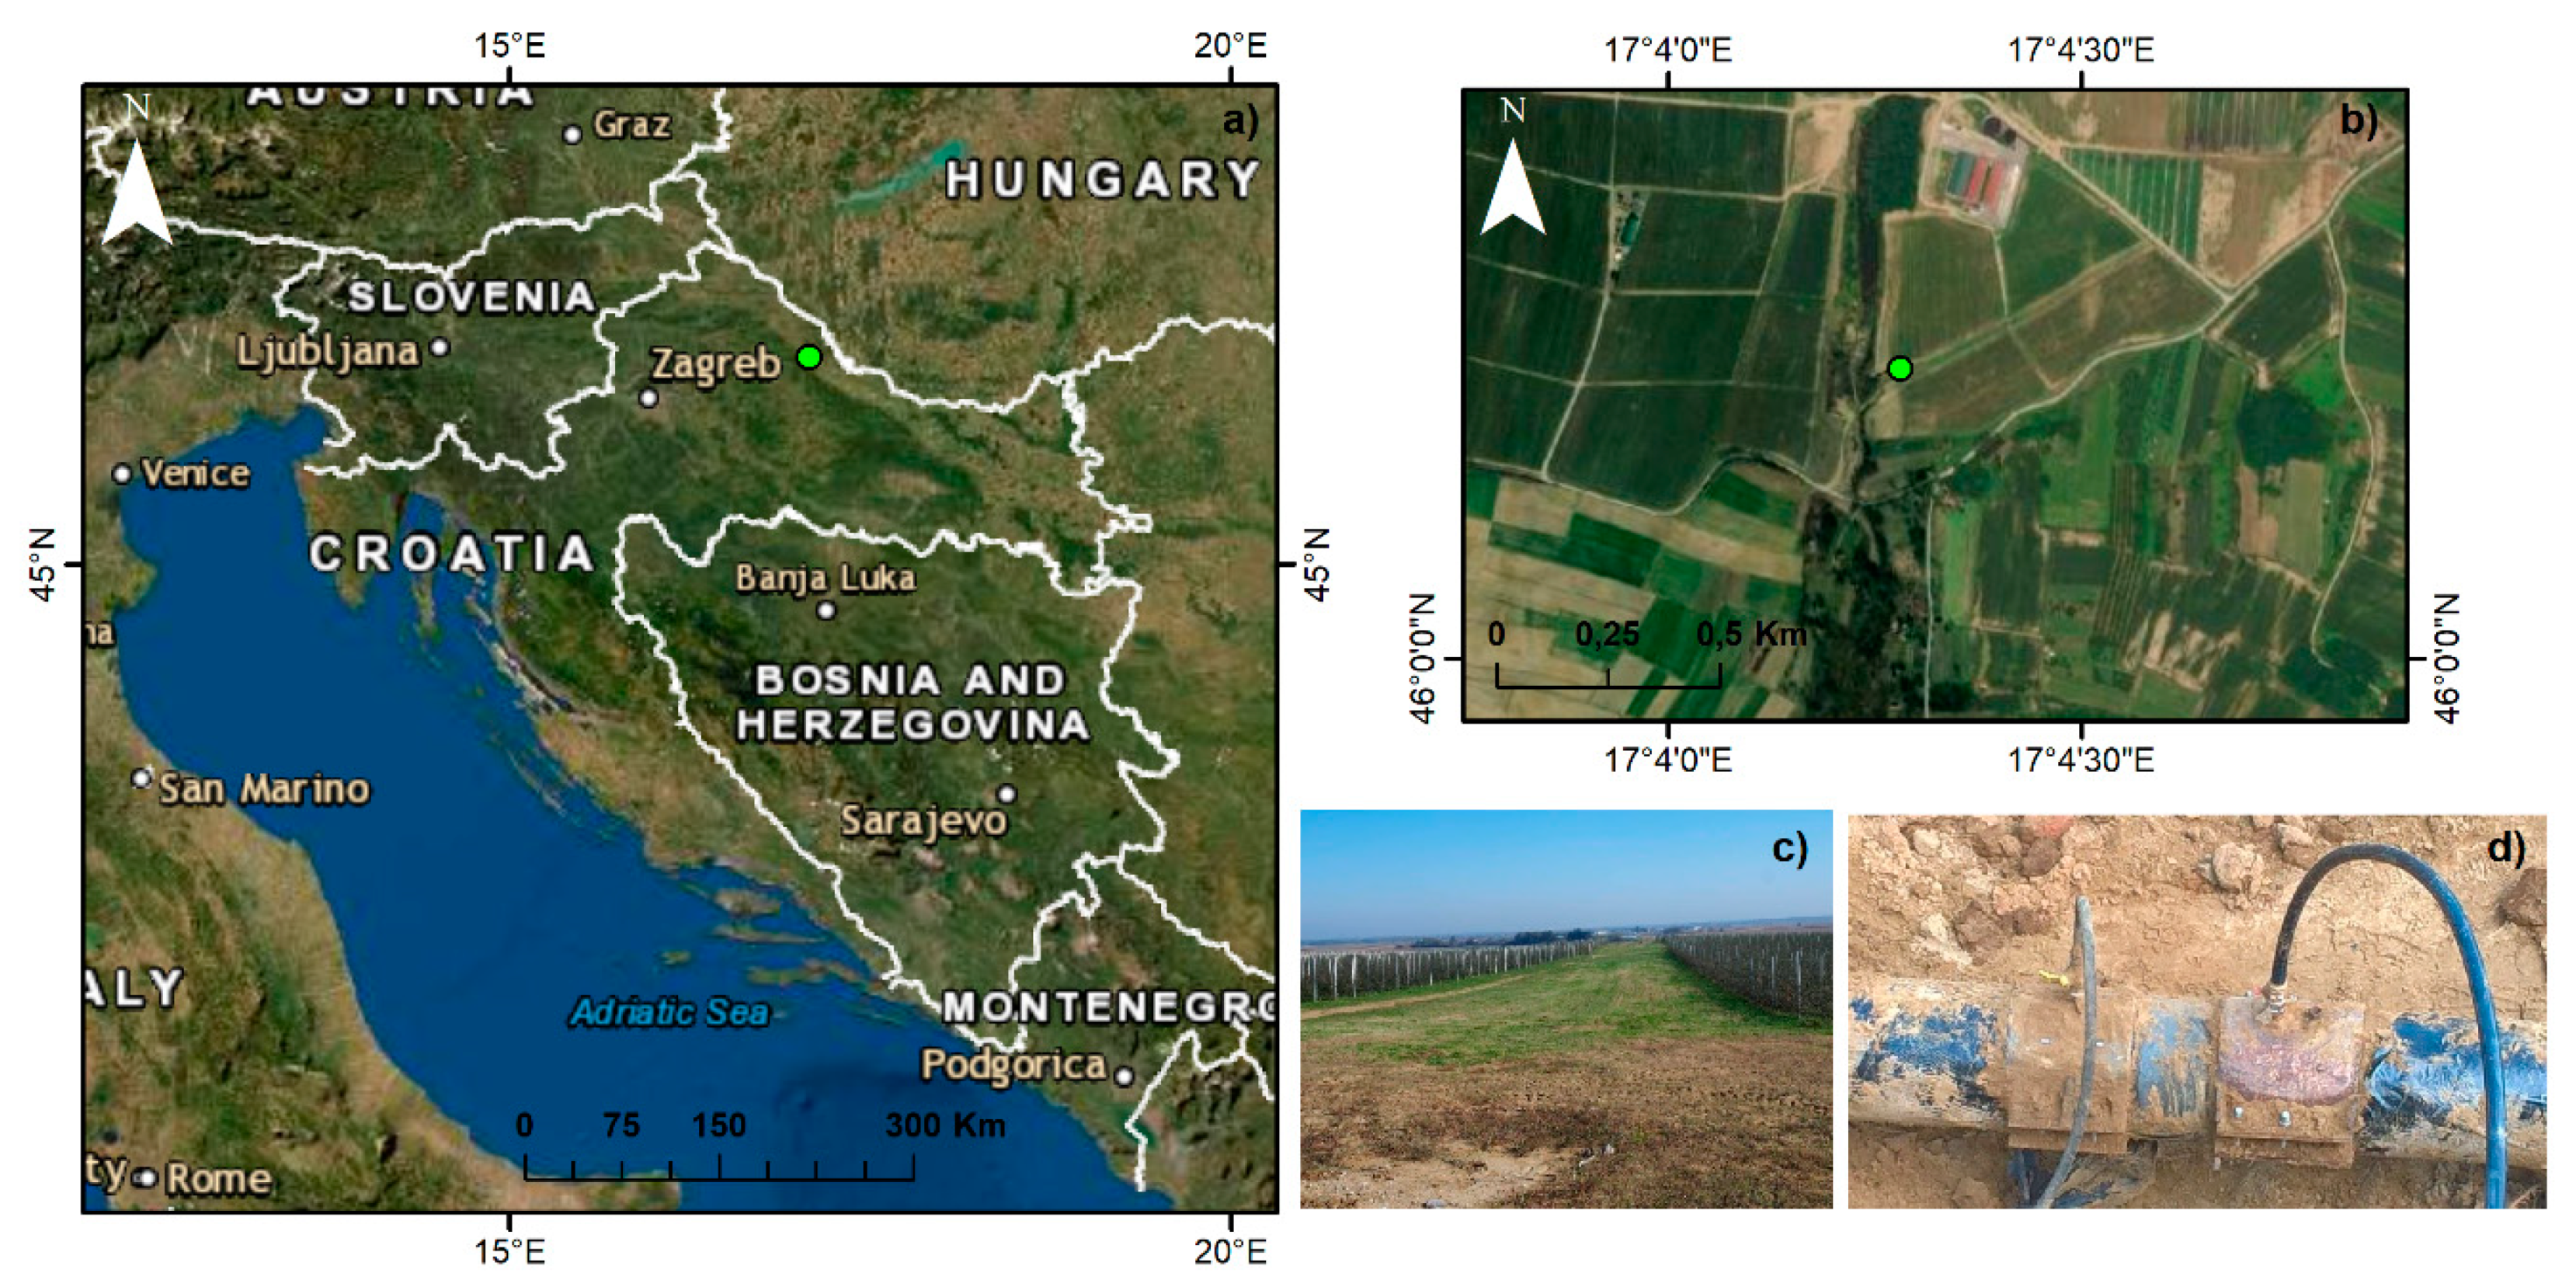
2.1. Study Area

One of the main reasons for the damage of the oil and gas condensate pipeline is the illegal and unprofessional installation of clamps with a trap to alienate the contents of the pipeline. Such an incident occurred on 25 September 2018, as a leak on the route of the gas condensate pipeline from the Budrovac junction to the Sandrovac distribution station (in the area of Budrovac, Koprivnicko-krizevacka County, Republic of Croatia; 46°00′14.6″ N 17°04′16.8″ E; Figure 1a) was caused by an illegal connection (theft of gas condensate). The area around the rupture site is dominated by orchards, field crops, and vegetable crops (Figure 1b). The consequences can be observed in the contaminated soil on an area of 0.25 ha (Figure 1c). The user of the pipeline (Figure 1d) estimated that about 10 m3 of condensate leaked and contaminated the surrounding agricultural soil. The soil at the oil pipeline rupture site was classified as Eutric cambisol [33].

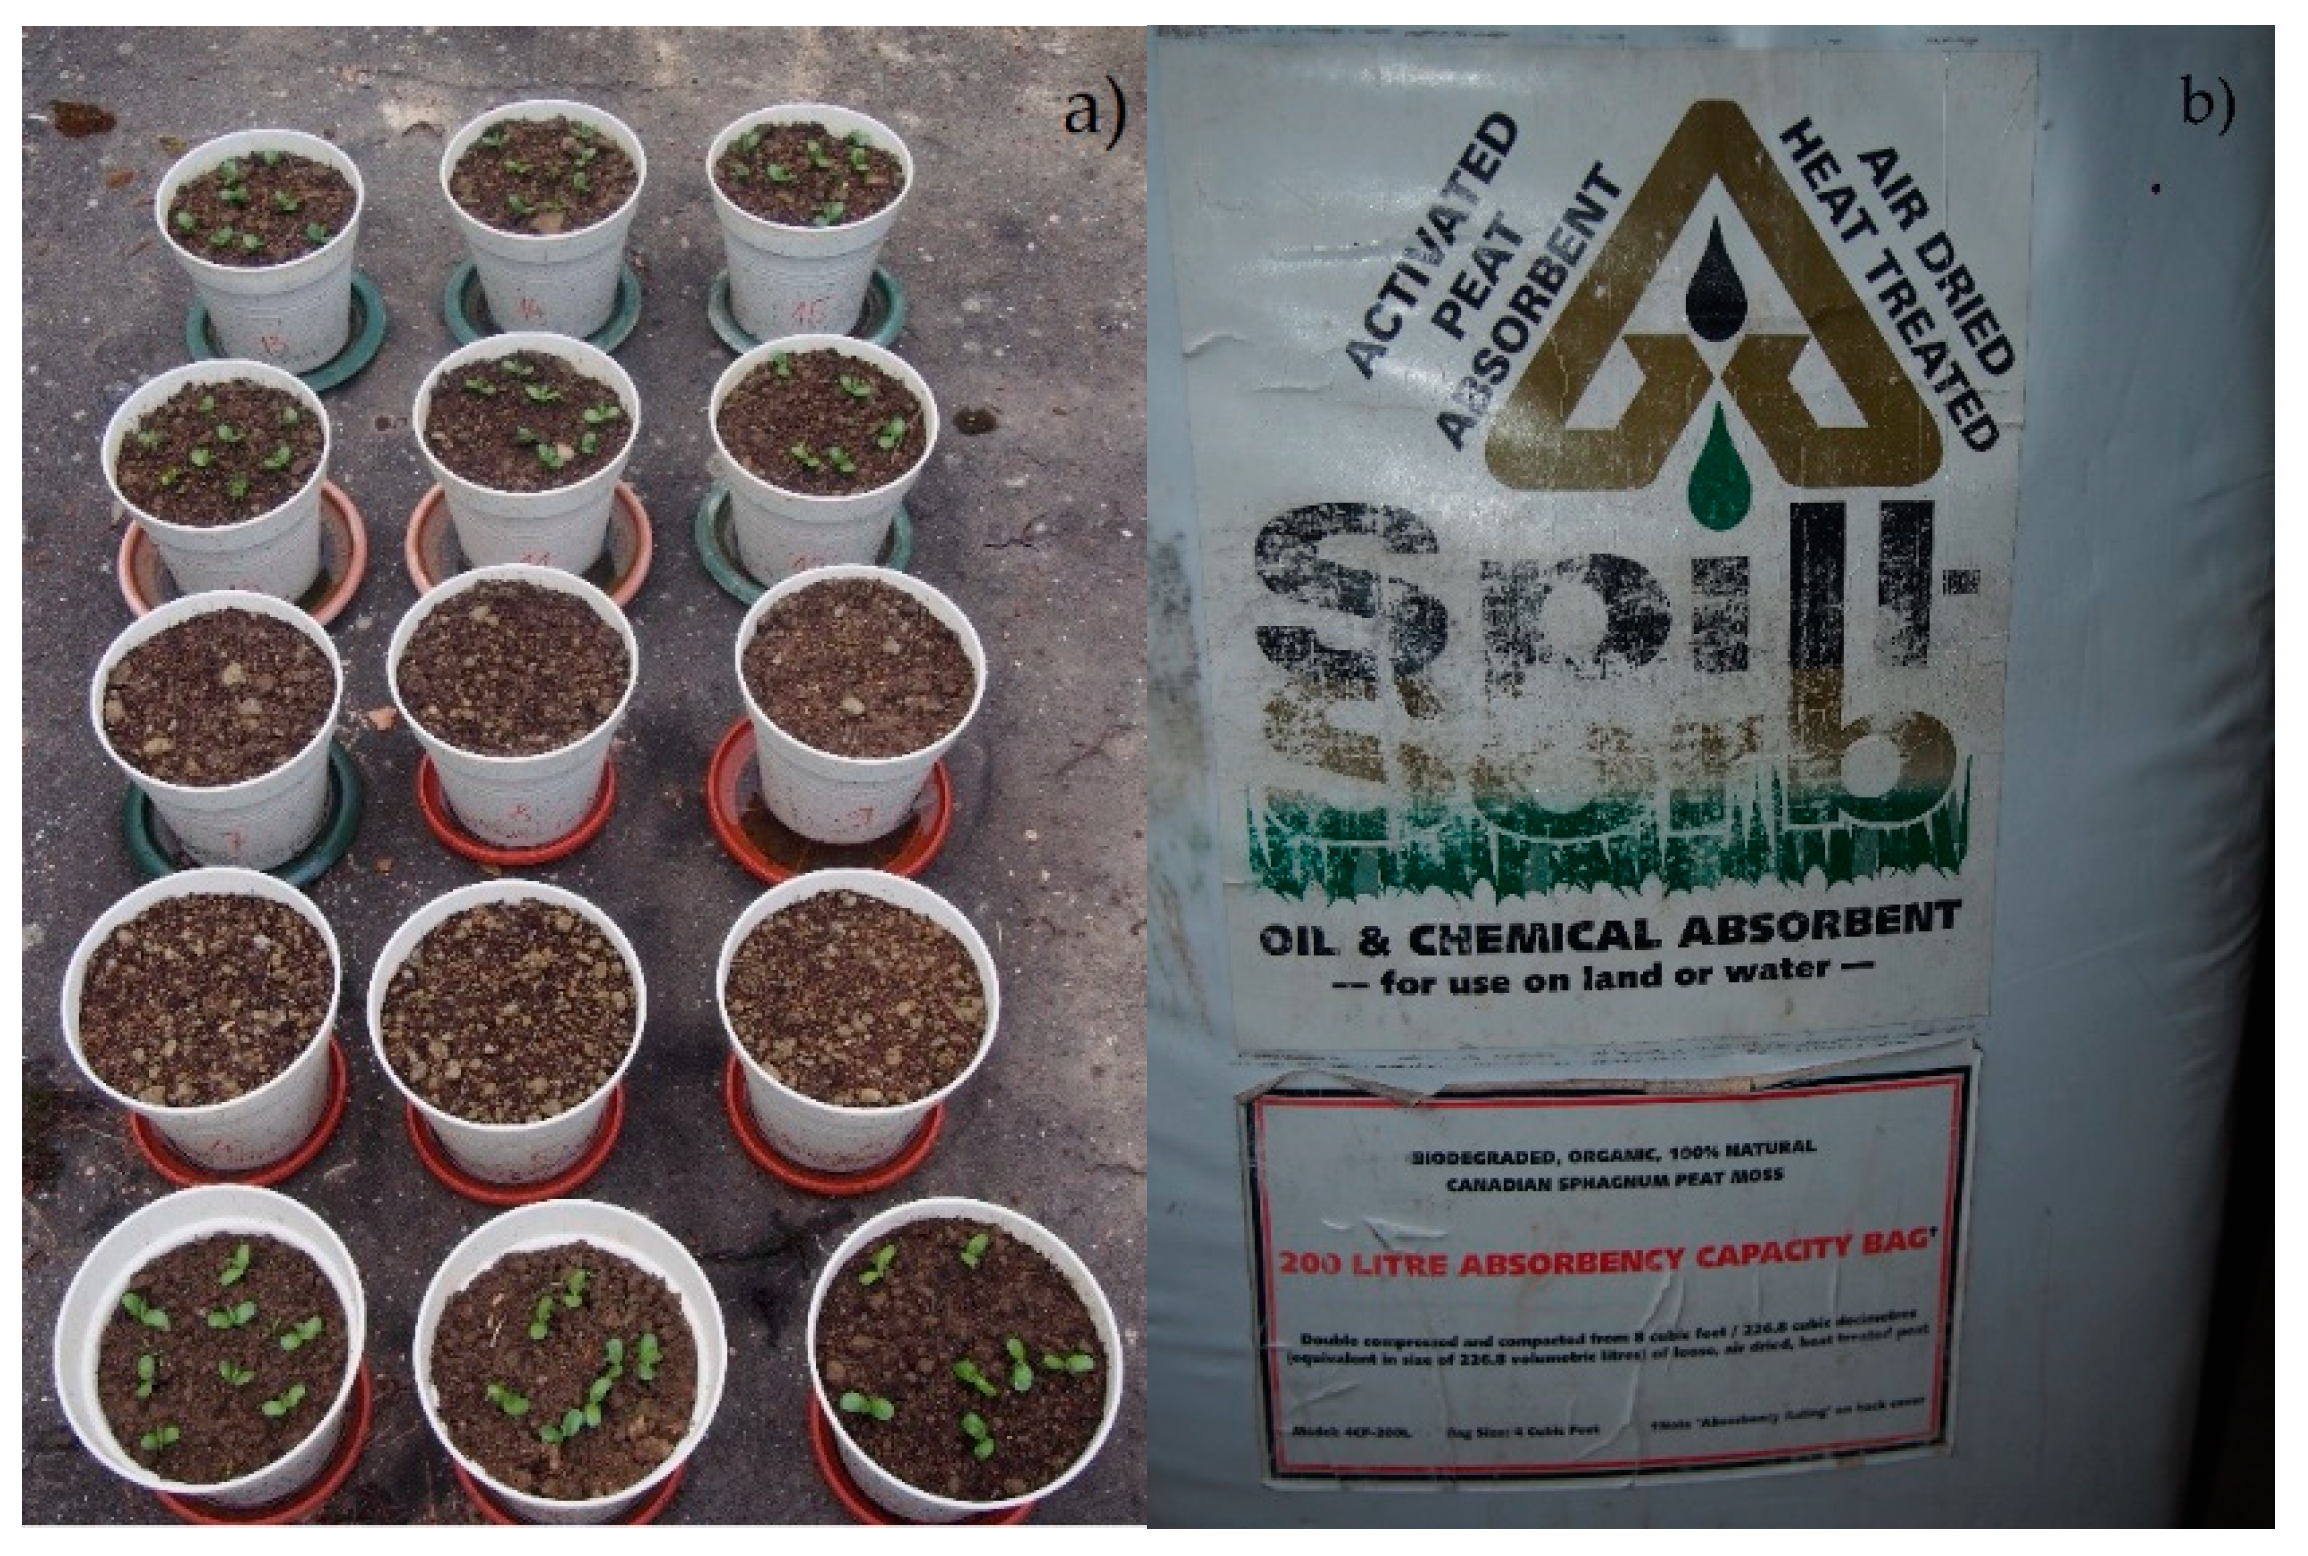
2.2. Experimental Design

On 24 October 2018, soil was sampled from the contaminated area. On the same day, soil samples were also collected nearby that were not affected by the oil spill (control). The main focus was to conduct experiments and soil analysis in a controlled area to observe the effect of the bioremediation treatments. For this purpose, two days later, an experiment was set up in triplicate in the greenhouse of the University of Zagreb Faculty of Agriculture (Figure 2a). The sub-samples for soil chemical analysis were taken at the beginning of the experiment (2 days) and then after 10, 50, and 153 days.

2.3. Treatments Preparation

Spill-Sorb, known as the “millennium adsorbent” and harvested from the northern Canadian Bogies zone, was used as a biological preparation for bioremediation [34]. After a special drying process to a water content of 7%, the spaghnum changes its properties and becomes hydrophobic and consequently can trap a large number of contaminants that replace the water. It is a product with fibrous form, with a unit that weights between 60 and 90 g−1, stable over time, with a pH of 4–6, producing only 2% ash during combustion. For this study, Spill-Sorb is used in the form of granules (Figure 2b).
Calcium ammonium nitrate (KAN—manufacturer Petrokemija Kutina, Croatia) was used as nitrogen fertilizer. KAN is a highly concentrated nitrogen fertilizer (27%). The main form of nitrogen that it contains is nitrate, which is immediately available to plant uptake. It is a fertilizer that is more effective than other straight nitrogen fertilizers (UREA, urea ammonium nitrate or ammonium nitrate), neutralizes organic acids created throughout decomposition of organic matter, and acidifies the soil due to increased calcium content. The soil used in the study was not sterilized and contained a natural microbial population that was not analyzed. Table 1 shows the treatments used in the study.

2.4. Laboratory Analysis

Prior to chemical analyses, soil samples were air dried and sieved through a 2 mm diameter sieve. Soil pH in a KCl suspension was determined by the electrometric method at a 1:2.5 (w/v) soil: solution ratio using the Beckman pH meter Φ72 (Beckman, Irvine, CA, 1999). Soil organic matter (SOM) was measured with a digestion method. A Vario MACRO CHNS analyzer (Elementar, Langenselbold, Germany, 2006) was used to determine the content (%) of total carbon (TC), and total nitrogen (TN) by a dry combustion method. In addition, the C/N ratio was calculated. Concentrations of TPHs and PAHs were measured in the authorized and accredited laboratory. The analytical procedures, according to which the analyses were performed, are listed in Table 2.

2.5. Statistical Analyses

Prior to conducting statistical analyses, normality and homogeneity of variances for each data set were estimated using the Shapiro–Wilk and Levene’s test (p > 0.05). Normality and homogeneity of variances were not observed for data sets, except for the TC data. To observe significant differences between sampling time and treatments, a parametric two-way ANOVA was used for the TC data. For the rest data (soil pH, SOM, and TN), a non-parametric Friedman ANOVA test was applied to observe differences between sampling times. For the differences between treatments, a non-parametric test Kruskal–Wallis ANOVA test (K-W) was performed. All statistical analyses were conducted using Statistica 12.0 (StatSoft Inc., Tusla, OK, USA, 2013) for Windows.

3. Results

3.1. Soil pH, Soil Organic Matter, Total Carbon, Total Nitrogen and Carbon to Nitrogen Ratio

Table 3 shows the soil properties in different treatments and sampling dates. Significantly higher soil pH was observed in the control and 50 + 50 + N than in the 100 − N treatment after 2, 10, and 50 days. In March 2019 (153 days after), a significantly higher soil pH was observed in the 50 + 50 − N treatment than in the 100 − N treatment, respectively. Concerning the sampling date, soil pH was significantly higher after 153 days than after 2 and 10 days in the 100 − N treatment. For the 50 + 50 − N treatment, the soil pH was significantly higher after 153 days than after 2 days.
In the 100 + N treatment, a significantly higher SOM value was observed after 2 days than in the other treatments. After 10 days, a significantly higher SOM was observed in 100 − N than in the control, 100 + N, and 50 + 50 + N treatments. After 50 days, SOM was significantly higher in 100 − N than in control, 50 + 50 + N, and 50 + 50 − N. In 50 days, significantly SOM was observed in 100 − N than in other treatments. Regarding after 153 days, a significantly higher SOM was observed in 100 − N than in the control and 100 + N treatments. By comparing the sampling date, significantly higher SOM was observed after 50 days than after 2 and 10 days in the control treatment. In the 100 − N treatment, significantly higher SOM was observed after 50 days vs. the other days. In 50 + 50 + N and 50 + 50 − N treatments, significantly higher SOM was observed after 10, 50, and 153 days than after 2 days.
Significantly higher TC was observed 2 and 10 days after all applied treatments then in the control. After 50 days, significantly higher TC was observed in 100 − N than in control, 100 + N, and 50 + 50 − N. After 153 days, significantly higher TC was observed in 100 − N than in control, 100 + N, 50 + 50 + N, and 50 + 50 − N treatments. Regarding the date of sampling, control, 100 + N, 50 + 50 + N, and 50 + 50 − N had significantly higher TC 50 days than after 2 and 50 days.
Significantly higher TN was observed after 50 and 153 days than after 2 and 10 days in the 100 − N treatment. Significantly higher TN was observed in all sampling dates in 100 + N and 50 + 50 + N than in all other treatments.
Significantly higher C/N was observed after 50 days than after 2 and 10 days in the 100 + N treatment. For the 100 − N treatment, a significantly higher C/N was observed after 10 days than in 50 and 153 days. In the 50 + 50 − N treatment, significantly higher C/N was observed after 2, 10, 50 days than after 153 days. As for the sampling dates, the C/N was significantly higher in the control, 100 − N, and 50 + 50 − N treatments then in the 100 + N and 50 + 50 + N treatments after 2 and 50 days.

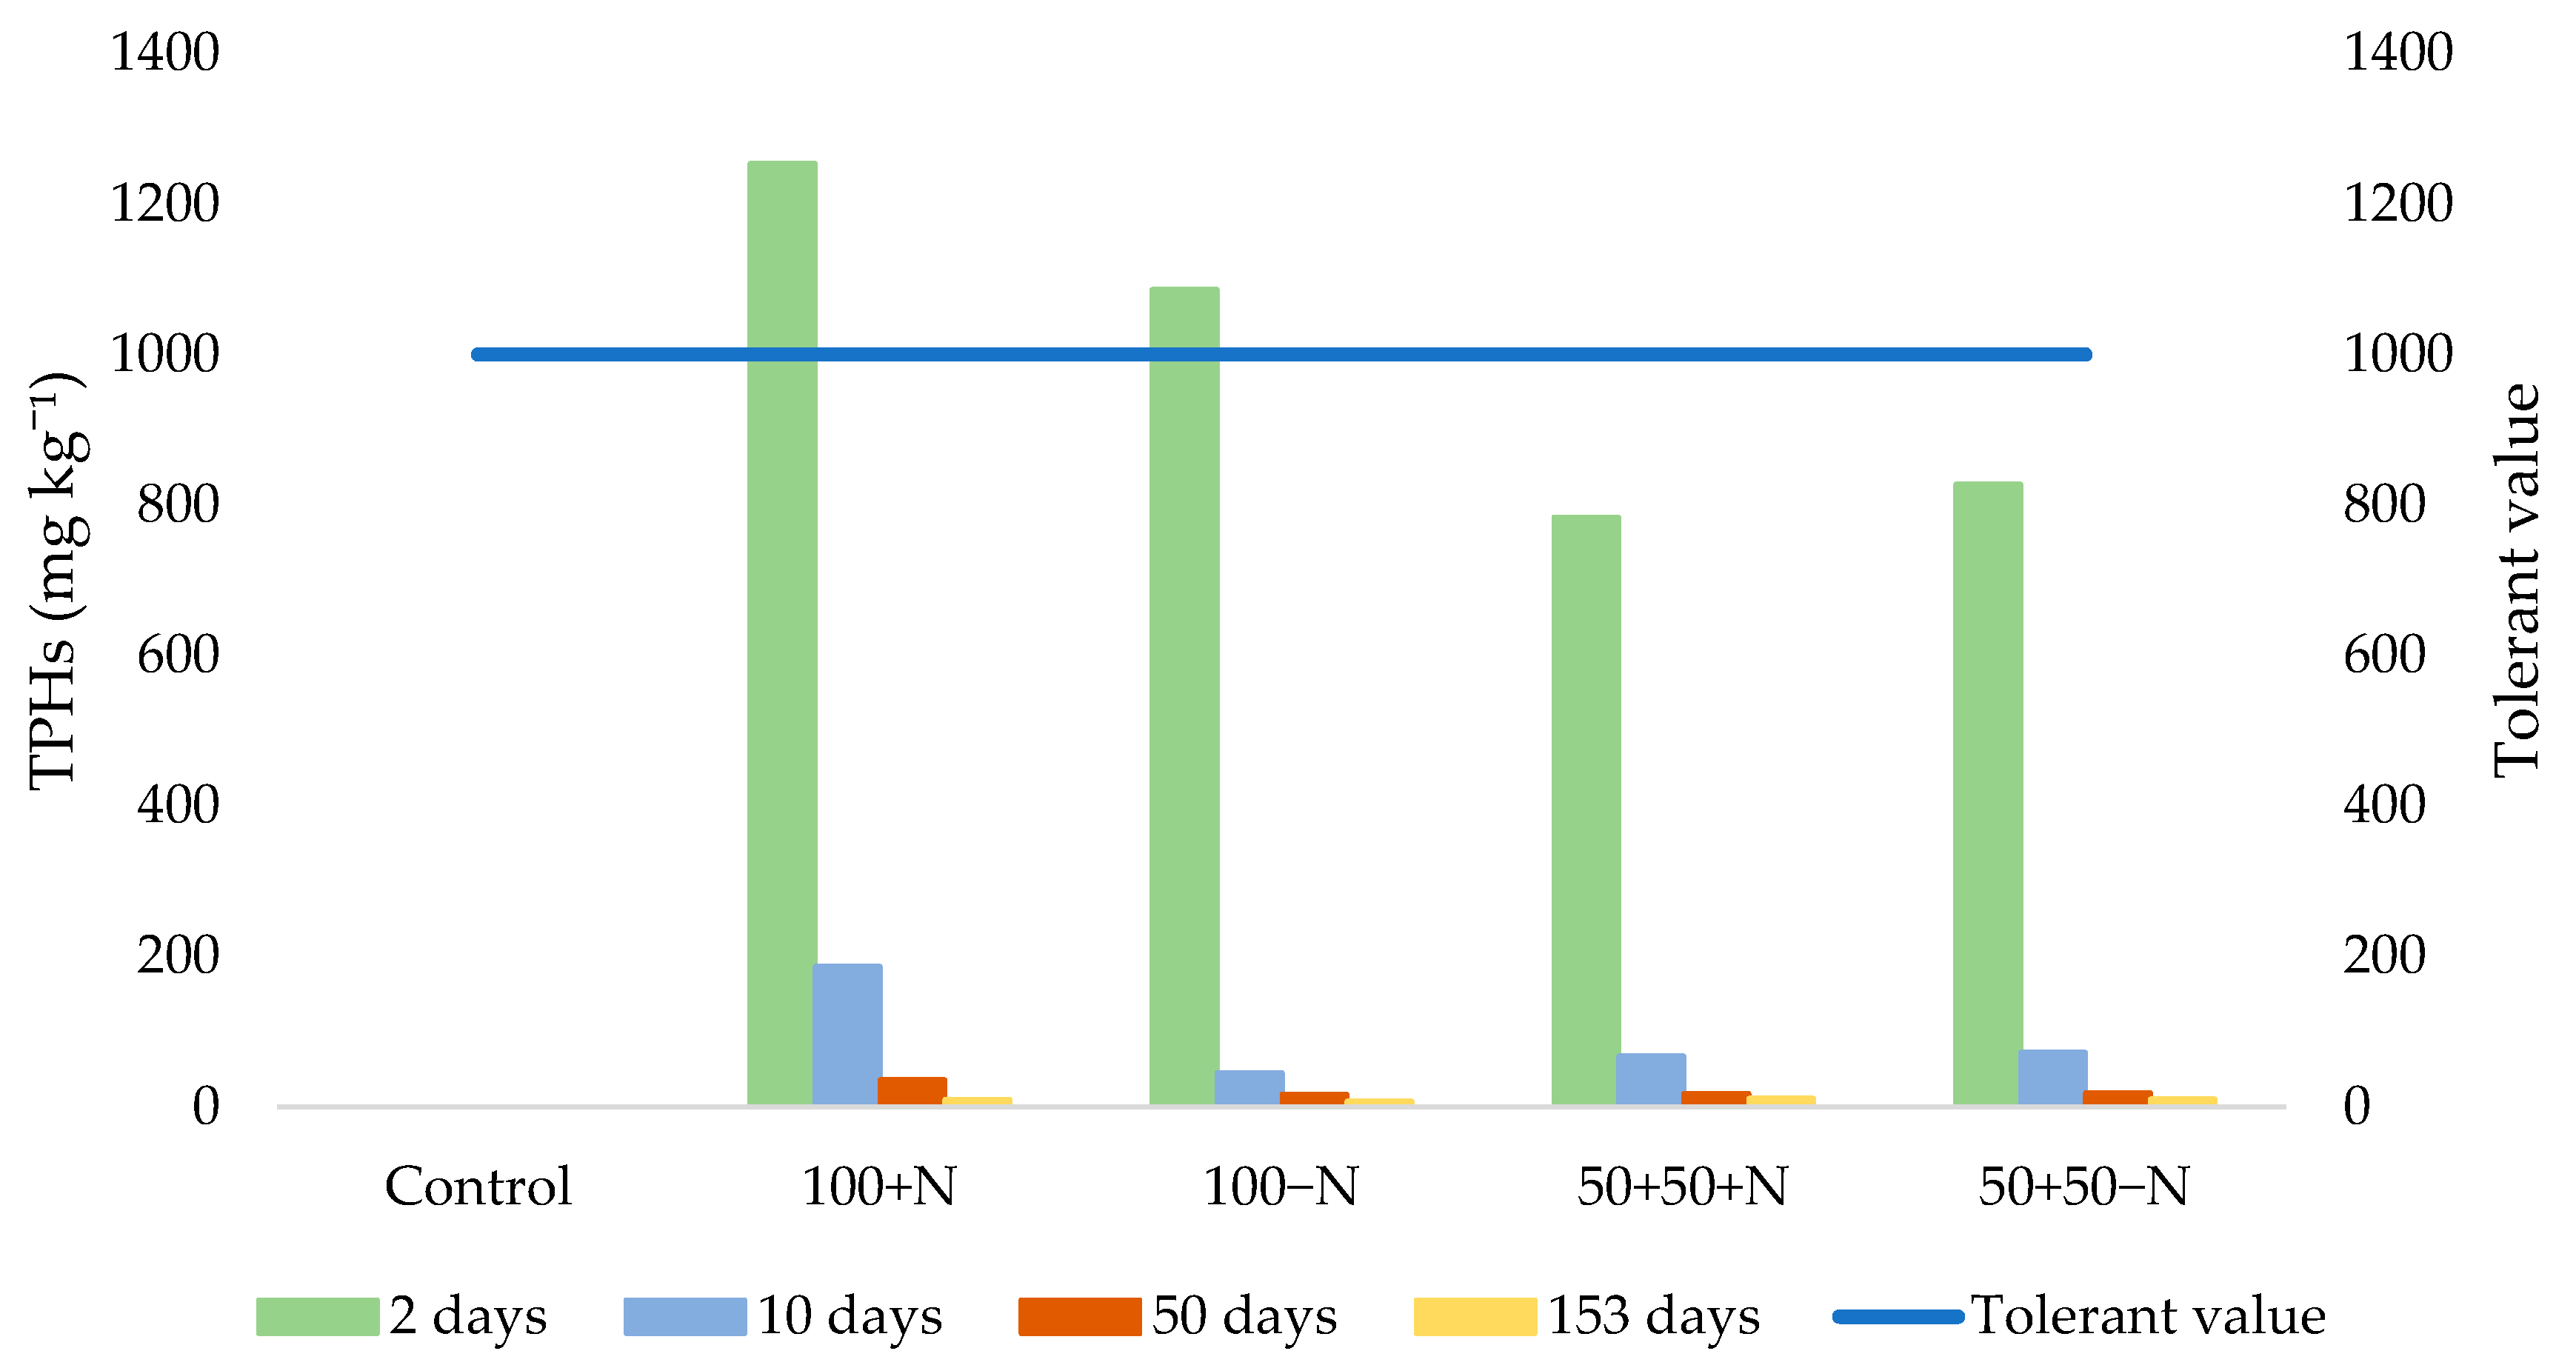
3.2. Total Petroleum Hydrocarbons (TPHs)

The contamination of the soil with TPHs is shown in Figure 3. The TPHs content at the beginning of the experiment (2 days) exceeded the maximum allowable concentration (according to the Ordinance on the protection of agricultural land from pollution by inorganic and organic pollutants in the Republic of Croatia (OG 71/19), the maximum permitted content of total hydrocarbons is 1 g kg−1 soil for lighter sandy soils and 2 g kg−1 for heavier clay soils) in the treatments with 100% contaminated soil with or without the addition of nitrogen. In the other two treatments, which contained the contaminated soil diluted with clean soil, the initial TPHs concentrations were below the maximum allowable value for agricultural soils. By the next measurement (10 days), TPHs concentrations had already fallen below the tolerance level in all studied treatments. In the third (50 days) and fourth measurement (153 days), the TPHs concentration decreased further and is an almost negligible level in all studied treatments.

3.3. Polycyclic Aromatic Hydrocarbons (PAHs)

Table 4 shows the changes in the 12 individual PAHs investigated as well as their sum. The US EPA has identified 16 PAHs as a priority pollutant. The following four PAHs (Benzo(a)pyrene, Indeno (1,2,3-cd) pyrene; Dibenz(a,h)anthracene and Benzo(g,h,i)perylene) are not listed in this table, as the concentration at baseline was less than 0.001 mg kg−1 soil. These are PAHs with four or more benzene rings. At the beginning of the research (2 days after), an increased content of fluranthene and phenanthrene2 was found in all experimental treatments (except the control). Although their content was significantly reduced in the next measurement (10 days), fluoranthene still exceeds the tolerance value on the treatment with 100% contaminated soil with nitrogen. With regard to phenanthrene in all treatments (except control) the content of this PAH was increased above the tolerant value. The sum of all PAHs in all treatments in this measurement exceeds the tolerance value. Only in the next measurement carried out after 50 days was the concentration of fluoranthene is still higher than the permitted vale on the treatment with 100% contaminated soil with nitrogen. The sum of individual PAHs was still above the allowable tolerance value on the treatment with 100% contaminated soil with nitrogen and 50 + 50 + N. In the last measurement (153 days), an increased content of phenanthrene was found on 100% contaminated soil with nitrogen, but this concentration is below the tolerance value. After 153 days, only fluoranthenes and phenanthrenes were found in the contaminated soil, but their concentration was below the maximum allowable values.

4. Discussion

In this study, we have demonstrated the effects of nitrogen and Spill-Sorb on the rate of degradation of total petroleum and polycyclic aromatic hydrocarbons in soil polluted by condensate. The relationship between contaminated soil, nitrogen, and Spill-Sorb was calculated based on similar studies [5,35,36]. The use of nitrogen as a biological method for the remediation of soil contaminated with hydrocarbons is a well-known method [37,38]. In our study, the effects of applied nitrogen are clearly demonstrated by the changes in soil pH in the experimental treatments. The soil pH was lowest in the 100 − N treatment. When comparing the control, 100 + N, 50 + 50 + N, and 50 + 50 − N, no significant differences in soil pH were observed during the study period. This is expected, as soil pH increases after nitrogen fertilization due to ammonium production [39]. In addition, the hydrocarbon contaminated soils decreased nitrogen uptake by vegetation but increased nitrogen accumulation in the soil microbial mass. There is extensive literature reporting that high concentrations of petroleum hydrocarbons, which contain a high percentage of carbon (~80%), can result in a rapid decrease in the concentration of inorganic components, such as nitrogen, in the soil [24]. At the same time, nitrogen levels decrease due to increased microbial activity [30,40]. Nitrogen then become the limiting agent for decomposition by microorganisms [37]. This phenomenon is referred to as nitrogen depression. This phenomenon can only be mitigated by adding nitrogen as a food for soil microorganisms [41], which occurred in our study in nitrogen-supplemented treatments (100 + N and 50 + 50 + N). Nitrogen is an essential element that promotes vegetation growth, and is an integral component of many compounds important for life processes, proteins, nucleic acids, and others [40]. The results demonstrate that in the last measurement (153 days after) TN was still high in treatments with the addition of nitrogen.
Furthermore, it was expected that a high level of hydrocarbon concentration in the soil (due to the rupture of the pipeline and spill) would disrupt the C/N ratio, i.e., that high levels of organic matter and carbon in the soil would be noted [21]. However, SOM content increases in all subsequent measurements compared to the control due to the supplement of nitrogen (KAN) and Spill-Sorb. It is interesting to consider that the 100 + N at first sampling (2 days), had a significantly higher SOM content compared to the other treatments. The explanation for this is that the soil analyzed was contaminated soil with the addition of both bioremediation treatments, which immediately increases the content of organic matter in the soils. In the measurements after 10 and 50 days and in the last measurement after 153 days, the SOM content is significantly higher in contaminated soil only with Spill-Sorb (100 − N) compared to the control and to the 100 + N treatment. With this behavior, the role of Spill-Sorb is more advanced in increasing SOM without nitrogen application caused by the increase of microbial activity and mineralization of organic matter. Indeed, the nitrogen addition caused soil acidification after 153 days (soil pH 6.53 and 6.88 in 100 + N and 50 + 50 + N, respectively). According to Chaillan et al. and River-Espinoza, Dendooven, [39,42] the biggest problem in applying nitrogen is choosing the optimal amount and form of nitrogen in order to avoid negative side effects. If the optimal amount is not applied, there will not be satisfactory results in the soil bioremediation. As for the TC content, the trends are strongly dependent on the SOM content. As expected, the measurements after 2 and 10 days demonstrated the significantly lowest carbon content in the control. In the natural soils of this part of Europe, organic matter contains, on average, 50–54% carbon and 4–6% nitrogen, which indicates the optimal C/N ratio of 10:1 [43]. Rapid and high quality decomposition of soil organic matter occurs only at the indicated optimal C/N ratio. Some other authors [44,45] suggested that the favorable C/N ratio is in the ratio of 100:10 to 100:1. Depending on the treatments studied, similar C/N values were found in this study. It is important to emphasize that all the released nitrogen in this phase of organic matter decomposition is used by the microorganisms until the C/N ratio decreases to a certain level [30], which occurred at 153 days in 100 − N treatments. The occurrence of increased carbon content in the soil due to crude oil significantly increases the microbial activity of the soil. The direction in which these processes occur and which microorganisms predominate in the soil (beneficial, harmful, or neutral microorganisms) is decided by the C/N ratio [46]. For example, soil microbes are key factors for the synthesis and mineralization of organic matter. Decomposition of organic matter releases organic acids and CO2, which lowers the pH in neutral and alkaline soils, and raises the pH in acidic soils. However, in our study, soil pH during the study period was significantly changed only in treatments without nitrogen additions. Additional amounts of nitrogen should be used to mitigate the negative effects of nitrogen depression, which confirmed our results. Some recommendations are 0.5–1.5% nitrogen to increase the amount of hydrocarbons. Nitrogen immobilization occurs with the introduction of increased carbon concentrations that expand the C/N ratio above 30:1. Immobilization of mineral nitrogen release may not occur at ratios of 30 to 20:1, and if the C/N ratio is less than 20:1, mineral nitrogen is usually released immediately at the beginning of the hydrocarbon decomposition process.
Overall, any form of nitrogen is useful, but when applied to acidic soils, nitrogen fertilizers containing calcium should be preferred because calcium neutralizes the acids produced by the decomposition of hydrocarbons. Application of a larger amount of nitrogen fertilizer results in faster mineralization of soil organic matter and other organic compounds containing nitrogen, which confirmed our results. The main reason why KAN was chosen in this study compared to other individual nitrogen fertilizers is its lower tendency to leach and contaminate groundwater [47,48]. Loss of ammonium through evaporation is the main cause of the lower application efficiency of UREA. About 20% of this element is lost in the conversion of amide to the nitrate form of nitrogen from UREA, which is a significant loss of nitrogen, and also poses an increased risk to the environment. From the results presented, it is evident that the concentration of hydrocarbons exceeded the maximum permissible values in the treatments 100 + N, and 100 − N, respectively, during the first measurement (2 days later). This is assumed based on the analysis of the fully contaminated soil. Already, for all further measurements, the concentration of hydrocarbons is below the permissible value for all treatments. The treatment with the addition of Spill-Sorb (100 − N) alone was the most effective in bioremediation, even compared to the treatments where 50% of the soil was clean. In the case of PAHs, the determined sum of 12 PAHs exceeded the permissible value already at the first measurement (2 days after), which is expected due to pipeline spills. Of the individual PAHs, the highest concentrations were found in fluoranthene and phenanthree. In the next measurement, the sum of the 11-detected PAHs exceeds the maximum permissible values in all treatments (except the control). However, in the treatments with only Spill-Sorb additions (100 − N, and 50 + 50 − N) the effect on bioremediation was the highest. In December 2018 (50 days after), the concentrations of five PAHs were determined to be higher than 0.001 mg kg−1 soil, and the sum exceeds the maximum permissible values in 100 + N and 50 + 50 + N treatments. In this measurement, treatments with only Spill-Sorb additions were the most effective for soil bioremediation. At the last measurement (153 days), only two individual PAHs (fluoranthene and phenanthrene) were detected, and their sum was below the allowable values in all treatments. The reason for this is the Spill-Sorb bioremediation material used. It can be noted that the application of nitrogen was not as efficient as the application of Spill-Sorb alone. It can be concluded that nitrogen deficiency in the soil increases the degradation of PAHs compared to the addition of Spill-Sorb alone. A similar observation was also found by MaCkiewicz-Walec [20] and Acuña et al. [5]. The incorrect dosage of applied nitrogen may lead to an inappropriate effect of the degradation of organic pollutants. An additional nitrogen dose may limit or increase the soil microbial population responsible for organic pollutant degradation [49,50]. Bioremediation treatments, such as Spill-Sorb, which contains peat moss, have been shown to be one of the most effective natural materials for producing low-cost and environmentally friendly sorbents [15]. The degradation process by Spill-Sorb alone resulted in higher microbial population in the soil and improved their metabolic activity. In addition, this type of sorbent has a highly porous physical structure and chemical composition and, therefore, provides a large surface area for the adsorption of pollutants [14]. Indeed, in our study the effect of Spill-Sorb was most effective in the decomposition of hydrocarbons, mainly due to its high adsorption rate. In the treatments with KAN, it was assumed that the nitrogen dose was too high for this case study, which shows that the treatment with Spill-Sorb is more efficient. According to another author, a high nitrogen dose can limit or even completely prevent the decomposition of hydrocarbons in the soil [51]. It is important to emphasize that bioremediation processes should also take place under aerobic conditions [52], at optimal temperatures [6] with an optimal soil moisture [13,53].

5. Conclusions

This study provides an overview of two bioremediation treatments (nitrogen and Spill-Sorb) for the area contaminated by organic pollutants caused by a pipeline spill. The main results demonstrate that the presence of nitrogen and Spill-Sorb in the soil accelerated the degradation processes of TPHs and PAHs. The study demonstrates that the nitrogen fertilizer KAN (calcium ammonium nitrate) in combination with the Spill-Sorb was less effective than the application of the adsorbent Spill-Sorb alone. The effectiveness of the absorbent studied was dependent on the concentration of organic pollutants and nitrogen application. The hypothesis that the addition of nitrogen will be more effective is rejected. It can be concluded that the application of Spill-Sorb alone has a higher effect on the degradation of organic pollutants due to the increase in the soil microbial population responsible for decomposition. Indeed, it is observed that the nitrogen dose overcomes the ability of KAN for bioremediation. Therefore, we can conclude that Spill-Sorb is an environmentally friendly technology, and we recommend its use in further practice on soil organic contaminants. However, future research is needed to further investigate the concentrations of nitrogen on the degradation of TPHs and PAHs in polluted soils, including their effects on soil microbial communities.

Author Contributions

Conceptualization, I.K.; methodology, I.K.; software, D.D.; validation, I.K., J.H., Ž.Z., G.D., V.B. and D.D.; formal analysis, I.K. and D.D.; investigation, I.K.; resources, I.K.; data curation, I.K. and D.D.; writing—original draft preparation, I.K.; writing—review and editing, I.K., J.H., Ž.Z., G.D., V.B. and D.D.; visualization, D.D.; supervision, I.K.; project administration, I.K.; funding acquisition, I.K. All authors have read and agreed to the published version of the manuscript.

Funding

This research received no external funding.

Data Availability Statement

Not applicable.

Acknowledgments

Ivica Kisić and Domina Delač want to thank the Croatian Science Foundation for the research project “Influence of Summer Fire on Soil and Water Quality (IP-2018-01-1645)”. The manuscript was produced during the duration of the research project.

Conflicts of Interest

The authors declare no conflict of interest.

References

  1. Kisic, I.; Mesic, S.; Basic, F.; Brkic, V.; Mesic, M.; Durn, G.; Zgorelec, Z.; Bertovic, L. The effect of drilling fluids and crude oil on some chemical characteristics of soil and crops. Geoderma 2009, 149, 209–216. [Google Scholar] [CrossRef]
  2. Elizaveta, M.; Maria, U. Ecological aspects of sorbents use to improve the efficiency of bioremediation on oil-contaminated lands. Rev. Fuentes El Reventón Energético 2021, 19, 65–73. [Google Scholar] [CrossRef]
  3. Mikhedova, E.E. Application of biopreparats to slove the problems of oil pollution remediation of soil cover. Environ. Prot. Oil Gas Ind. 2020, 4, 10–14. [Google Scholar] [CrossRef]
  4. Bento, F.; Camargo, F.; Okeke, B.; Frankenberger, W. Comparative bioremediation of soils contaminated with diesel oil by natural attenuation, biostimulation and biaugmentation. Bioresour. Technol. 2005, 96, 1049–1055. [Google Scholar] [CrossRef] [PubMed]
  5. Acuña, A.J.; Pucci, O.H.; Pucci, G.N. Effect of nitrogen deficiency in the biodegradation of aliphatic and aromatic hydrocarbons in Patagonian contaminated soil. Int. J. Recent Res. Appl. Stud. 2012, 11, 470–476. [Google Scholar]
  6. Nedwell, D.B. Effect of low temperature on microbial growth: Lowered affinity for substrates limits growth at low temperature. FEMS Microbiol. Ecol. 1999, 30, 101–111. [Google Scholar] [CrossRef] [PubMed]
  7. Maila, M.P.; Cloete, T.E. Bioremediation of petroleum hydrocarbons through landfarming: Are simplicity and cost-effectiveness the only advantages? Rev. Environ. Sci. Bio/Technol. 2004, 3, 349–360. [Google Scholar] [CrossRef] [Green Version]
  8. Gomes, I.G.; Dias-Ferreira, C.; Ribeiro, A.B. Overview of in situ and ex situ remediation technologies for PCB-contaminated soils and sediments and obstacles for full-scale application. Sci. Total Environ. 2013, 445–446, 237–260. [Google Scholar] [CrossRef] [PubMed]
  9. Davis, J.W.; Madsen, S. Factors affecting the biodegradation of toluene in soil. Chemosphere 1996, 33, 107–130. [Google Scholar] [CrossRef]
  10. White, J.C.; Kelsey, J.W.; Hatzinger, P.B.; Alexander, M. Factors affecting sequestration and bioavailability of phenanthrene in soils. Environ. Toxicol. Chem. 1997, 16, 2040–2045. [Google Scholar] [CrossRef]
  11. Khamechiyan, M.; Charkhabi, A.H.; Tajik, M. Effects of crude oil contamination on geotechnical properties of clayey and sandy soils. Eng. Geol. 2007, 89, 220–229. [Google Scholar] [CrossRef]
  12. Zhou, E.; Crawford, R.L. Effects of oxygen, nitrogen, and temperature on gasoline biodegradation on soil. Biodegradation 1995, 6, 124–140. [Google Scholar] [CrossRef] [PubMed]
  13. Johnsen, A.R.; Wickb, L.Y.; Harms, H. Principles of microbial PAH-degradation in soil. Environ. Pollut. 2005, 133, 71–84. [Google Scholar] [CrossRef] [PubMed]
  14. Makadia, T.H.; Adetutu, E.M.; Simons, K.L.; Jardine, D.; Sheppard, P.J.; Ball, A.S. Re-use of remediated soils for the bioremediation of waste oil sludge. J. Environ. Manag. 2011, 92, 866–871. [Google Scholar] [CrossRef] [PubMed]
  15. Megharaj, M.; Ramakrishnan, B.; Venkateswarlu, K.; Sethunthan, N.; Naidu, R. Bioremediation approaches for organic pollutants: A critical perspective. Environ. Int. 2011, 37, 1362–1375. [Google Scholar] [CrossRef] [PubMed]
  16. Pandey, S.; Alam, A. Peat moss: A hyper-sorbent for oil spill cleanup—A review. Plant Sci. Today 2019, 6, 416–419. [Google Scholar] [CrossRef]
  17. Koshlaf, E.; Ball, A.S. Soil bioremediation approaches for petroleum hydrocarbon polluted environments. Microbiology 2017, 3, 25–49. [Google Scholar] [CrossRef]
  18. Alvernia, P.; Utomo, S.; Budhi Soesilo, T.E.; Herdiansyah, H. The Use of Bioremediation Technology on Oil-Contaminated Soil. Earth Environ. Sci. 2021, 755, 012061. [Google Scholar] [CrossRef]
  19. Mambwe, M.; Kalebails, K.K.; Johnson, T. Remediation technologies for oil contaminated soil. Glob. J. Environ. Sci. Manag. 2021, 7, 419–438. [Google Scholar] [CrossRef]
  20. Mackiewicz-Walec, E.; Krzebietke, S.J. Content of polycyclic aromatic hydrocarbons in soil in a multi-annual fertilisation regime. Environ. Monit. Assess. 2020, 192, 314. [Google Scholar] [CrossRef]
  21. Kisic, I.; Jurisic, A.; Durn, G.; Mesic, H.; Mesic, S. Effects of hydrocarbons on temporal changes in soil and crops. African J. Agric. Res. 2010, 5, 1821–1829. [Google Scholar]
  22. Carls, E.G.; Fenn, D.B.; Chaffey, A.S. Soil Contamination by Oil and Gas Drilling and Production Operations in Padre Island National Seashore, Texas, U.S.A. J. Environ. Manag. 1995, 45, 273–286. [Google Scholar] [CrossRef]
  23. Sarkar, D.; Ferguson, M.; Datta, R.; Birnbaum, S. Bioremediation of petroleum hydrocarbons in contaminated soils: Comparison of biosolids addition, carbon supplementation, and monitored natural attenuation. Environ. Pollut. 2005, 136, 187–195. [Google Scholar] [CrossRef] [PubMed]
  24. Alexander, M. Biodegradation and Bioremediation, 2nd ed.; Academic Press: Cambridge, MA, USA, 1999; p. 443. [Google Scholar]
  25. Da Silva, I.G.S.; de Almeida, F.C.G.; Silva, N.M.P.-R.; Casazza, A.C.; Sarrubo, L.A. Soil Bioremediation: Overview of Technologies and Trends. Energies 2020, 13, 4664. [Google Scholar] [CrossRef]
  26. Harmsen, J.; Rietra, R.P.J.J. 25 years monitoring of PAHs and petroleum hydrocarbons biodegradation in soil. Chemosphere 2018, 2017, 229–238. [Google Scholar] [CrossRef]
  27. Mendelssohn, I.A.; Hester, M.W.; Sasser, C.; Fischel, M. The effect of Louisiana crude oil discharge from a pipeline break on the vegetation of a southeast Louisiana brackish marsh. Oil Chem. Pollut. 1990, 7, 1–15. [Google Scholar] [CrossRef]
  28. Adam, G.; Duncan, H.J. Effect of Diesel Fuel on Growth of Selected Plant Species. Environ. Geochem. Health 1999, 21, 353–357. [Google Scholar] [CrossRef] [Green Version]
  29. Wang, D.; Ma, J.; Li, H.; Zhang, X. Concentration and Potential Ecological Risk of PAHs in Different Layers of Soil in the Petroleum-Contaminated Areas of the Loess Plateau, China. Int. J. Environ. Res. Public Health 2018, 15, 1785. [Google Scholar] [CrossRef] [PubMed] [Green Version]
  30. Leys, N.M.; Bastiaens, L.; Verstraete, W.; Springael, D. Influence of the carbon/nitrogen/phosphorus ration on polycyclic aromatic hydrocarbon degradation by Mycobacterium and Sphingomonas in soil. Appl. Microbio. Biotechnol. 2005, 66, 726–736. [Google Scholar] [CrossRef] [PubMed]
  31. Patel, A.B.; Shaikh, S.; Jain, K.R.; Desai, C.; Madamwar, D. Polycyclic Aromatic Hydrocarbons: Sources, Toxicity, and Remediation Approaches. Front. Microbiol. 2020, 11. [Google Scholar] [CrossRef] [PubMed]
  32. Mohan, S.V.; Kisa, T.; Ohkuma, T.; Kanaly, R.A.; Shimizu, Y. Bioremediation technologies for treatment of PAH contaminated soil and strategies to enhance process efficiency. Rev. Environ. Sci. Biotechnol. 2006, 5, 347–374. [Google Scholar] [CrossRef]
  33. IUSS-WRB. World Reference Base for Soil Resources 2014, Update 2015: International Soil Classification System for Naming Soils and Creating Legends for Soil Maps. World Soil Resources Reports No. 106. 2015. Available online: https://www.fao.org/3/i3794en/I3794en.pdf/ (accessed on 4 January 2022).
  34. Onofrei, A.G. The removal of light ends of liquid petroleum oils which contaminate by accident the soil. In Realizări şi Perspective în Horticultură, Viticultură, Vinificaţie şi Silvicultură” Consacrat Aniversării a 100 Ani de la Naşterea Profesorului Universitar Gherasim Rudi; State Agrarian University of Moldova: Chisinau, Moldova, 2007; Volume 15, pp. 28–29. Available online: https://ibn.idsi.md/vizualizare_articol/112600 (accessed on 21 December 2021).
  35. Biswas, S.; Chaudhary, S.K.; Mukherji, S. Microbial uptake of diesel oil sorbed on soil and oil spill clean-up sorbents. J. Chem. Technol. Biotechnol. 2005, 80, 587–593. [Google Scholar] [CrossRef]
  36. Emami, S.; Pourbabaei, A.A.; Alikhami, H.A. Interactive effect of nitrogen fertilizer and hydrocarbon pollution on soil biological indicators. Environ. Earth Sci. 2014, 72, 3513–3519. [Google Scholar] [CrossRef]
  37. Margesin, R.; Zimmerbauer, A.; Schinner, F. Monitoring of bioremediation by soil biological activities. Chemosphere 2000, 40, 339–346. [Google Scholar] [CrossRef]
  38. Lee, S.H.; Lee, S.; Kim, D.Y.; Kim, Y.G. Degradation characteristics of waste lubricants under different nutrient conditions. J. Hazard. Mater. 2007, 143, 65–72. [Google Scholar] [CrossRef] [PubMed]
  39. Chaillan, F.; Chaineau, C.H.; Point, V.; Saliot, A.; Oudot, J. Factors inhibiting bioremediation of soil contaminated with weathered oils and drill cuttings. Environ. Pollut. 2006, 144, 255–265. [Google Scholar] [CrossRef] [PubMed]
  40. Xu, J.G.; Johnson, R.L. Nitrogen dynamics in soils with different hydrocarbon contents planted to barley and field pea. Can. J. Soil Sci. 1997, 77, 453–458. [Google Scholar] [CrossRef]
  41. Schaefer, M.; Juliane, F. The influence of earthworms and organic additives on the biodegradation of oil contaminated soil. Appl. Soil Ecol. 2007, 36, 53–62. [Google Scholar] [CrossRef]
  42. Rivera-Espinoza, Y.; Dendooven, L. Dynamics of carbon, nitrogen and hydrocarbons in diesel-contaminated soil amended with biosolids and maize. Chemosphere 2004, 54, 379–386. [Google Scholar] [CrossRef]
  43. Basic, F. The Soils of Croatia; World Soils Book Series; Springer: Berlin/Heidelberg, Germany, 2013; p. 179. [Google Scholar]
  44. Van Hamme, J.; Singh, A.; Ward, O. Recent advances in petroleum microbiology. Microbiol. Mol. Biol. Rev. 2003, 67, 503–549. [Google Scholar] [CrossRef] [PubMed] [Green Version]
  45. Chaineau, C.; Rougeux, G.; Yepremian, C.; Oudot, J. Effects of nutrient concentration on the biodegradation of crude oil and associated microbial populations in the soil. Soil Biol. Biochem. 2005, 37, 1490–1497. [Google Scholar] [CrossRef]
  46. Wawra, A.; Friels-Hanl, W.; Puschenreiter, M.; Soja, G.; Reichenauer, T.; Roithner, C.; Watzinger, A. Degradation of polycyclic aromatic hydrocarbons in a mixed contaminated soil supported by phytostabilisation, organic and inorganic soil additives. Sci. Total Environ. 2018, 628–629, 1287–1295. [Google Scholar] [CrossRef]
  47. Erickson, D.C.; Loehr, R.C.; Neuhauser, E.F. PAH loss during bioremediation of manufactured gas plant site soils. Water Research 1993, 27, 911–919. [Google Scholar] [CrossRef]
  48. Vidali, M. Bioremediation. An overview*. Pure Appl. Chem. 2001, 73, 1163–1172. Available online: http://publications.iupac.org/pac/2001/pdf/7307x1163.pd (accessed on 24 December 2021). [CrossRef]
  49. Dibble, J.T.; Bartha, R. Effect of environmental parameters on the biodegradation of oil sludge. Appl. Environ. Microbiol. 1979, 37, 729–739. [Google Scholar] [CrossRef] [Green Version]
  50. Ghaly, R.A.; Pyke, J.B.; Ghaly, A.E.; Ugursal, V.I. Remediation of diesel-oil-contaminated soil using peat, energy sources. A. Recovery, utilization and environmental effects. Chemosphere 1999, 21, 788–799. [Google Scholar] [CrossRef]
  51. Zhang, T.; Chen, H.Y.H.; Ruan, H. Global negative effects of nitrogen deposition on soil microbes. Int. Soc. Microb. Ecol. 2018, 12, 1817–1825. [Google Scholar] [CrossRef] [PubMed] [Green Version]
  52. Ambrosoli, R.; Petruzzelli, L.; Minati, J.L.; Marsan, F.A. Anaerobic PAH degradation in soil by a mixed bacterial consortium under denitrifying conditions. Chemosphere 2005, 60, 1231–1236. [Google Scholar] [CrossRef] [PubMed]
  53. Sabate, J.; Vinas, M.; Solanas, A.M. Bioavailability assessment and environmental fate of polycyclic aromatic hydrocarbons in biostimulated creosote-contaminated soil. Chemosphere 2006, 63, 1648–1659. [Google Scholar] [CrossRef] [PubMed]
Figure 1. (a) Study site; (b) location; (c) study area; and (d) rupture pipeline.
Energies 15 01561 g001
Figure 2. (a) Experimental set up. Picture taken at the end of the study (153 days); (b) bioremediation treatment, Spill-Sorb.
Energies 15 01561 g002
Figure 3. Concentrations of TPHs (mg kg−1 soil) during study period and tolerant value (OG 71/19).
Energies 15 01561 g003
Table 1. Basic information of the treatments.
I Control I.II.III.Average
Control g−14.0354.0324.0184.028
II 100% contaminated soil + absorbent + nitrogen (100 + N)I.II.III.
Contaminated soil g−14.0034.0284.0434.025
Spill-Sorb g−1216202200206
KAN * g−115151515
III 100% contaminated soil + absorbent (100 − N)I.II.III.
Contaminated soil g−14.0014.0594.0764.045
Spill-Sorb g−1201206220209
IV 50% clean soil + 50% contaminated soil + absorbent + nitrogen (50 + 50 + N)I.II.III.
Clean soil g−11.9752.0402.0002.005
Contaminated soil g−12.0792.0362.0672.061
Spill-Sorb g−1203204196201
KAN g−115151515
V 50% clean soil + 50% contaminated soil + absorbent (50 + 50 − N)I.II.III.
Clean soil g−12.0161.9992.0292.015
Contaminated soil g−12.0362.0002.0712.036
Spill-Sorb g−1199201202201
* KAN—Calcium ammonium nitrate, used as a nitrogen fertilizer (N) in the experiment.
Table 2. Methods used in investigations.
AnalysisMethod
Soil samplingISO 10381,1-8:2002:2009
Preparation of soil samples for chemical analysesISO 11464:2004
Determination of pH values (KCl) 1:2.5
Determination of soil organic matter (SOM)
Modified ISO 10390:2004
ISO 14235:2004
Determination of total carbon (TC) by dry digestionISO 10694:2004
Determination of total nitrogen (TN) by dry digestionISO 13878:2004
Determination of total petroleum hydrocarbons—gas chromatographyISO 16703:2004
Determination of polycyclic aromatic hydrocarbons, gas chromatography with mass spectrometric detection (GC-MS)ISO 18287:2006
Table 3. Soil pH, soil organic matter (SOM), total carbon (TC), total nitrogen (TN), and carbon to nitrogen ratio (C/N) during studied period and in treatments. Mean ± standard deviation. Different letters indicate significant differences between sampling dates (capital letters), and treatment (lower-case letters). 1 Two-way ANOVA are shown for each treatment–sampling date comparison. 2 Kruskal–Wallis (K-W) (* p < 0.05, ** p < 0.01, *** p < 0.001, and n.s., non-significant at p < 0.05) are shown for each comparison between treatments, and 3 Friedman ANOVA between sampling dates.
SoilTreatmentSampling Dates
Properties 2 Days10 Days50 Days153 Daysp
pHControl7.26 ± 0.15 a7.16 ± 0.07 a7.19 ± 0.05 a7.22 ± 0.04 a3 n.s.
100 + N6.12 ± 0.07 bc6.37 ± 0.2 bc6.45 ± 0.04 ab6.53 ± 0.38 ab3 n.s.
100 − N5.05 ± 0.04 Bc5.12 ± 0.08 Bc 5.19 ± 0.02 ABc5.32 ± 0.1 Ab3 **
50 + 50 + N6.86 ± 0.6 ab6.74 ± 0.5 ab6.8 ± 0.59 a6.88 ± 0.19 ab3 n.s.
50 + 50 − N 6.87 ± 0.04 Bab6.96 ± 0.05 ABab7.08 ± 0.03 ABa7.21 ± 0.21 Aa3 *
K-W p2 *2 *2 *2 *
SOMControl6.3 ± 0.19 Cc6.77 ± 0.1 Bc7.2 ± 0.19 Ac6.9 ± 0.02 ABc3 ***
100 + N9.4 ± 0.29 a9.94 ± 0.19 ab10 ± 0.59 ab10.39 ± 0.59 ab3 n.s.
100 − N8.3 ±0.39 Cb12.22 ± 0.22 Ba13 ± 0.2 Aa12.79 ± 0.17 Ba3 *
50 + 50 + N7.44 ± 0.46 Bb10.77 ± 0.87 Aab11.81 ± 0.71 Ab12.09 ± 0.71 Aab3 ***
50 + 50 − N 6.94 ± 0.09 Bb11.33 ± 0.12 Aab12.1 ± 0.49 Ab12.4 ± 0.57 Aab3 ***
K-W p2 **2 *2 *2 *
TCControl4.71 ± 0.36 Bb4.53 ± 0.28 Bb5.71 ± 0.36 Ad4.97 ± 0.38 ABc
100 + N6.09 ± 0.22 Da6.18 ± 0.04 Ca 7.27 ± 0.14 Ac6.95 ± 0.29 ABb
100 − N6.79 ± 0.23 Ba6.98 ± 0.13 Ba8.46 ± 0.49 Aa8.14 ± 0.21 Aa1 ***
50 + 50 + N6.86 ± 0.42 Ba6.79 ± 0.21 Ba7.98 ±0.34 Aab7.09 ± 0.09 ABb
50 + 50 − N 6.36 ± 0.13 Ba6.42 ± 0.06 Ba7.39 ± 0.16 Abc6.96 ± 0.29 Bb
1 ***
TNControl0.25 ± 0.01 b0.24 ± 0.01 b0.26 ± 0.02 b0.26 ± 0.01 b3 n.s.
100 + N2.12 ± 0.11 a2.33 ± 0.19 a2.02 ± 0.12 a2.10 ± 0.15 a3 n.s.
100 − N0.21 ± 0.19 Bb0.19 ± 0.03 Bb0.35 ± 0.02 Ab0.36 ± 0.06 Ab3 **
50 + 50 + N2.27 ± 0.19 a2.32 ± 0.17 a2.22 ± 0.22 a2.42 ± 0.25 a3 n.s.
50 + 50 − N 0.24 ± 0.01 Cb0.24 ± 0.01 Cb0.29 ± 0.01 Bb0.31 ± 0.01 Ab3 *
K-W p2 ***2 ***2 ***2 ***
C/NControl18.89 ± 2.11 a18.68 ± 1.69 a22.31 ± 2.65 a19.09 ± 1.84 a3 n.s.
100 + N2.88 ± 0.23 Bb2.67 ± 0.22 Bb3.61 ± 0.26 Ab3.32 ± 0.35 ABb3 ***
100 − N33.1 ± 3.45 ABa37.77 ± 6.25 Aa24.1 ± 2.68 Ba23.07 ± 4.53 Ba3 **
50 + 50 + N3.04 ± 0.3 b2.94 ± 0.28 b3.64 ± 0.54 b2.94 ± 0.32 b3 n.s.
50 + 50 − N 26.16 ± 0.57 Aa26.9 ± 0.73 Aa25.7 ± 1.57 Aa22.19 ± 0.5 Ba3 **
K-W p2 ***2 ***2 ***2 ***
Table 4. Changes in the individual PAHs and their sum in the course of bioremediation process. According to the Ordinance on the protection of agricultural land from pollution by inorganic and organic pollutants in the Republic of Croatia (OG 71/19), the maximum permitted content of sum PAHs is 1 mg kg−1 soil for lighter sandy soils and 2 mg kg−1 for heavier clay soils.
Control100 + N100 − N50 + 50 + N50 + 50 − N
PAHs mg kg soil−12 Days
Naphtalene<0.0010.2030.1860.2120.231
Acenaphthylene<0.0010.4560.4680.2170.222
Acenaphtene<0.0010.7550.7370.4570.448
Fluoranthene<0.0012.0661.8451.2461.117
Phenanthrene<0.0018.4927.6235.1214.657
Anthracene<0.0010.0280.024<0.001<0.001
Fluoranthene<0.0010.1400.1420.0070.008
Pyrene<0.0010.2740.2860.1240.131
Benzo(a)anthracene<0.0010.0430.042<0.001<0.001
Chrysene<0.0010.0820.0840.05390.054
Benzo(b)fluoranthene<0.0010.0110.0120.0090.011
Benzo(k)fluoranthene<0.0010.0040.003<0.001<0.001
Σ PAHs mg kg soil−1-12.55411.4527.4656.879
10 days
Naphtalene<0.0010.4520.1830.1830.194
Acenaphthylene<0.0010.0090.2070.1960.109
Acenaphtene<0.0010.0180.68420.3080.111
Fluoranthene<0.0011.8440.9820.8740.741
Phenanthrene<0.0013.1261.2602.1271.878
Anthracene<0.001<0.001<0.001<0.001<0.001
Fluoranthene<0.0010.009<0.0010.0120.009
Pyrene<0.0010.015<0.0010.0150.009
Benzo(a)anthracene<0.0010.0030.0018<0.0010.004
Chrysene<0.0010.004<0.0010.0150.003
Benzo(b)fluoranthene<0.001<0.001<0.0010.0030.003
Σ PAHs mg kg soil−1-5.4803.3183.7333.061
50 days
Naphtalene<0.0010.162<0.0010.0210.008
Acenaphthylene<0.0010.0030.047<0.001<0.001
Acenaphtene<0.001<0.0010.1380.087<0.001
Fluoranthene<0.0010.2140.2410.1270.183
Phenanthrene<0.0011.3270.4580.9820.489
Σ PAHs mg kg soil−1-1.7060.8841.2170.680
153 days
Fluoranthene<0.0010.0350.047<0.001<0.001
Phenanthrene<0.0010.6520.1810.2570.043
Σ PAHs mg kg soil−1-0.6870.2280.2570.043
Publisher’s Note: MDPI stays neutral with regard to jurisdictional claims in published maps and institutional affiliations.

