Article

Effectiveness of Large Soil Grain Sizes in Studying Impulse Characteristics of Soil

by
Muhd Shahirad Reffin
1,
Normiza Mohamad Nor
1,*,
Nurul Azlina Abdul Rahman
2,
Noradlina Abdullah
2,
Norhasliza Hatta
2 and
Mohd Pauzi Yahaya
2
1
Faculty of Engineering, Jalan Multimedia, Cyberjaya 63100, Selangor, Malaysia
2
TNB Research Sdn Bhd, No. 1, Kawasan Institusi Penyelidikan, Jalan Ayer Itam, Kajang 43000, Selangor, Malaysia
*
Author to whom correspondence should be addressed.
Energies 2022, 15(4), 1471; https://doi.org/10.3390/en15041471
Submission received: 26 December 2021 / Revised: 8 February 2022 / Accepted: 14 February 2022 / Published: 17 February 2022

Abstract

:
There have been many published studies analysing the impulse characteristics of soil and various soil properties. Some of these published results are found to be largely different and inconsistent from one study to another. Soil properties may be complex in nature, and its characteristics under high impulse conditions are influenced by many factors, which result in inconsistency in the results. Nevertheless, it has been known that under high impulse conditions, ionisation in the soil would occur due to air discharges in the air voids within the soil, and interfaces between the soil and the ground electrodes. It is also possible that the expansion of the ionisation zone, leading to the occurrence of breakdown in soil, gives better conduction in soil, producing longer streamers and higher magnitudes of current. However, limited study on the impulse breakdown characteristics of soil is found, which was believed to have been due to voltage/current magnitudes that are not high enough to cause the occurrence of soil breakdown. It is important to determine the factors that will cause breakdown to occur in soil when subjected under high impulse conditions since this will give more effective grounding systems when subjected to high impulse conditions. This paper shows that the soil grain size contributes to the most pronounced factor in influencing the soil characteristics under high impulse conditions, in comparison to any other factors. This paper considers thirty-two soil samples containing various percentages of water contents, subjected to high impulse conditions. The soil samples are housed in a hemispherical environment with two different active electrodes, and pre-breakdown and breakdown characteristics of various soils, configurations and percentage of water content are studied.

1. Introduction

There have been various investigations [1,2,3] on the effect of soil, among which are variations in the soil grain size, the moisture content in the soil, and a mixture with various percentages of salt and types of soil are investigated for laboratory tests, while the effect of soil resistivity [4] and seasonal changes [5] have been included in the study of the field tests on the soil characteristics under high impulse conditions. There are, however, several other parameters that may contribute to differences in soil properties, such as soil porosity, temperature and the percentage amount of colloids [6], indicating that soil has a non-uniform soil resistivity. All these factors may also contribute to differences in the results from one study to another.
Extensive studies [1,2,3,4,5] on the impulse characteristics of soil show a common finding, where an ionisation process in the soil would occur, and this ionisation process is initiated mainly in air voids in soil. Due to air discharges that occur in soil during the ionisation process, the effects of soil parameters on the impulse characteristics can be expected to be seen more clearly in large soil grain size, due to its large air voids. However, due to differences in soil grain size, among other factors, the results are found to be different from one study to another. This can be seen in [1] who found that a clear difference in soil breakdown is seen in sand with grain sizes in a range of 1 mm to 19 mm, where a higher voltage level is needed to cause breakdown for negative impulse polarity than the positive impulse polarity. Due to air discharges in air voids that occur during the ionisation process, a higher breakdown voltage in negative impulse polarity than positive impulse polarity is expected. However, lower breakdown voltage in negative impulse polarity than positive impulse polarity is seen in small grain size sand, of below 0.4 mm. The same authors have also shown that a clear photographic difference is seen in large soil grain size in [7], whereby, when subjected to the positive impulses, the discharge channels are initiated from the active electrode, while the discharge channels are initiated from the grounded electrode when subjected to negative impulse polarity. However, for a smaller grain size of sand, the discharge channels seen are propagated from the active electrode, under both impulse polarities. The study [7] shows that more convincing results can be obtained on soil characteristics under high impulse conditions if a large soil grain size is used.
It was also demonstrated in a few studies [1,2,8,9,10] that due to high enough electric field values—higher than the initial discharges in soil—a breakdown in the soil would occur, which is indicated in a sudden rise in current and a drop in voltage that is observed, similar to the voltage and current signals typically seen during the breakdown process in other insulating materials. The ionisation process in soil and the factors affecting it are well presented in published work, [1,2,8,9,10,11,12,13] however, the breakdown observation in soil is found to be limited, which would require higher electric field stress to be applied on the ground electrode and surrounding test media. For the soil ionisation process, it is understood that the discharges are initiated in air voids, where a lower electric field is expected for positive impulse polarity than negative impulse polarity. This is evident in [8] who carried out impulse tests on six ground electrodes installed at the same practical site of high soil resistivity, above 1000 Ωm, and found that for the same ground electrode, a higher breakdown voltage is seen for negative impulse polarity than positive impulse polarity. An obvious difference in impulse polarity effect on the impulse breakdown level of the ground electrode, seen in [8] could be due to high soil resistivity (presumably with a low percentage of water content, coarse types of soil with large grain size), where discharges in air voids may have taken place, thus giving a clear impulse polarity effect, as seen in air breakdown.
Fine work on impulse polarity effect on the breakdown characteristics of soil can be seen in [1], who also found that higher breakdown voltage in negative impulse polarity than positive impulse polarity for the case of high resistivity sand having coarse grain size, ranged from 1 mm to 19 mm. An occurrence of breakdown can also be seen in [9] when high impulse current magnitudes were performed on a few rod electrodes with various lengths, installed at the same in situ. In their measurements, two peak current peaks are observed for tests at high current magnitudes, where the R1 and R2 are based on the first and the second peak currents, respectively. However, due to a high electric field, at interfaces of electrode and soil, when ground electrodes are subjected to high current magnitudes, soil breakdown is thought to be initiated at an early stage, which can even be at the first peak current, hence making it difficult to quantify R1 and R2 accurately. Detailed analysis of the breakdown delay can be found in [8,10]. They [10] found the measured time breakdown delay under negative impulse polarity is slower than when the ground electrodes are subjected under positive impulse polarity, which again supports the impulse breakdown characteristics in soil as similar to that in gases or air void discharges. From an extensive work carried out by He et al. [10], on the impulse breakdown delay under influences of impulse voltage levels, soil moisture, soil temperature and soil density, they discovered that impulse breakdown time delays are slower in low magnitudes of impulse voltage, large percentages of water content in soil, low soil temperature and large soil density. On the other hand, Ref. [10] found that the breakdown time delays are shorter in negative impulse polarity than the breakdown time delays of positive impulse polarity.
As mentioned in [1,2,8,9,10,11,12,13] and as expected, during the breakdown in soil, higher current magnitudes are produced, and smaller impulse impedance values are obtained, in comparison to the case of when only ionisation process in soil occurs. Further, from the breakdown characteristics in soil, information on impulse breakdown time delay can give important information of how fast the current is being discharged to the ground, and how effective the grounding system is under various conditions. Despite much-published work [1,2,8,9,10] being directed towards the soil breakdown phenomenon, inconsistent results are seen from one published work to another. This can be due to many non-uniformities in the soil that lead to differences in the results, and also due to unclear observations of ionisation through voltage and current traces. This is also supported by Zhang et al. [14], who show that the determination of the onset electric field of ionisation in soil should not be based on the voltage and current traces alone, but also with X-ray photos.
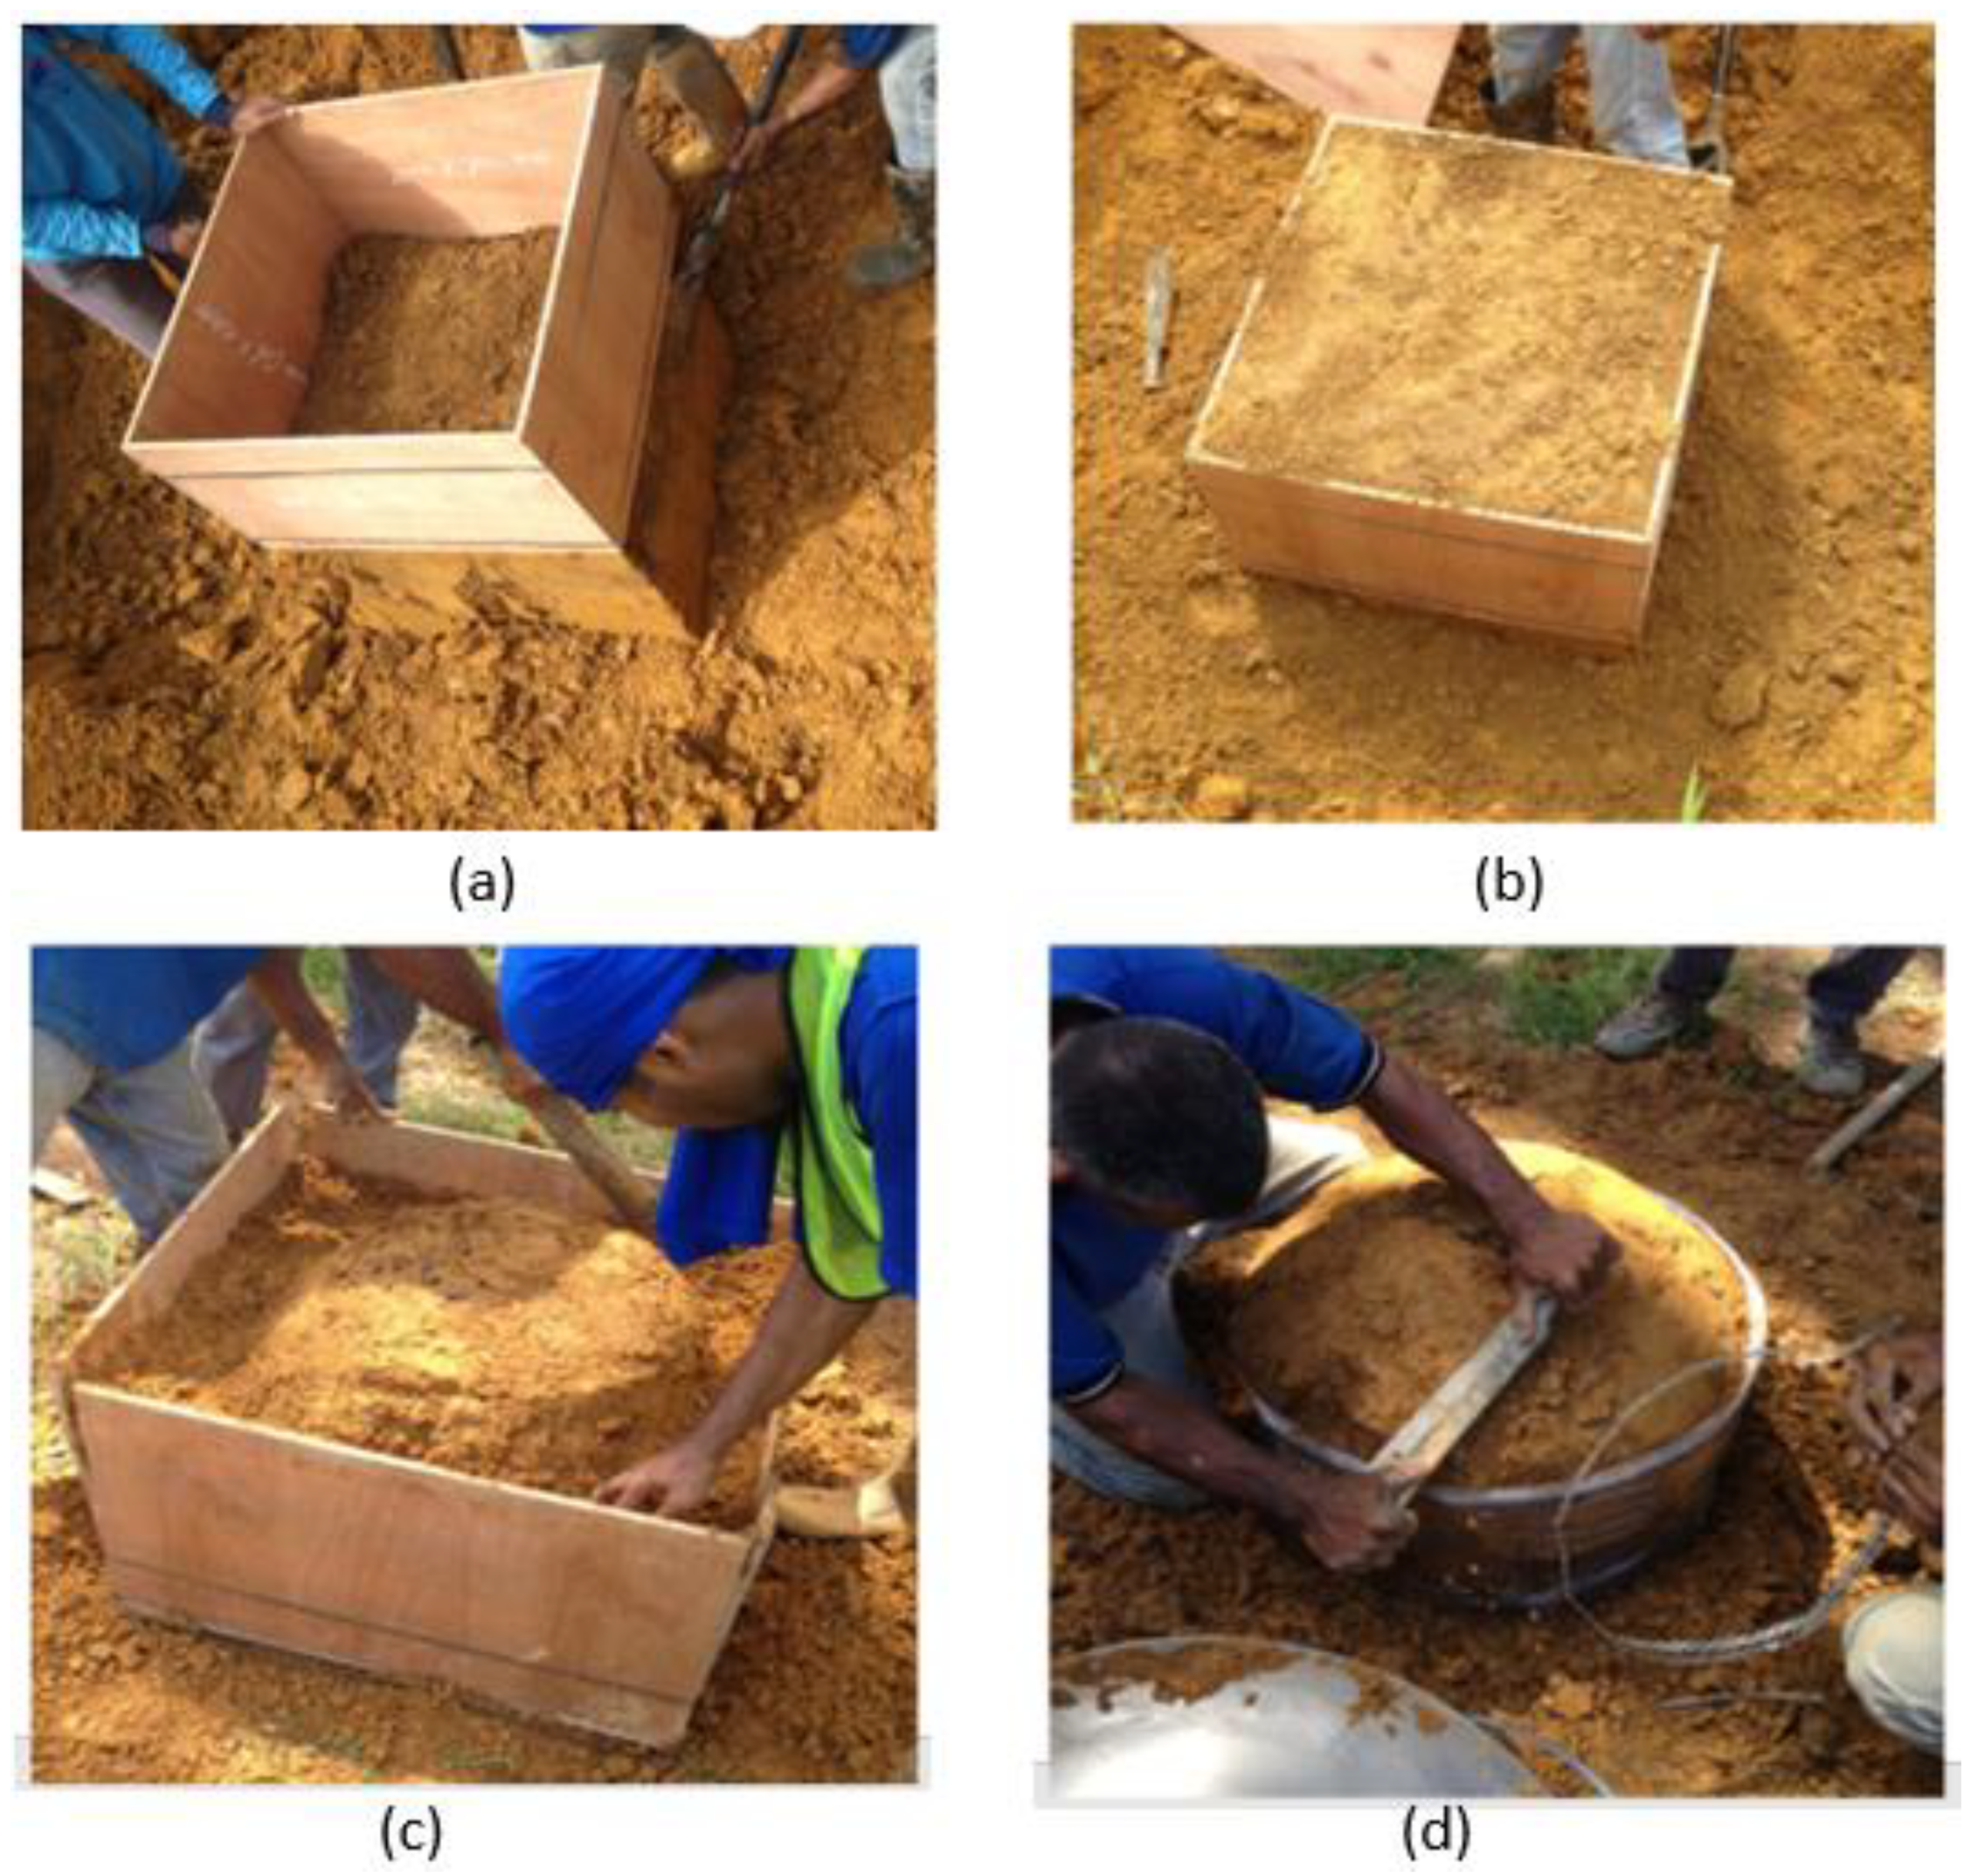
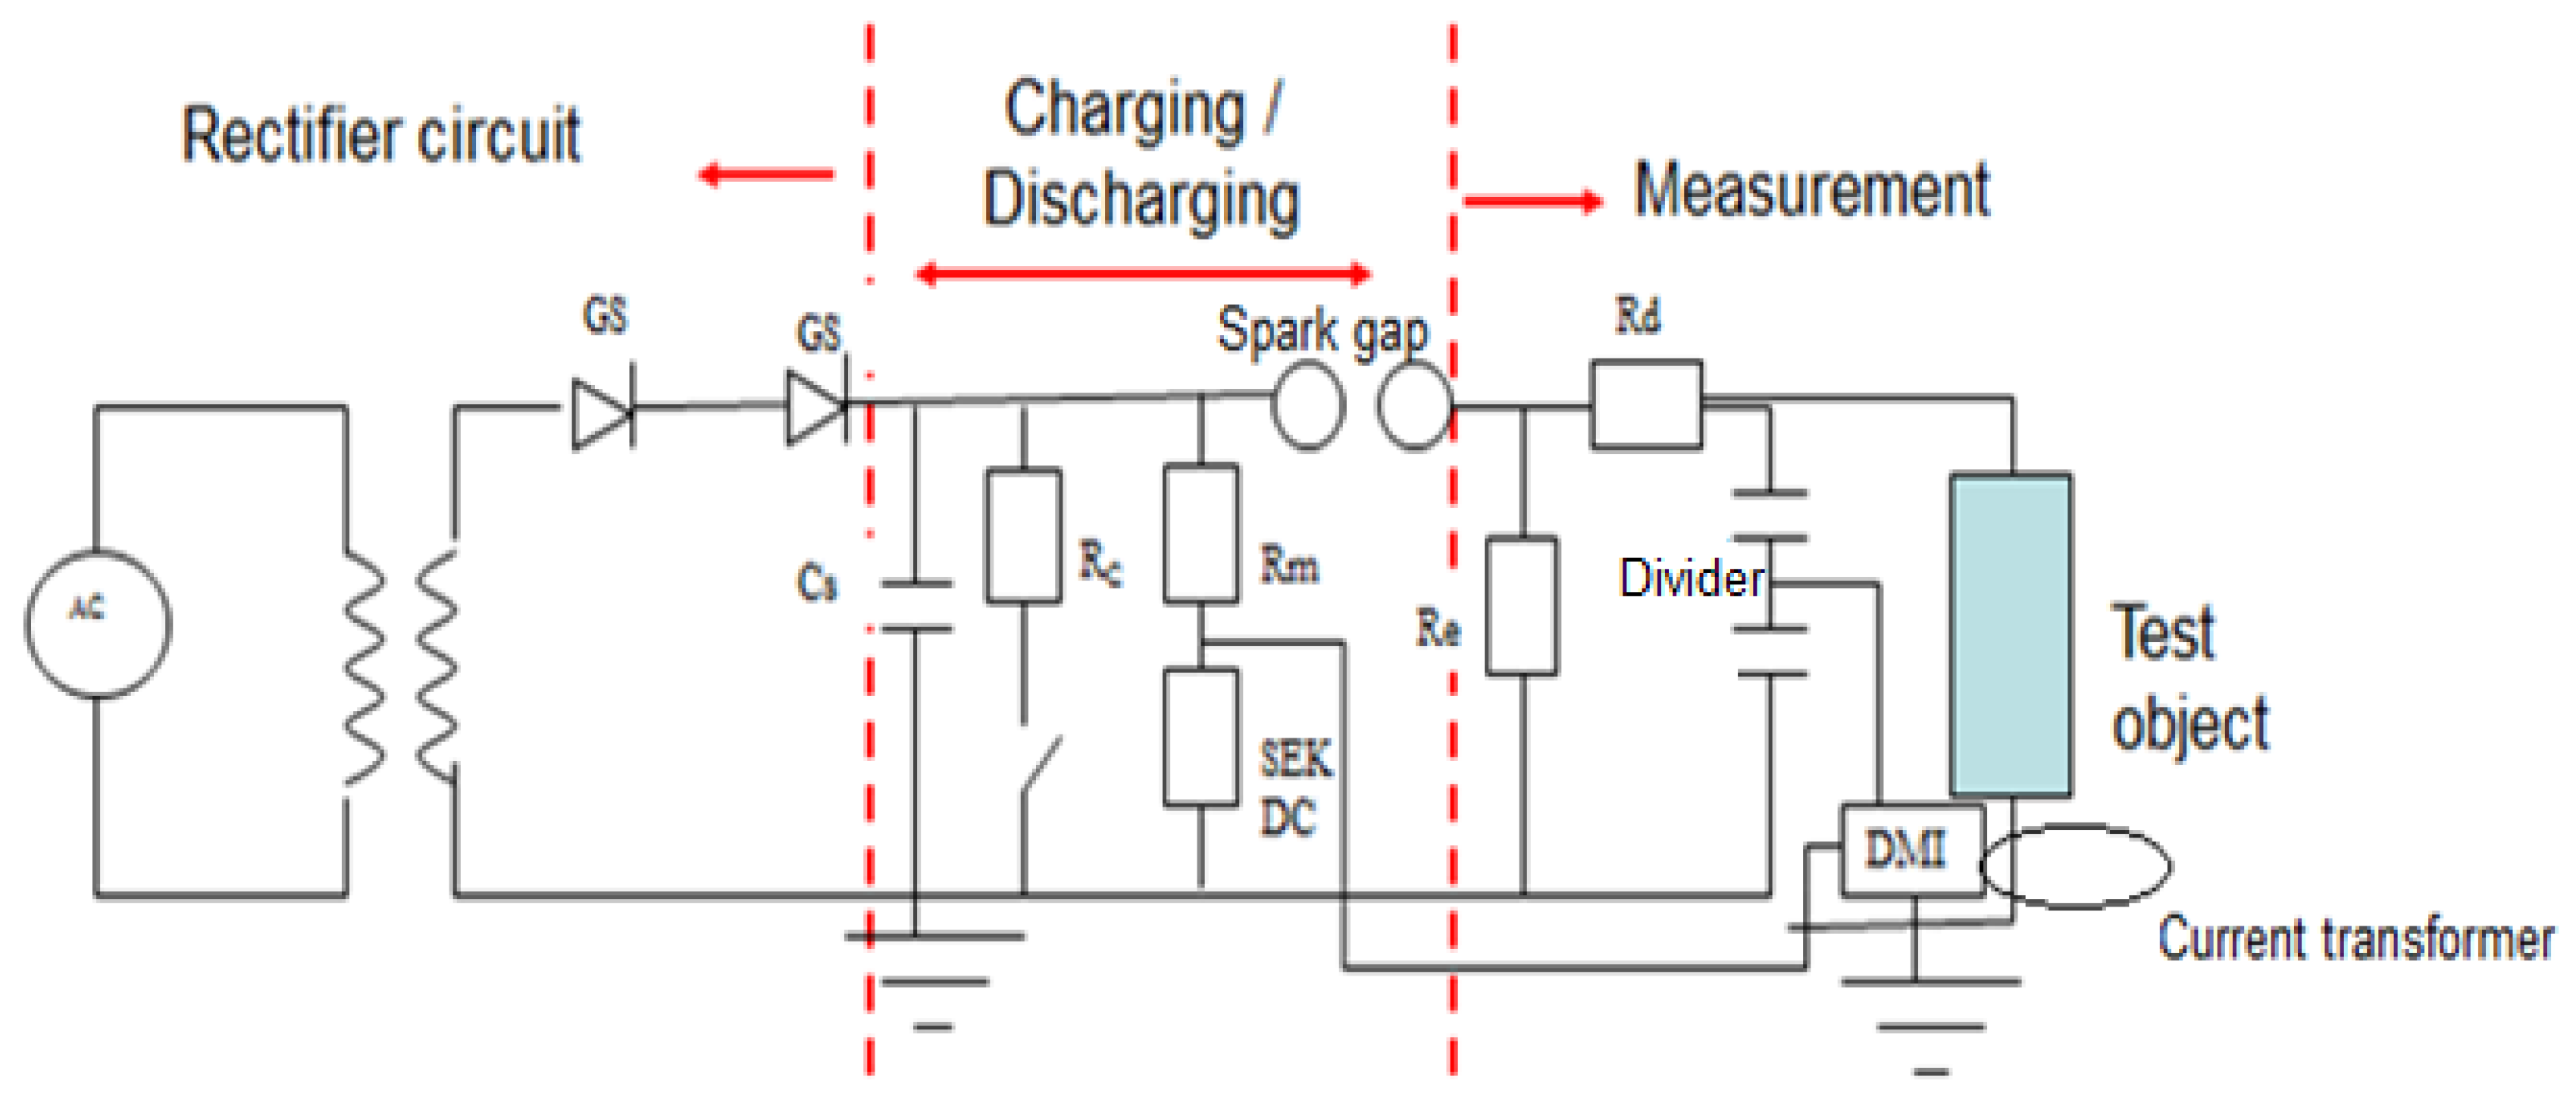
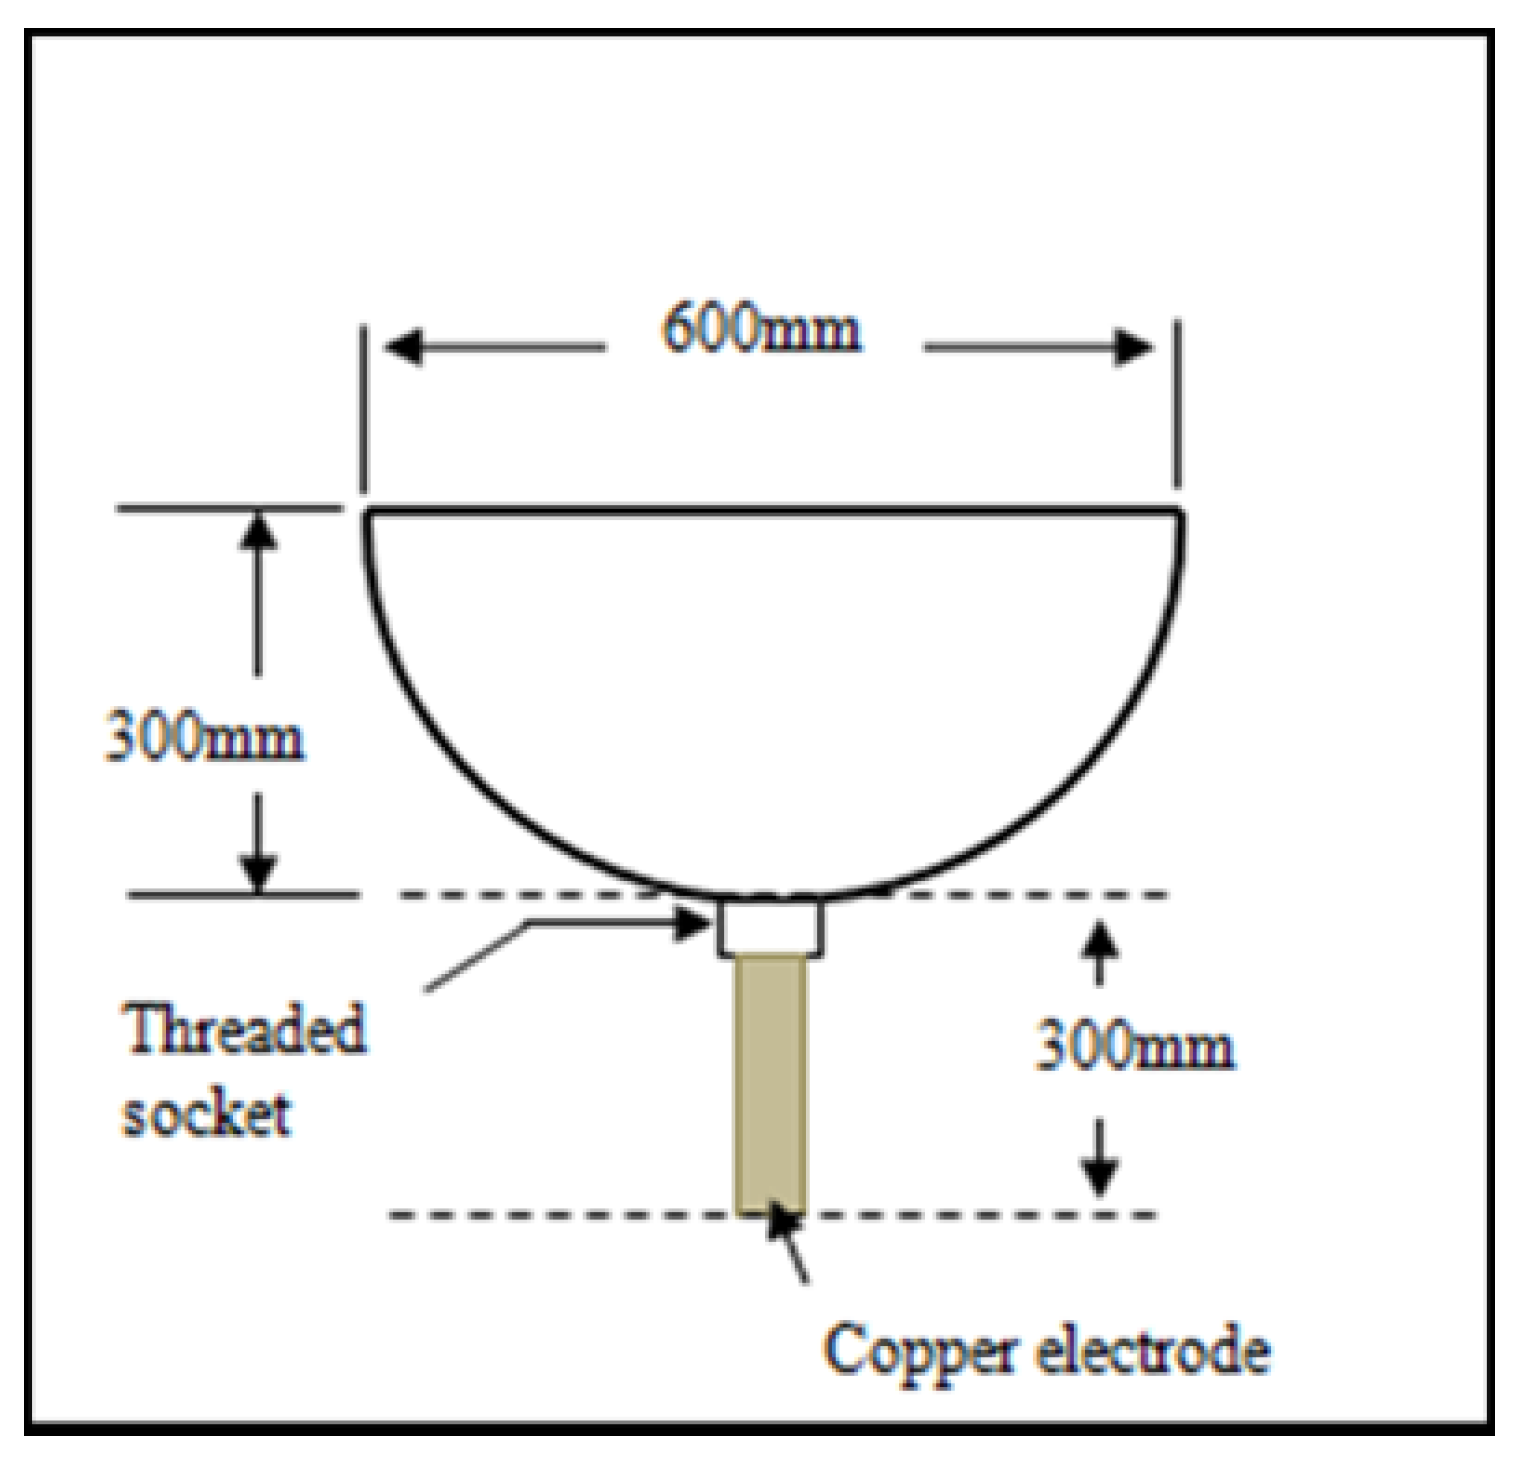
In this paper, despite the soil extracted from four different sites, with a variety of soil compositions, it was obvious that large grain soil size shows more realistic results, and is close to other published work, in comparison to small soil grain size. This study also suggests that to encourage ionisation and breakdown to occur in the soil, large soil grain size can be considered. This paper investigates sixteen test samples representing the local test media at sites, where variations in soil grain size are seen. A hemispherical test rig with two different inner electrodes is used, where, from the voltage and current measurement, the discharged times and impulse impedance values are obtained.

2. Experimental Arrangement

2.1. Test Sample Preparation

In this study, soil collected from four sites, where the sites are located at least 20 km apart from one place to another, is used. In order to have proper handling of the soil, and minimise the disturbance of the soil while taking the soil from the site, and placing it in a container to be tested in the laboratory later on, the test media is collected using a box sampling method, as shown in Figure 1a–d. In this method, for each test sample, the top layer of 0.5 m was removed, which prior to this, the soil was cut to the box’s size of 1.1 m × 1.1 m × 1.1 m, shown in Figure 1a,b. This large size of box is used to match the size of the test rig used in this study; a hemispherical container having a diameter of 0.6 m. Once the soil is in the box, it is transferred to the container so the top layer from in situ remained as the top layer in the container, and similarly applied for the bottom layer (see Figure 1c), which is a representation of the real soil extracted from the site. This way, the soil density, compression and profiles are not largely disturbed. The soil is levelled off to the container’s level (see Figure 1d), which can provide more uniform electric field distribution and reduce the breakdown process that may occur between the active rod and the metallic container if part of the container is exposed. Special care in ensuring the original soil did not dry out while transporting it to the lab. The container is covered with big paper.
Each test sample is sent to a civil lab to obtain its soil compositions and grain sizes of soil, which are summarised in Table 1. It can be seen in Table 1 that the larger the percentage of gravel, the larger the particle size distribution is, i.e., test sample A has the largest percentage of gravel, followed by test sample B. Test sample D has the largest percentage of clay, with no gravel, that contributes to the smallest grain size, which is defined as organic soil. It was noticed from Table 1 that soil has a close percentage of water contents, ranging from 25% to 29%, though the soil is taken from four different sites, and has a different range of soil composition. Various percentages of water content were poured into the soil; 3%, 6% and 10% of water content, to investigate the effects of water content on the impulse breakdown of soil. No mixture was done so that the soil compactness remains the same throughout the tests.

2.2. Test Cells

Figure 2 shows the hemispherical test cell used in the study. Two inner active electrodes are used for this hemispherical container; a solid spherical electrode with a diameter of 9 cm, and a copper strip of 10 cm length, 25 mm width with a thickness of 3 mm, defined as C1 and C2, respectively. For the spherical active electrode, it is buried at 4.5 cm depth, and for a copper strip, it is joined to a 16 mm rod, and the strip electrode is buried at a 20 cm depth in the soil contained in the hemispherical container.

2.3. Impulse Test Circuit

In this study, a three-stage impulse voltage generator was used, which is capable of producing a standard lightning impulse voltage of 1.2/50 μs and generating up to 300 kV. Figure 3 shows the impulse generator used in the study, where abbreviations used in the test circuit are given below:
GS—diode, 140 kV PIV
Cs—impulse capacitor, 25 nF
RL—current limiting resistor, 10 MΩ
Re—wave tail resistor (control tail time),
Rd—wave-front resistor (control front time),
Cb—load capacitor,
SEK—secondary unit NTZ,
RM and SEK DC—for DC measurement
The gap of the spark gap is manually adjusted with a controller unit to trigger it at the desired charging voltage value. A capacitive divider was used to measure the voltage response, while a current transformer (CT) with the ratio of 0.01 V/A with a response time of 150 ns was used to measure the current response. A digital storage oscilloscope (DSO) was used to capture both voltage and current traces. Impulse voltage magnitudes are increased until the breakdown traces are seen from the voltage and current traces, captured by the digital storage oscilloscope (DSO). Once the breakdown was noted, up-and-down tests, based on IEC 60-1 [15] were carried out on each test medium. The results are discussed in the next section.

3. Results

3.1. Resistance, RDC Values

The inner electrodes are pushed with some effort into the soil. Different percentages of water content are added by pouring 3%, 6%, 10% to the original soil, where the test samples are now identified according to the percentage of water content added in (i.e., A0 for test sample A with original water content, and A3 for test sample A with 3% of water content poured into the container). Resistance values are measured for each test sample, where the terminals of the multi-meter are placed at the inner active electrode and at the outer part of the test cell, where the results are presented in Table 2 for both test cells C1 and C2. Expectedly, it can be seen that the higher the percentage of water content, the lower the resistance values for both test cells are. However, as more water is added in, resistance values are reduced at a slower rate, as shown in Figure 4. A similar observation is also seen in IEEE Std. 80 [16] where the soil resistivity is hardly affected by the percentage of water content in it for the soil filled with a large amount of water content, which was stated as approximately more than 22%. It is also known that the soil resistivity is influenced by soil grain size, percentage of chemical content, compactness and soil composition. In this study, with various soil grain sizes and soil composition, it can be seen that the percentage of water content in soil affects the reduction of resistance values differently for different soil, where the significant resistance reduction is seen for test sample A. Despite having high percentages of water content in test sample A, of more than 25%, a fast rate of reduction is still seen, which could be due to the large grain size of the test sample and high resistance values. This gives an indication that the resistance or resistivity value of soil would reduce at various rates despite the soil contained with more than 25% of water content.

3.2. During Pre-Breakdown

Impulse tests at different voltage levels are applied on each test sample, and voltage and current measurements are captured. From these measurements, impulse impedance and current discharged times are obtained. Figure 5 shows the typical voltage and current traces obtained for test sample A in C1. It can be seen from the figure that the current trace exhibited high oscillations at its front times and was found to be discharged at a faster time than the voltage trace. High oscillations on the current trace could be due to the presence of the capacitive effects, due to the air voids and interfaces of the soil and the electrodes. Getting the value of peak current is not a direct forward measurement, due to these oscillations. However, some considerations were made so that the peak current can be measured and fairly consistent from one figure to another, where the peak current is just above the flat plateau of the current magnitude, denoted in Figure 5. Current trace discharged at faster times than the voltage trace could be due to non-linearity of the test cell, which is having a similar trend when impulse tests are carried out on the surge arrester, having non-linear characteristics, as demonstrated in [17]. For other test samples, and other voltage levels, similar observations are seen for voltage and current traces, with current traces having initial oscillations and faster discharged times in current traces than the voltage traces.

3.2.1. Current Discharged Times

Current discharged times are measured and plotted versus peak current in Figure 6, Figure 7, Figure 8 and Figure 9, respectively, for test samples A, B, C and D, that were added with various percentages of water content for configurations C1 and C2. This is rather expected since, at higher magnitudes of current, the conduction is improved, hence a shorter time for the current to discharge to the ground. A much clearer relation of current discharged times decrease with increasing peak current is seen for test sample A for all percentages of water content, for both test cells C1 and C2, while for other test samples, inconsistencies in the results are seen (i.e., current discharged times are independent of water content, longer current discharged times in a large percentage of water content). Another observation with the clear trend for test sample A is that for the same percentages of water content, the current discharged times are slower for test sample A in C2 than in C1. This could be due to high resistance values, RDC of C2 than in C1, thus producing slower conduction. This trend is also seen in several publications [4], where the higher the resistance values of ground electrodes, the slower the current discharged times are. The clear relations in terms of current discharged times with current magnitudes are seen in test sample A and could be due to the large grain size of test sample A. It was, however, noticed that from other test samples, shown in Figure 6, Figure 7, Figure 8 and Figure 9, the trend of current discharged times with increasing currents are not as clear relation as seen in test sample A. For test samples B and D, current discharged times decrease with increasing currents with no addition and 3% addition of water content only, but not when the test samples were mixed with a higher percentage of water content. No clear relation is seen for test sample C in terms of current discharged times and the current magnitudes. These observations show that the soil grain size (as seen as a clear relation in test sample A), and the percentage of water content in soil (as seen in all test samples A, and below 3% for test samples B and C) can really affect the current discharged times, which indicated as the streamers propagation rate in soil.

3.2.2. Impulse Impedance

It can be seen from Figure 5 that peak current occurs at the same time as the peak voltage. Impulse impedance values are then taken as the ratio of peak voltage to the peak current. Figure 10, Figure 11, Figure 12 and Figure 13 show impulse impedance values versus magnitudes of peak current, respectively, for test samples A, B, C and D. It can be seen from all of these figures that test samples with high RDC values have high impulse impedance values; hence for the same test samples and current magnitudes, higher impulse impedance values are seen in test samples with strip (C2) than hemi (C1) inner active electrodes, and the higher the percentage of water, the lower the impulse impedance values are. It was also observed that impulse impedance values decrease with increasing current magnitudes in most test samples. In several test samples, particularly with low RDC values, the impulse impedance values, however, are not affected by the current magnitudes. This is also seen in other publications [2,3,4,5,12] where the lower the RDC values, the lower the dependency of impulse impedance on the current magnitudes are.

3.3. During Breakdown

Figure 14 shows the typical voltage and current traces during soil breakdown at an applied voltage of 53 kV, for test sample A, where the voltage trace exhibited a sudden drop, with the current trace sharply increased. It can be seen in Figure 14 that there is an initial peak current, due to the ionisation process, before leading to a breakdown, which is indicated as a sudden increase of the second peak current, that is higher than the first/initial peak current, and a drop of voltage trace. Similar voltage and current traces are seen in other publications when a breakdown occurred in soil [1,2,3,8,9,10] where a breakdown is followed after the ionisation process in soil. At different voltage levels and for other test media, voltage and current traces are found to have similar responses. In carrying out the up-and-down tests, 21 shots of impulse voltages were applied on each test medium. Table 3 summarises the average breakdown voltage; U50 for various test media added with various percentages of water content for both inner electrodes’ configurations. It can be seen from the table that for spherical active electrode C1, the lowest average breakdown voltage occurred in test medium A, which has the largest grain size, followed by test media B and D. This observation shows that the breakdown voltage is dependent on the soil grain size, and since discharges and breakdown occurred in the air voids, lower breakdown voltage in soil with a large composition of gravel can be due to a large field enhancement in large air voids, in comparison to soil with smaller grain sizes. This finding is similar to that observed in [8], who found that for the same configurations of ground electrodes and applied impulse voltage levels, a breakdown was found to occur in high resistivity soil but not in low resistivity soil, where the high soil resistivity presumably has more air voids than the low soil resistivity. Another clear observation that can be seen from Table 3 is that the higher the percentage of water content added into the soil, the higher the breakdown voltage levels are for spherical active electrode C1. This really gives evidence that a breakdown in soil is due to air voids in soil, where for soil with a large percentage of water content, the air voids are filled up with water, where more energy is needed to vaporise the water to create air voids, and hence increases the voltage level to cause a breakdown in the soil.
It was noticed from Table 3 that copper strip active electrode C2 has lower average breakdown voltage levels than spherical active electrode C1 for test media A, which can be due to the non-uniform electric field of the strip used, in relation to the C1, hence causing the breakdown to occur at lower voltage levels. The table also shows that lower average breakdown voltage levels for copper strip active electrode than strip active electrode is most obvious in test medium A, and as the smaller the soil grain sizes are, the weaker the dependency of the inner configuration on the average breakdown voltages are. This concludes that soil grain size and the configurations of ground electrodes have an important role in determining the breakdown voltage levels.
In this study, times to breakdown are also measured and plotted at various applied breakdown voltages for each test medium. Breakdown voltage is the applied voltage that caused the breakdown, and time to breakdown is denoted as when the voltage trace started to fall, as indicated in Figure 14 for spherical active electrode C1. Figure 15 shows the time to breakdown versus breakdown voltage for the test media experienced breakdown (A, B and D), and for spherical active electrode C1. It can be seen from the graph that breakdown times for test media (A, B and D) are close (within 3 μs to 9 μs), and slowly decrease with the breakdown voltage levels. A clear relation between times to breakdown with increasing breakdown voltage can be seen in previously published work [8,9,10], where the times to breakdown were found to significantly decrease with increasing breakdown voltage levels. In this present paper, slightly longer breakdown times can be noted for test medium A added with 6% and 10% water content, in comparison to other test media, which are found to be unaffected by the percentage of water content. The difference in the percentage of water content seen in test medium A shows a clearer effect of water content on the times to breakdown for the reason of the large grain size of test sample A in comparison to other test media. This is similar to that found in [10], who found the times to breakdown are longer in soil with a large percentage of water content, and this trend is noticed for various soil temperatures. In this current study, low breakdown time delays for test media D added with 3% and 6% are noted, which can be due to high breakdown voltage levels for these test media, hence, reducing the breakdown time delays.
Times to breakdown for both configurations are plotted in Figure 16, and despite the breakdown that occurred at lower voltage in C2, it was found that the times to breakdown are within close range for both configurations. Times to breakdown in C2 are also found to have a weak decrease with breakdown voltage, similar to the times to breakdown in C1. The decrease in times to breakdown with increasing voltage is also found in the discharges or breakdown in air [16], which again indicates that soil breakdown is enhanced with the presence of voids in the soil.

4. Conclusions

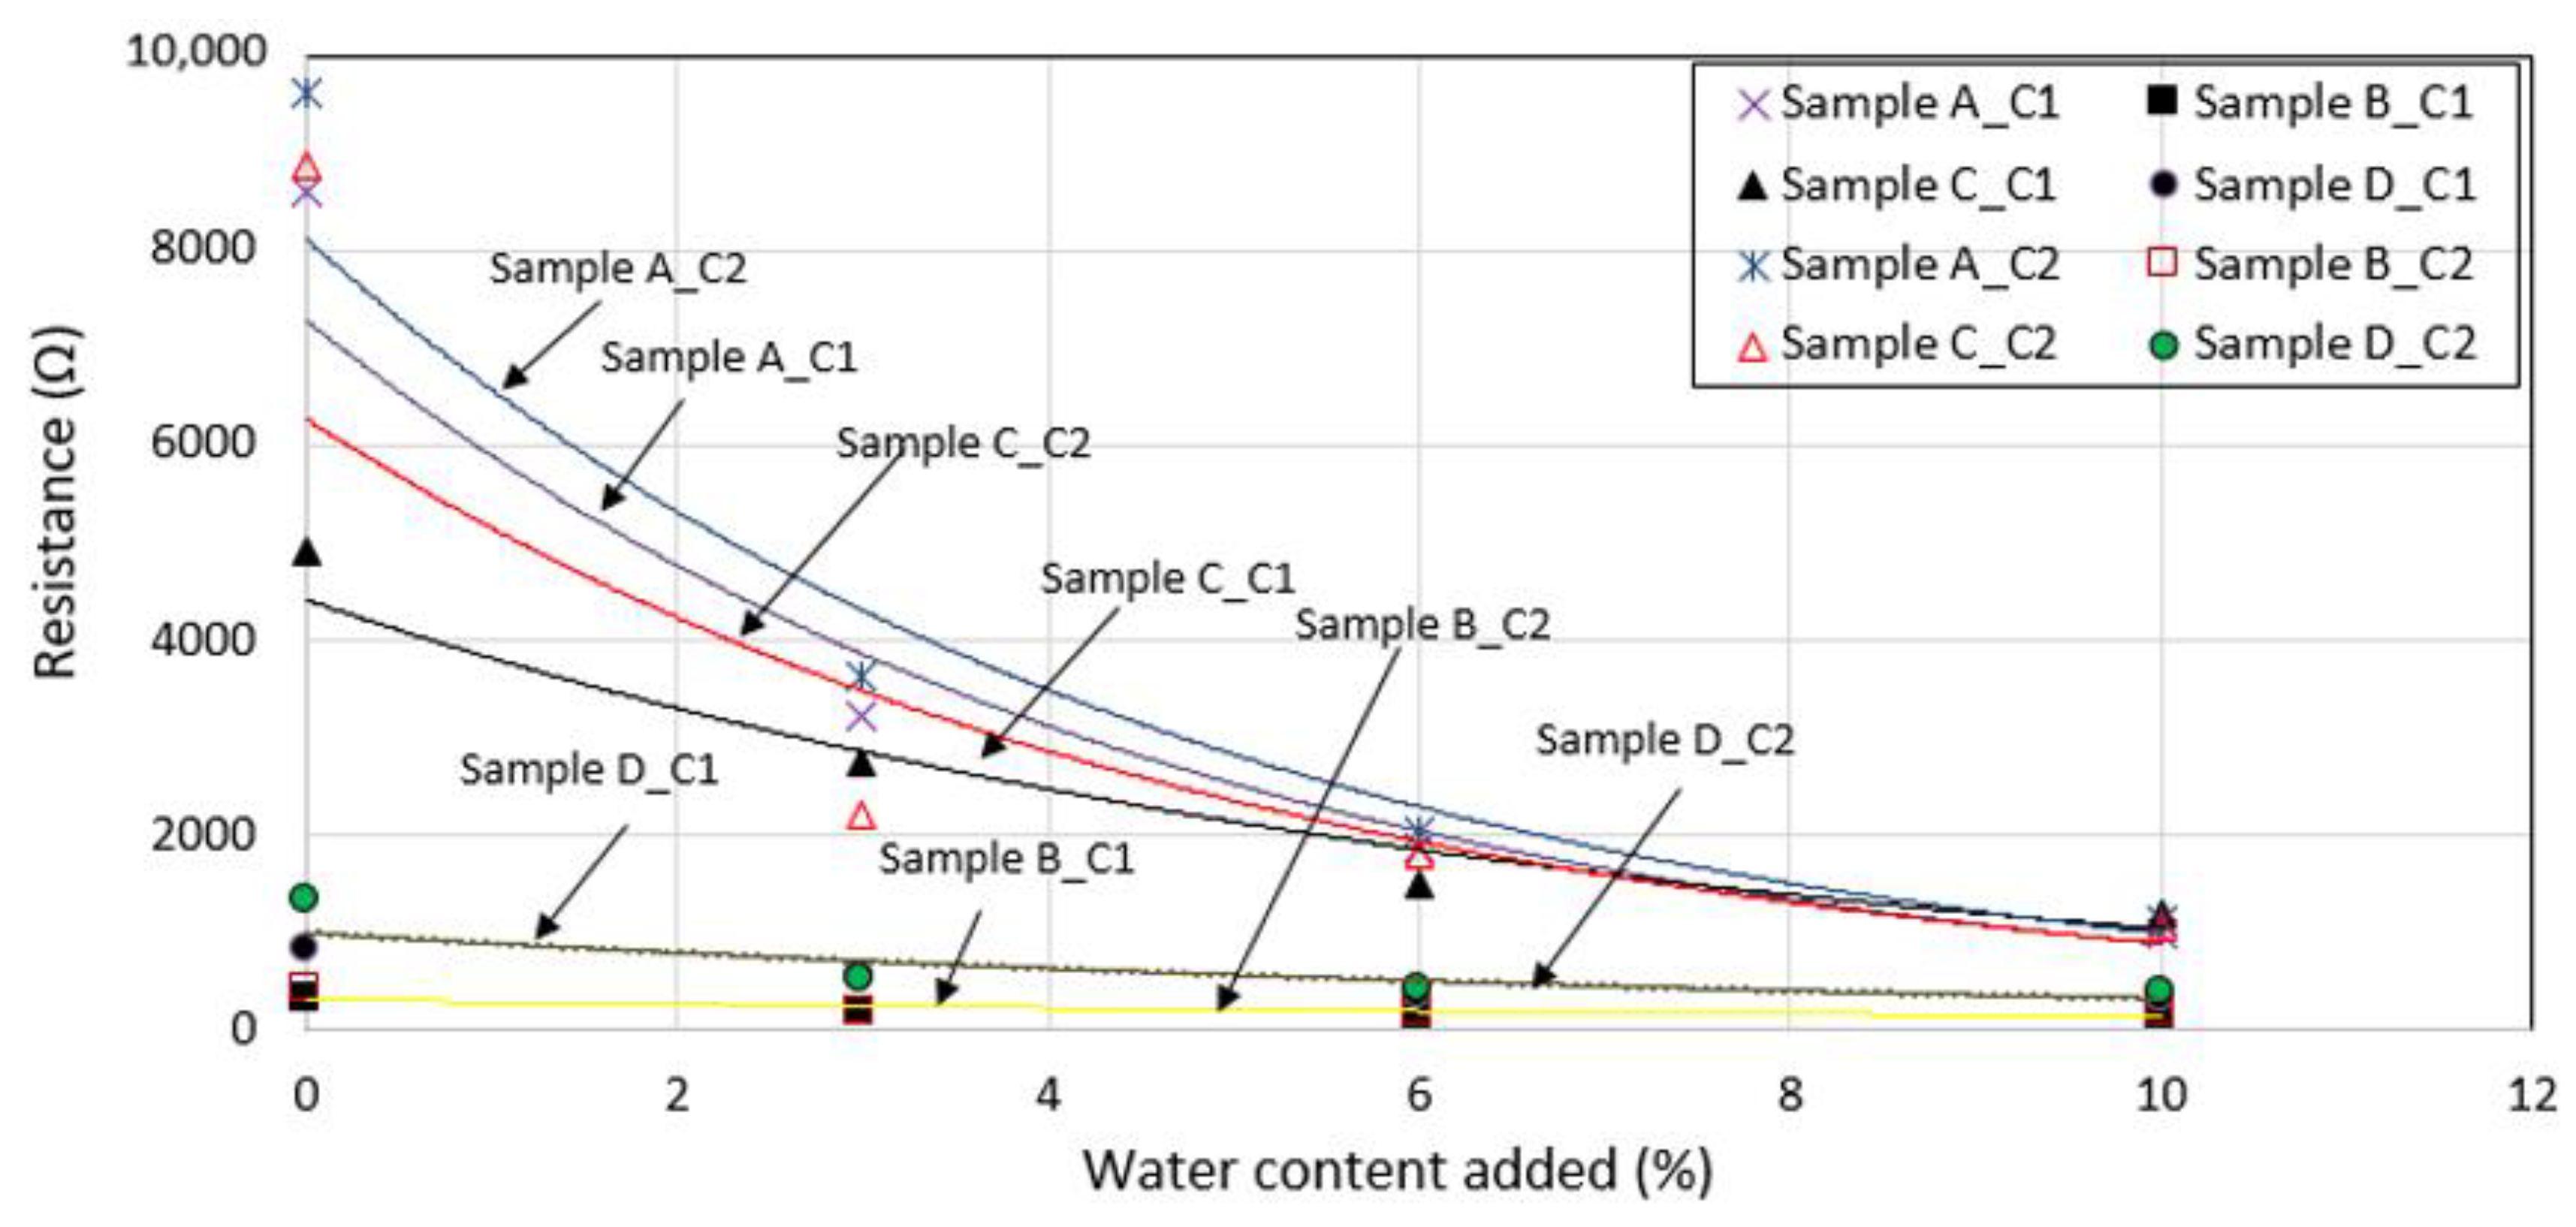
Experimental work on four test samples of various soil grain sizes, composition and the percentage of water content was carried out. With the resistance of the test cell measured at low voltage and low current magnitudes, RDC values decrease with an increasing percentage of water content, and the degree of decrease is found to be influenced by the soil grain size and soil composition. Despite the percentage of water content being more than 25%, a significant decrease in RDC values with an increasing percentage of water content is seen, particularly in the test sample with a large grain size.
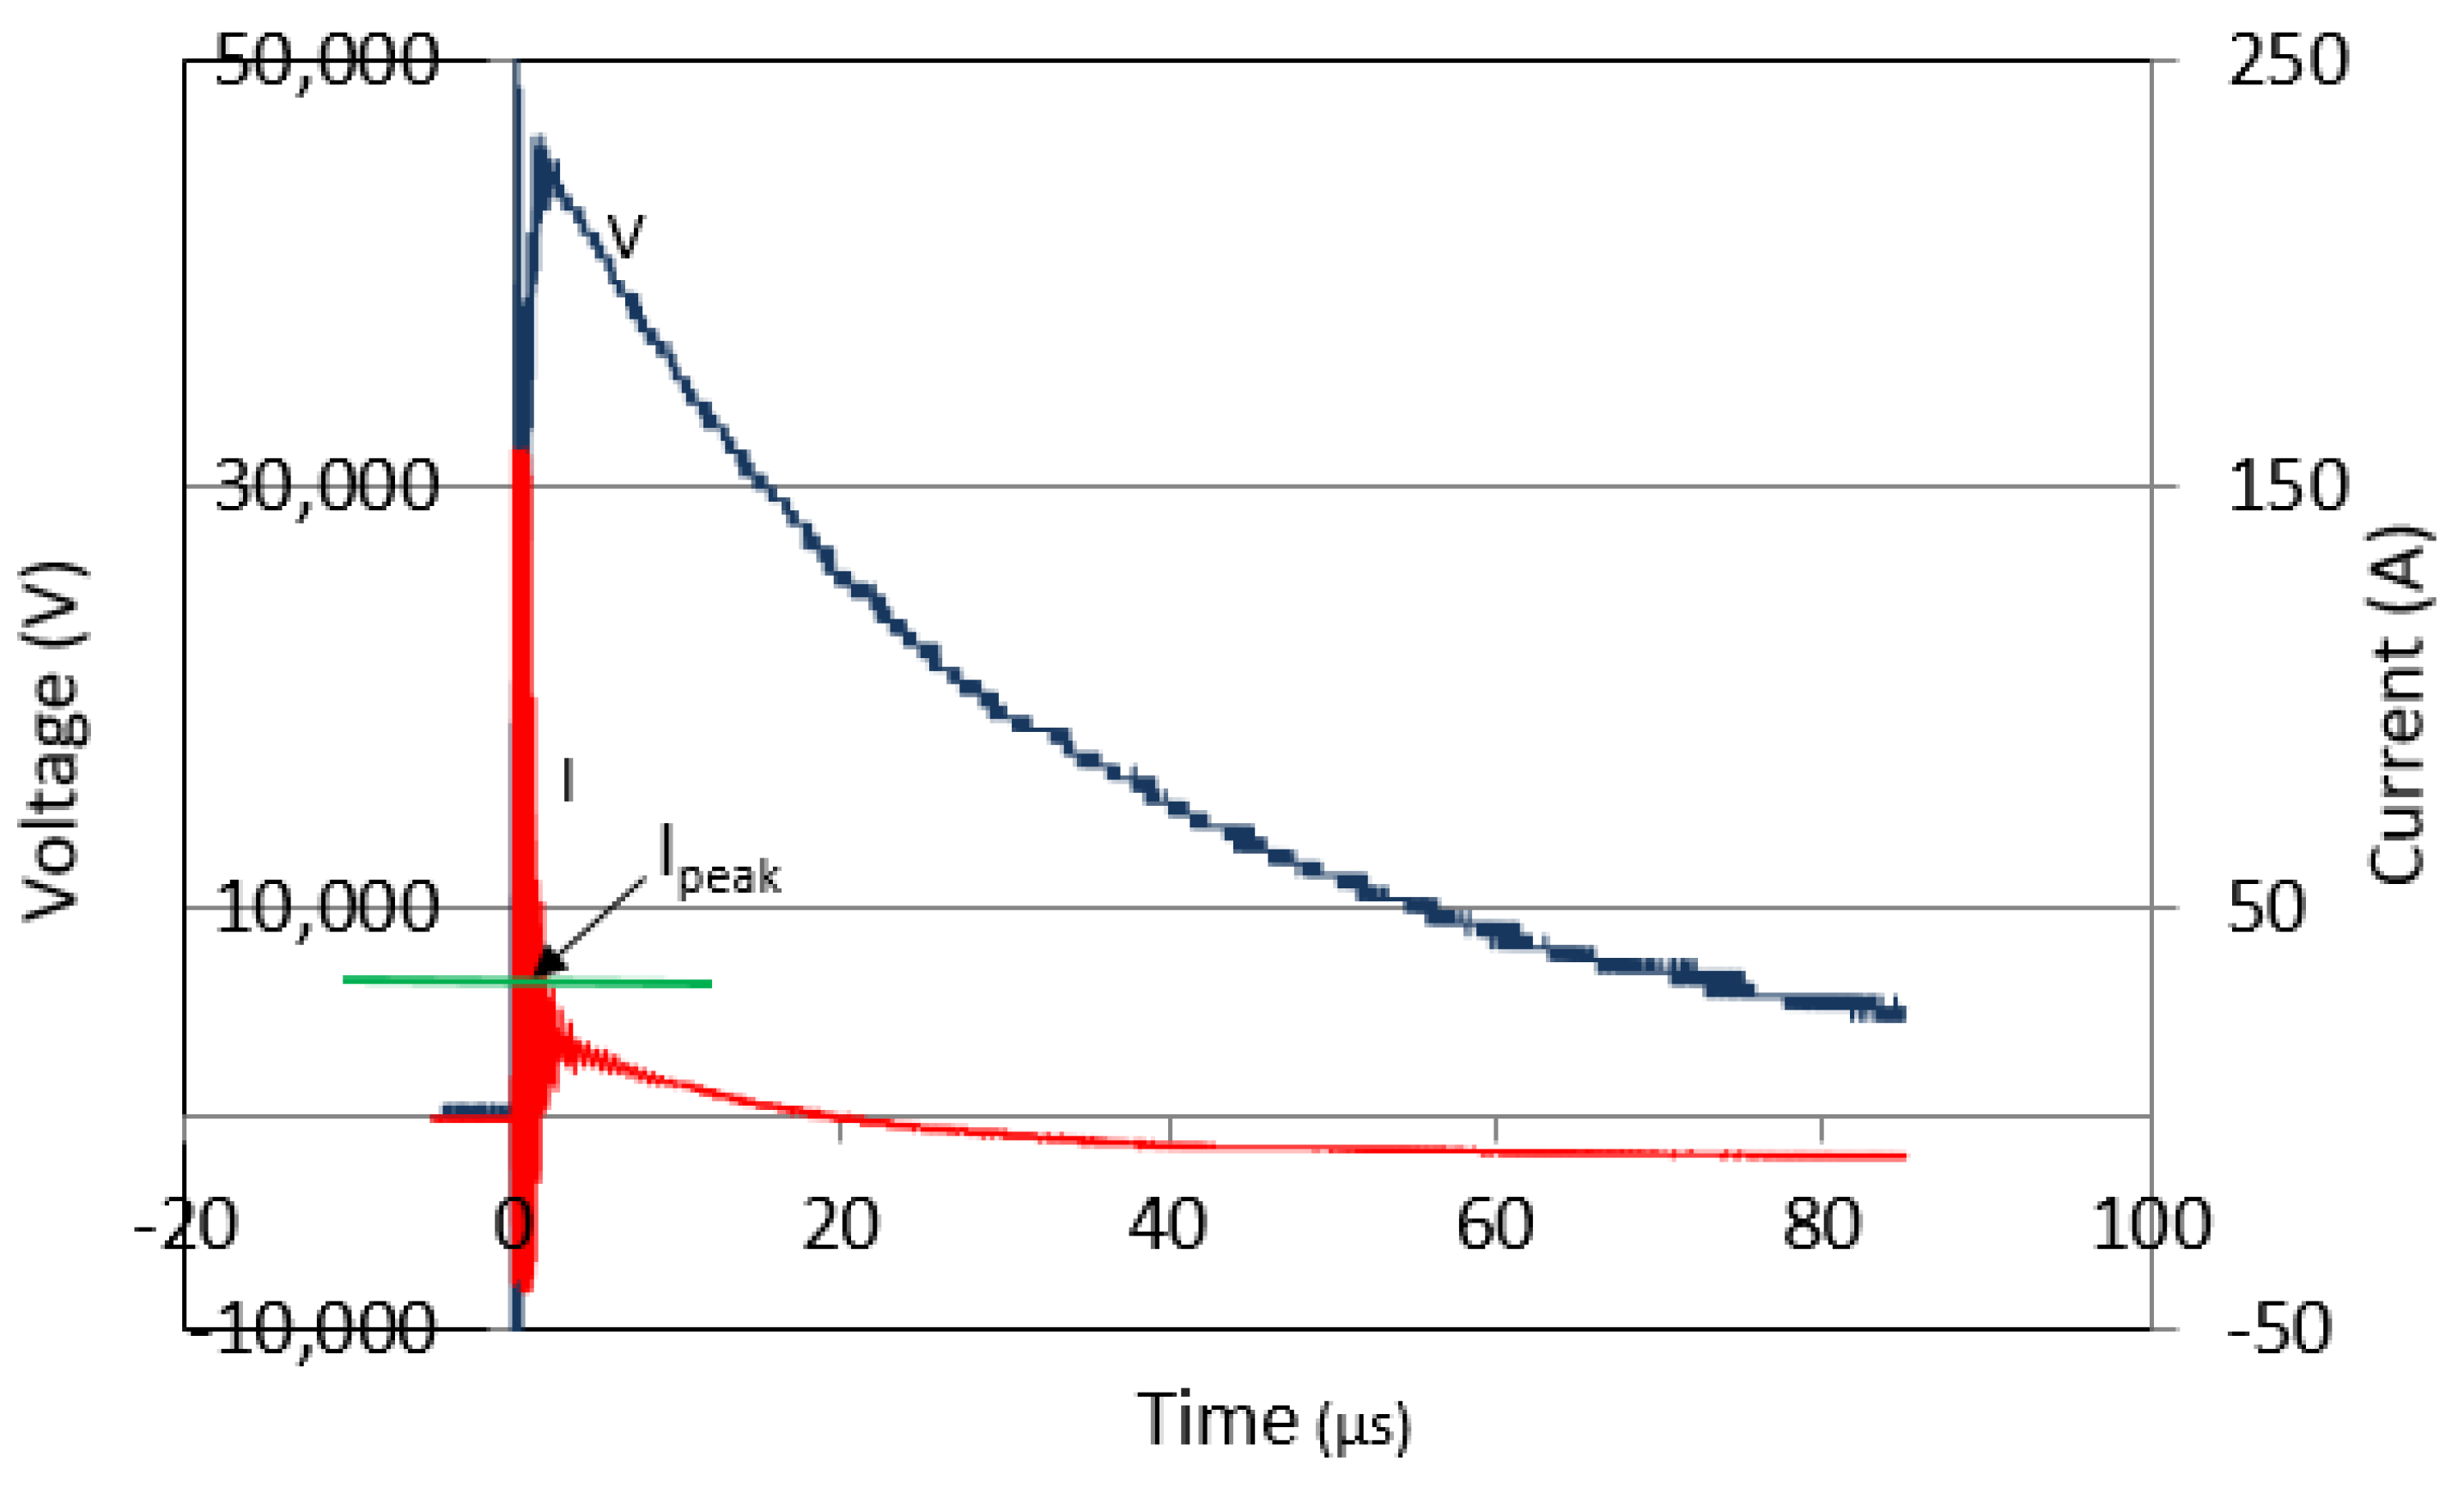
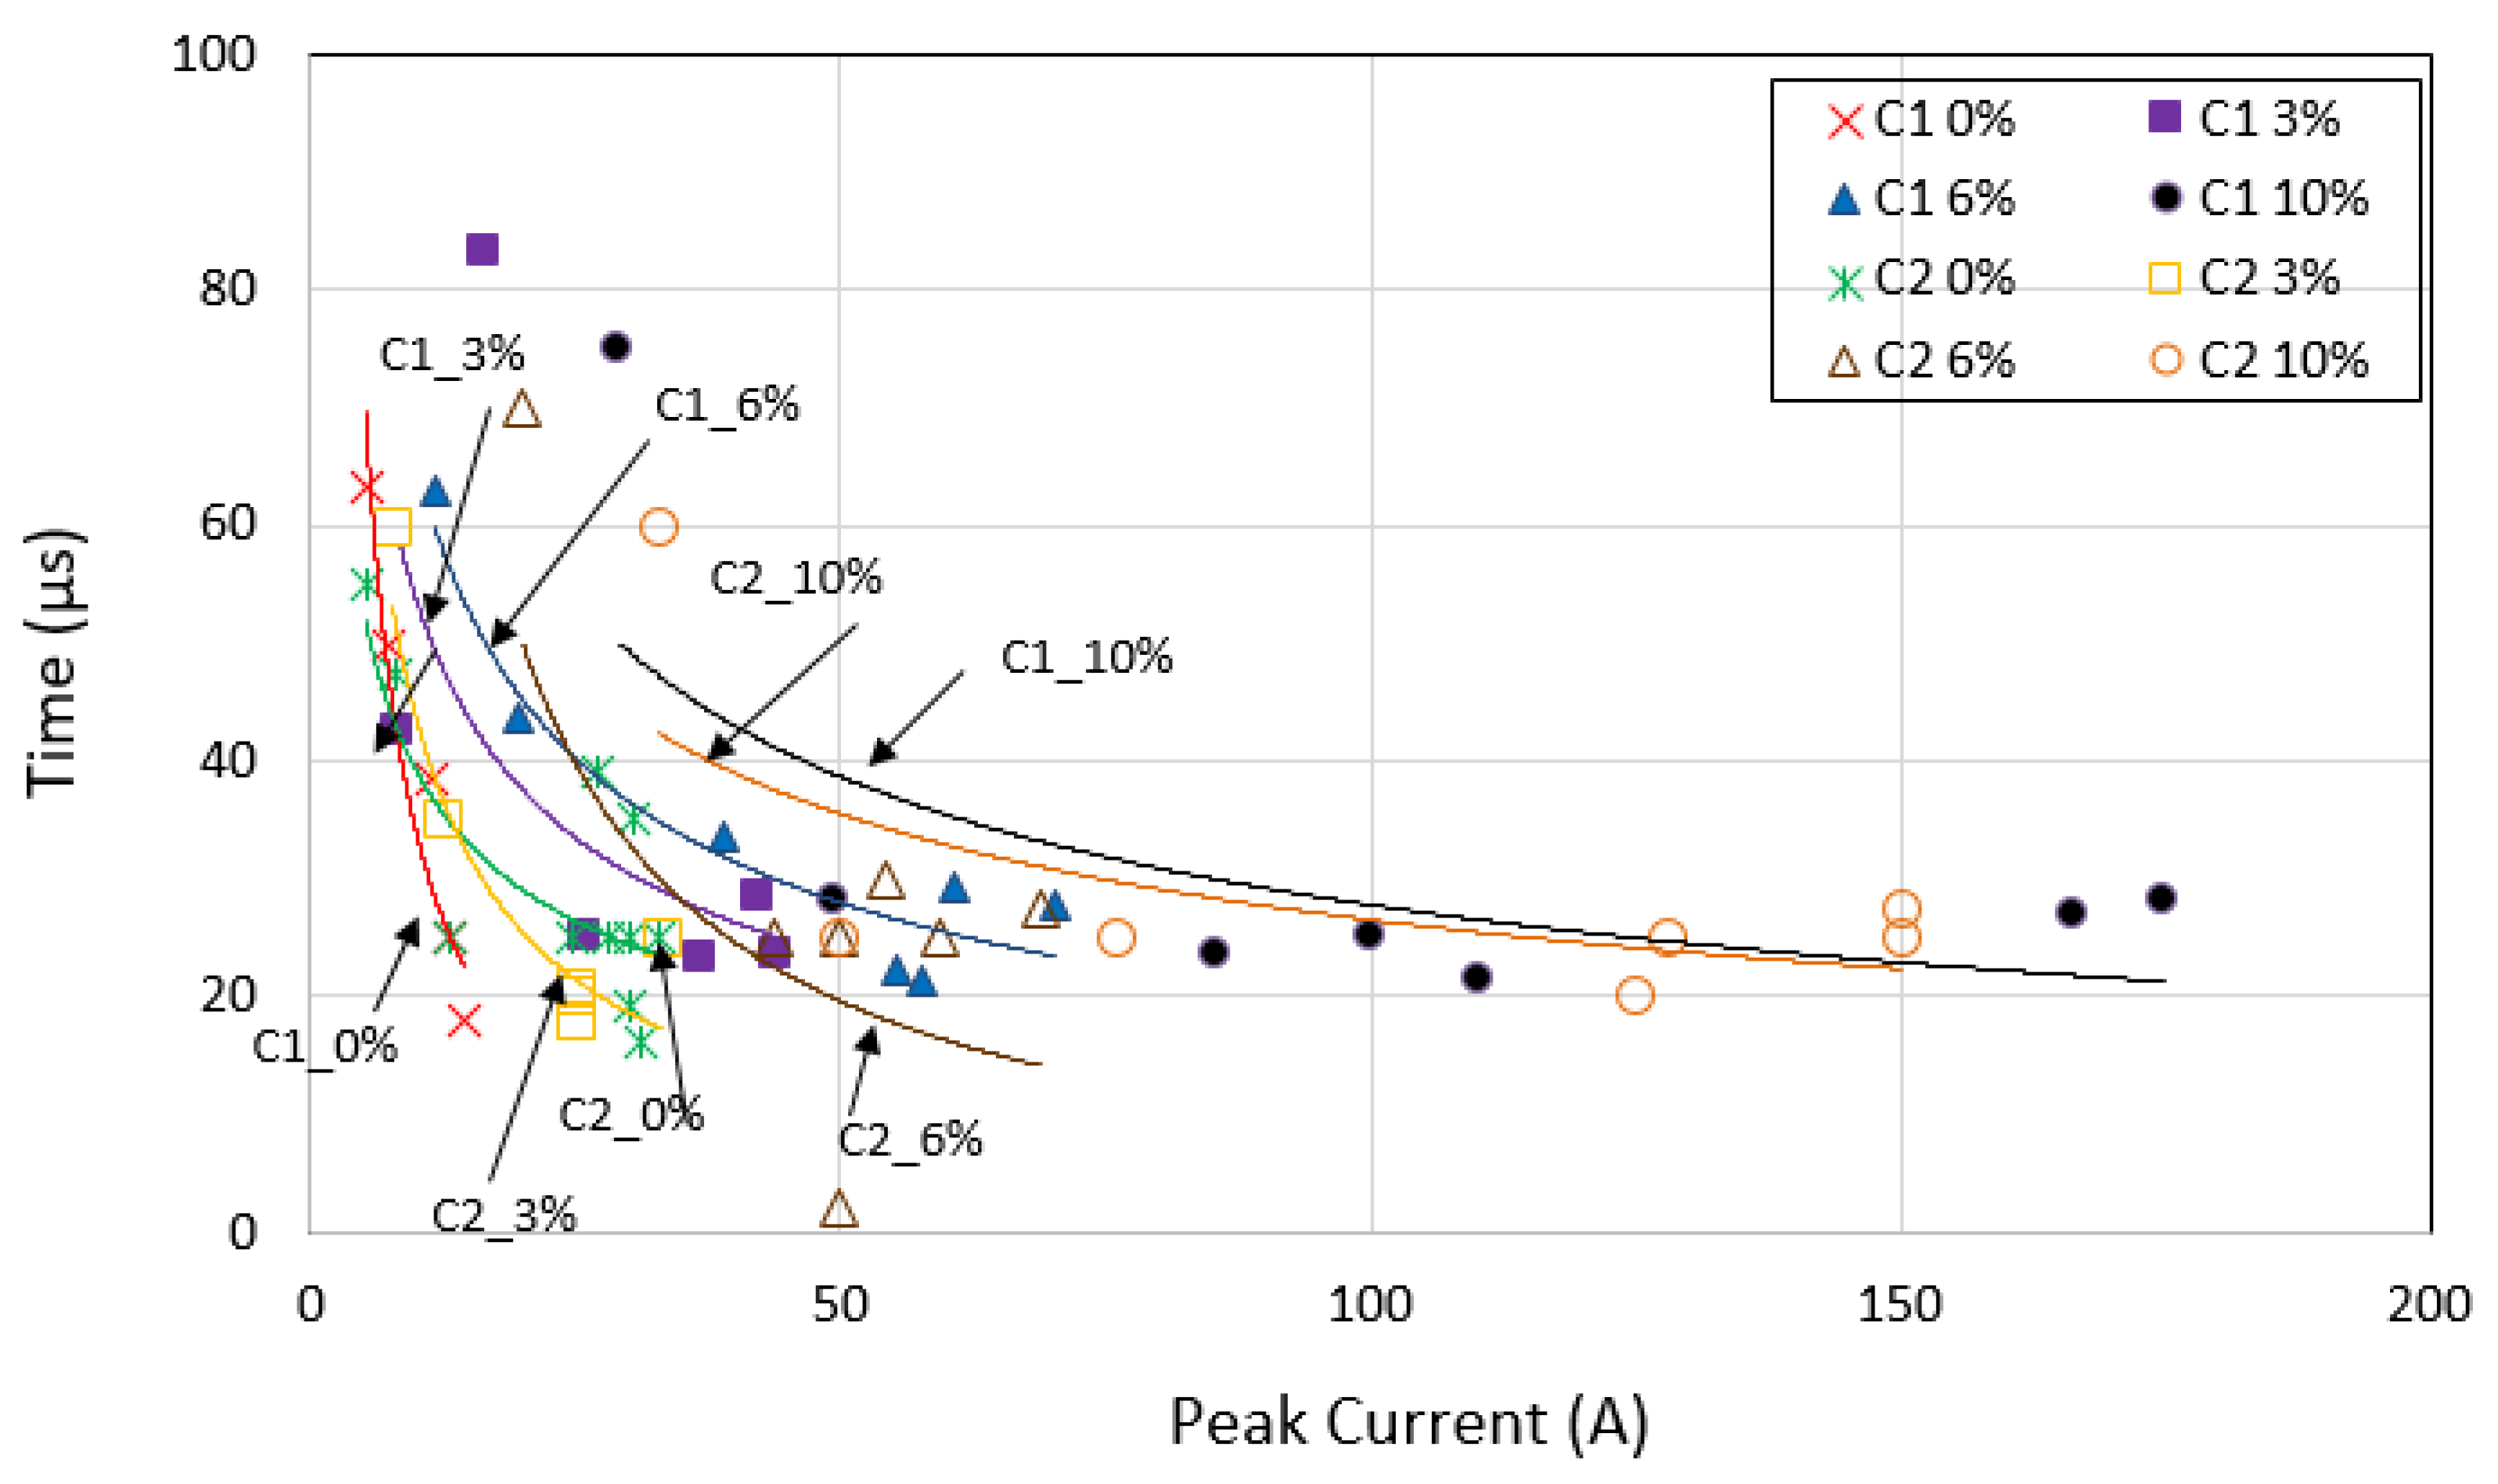
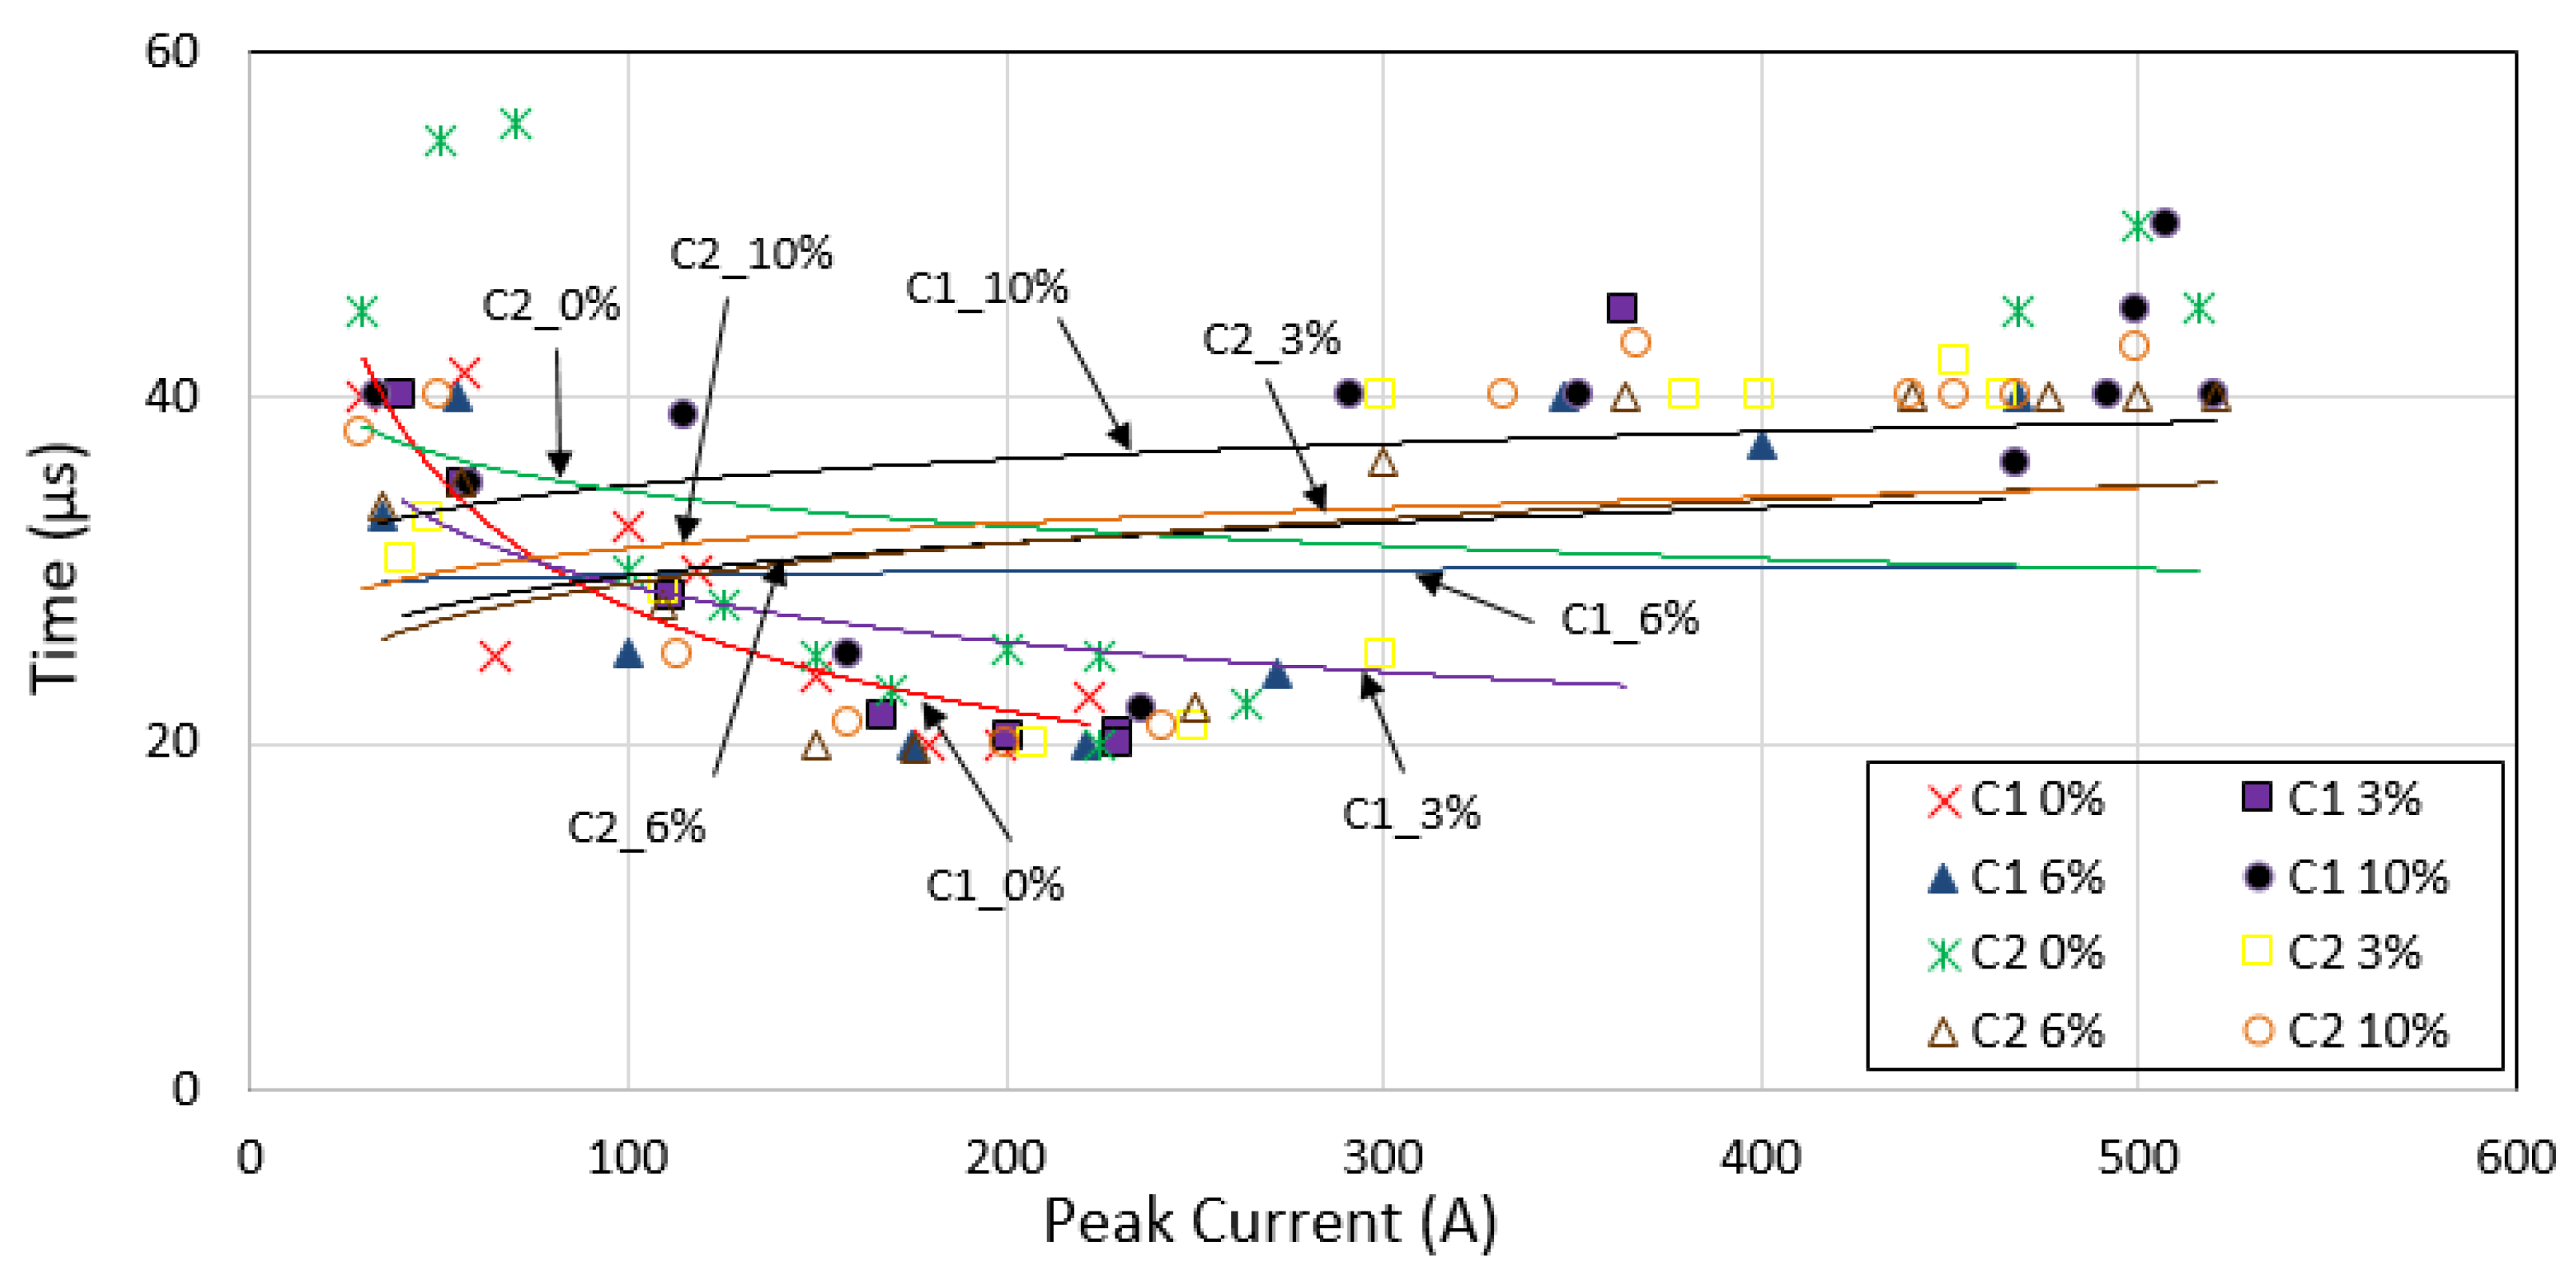
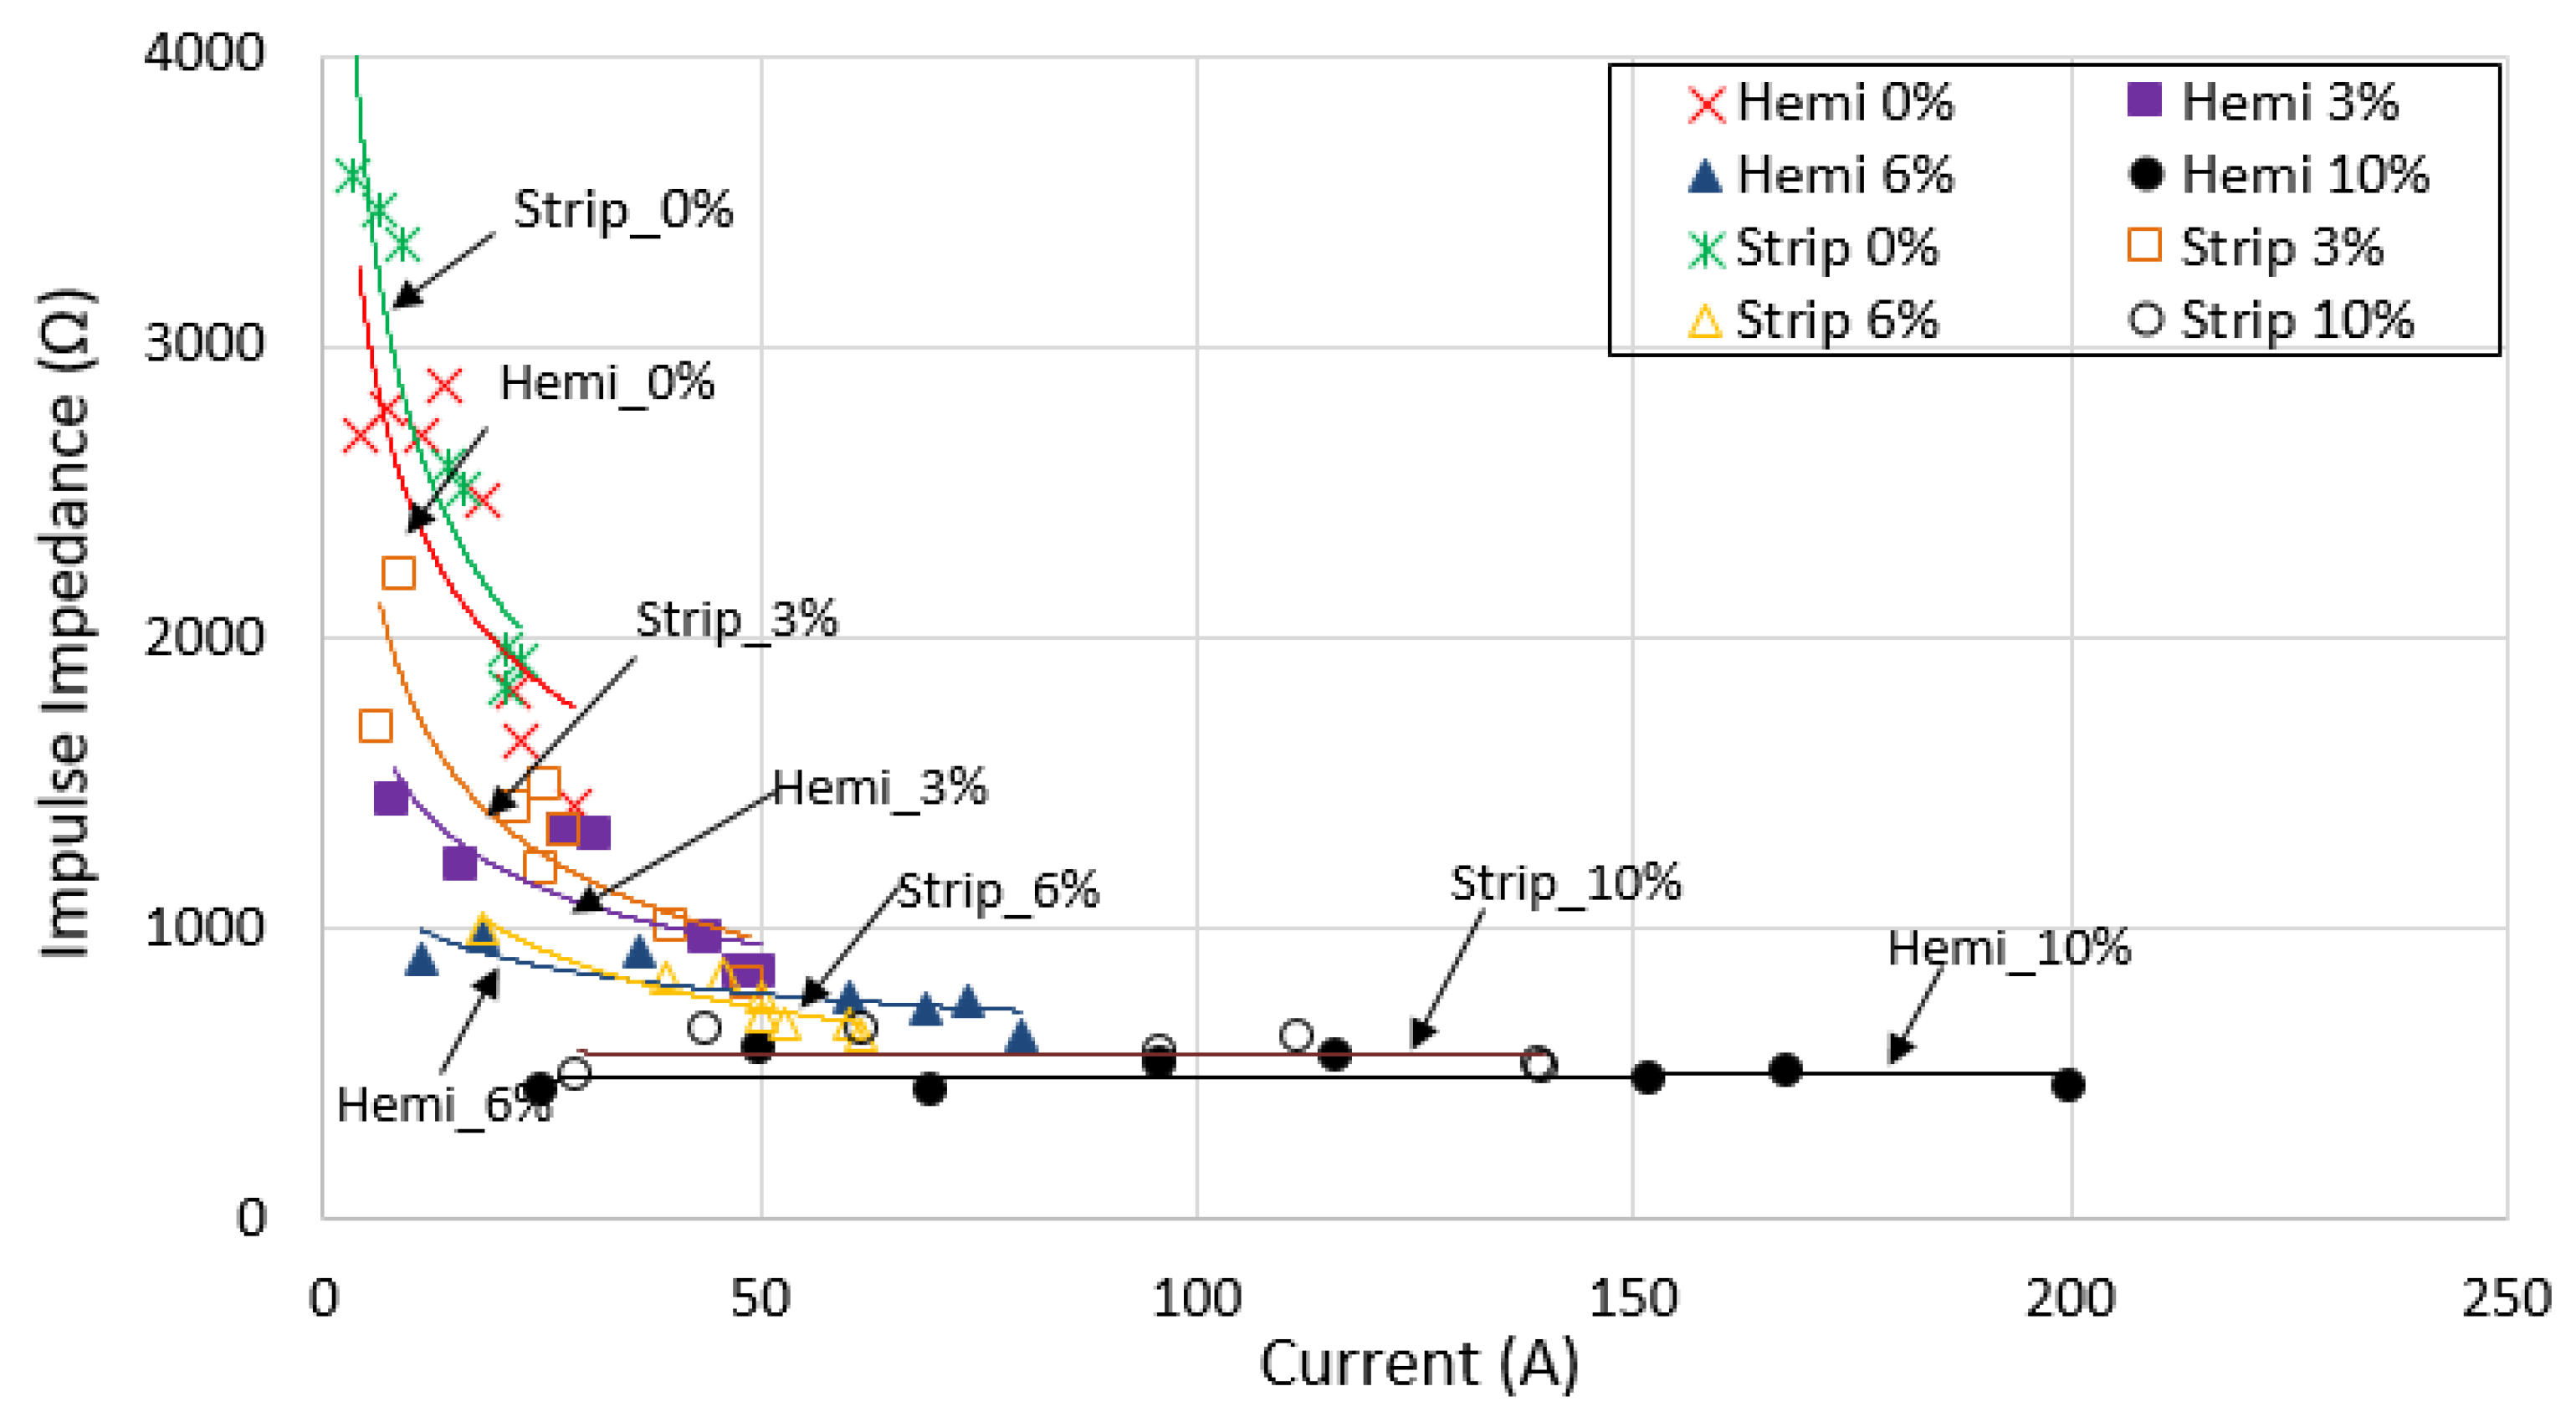
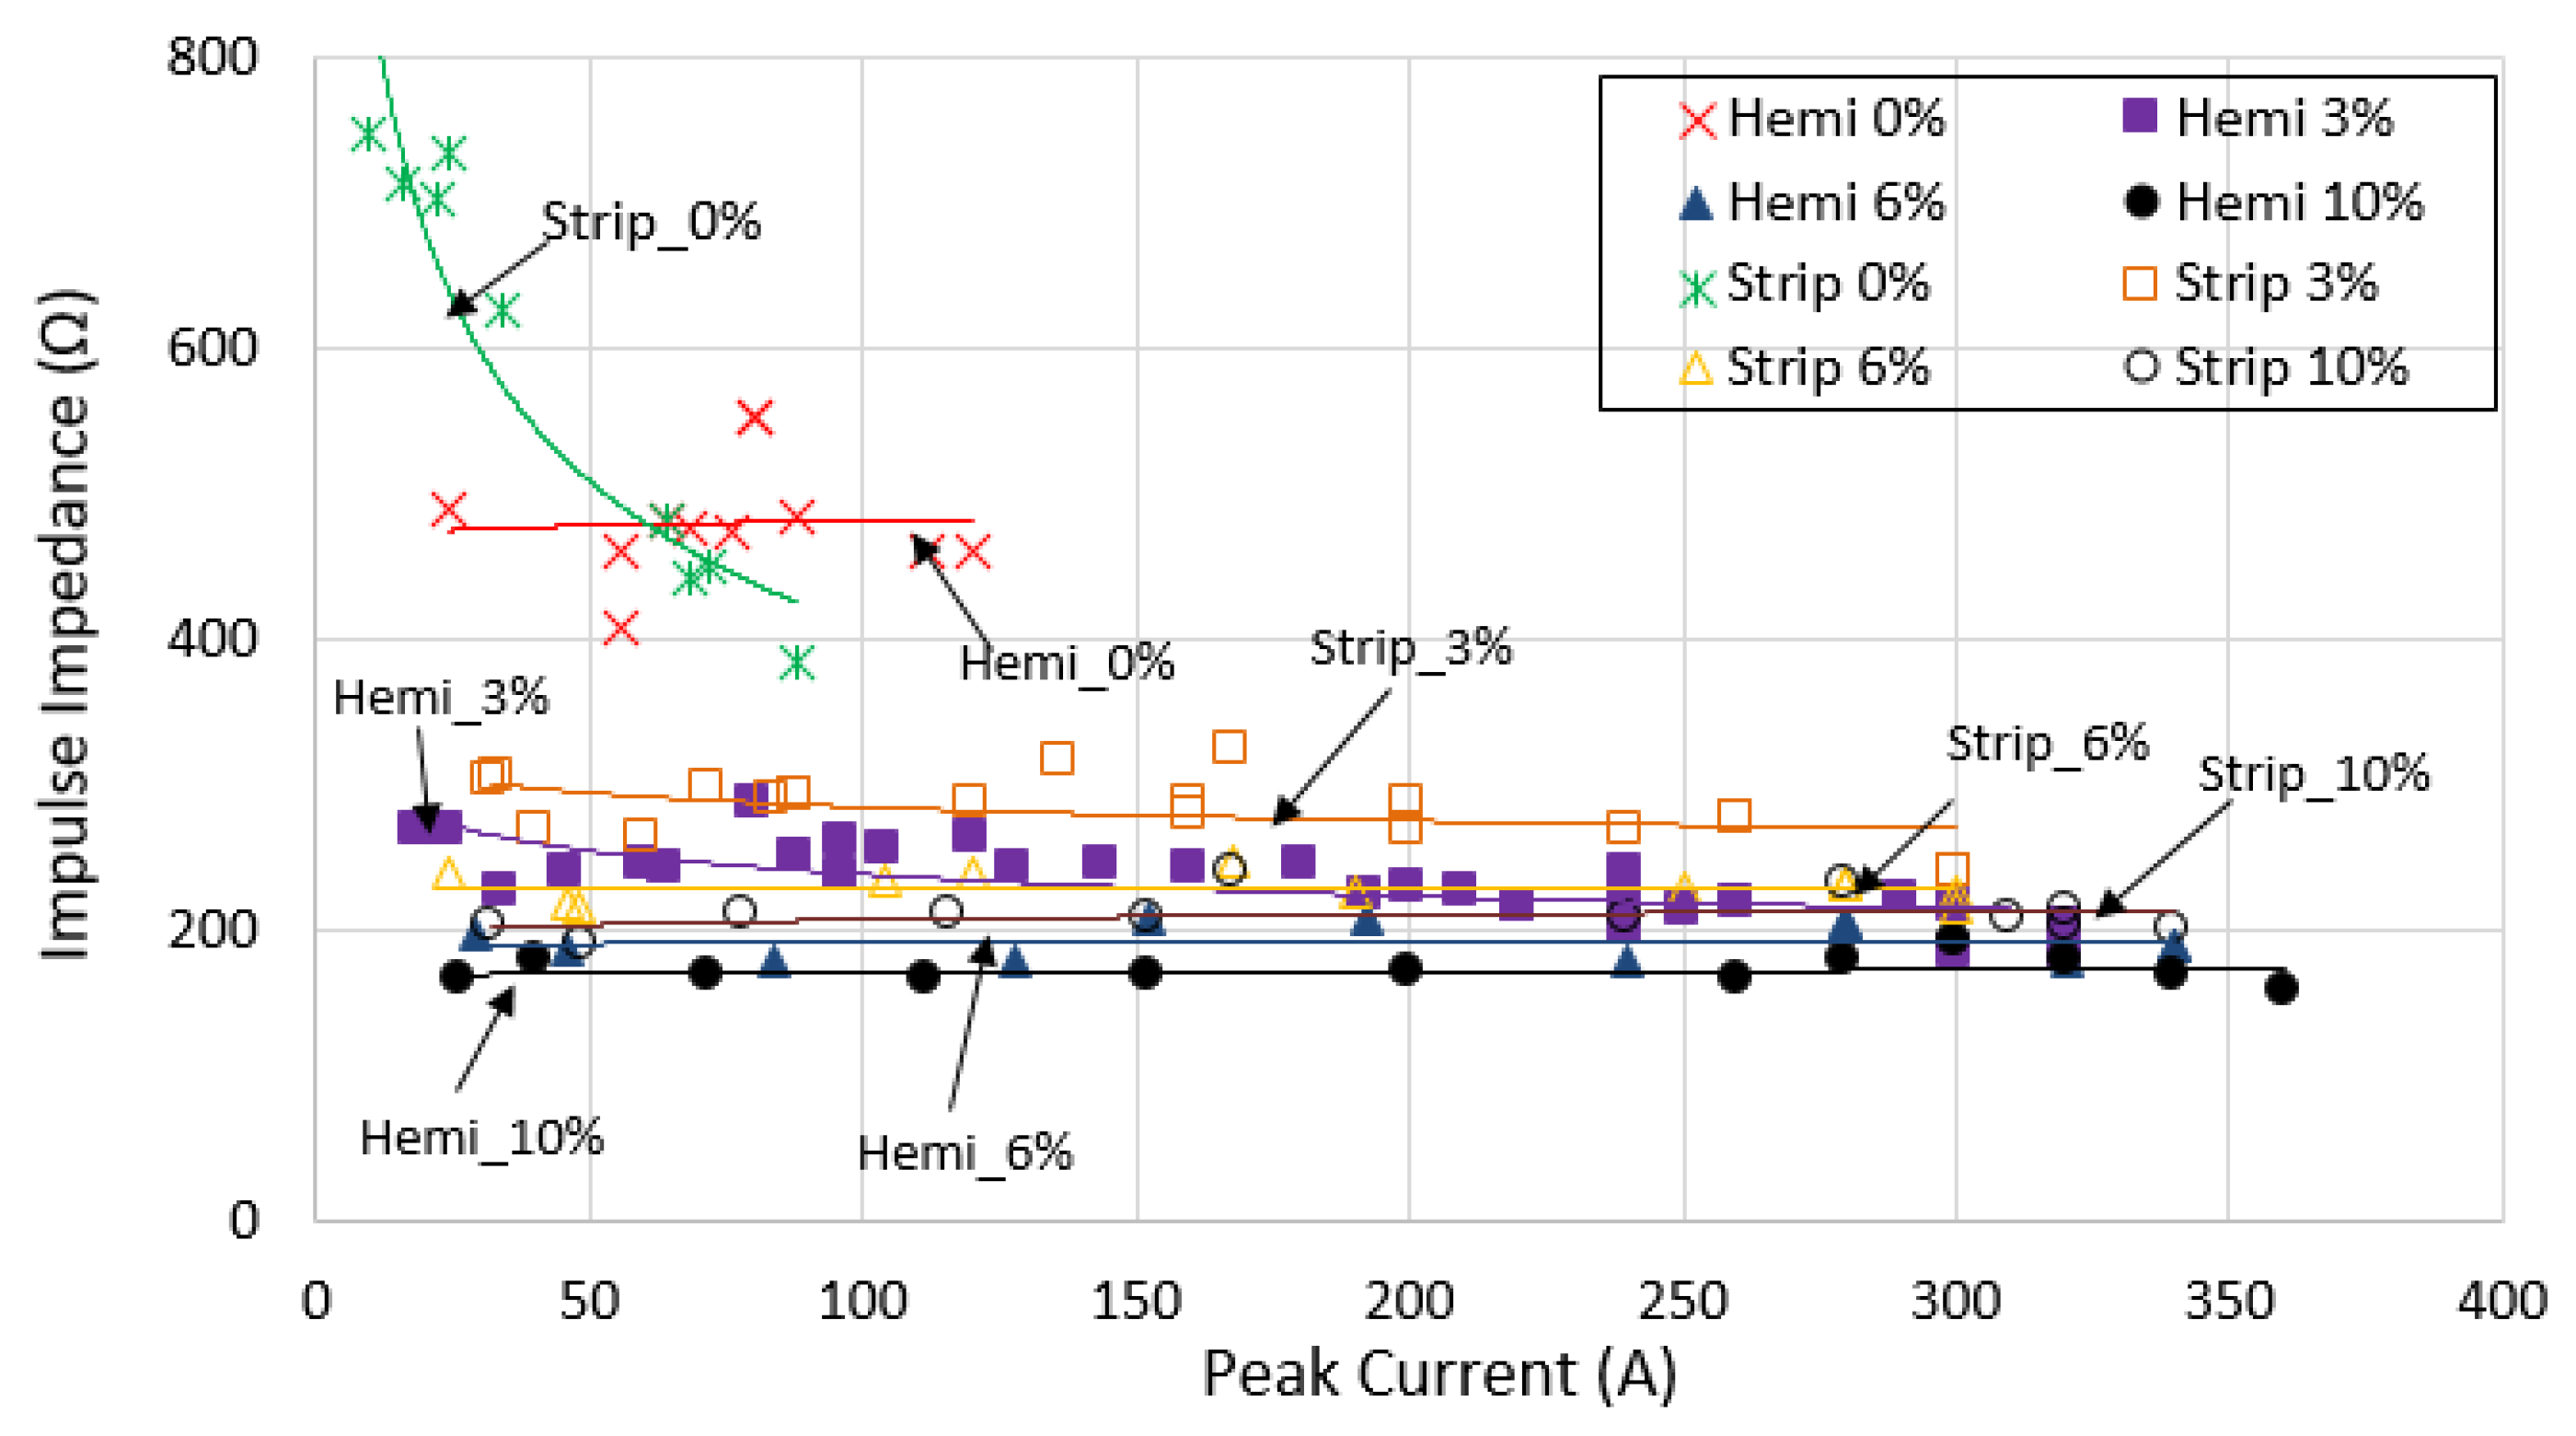
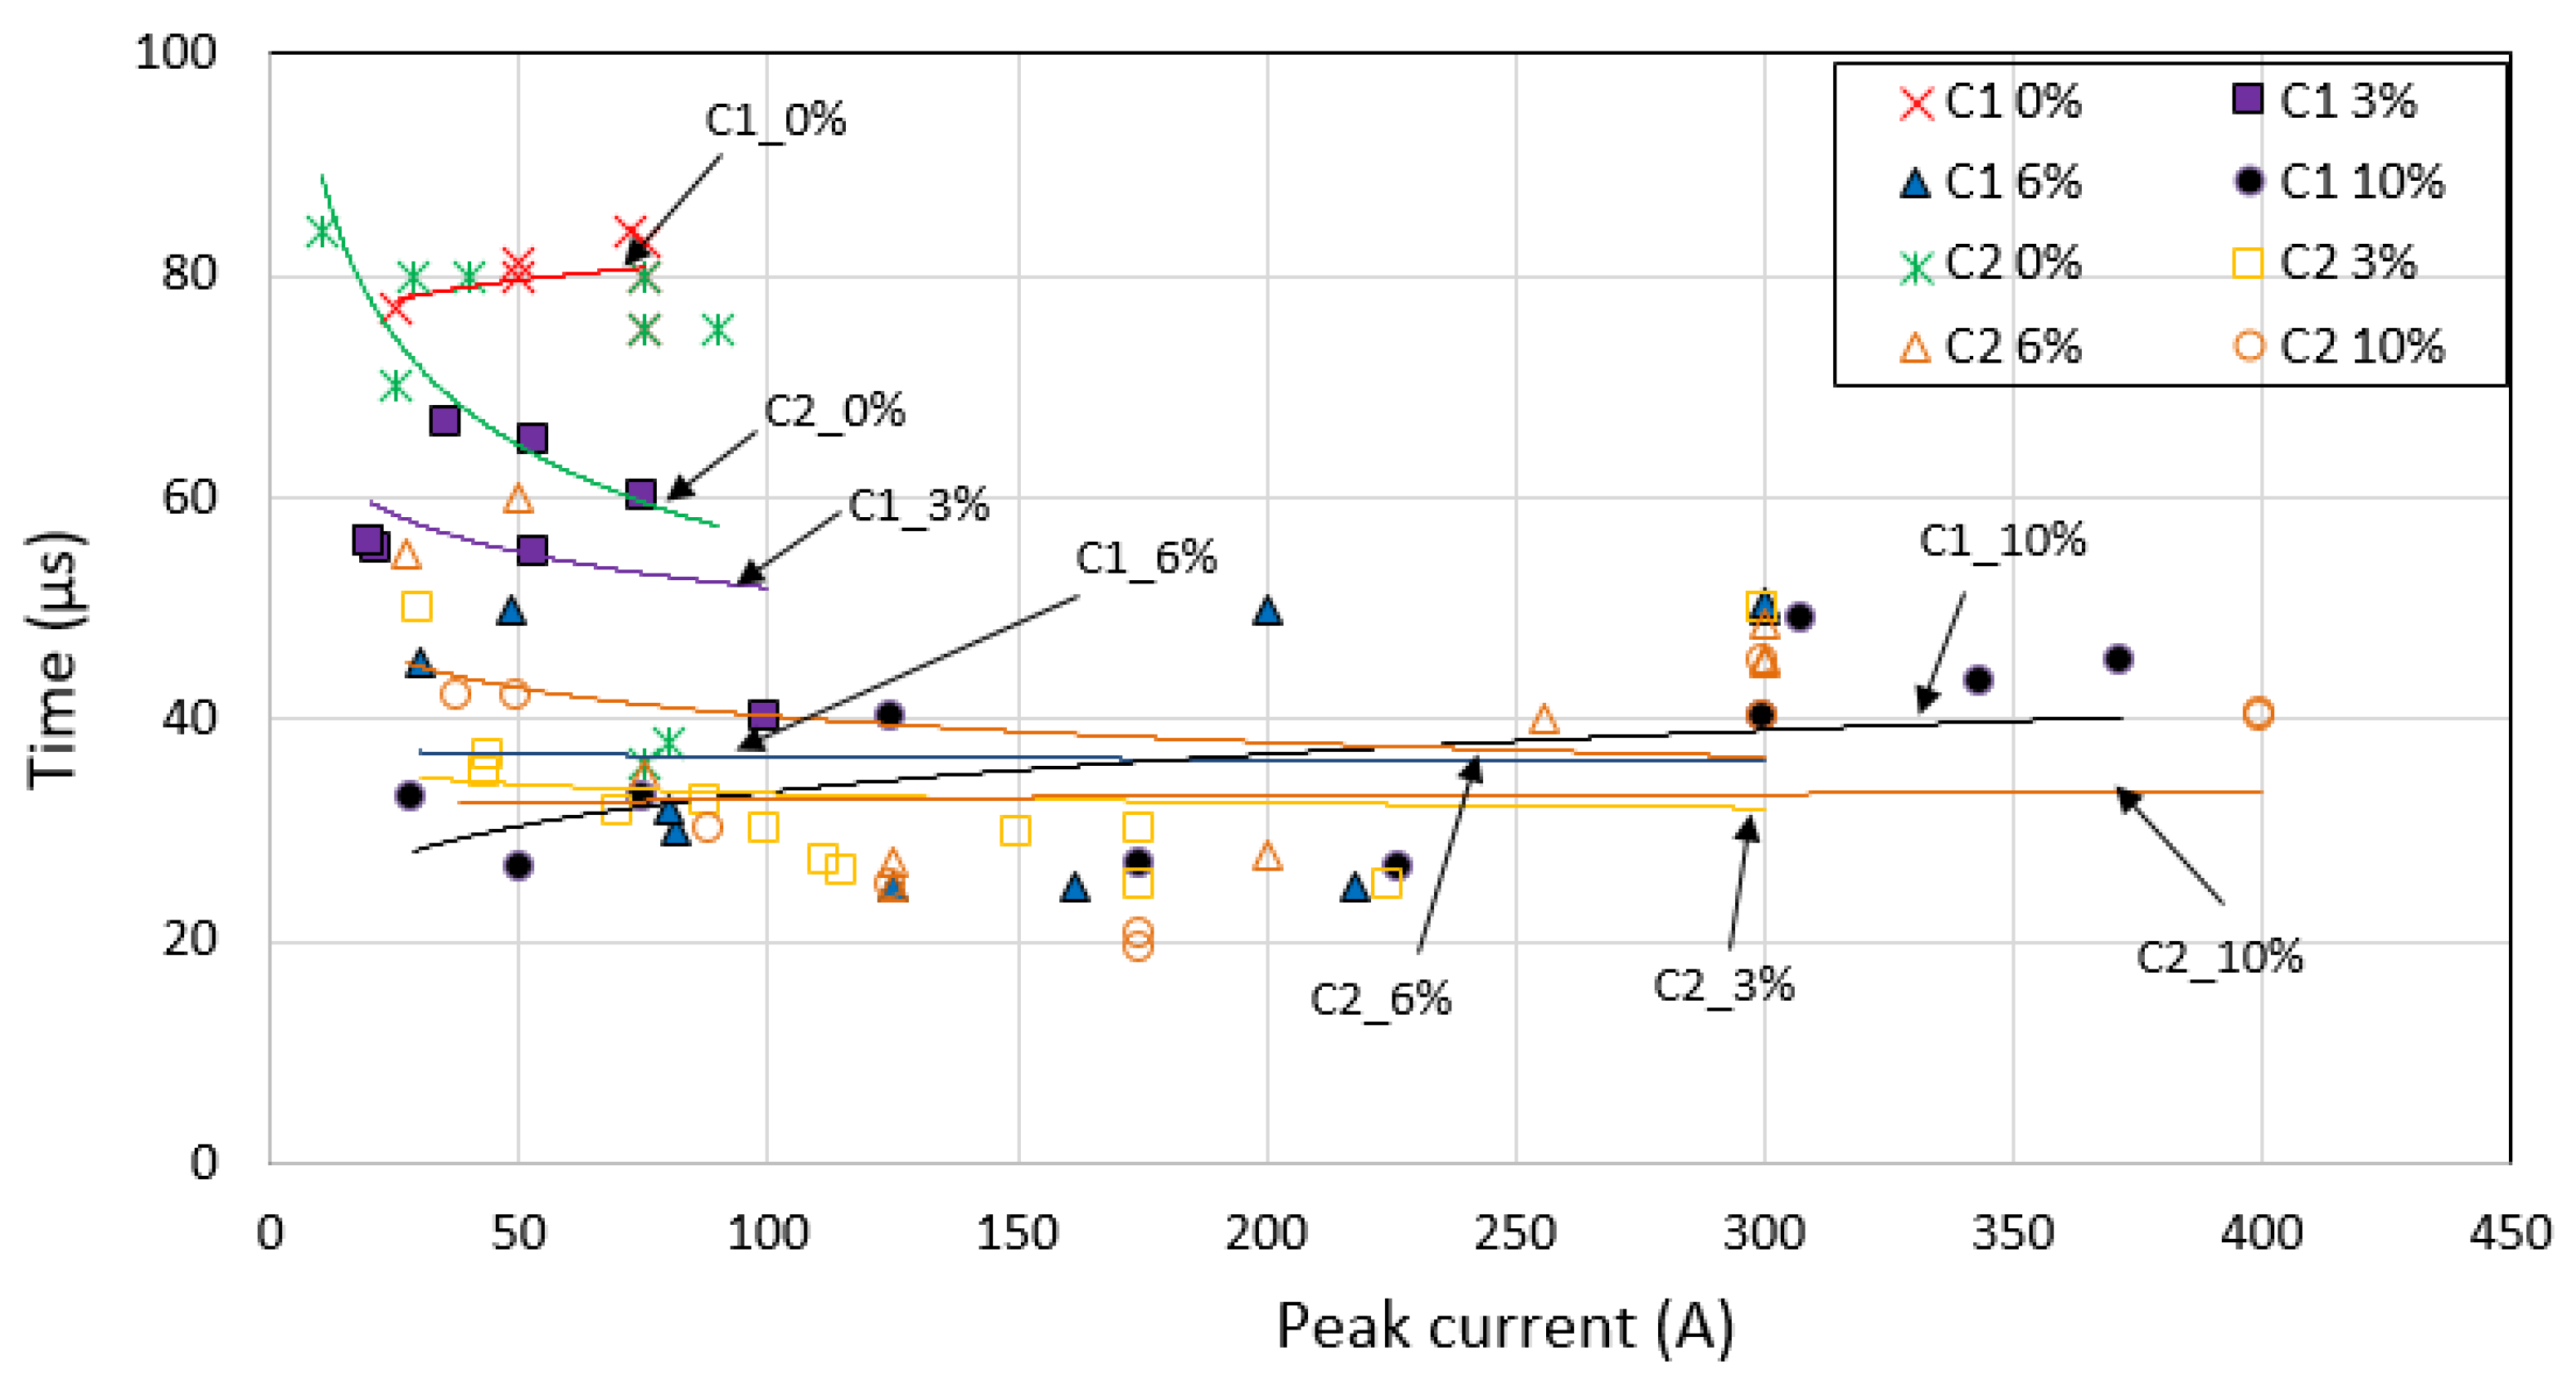
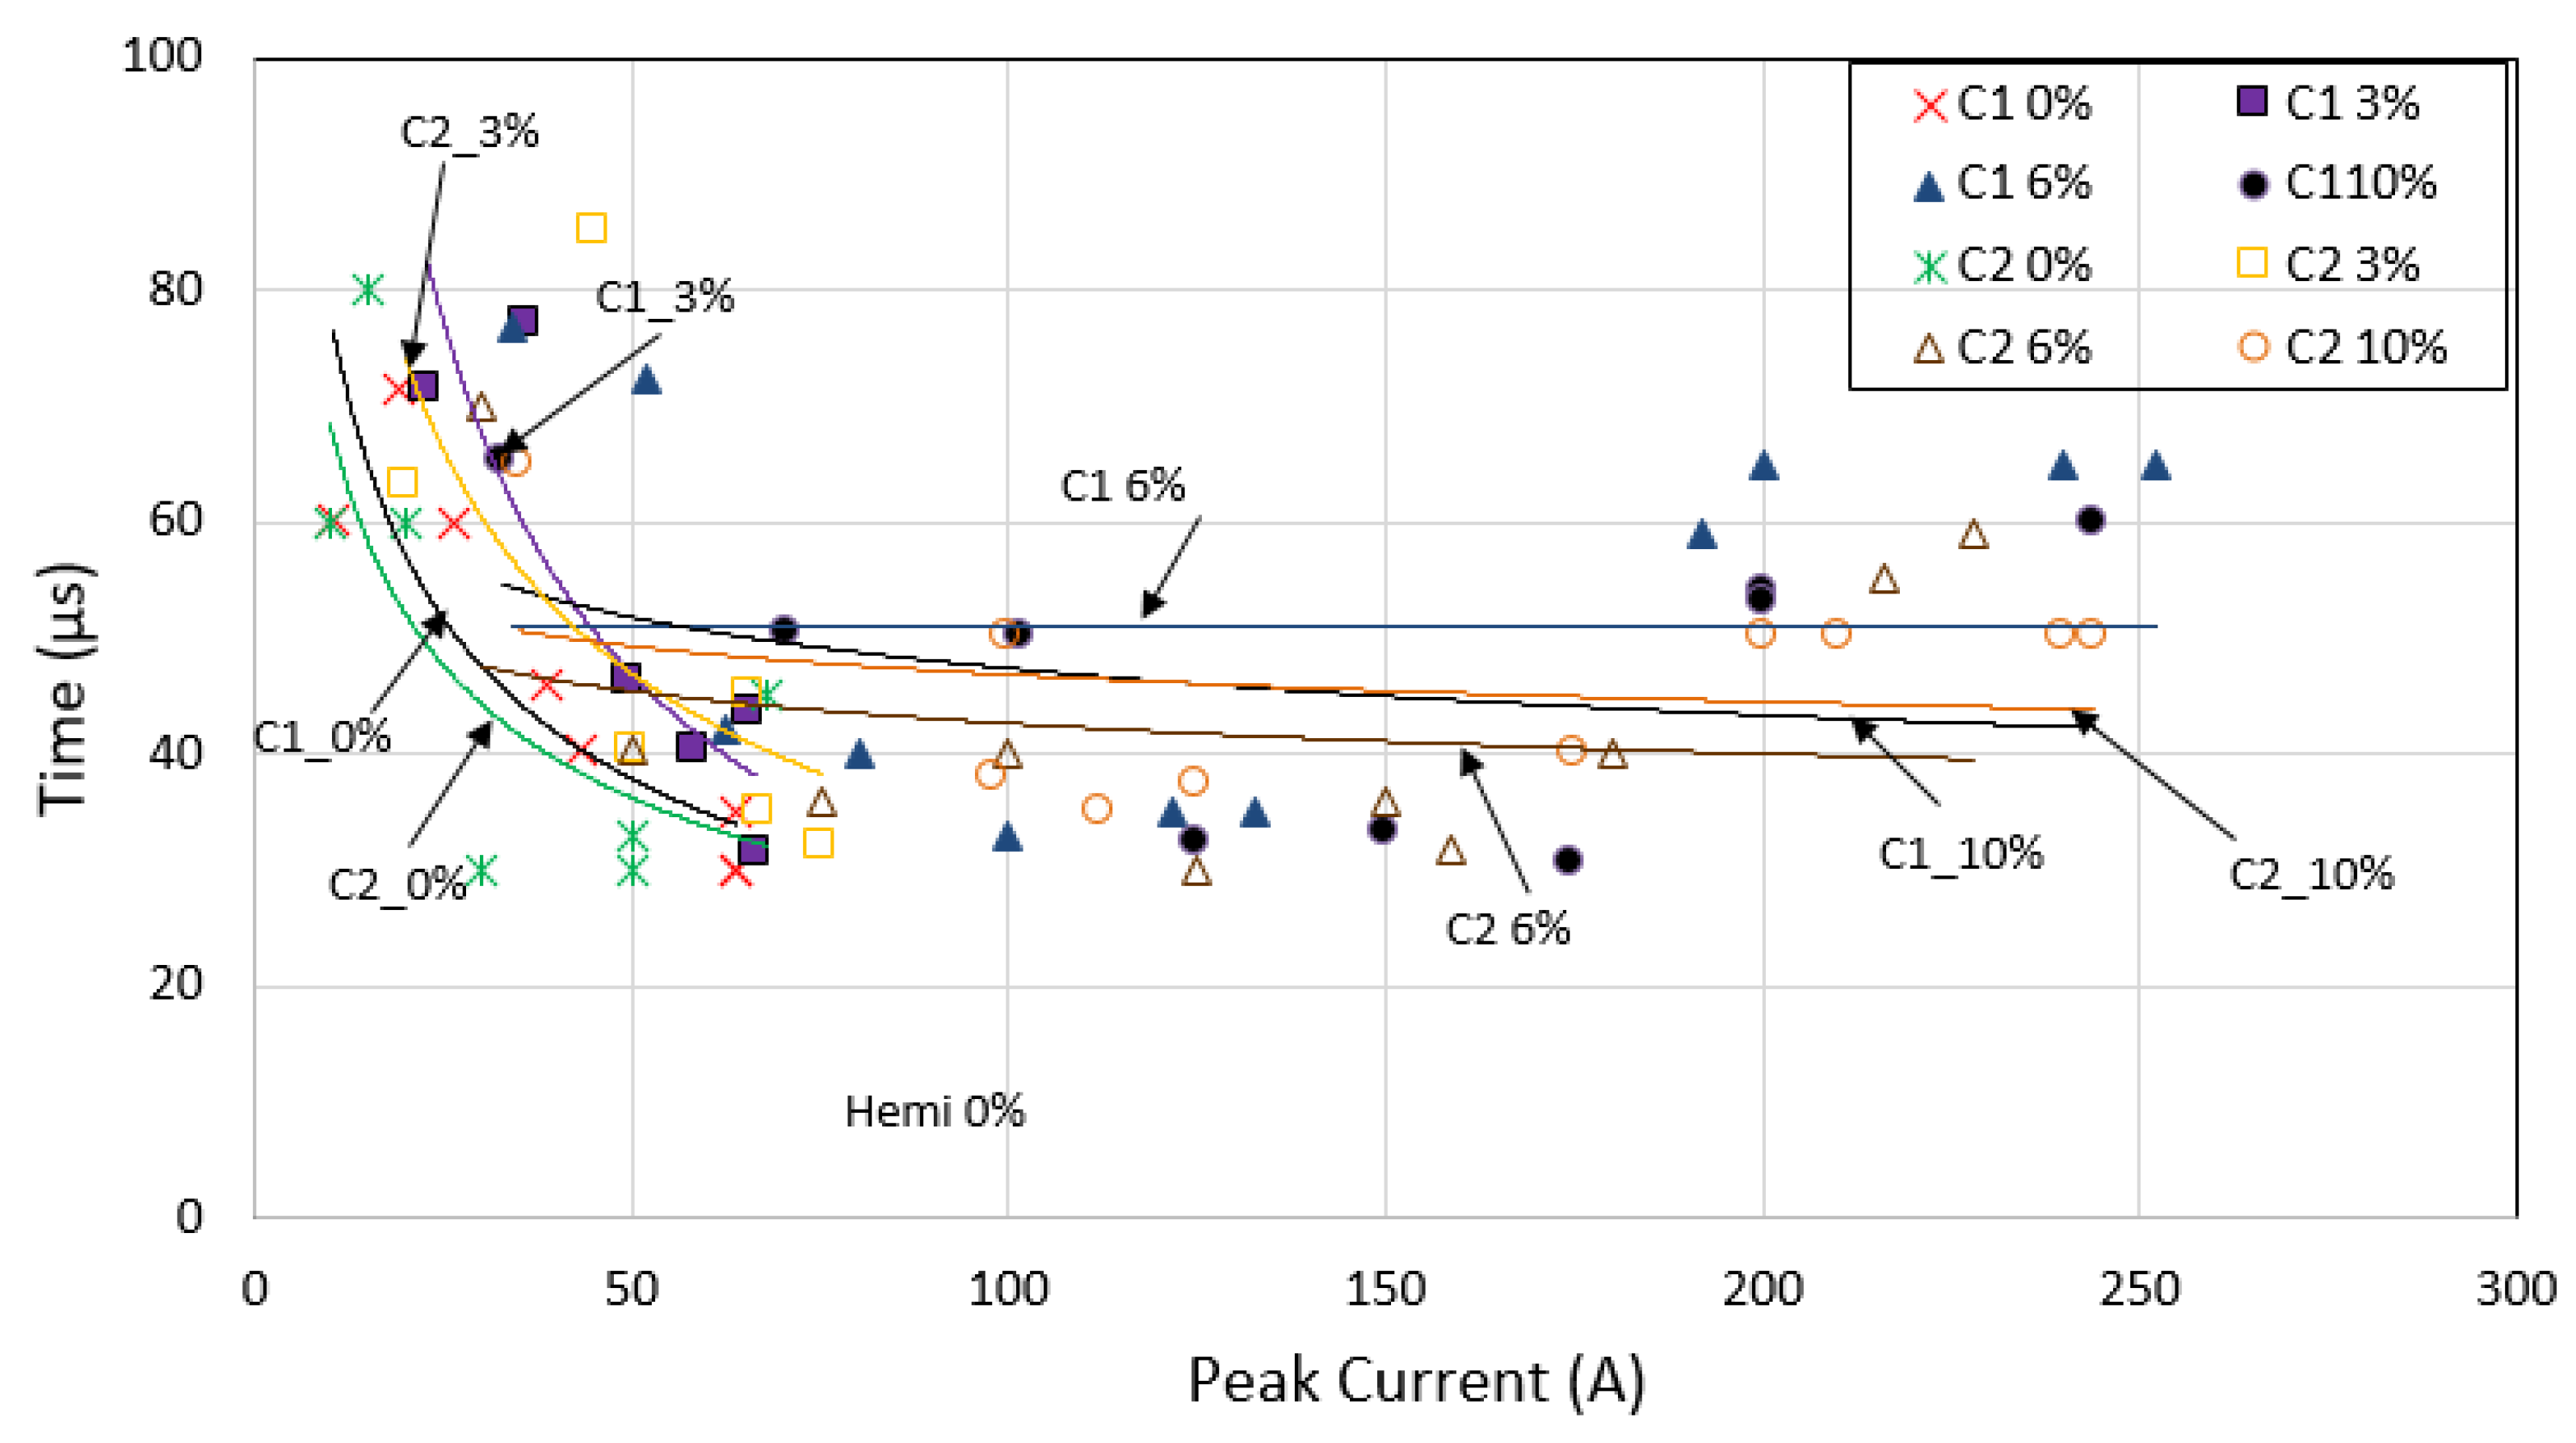
When impulse tests were performed on all the test samples, the peak current occurred at approximately the same time as the peak voltage. The current trace was, however, found to discharge at faster times than the voltage trace for all test samples, indicating the non-linear characteristics of the test samples. A clear relation of the current discharged time with the increasing current was seen for test sample A of the largest soil grain size, mixed with various percentages of water contents, and where the higher the RDC, the slower the current discharged times are. Impulse impedance values were also measured and observed, showing that impulse impedance values decrease with increasing current magnitudes in test samples of high RDC. For test samples with low RDC, impulse impedance values are found to be independent of current magnitudes.
The study indicates that the soil with a large grain size provides better resistance reduction, and a clearer relation in terms of current discharged times, where the impulse impedance decreases with an increasing current more significantly. The presence of large air voids in soil offers a bridging of arc, which can lead to better conduction in soil. Despite the large soil grain size in soil giving less conduction at low current magnitudes, given consideration in this study, it shows that large grain size in soil tends to be more effective when impulse characteristics are taken into account.
It was also found that for the uniform soil configuration, where both inner and outer electrodes are hemispherical (configuration 1) low average breakdown voltage levels are seen in test medium A, which could be associated with large grain size in soil, allowing more discharges in air voids to take place. A clear relation on the effect of the percentage of water content on the soil, where the average breakdown voltage levels increase with a large addition of water content is also seen in test medium A, having the largest grain size. On the other hand, inconsistencies in the results are seen in other test media, with smaller grain sizes. When strip electrode was used (configuration 2) lower breakdown voltage levels were seen. Lower average breakdown voltage levels for configuration 2 is rather expected due to the non-uniformity of the test cell, hence weakening the electric field strength of the soil and its air voids. Lower average breakdown voltage levels for the C2 than the C1 are more obvious and consistent in test medium A, again due to its large grain size of soil. This shows that for the study of impulse breakdown in soil, a large grain size in soil should be considered to provide more consistent results, which is also demonstrated in other published work before.
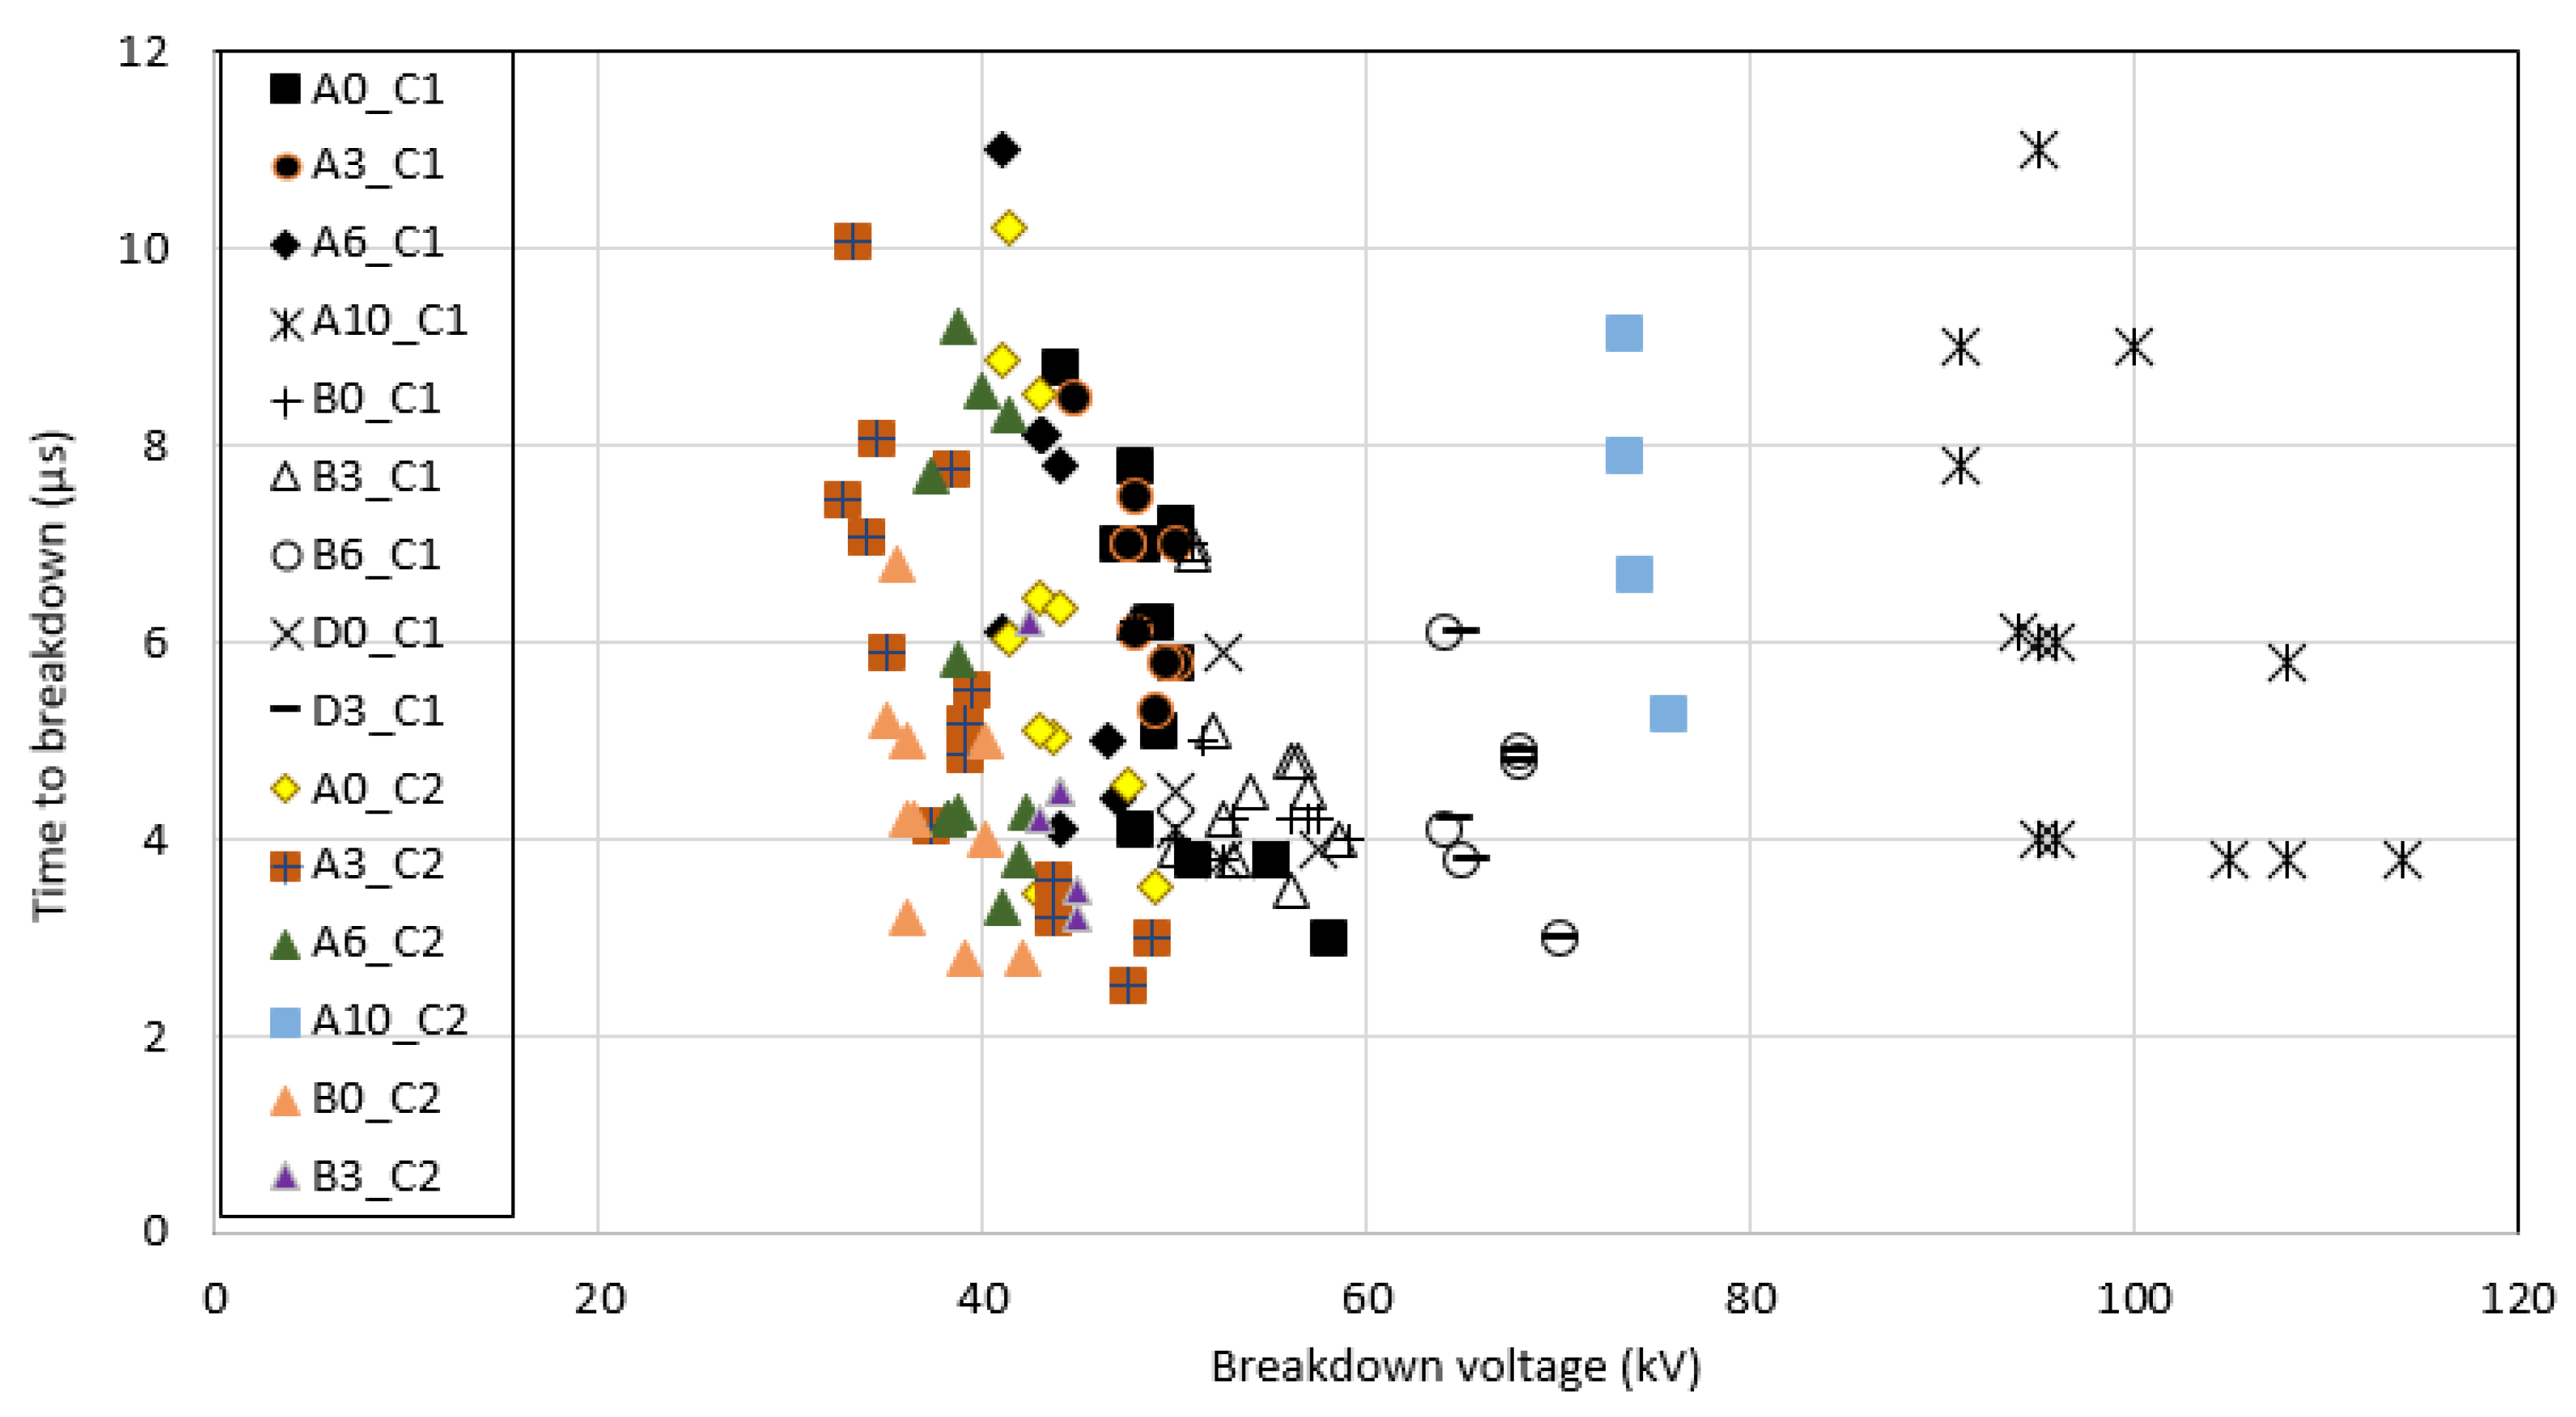
When the time delays versus the average breakdown voltage are plotted, it was noted that the times to breakdown decrease slowly with breakdown voltage levels in all test media. The times to breakdown are found to be close for all test media, ranging from 3 μs to 11 μs, with an exception of test medium A with 6% and 10% of water content, where the times to breakdown are found to be slightly higher. However, no significant difference was seen for other test media, which again indicates that soil with large air voids is more suitable to be used in the study of discharges and breakdown in soil since it is generally known that air voids play a role in the discharges and breakdown in soil. This can be an important decision for consideration in the study of soil discharges and breakdown since there are many other parameters in the soil that can affect the results. With the consideration of having a large size of soil, the study of other parameters can be considerably more consistent and accurate.
From the above discussions, it can be concluded that breakdown is more plausible to occur at a lower voltage for:
  • soil with a large grain size;
  • soil with a small percentage of water content;
  • non-uniform electric field ground electrodes with sharp edges and points.
It can be said that despite all of these points being opposite to the standard design of grounding systems, where a soil of low resistivity values is more preferred, the paper clearly shows that the impulse breakdown characteristics are different, where the discharges in soil, that can lower down impulse impedance value and cause faster discharged time, are more effective in soil with large soil grain size, which can be made of gravel or high soil resistivity.
It is suggested that due to more discharge processes in soil with large air voids, soil with large soil grain size can be considered for the design of grounding systems since it can lower the impulse impedance values and provide a better discharge of current when grounding systems are subjected to high impulse conditions. This, of course, compromises the performance of grounding systems at low voltage and low-frequency currents.

Author Contributions

Conceptualization, M.S.R., M.P.Y. and N.M.N.; methodology, M.S.R., M.P.Y. and N.M.N.; validation, M.S.R. and N.M.N.; formal analysis, M.S.R., M.P.Y., N.A.A.R. and N.M.N.; investigation, M.S.R., M.P.Y., N.A.A.R. and N.M.N.; resources, M.S.R., M.P.Y., N.H., N.A.A.R., N.A. and N.M.N.; data curation, M.S.R. and N.M.N.; writing—original draft preparation, M.S.R.; writing—review and editing, N.M.N.; visualization, M.S.R., M.P.Y. and N.M.N.; supervision, M.P.Y. and N.M.N.; project administration, M.S.R., M.P.Y., N.A, N.A.A.R. and N.H.; funding acquisition, M.S.R., M.P.Y., N.A., N.A.A.R. and N.H. All authors have read and agreed to the published version of the manuscript.

Funding

This research was funded by Tenaga Nasional Berhad, grant number TNBR/SF 192.2015, Telekom Malaysia Resesarch and Development (TMR&D), grant number MMUE210072 and Ministry Of Higher Education (MOHE) under Fundamental Research Grant Scheme (FRGS) with the grant number FRGS/1/2021/TK0/MMU/02/8.

Institutional Review Board Statement

Not applicable.

Informed Consent Statement

Not applicable.

Data Availability Statement

Not available.

Conflicts of Interest

The authors declare no conflict of interest.

References

  1. Cabrera, V.M.; Lundquist, M.S.; Cooray, V. On the Physical Properties of Discharges in Sand under Lightning Impulses. J. Electrost. 1993, 30, 17–28. [Google Scholar]
  2. Bok-Hee, L.; Geon-Hun, P.; Hoe-Gu, K.; Kyu-Sun, L. Analysis of Soil Ionization Behaviours under Impulse Currents. J. Electr. Eng. Technol. 2006, 4, 98–105. [Google Scholar]
  3. Flanagan, T.M.; Mallon, C.E.; Denson, R. Electrical Breakdown Characteristics of Soil. IEEE Trans. Nucl. Sci. 1982, 29, 1887–1890. [Google Scholar] [CrossRef]
  4. Reffin, M.S.; Nor, N.M.; Ahmad, N.N.; Abdullah, S. Performance of Practical Grounding Systems under High Impulse Conditions. Energies 2018, 11, 3187. [Google Scholar] [CrossRef] [Green Version]
  5. He, J.; Wu, J.; Zhang, B.; Yu, S. Field Testing for Observation of Seasonal Influence on Grounding Device at Impulse Condition. In Proceedings of the Asia-Pacific Symposium on Electromagnetic Compatibility, Singapore, 21–24 May 2012. [Google Scholar]
  6. Mc Neill, J.D. Electrical Conductivity of Soils and Rocks; Geonics Limited: Mississauga, ON, Canada, 1980. [Google Scholar]
  7. Victor, M.; Cabrera, M. Photographic Investigation of Electric Discharges in Sandy Media. J. Electrost. 1993, 30, 47–56. [Google Scholar] [CrossRef]
  8. Ali, A.; Nor, N.M. On the Characterisations of the Impulse Breakdown in High Resistivity Soils by Field Testing. Energies 2021, 14, 2401. [Google Scholar]
  9. Clark, D.; Mousa, S.; Harid, N.; Griffiths, H.; Haddad, A. Lightning Current Performance of Conventional and Enhanced Rod Ground Electrodes. IEEE Trans. Electromagn. Compat. 2021, 63, 1179–1188. [Google Scholar] [CrossRef]
  10. He, J.; Zhang, B.; Zeng, R.; Zhang, B. Experimental Studies of Impulse Breakdown Delay Characteristics of Soil. IEEE Trans. Power Deliv. 2011, 26, 1600–1607. [Google Scholar] [CrossRef]
  11. Kosztaluk, R.; Loboda, M.; Mukhedkar, D. Experimental Study of Transient Ground Impedances. IEEE Trans. Power Appar. Syst. 1981, PAS 100, 4653–4660. [Google Scholar] [CrossRef]
  12. Sekioka, S.; Hara, T.; Ametani, A. Development of a Nonlinear Model of a Concrete Pole Grounding Resistance. In Proceedings of the International Conference on Power Systems Transients, Lisbon, Portugal, 3–7 September 1995. [Google Scholar]
  13. Sekioka, S. Frequency and Current-Dependent Grounding Resistance Model for Lightning Surge Analysis. IEEE Trans. Electromagn. Compat. 2018, 61, 419–425. [Google Scholar] [CrossRef]
  14. Zhang, B.; Zhizhong, L.; Wang, S. Onset Electric Field of Soil Ionization around Grounding Electrode under Lightning. IET High Volt. 2020, 5, 614–619. [Google Scholar] [CrossRef]
  15. In IEC-60-1; Guide on High-Voltage Testing Techniques. IEEE: Piscataway, NJ, USA, 2010.
  16. In IEEE Std. 80-2013; IEEE Guide for Safety in AC Substation Grounding. IEEE: Piscataway, NJ, USA, 2013.
  17. Haddad, A.; Naylor, P.; German, D.M.; Waters, R.T. A Fast Transient Test Module for ZnO Surge Arresters. IET Meas. Sci. Technol. 1995, 6, 560–570. [Google Scholar] [CrossRef]
Figure 1. The processes involved at sites in extracting the soil (a) The soil is cut to the size of the box; (b) The soil that was cut earlier fitted into the box; (c) The soil from the box is placed on top of test cell; (d) The soil is levelled off in the test cell.
Energies 15 01471 g001
Figure 2. Schematic drawing of a hemispherical container.
Energies 15 01471 g002
Figure 3. Impulse voltage generator used in the study.
Energies 15 01471 g003
Figure 4. Changes in resistance values with additional increasing percentage of water content.
Energies 15 01471 g004
Figure 5. Traces of voltage and current for test sample A in test cell C1.
Energies 15 01471 g005
Figure 6. Current discharged times for test sample A with various percentages of water content in test cells C1 and C2.
Energies 15 01471 g006
Figure 7. Current discharged times for test sample B with various percentages of water content in test cells C1 and C2.
Energies 15 01471 g007
Figure 8. Current discharged times for test sample C with various percentages of water content in test cells C1 and C2.
Energies 15 01471 g008
Figure 9. Current discharged times for test sample D with various percentages of water content in test cells C1 and C2.
Energies 15 01471 g009
Figure 10. Current discharged times for test sample D with various percentages of water content in test cells C1 and C2.
Energies 15 01471 g010
Figure 11. Current discharged times for test sample D with various percentages of water content in test cells C1 and C2.
Energies 15 01471 g011
Figure 12. Current discharged times for test sample D with various percentages of water content in test cells C1 and C2.
Energies 15 01471 g012
Figure 13. Current discharged times for test sample D with various percentages of water content in test cells C1 and C2.
Energies 15 01471 g013
Figure 14. Typical breakdown voltage and current traces for gravel test medium for spherical active electrode C1.
Energies 15 01471 g014
Figure 15. Time to breakdown versus breakdown voltage for test media A, B and D mixed with various percentages of water content for the spherical active electrode (C1).
Energies 15 01471 g015
Figure 16. Time to breakdown versus breakdown voltage for test media A, B and D mixed with various percentages of water content for both configurations 1 and 2 (C1 and C2).
Energies 15 01471 g016
Table 1. Soil composition of soil extracted from four sites.
Soil PropertiesTest Sample ATest Sample BTest Sample CTest Sample D
Grain size60 mm–2 mm2 mm–0.06 mm0.06 mm–0.002 mmOrganic soil
Moisture Content (%)26252927
Clay (%)3494546
Silt (%)18431713
Sand (%)31443841
Gravel (%)174--
Density (g/cm3)1.751.771.771.70
Table 2. Resistance values of various test samples.
Test Sample/Soil TypeWater Content Added in (%)Resistance Values, RDC (Ω) for Test Cell 1Resistance Values, RDC (Ω) for Test Cell 1
Test Sample A0086009600
Test Sample A3332003600
Test Sample A6618462036
Test Sample A10109701100
Test Sample B00287390
Test Sample B33169167
Test Sample B66131153
Test Sample B1010122148
Test Sample C0049208860
Test Sample C3327402200
Test Sample C6614831786
Test Sample C101011781045
Test Sample D008001300
Test Sample D33522514
Test Sample D66345407
Test Sample D1010299375
Table 3. Breakdown voltage (U50) for various test mediums mixed with different percentages of water content.
Percentage of Water Content Added (%)Test Medium ATest Medium BTest Medium CTest Medium D
Test CellC1C2C1C2C1C2C1C2
0%48.041.652.648.0NB37.252.3NB
3%42.435.944.643.0NBNB65.7NB
6%47.836.066.5NBNBNBNBNB
10%103.571.1NBNBNBNBNBNB
20%NBNBNBNBNBNBNBNB
Publisher’s Note: MDPI stays neutral with regard to jurisdictional claims in published maps and institutional affiliations.

