1. Introduction
Energy is one of the critical inputs to modern poultry farming, and its overall use in poultry production and processing is constantly growing [
1]. Livestock and poultry buildings require a large amount of heating fuel to provide supplemental heat for young animals and chickens [
2]. Fossil fuel consumption negatively impacts growers’ operating expenses and bottom lines, in addition to generating greenhouse gases and air pollutants.
Transpired solar collector (TSC) is a solar thermal technology that uses solar radiation to pre-heat ventilation air for buildings [
3,
4]. The conventional transpired solar collectors were constructed by fixing a solar-absorbing, perforated metallic sheet to the envelope of a building to create an air plenum. Exterior air is drawn through small holes on a dark-colored, thermally conductive surface heated by the sun’s radiation into the plenum and ducted inside a building space. Hall et al. [
4] compiled findings on the economic payback between 2 and 10 years reported in the literature of TSC installation in industrial buildings. Reasons for the varied economic performance included the length of the heating seasons, TSC heat distribution, TSC operating suction-face velocity, wind velocity, etc. [
4]. Cordeau and Barrington [
5,
6] tested the performance of a conventional transpired solar wall (TSW) installed on the walls of broiler barns. The energy recovery efficiency of the TSW was reported to range from 25% to 65% depending on wind velocity. An annual return on investment of 4.7% was estimated. Shah et al. [
7] tested the performance of a TSW at a swine nursery in eastern North Carolina. Over the span of 225 h that data were recorded, the TSW produced a temperature rise of 7.6 K on average, with a maximum temperature rise of 18.3 K. Propane usage was reduced by 8.5%. Based on these studies [
6,
7], it was concluded that transpired solar collectors are technically feasible but not economically feasible options to provide supplementary heat to livestock houses, because of the long payback period.
The cost effectiveness of such collectors with reasonable performance is important to allow the adoption of solar thermal technologies [
8]. Poole et al. [
9] compared the performance of a metal transpired solar collector, a perforated plastic TSC, and a landscape fabric solar collector of a bench scale. Their results showed a slightly higher level of efficiency in fabric TSC than metal TSC. A field test at a swine nursery reported a peak daily daytime average of 12 °C. Poole et al. [
10] reported an increase of 8.1 K of pre-heated air over 178 h of operation and higher ventilation rates due to the installation of a plastic transpired solar collector in a turkey barn. No difference in heating fuel use was reported between the test barn and control barn.
The objective of this study was to evaluate whether a fabric solar collector can be integrated into commercial broiler buildings to pre-heat ventilation air, reduce fuel consumption, and potentially improve air quality.
2. Materials and Methods
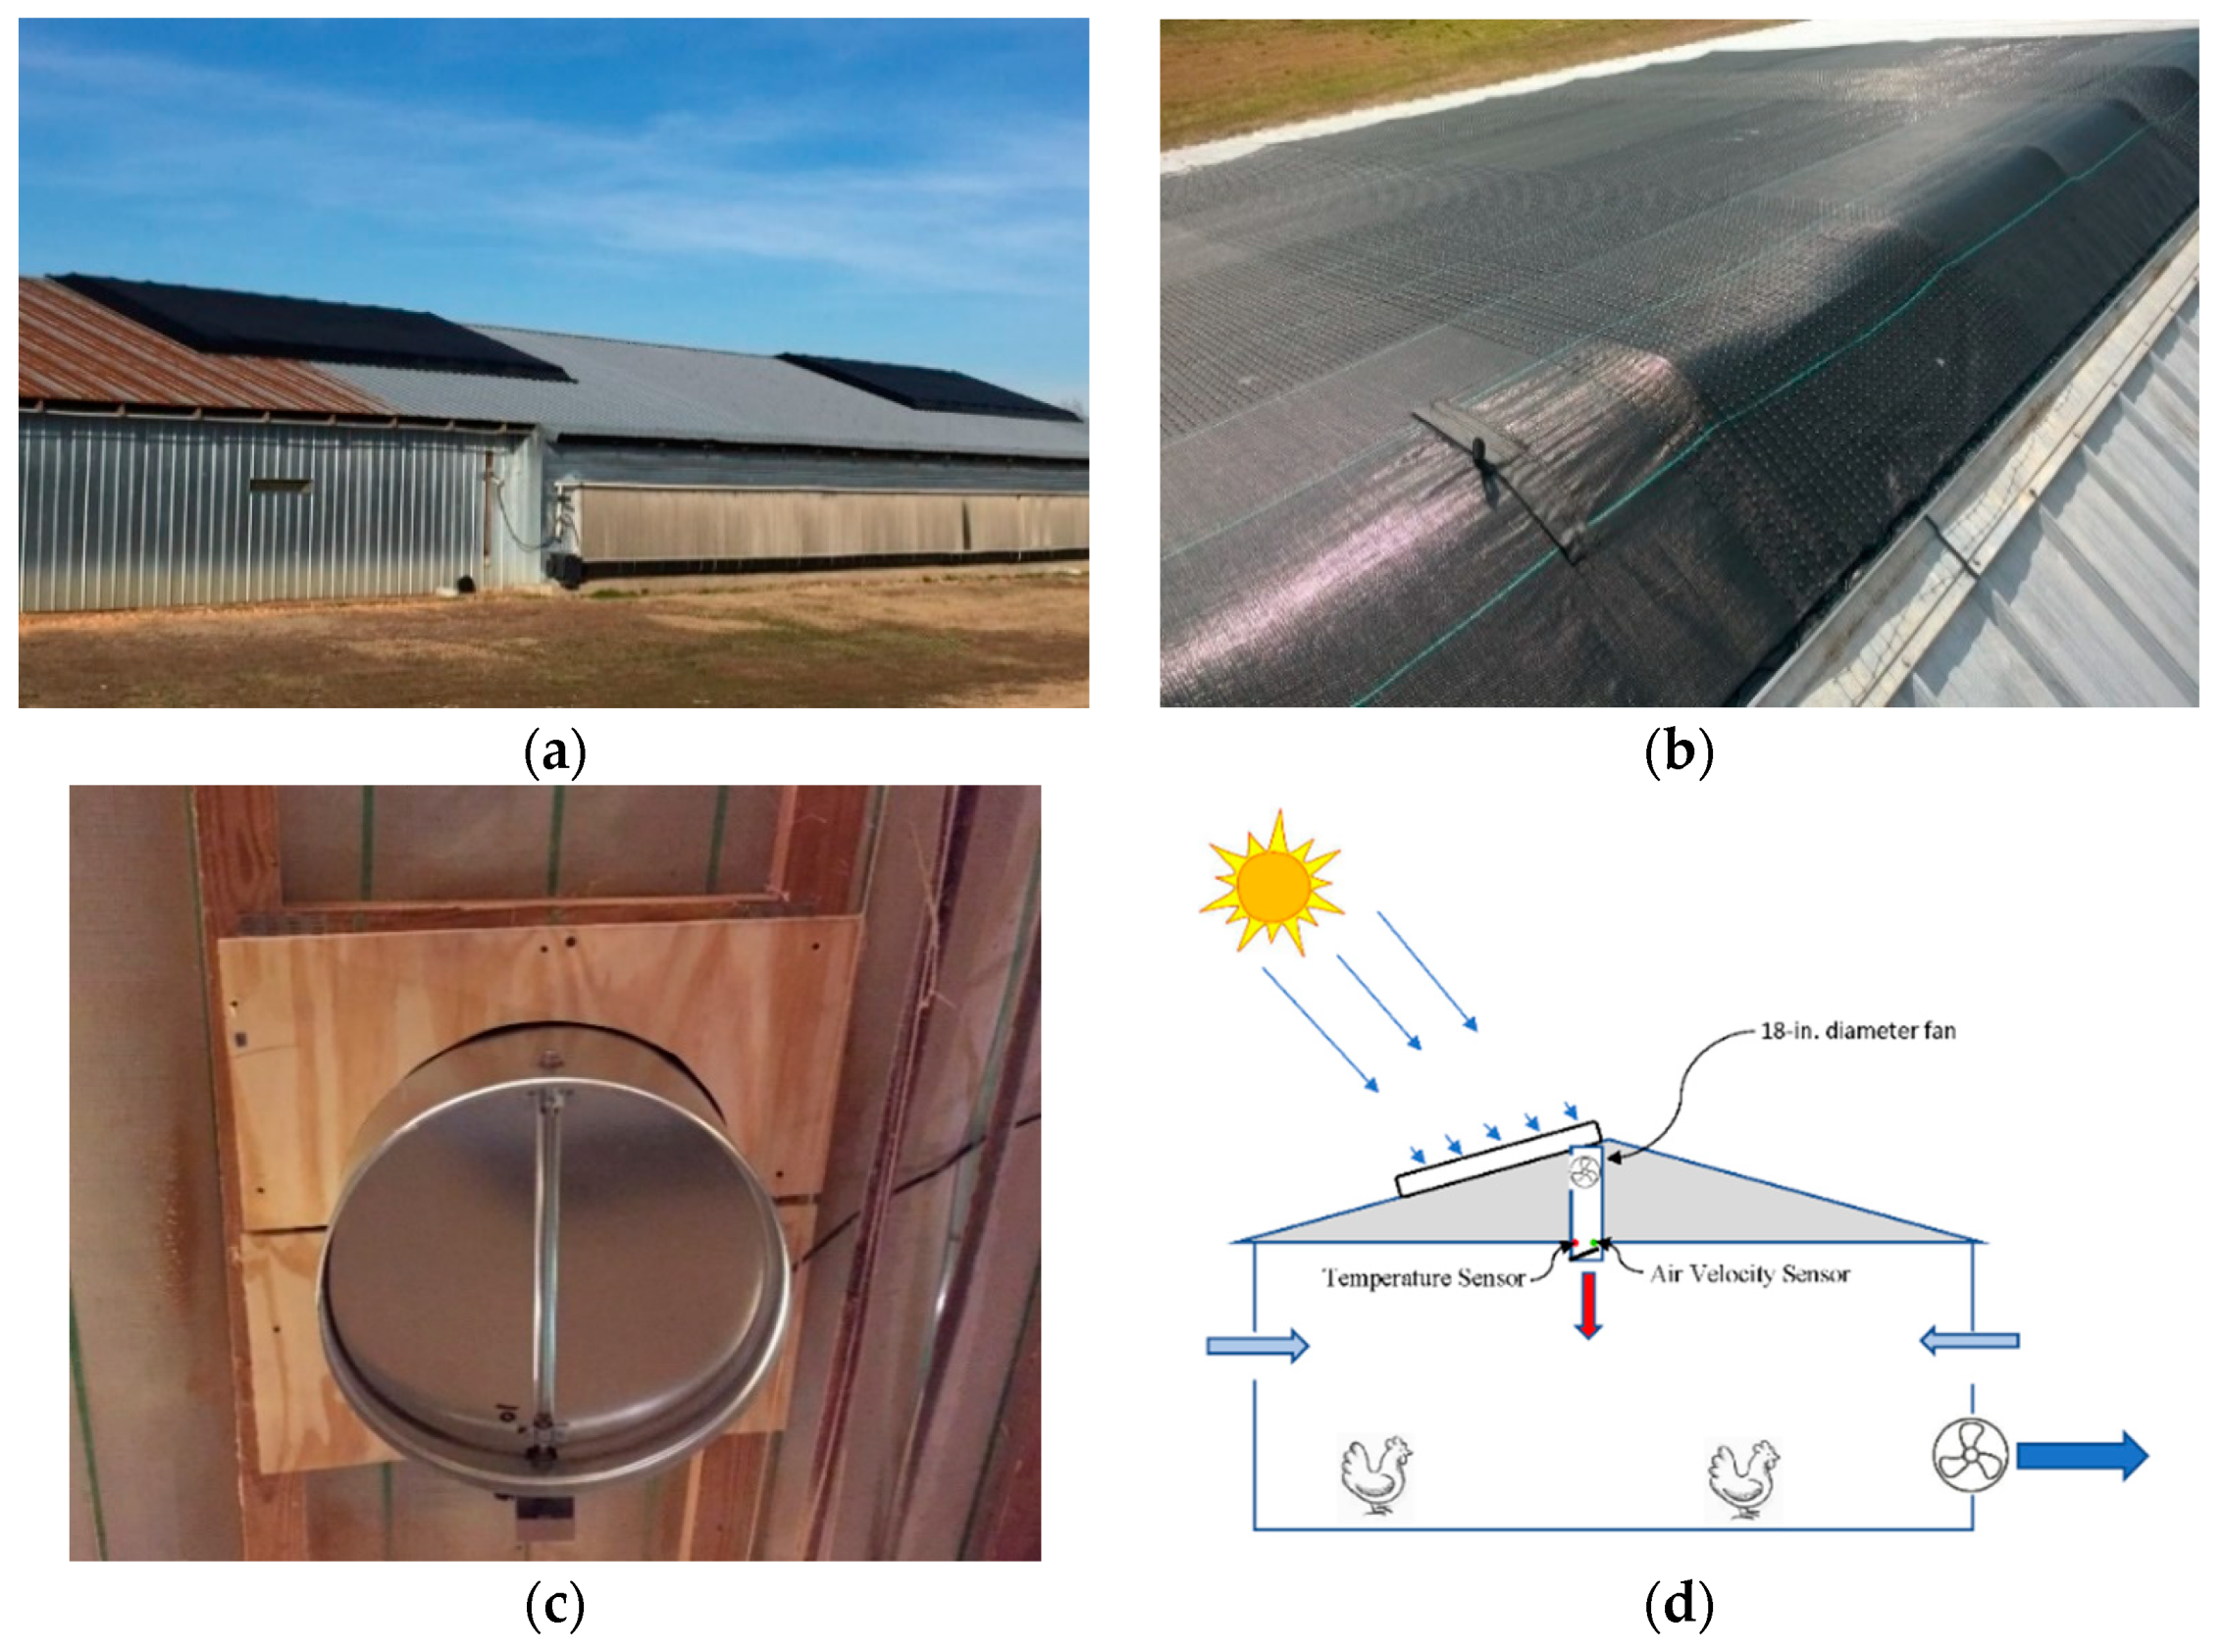
Six, black, metal-fiber-enforced and nylon-based solar collectors (Southwestern Sales Co., Springdale, AR, USA) were installed on south-facing rooftops of a commercial-scale broiler house (test house, dimension of 12 × 122 m), with a roof pitch of 3/12 (
Figure 1a). The farm uses whole-house brooding, with 4 exhaust fans of 0.9 m diameter used for minimum ventilation. Each collector has approximately 36 m
2 surface area. The collectors were raised 22 cm above the galvanized metal roof (
Figure 1b). Under each collector and close to the ridge of the house, a 50 cm diameter opening was made on the sheet metal roof to duct the air underneath the collector to the interior of the house (
Figure 1c,d). A stir fan (FAN18-STD, Southwestern Sales Co., Springdale, AR, USA) was mounted inside the duct and wired to the collector’s controller to push air down when activated. Solar heating was allowed by opening a flat-disk, round damper on the bottom of the duct, allowing fresh air in the plenum into the house. An adjacent house with no collector served as control.
2.1. Solar Collector Operation
Chicks were placed on 20 October 2020 and 22 January 2021, respectively. Both the test and control houses were programmed with a similar min-vent schedule for intermittent ventilation, with four exhaust fans as min-vent fans. The control house used 50 sidewall vents as inlets, while the test house used the 50 vents plus the six duct inlets connecting the solar collectors. The fans inside the ductworks were only allowed to operate from 8 a.m. to 5 p.m.
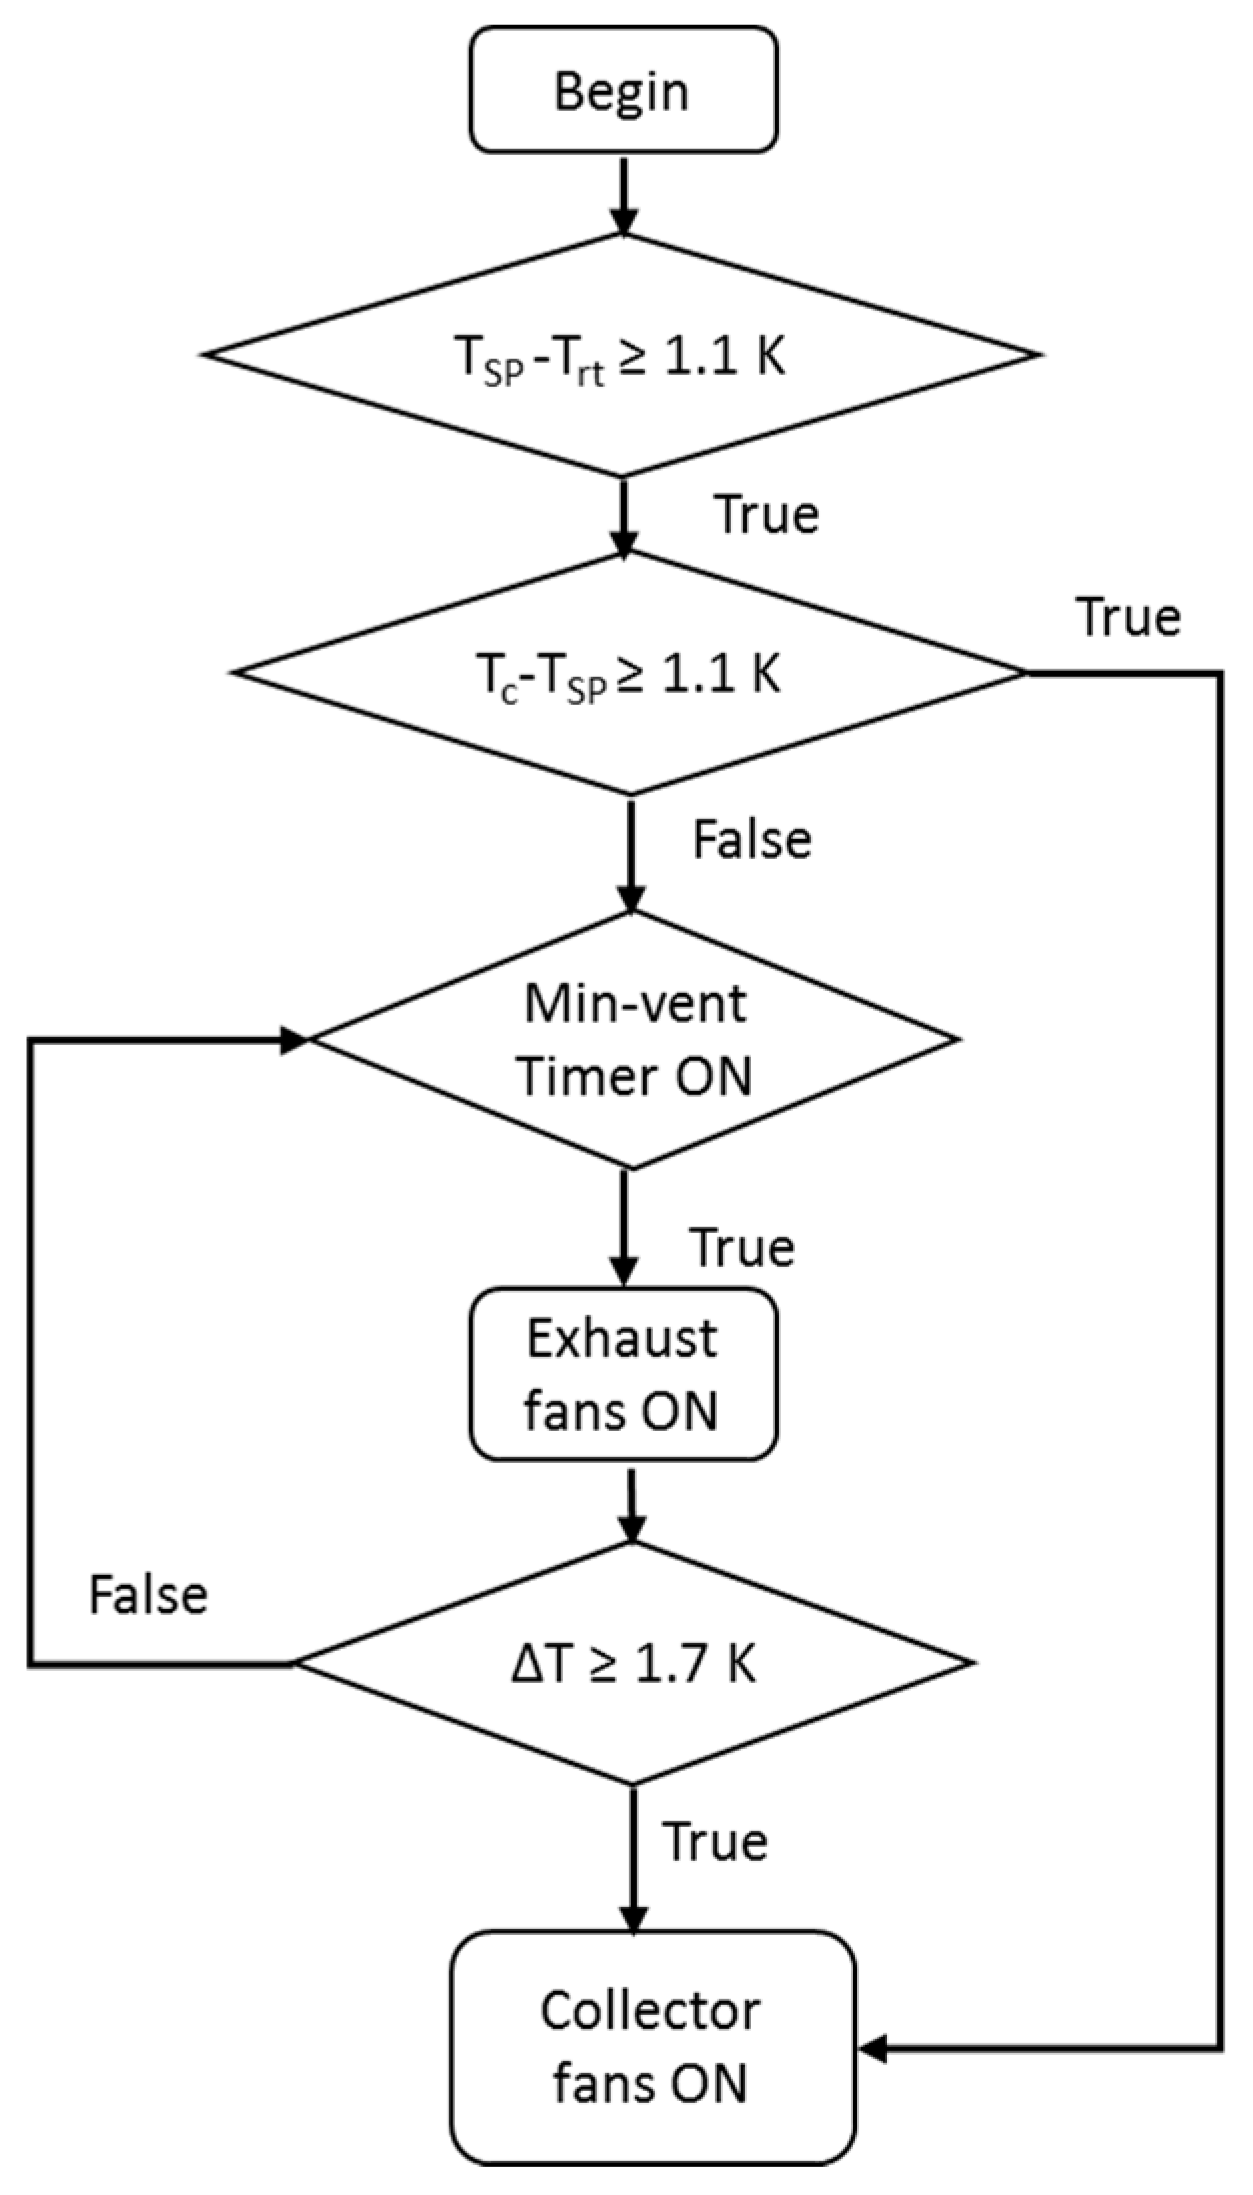
When the bird-level real-time temperature (T
rt) was close to or higher than the target setpoint temperature (house in transition to cooling), collectors were disallowed to operate. When the house was in need of heat, the solar collectors were in operation when one of two conditions was met (
Figure 2). First, when the temperature under the collectors (T
c) was higher than the house target temperature (T
sp), fresh warm air under the solar collectors was delivered into the house under constant heat mode. This allowed the solar collectors to be used as heaters, delivering additional warm air to the house independent of the min-vent timer, in comparison with the control house without solar collectors. The house was likely in neutral or slightly positive pressure during the heating mode as the air inside the house likely exits through cracks on the wall. Secondly, during the ON cycle of minimum ventilation (Intermittent mode), the fans inside the ducts were activated (simultaneously) in sync with the four exhaust fans. Fresh air enters the buildings through either the sidewall inlets or six collector duct openings.
2.2. Instrumentation
Temperature (Trt) and relative humidity at multiple locations at bird levels and ambient were measured using HOBO data loggers (HOBO U23 Pro, Onset Computer Corp., Bourne, MA, USA). Temperature above the damper inside the duct of the 1st and 3rd solar collectors was measured using T-type thermocouple and data loggers (HOBO UX100-014M, Onset Computer Corp., Bourne, MA, USA) at 1 min interval (
Figure 1d). Airflow inside the duct of the 1st and 3rd solar collectors was measured with air velocity sensors (T-DCI-F900, Degree control, Milford, NH, USA) and voltage data loggers (UX120-006M, Onset Computer Corp., Bourne, MA, USA) at 10 s intervals. When operating in intermittent mode during brooding, min-vent fan ON time started around 35 s. This allowed at least three consecutive non-zero voltage readings to mark the airflow timing every 5 min. The duty cycle of the min-vent fans was determined based on recordings of an AC magnetic field sensor attached to the motor of one of the min-vent fans (UX90-004, Onset Computer Corp., Bourne, MA, USA). The duty cycle of the collector fans was tallied based on the duration of motor logger recordings when the air velocity sensors recorded non-zero voltage readings.
Ambient temperature (Ta), relative humidity, wind speed, direction, and horizontal solar irradiance were measured every 30 min by an on-site weather station (U30, Onset Computer Corp., Bourne, MA, USA).
Carbon dioxide concentrations in the test and control houses were monitored every 10 min in front of one of the exhaust fans using an infrared sensor (Telaire 7001, Onset Computer Corp., Bourne, MA, USA). Each house was equipped with a temperature-compensated natural gas meter, and meters were read every day from the test house and an adjacent house (control).
2.3. Calculation of Delivered Energy
Flow rates delivered by the stir fans were difficult to measure directly in the mounted duct due to the short section of duct exposed under the tri-ply ceiling materials (
Figure 1c). Instead, the flow rates were determined by constructed ductworks in a laboratory to simulate typical static pressure conditions of a broiler house [
11]. Ductworks were constructed with a primary fan of 0.9 m diameter at the downstream, with a fan of 0.46 m diameter being in line with the duct, generating static pressure of 30 Pa to mimic the negative pressure difference under minimum ventilation. A discrete traverse using a Pitot tube at 24 points was conducted upstream of the fan inside the duct, with readings averaged for the airflow rates [
12]. Similar traversing was conducted under 0.0 Pa, mimicking the neutral pressure condition when the collectors operated at a constant heating mode. The corresponding airflow rates from each duct were 25 m
3/min and 17 m
3/min under negative pressure (min-vent mode) and neutral pressure conditions (constant mode), respectively. The resulting suction velocities (also called approach velocity) were 0.012 m/s and 0.0079 m/s (velocity = airflow_rate/surface area), respectively. It was assumed that all six collectors operated similarly.
Assuming a nominal airflow rate at 227 m3/min for an exhaust fan of 0.9 m diameter, when the test house was under the min-vent condition and assisted by the solar collectors, approximately 17% of fresh air was delivered by the six solar collectors, while 83% was delivered by the conventional inlet vents on the sidewalls.
Temperature rise (Kelvin, K) caused by the solar collecting system was calculated by
where T
c = Temperature (°C) measured by the thermocouple (10 s interval) corresponding to the time when the motor of the exhaust fan was powered;
Ta = Ambient temperature measured at the weather station.
The delivered energy (kJ/d) through the solar collectors was calculated as follows whenever the collectors were in operation:
where
Cp = Specific heat of air (J/kg-K);
m = Mass airflow rate through the solar collector (kg/min);
t = Length of operation per day (min/d).
3. Results
3.1. Collector Utilization
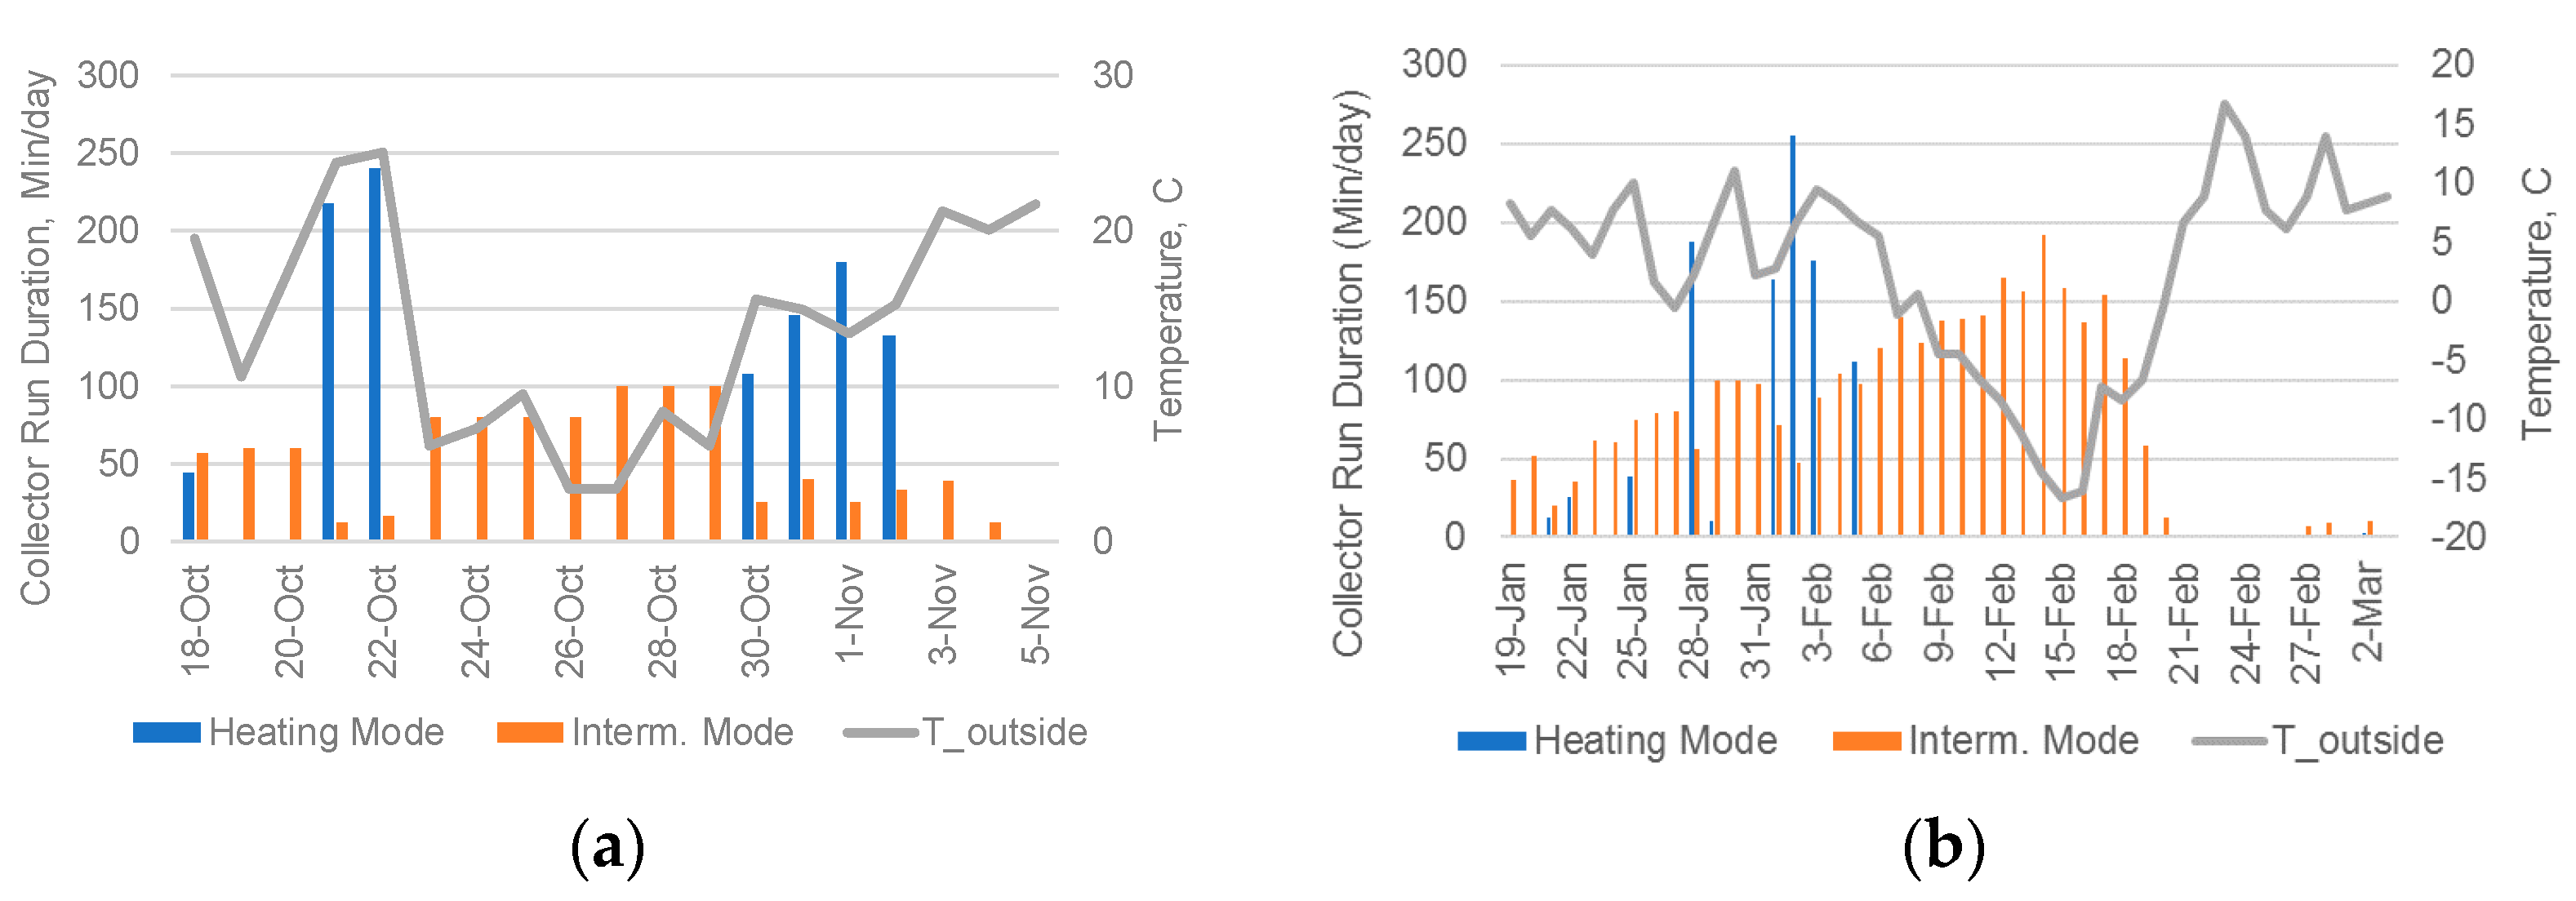
The solar collectors operated a cumulative duration between 60 min and 260 min each day during the first 18 days of the fall flock, followed by periods when heating was not needed due to warm ambient temperature and heat produced by older chickens (
Figure 3a). During the 18 days, solar collectors operated as heaters and provided additional warm air into the test house for seven days, when daily maximum solar irradiance was above 650 W/m
2.
The cumulative length of solar collectors in operation each day averaged 133 min (a range between 60 min and 303 min) (
Figure 3b) during the first 33 days of the winter flock. During this period, solar collectors operated as heaters for 7 days. February 2021 was an extremely cold winter month in this region with historically low temperatures (−15 °C) and snowstorms from 13–16 February.
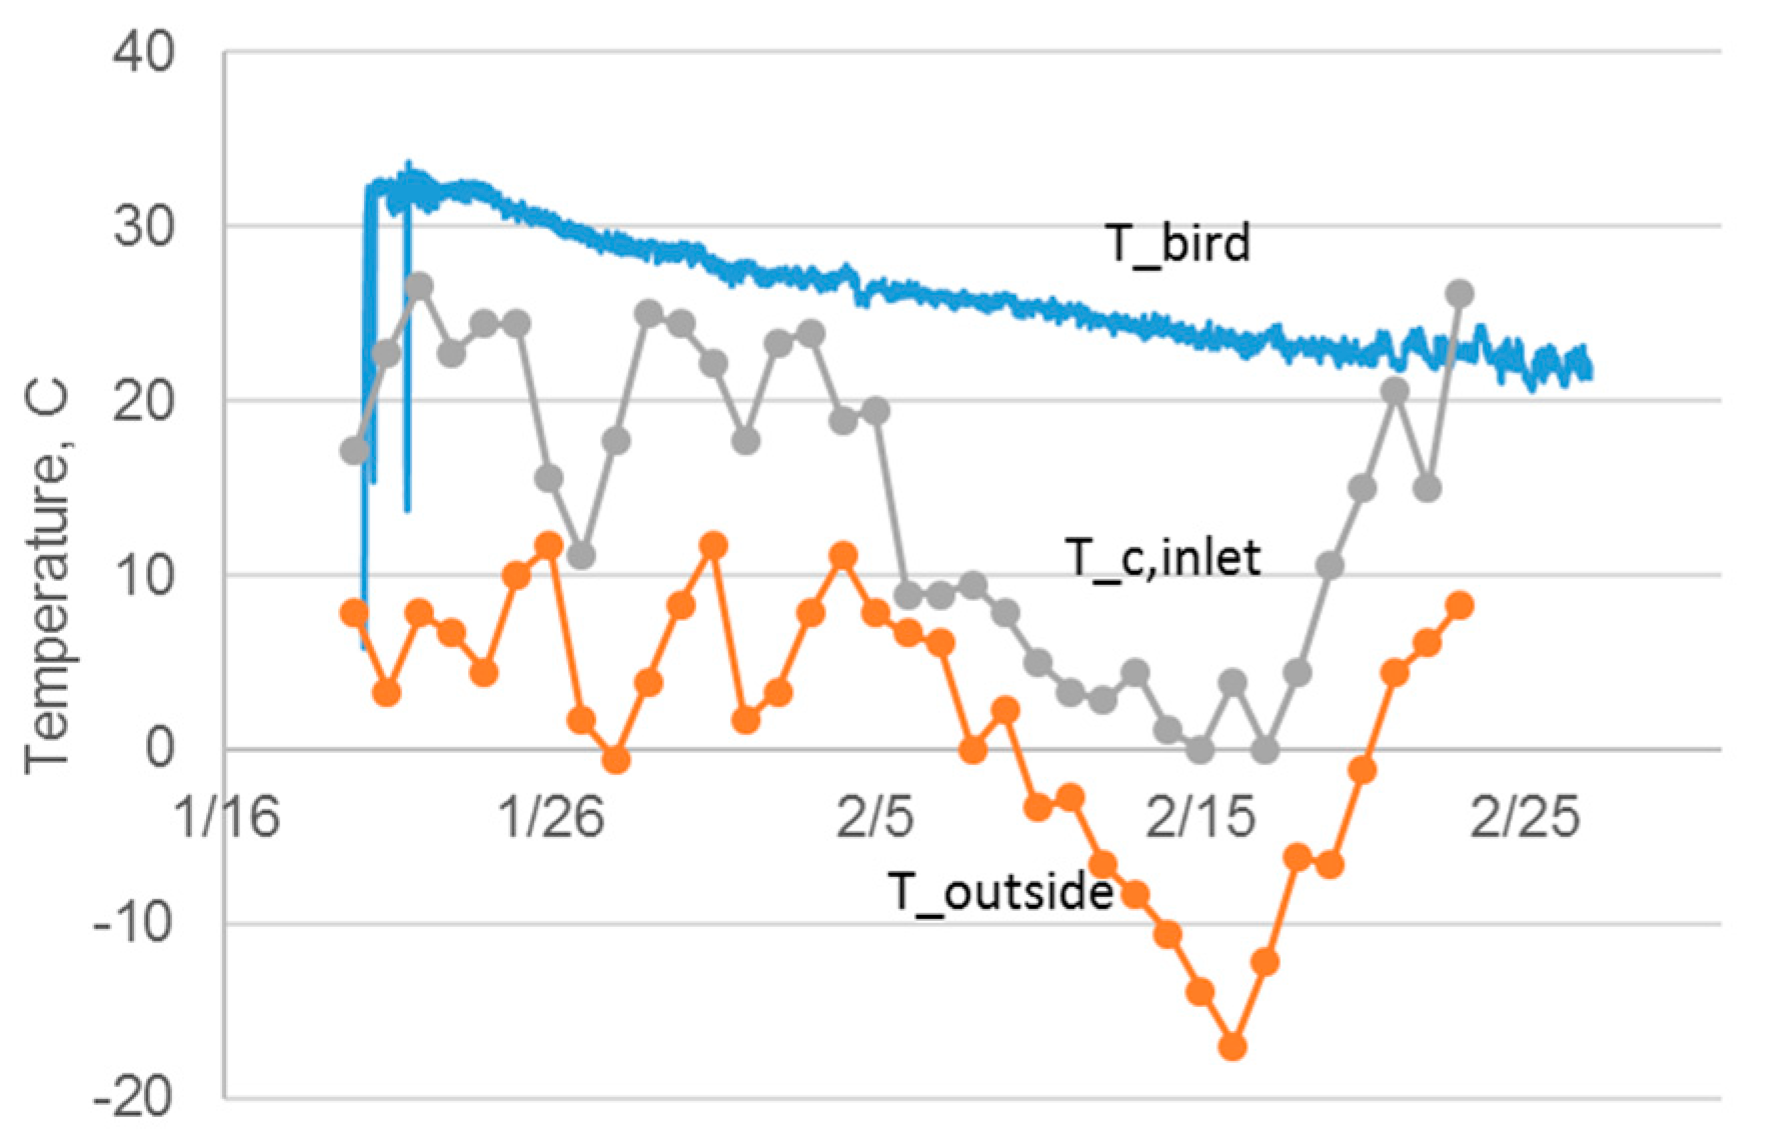
3.2. Temperature Rise
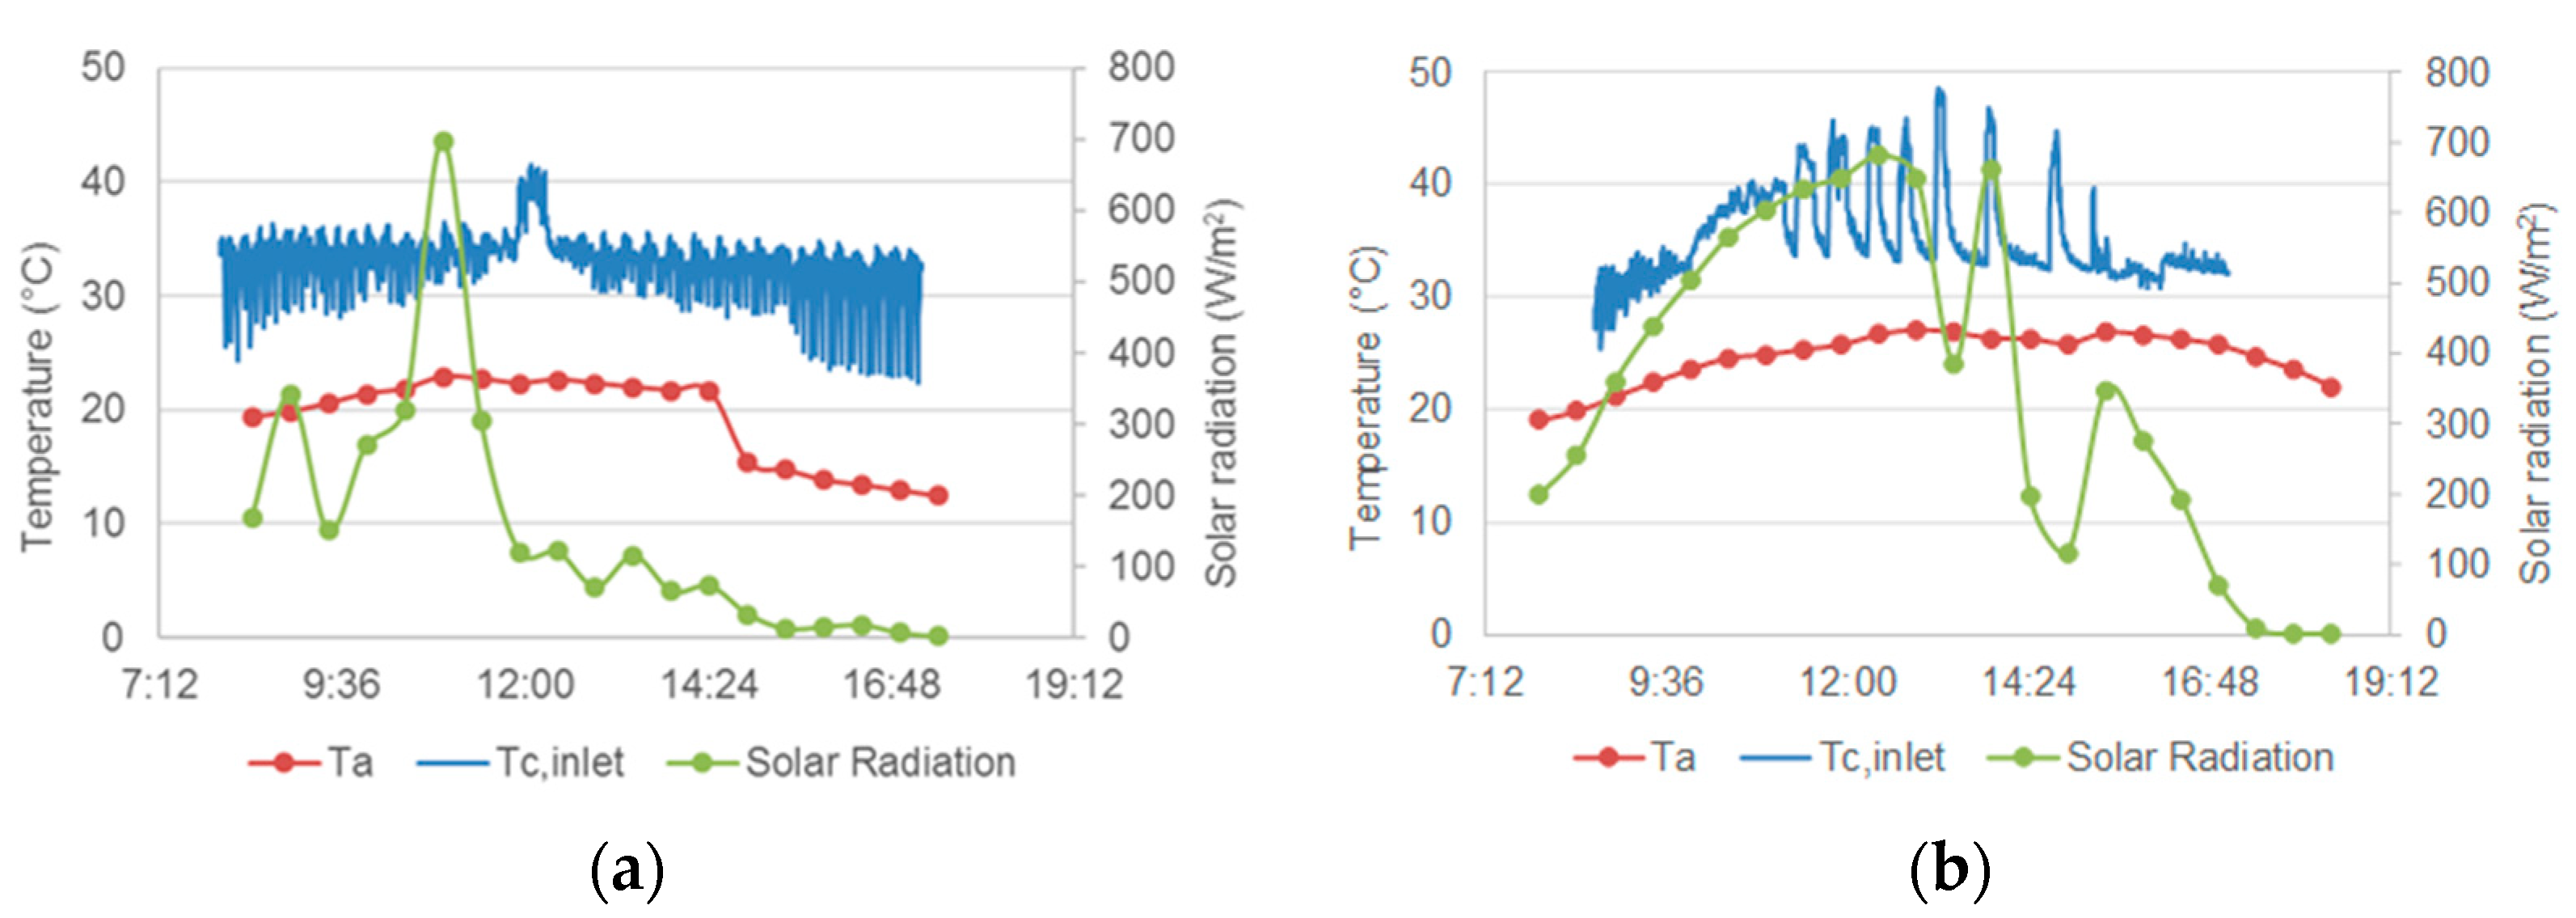
The temperatures measured in the duct of the collectors fluctuated considerably during min-vent cycles (
Figure 4a), caused by intermittent airflow through the collector, variations in ambient wind conditions and solar irradiance (passing cloud), etc. This phenomenon was more obvious during cloudy or partially sunny days when collectors only delivered air during min-vent ON cycles. During the OFF period of the min-vent cycles, the warm air underneath the damper could have seeped backward through the gap around the disk from the house to the collectors, indicated by more than 10 K temperature fluctuation in the early mornings, late afternoons, and evenings (
Figure 4a).
When T
c was higher than T
sp, and T
sp was higher than T
a, solar collectors operated as heaters to deliver warm air from the collector plenum continuously into the barn (
Figure 4b), until the T
c fell below the T
sp or T
a rose above T
sp. When in operation, solar collectors were able to raise the daytime daily average temperature of the incoming air up to 20 K (
Figure 5).
3.3. Fuel Consumption and Savings
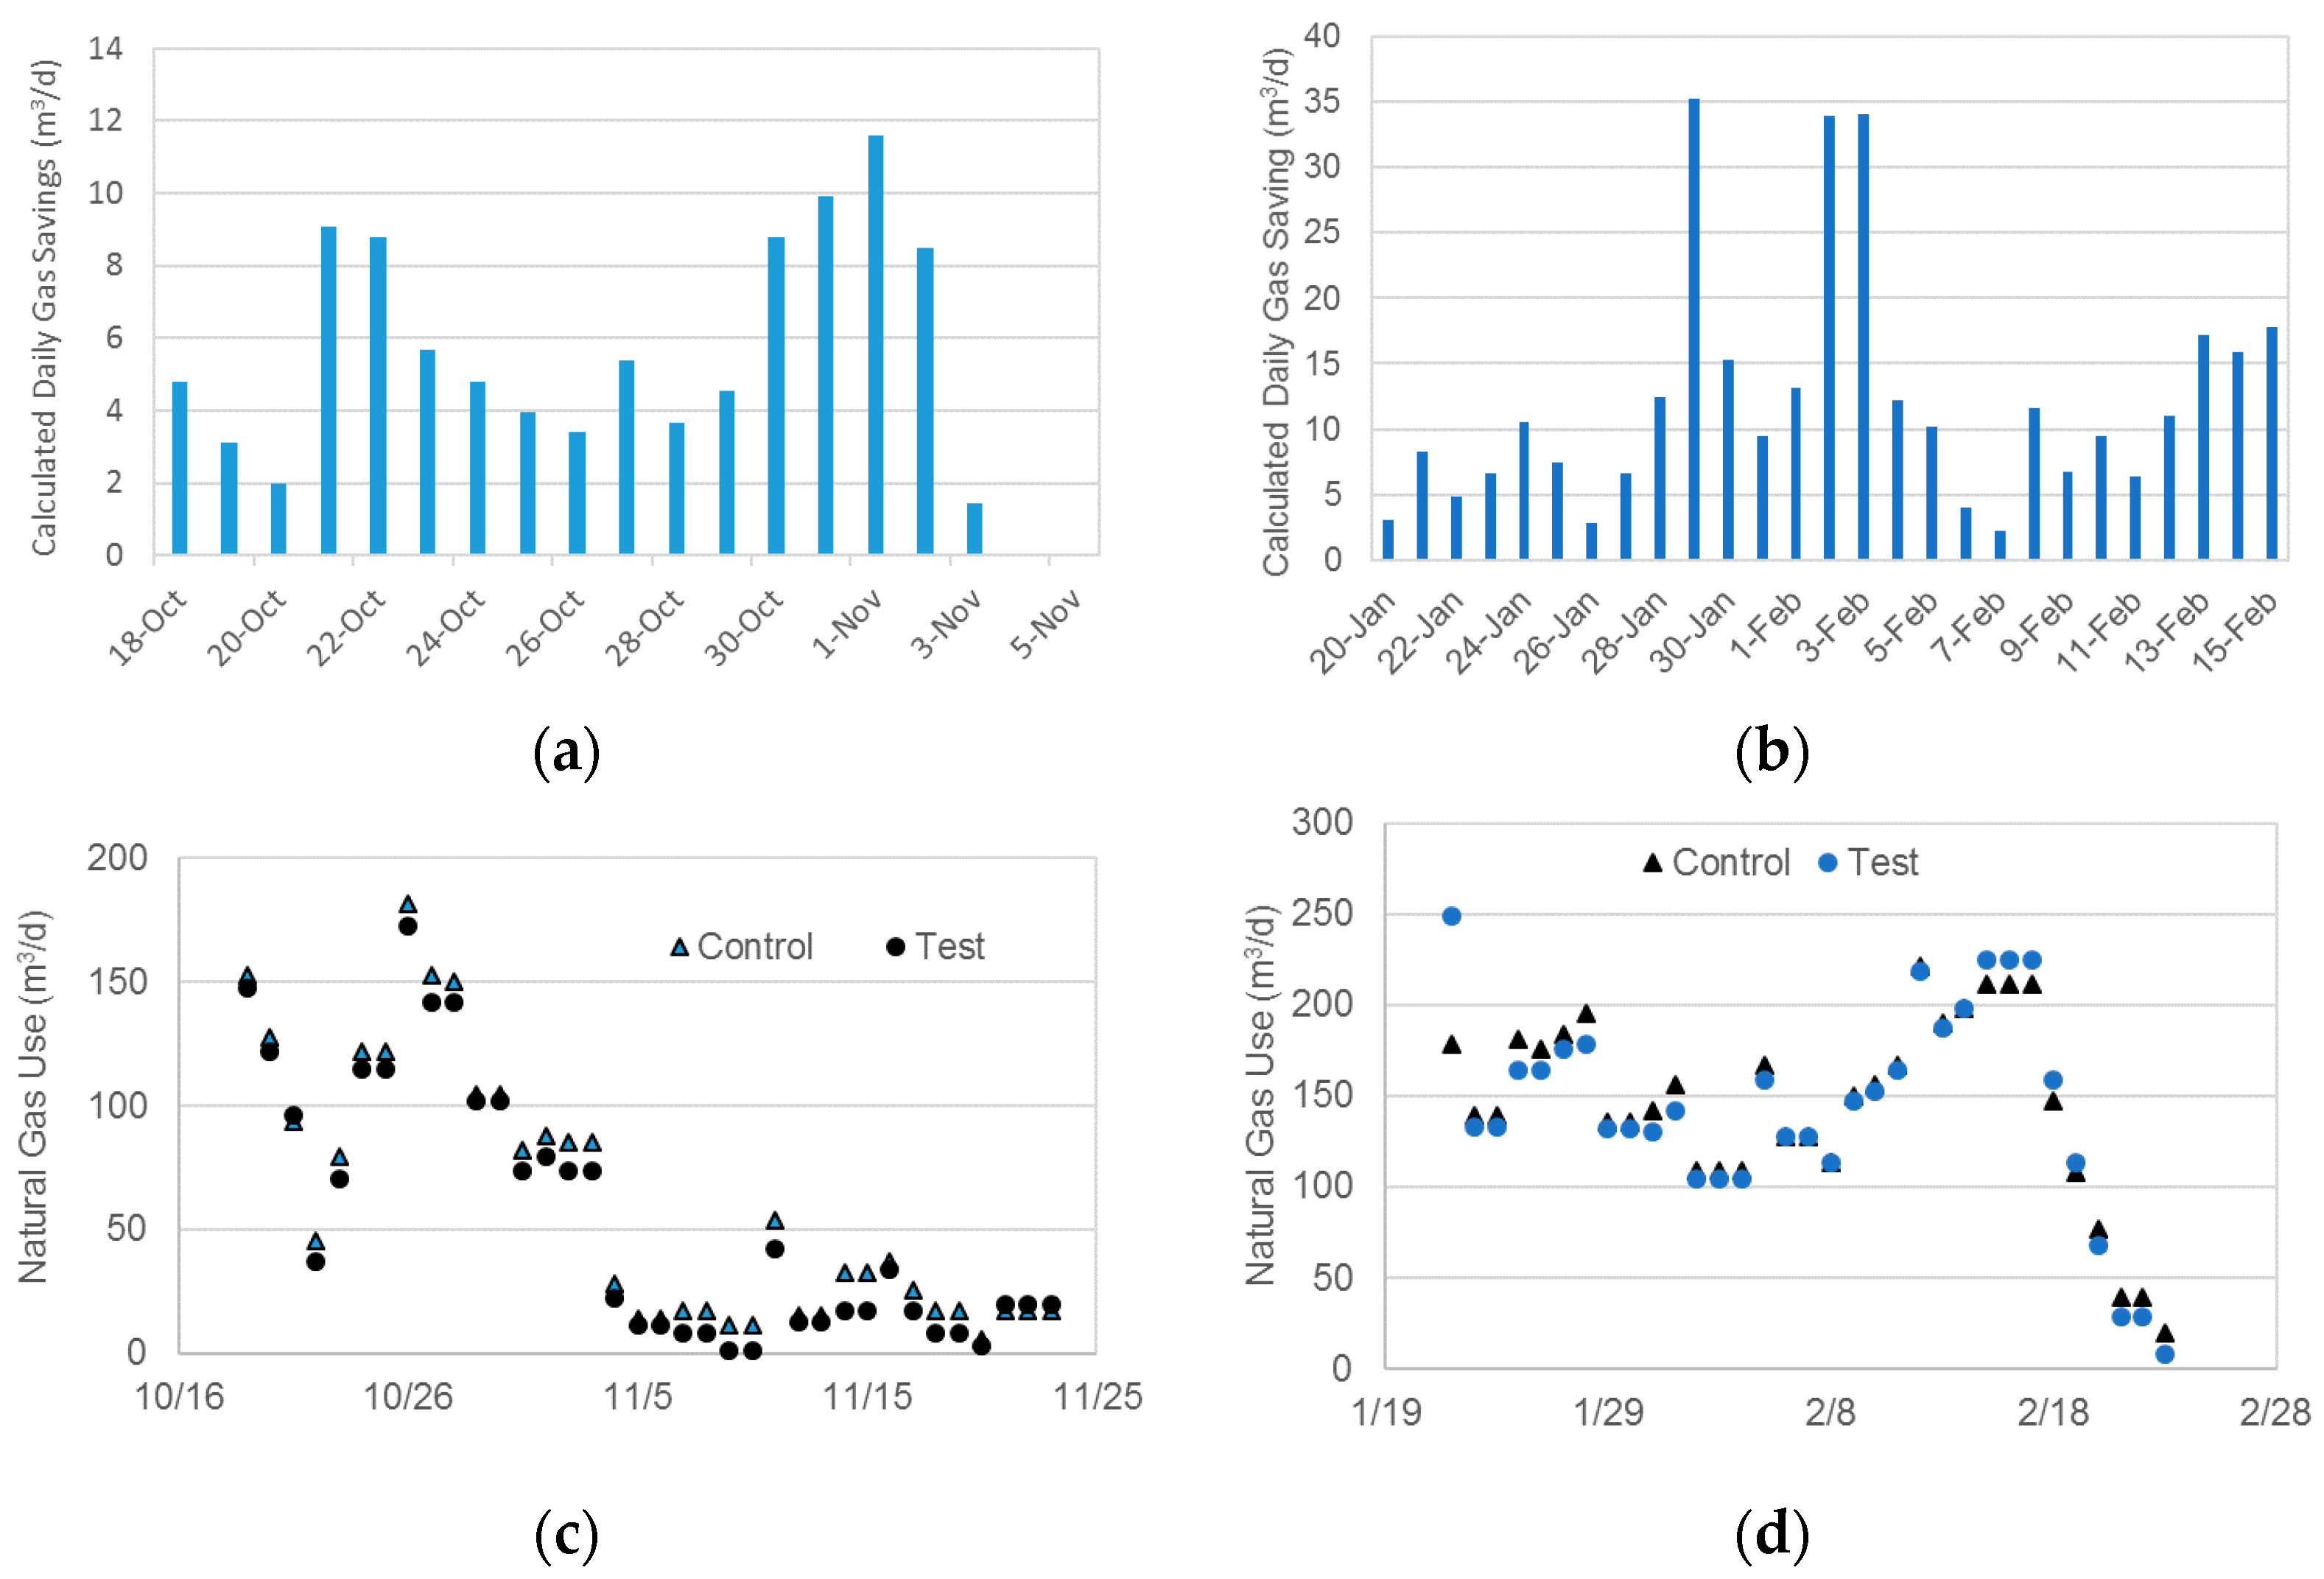
During the first two weeks of brooding in the fall, daily calculated gas savings ranged from 2.0 to 11.6 m
3/d per house (
Figure 6a). In comparison, daily savings based on meter readings were −2.8 to 11.3 m
3/d (
Figure 6c), resulting in cumulative fuel savings of approximately 100 m
3, displacing about 7% of natural gas consumption in the fall flock. However, a larger discrepancy was found between the calculated gas savings and gas meter readings in the winter flock. During the first 33 d of the winter flock, daily calculated gas savings ranged from 2.2 to 34 m
3/d per house (
Figure 6b), while daily gas meter readings were equivalent between the test and control houses with differences of −13 to 17 m
3/d (
Figure 6d), resulting in cumulative fuel savings of approximately 400 m
3 during the winter flock.
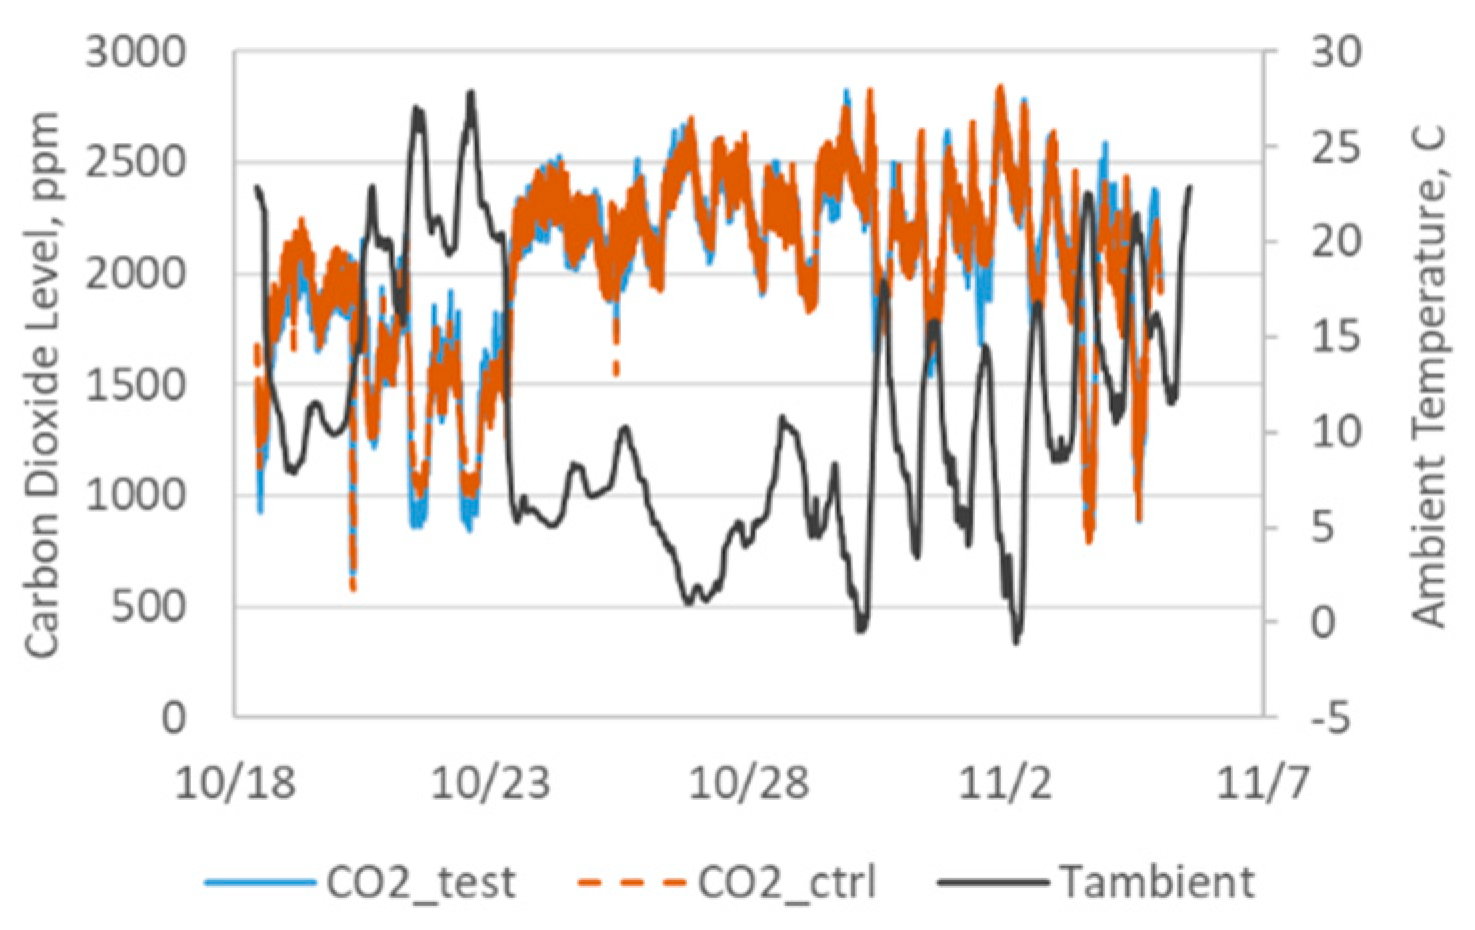
3.4. Carbon Dioxide Concentrations
Building CO
2 concentrations are indicators of indoor air quality and are results of a combination of interior CO
2 generation rates (from birds and litter) and building ventilation rates. Carbon dioxide concentrations in both test and control houses are shown in
Figure 7. Lower CO
2 levels of 1000 ppm during the daytime of 21–22 October 2020 were likely a result of low gas consumption (
Figure 7). The similar concentration level in test and control houses indicated that the additional ventilation provided by solar collectors as heaters during several sunny days did not make a substantial difference in air quality between the test and control houses.
4. Discussion
The low gas savings in this study partially resulted from the challenge in design and operation to deliver the air inside the collector plenum into the house. The current design included a dedicated duct independent of the existing ventilation inlets. A small proportion (17%) was pre-heated by the collectors, while the majority of the fresh air was delivered directly through vents from outside. Solar collectors operated continuously as heaters for only 7 days out of the 18 d brooding period during the fall due to the higher ambient temperature at the time and the less need for heating, and the 33 d brooding period during the winter. Additionally, the nature of conventional intermittent ventilation programs dominating the brooding periods makes the utilization of solar collectors at a low level during the daytime.
Secondly, without thermal storage, the effectiveness of solar heating is limited within the 24 h time period. Flood et al. [
13] reported that heating requirements are roughly distributed as 60% during nighttime hours, and 40% during daytime hours for day-old chicks during any time of the year. The fraction of daytime consumption decreases rapidly to less than 10% of the total by four weeks of age.
Flood et al. [
14] proposed a partitioned ventilation control strategy, calling for higher ventilation rates to achieve up to 60% of moisture removal during the warmest eight hours of the day. This strategy could potentially be applied to solar heating to increase its utilization.
In addition to the limited airflow capacity and limited active operation of the solar collectors, the uninsulated flat disks may have allowed additional heat loss in the test house when the collectors were not in operation, especially at nighttime. It was speculated that the calculated gas savings may have been offset by the energy loss when solar collectors were inactive, especially at night when the temperature under the ceiling could be significantly higher than under the collectors. The long duration of inactivation could have affected their performance. For solar thermal collectors to contribute to pre-heat a building space, a constant airflow rate that generates a suction air velocity through the collector surface is essential to harvest the collected energy [
15]. The induced pressure drop across the absorber surface is critical to impede the effect of wind impingement, preventing air from flowing out of the absorber (reversed airflow) [
15].
The experimental solar collectors tested in this study were estimated to be USD 6000 including the costs of fabrics, framing, the controller, and the labor for installation. Assuming a spring flock placement would have achieved similar fuel savings as the fall flock, the annual total natural gas savings would be around 600 m3. In the United States, poultry farms have access to either natural gas or liquid propane. The commercial price of natural gas averaged around USD 0.35 per cubic meter, while the propane averaged around USD 30 per million BTU (USD 2.70 per gallon) in winter 2021 but fluctuated considerably (between USD 1.30 to USD 3.50 per gallon) in the past several years.
Based on the results of this study, the simple payback period of the six solar collectors is estimated to be around 25 years using the commercial price of natural gas, or 10 years using the price of propane. Therefore, technical improvement including implementation and control algorithm will be necessary to further reduce heating fuel consumption before this solar technology can be economically feasible.
5. Conclusions
Low-cost solar collectors mounted on the roof of a broiler house were evaluated for their performance to pre-heat ventilation air during brooding in the fall and winter seasons. The calculated fuel savings from daytime were up to 7% for the fall and winter flocks. There was little difference in natural gas usage between the test and control houses. The solar collectors produced a maximum temperature rise of 20 K but fluctuated widely due to the intermittent airflow through the ductwork of the collectors. The existing control algorithm allowed solar collectors to be utilized for a limited duration as heaters. Future research should include reevaluating the control algorithm to allow solar collectors to operate as heaters longer during sunny days.
Author Contributions
Y.L. contributed to the conceptualization, methodology, and writing; M.J. contributed to the sensor calibration, data collection and analysis, and review and editing; C.E.H. contributed to project management, data collection, and review and editing. All authors have read and agreed to the published version of the manuscript.
Funding
This research received no external funding.
Institutional Review Board Statement
The study protocol was approved by the Institutional Animal Care and Use Committee (IACUC) at the University of Arkansas (protocol # 19091, date of approval: 17 June 2019).
Data Availability Statement
The data presented in this study are available on request from the corresponding author.
Acknowledgments
We would like to acknowledge Southwestern Sales Company for providing the solar collectors used in this study.
Conflicts of Interest
The authors declare no conflict of interest.
References and Note
- Pelletier, N. Environmental performance in the US broiler poultry sector: Life cycle energy use and greenhouse gas, ozone depleting, acidifying and eutrophying emissions. Agric. Syst. 2008, 98, 67–73. [Google Scholar] [CrossRef]
- Liang, Y.; Costello, T.A.; Bautista, R. Energy Consumption and Conservation Opportunity for Arkansas Broiler Production. Factsheet 1099; University of Arkansas Division of Agriculture: Little Rock, AR, USA, 2020; pp. 1–6. [Google Scholar]
- Kutscher, C.F. Transpired solar collector systems: A major advance in solar heating. Energy Business Technology Sourcebook. In Proceedings of the 19th World Energy Engineering Congress, NREL Report (No. 24373), Atlanta, GA, USA, 6–8 November 1996; pp. 481–489. [Google Scholar]
- Hall, R.; Wang, X.; Ogden, R.; Elghali, L. Transpired solar collectors for ventilation air heating. Energy 2011, 164, 101–110. [Google Scholar] [CrossRef] [Green Version]
- Cordeau, S.; Barrington, S. Instrumentation strategies for energy conservation in broiler barns with ventilation air solar pre-heaters. Energy Build. 2010, 42, 1301–1308. [Google Scholar] [CrossRef]
- Cordeau, S.; Barrington, S. Performance of unglazed solar ventilation air pre-heaters for broiler barns. Sol. Energy 2011, 85, 1418–1429. [Google Scholar] [CrossRef]
- Shah, S.B.; Marshall, T.; Matthis, S. Transpired solar wall for tempering air in a swine nursery in a humid subtropical climate. Appl. Eng. Agric. 2016, 32, 115–123. [Google Scholar]
- Bansal, N.K.; Uhlemann, R. Development and testing of low cost solar energy collectors for heating air. Sol. Energy 1984, 33, 197–208. [Google Scholar] [CrossRef]
- Poole, M.R.; Shah, S.B.; Boyette, M.D.; Grimes, J.L.; Stikeleather, L.F. Evaluation of landscape fabric as a solar air heater. Renew. Energy 2018, 127, 998–1003. [Google Scholar] [CrossRef]
- Poole, M.R.; Shah, S.B.; Grimes, J.L.; Boyette, M.D.; Stikeleather, L.F. Evaluation of a novel, low-cost plastic solar air heater for turkey brooding. Energy Sustain. Dev. 2018, 45, 1–10. [Google Scholar] [CrossRef]
- Hughes, A. 2019. Unpublished data.
- ANSI/AMCA Standard 210-99; Laboratory Methods of Testing Fans for Aerodynamic Performance Rating. Air Movement and Control Association International, Inc.: Chicago, IL, USA, 1999.
- Flood, C.A., Jr.; Koon, J.L.; Brewer, R.N. Solar heating of poultry houses. 1. An analysis of energy use for brooding broiler chickens. Poult. Sci. 1979, 58, 314–318. [Google Scholar] [CrossRef]
- Flood, C.A., Jr.; Trumbull, R.D.; Koon, J.L.; Brewer, R.N. Partitioned ventilation control for boilers. Trans. ASAE 1991, 34, 2541–2549. [Google Scholar] [CrossRef]
- Kozubal, E.; Deru, M.; Slayzak, S.; Norton, P. Evaluating the Performance and Economics of Transpired Solar Collectors for Commercial Applications; ACEEE Summer Study on Energy Efficiency in Buildings: Washington, DC, USA, 2008. [Google Scholar]
| Publisher’s Note: MDPI stays neutral with regard to jurisdictional claims in published maps and institutional affiliations. |
© 2022 by the authors. Licensee MDPI, Basel, Switzerland. This article is an open access article distributed under the terms and conditions of the Creative Commons Attribution (CC BY) license (https://creativecommons.org/licenses/by/4.0/).

