
Assessment of the Possibility of Using Various Types of Renewable Energy Sources Installations in Single-Family Buildings as Part of Saving Final Energy Consumption in Polish Conditions


Abstract
1. Introduction
2. Review of the Literature
3. Materials and Methods
3.1. Location and Climatic Data
3.2. Case Study: Building Energy Parameters
| Building characteristics: | |
| Type and purpose | Residential building, single-family house |
| Standard | According to the regulations of 2002–2009 |
| Number of stories | 1 |
| The height of the story, m | 2.7 |
| Heated area, m2 | 120 |
| Roof | gable |
| Total area of the facade, m2 | 104 |
| Insulated facade surface, m2 | 104 |
| Total area of windows, m2 | 34 |
| Cubature, m3 | 247.07 |
| Location | Kraków, Poland |
| Insolation, kWh/m2 | 1080 |
| Airing, m/s | 17 |
| Climate zone, °C | I–7.7 |
| Heating system: | |
| Building heating system | Solid fuel boiler |
| Type | Old type (soot) |
| Heat distributor | Heater |
| Efficiency of the device, % | 60 |
| Efficiency of distribution and regulation, % | 62 |
| The temperature in the house, °C | 20 |
| Fuel | Coal |
| Calorific value, MJ/kg | 26 |
| Price 1 t, EUR | 197.8 |
| Cost 1 kWh, EUR | 0.12 |
| Max. power of the heating device, kW | 13.2 |
| Efficiency, % | 60 |
| Annual energy demand, kWh | 2900 |
| Building insulation parameters-roof: | |
| Material, λ = 0.042 | Mineral wool |
| Thickness, cm | 30 |
| U-factor, W/m2·K | 0.13 |
| Insulating parameters of the building–walls: | |
| U-factor of a wall without additional insulation | 1.25 |
| Material, λ = 0.045 | standard Styrofoam |
| Thickness, cm | 15 |
| U-factor, W/m2·K | 0.24 |
| Exterior doors, U | 1.3 |
| Insulating parameters of the building–floors: | |
| Material, λ = 0.045 | Styrofoam XPS |
| Thickness, cm | 10 |
| U-factor, W/m2·K | 0.19 |
| Foundations | Traditional insulated |
| Insulating parameters of the building–ventilation: | |
| Tightness | Airtight without recuperation |
| Trial n50 | 3 |
| Ventilation | Gravitational |
| Patency, % | 100 |
3.3. Simulation Tools
3.4. Requirements for the Heat Transfer Coefficient Uc
- Heat transfer coefficient Uc:
- —resistance to heat transfer of the partition, .
- Heat transfer coefficient resistance (thermal insulation) RT:
- —resistance to heat transfer on the inner surface of the partition, ;
- —design thermal resistance for the i-th layer of the partition, ;
- —resistance to heat transfer on the outer surface of the partition, .
- —thickness of the i-th layer of the partition, [m];
- —heat conduction coefficient, .
3.5. The Use of Renewable Energy Sources in Buildings and Their Impact on Energy and Ecological Efficiency
- The amount of energy demand in individual areas of use;
- The amount of auxiliary energy demand;
- Efficiency of systems in individual areas of use;
- Values of the coefficients of input of non-renewable primary energy in and for the delivery of an energy carrier or a given type of energy to the building.
4. Results and Discussion
4.1. Building Energy Parameters–Calculations
- Usable energy demand during the year [56]:
- —annual demand for primary energy by the heating and ventilation system;
- —the annual primary energy requirement of the hot water system.
- Energy necessary to heat 1 dm3 of water by 1 °C = :
- —usable energy;
- —efficiency of the heating system.
4.2. Requirements for the Heat Transfer Coefficient Uc
| Insulation thickness d, m | 0.45 |
| Total resistance RT, | 7.21 |
| Total permeation coefficient Uc, | 0.14 |
| On the ground floor: | |
| Insulation thickness d, m | 1.08 |
| Total resistance RT, | 6.42 |
| Total permeation coefficient Uc, | 0.16 |
| Exterior doors: | |
| Total resistance RT, | 6.42 |
| Total permeation coefficient Uc, | 0.16 |
| Interior doors: | |
| Total resistance RT, | 0.83 |
| Total permeation coefficient Uc, | 1.20 |
| Windows: | |
| Permeability coefficient b, % | 0.14 |
| Total resistance RT, | 0.83 |
| Total permeation coefficient Uc, | 1.20 |
| External walls: the material characteristics of the walls are shown in Table 7. | |
| Insulation thickness d, m | 1.08 |
| Total resistance RT, | 1.09 |
| Total permeation coefficient Uc, | 0.91 |
4.3. The Use of Renewable Energy Sources in Buildings and Their Impact on Energy and Ecological Efficiency
- (a)
- Air Source Heat Pump
- (b)
- Ground Source Heat Pump
- (c)
- Air Source Heat Pump and Solar Panels
- (d)
- Induction Boiler and Solar Panels
- (e)
- Use of an Air Source Heat Pump and a Vertical swing wind turbine
- Pel—rated power of the wind farm: 2 kW,
- hn—height of the turbine mast: 9 m,
- V0—wind speed at height h0 = 30 m: 7 m/s.
- (f)
- The use of an Induction Boiler and a Wind Turbine with a Vertical Rotation Line
- Pel—rated power of the wind farm: 6 kW,
- hn—turbine rotor height: 12 m,
- V0—wind speed at height h0 = 30 m: 7 m/s.
- -
- 11.6 kW air source heat pump + 8.4 kWp monocrystalline photovoltaic panels;
- -
- 21 kW induction boiler + 28.7 kWp monocrystalline photovoltaic panels;
- -
- 21 kW induction boiler + 7.5 kW wind turbine with a horizontal axis of rotation.
5. Conclusions
- Even using traditional technologies, that is, two-layer walls of constructing external partitions, it is possible to obtain a heat transfer coefficient U through the partition, appropriate for an energy-saving building. The availability of materials on the market is not a problem.
- A three-layer wall is the most optimal solution for a single-family house built in energy-saving technology. Despite the higher investment costs, with such a solution the coefficient of demand for primary energy for heating is the lowest. Due to the cover layer, this solution is also the most durable and easy to maintain.
- When using a heat pump instead of a solid fuel boiler, the amount of CO2 released into the atmosphere is reduced by almost 90% per year and amounts to 2935.83 kg CO2/year with an air source heat pump and 3196.79 kg CO2/year with a ground source heat pump.
- “Zero emission” occurs in solutions where the consumer himself produces the electricity needed to power the heat pump or induction boiler. Variants with the generation of electricity by means of a turbine with a vertical and a horizontal axis of rotation, as well as with the use of a photovoltaic installation, were presented.
- The combination of two solutions using renewable energy sources is characterized by higher costs than that with one source of energy, but then the household becomes energy self-sufficient and is not affected by increases in electricity prices and power cuts.
- Taking into account the co-financing programs, the most cost-effective solution for the analyzed single-family building is to install a heat pump in combination with photovoltaic panels. Then, it is possible to obtain funding of up to EUR 6480 under a government program called the “Clean Air Program” [57] for the replacement of the current high-emission furnace with an environmentally friendly device and for the installation of photovoltaic panels. In the event that the consumer decides not to introduce photovoltaics, the surcharge may amount to a maximum of EUR 5400. Currently, there is a huge selection of photovoltaic panels on the market. The popularity of this solution is constantly growing, and the programs of subsidies or tax deductions for purchase costs encourage more people to install photovoltaics in their home. The aforementioned heat pump is also relatively popular.
- By using two solutions using renewable energy sources from a highly energy-consuming building with energy class F, a house has become passive with energy class A+. The household is then energy self-sufficient and is not affected by possible increases in energy prices or power outages.
Author Contributions
Funding
Institutional Review Board Statement
Informed Consent Statement
Data Availability Statement
Conflicts of Interest
References
- Directive 2009/28/EC of the European Parliament and of the Council of 23 April 2009 on the Promotion of the Use of Energy from Renewable Sources and Amending and Subsequently Repealing Directives 2001/77/EC and 2003/30/EC (Text with EEA relevance). Available online: https://eur-lex.europa.eu/legal-content/PL/TXT/?uri=celex%3A32009L0028 (accessed on 15 December 2021).
- Wróblewski, P.; Lewicki, W. A Method of Analyzing the Residual Values of Low-Emission Vehicles Based on a Selected Expert Method Taking into Account Stochastic Operational Parameters. Energies 2021, 14, 6859. [Google Scholar] [CrossRef]
- Wróblewski, P. Analysis of Torque Waveforms in Two-Cylinder Engines for Ultralight Aircraft Propulsion Operating on 0W-8 and 0W-16 Oils at High Thermal Loads Using the Diamond- Like Carbon Composite Coating. SAE Int. J. Engines 2021, 15, 2022. [Google Scholar] [CrossRef]
- Dziubak, T.; Bąkała, L.; Karczewski, M.; Tomaszewski, M. Numerical research on vortex tube separator for special vehicle engine inlet air filter. Sep. Purif. Technol. 2020, 237, 116463. [Google Scholar] [CrossRef]
- Dziubak, T.; Dziubak, S.D. Experimental Study of Filtration Materials Used in the Car Air Intake. Materials 2020, 13, 3498. [Google Scholar] [CrossRef] [PubMed]
- Dziubak, T.; Bąkała, L. Computational and Experimental Analysis of Axial Flow Cyclone Used for Intake Air Filtration in Internal Combustion Engines. Energies 2021, 14, 2285. [Google Scholar] [CrossRef]
- Wróblewski, P.; Koszalka, G. An Experimental Study on Frictional Losses of Coated Piston Rings with Symmetric and Asymmetric Geometry. SAE Int. J. Engines 2021, 14, 853. [Google Scholar] [CrossRef]
- Wróblewski, P. An Innovative Approach to Data Analysis in the Field of Energy Consumption and Energy Conversion Efficiency in Vehicle Drive Systems—The Impact of Operational and Utility Factors. In Proceedings of the 37th International Business Information Management Association (IBIMA), Cordoba, Spain, 1–2 April 2021; ISBN 978-0-9998551-6-4. [Google Scholar]
- Kubińska-Jabcoń, E.; Kubiński, W.; Niekurzak, M. Analysis of the Economical, Ecological and Quality Advantages Consequent Resulting from Initiation of Technology Integrated in Metallurgy. J. Mech. Eng. Autom. 2015, 5, 549–553. [Google Scholar] [CrossRef]
- Janoś, K. Polski Prąd Najdroższy w UE już 7 m-c z Rzędu. Tak Drogo Może być 15 Lat. Available online: https://www.money.pl/gospodarka/polski-prad-najdrozszy-w-ue-juz-7-miesiecy-z-rzedu-tak-drogo-moze-byc-15-lat-6576934583294752a.html (accessed on 12 December 2021).
- Olczak, P.; Matuszewska, D.; Kryzia, D. “Mój Prąd” as an example of the photovoltaic one off grant program in Poland. Energy Policy J. 2020, 23, 123–138. Available online: https://epj.min-pan.krakow.pl/-Moj-Prad-as-an-example-of-the-photovoltaic-one-off-grant-program-in-Poland,122482,0,2.html (accessed on 15 October 2021). [CrossRef]
- Niekurzak, M. The Potential of Using Renewable Energy Sources in Poland Taking into Account the Economic and Ecological Conditions. Energies 2021, 14, 7525. [Google Scholar] [CrossRef]
- Eurostat Statistics Explained, Electricity Price Statistics. Available online: https://ec.europa.eu/eurostat/statistics-explained/index.php/Electricity_price_statistics (accessed on 10 December 2021).
- Niekurzak, M.; Mikulik, J. Modeling of Energy Consumption and Reduction of Pollutant Emissions in a Walking Beam Furnace Using the Expert Method—Case Study. Energies 2021, 14, 8099. [Google Scholar] [CrossRef]
- Niekurzak, M.; Kubińska-Jabcoń, E. Analysis of the Return on Investment in Solar Collectors on the Example of a Household: The Case of Poland. Front. Energy Res. 2021, 9, 224. [Google Scholar] [CrossRef]
- Olczak, P.; Olek, M.; Kryzia, D. The Ecological Impact of Using Photothermal and Photovoltaic Installations for DHW Preparation. Polityka Energetyczna. Energy Policy J. 2020, 23, 65–74. [Google Scholar] [CrossRef]
- Olczak, P.; Olek, M.; Matuszewska, D.; Dyczko, A.; Mania, T. Monofacial and Bifacial Micro PV Installation as Element of Energy Transition-The Case of Poland. Energies 2021, 14, 499. [Google Scholar] [CrossRef]
- Borowski, P. Adaptation strategy on regulated markets of power companies in Poland. Energy Environ. 2019, 30, 3–26. [Google Scholar] [CrossRef]
- Kochanek, E. Wielowymiarowość Interesów Energetycznych w Dobie Transformacji Systemowej; WAT: Warsaw, Poland, 2021. [Google Scholar]
- Polityka Energetyczna Polski 2040, Załącznik do Uchwały nr 22/2021 Rady Ministrów z Dnia 2 Lutego 2021 r; Ministerstwo Klimatu i Środowiska: Warsaw, Poland, 2021.
- Wiśniewski, G. Europejskie Centrum Energii Odnawialnej, Ekonomiczne i Prawne Aspekty Wykorzystania Odnawialnych Zródeł Energii w Polsce; Ministerstwa Środowiska: Warsaw, Poland, 2000; Available online: http://www.pga.org.pl/prawo/ekonomiczne_i_prawne_aspekty.pdf (accessed on 10 December 2021).
- Szczerbowski, R. The forecast of Polish power production sector development by 2050—Coal scenario. Energy Policy J. 2018, 19, 5–18. [Google Scholar]
- Młynarski, T.; Tarnawski, M. Źródła Energii i ich Znaczenie dla Bezpieczeństwa Energetycznego w XXI Wieku; Difin: Warsaw, Poland, 2016. [Google Scholar]
- Wnioski z Analiz Prognostycznych na Potrzeby Polityki Energetycznej Polski do 2050 Roku, Załącznik 2; Ministerstwo Klimatu i Środowiska: Warsaw, Poland, 2021.
- Gabryś, H. Elektroenergetyka w Polsce 2020. Energetyka 2020, 8, 365–373. [Google Scholar]
- Robaina, M.; Neves, A. Complete decomposition analysis of CO2 emissions intensity in the transport sector in Europe. Res. Transp. Econ. 2021, 87, 101074. [Google Scholar] [CrossRef]
- Polski Sektor Energetyczny 2050. 4 Scenariusze; Forum Energii: Warsaw, Poland, 2018. [Google Scholar]
- Šadauskienė, J.; Seduikyte, L.; Paukštys, V.; Banionis, K.; Gailius, A. The role of air tightness in assessment of building energy performance: Case study of Lithuania. Energy Sustain. Dev. 2016, 32, 31–39. [Google Scholar] [CrossRef]
- Cardoso, V.E.M.; Pereira, P.F.; Ramos, N.M.M.; Almeida, R. The Impacts of Air Leakage Paths and Airtightness Levels on Air Change Rates. Buildings 2020, 10, 55. [Google Scholar] [CrossRef]
- Ziółkowski, J.; Żurek, J.; Małachowski, J.; Oszczypała, M.; Szkutnik-Rogoż, J. Method for Calculating the Required Number of Transport Vehicles Supplying Aviation Fuel to Aircraft during Combat Tasks. Sustainability 2022, 14, 1619. [Google Scholar] [CrossRef]
- Wang, L.; Chen, Q. Validation of a Coupled Multizone-CFD Program for Building Airflow and Contaminant Transport Simulations. HvacR Res. 2007, 13, 267–281. [Google Scholar] [CrossRef]
- Chan, W.R.; Joh, J.; Sherman, M.H. Analysis of air leakage measurements of US houses. Energy Build. 2013, 66, 616–625. [Google Scholar] [CrossRef]
- Montoya, M.I.; Pastor, E.; Carrié, F.R.; Guyot, G.; Planas, E. Air leakage in Catalan dwellings: Developing an airtightness model and leakage airflow predictions. Build. Environ. 2010, 45, 1458–1469. [Google Scholar] [CrossRef]
- Pan, W. Relationships between air-tightness and its influencing factors of post-2006 new-build dwellings in the UK. Build. Environ. 2010, 45, 2387–2399. [Google Scholar] [CrossRef]
- Fernández-Agüera, J.; Domínguez-Amarillo, S.; Sendra, J.J.; Suarez, R. An approach to modelling envelope airtightness in multi-family social housing in Mediterranean Europe based on the situation in Spain. Energy Build. 2016, 128, 236–253. [Google Scholar] [CrossRef]
- Bramiana, C.; Entrop, A.; Halman, J. Relationships between Building Characteristics and Airtightness of Dutch Dwellings. Energy Procedia 2016, 96, 580–591. [Google Scholar] [CrossRef][Green Version]
- Szkutnik-Rogoż, J.; Ziółkowski, J.; Małachowski, J.; Oszczypała, M. Mathematical Programming and Solution Approaches for Transportation Optimisation in Supply Network. Energies 2021, 14, 7010. [Google Scholar] [CrossRef]
- Relander, T.-O.; Heiskel, B.; Tyssedal, J.S. The influence of the joint between the basement wall and the wood-frame wall on the airtightness of wood-frame houses. Energy Build. 2011, 43, 1304–1314. [Google Scholar] [CrossRef]
- Hallik, J.; Gustavson, H.; Kalamees, T. Air Leakage of Joints Filled with Polyurethane Foam. Buildings 2019, 9, 172. [Google Scholar] [CrossRef]
- Kalamees, T.; Alev, Ü.; Pärnalaas, M. Air leakage levels in timber frame building envelope joints. Build. Environ. 2017, 116, 121–129. [Google Scholar] [CrossRef]
- Pinto, M.; Viegas, J.; De Freitas, V. Air permeability measurements of dwellings and building components in Portugal. Build. Environ. 2011, 46, 2480–2489. [Google Scholar] [CrossRef]
- Langmans, J.; Desta, T.Z.; Alderweireldt, L.; Roels, S. Durability of self-adhesive tapes for exterior air barrier applications: A laboratory investigation. Int. J. Vent. 2016, 16, 30–41. [Google Scholar] [CrossRef]
- Ziółkowski, J.; Oszczypała, M.; Małachowski, J.; Szkutnik-Rogoż, J. Use of Artificial Neural Networks to Predict Fuel Consumption on the Basis of Technical Parameters of Vehicles. Energies 2021, 14, 2639. [Google Scholar] [CrossRef]
- Fokin, K.F. Cmpoumeльнaя Tenлomexнuкa Oгpaждaющux Чacmeй Здaнuй [Building Heat Engineering Enclosing Parts of Buildings]; ABOK-ΠPECC: Moscow, Russia, 2006. [Google Scholar]
- Hens, S.L.C.H. Building Physics-Heat, Air and Moisture 3e Fundamentals and Engineering Methods with Examples and Exercises; John Wiley & Sons: Hoboken, NJ, USA, 2017; pp. 135–141. [Google Scholar]
- Niekurzak, M. Determining the Unit Values of the Allocation of Greenhouse Gas Emissions for the Production of Biofuels in the Life Cycle. Energies 2021, 14, 8394. [Google Scholar] [CrossRef]
- Shaw-Williams, D.; Susilawati, C.; Walker, G.; Varendorff, J. Towards net-zero energy neighbourhoods utilising high rates of residential photovoltaics with battery storage: A techno-economic analysis. Int. J. Sustain. Energy 2020, 39, 190–206. [Google Scholar] [CrossRef]
- Brown, H.S.; Vergragt, P.J. Bounded socio-technical experiments as agents of systemic change: The case of a zero-energy residential building. Technol. Forecast. Soc. Chang. 2008, 75, 107–130. [Google Scholar] [CrossRef]
- Yi, H.; Srinivasan, R.S.; Braham, W.W.; Tilley, D.R. An ecological understanding of net-zero energy building: Evaluation of sustainability based on emergy theory. J. Clean. Prod. 2017, 143, 654–671. [Google Scholar] [CrossRef]
- Szalay, Z.; Zöld, A. Definition of nearly zero-energy building requirements based on a large building sample. Energy Policy 2014, 74, 510–521. [Google Scholar] [CrossRef]
- Srinivasan, R.; Braham, W.W.; Campbell, D.E.; Curcija, C.D. Re (De) fining Net Zero Energy: Renewable Energy balance in environmental building design. Build. Environ. 2012, 47, 300–315. [Google Scholar] [CrossRef]
- Robert, A.; Kummert, M. Designing net-zero energy buildings for the future climate, not for the past. Build. Environ. 2012, 55, 150–158. [Google Scholar] [CrossRef]
- Zhou, Z.; Feng, L.; Zhang, S.; Wang, C.; Chen, G.; Du, T.; Li, Y.; Zuo, J. The operational performance of “net zero energy building”: A study in China. Appl. Energy 2016, 177, 716–728. [Google Scholar] [CrossRef]
- Pikas, E.; Thalfeldt, M.; Kurnitski, J. Cost optimal and nearly zero energy building solutions for office buildings. Energy Build. 2014, 74, 30–42. [Google Scholar] [CrossRef]
- Nematchoua, M.K.; Tchinda, R.; Orosa, J.A. Adaptation and comparative study of thermal comfort in naturally ventilated classrooms and buildings in the wet tropical zones. Energy Build 2014, 85, 321–328. [Google Scholar] [CrossRef]
- Strzeszewski, M.; Wereszczyński, P. Norma PN-EN 12831-3:2017-08E Nowa Metoda Obliczania Projektowego Obciążenia Ceiplnego. Poradnik. Warszawa. 2009. Available online: https://www.purmo.com/docs/Poradnik-Purmo-nowa-metoda-obliczania_12831_01_2012.pdf (accessed on 8 December 2021).
- Ministerstwo Klimatu i Środowiska, Program Czyste Powietrze, Warsaw, Poland. 2022. Available online: https://czystepowietrze.gov.pl (accessed on 10 January 2022).


| Requirements | Standard Building | Low-Energy Building | Building Passive |
|---|---|---|---|
| The maximum heat transfer coefficient of the building partition, W/m2·K: | |||
| - external wall | 0.30 | 0.18 | 0.15 |
| - roof / flat roof | 0.25 | 0.20 | 0.10 |
| - windows | 1.80/1.70 | 1.70 | 0.80 |
| Energy demand for heating purposes, W/m2 | ≤100 | 25–35 | ≤10 |
| Annual energy demand for heating purposes, kWh/(m2·a) | ≤100 | 30–40 | ≤15 |
| Building tightness n50 (h−1) | ≤3.0 | 0.2–0.6 |
| Energy Class | Energy Rating | Indicator EA, [kWh/m2/Year] |
|---|---|---|
| A+ | Passive | ≥20 |
| A | Low energy | 20–45 |
| B | Energy saving | 45–80 |
| C | Moderately energy efficient | 80–100 |
| D | Moderately energy-consuming | 100–150 |
| E | Energy-consuming | 150–250 |
| F | Highly energy-consuming | ≤250 |
| Heat Flux Direction | Resistance to Heat Transfer on the Outer Surface Rse, | Resistance to Heat Transfer on the Inner Surface Rsi, |
|---|---|---|
| Up | 0.04 | 0.10 |
| Down | 0.04 | 0.17 |
| Horizontal | 0.04 | 0.13 |
| Partition | from 1 January 2017 r. | from 1 January 2021 r. |
|---|---|---|
| Exterior walls | 0.23 | 0.20 |
| Interior walls | 1.00 | 1.00 |
| Roofs, flat roofs, and ceilings under unheated attics or over crossings | 0.18 | 0.15 |
| Floors on the ground | 0.30 | 0.30 |
| Ceilings over heated underground spaces and inter-story ceilings | 1.00 | 1.00 |
| Windows (except roof windows), balcony doors, and unopened transparent surfaces | 1.1 | 0.9 |
| Doors in external partitions or partitions between heated and unheated rooms | 1.5 | 1.3 |
| Material | The Thickness of the Partition Layer d, [m] | Thermal Conductivity λ, [W/m·K] | Layer Resistance R, |
|---|---|---|---|
| Corrugated sheet | 0.024 | 58.000 | 0.000 |
| Plates URSA XPS-DRAIN 140 mm | 0.280 | 0.040 | 7.000 |
| Reinforced concrete with 1% steel | 0.150 | 2.300 | 0.065 |
| Plaster or cement-lime finish | 0.000 | 0.820 | 0.000 |
| Material | The Thickness of the Partition Layer d, [m] | Thermal Conductivity λ, [W/m·K] | Layer Resistance R, |
|---|---|---|---|
| Sand | 0.400 | 2.000 | 0.200 |
| Concrete of medium density 1800 | 0.200 | 1.150 | 0.174 |
| Styrofoam 40 | 0.160 | 0.040 | 4.000 |
| Steel reinforced concrete 1% | 0.200 | 2.300 | 0.087 |
| Styrofoam 40 | 0.070 | 0.040 | 1.750 |
| Concrete of medium density 2000 | 0.050 | 1.350 | 0.037 |
| Material | The Thickness of the Partition layer d, [m] | Thermal Conductivity λ, [W/m·K] | Layer Resistance R, |
|---|---|---|---|
| POROTHERM 25P + ordinary mortar | 0.250 | 0.300 | 0.833 |
| Heating System | |
|---|---|
| Source of heat | Heat pump |
| Type | Air-water |
| The efficiency of the device, % | 490 |
| Efficiency of distribution and regulation, % | 98 |
| The temperature in the house, °C | 20 |
| Fuel | Electricity |
| Cost 1 kWh, EUR | 0.14 |
| Maximum power of the heating device, kW | 11.6 |
| Water heating | Heat pump to CWU |
| Heating mode | A7/W35 |
| Tray | Modern tray |
| Indicators | Measuring Unit, [kg/MWh] |
|---|---|
| Carbon dioxide (CO2) | 719 |
| Sulfur oxide (SOx/SO2) | 0.511 |
| Nitric oxide (NOx/NO2) | 0.576 |
| Carbon monoxide (CO) | 0.233 |
| Total dust | 0.029 |
| Building Type | Single-Family House |
|---|---|
| Heated area, m2 | 120 |
| Energy performance index | Low energy A |
| The amount of the annual demand for usable energy, kWh/year | 20,007.72 |
| The volume of the annual demand for final energy, kWh/year | 4083.21 |
| Annual primary energy demand, kWh/year | 12,249.62 |
| Value of the issue CO2, kg CO2/year | 2935.83 |
| Power, kW | 11.6 |
| Building Type | Single-Family House |
|---|---|
| Heated area, m2 | 120 |
| Energy performance index | Low energy A |
| The amount of the annual demand for usable energy, kWh/year | 20,007.72 |
| The volume of the annual demand for final energy, kWh/year | 4446.16 |
| Annual primary energy demand, kWh/year | 13,338.48 |
| Value of the issue CO2, kg CO2/year | 3196.79 |
| Power, kW | 12.5 |
| Building Type | Single-Family House |
|---|---|
| Heated area, m2 | 120 |
| Energy performance index | Energy-saving B |
| The amount of the annual demand for usable energy, kWh/year | 20,007.72 |
| The volume of the annual demand for final energy, kWh/year | 0 |
| Annual primary energy demand, kWh/year | 0 |
| Value of the issue CO2, kg CO2/year | 2935.83 |
| Power, kW | 8.4 |
| Heating System | |
|---|---|
| Source of heat | Induction boiler |
| The efficiency of the device | 0.986 |
| Temperature in the house, °C | 20 |
| Fuel | Electricity |
| Cost 1 kWh, EUR | 0.14 |
| Heating device power, kW | 21 |
| Water heating | Electricity |
| Adjustable outlet temperature, °C | >80 |
| Permissible outlet temperature, °C | 90 |
| Building Type | Single-Family House |
|---|---|
| Heated area, m2 | 120 |
| Energy performance index | Passive A+ |
| The amount of the annual demand for usable energy, kWh/rok | 20,007.72 |
| The volume of the annual demand for final energy, kWh/rok | 0 |
| Annual primary energy demand, kWh/rok | 0 |
| Value of the issue CO2, kg CO2/year | 0 |
| Computational power demand, kW | 21,000 |
| Technical Parameters of the Wind Turbine | |
|---|---|
| Rated power, kW | 2 |
| Rated voltage, V | 24/48 |
| Take-off wind speed, m/s | 2.5 |
| Rated wind speed, m/s | 12 |
| Maximum wind speed, m/s | 40 |
| Rotor diameter, m | 2 |
| Number of rotor blades, pcs. | 3 |
| Propeller material | Aluminum |
| Technical Parameters of the Wind Turbine | |
|---|---|
| Rated power, kW | 6 |
| Rated voltage, V | 48 |
| Take-off wind speed, m/s | 2 |
| Rated wind speed, m/s | 11 |
| Maximum wind speed, m/s | 40 |
| Rotor diameter, m | 3 |
| Number of rotor blades, pcs | 3 |
| Propeller material | Fiberglass reinforced with polyester resin |
| Weight, kg | 156 |
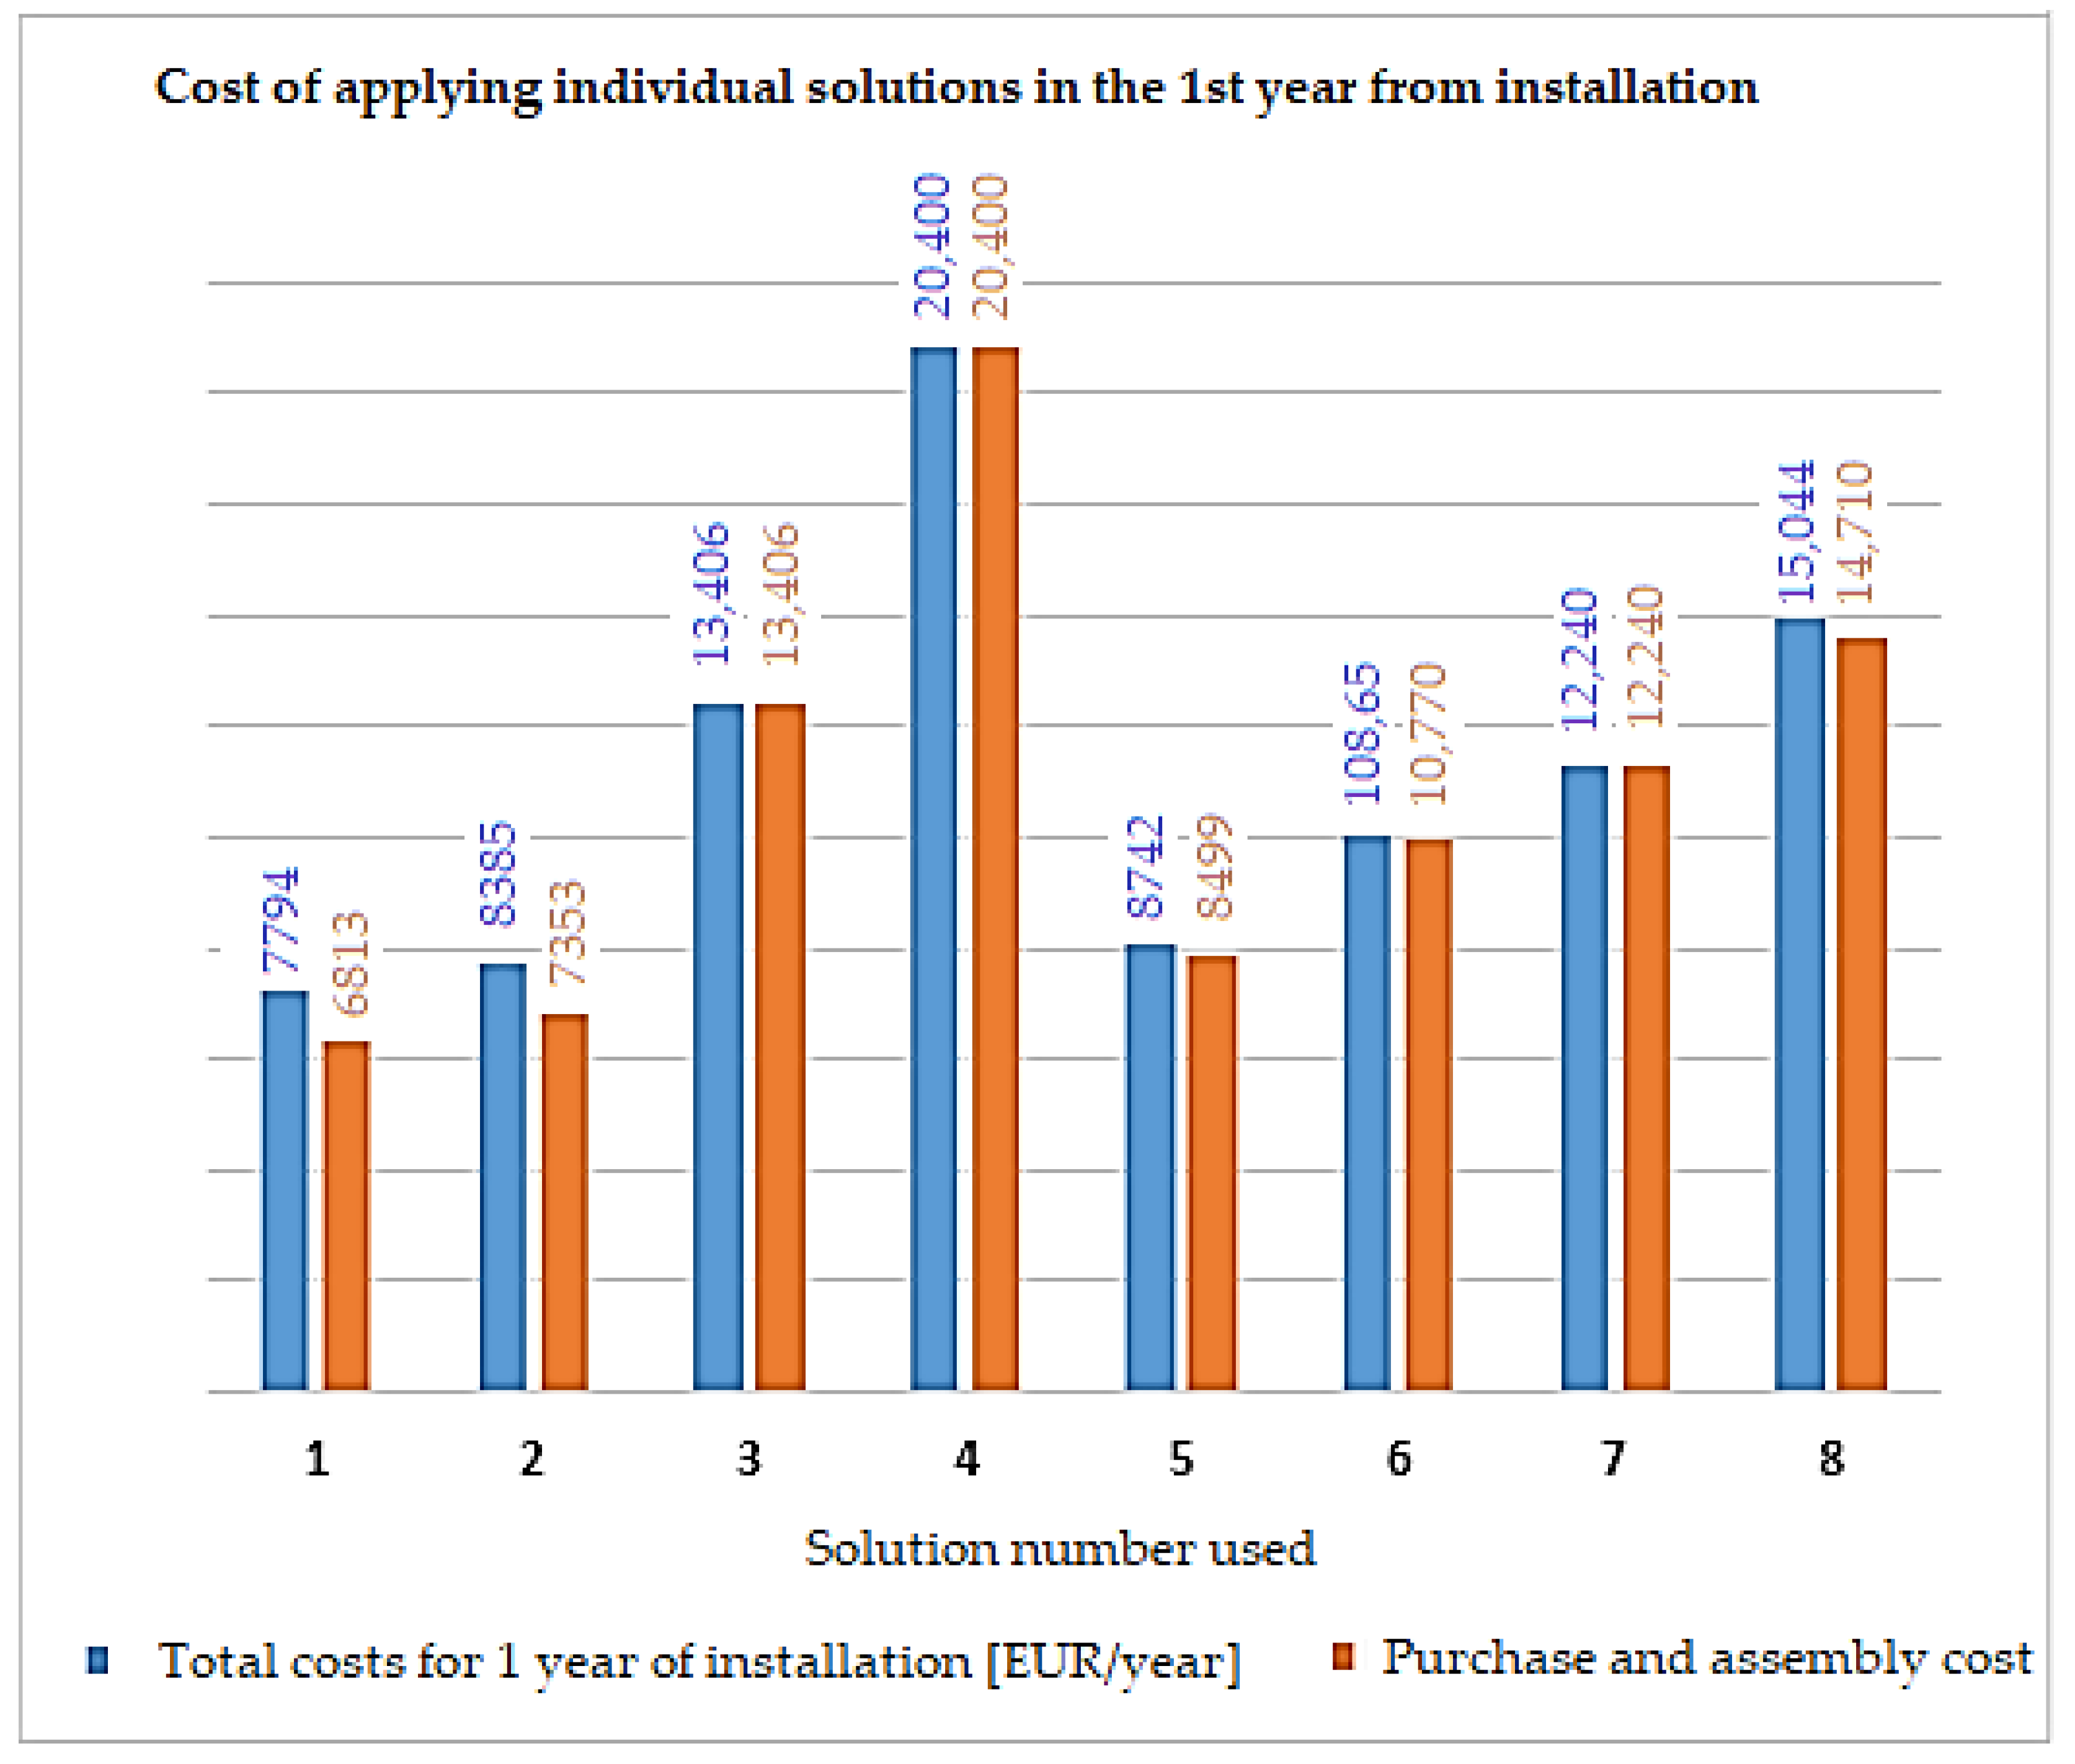
| No. | Device Name | The Cost of Purchasing the Device and Assembly, EUR | The Cost of Purchasing Additional Elements, EUR | Total Cost of Purchase and Assembly, EUR | Amount of Missing Electricity to Meet the Demand, [kWh/Year] | The Cost of Purchasing the Missing Energy, EUR | Sum of Costs in the First year, EUR/Year |
|---|---|---|---|---|---|---|---|
| 1. | Air-to-water heat pump | 6477.77 | 323.89 | 6801.65 | 1508.02 | 980.30 | 7781.96 |
| 2. | Ground source heat pump | 6261.84 | 1079.63 | 7341.47 | 1586.40 | 1031.04 | 8372.51 |
| 3. | Air-to-water heat pump + Solar panels | 11,517.47 | 1943.33 | 13,385.22 | - | - | 13,385.22 |
| 4. | Induction boiler + Monocrystal line photovoltaic panels | 18,209.00 | 2159.26 | 20,368.25 | - | - | 20,368.25 |
| 5. | Air-to-water heat pump + A wind turbine Ista Breeze i-2000 | 8097.21 | 388.67 | 8485.87 | 373.12 | 242.48 | 8728.36 |
| 6. | Air-to-water heat pump + FLTX FH-2000 wind turbine | 10,364.43 | 388.67 | 10,753.09 | 145.97 | 95.01 | 10,848.10 |
| 7. | Induction boiler + A wind turbine Windspot 7.5 kW | 11,767.94 | 453.44 | 12,221.38 | Overproduction 870.18 | - | 12,221.38 |
| 8. | Induction boiler + A wind turbine Spine + ARC 1500 6 kW | 14,251.08 | 431.85 | 14,682.94 | 520.38 | 338.14 | 15,021.07 |
Publisher’s Note: MDPI stays neutral with regard to jurisdictional claims in published maps and institutional affiliations. |
© 2022 by the authors. Licensee MDPI, Basel, Switzerland. This article is an open access article distributed under the terms and conditions of the Creative Commons Attribution (CC BY) license (https://creativecommons.org/licenses/by/4.0/).
Share and Cite
Wróblewski, P.; Niekurzak, M. Assessment of the Possibility of Using Various Types of Renewable Energy Sources Installations in Single-Family Buildings as Part of Saving Final Energy Consumption in Polish Conditions. Energies 2022, 15, 1329. https://doi.org/10.3390/en15041329
Wróblewski P, Niekurzak M. Assessment of the Possibility of Using Various Types of Renewable Energy Sources Installations in Single-Family Buildings as Part of Saving Final Energy Consumption in Polish Conditions. Energies. 2022; 15(4):1329. https://doi.org/10.3390/en15041329
Chicago/Turabian StyleWróblewski, Piotr, and Mariusz Niekurzak. 2022. "Assessment of the Possibility of Using Various Types of Renewable Energy Sources Installations in Single-Family Buildings as Part of Saving Final Energy Consumption in Polish Conditions" Energies 15, no. 4: 1329. https://doi.org/10.3390/en15041329
APA StyleWróblewski, P., & Niekurzak, M. (2022). Assessment of the Possibility of Using Various Types of Renewable Energy Sources Installations in Single-Family Buildings as Part of Saving Final Energy Consumption in Polish Conditions. Energies, 15(4), 1329. https://doi.org/10.3390/en15041329