
Optimizing the Synthesis and Thermal Properties of Conducting Polymer–Montmorillonite Clay Nanocomposites


Abstract
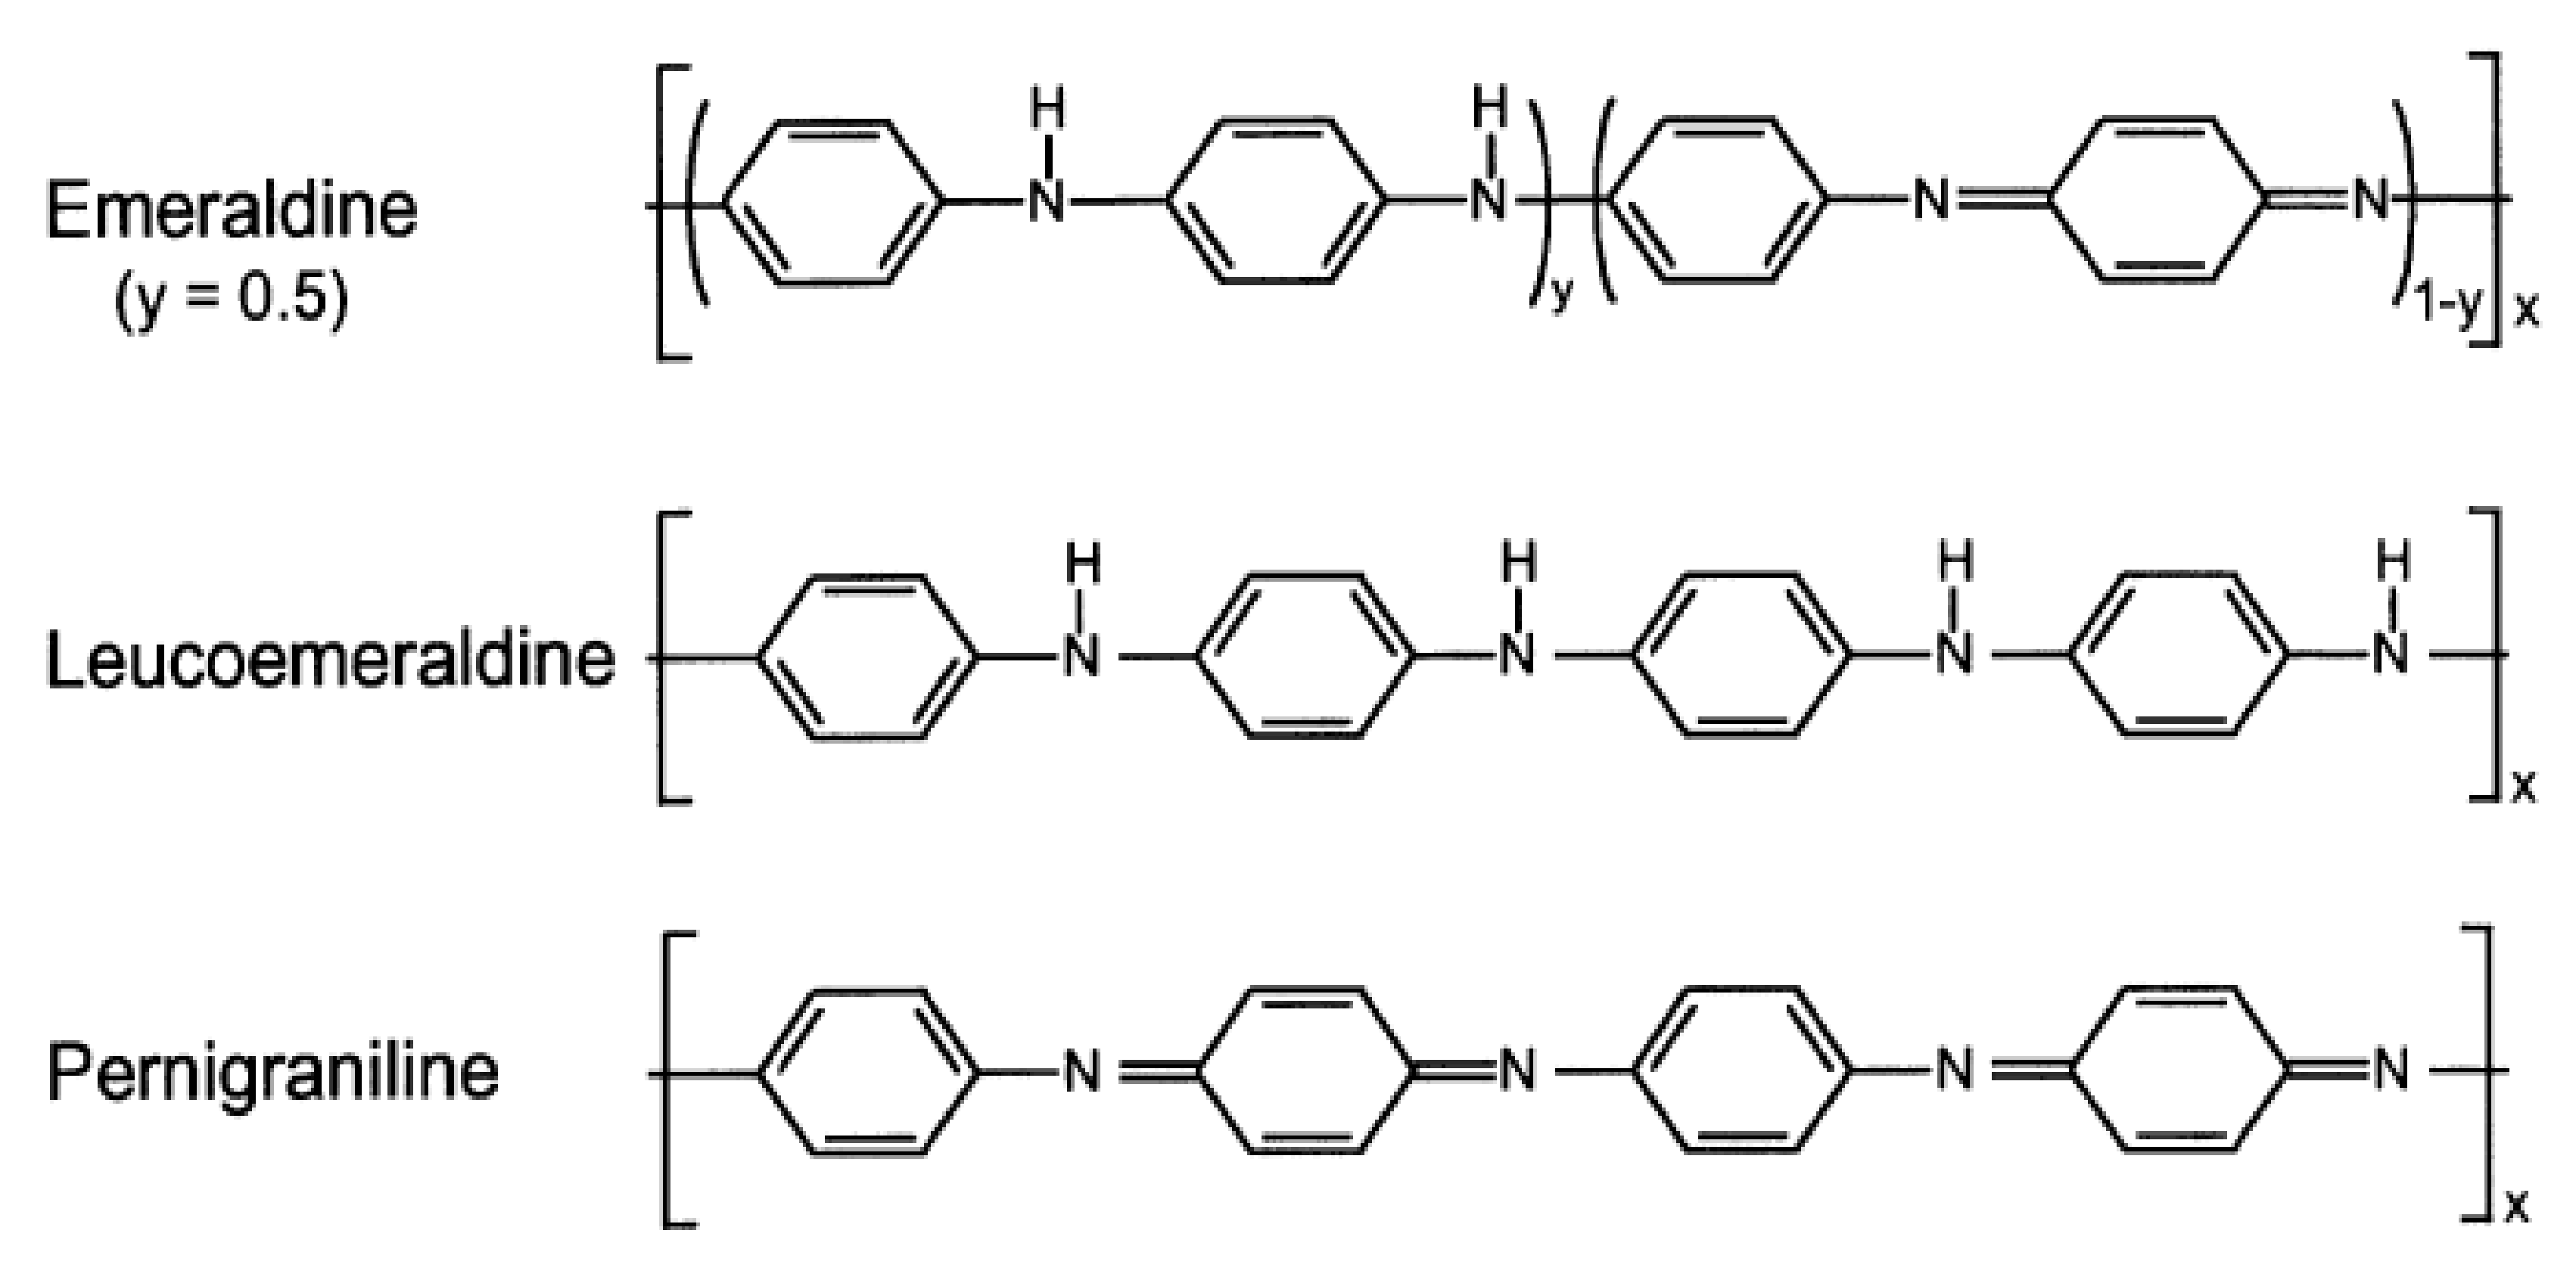
:1. Introduction
2. Materials and Methods
2.1. Materials
2.2. Preparation of the Powder Samples
2.3. Characterization
3. Results
3.1. Composition
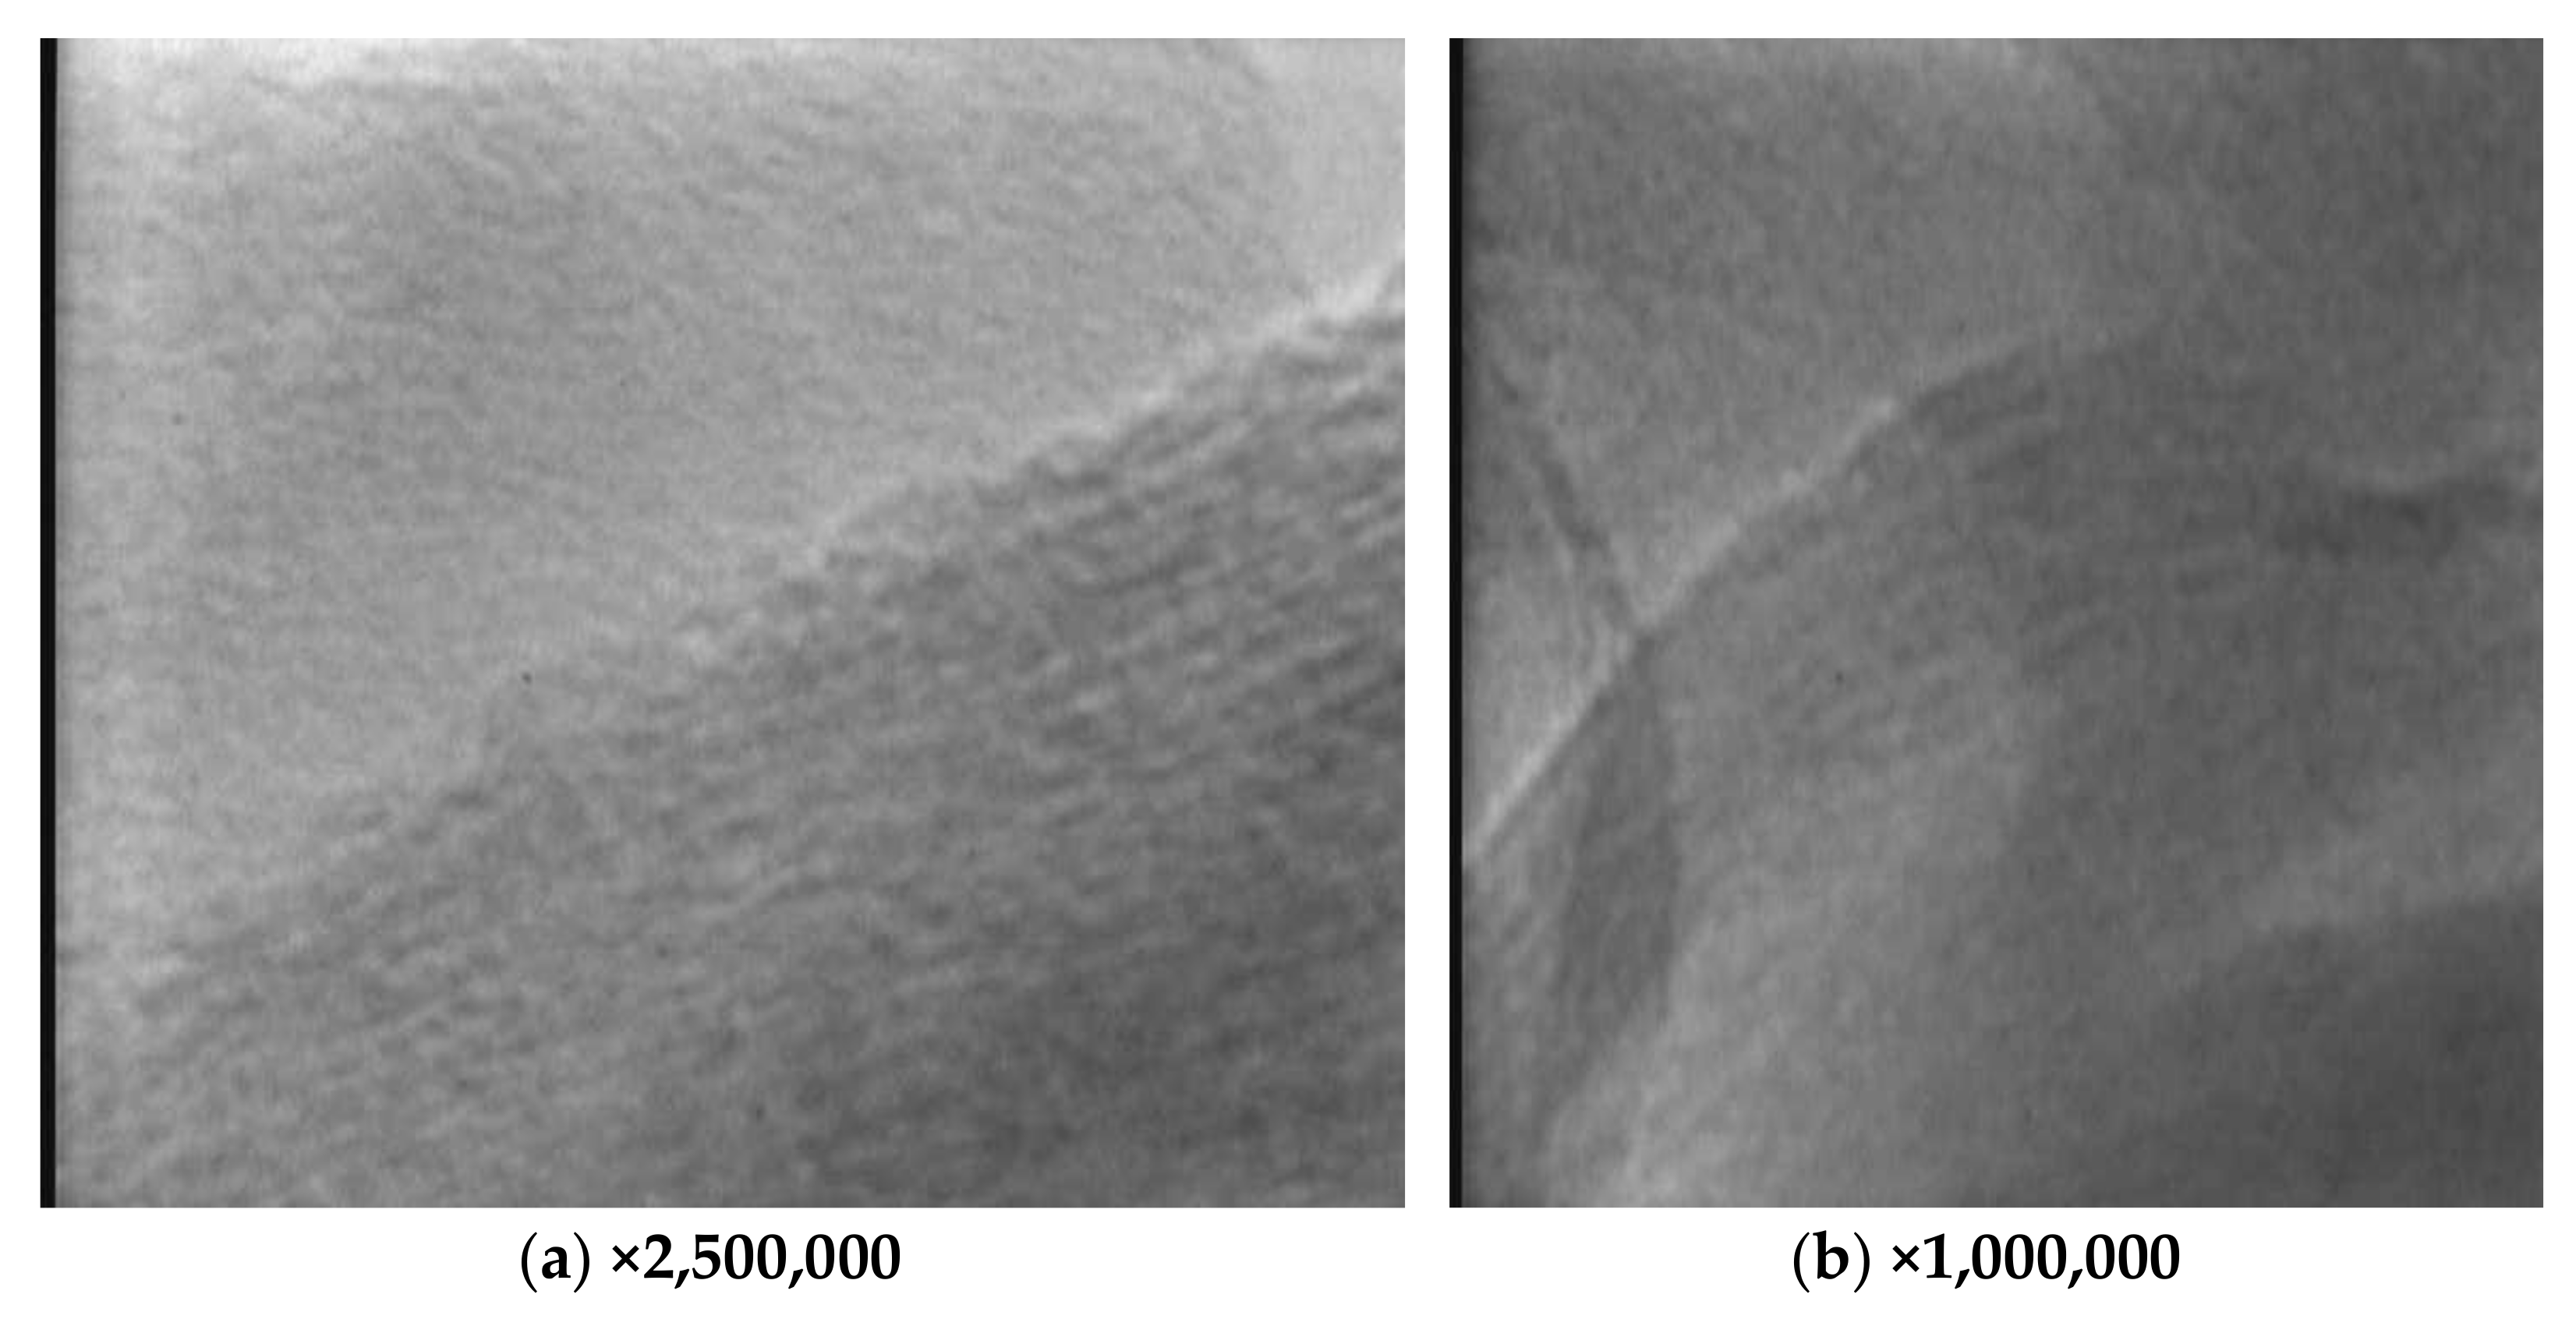
3.2. Morphology
3.3. Structure
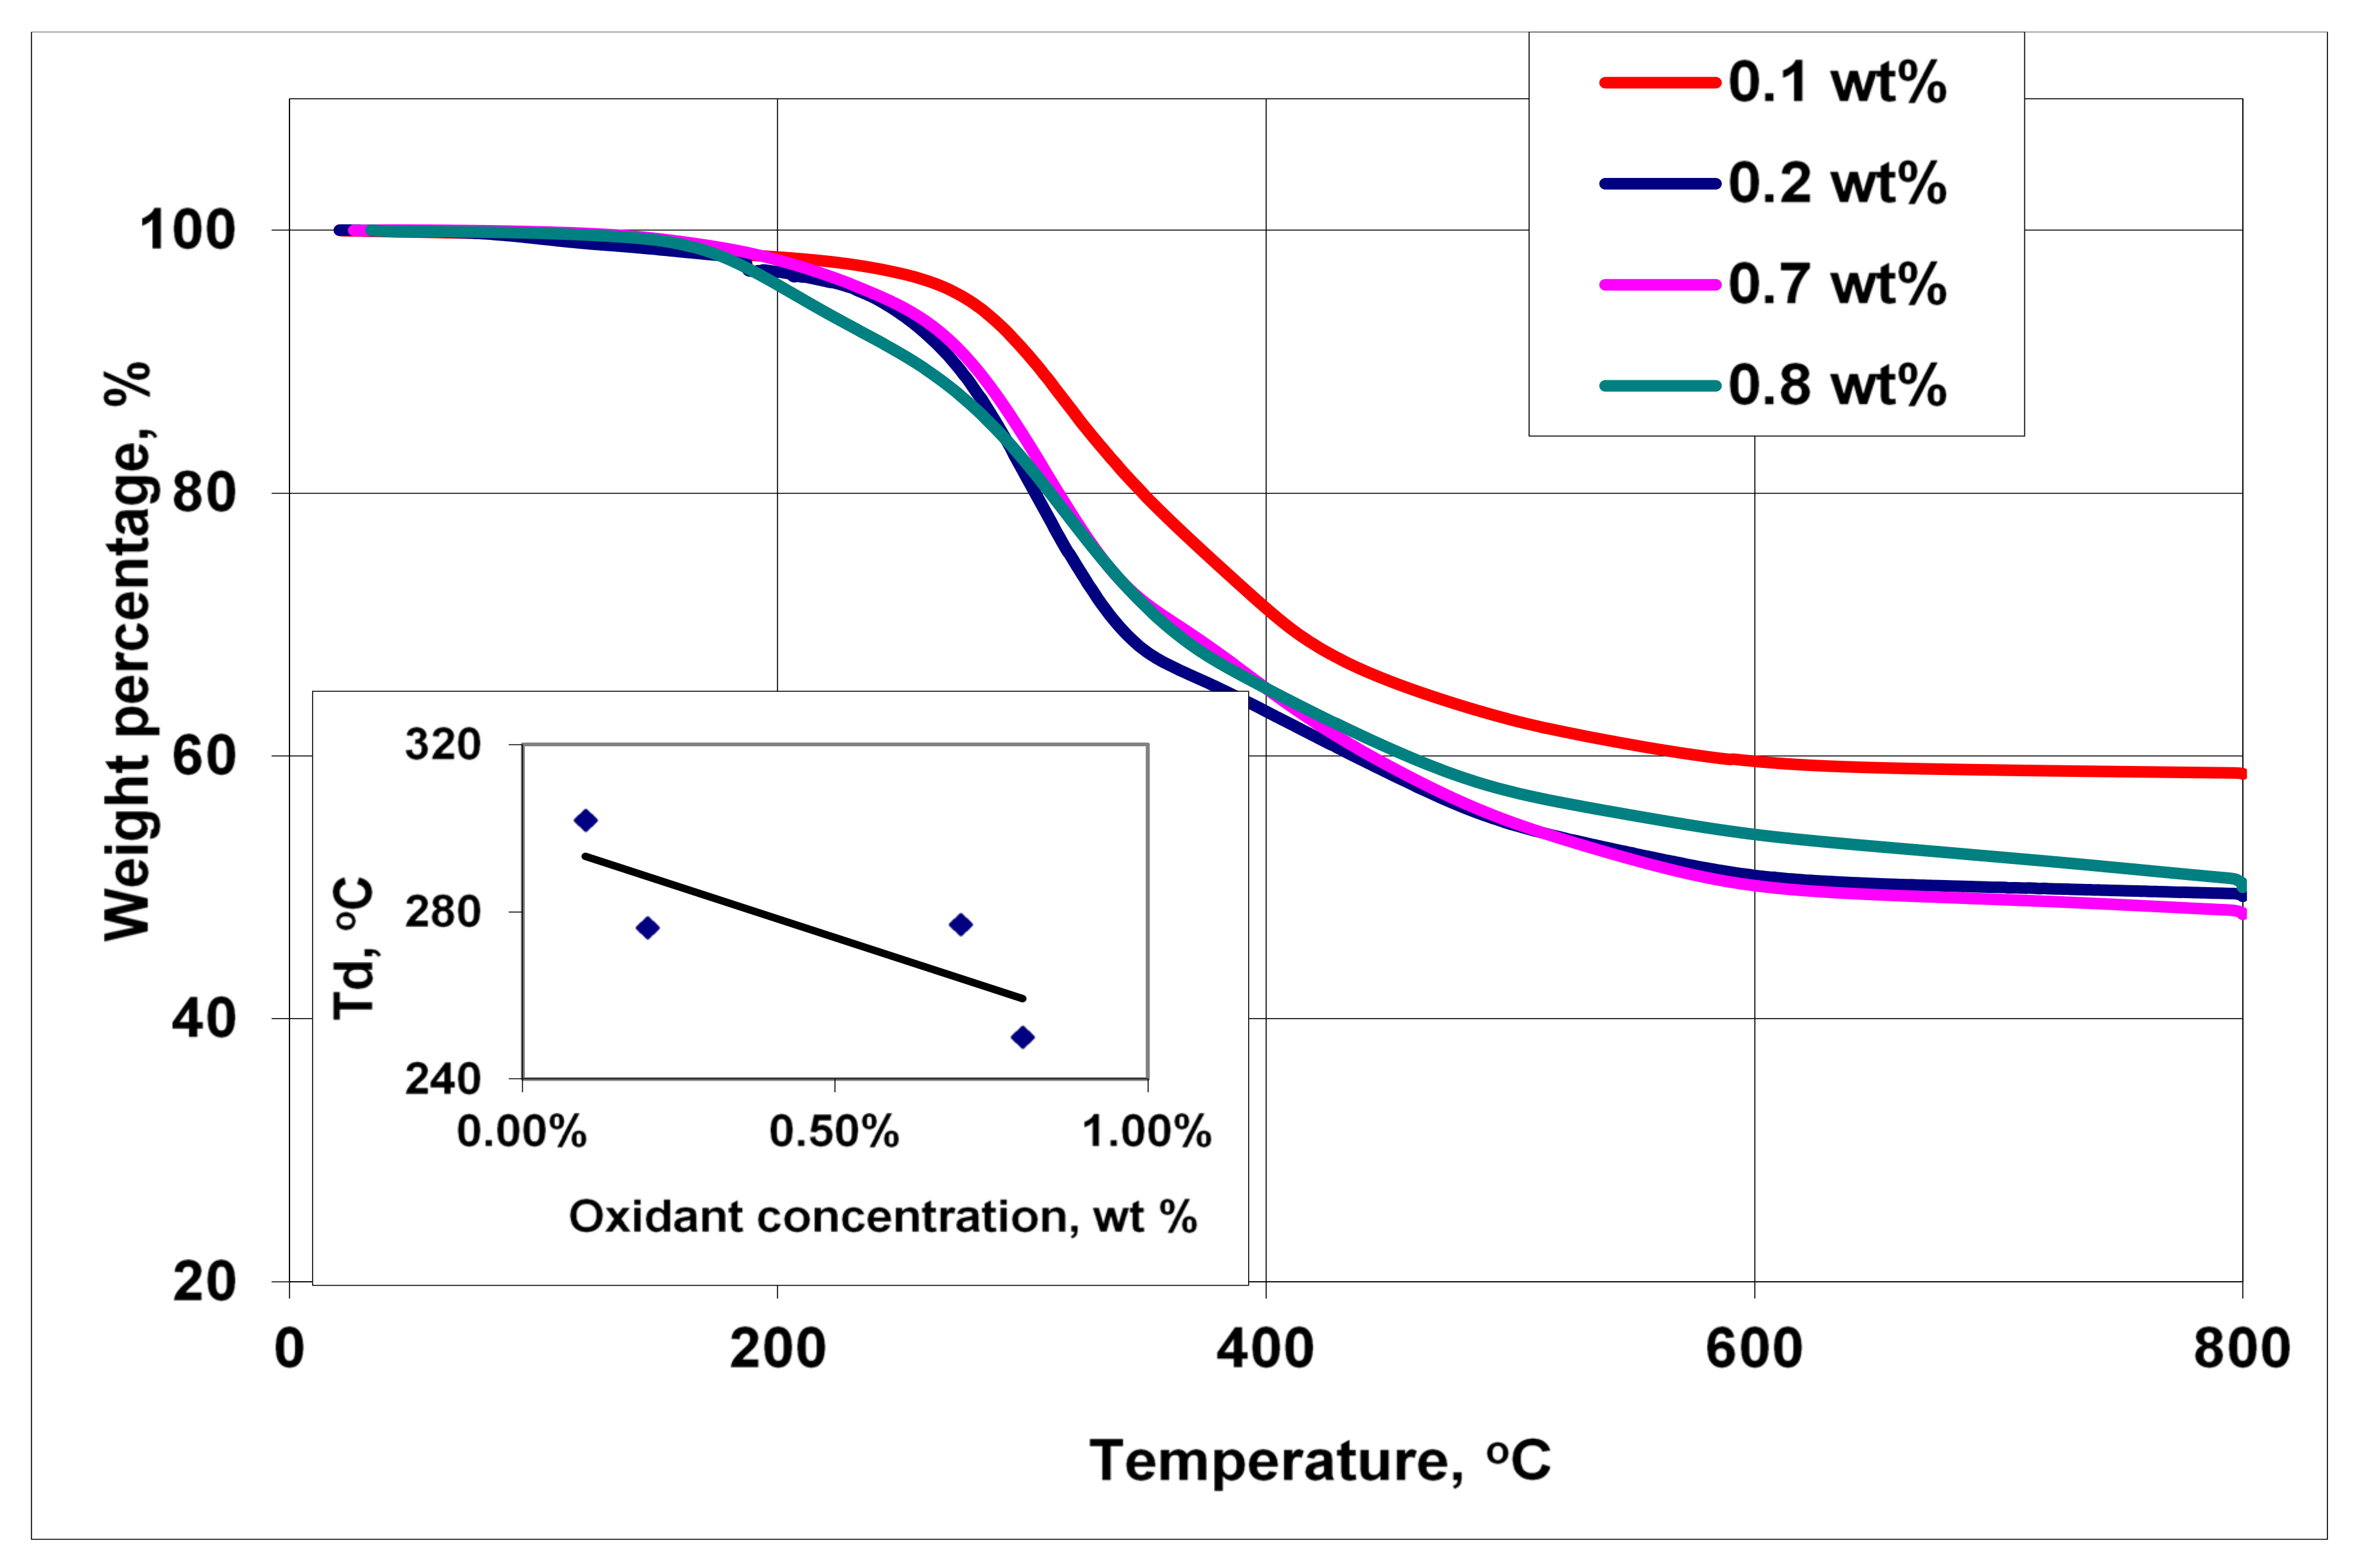
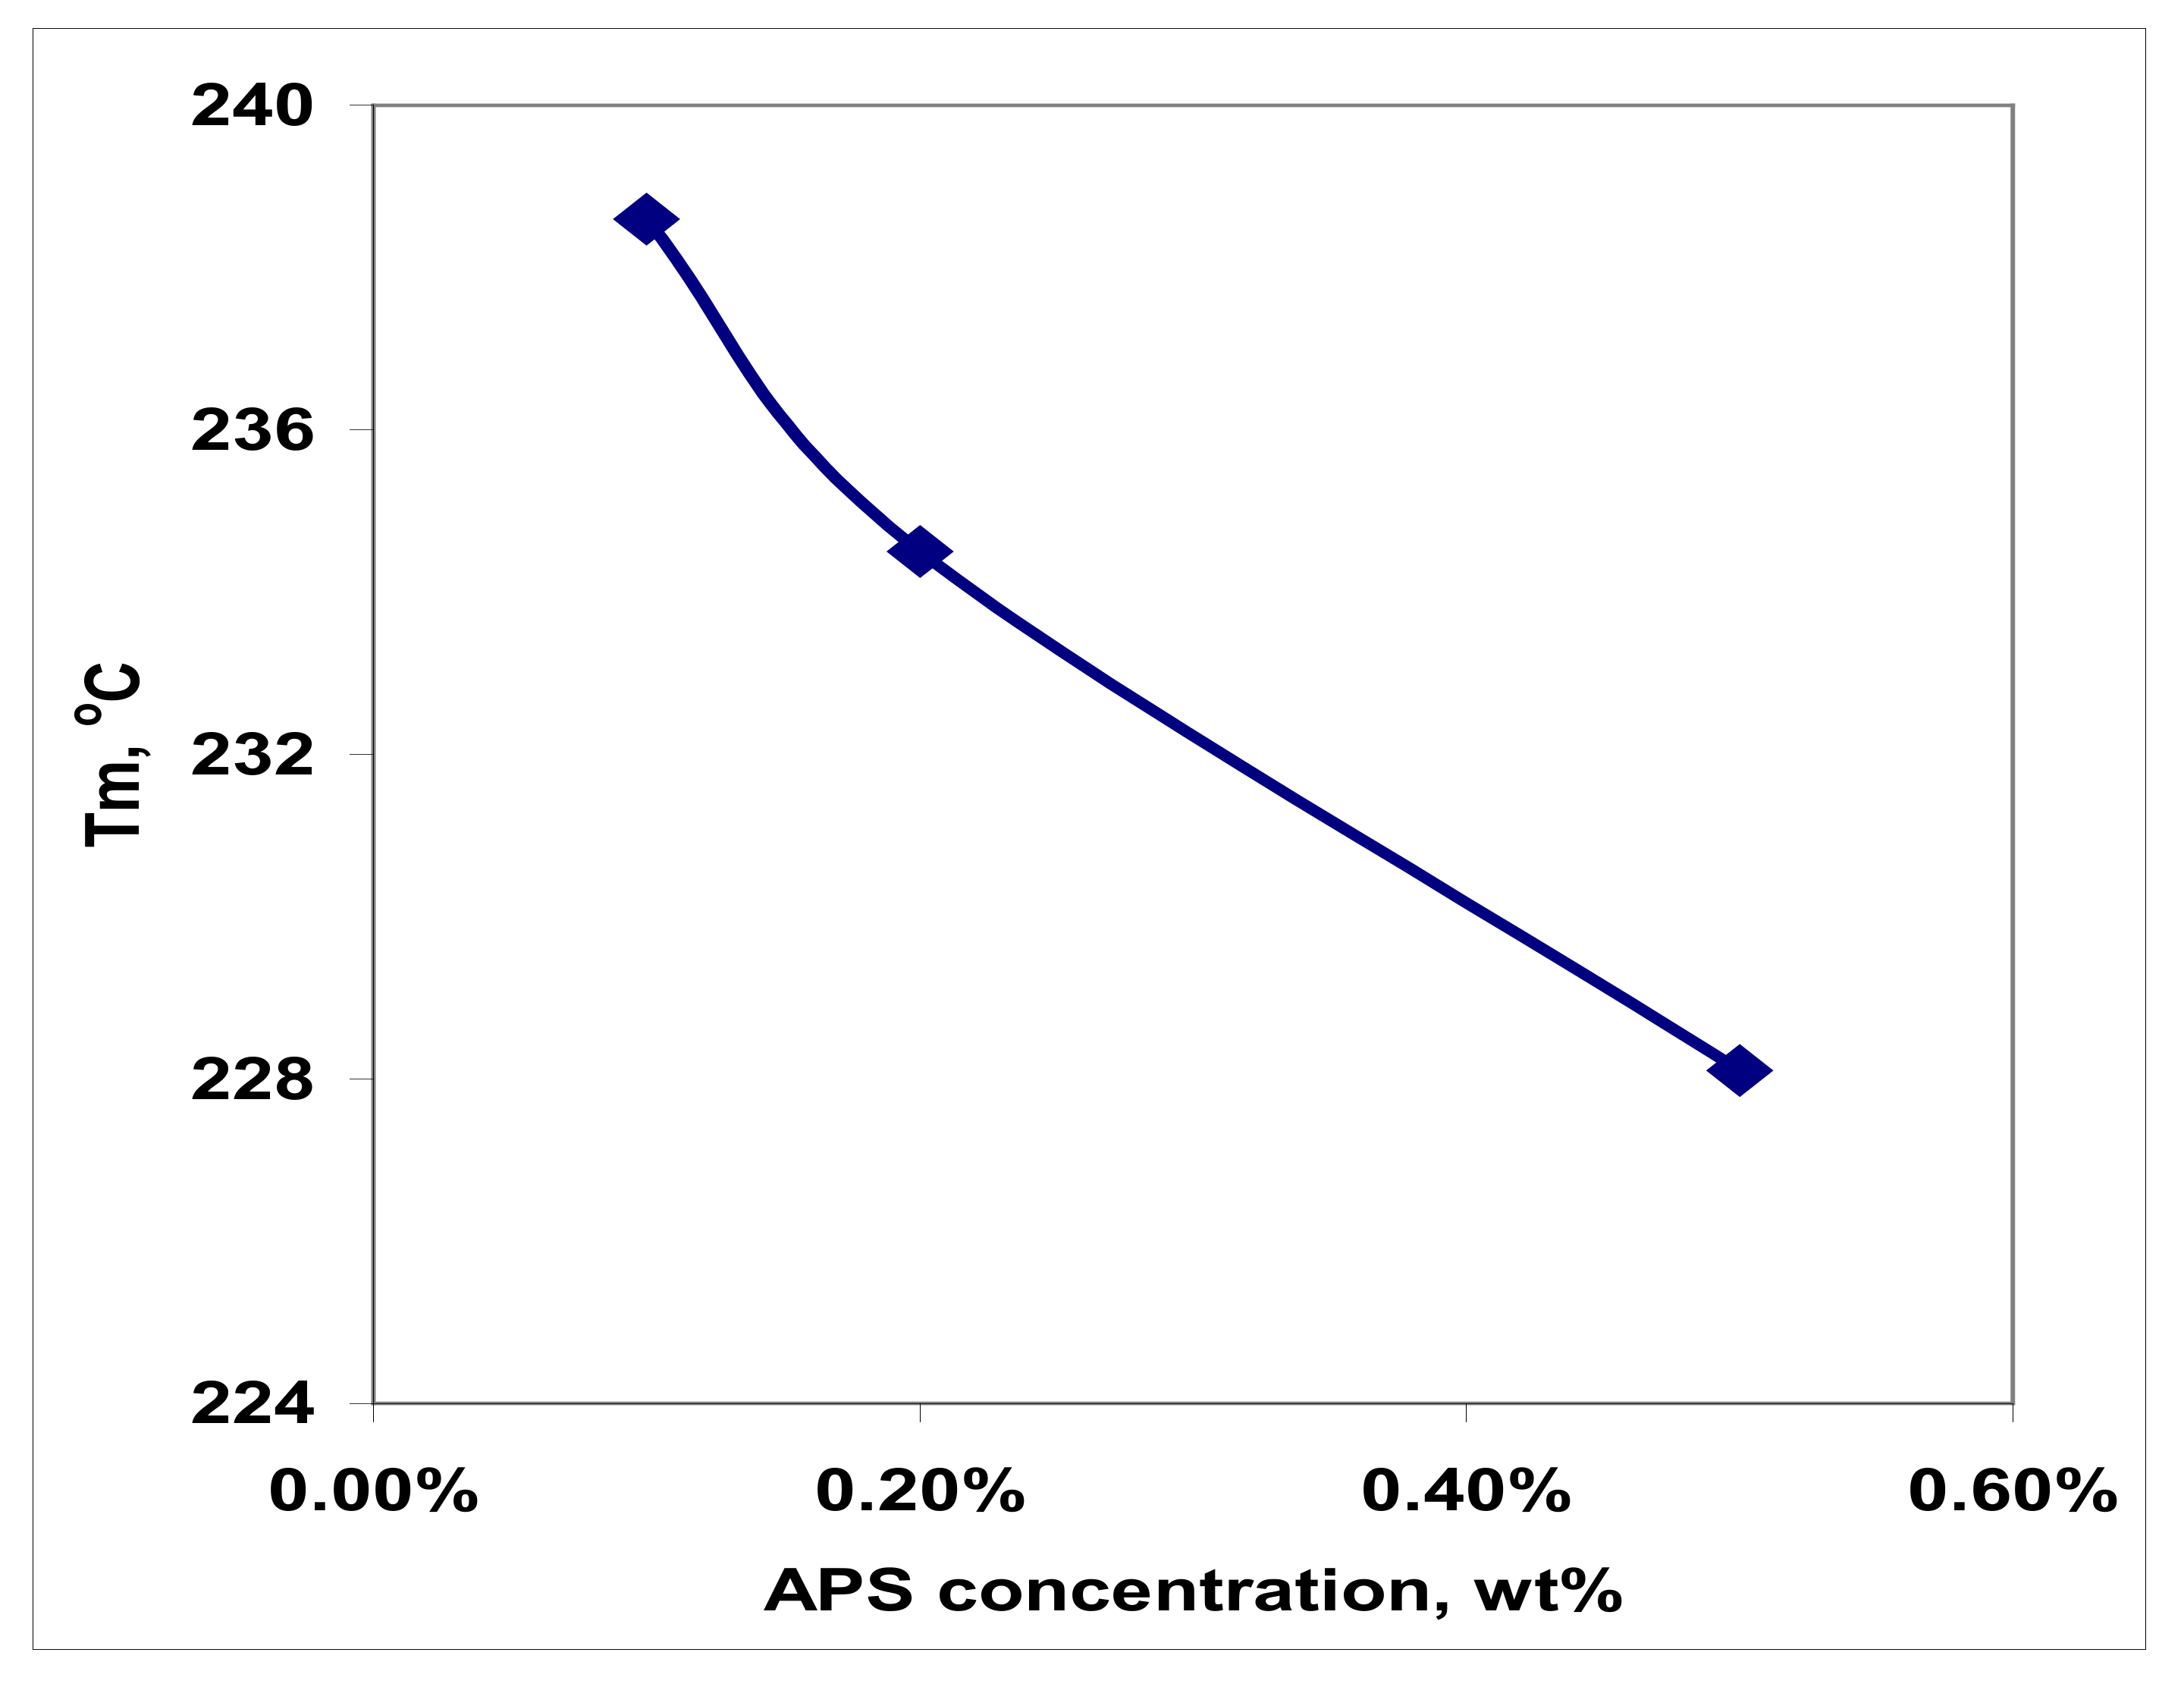
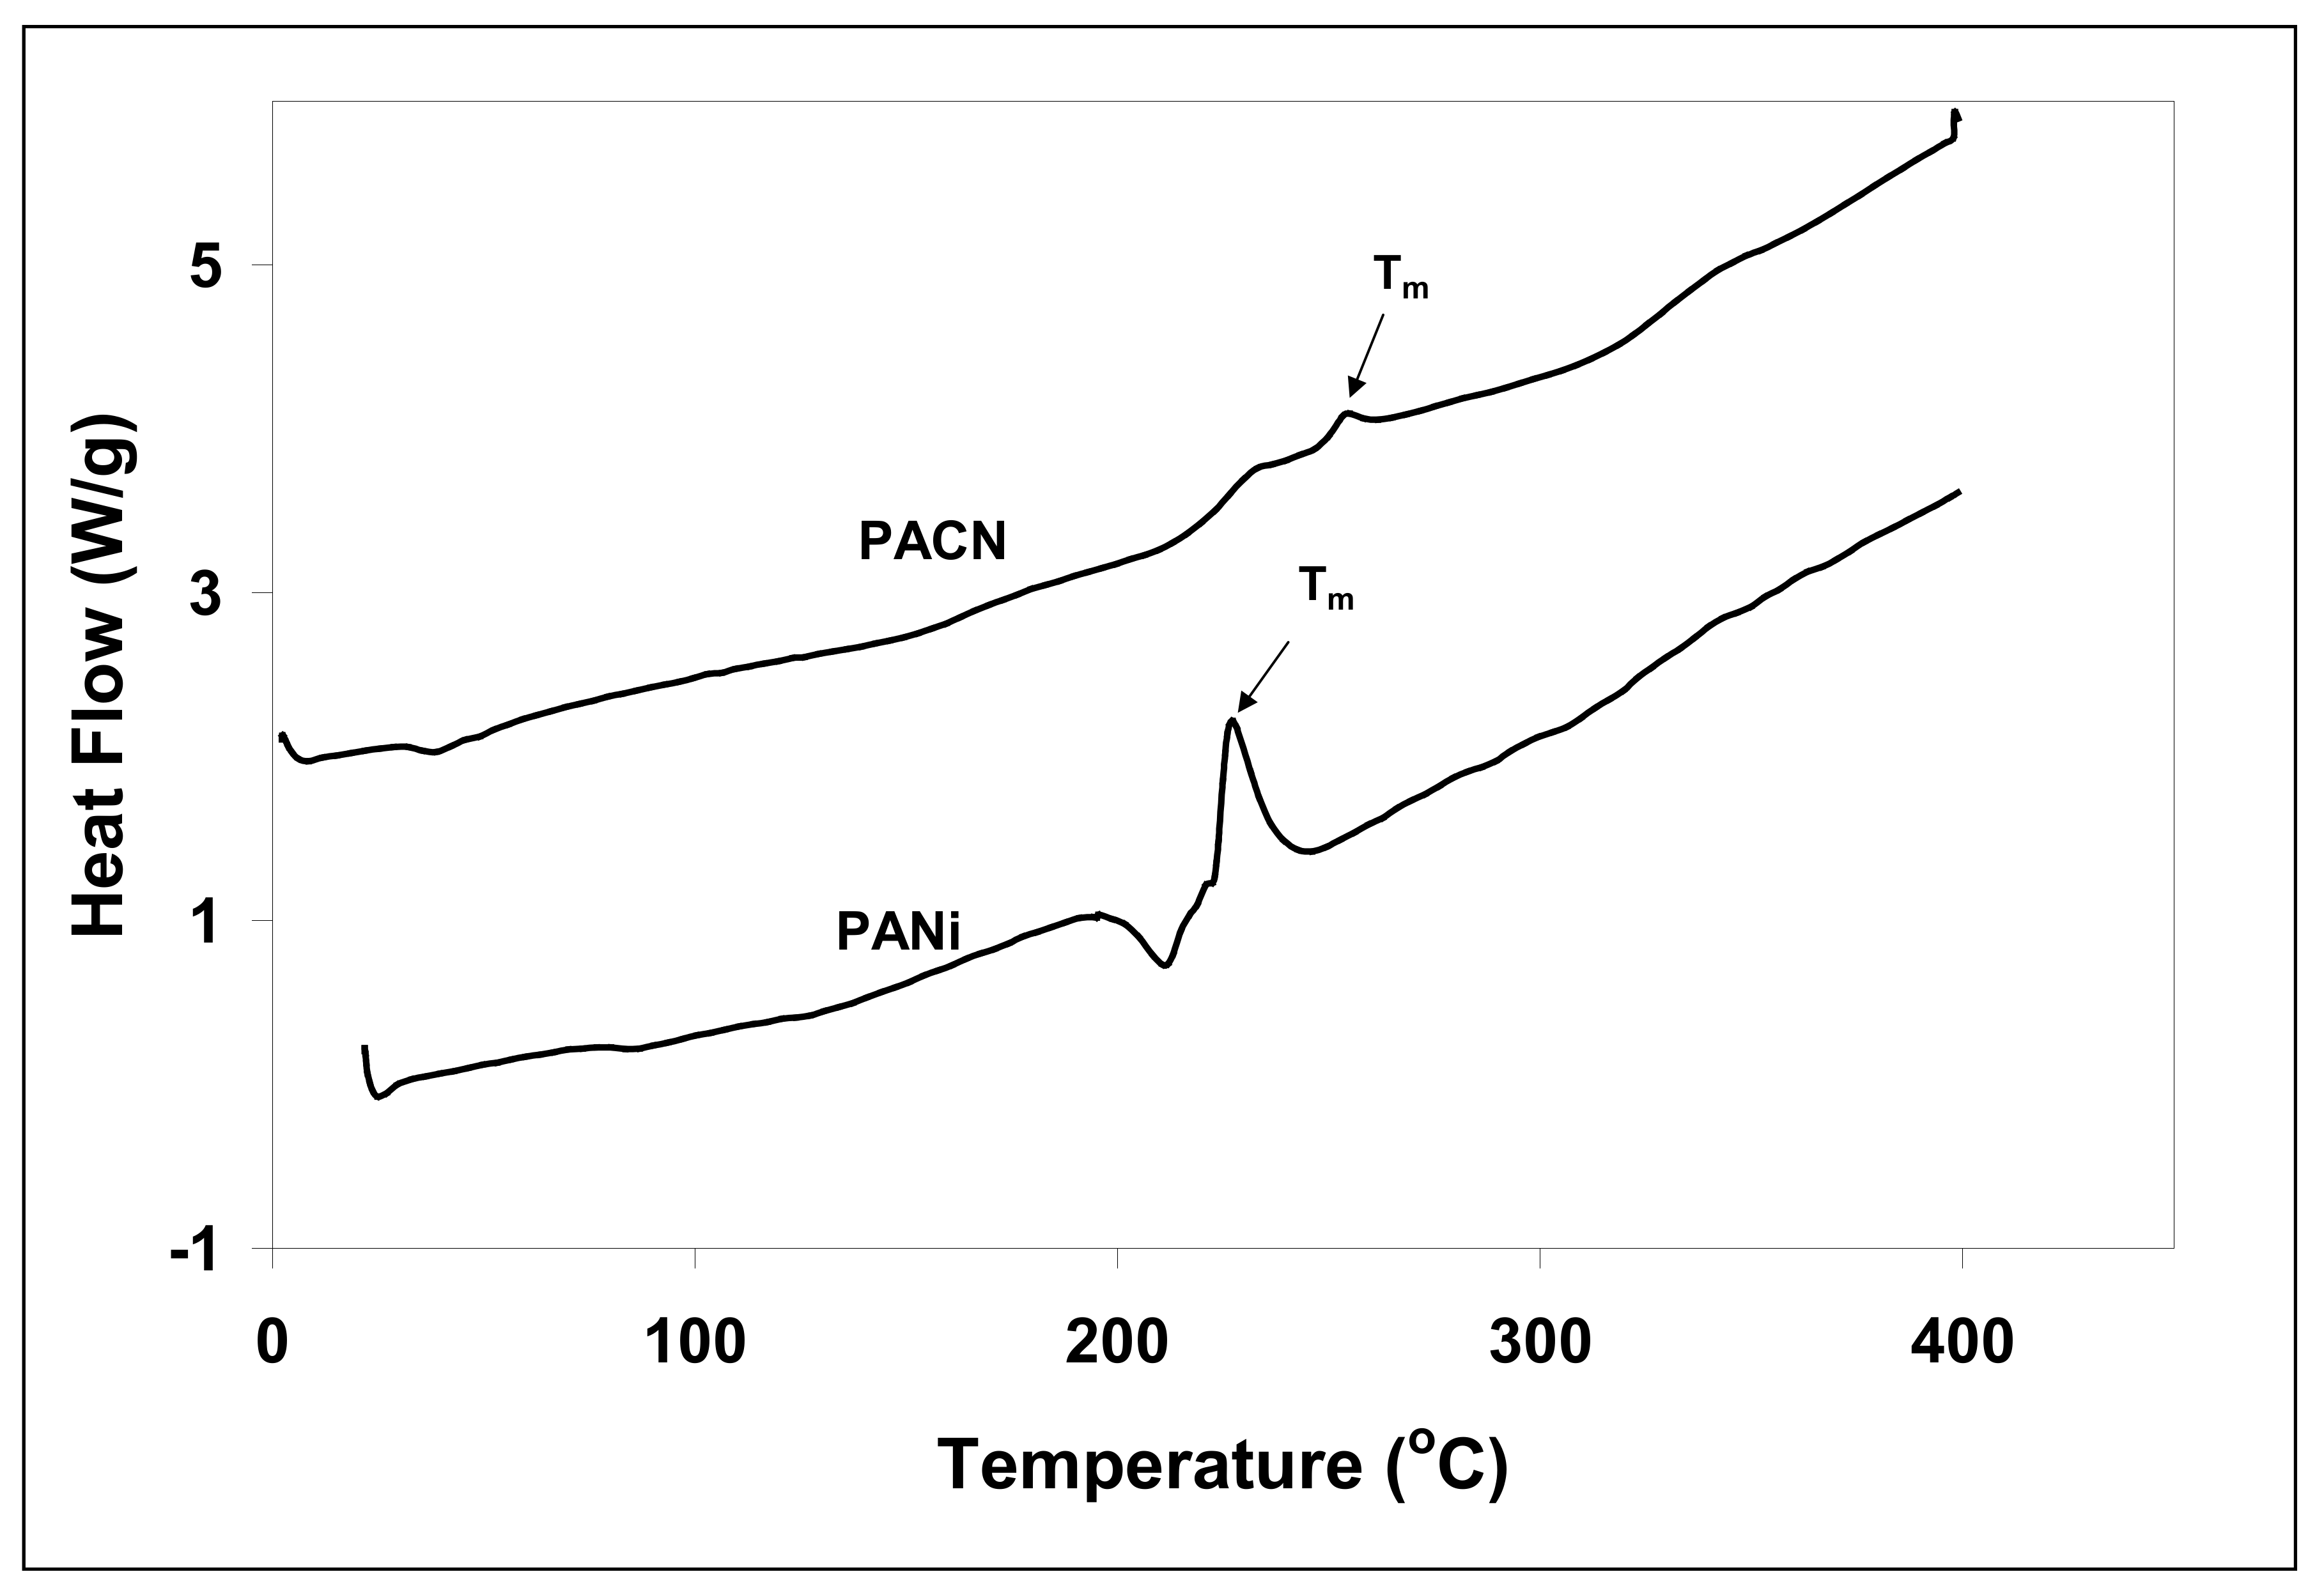
3.4. Thermal Analysis
4. Conclusions
Author Contributions
Funding
Institutional Review Board Statement
Informed Consent Statement
Data Availability Statement
Acknowledgments
Conflicts of Interest
References
- Chow, G.M.; Ovid’ko, I.A.; Tsakalakos, T. (Eds.) Nanostructured Films and Coatings; NATO Science Series, 3; High Technology; Springer Science & Business Media: Berlin/Heidelberg, Germany, 2012; Volume 78. [Google Scholar]
- Wijeratne, W.M.K.T.; Rajapakse, R.M.G.; Wijeratne, S.; Velauthamurty, K. Thermal properties of montmorillonite-polyaniline nanocomposites. J. Compos. Mater. 2011, 46, 1335–1343. [Google Scholar] [CrossRef]
- Bekri-Abbes, I.; Srasra, E. Electrical and Dielectric Properties of Polyaniline and Polyaniline/Montmorillonite Nanocomposite Prepared by Solid Reaction Using Spectroscopy Impedance. J. Nanomater. 2015, 2015, 516902. [Google Scholar] [CrossRef] [Green Version]
- Krishnamoorti, R.; Vaia, R.A.; Giannelis, E.P. Structure and Dynamics of Polymer-Layered Silicate Nanocomposites. Chem. Mater. 1996, 8, 1728. [Google Scholar] [CrossRef]
- Burnside, S.D.; Giannelis, E.P. Nanostructure and Properties of Polysiloxane-Layered Silicate Nanocomposites. J. Polym. Sci. B 2000, 38, 1595. [Google Scholar] [CrossRef]
- Vaia, R.A.; Giannelis, E.P. Lattice Model of Polymer Melt Intercalation in Organically-Modified Layered Silicates. Machomolecules 1997, 30, 7990–7999. [Google Scholar] [CrossRef]
- LeBaron, P.C.; Wang, Z.; Pinnavaia, T.J. Polymer-Layered Silicate Nanocomposites: An Overview. Appl. Clay Sci. 1999, 15, 11–29. [Google Scholar] [CrossRef]
- Kornmann, X.; Lindberg, H.; Berglund, L.A. Synthesis of epoxy-clay nanocomposites: Influence of the Nature of the Clay on Structure. Polymer 2001, 42, 1303–1310. [Google Scholar] [CrossRef]
- Lan, T.; Kaviratna, P.D.; Pinnavaia, T.J. Epoxy Self-polymerization in Smectite Clays. J. Phys. Chem. Solids 1996, 57, 1005–1010. [Google Scholar] [CrossRef]
- Fong, H.; Vaia, R.A.; Sanders, J.H.; Lincoln, D.; Vreugdenhil, A.J.; Liu, W.; Bultman, J.; Chen, C. Self Passivation of Polymer Layered Silicate Nanocomposites. Chem. Mater. 2001, 13, 4123–4129. [Google Scholar] [CrossRef]
- Wu, T.M.; Liao, C.S. Polymorphism in Nylon 6/Clay Nanocomposites. Macromol. Chem. Phys. 2000, 201, 2820–2825. [Google Scholar] [CrossRef]
- Wu, Z.; Zhou, C.; Qi, R.; Zhang, H. Synthesis and Characterization of Nylon 1012/Clay Nanocomposite. J. Appl. Polym. Sci. 2002, 83, 2403–2410. [Google Scholar] [CrossRef]
- Delozier, D.M.; Orwoll, R.A.; Cahoon, J.F.; Johnston, N.J. Preparation and Characterization of Polyimide/Organoclay Nanocomposites. Polymer 2002, 43, 813–822. [Google Scholar] [CrossRef]
- Liang, Z.; Yin, J.; Xu, H. Polyimide/Montmorillonite Nanocomposites Based on Thermally Stable Rigid-Rod Aromatic Amine Modifiers. Polymer 2003, 44, 1391–1399. [Google Scholar] [CrossRef]
- Chen, T.K.; Tien, T.I.; Wei, K.H. Synthesis and Characterization of Novel Segmented Polyurethane/Clay Nanocomposites via Poly (ε-caprolactone)/Clay. J. Polym. Sci. Part A Polym. Chem. 1999, 37, 2225–2233. [Google Scholar] [CrossRef]
- Kodaire, P.; Kalgaonkar, R.; Hambir, S.; Bulakh, N.; Jog, J.P. PP/Clay Nanocomposites: Effect of Clay Treatment on Morphology and Dynamic Mechanical Properties. J. Appl. Polym. Sci. 2001, 81, 1786–1792. [Google Scholar]
- Shakoor, A.; Rizvi, T.Z.; Farooq, H.U.; Hassan, N.; Majid, A.; Saeed, M.; Farooq, M. Structural and Electrical Properties of Doped Polypyrrole and its Composite with Montmorillonite Clay. Polym. Sci. Ser. A 2013, 55, 279–284. [Google Scholar] [CrossRef]
- Tokarsky, J.; Peikertova, P.; Kulhankova, L.; Kutlakova, K.M.; Neuwirthova, L. Functional Nanocomposites of Montmorillonite with Conducting Polyaniline. Clay Miner. 2015, 50, 341–351. [Google Scholar] [CrossRef]
- Kazim, S.; Ahmad, S.; Pfleger, J.; Plestil, J.; Joshi, Y.M. Polyaniline-Sodium Montmorillonite ClayNanocomposites: Effect of Clay Concentration on Thermal, Structural and Electrical Properties. J. Mater. Sci. 2012, 47, 420–428. [Google Scholar] [CrossRef]
- Theng, B.K.G. The Chemistry of Clay-Organic Reactions; Adam Hilger Ltd., Rank Precision Industries: London, UK, 1974. [Google Scholar]
- Zhu, Y.; Iroh, J.O. Electrochemical Synthesis of Polyaniline Films in the Presence of Inorganic Fillers and Their Effect on Corrosion Protection of Al 2024-T3. J. Adv. Mater. 2002, 34, 16–21. [Google Scholar]
- Kim, J.W.; Liu, F.; Choi, H.J.; Hong, S.H.; Joo, J. Intercalated Polypyrrole/Na+-Montmorillonite Nanocomposite Via An Inverted Emulsion Pathway Method. Polymer 2003, 44, 289–293. [Google Scholar] [CrossRef]
- Wu, Q.; Xue, Z.; Qi, Z.; Wang, F. Synthesis and Characterization of PAn/Clay Nanocomposite with Extended Chain Conformation of Polyaniline. Polymer 2000, 41, 2029–2032. [Google Scholar] [CrossRef]
- Kim, B.H.; Jung, J.H.; Hong, S.H.; Kim, J.W.; Choi, H.J.; Joo, J. Physical Characterization of Emulsion Intercalated Polyaniline-Clay Nanocomposite. Curr. Appl. Phys. 2001, 1, 112–115. [Google Scholar] [CrossRef]
- Kim, B.; Jung, J.; Hong, S.; Joo, J.; Epstein, A.J.; Mizoguchi, K.; Kim, J.W.; Choi, H.J. Nanocomposites of Polyaniline and Na+-Montmorillonite Clay. Macromolecules 2002, 35, 1419–1423. [Google Scholar] [CrossRef]
- Yeh, J.; Liou, S.; Lai, C.; Wu, P.; Tsai, T. Enhancement of Corrosion Protection Effect in Polyaniline Via the Formation of Polyaniline-Clay Nanocomposite Materials. Chem. Mater. 2001, 13, 1131–1136. [Google Scholar] [CrossRef]
- Jia, W.; Segal, E.; Kornemandel, D.; Lamhot, Y.; Narkis, M.; Siegmann, A. Polyaniline-DBSA/Organophilic Clay Nanocomposites: Synthesis and Characterization. Synth. Met. 2002, 128, 115–120. [Google Scholar] [CrossRef]
- Zeng, Q.H.; Wang, D.Z.; Yu, A.B.; Lu, G.Q. Synthesis of Polymer-Montmorillonite Nanocomposites by In-situ Intercalation Polymerization. Nanotechnology 2002, 13, 549–553. [Google Scholar] [CrossRef]
- Yamabe, K.; Goto, H. Synthesis and Surface Observation of Montmorillonite/Polyaniline Composites. J. Compos. Sci. 2018, 2, 15. [Google Scholar] [CrossRef] [Green Version]
- Zehhaf, A.; Morallon, E.; Benyoucef, A. Polyaniline/Montmorillonite Nanocomposites Obtained by In-situ Intercalation and Oxidative Polymerization in Cationic Modified-Clay (Sodium, Copper and Iron). J. Inorg. Organomet. Polym. Mater. 2013, 23, 1485–1491. [Google Scholar] [CrossRef] [Green Version]
- Kim, J.W.; Kim, S.G.; Choi, H.J.; Jhon, M.S. Synthesis and Electrorheological Properties of Polyaniline-Na+-Montmorillonite Suspensions. Macromol. Rapid Commun. 1999, 20, 450–452. [Google Scholar] [CrossRef]
- Park, J.H.; Lim, Y.T.; Park, O.O. New Approach to Enhance the Yield Stress of Electro-Rheological Fluids by Polyaniline-Coated Layered Silicate Nanocomposites. Macromol. Rapid Commun. 2001, 22, 616–619. [Google Scholar] [CrossRef]
- Lu, J.; Zhao, X. Electrorheological Properties of a Polyaniline-Montmorillonite Clay Nanocomposite Suspension. J. Mater. Chem. 2002, 12, 2603–2605. [Google Scholar] [CrossRef]
- Yariv, S.; Heller, L.; Kaufherr, N. Effect of Acidity in Montmorillonite Interlayers on the Sorption of Aniline Derivatives. Clays Clay Miner. 1969, 17, 301–308. [Google Scholar] [CrossRef]


| Peak Position (cm−1) | Peak Assignment |
|---|---|
| 2928 and 2854 doublet | CH2 asymmetric stretching (2928 cm−1) and CH2 symmetric stretching |
| 1637 | H–O–H bending |
| 1474 | CH2 plane scissoring |
| 1054 | Silicate Si–O bond stretching |
| 798 | CH out of plane bending |
| 450–600 doublet | Silicate Si–O bond bending and Al–O stretching |
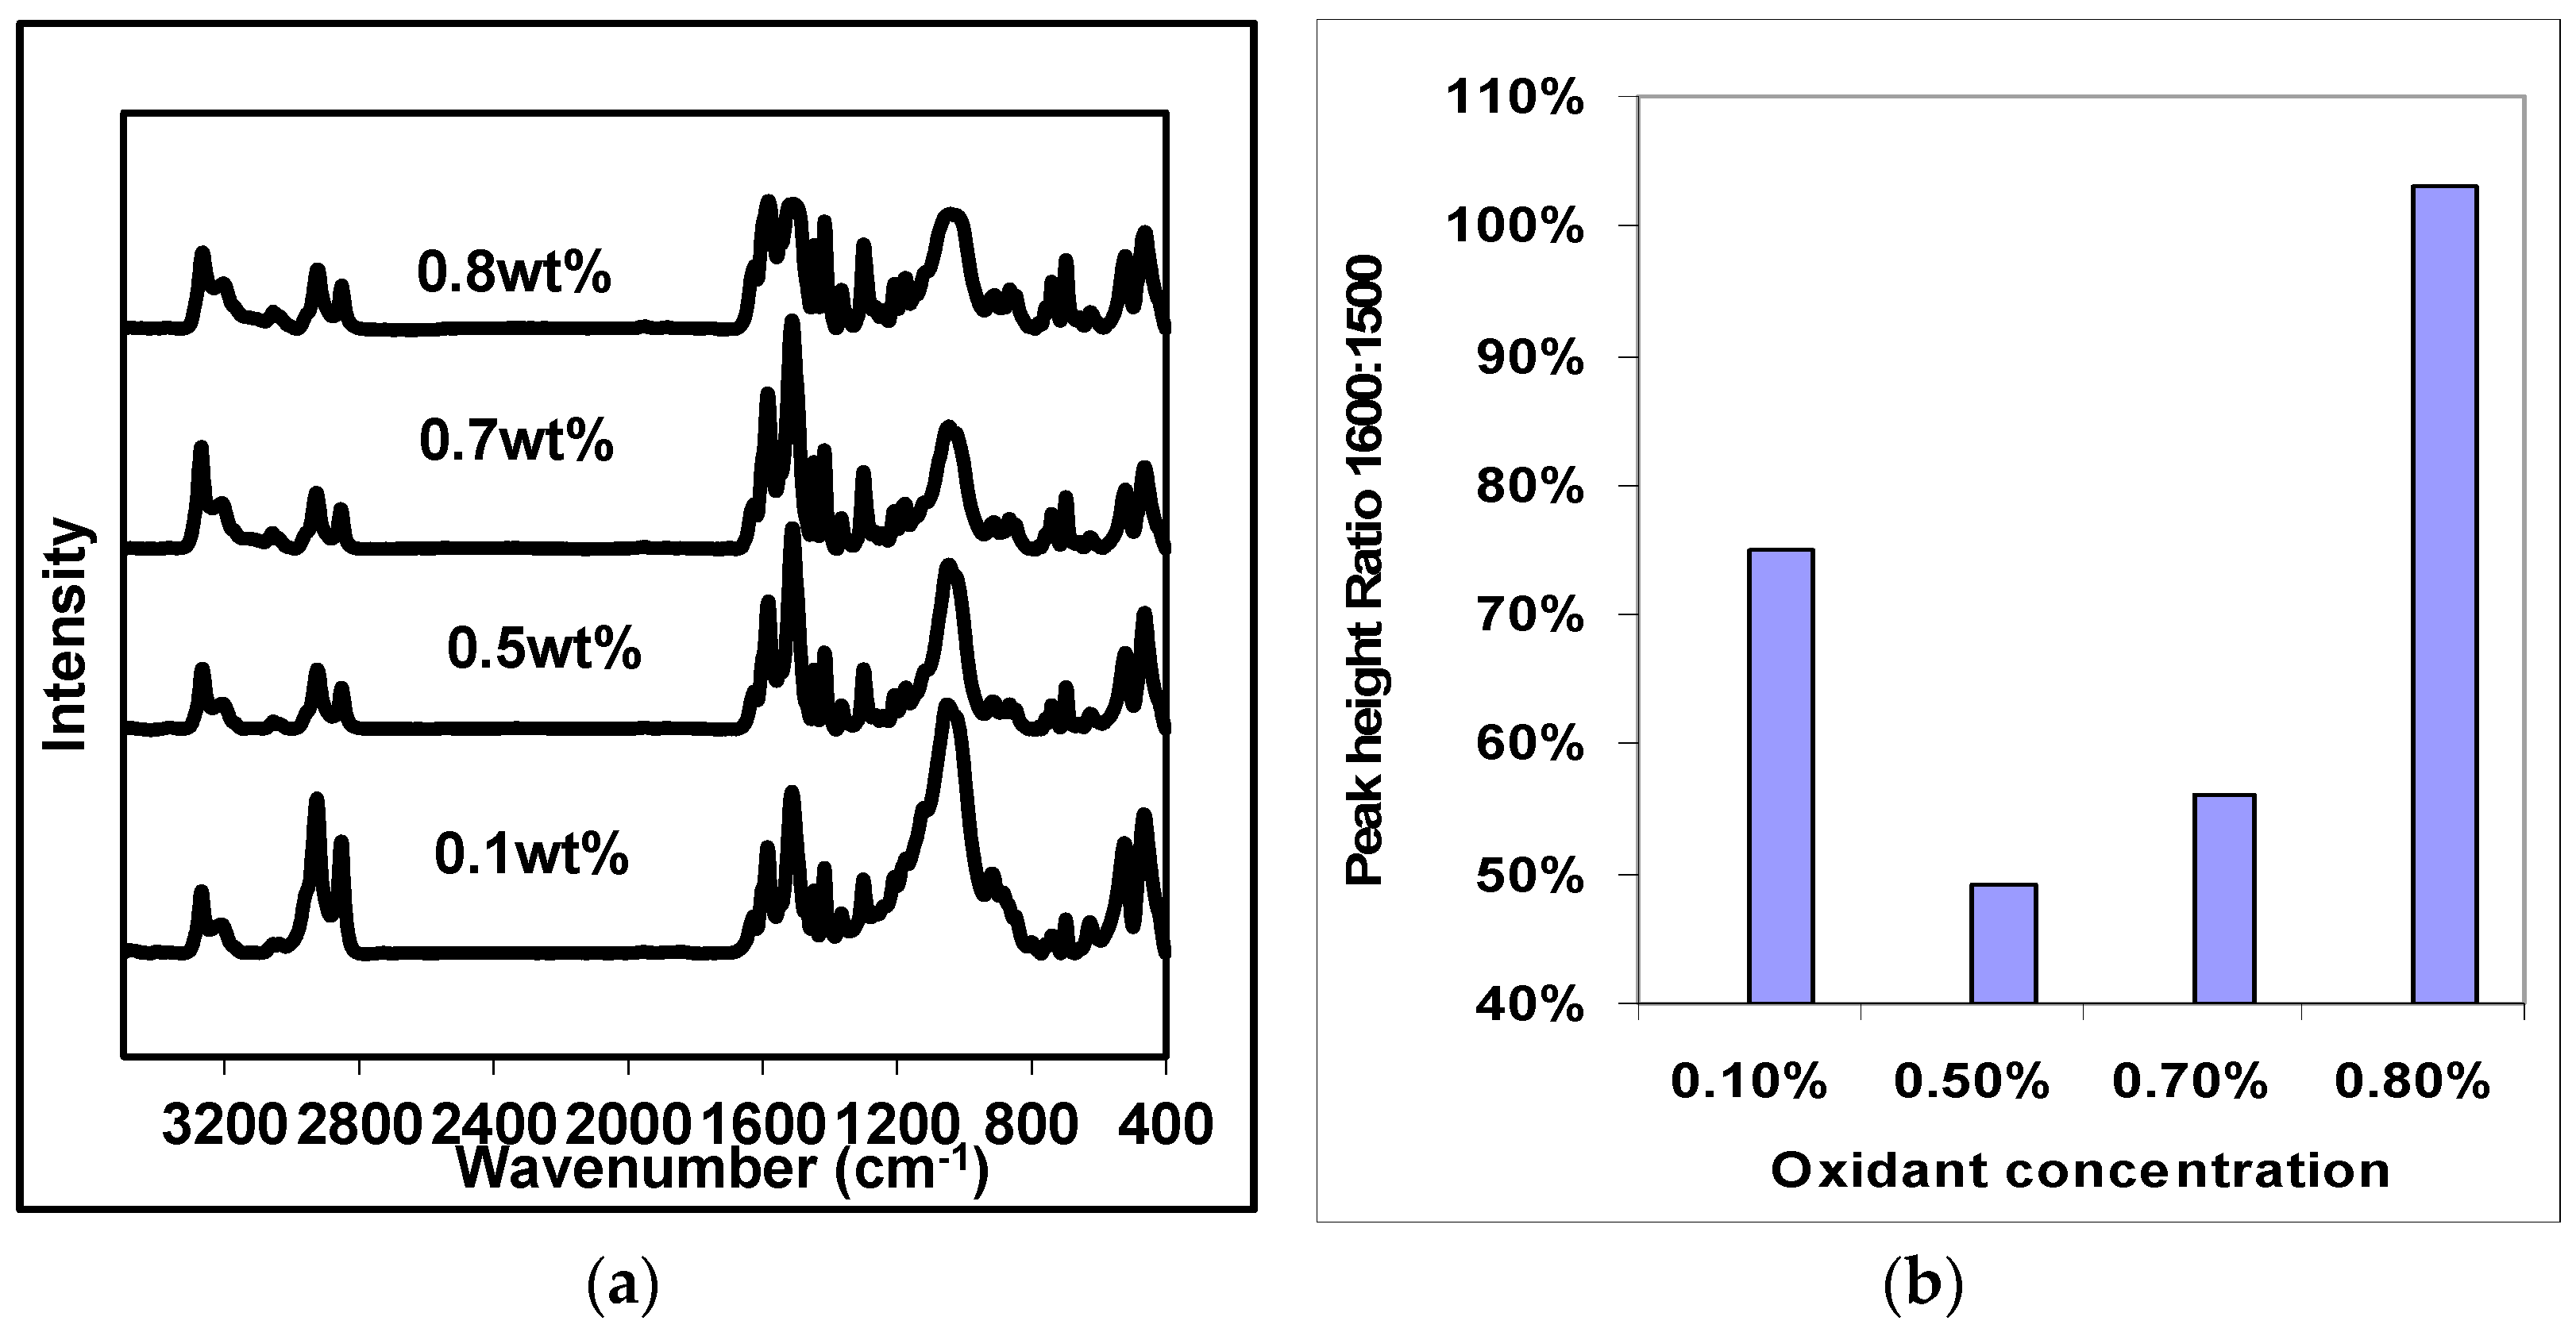
| Peak Position (cm−1) | Peak Assignment |
|---|---|
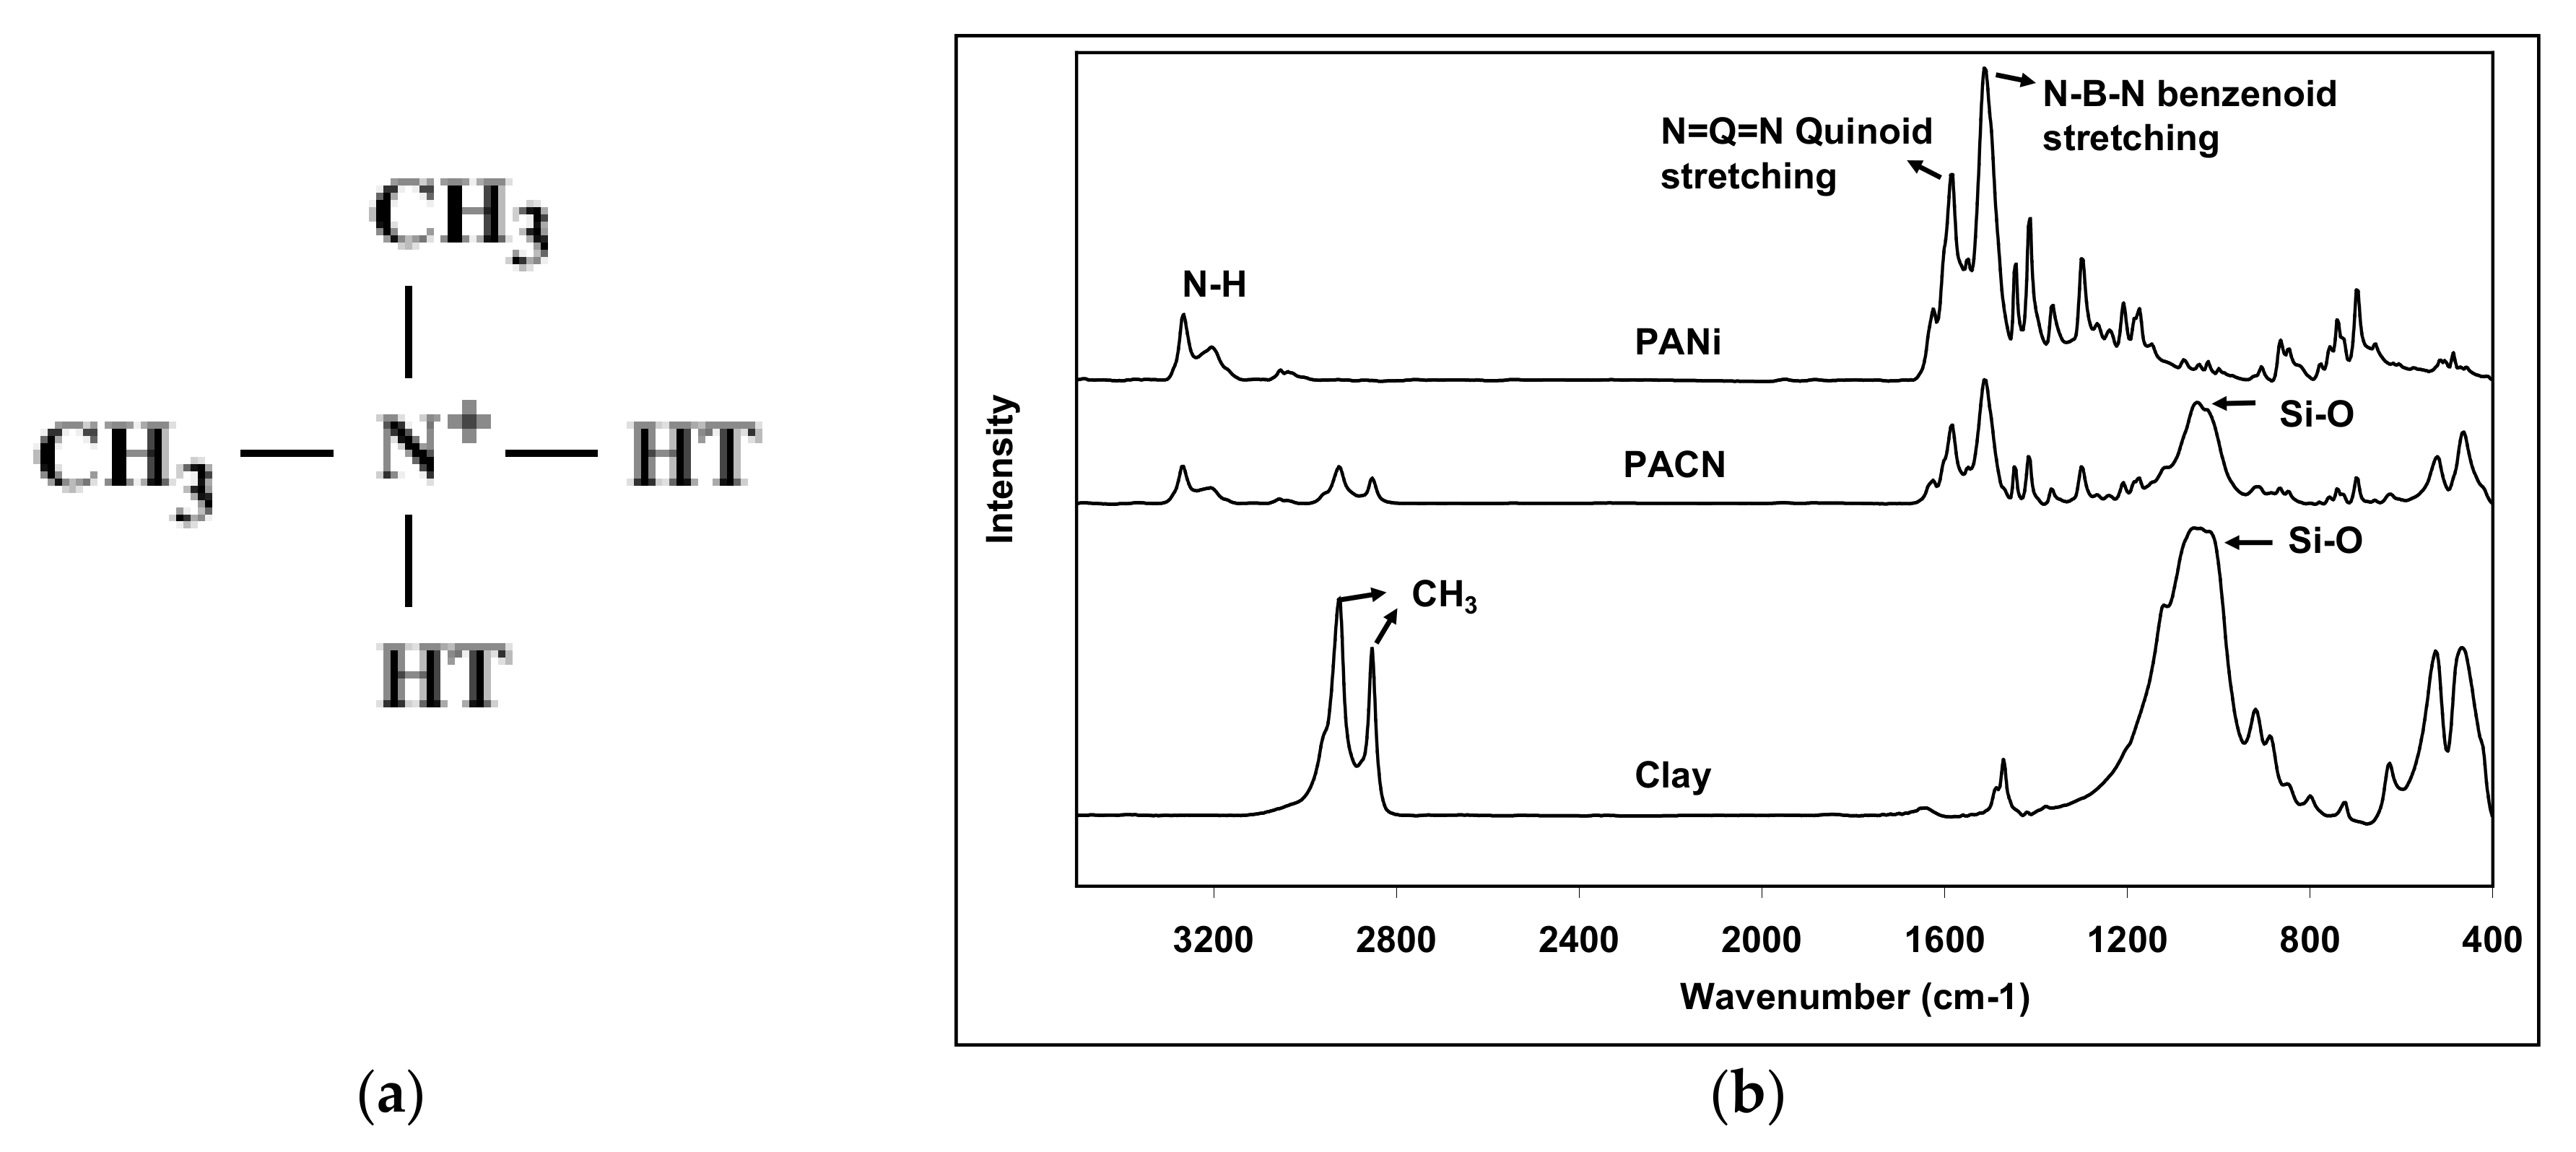
| 3265 and 3200 doublet | Secondary amine |
| 1584 | N=Q=N quinoid ring stretching |
| 1511 | N=B=N benzenoid ring stretching |
| 1300 | N–H deformation |
| 850 | C–H ring hydrogen |
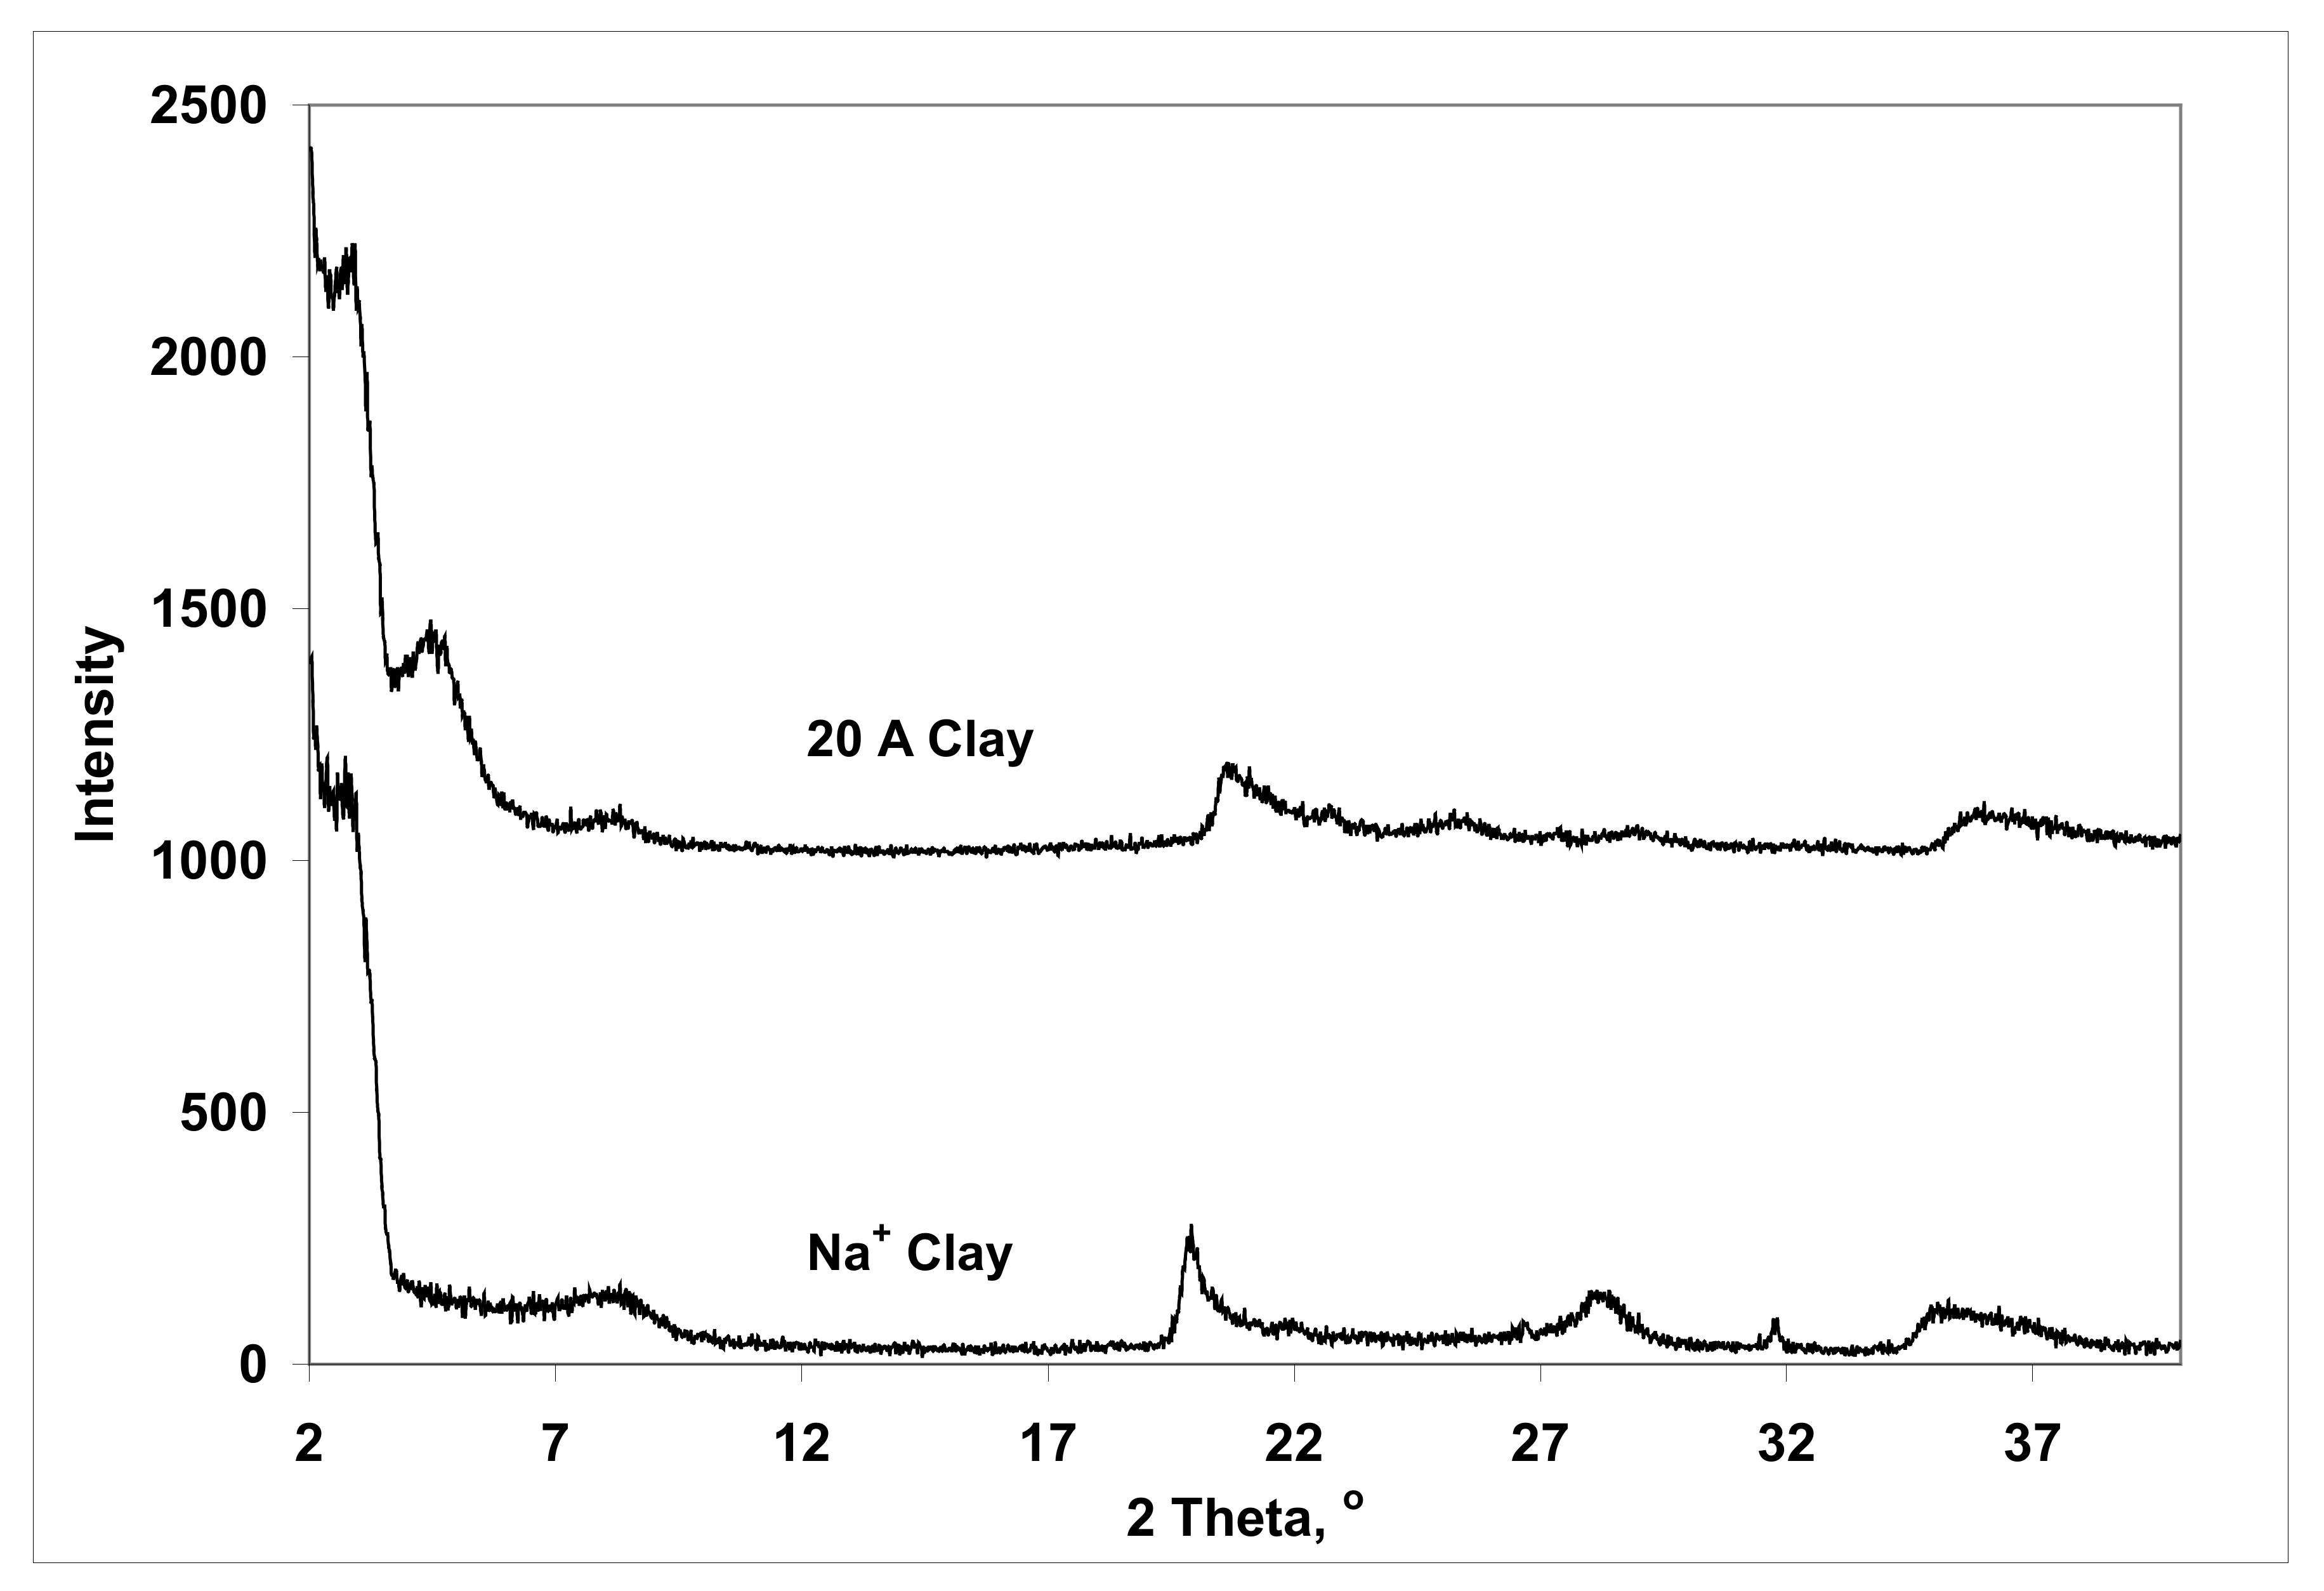
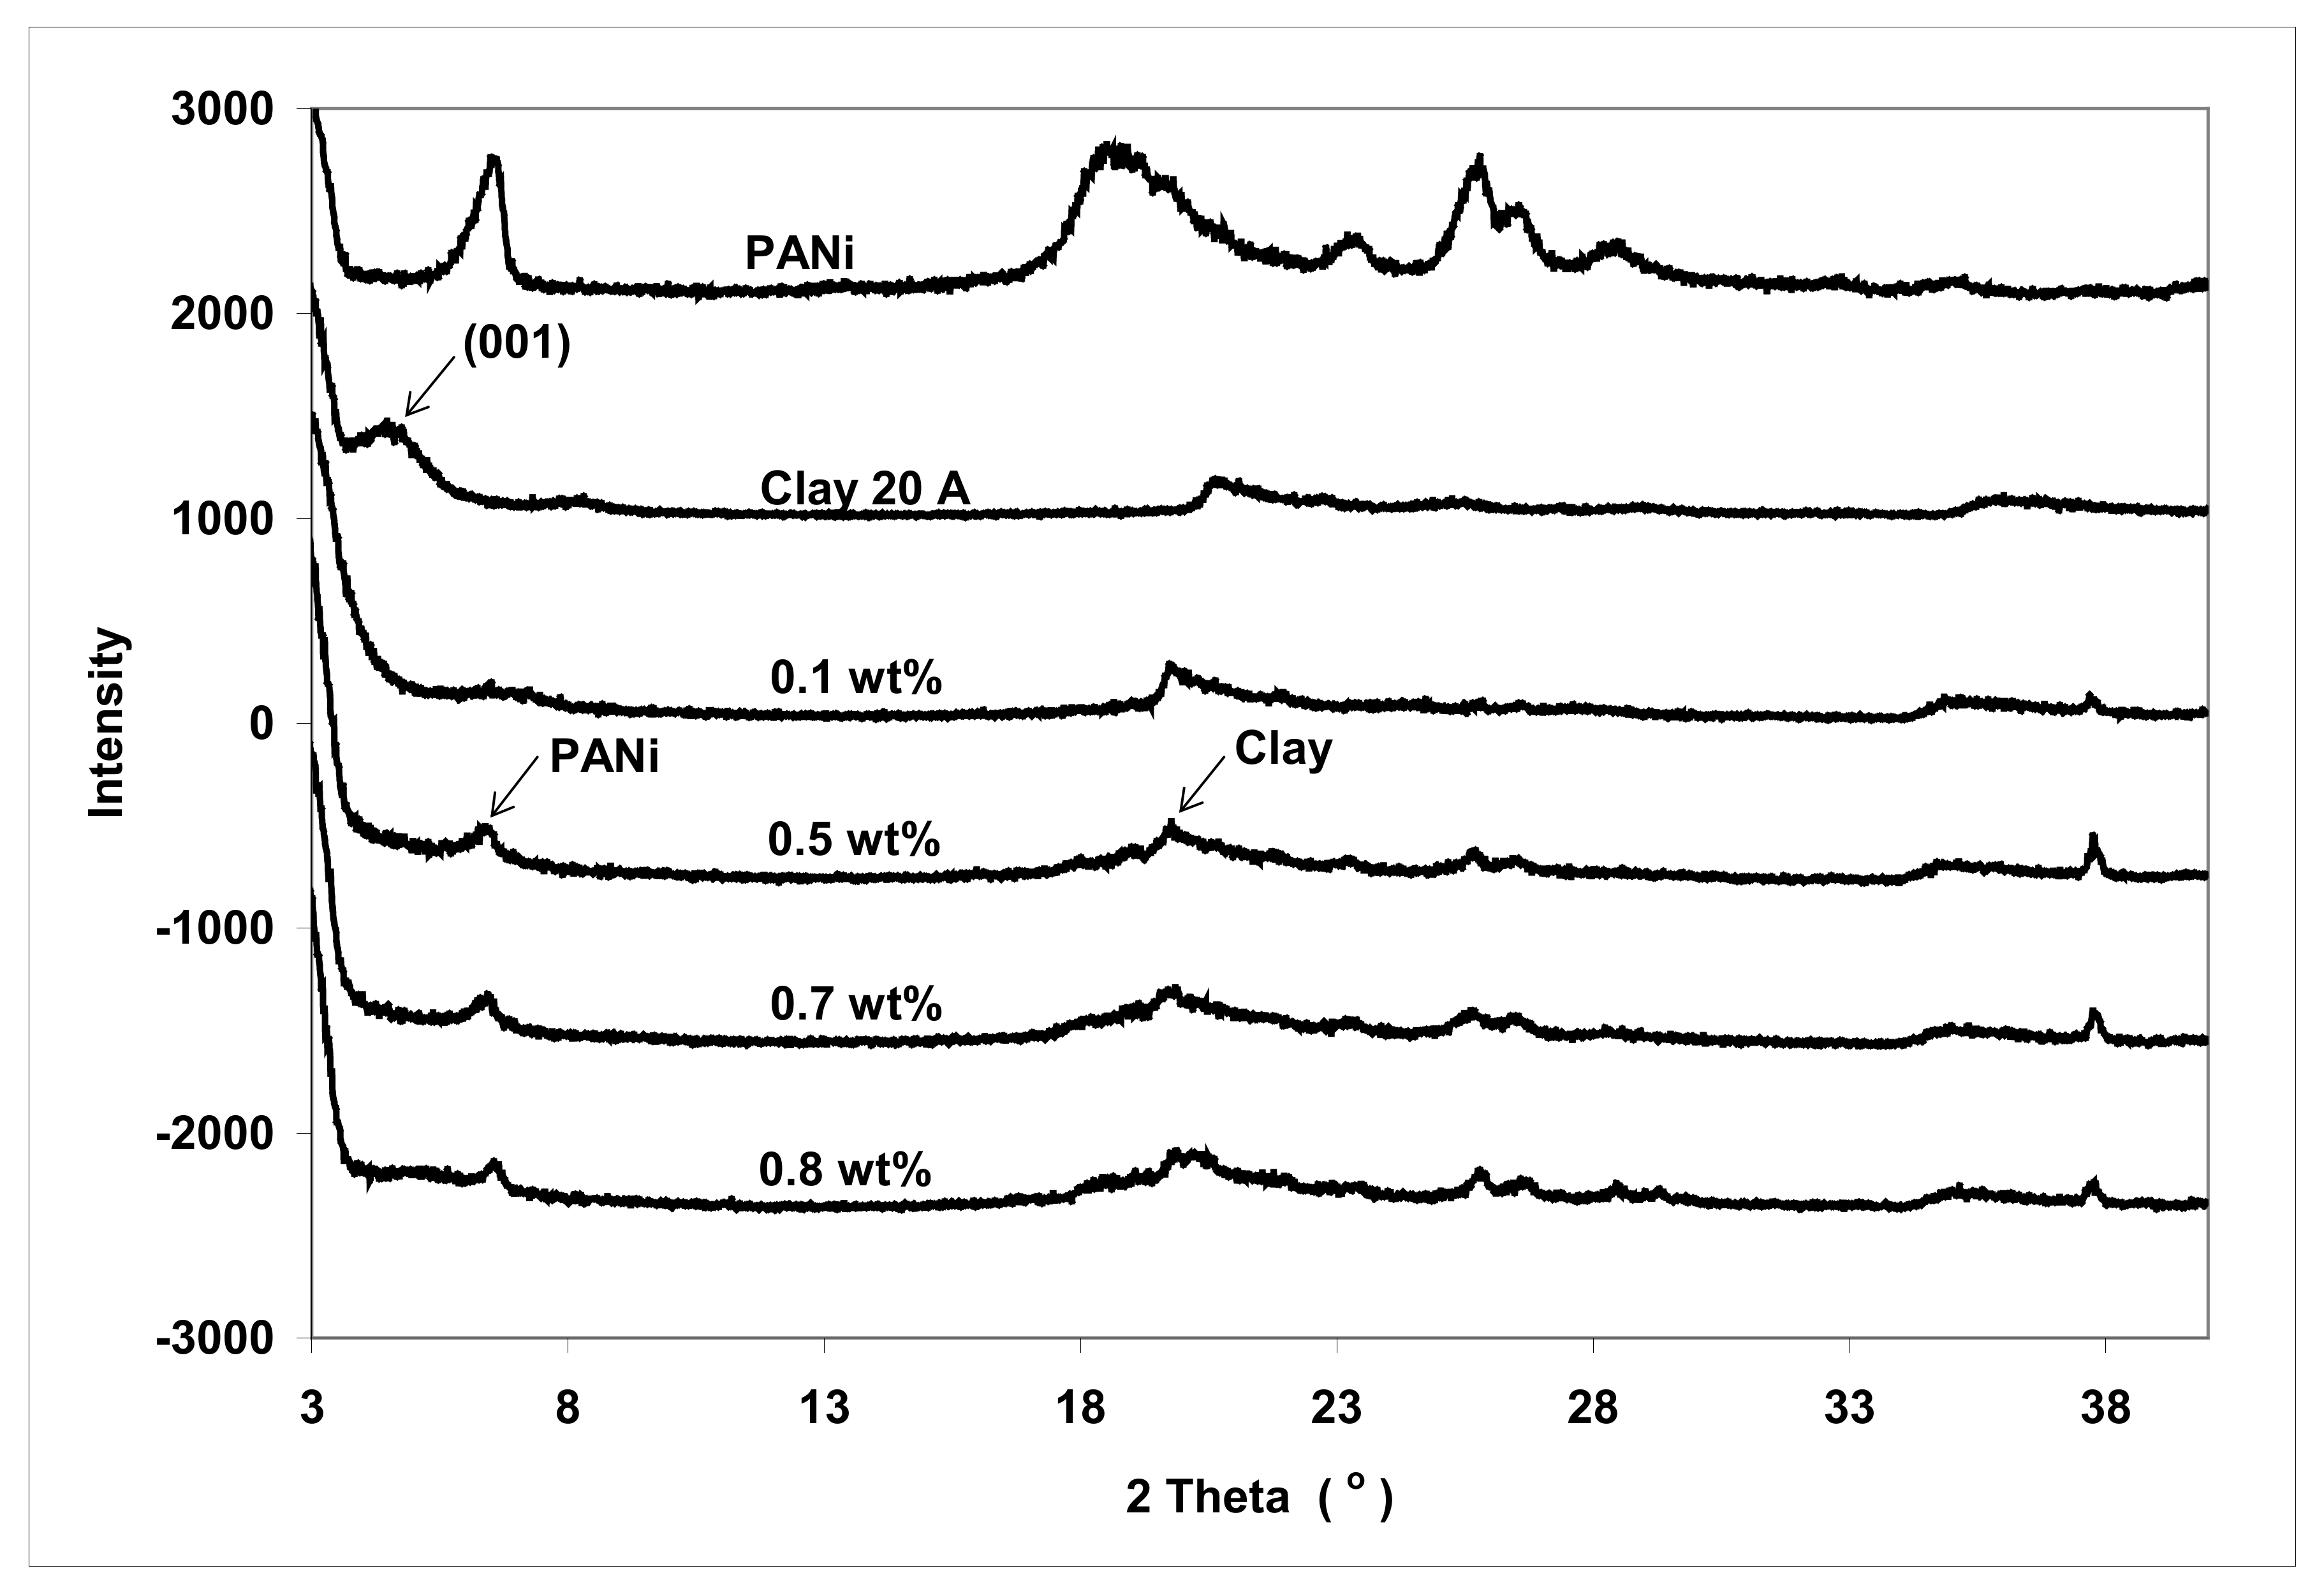
| Sample | 2 Theta Peak (°) | d-Spacing (Ǻ) |
|---|---|---|
| Na+ clay | 8.49 | 10.4 |
| 20 A clay | 4.57 | 19.3 |
| PACN#1 | >2 | >44.1 |
| PACN #4 | >2 | >44.1 |
| PACN#5 | >2 | >44.1 |
| PACN#6 | >2 | >44.1 |
Publisher’s Note: MDPI stays neutral with regard to jurisdictional claims in published maps and institutional affiliations. |
© 2022 by the authors. Licensee MDPI, Basel, Switzerland. This article is an open access article distributed under the terms and conditions of the Creative Commons Attribution (CC BY) license (https://creativecommons.org/licenses/by/4.0/).
Share and Cite
Zhu, Y.; Iroh, J.O.; Rajagopolan, R.; Aykanat, A.; Vaia, R. Optimizing the Synthesis and Thermal Properties of Conducting Polymer–Montmorillonite Clay Nanocomposites. Energies 2022, 15, 1291. https://doi.org/10.3390/en15041291
Zhu Y, Iroh JO, Rajagopolan R, Aykanat A, Vaia R. Optimizing the Synthesis and Thermal Properties of Conducting Polymer–Montmorillonite Clay Nanocomposites. Energies. 2022; 15(4):1291. https://doi.org/10.3390/en15041291
Chicago/Turabian StyleZhu, Yanrong, Jude O. Iroh, Ramakrishnan Rajagopolan, Aydin Aykanat, and Richard Vaia. 2022. "Optimizing the Synthesis and Thermal Properties of Conducting Polymer–Montmorillonite Clay Nanocomposites" Energies 15, no. 4: 1291. https://doi.org/10.3390/en15041291
APA StyleZhu, Y., Iroh, J. O., Rajagopolan, R., Aykanat, A., & Vaia, R. (2022). Optimizing the Synthesis and Thermal Properties of Conducting Polymer–Montmorillonite Clay Nanocomposites. Energies, 15(4), 1291. https://doi.org/10.3390/en15041291