
Energy Production from Biodegradable Waste as an Example of the Circular Economy


Abstract
1. Introduction
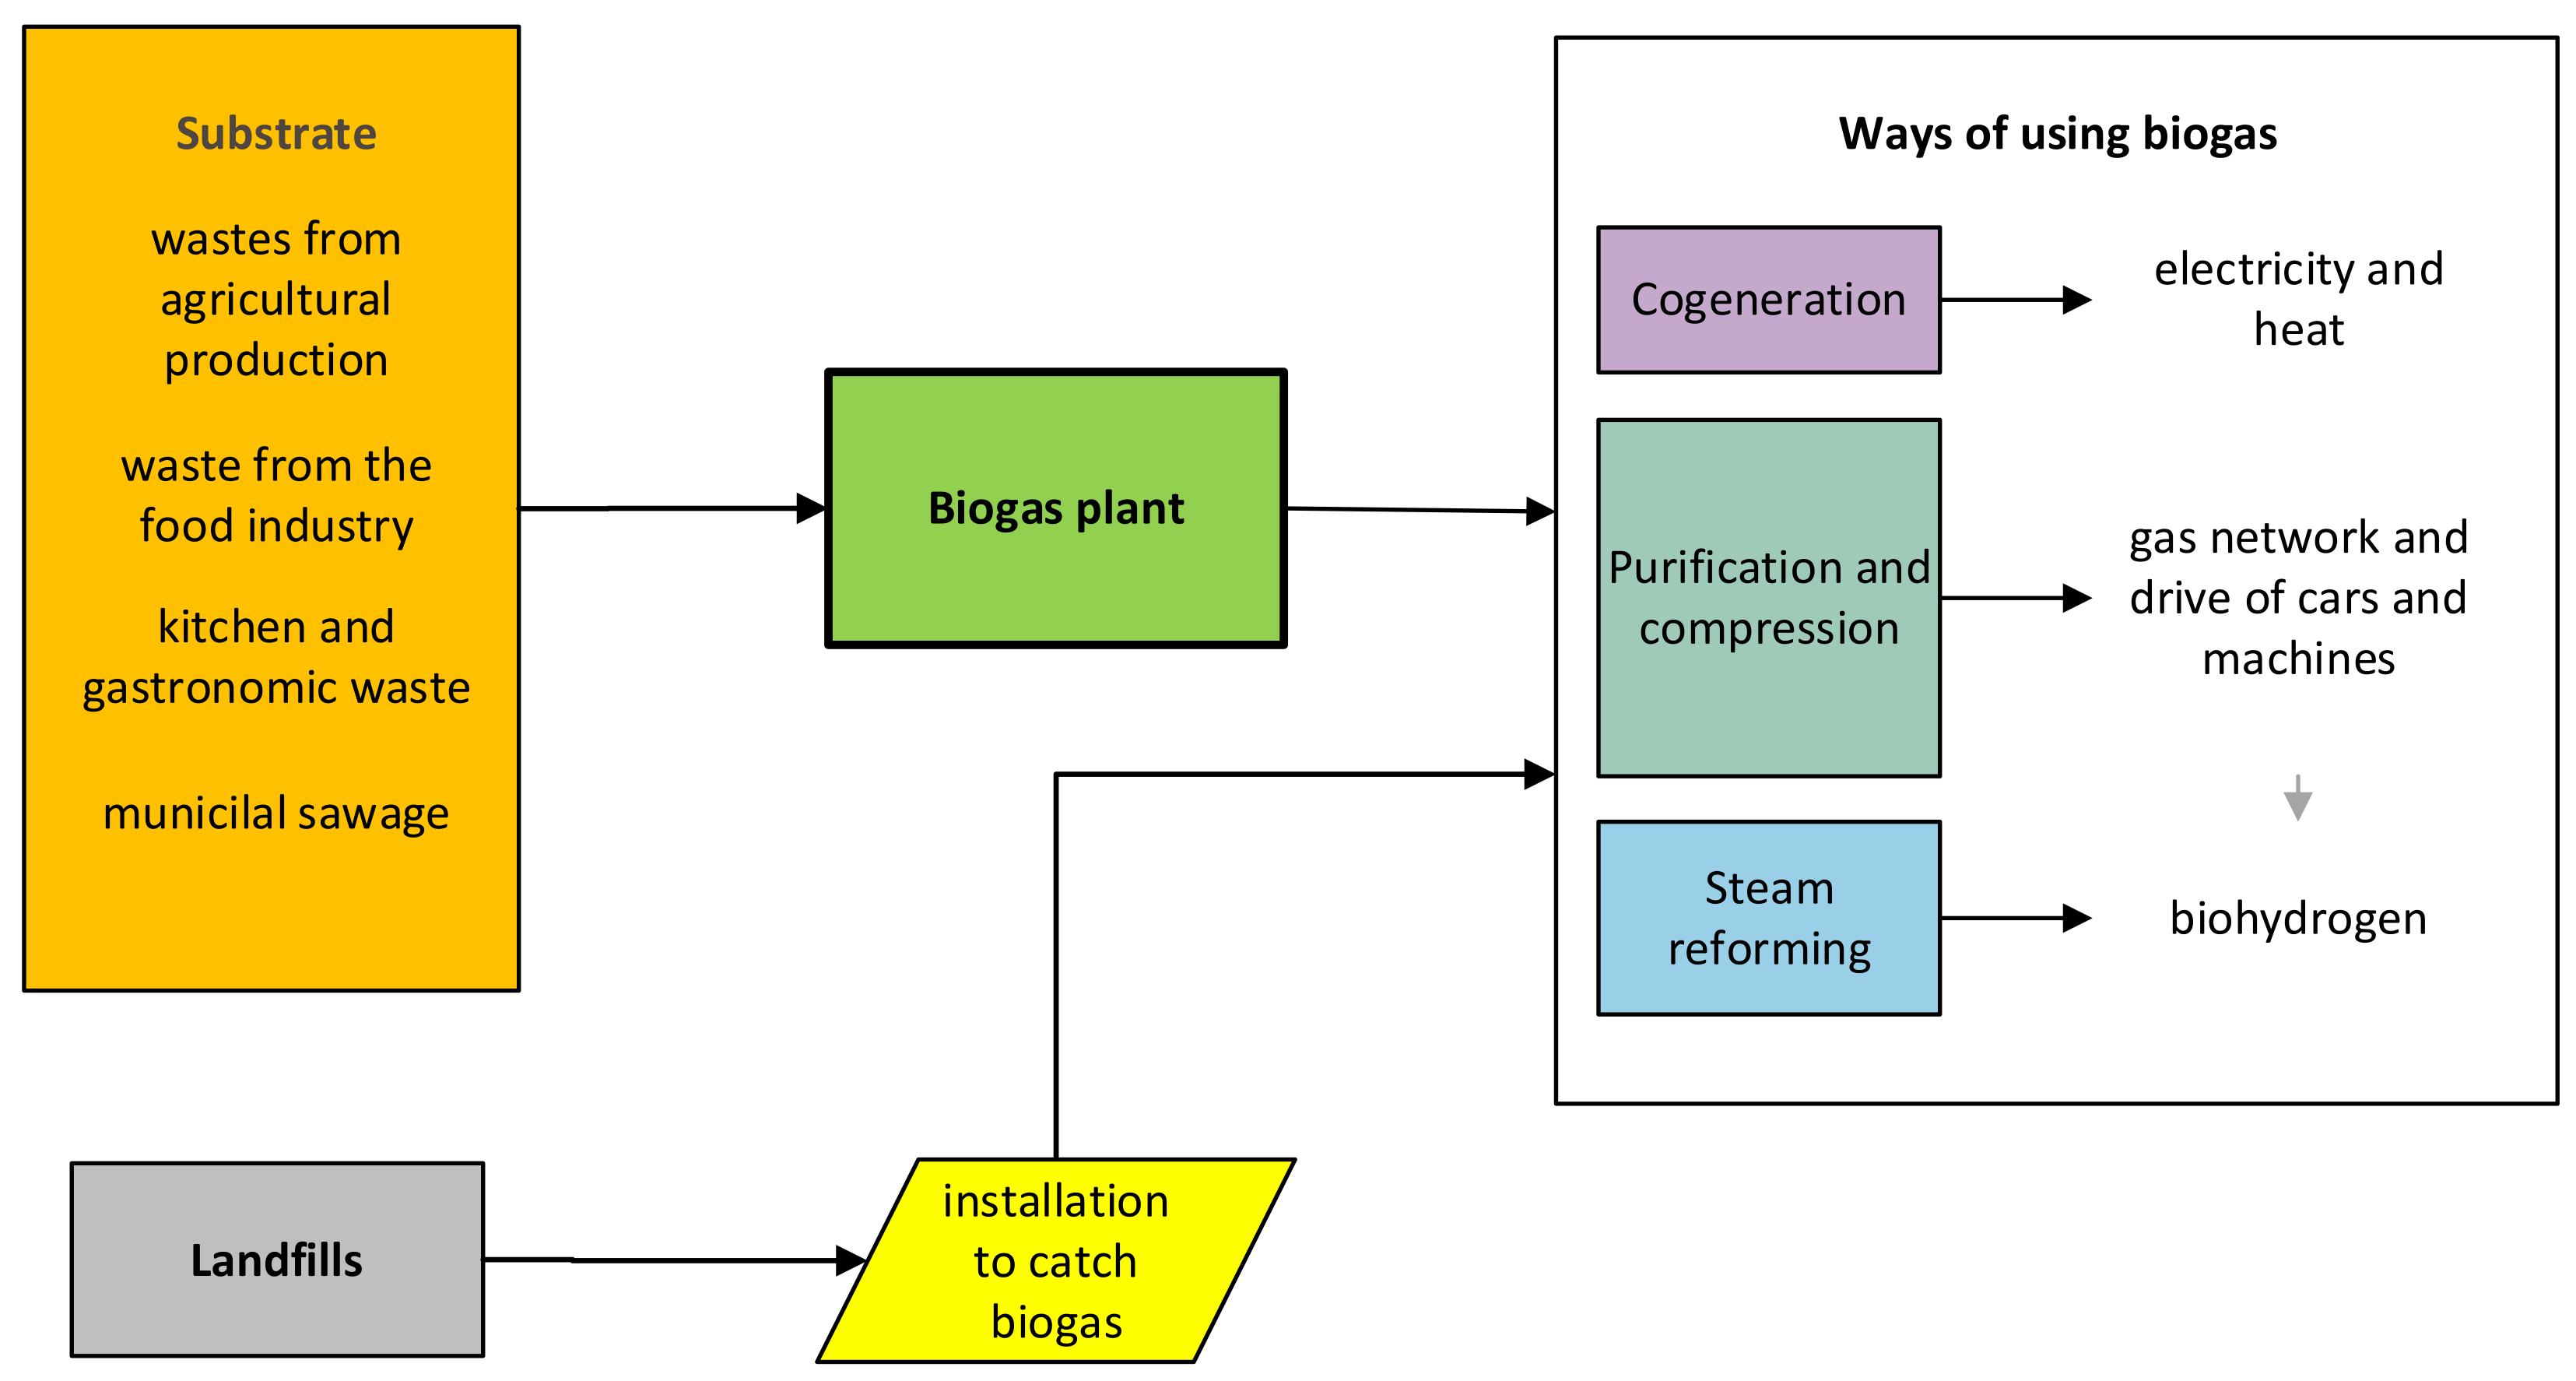
- anaerobic storage,
- semi-aerobic storage,
- landfill gas capture,
- composting,
- pre-composting before landfilling,
- biogas production.
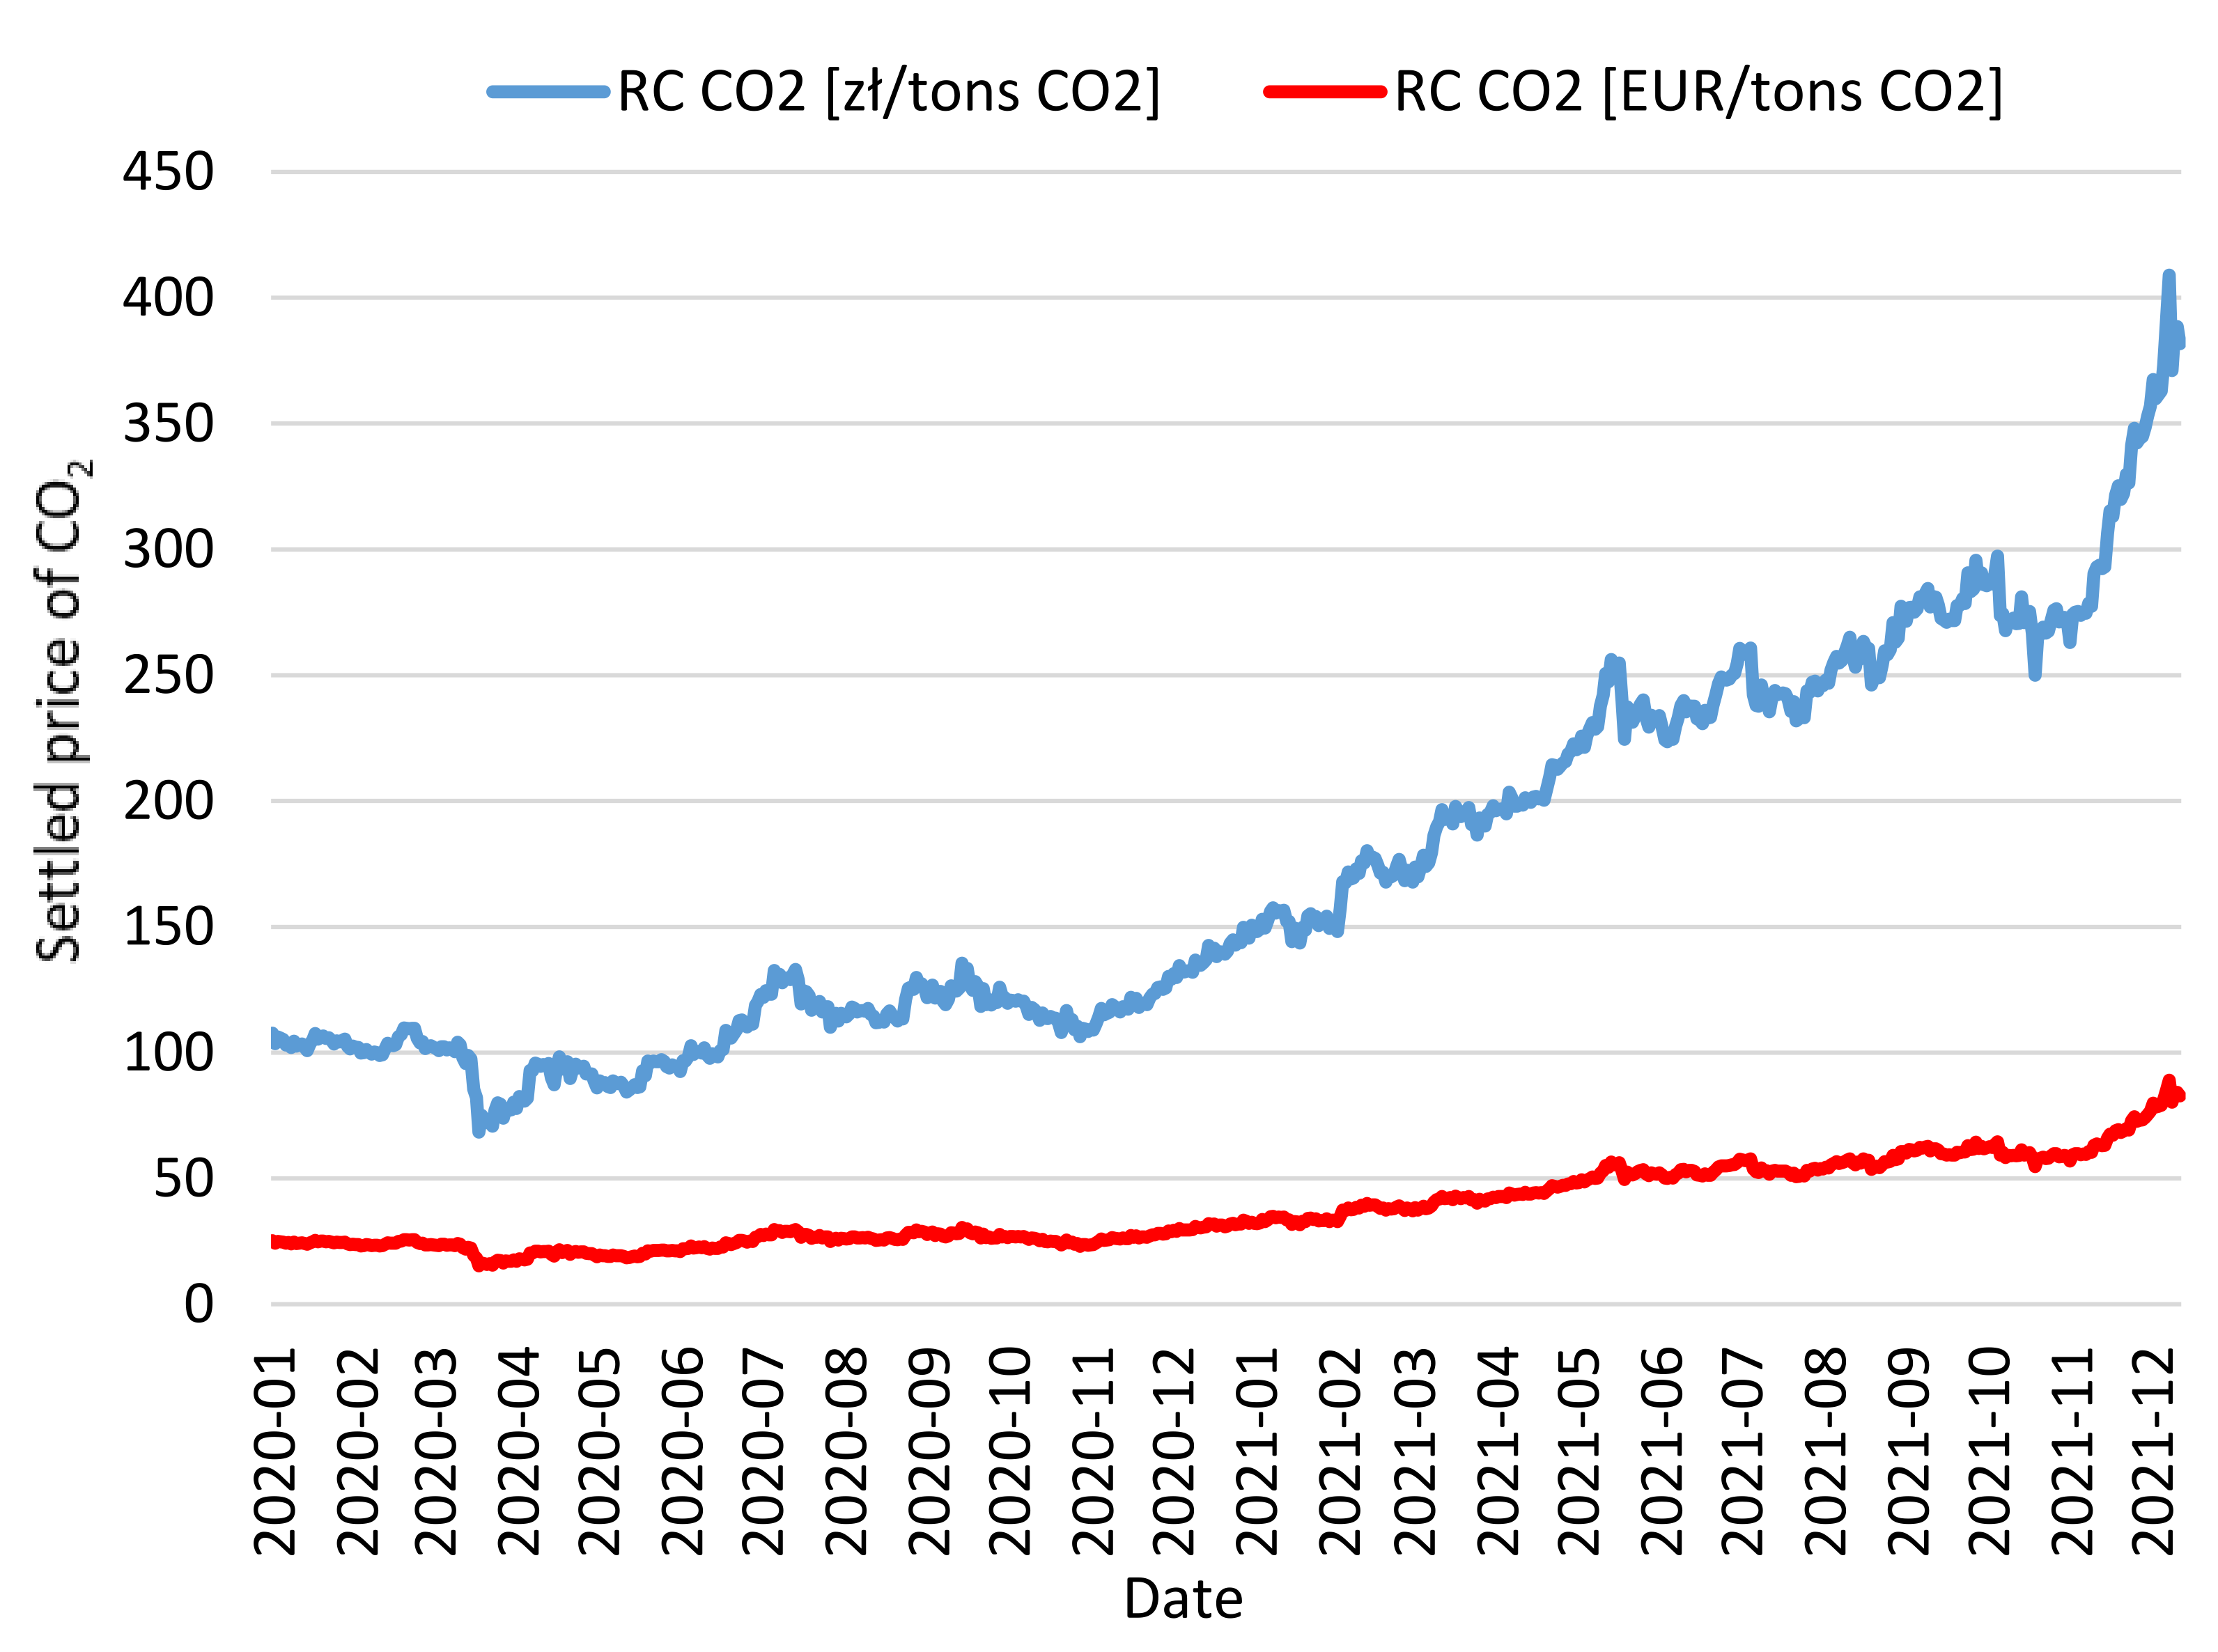
2. Emission Allowances Prices in the EU and Their Impact on the Price of Electricity
- one ton of carbon dioxide (CO2), the main greenhouse gas; or
- the equivalent amount of two more powerful greenhouse gases: nitrous oxide (NO2) and perfluorocarbon (PFC).
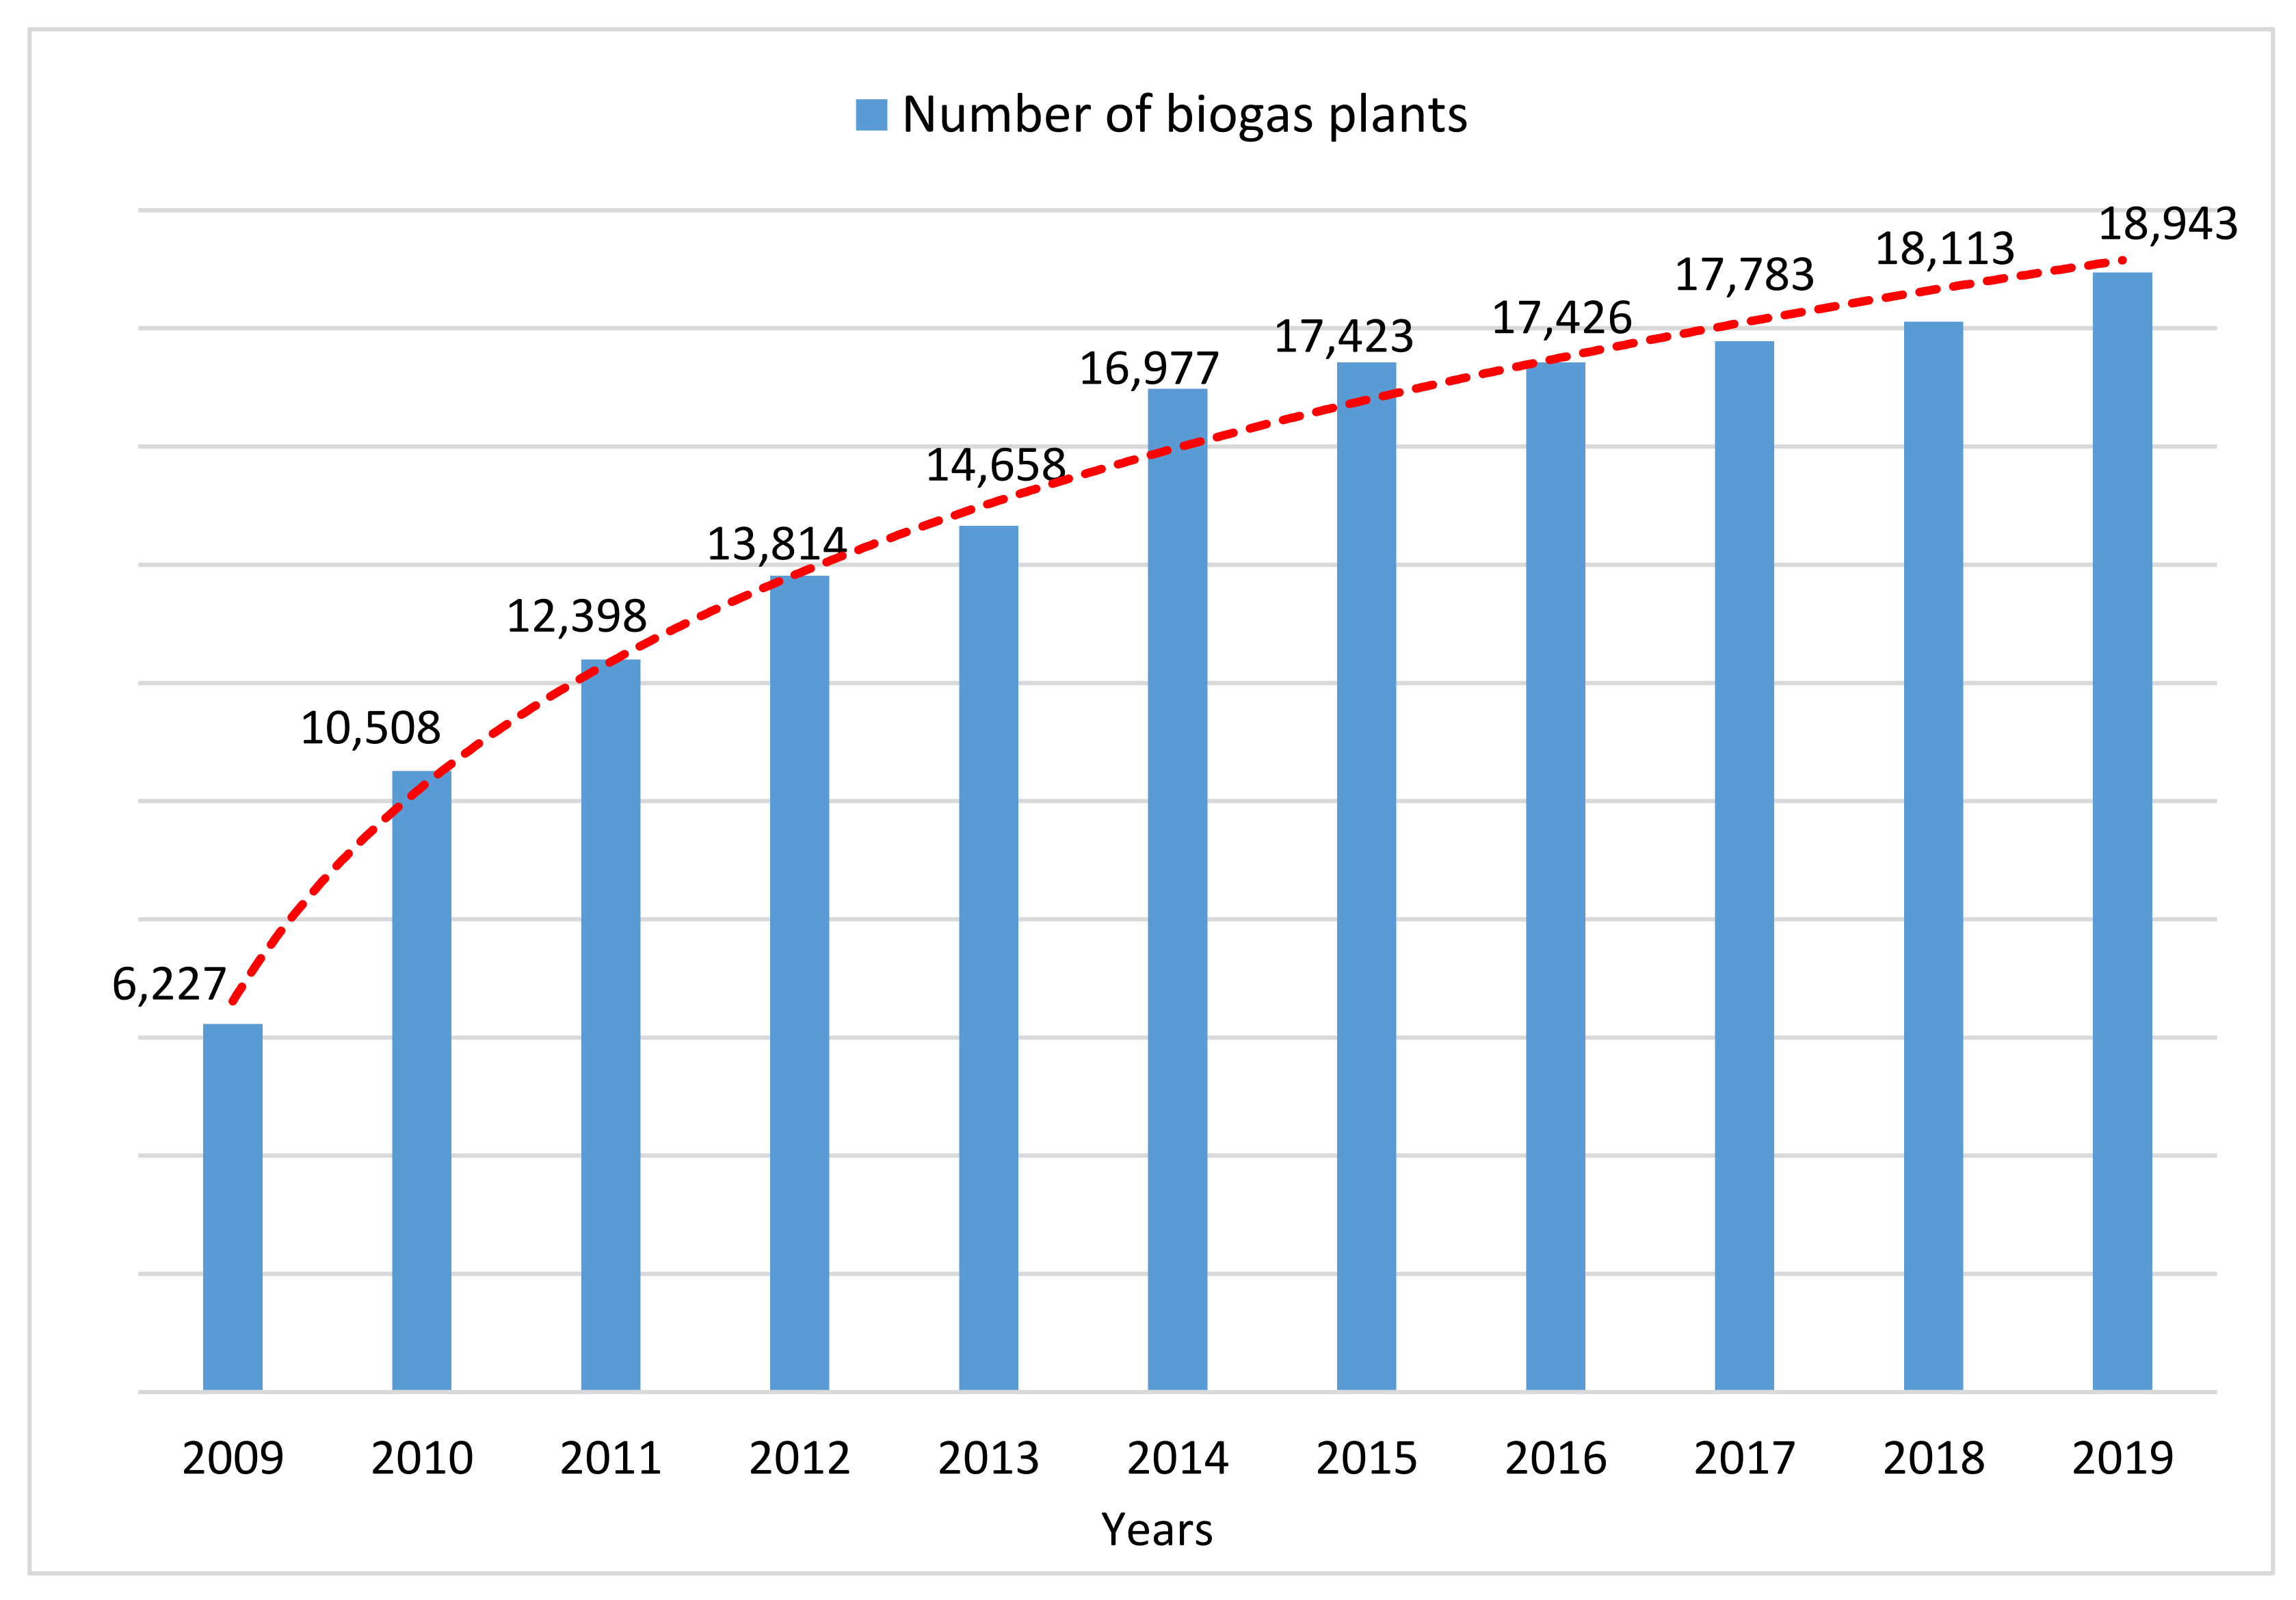
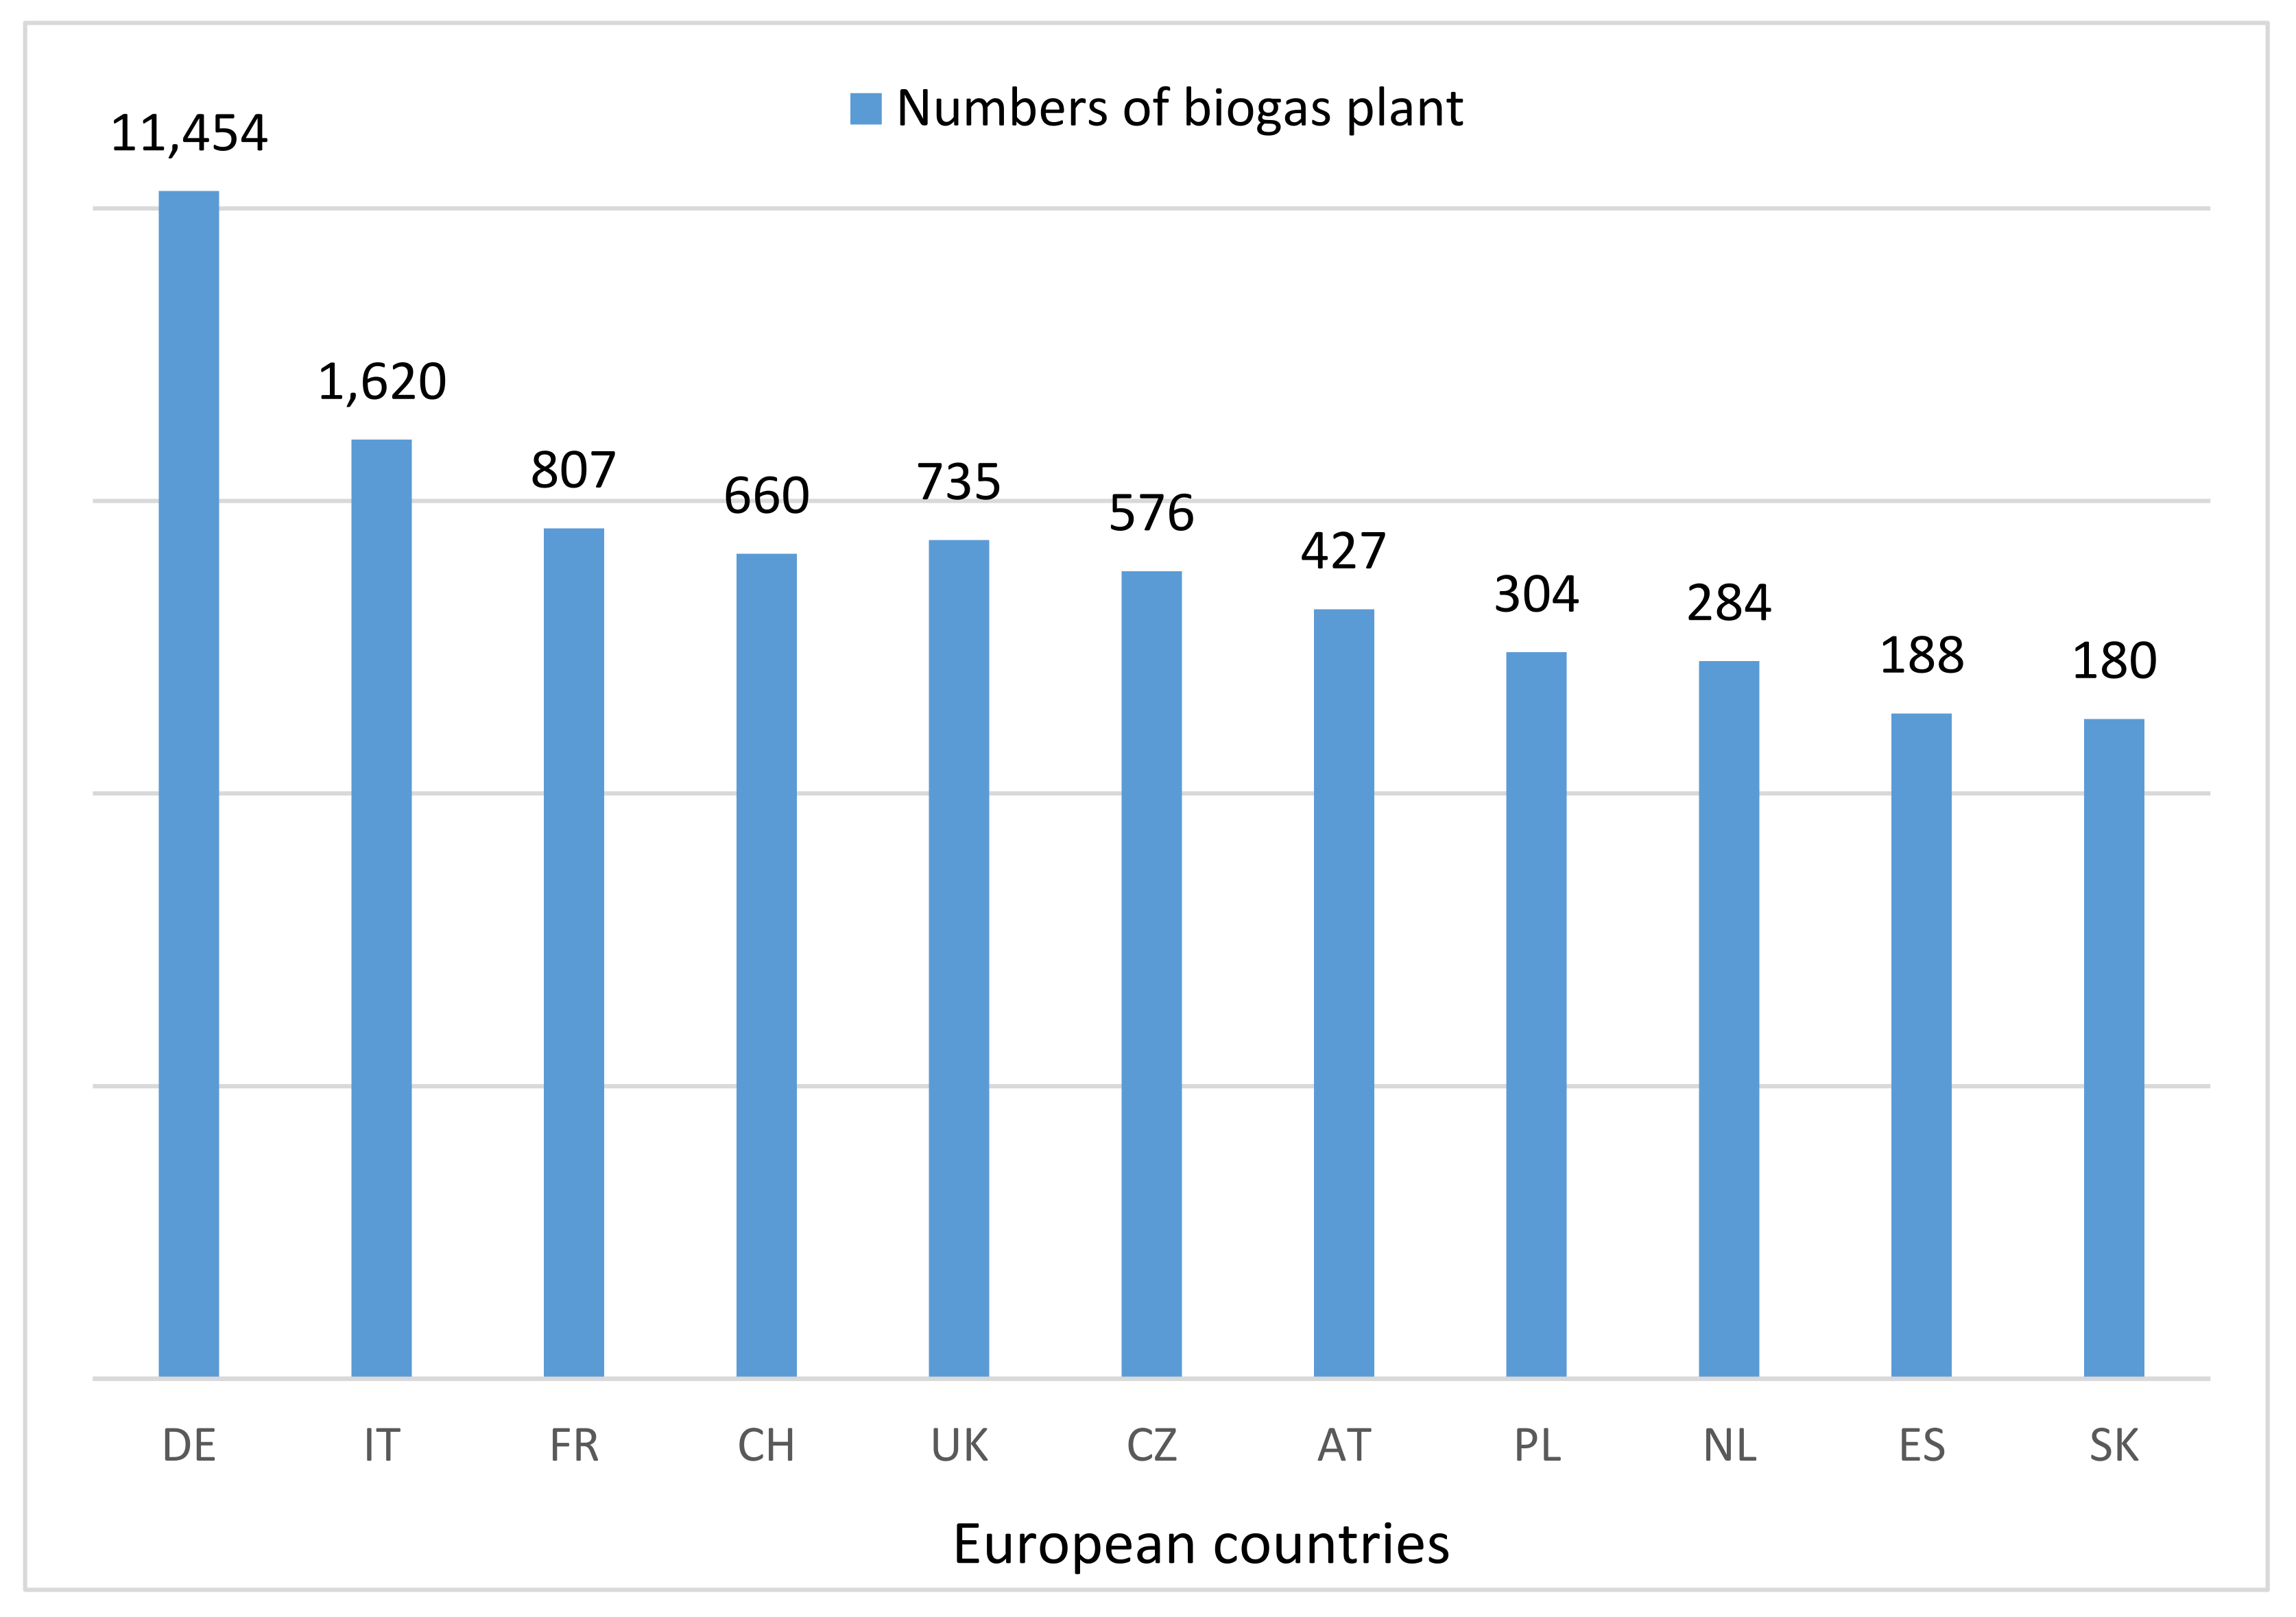
3. Biogas Plants in Europe
- agricultural—using biomass from target crops, manure from farm animals,
- waste from the agri-food industry,
- in sewage treatment plants—using organic waste separated from municipal sewage,
- on landfills—collecting biogas generated in landfills,
- municipal—processing selectively collected biodegradable municipal waste,
- mixed (other).
4. Biogas Plants in Poland
5. Conclusions
Author Contributions
Funding
Data Availability Statement
Conflicts of Interest
References
- Jeon, E.C.; Myeong, S.; Sa, J.W.; Kim, J.; Jeong, J.H. Greenhouse gas emission factor development for coal-fired power plants in Korea. Appl. Energy 2010, 87, 205–210. [Google Scholar] [CrossRef]
- Dieterich, B.; Finnan, J.; Hochstrasser, T.; Müller, C. The greenhouse gas balance of a dairy farm as influenced by the uptake of biogas production. BioEnergy Res. 2014, 7, 95–109. [Google Scholar] [CrossRef]
- Jeffry, L.; Ong, M.Y.; Nomanbhay, S.; Mofijur, M.; Mubashir, M.; Show, P.L. Greenhouse gases utilization: A review. Fuel 2021, 301, 121017. [Google Scholar] [CrossRef]
- Horowitz, C.A. Paris Agreement. Int. Leg. Mater. 2016, 55, 740–755. [Google Scholar] [CrossRef]
- United Nations. Paris Agreement. In Proceedings of the 21st United Nations Framework Convention on Climate Change, Paris, France, 30 November–13 December 2015; United Nations: New York, NY, USA, 2016. [Google Scholar]
- Kreidenweis, U.; Breier, J.; Herrmann, C.; Libra, J.; Prochnow, A. Greenhouse gas emissions from broiler manure treatment options are lowest in well-managed biogas production. J. Clean. Prod. 2021, 280, 124969. [Google Scholar] [CrossRef]
- Dictionary of Environmental Protection. Available online: https://www.teraz-srodowisko.pl/slownik-ochrona-srodowiska/ (accessed on 15 October 2021).
- Nikiciuk, M. Ecological and Progrowth Potential of Agricultural Biogas Sector in Podlaskie Voivodship. In Współczesne Problemy Ekonomiczne w Badaniach Młodych Naukowców. Analizy Makro-i Mezoekonomiczne; Polskie Towarzystwo Ekonomiczne: Białystok, Poland, 2019; Volume 3, pp. 98–117. [Google Scholar]
- Tagne, R.F.T.; Dong, X.; Anagho, S.G.; Kaiser, S.; Ulgiati, S. Technologies, challenges and perspectives of biogas production within an agricultural context. The case of China and Africa. Environ. Dev. Sustain. 2021, 23, 14799–14826. [Google Scholar] [CrossRef]
- Biznez Alert. Metan z Kopalni w Brzeszczach Będzie Zródłem Prądu i Ciepła. Available online: https://biznesalert.pl/metan-brzeszcze-energia-cieplo (accessed on 17 October 2021).
- Kwaśny, J.; Banach, M.; Kowalski, Z. Technologies of biogas production from different sources—A review. Czas. Tech. 2012, 17, 83–102. [Google Scholar]
- Igliński, B.; Piechota, G.; Iwański, P.; Skarzatek, M.; Pilarski, G. 15 Years of the Polish agricultural biogas plants: Their history, current status, biogas potential and perspectives. Clean Technol. Environ. Policy 2020, 22, 281–307. [Google Scholar] [CrossRef]
- Vlyssides, A.; Mai, S.; Barampouti, E.M. Energy Generation Potential in Greece From Agricultura Residues and Livestock Manure by Anaerobic Digestion Technology. Waste Biomass Valorization 2015, 6, 747–757. [Google Scholar] [CrossRef]
- Augustyn, G.; Mikulik, J.; Rumin, R.; Szyba, M. Energy Self-Sufficient Livestock Farm as the Example of Agricultural Hybrid Off-Grid System. Energies 2021, 14, 7041. [Google Scholar] [CrossRef]
- Zepter, J.M.; Gabderakhmanova, T.; Andreasen, K.M.; Boesgaard, K.; Marinelli, M. Biogas Plant Modelling for Flexibility Provision in the Power System of Bornholm Island. In Proceedings of the 55th International Universities Power Engineering Conference (UPEC), Turin, Italy, 1–4 September 2020; Institute of Electrical and Electronics Engineers: Piscataway, NJ, USA, 2020; pp. 1–6. [Google Scholar]
- Ramos-Suárez, J.L.; Ritter, A.; González, J.M.; Pérez, A.C. Biogas from animal manure: A sustainable energy opportunity in the Canary Islands. Renew. Sustain. Energy Rev. 2019, 104, 137–150. [Google Scholar] [CrossRef]
- Duan, N.; Lin, C.; Wang, P.; Meng, J.; Chen, H.; Li, X. Ecological analysis of a typical farm-scale biogas plant in China. Front. Earth Sci. 2014, 8, 375–384. [Google Scholar] [CrossRef]
- Balda, M.C.; Furubayashi, T.; Nakata, T. A novel approach for analyzing the food-energy nexus through on-farm energy generation. Clean Technol. Environ. Policy 2017, 19, 1003–1019. [Google Scholar] [CrossRef]
- Otoma, S.; Diaz, R. Life-cycle greenhouse gas emissions and economic analysis of alternative treatments of solid waste from city markets in Vietnam. J. Mater. Cycles Waste Manag. 2017, 19, 70–87. [Google Scholar] [CrossRef]
- Zhang, Y.; Banks, C.J.; Heaven, S. Anaerobic digestion of two biodegradable municipal waste streams. J. Environ. Manag. 2012, 104, 166–174. [Google Scholar] [CrossRef]
- Barros, R.M.; Tiago Filho, G.L.; da Silva, T.R. The electric energy potential of landfill biogas in Brazil. Energy Policy 2014, 65, 150–164. [Google Scholar] [CrossRef]
- Jeswani, H.K.; Smith, R.W.; Azapagic, A. Energy from waste: Carbon footprint of incineration and landfill biogas in the UK. Int. J. Life Cycle Assess. 2013, 18, 218–229. [Google Scholar] [CrossRef]
- Glivin, G.; Sekhar, S.J. Waste potential, barriers and economic benefits of implementing different models of biogas plants in a few Indian educational institutions. BioEnergy Res. 2020, 13, 668–682. [Google Scholar] [CrossRef]
- Wu, X.; Wu, F.; Tong, X.; Wu, J.; Sun, L.; Peng, X. Emergy and greenhouse gas assessment of a sustainable, integrated agricultural model (SIAM) for plant, animal and biogas production: Analysis of the ecological recycle of wastes. Resour. Conserv. Recycl. 2015, 96, 40–50. [Google Scholar] [CrossRef]
- Kiselev, A.; Magaril, E.; Magaril, R.; Panepinto, D.; Ravina, M.; Zanetti, M.C. Towards circular economy: Evaluation of sewage sludge biogas solutions. Resources 2019, 8, 91. [Google Scholar] [CrossRef]
- Kapoor, R.; Ghosh, P.; Kumar, M.; Sengupta, S.; Gupta, A.; Kumar, S.; Vijay, V.; Kumar, V.; Vijay, V.K.; Pant, D. Valorization of agricultural waste for biogas based circular economy in India: A research outlook. Bioresour. Technol. 2020, 304, 123036. [Google Scholar] [CrossRef]
- Cruz, I.A.; Andrade, L.R.S.; Bharagava, R.N.; Nadda, A.K.; Bilal, M.; Figueiredo, R.T.; Ferreira, L.F.R. Valorization of cassava residues for biogas production in Brazil based on the circular economy: An updated and comprehensive review. Clean. Eng. Technol. 2021, 4, 100196. [Google Scholar] [CrossRef]
- Moore, P.A.; Miles, D.; Burns, R.; Pote, D.; Berg, K.; Choi, I.H. Ammonia emission factors from broiler litter in barns, in storage, and after land application. J. Environ. Qual. 2011, 40, 1395–1404. [Google Scholar] [CrossRef]
- Meyer-Aurich, A.; Schattauer, A.; Hellebrand, H.J.; Klauss, H.; Plochl, M.; Berg, W. Impact of uncertainties on greenhouse gas mitigation potential of biogas production from agricultural resources. Renew. Energy 2012, 37, 277–284. [Google Scholar] [CrossRef]
- European Comission. Emissions Cap and Allowances. Available online: https://ec.europa.eu/clima/eu-action/eu-emissions-trading-system-eu-ets/emissions-cap-and-allowances_pl (accessed on 10 November 2021).
- European Comission. Auctioning. Available online: https://ec.europa.eu/clima/eu-action/eu-emissions-trading-system-eu-ets/auctioning_pl (accessed on 10 November 2021).
- Polskie Sieci Elektroenergetyczne. Settlement Price of CO2 Emission Allowances. Available online: https://www.pse.pl/web/pse-eng/data/balancing-market-operation/basic-price-and-cost-indicators/settlement-price-of-co2-emission-allowances (accessed on 10 November 2021).
- Energy Regulatory Office. Średnia Kwartalna Cena Energii Elektrycznej Sprzedanej na Zasadach Innych Niż Wynikające z Art. 49a ust. 1 i 2 Ustawy—Prawo Energetyczne. Available online: https://www.ure.gov.pl/pl/energia-elektryczna/ceny-wskazniki/7851,Srednia-kwartalna-cena-energii-elektrycznej-sprzedanej-na-zasadach-innych-niz-wy.html (accessed on 14 November 2021).
- Eur-Pln. Available online: https://eur-pln.pl/ (accessed on 10 January 2022).
- Centrum Informacji o Rynku Energii. Uprawnienia do Emisji CO2 Stanowią Już 59% Ceny Energii Elektrycznej. Available online: https://www.cire.pl/artykuly/o-tym-sie-mowi/uprawnienia-do-emisji-co2-stanowia-juz-59-ceny-energii-elektrycznej (accessed on 10 January 2022).
- Energy Regulatory Office. Od Stycznia za Prąd Zapłacimy o 21 zł Więcej. Available online: https://www.ure.gov.pl/pl/urzad/informacje-ogolne/aktualnosci/9963,Od-stycznia-za-prad-zaplacimy-o-21-zl-wiecej.html (accessed on 10 January 2022).
- Woźniak, J. Influence of the cost of CO2 emission allowance purchases on the increase in electricity prices in Poland. Energy Policy J. 2012, 15, 139–149. [Google Scholar]
- Energy Regulatory Office. Średnioważony Koszt Węgla, Zużywanego Przez Jednostki Wytwórcze Centralnie Dysponowane Oraz Srednia Cena Energii Elektrycznej Wytworzonej Przez Wytwórców Eksploatujących Jednostki Wytwórcze Centralnie Dysponowane w Danym Roku. Available online: https://www.ure.gov.pl/pl/energia-elektryczna/ceny-wskazniki/7854,Sredniowazony-koszt-wegla-zuzywanego-przez-jednostki-wytworcze-centralnie-dyspon.html (accessed on 14 November 2021).
- Energy Regulatory Office. Średnia Cena Energii Elektrycznej dla Gospodarstw Domowych. Available online: https://www.ure.gov.pl/pl/energia-elektryczna/ceny-wskazniki/7853,Srednia-cena-energii-elektrycznej-dla-gospodarstw-domowych.html (accessed on 14 November 2021).
- Goel, S.; Sharma, R. Optimal sizing of a biomass-biogas hybrid system for sustainable power supply to a commercial agricultural farm in northern Odisha, India. Environ. Dev. Sustain. 2019, 21, 2297–2319. [Google Scholar] [CrossRef]
- Pathak, H.; Jain, N.; Bhatia, A.; Mohanty, S.; Gupta, N. Global warming mitigation potential of biogas plants in India. Environ. Monit. Assess. 2009, 157, 407–418. [Google Scholar] [CrossRef]
- PN-C-04750: 2011 Standard; Gaseous Fuels. Classification, Designation and Requirements. Polish Standardization Committee: Warsaw, Poland, 2011; ICS 75.160.30.
- Aryal, N.; Kvist, T. Alternative of biogas injection into the Danish gas grid system—A study from demand perspective. ChemEngineering 2018, 2, 43. [Google Scholar] [CrossRef]
- Fernández-González, J.M.; Martín-Pascual, J.; Zamorano, M. Biomethane injection into natural gas network vs composting and biogas production for electricity in Spain: An analysis of key decision factors. Sustain. Cities Soc. 2020, 60, 1–16. [Google Scholar] [CrossRef]
- Persson, M.; Jönsson, O.; Wellinger, A. Biogas upgrading to vehicle fuel standards and grid injection. IEA Bioenergy Task 2006, 37, 102242. [Google Scholar]
- Gregorie, E.F.; Lamb, J.J.; Lien, K.M.; Pollet, B.G.; Burheim, O.S. Hydrogen and Biogas. In Micro-Optics and Energy; Springer: Cham, Switzerland, 2020; pp. 131–155. [Google Scholar]
- Nahar, G.; Mote, D.; Dupont, V. Hydrogen production from reforming of biogas: Review of technological advances and an Indian perspective. Renew. Sustain. Energy Rev. 2017, 76, 1032–1052. [Google Scholar] [CrossRef]
- European Biogas Association. Available online: https://www.europeanbiogas.eu/wpcontent/uploads/2021/01/EBA_StatisticalReport2020_abridged.pdf (accessed on 12 November 2021).
- European Biogas Association. Available online: https://www.europeanbiogas.eu/wp-content/uploads/2021/01/Annual-Report-2020-new.pdf (accessed on 16 November 2021).
- Sustainable Agribusiness Forum. European Biogas Association Statistical Report. Available online: https://saf.org.ua/en/library/989/ (accessed on 24 October 2021).
- The World Bank. Available online: https://datatopics.worldbank.or (accessed on 24 October 2021).
- Statista. Cumulative Capacity of Biomass Power Plants in Germany from 1990 to 2020. Available online: https://www.statista.com/statistics/449300/biomass-plants-cumulative-capacity-germany/ (accessed on 12 November 2021).
- Yang, X.; Liu, Y.; Thrän, D.; Bezama, A.; Wang, M. Effects of the German Renewable Energy Sources Act and environmental, social and economic factors on biogas plant adoption and agricultural land use change. Energy Sustain. Soc. 2021, 11, 6. [Google Scholar] [CrossRef]
- Bischof, A. Insights to the internal sphere of influence of peasant family farms in using biogas plants as part of sustainable development in rural areas of Germany. Energy Sustain. Soc. 2012, 2, 2–9. [Google Scholar] [CrossRef]
- Murano, R.; Maisano, N.; Selvaggi, R.; Pappalardo, G.; Pecorino, B. Critical Issues and Opportunities for Producing Biomethane in Italy. Energies 2021, 14, 2431. [Google Scholar] [CrossRef]
- International Energy Agency. Biogas and Biometane in Italy. Available online: https://iea.blob.core.windows.net/assets/ced91034-a399-404e-b8be-dea83b9b3187/1.4_PelliniAlessandro_13Jul2021.pdf (accessed on 15 November 2021).
- Bortoluzzi, G.; Gattia, M.; Sognia, A.; Consonnia, S. Bio-methane production from agricultural resources in the Italian scenario: Technoeconomic analysis of water wash. Chem. Eng. 2014, 37, 259–264. [Google Scholar]
- Energy Regulatory Office Departament Komunikacji Społecznej. Available online: https://www.ure.gov.pl/pl/urzad/informacje-ogolne/departamenty/6664,Departament-Komunikacji-Spolecznej.html (accessed on 28 November 2021).
- Internetowy System Aktów Prawnych. Regulation of the Minister of the Environment of 15 December 2017 on the Levels of Storage Limitations for the Mass of Biodegradable Municipal Waste. Journal of Laws of 2017, Item 2412. Available online: http://isap.sejm.gov.pl/isap.nsf/download.xsp/WDU20170002412/O/D20172412.pdf (accessed on 16 November 2021).
- Biuletyn Informacji Publicznej. Dane Dotyczące Działalności Wytwórców Biogazu Rolniczego w Latach 2011–2020. Available online: https://bip.kowr.gov.pl/informacje-publiczne/odnawialne-zrodla-energii/biogaz-rolniczy/dane-dotyczace-dzialalnosci-wytworcow-biogazu-rolniczego-w-latach-2011-2020 (accessed on 12 November 2021).
- Gradziuk, P. Potential and forecasts for the use of agricultural biogas in Poland. Ann. Assoc. Agric. Agribus. Econ. 2017, 19, 64–70. [Google Scholar] [CrossRef][Green Version]
- Internetowy System Aktów Prawnych. The Act of February 20, 2015 on Renewable Energy Sources. Journal of Laws of 2015, Item. Available online: http://isap.sejm.gov.pl/isap.nsf/download.xsp/WDU20150000478/U/D20150478Lj.pdf (accessed on 19 October 2021).
- Szyba, M. Spatial planning and the development of renewable Energy sources in Poland. Acta Innov. 2021, 39, 5–14. [Google Scholar] [CrossRef]
- Polska Izba Gospodarcza Energetyki Odnawialnej i Rozproszonej. Document of the Council of Ministers, Kierunki Rozwoju Biogazowi Rolniczych w Polsce w Latach 2010–2020 (Directions of Development of Agricultural Biogas Plants in Poland in 2010–2020), Warszawa, 2010. Available online: https://www.pigeor.pl/media/js/kcfinder/upload/files/Kierunki-Rozwoju-Biogazowni-Rolniczych-w-Polsce-na-lata-2010–2020.pdf (accessed on 21 October 2021).
- Institute of Renewable Energy. Biogaz Produkcja Wykorzystywanie. Available online: https://www.ieo.pl/dokumenty/obszary_badan/Biogaz%20-%20Produkcja%20Wykorzystywanie.pdf (accessed on 15 November 2021).
- The National Centre for Emissions Management (KOBiZE). Wartości Opałowe (WO) i Wskaźniki Emisji CO2 (WE) w Roku 2018 do Raportowania w Ramach Systemu Handlu Uprawnieniami do Emisji za Rok 2021. Available online: https://www.kobize.pl/uploads/materialy/materialy_do_pobrania/monitorowanie_raportowanie_weryfikacja_emisji_w_eu_ets/WO_i_WE_do_monitorowania-ETS-2021.pdf (accessed on 10 November 2021).


| Components | Unit | Household Waste | Sludge from Sewage Treatment Plants | Agricultural Waste | Wastes from the Agri-Food Industry |
|---|---|---|---|---|---|
| CH4 | [%] by vol. | 50–60 | 60–75 | 60–75 | 68 |
| CO2 | 34–38 | 19–33 | 19–33 | 26 | |
| N2 | 0–5 | 0–1 | 0–1 | - | |
| O2 | 0–1 | <0.5 | <0.5 | - | |
| H2O | 6 | 6 | 6 | 6 | |
| H2S | mg/m3 | 100–900 | 1000–4000 | 3000–10,000 | 100 |
| NH3 | - | - | 50–100 | 400 |
| Biogas Plants | Year | Number of Installations | Installed Power [MW] | Energy Produced [MWh] | Use of Installed Power | |
|---|---|---|---|---|---|---|
| Whole | Mean | [%] | ||||
| agricultural | 2018 | 95 | 102.688 | 1.081 | 567,099 | 64.74 |
| 2019 | 105 | 112.158 | 1.068 | 562,303 | 64.19 | |
| 2020 | 120 | 117.980 | 0.983 | 508,381 | 49.19 | |
| in sewage treatment plants | 2018 | 109 | 70.281 | 0.661 | 249,443 | 40.52 |
| 2019 | 113 | 72.108 | 0.638 | 279,741 | 44.29 | |
| 2020 | 114 | 74.820 | 0.656 | 247,990 | 37.84 | |
| in landfills | 2018 | 97 | 62.348 | 0.643 | 128,729 | 23.57 |
| 2019 | 98 | 59.396 | 0.606 | 65,173 | 10.32 | |
| 2020 | 102 | 61.195 | 0.600 | 44,528 | 8.31 | |
| together | 2018 | 301 | 235.317 | - | 945,570 | - |
| 2019 | 316 | 243.662 | - | 907,218 | - | |
| 2020 | 336 | 253.995 | - | 800,899 | - | |
| No. | Substrates | Amount of Substrates Consumed [tons] | ||
|---|---|---|---|---|
| 2018 | 2019 | 2020 | ||
| Distillation decoction | ||||
| 1. | Fruit and vegetable residues | 839,983 | 817,199 | 759,774 |
| 2. | Slurry | 770,953 | 768,890 | 706,945 |
| 3. | Maize silage | 757,555 | 733,452 | 759,774 |
| 4. | Beet pulp | 482,427 | 420,712 | 491,870 |
| 5. | Technological sludges from the agri- food industry | 291,648 | 251,507 | 209,816 |
| 6. | 179,801 | 187,812 | 227,148 | |
| Dairy industry waste manure | ||||
| 7. | Manure | 107,972 | 125,141 | 132,911 |
| 8. | Expired food | 85,422 | 84,923 | 91,681 |
| 9. | Post-slaughter waste | 73,610 | 98,406 | 117,184 |
| 10. | Food processing waste | 66,847 | 104,438 | 85,777 |
| 11. | Plant waste mass | 66,356 | 120,602 | 344,329 |
| 12. | Green fodder | 54,657 | 42,114 | 42,247 |
| 13. | Fruits and vegetables | 40,715 | 33,060 | 43,691 |
| 14. | Grass and cereal silage | 38,397 | 30,350 | 45,926 |
| 15. | Poultry manure | 25,419 | 22,334 | 26,708 |
| 16. | Gastric contents | 22,525 | 19,741 | 27,532 |
| 17. | Cereal, grain waste | 18,387 | 10,607 | 11,348 |
| 18. | Sludge from processing plant products | 13,137 | 7346 | 18,971 |
| 19. | 13,046 | 16,732 | 21,090 | |
| 20. | Forage | 12,879 | 8216 | 20,066 |
| 21. | Fats | 11,909 | 14,602 | 25,580 |
| 22. | Straw | 6849 | 4193 | 7753 |
| 23. | Fatty sediments | 5171 | 4395 | 3462 |
| 24. | Catering waste | 4920 | 6196 | 1528 |
| 25. | Protein waste, fat waste | 3590 | 4120 | 3036 |
| 26. | Coffee | 2224 | 10 | 3 |
| 27. | Liquid wheat residues | 1436 | 1203 | 1101 |
| 28. | Yeast sediments | 865 | - | - |
| 29. | Waste from plant oil production | 616 | 10,129 | 12,232 |
| 30. | Glycerine | 357 | 348 | 415 |
| 31. | Plant oils | 204 | 6131 | 3891 |
| 32. | Production washings | 150 | 419 | 1215 |
| 33. | Fusel oils | 140 | 163 | 248 |
| 34. | Lecithin and soap mixture | 40 | 1485 | 181 |
| 35. | Post-extraction pulp from the production of herbal pharmaceuticals | 40 | 35 | - |
| Total | 4,000,249 | 3,957,741 | 4,409,055 | |
| Substrate | Biogas Yield [m3] | Methane Content [%] | Biomethane Yield [m3] | Electricity Yield [kWh] | Amount of Heat [kWh] | |||
|---|---|---|---|---|---|---|---|---|
| Produced | On Fermentation | For Sale | ||||||
| Cattle slurry | 27 | 60 | 16.20 | 52.73 | 82.86 | 24.86 | 58.00 | |
| Pig slurry | 45 | 65 | 29.25 | 95.21 | 149.61 | 44.88 | 104.73 | |
| Cattle manure | 45 | 60 | 27.00 | 87.89 | 138.11 | 41.43 | 96.67 | |
| Pig manure | 60 | 60 | 36.00 | 117.18 | 184.14 | 55.24 | 128.90 | |
| Chicken manure | 80 | 60 | 48.00 | 156.24 | 245.52 | 73.66 | 171.86 | |
| Maize silage | 185 | 55 | 101.75 | 331.20 | 520.45 | 156.14 | 364.32 | |
| Grass silage | 185 | 55 | 101.75 | 331.20 | 520.45 | 156.14 | 364.32 | |
| Food remnants and | Min. | 50 | 55 | 30.00 | 97.65 | 153.45 | 46.04 | 107.42 |
| expired food products: | Max | 480 | 55 | 264.00 | 859.30 | 1350.36 | 405.11 | 946.25 |
| Grocery store waste | Min. | 45 | 65 | 29.25 | 95.21 | 149.61 | 44.88 | 104.73 |
| Max. | 110 | 65 | 71.50 | 232.70 | 365.72 | 109.72 | 256.01 | |
| Stomach content of pigs | 40 | 65 | 26.00 | 84.63 | 132.99 | 39.90 | 93.09 | |
| Content of the rumen of cows | 40 | 60 | 24.00 | 78.12 | 122.76 | 36.83 | 85.93 | |
| Mown grass | 175 | 60 | 105.00 | 341.78 | 537.08 | 161.12 | 375.95 | |
| Description | Unit | Amount |
|---|---|---|
| Number of cows in barns | item | 1,482,747 |
| Weight of slurry produced per cow/year | ton | 25 |
| Annual mass of slurry produced | ton | 16,576,482 |
| Biogas yield from slurry | m3/ton | 27 |
| Annual biogas production | m3 | 414,412,060 |
| Methane content in biogas | % | 60 |
| Annual production of methane | m3 | 248,647,236 |
| Electricity yield | kWh/ton | 52.73 |
| Annual electricity production | kWh | 874,077,916 |
| MWh | 874,078 | |
| Thermal energy yield | kWh/ton | 82.86 |
| Annual production of thermal energy | kWh | 1,131,603,768 |
| MWh | 1,131,604 | |
| Thermal energy for fermentation | MWh | 170,168 |
| Thermal energy for sale | MWh | 961,436 |
| Description | Unit | Coal | Lignite | Natural Gas |
|---|---|---|---|---|
| CO2 emission factor | ton/MWh | 0.33704 | 0.38571 | 0.19946 |
| Electricity | ||||
| Production | MWh | 874,078 | 874,078 | 874,078 |
| CO2 emissions | ton | 294,599 | 337,141 | 174,344 |
| Cost of CO2 emission allowances | zł EUR | 112,472,101 24,381,034 | 128,713,548 27,901,758 | 66,560,899 14,428,676 |
| Thermal energy for sale | ||||
| Production | MWh | 961,436 | 961,436 | 961,436 |
| CO2 emissions | ton | 324,042 | 370,835 | 191,768 |
| Cost of CO2 emission allowances | zł EUR | 123,712,903 26,817,748 | 141,577,569 30,690,344 | 73,213,196 15,870,722 |
Publisher’s Note: MDPI stays neutral with regard to jurisdictional claims in published maps and institutional affiliations. |
© 2022 by the authors. Licensee MDPI, Basel, Switzerland. This article is an open access article distributed under the terms and conditions of the Creative Commons Attribution (CC BY) license (https://creativecommons.org/licenses/by/4.0/).
Share and Cite
Szyba, M.; Mikulik, J. Energy Production from Biodegradable Waste as an Example of the Circular Economy. Energies 2022, 15, 1269. https://doi.org/10.3390/en15041269
Szyba M, Mikulik J. Energy Production from Biodegradable Waste as an Example of the Circular Economy. Energies. 2022; 15(4):1269. https://doi.org/10.3390/en15041269
Chicago/Turabian StyleSzyba, Marta, and Jerzy Mikulik. 2022. "Energy Production from Biodegradable Waste as an Example of the Circular Economy" Energies 15, no. 4: 1269. https://doi.org/10.3390/en15041269
APA StyleSzyba, M., & Mikulik, J. (2022). Energy Production from Biodegradable Waste as an Example of the Circular Economy. Energies, 15(4), 1269. https://doi.org/10.3390/en15041269