
A Case Study of a Nursing Home in Nagano, Japan: Field Survey on Thermal Comfort and Building Energy Simulation for Future Climate Change


Abstract
:1. Introduction
2. Methods
2.1. Field Survey
2.1.1. Survey of the Indoor Thermal Environment
2.1.2. Subjective Vote Survey
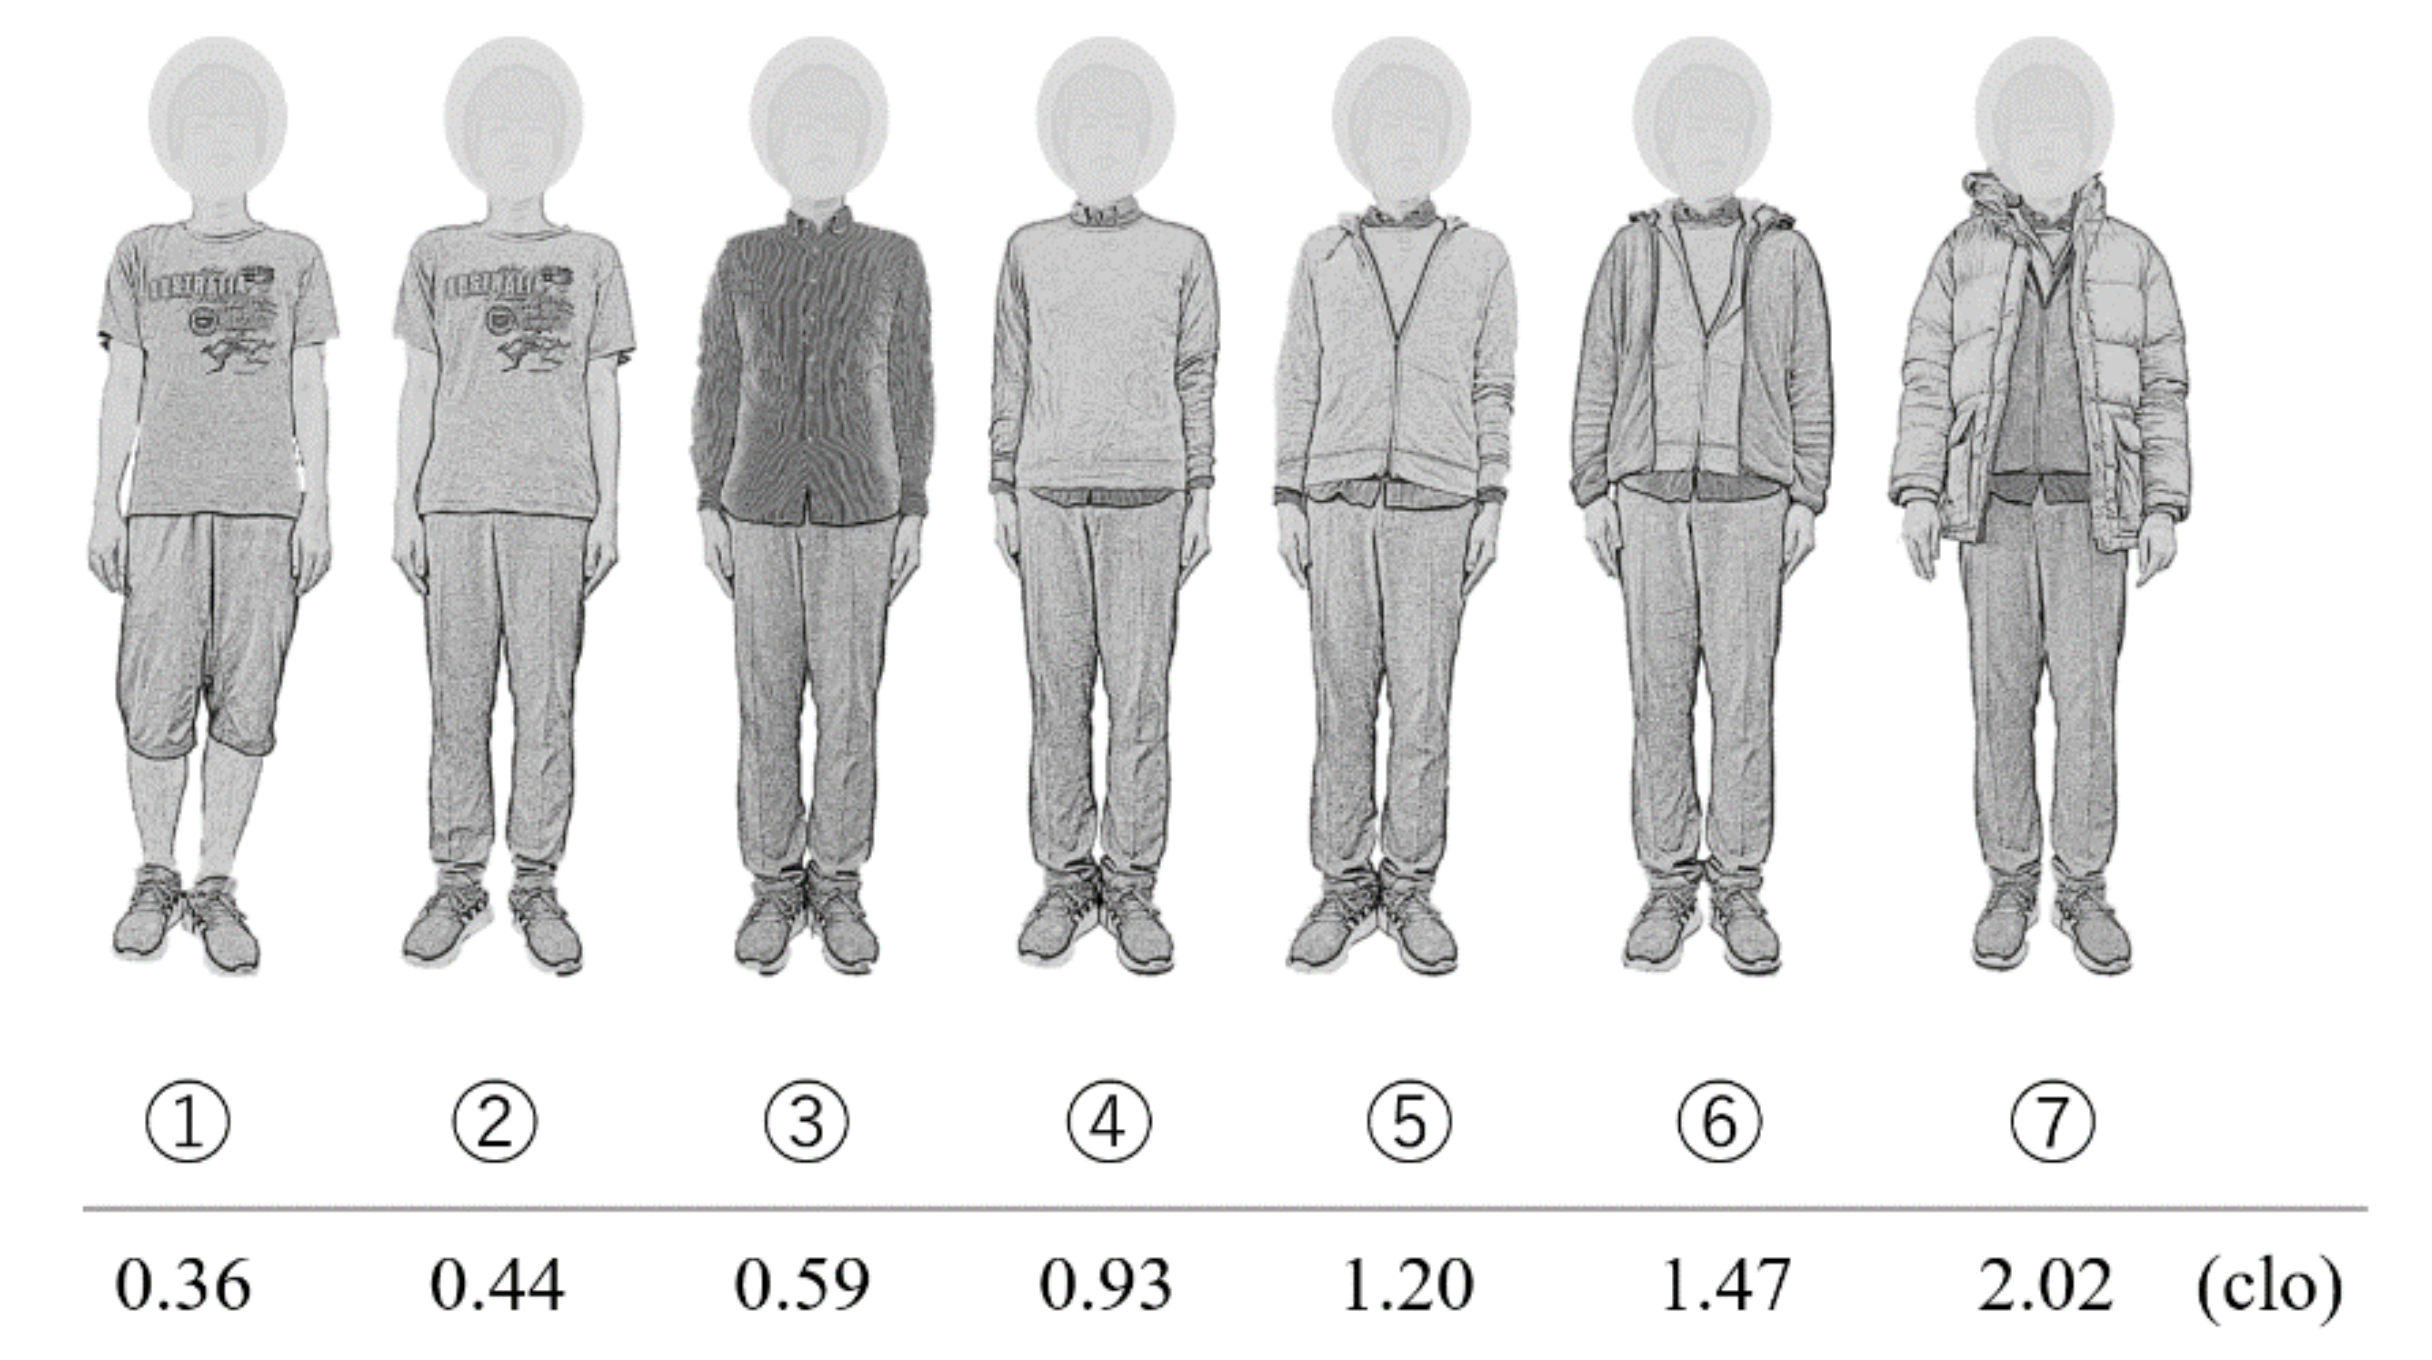
2.1.3. Characteristics of Residents
2.1.4. Thermal Indices
2.1.5. Comfort Zone
2.1.6. Adaptive Thermal Comfort Model
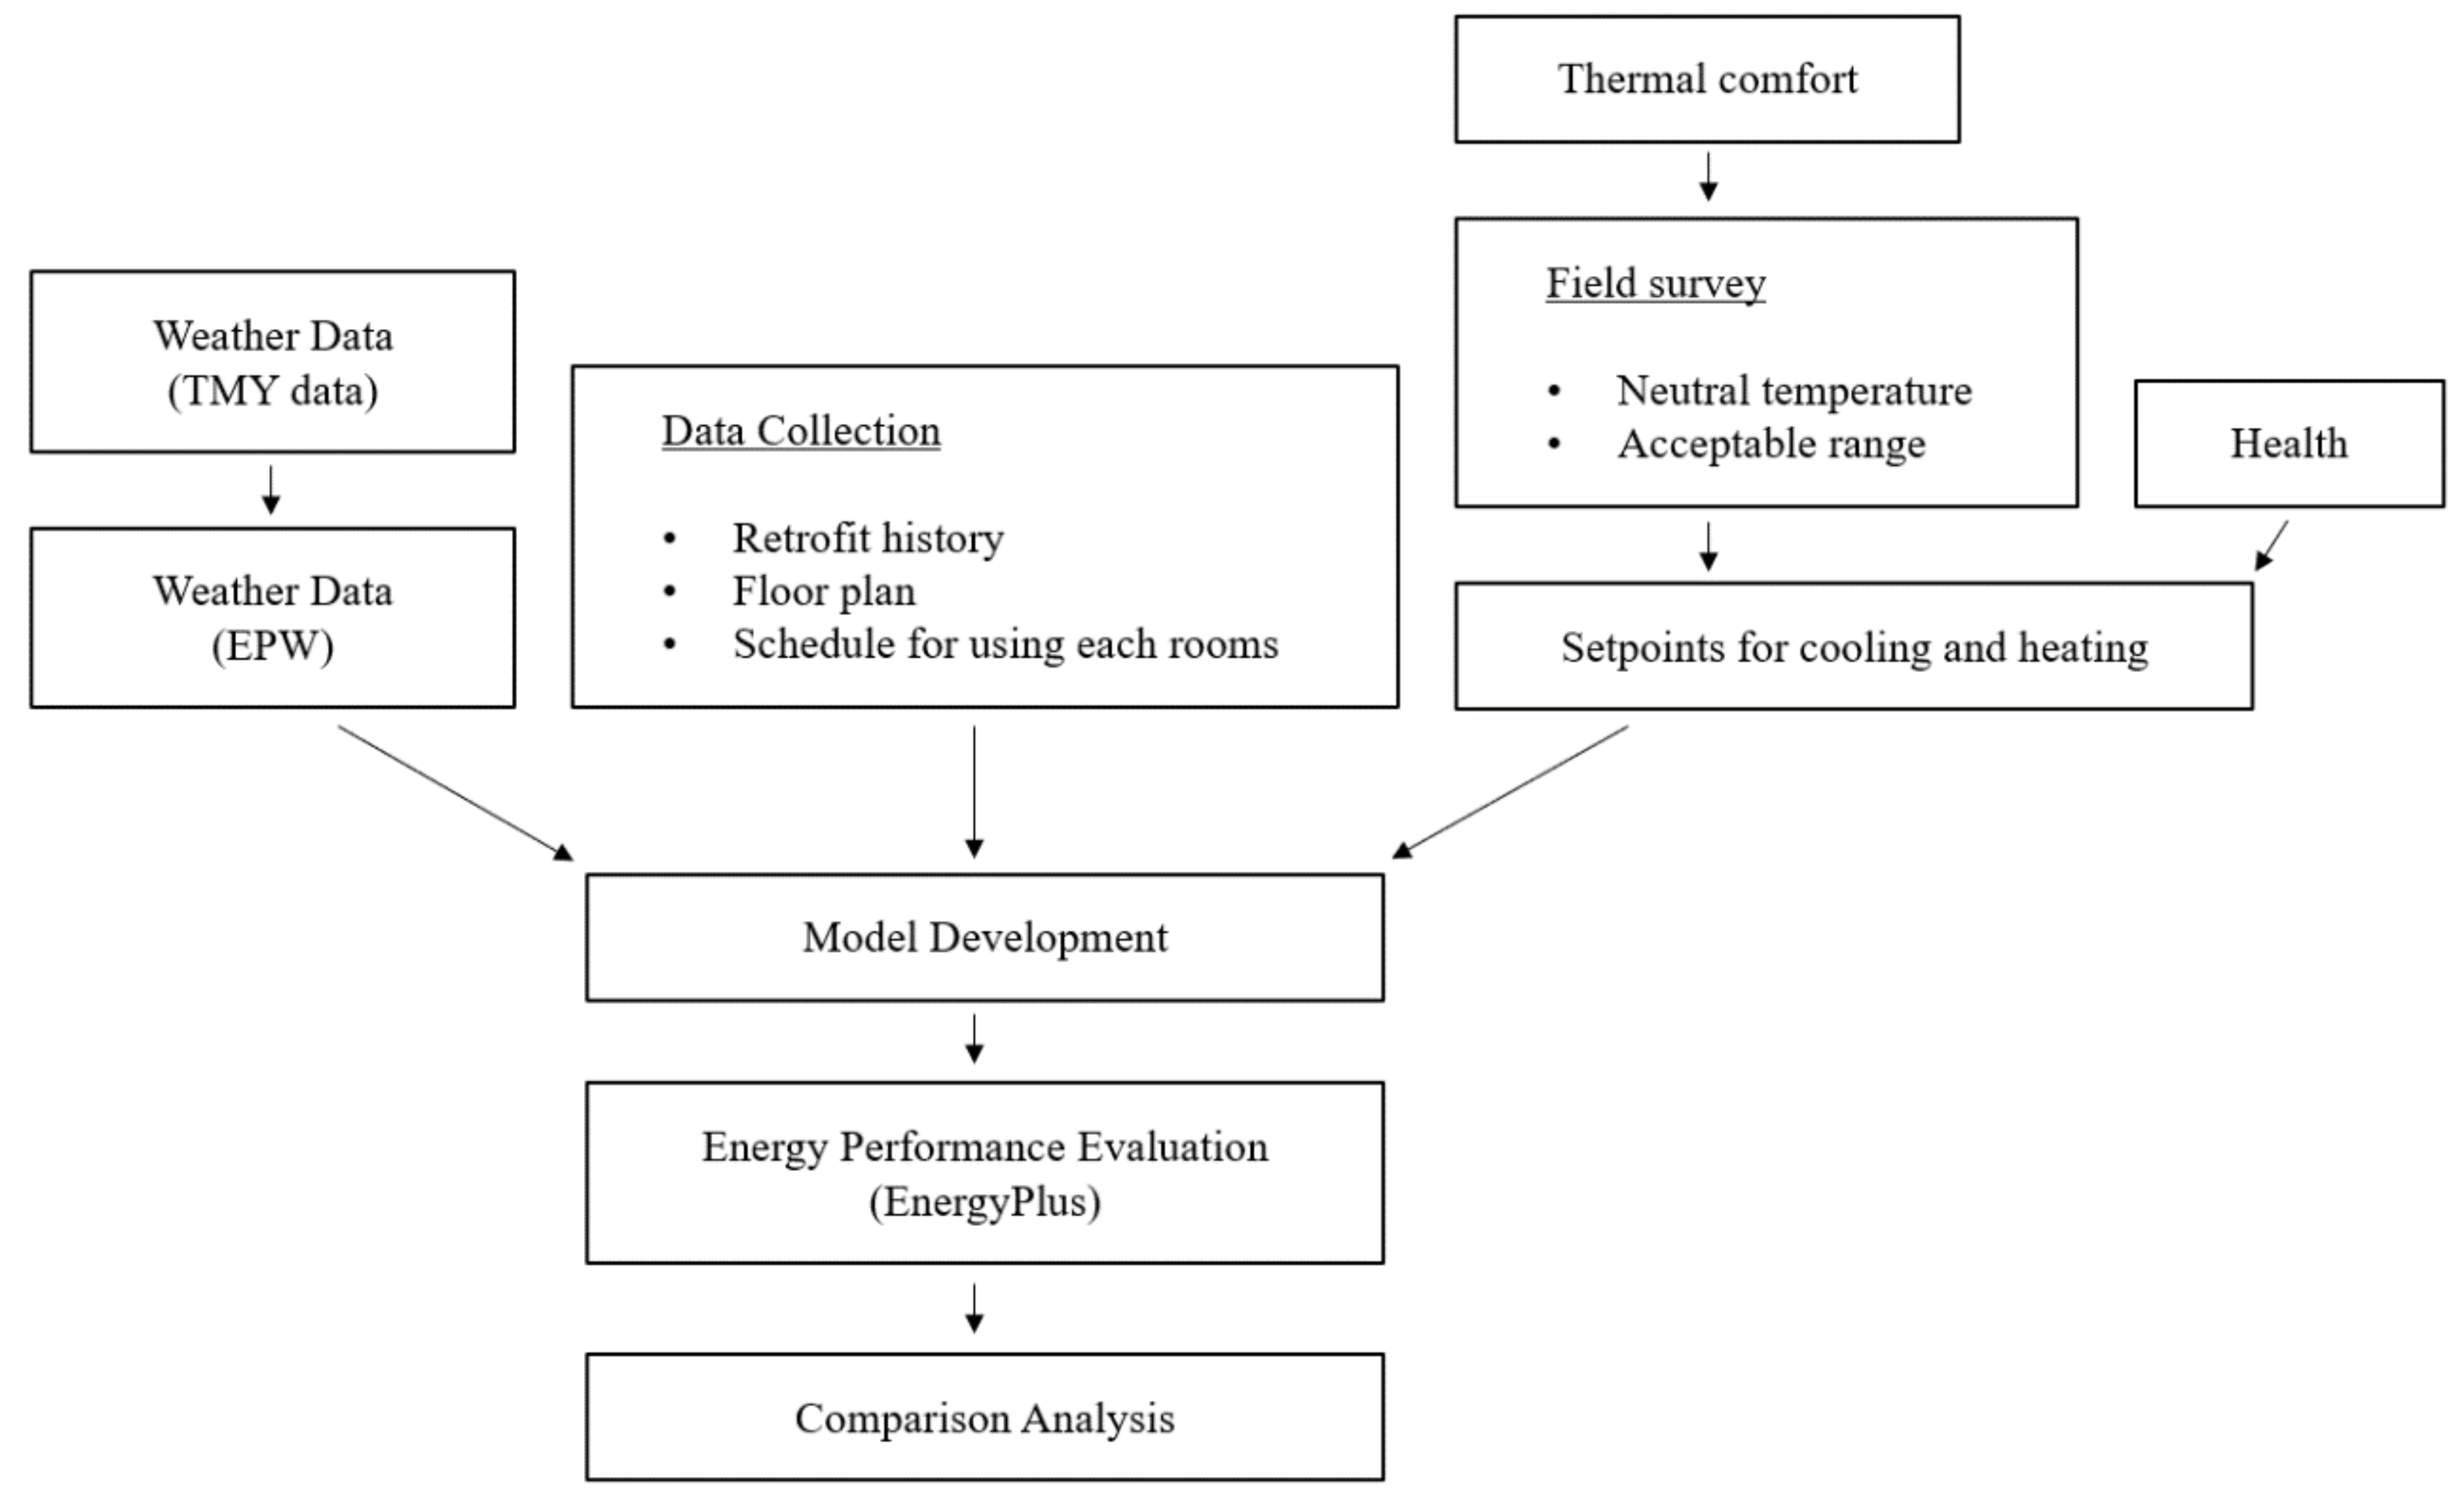
2.2. Building Energy Simulation
2.2.1. Weather Data
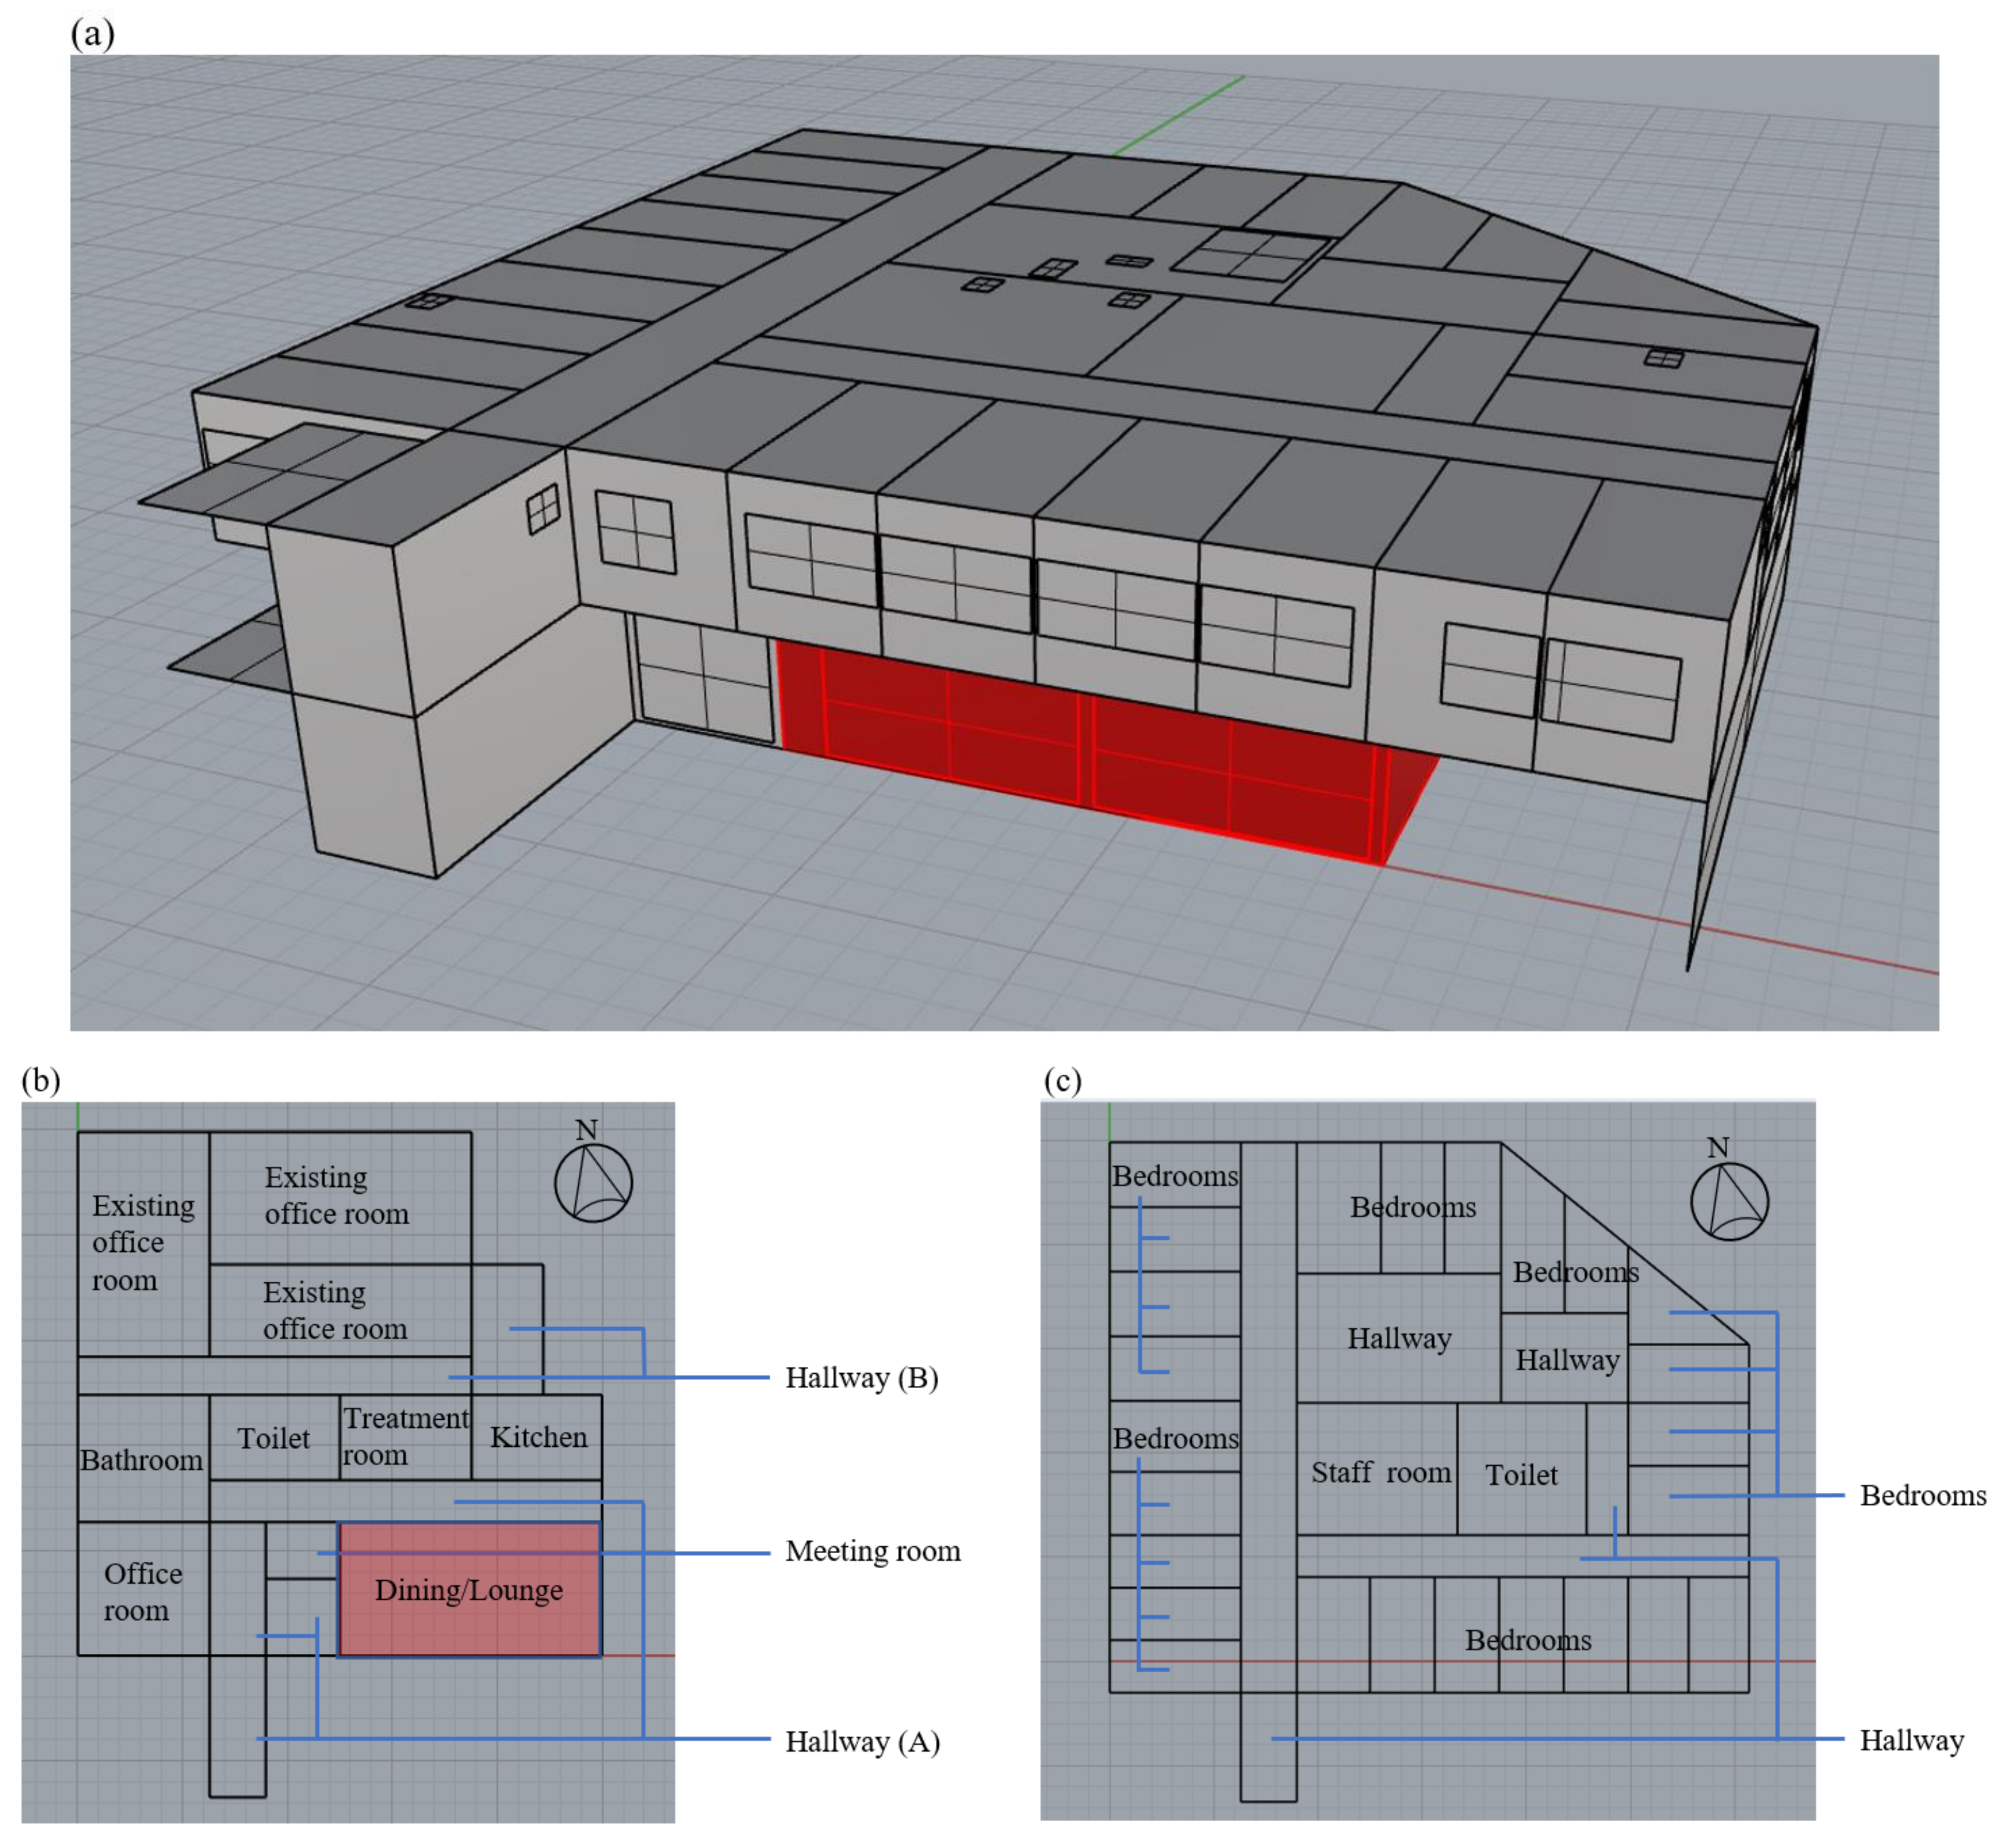
2.2.2. Building Data Collection and Development
2.2.3. Building Evaluation
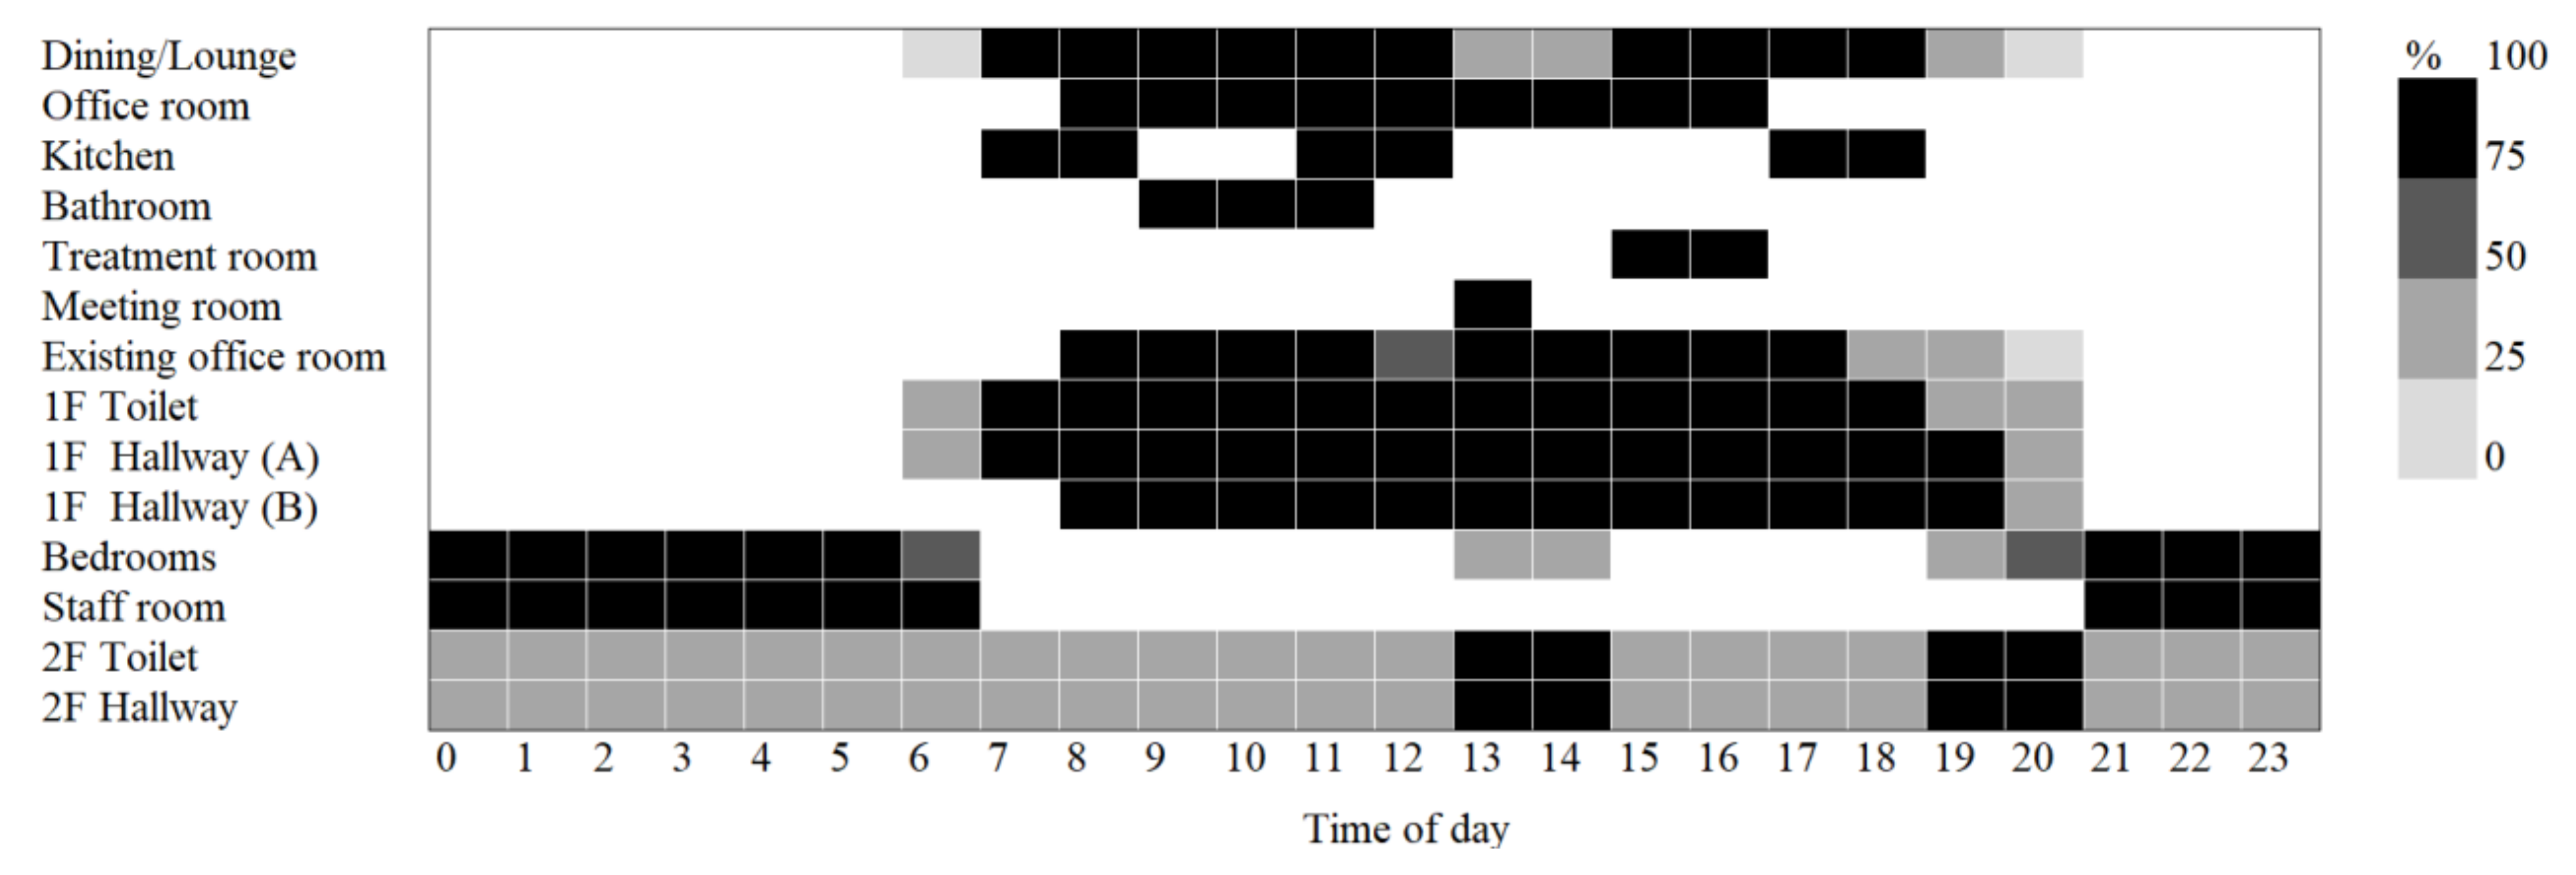
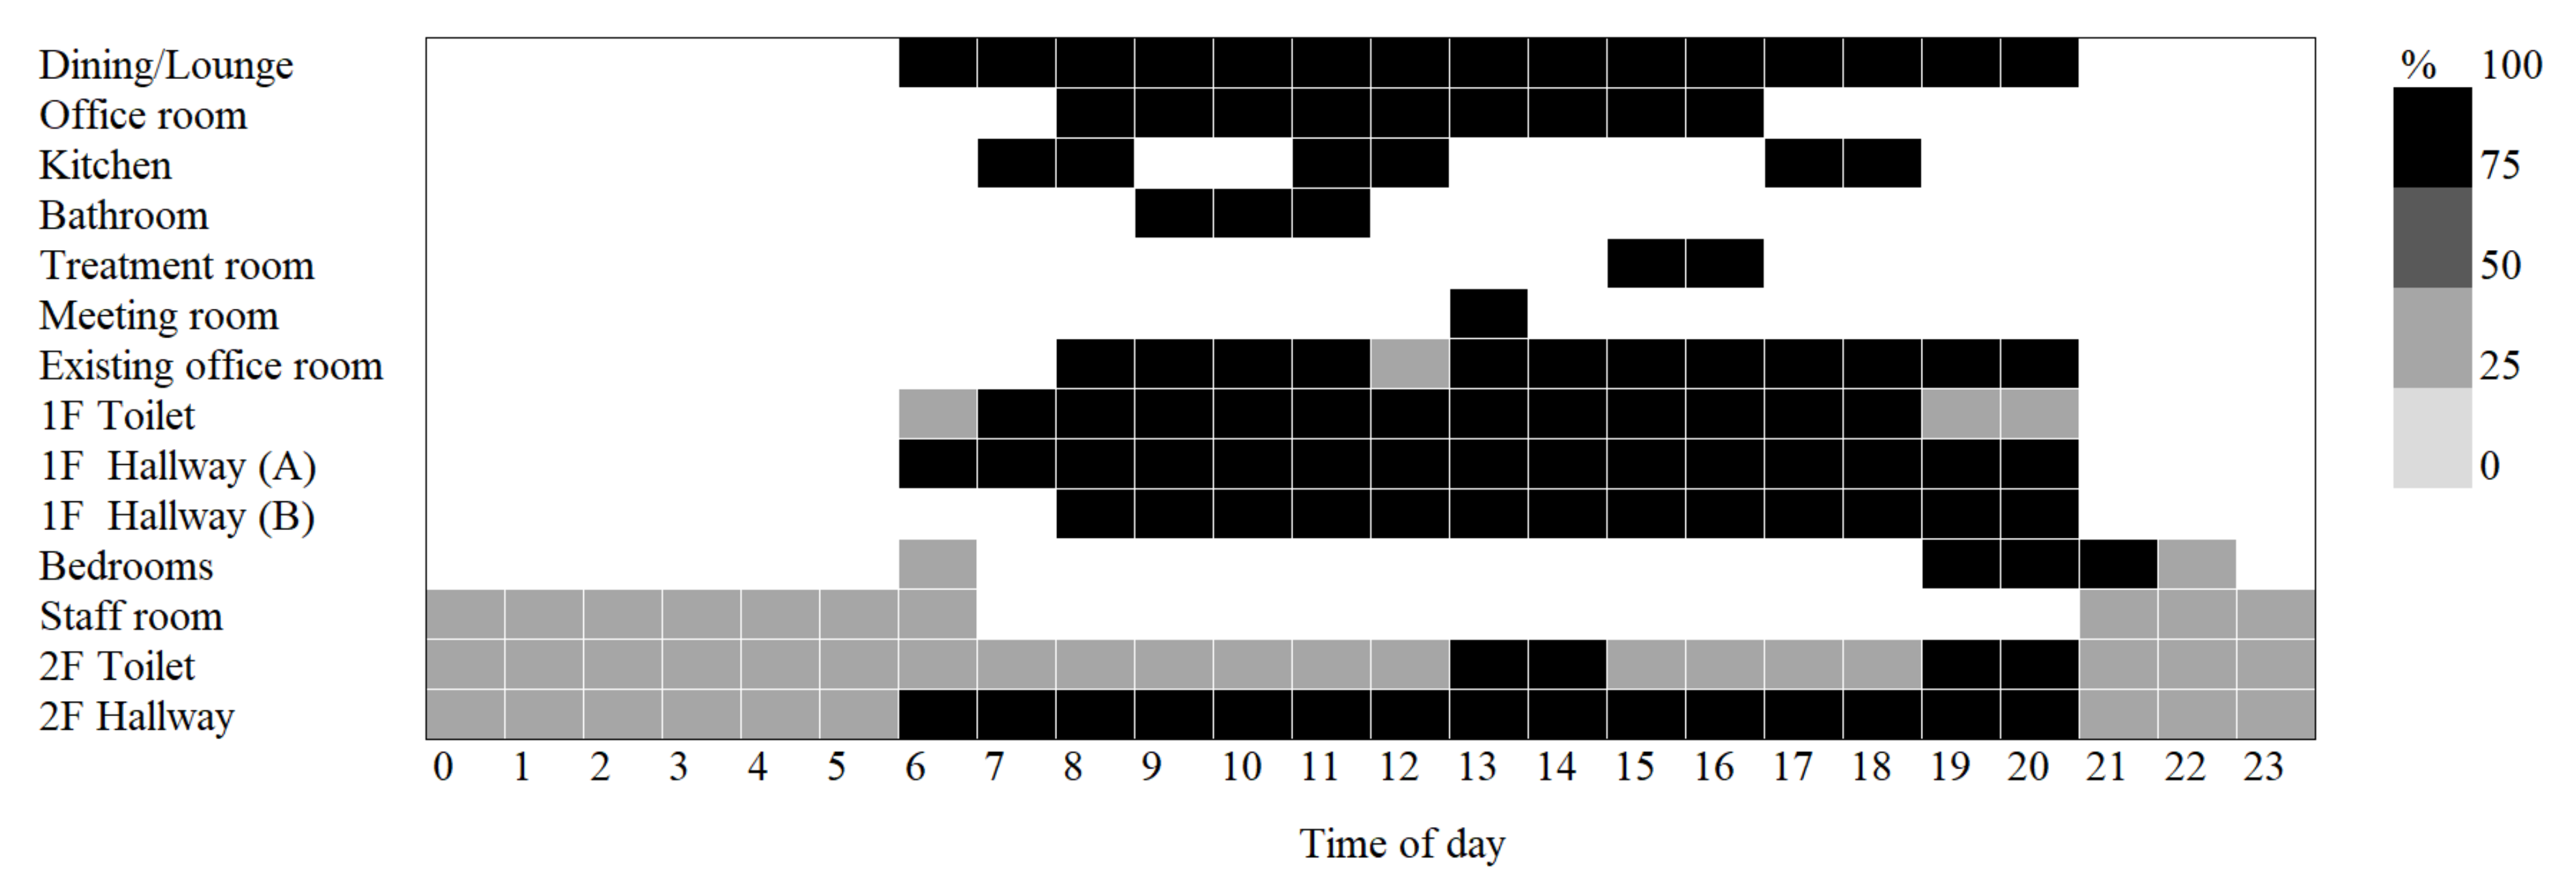
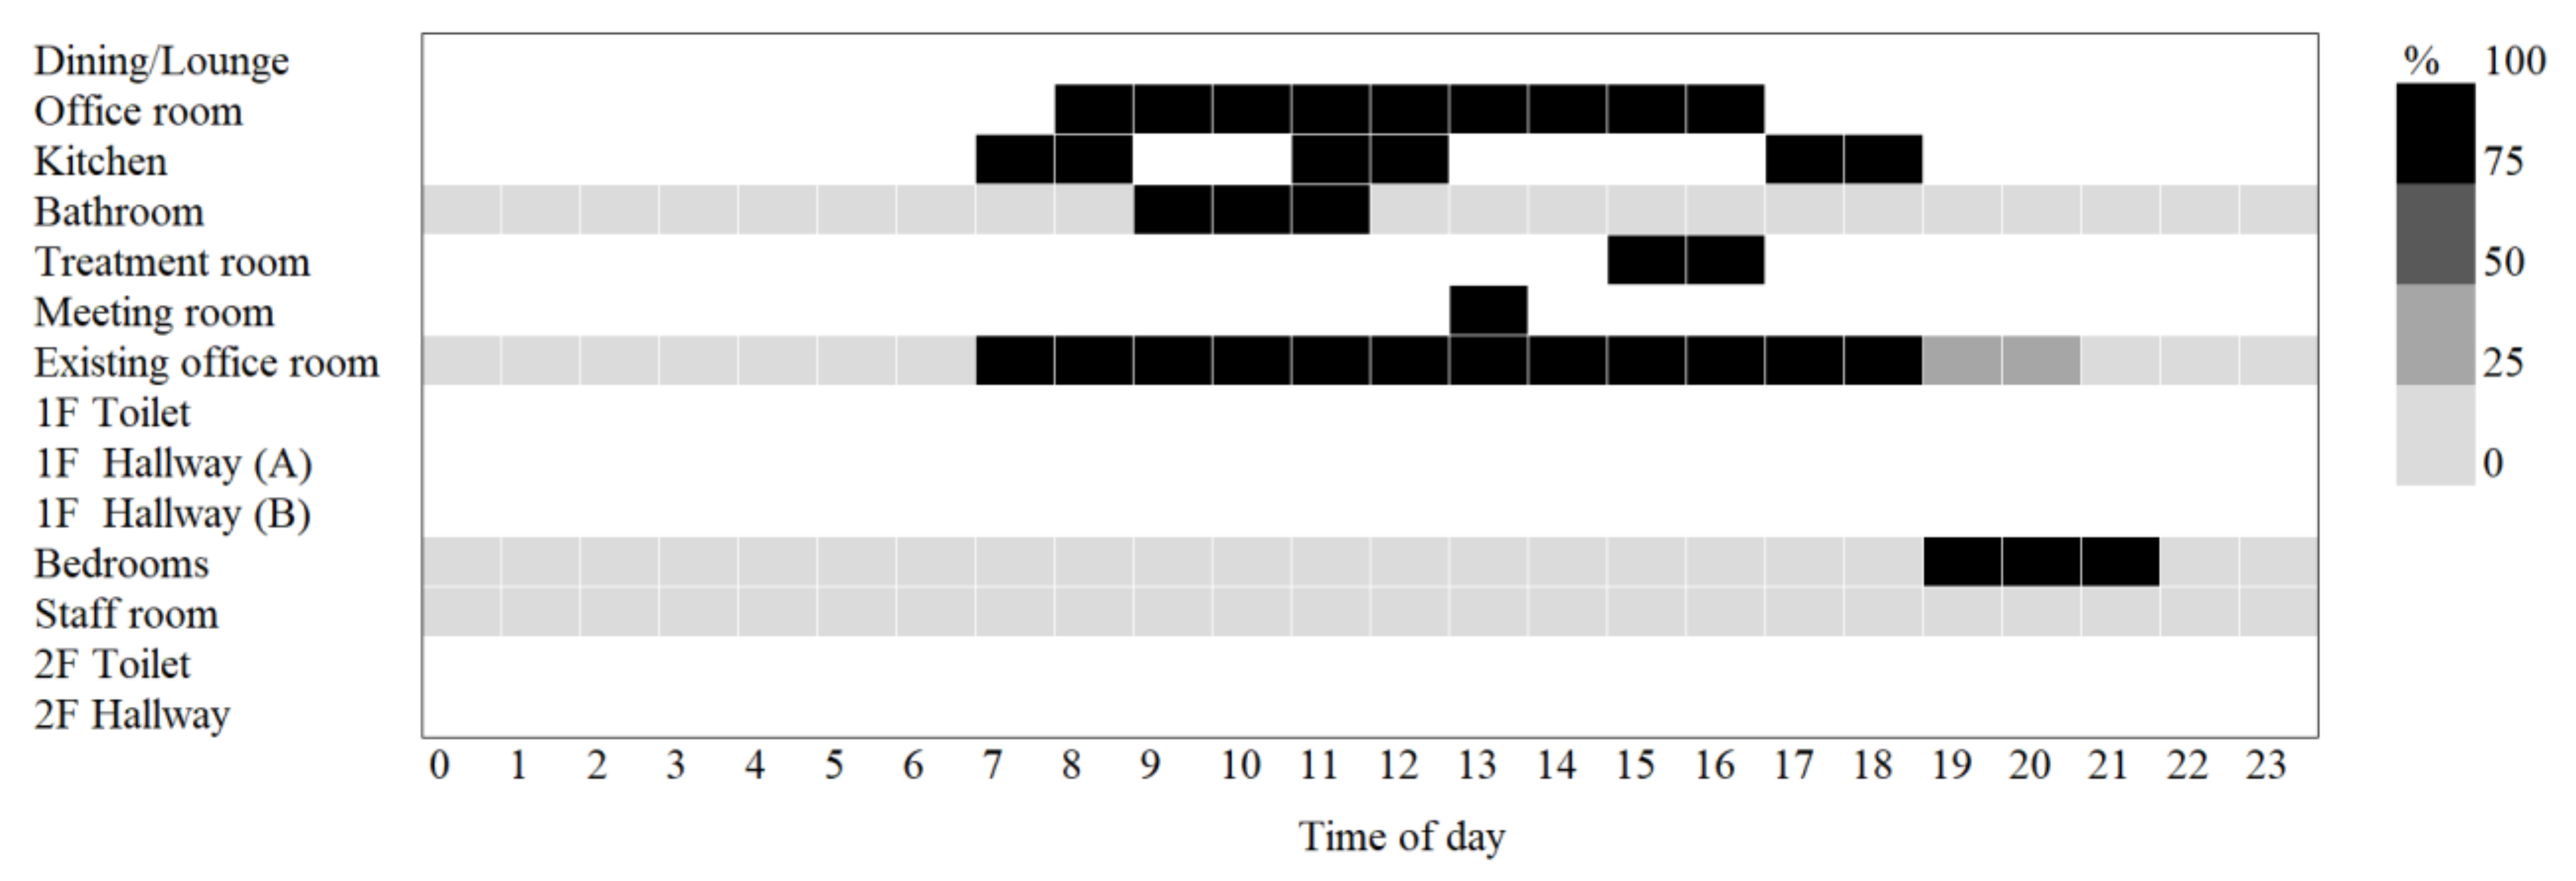
- Internal Heat Gains, Occupancy, and HVAC: The internal heat gains and occupancy of the building were set based on the room usage of each zone and the room usage schedule of the occupants, referring to the standard room usage conditions [61] according to the Japanese energy conservation act. The internal heat gain and occupancy of the elderly facility were selected from the room usages of the hospital and hotel, referring to the previous study by San et al. [42]. The internal heat gain and occupancy of the existing office were selected from the room usage of the office. To be consistent with the daily room usage schedule in the elderly facility, the internal heat gain and occupancy assumed in the elderly facility were adjusted based on the information collected in the interview survey. Table 6 shows the activity levels of the occupants, the heat generation by lighting, and the heat generation by equipment in each zone. In addition, the occupancy is shown in Figure 9, the lighting schedule is shown in Figure 10, and the equipment schedule is shown in Figure 11.
- 2.
- Construction System: The structural elements of the building and their respective characteristics are shown in Table 7, Table 8 and Table 9. There were three exterior walls and two roof configuration patterns, which were arranged according to the architectural drawings. Three types of U-values were established for windows, corresponding to (1) single-glazed glass + composite frame of resin and metal, (2) double-glazed glass (dry air) + metal frame, and (3) triple-glazed Low-E (gas) + composite frame of resin and metal, respectively [63]. To examine the effect of solar radiation in windows, (4) single-glazed glass + composite frame of resin and metal + heat shield film [64] was added to the comparison. The U-values and solar heat gain coefficients (SHGC) of the windows are shown in Table 10.
2.2.4. Comparison Analysis
3. Results and Discussion
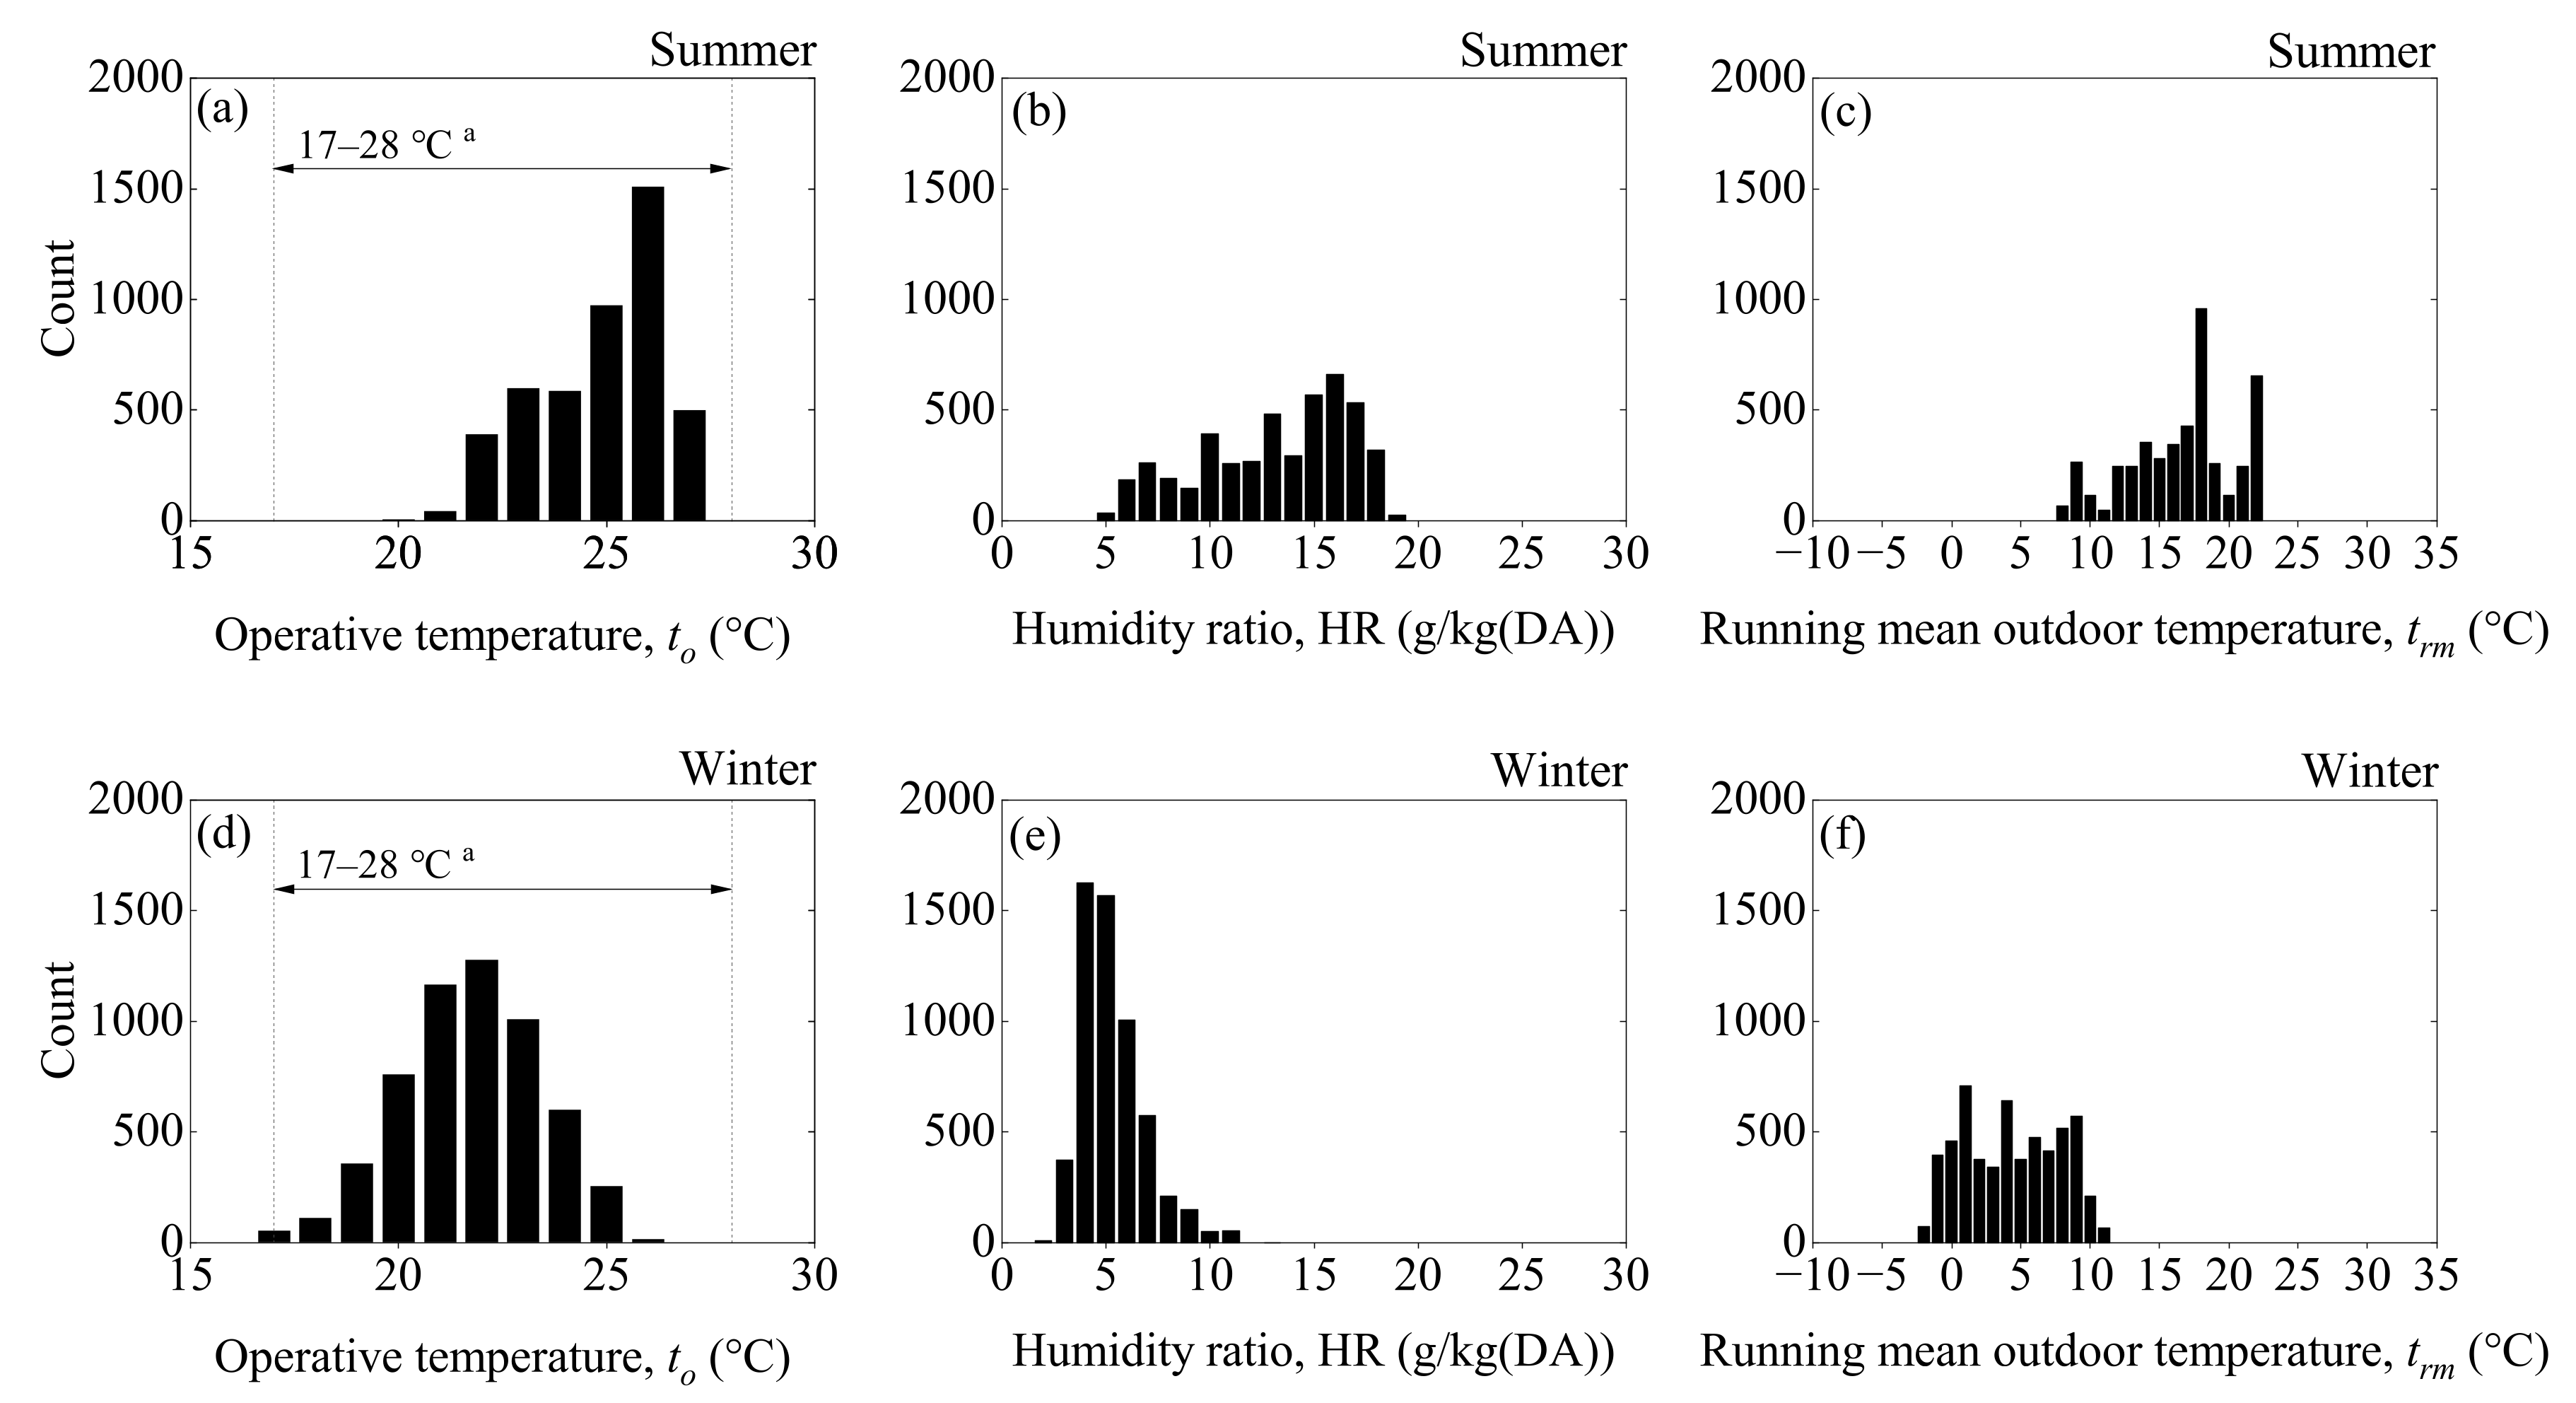
3.1. Measured Results of Thermal Comfort
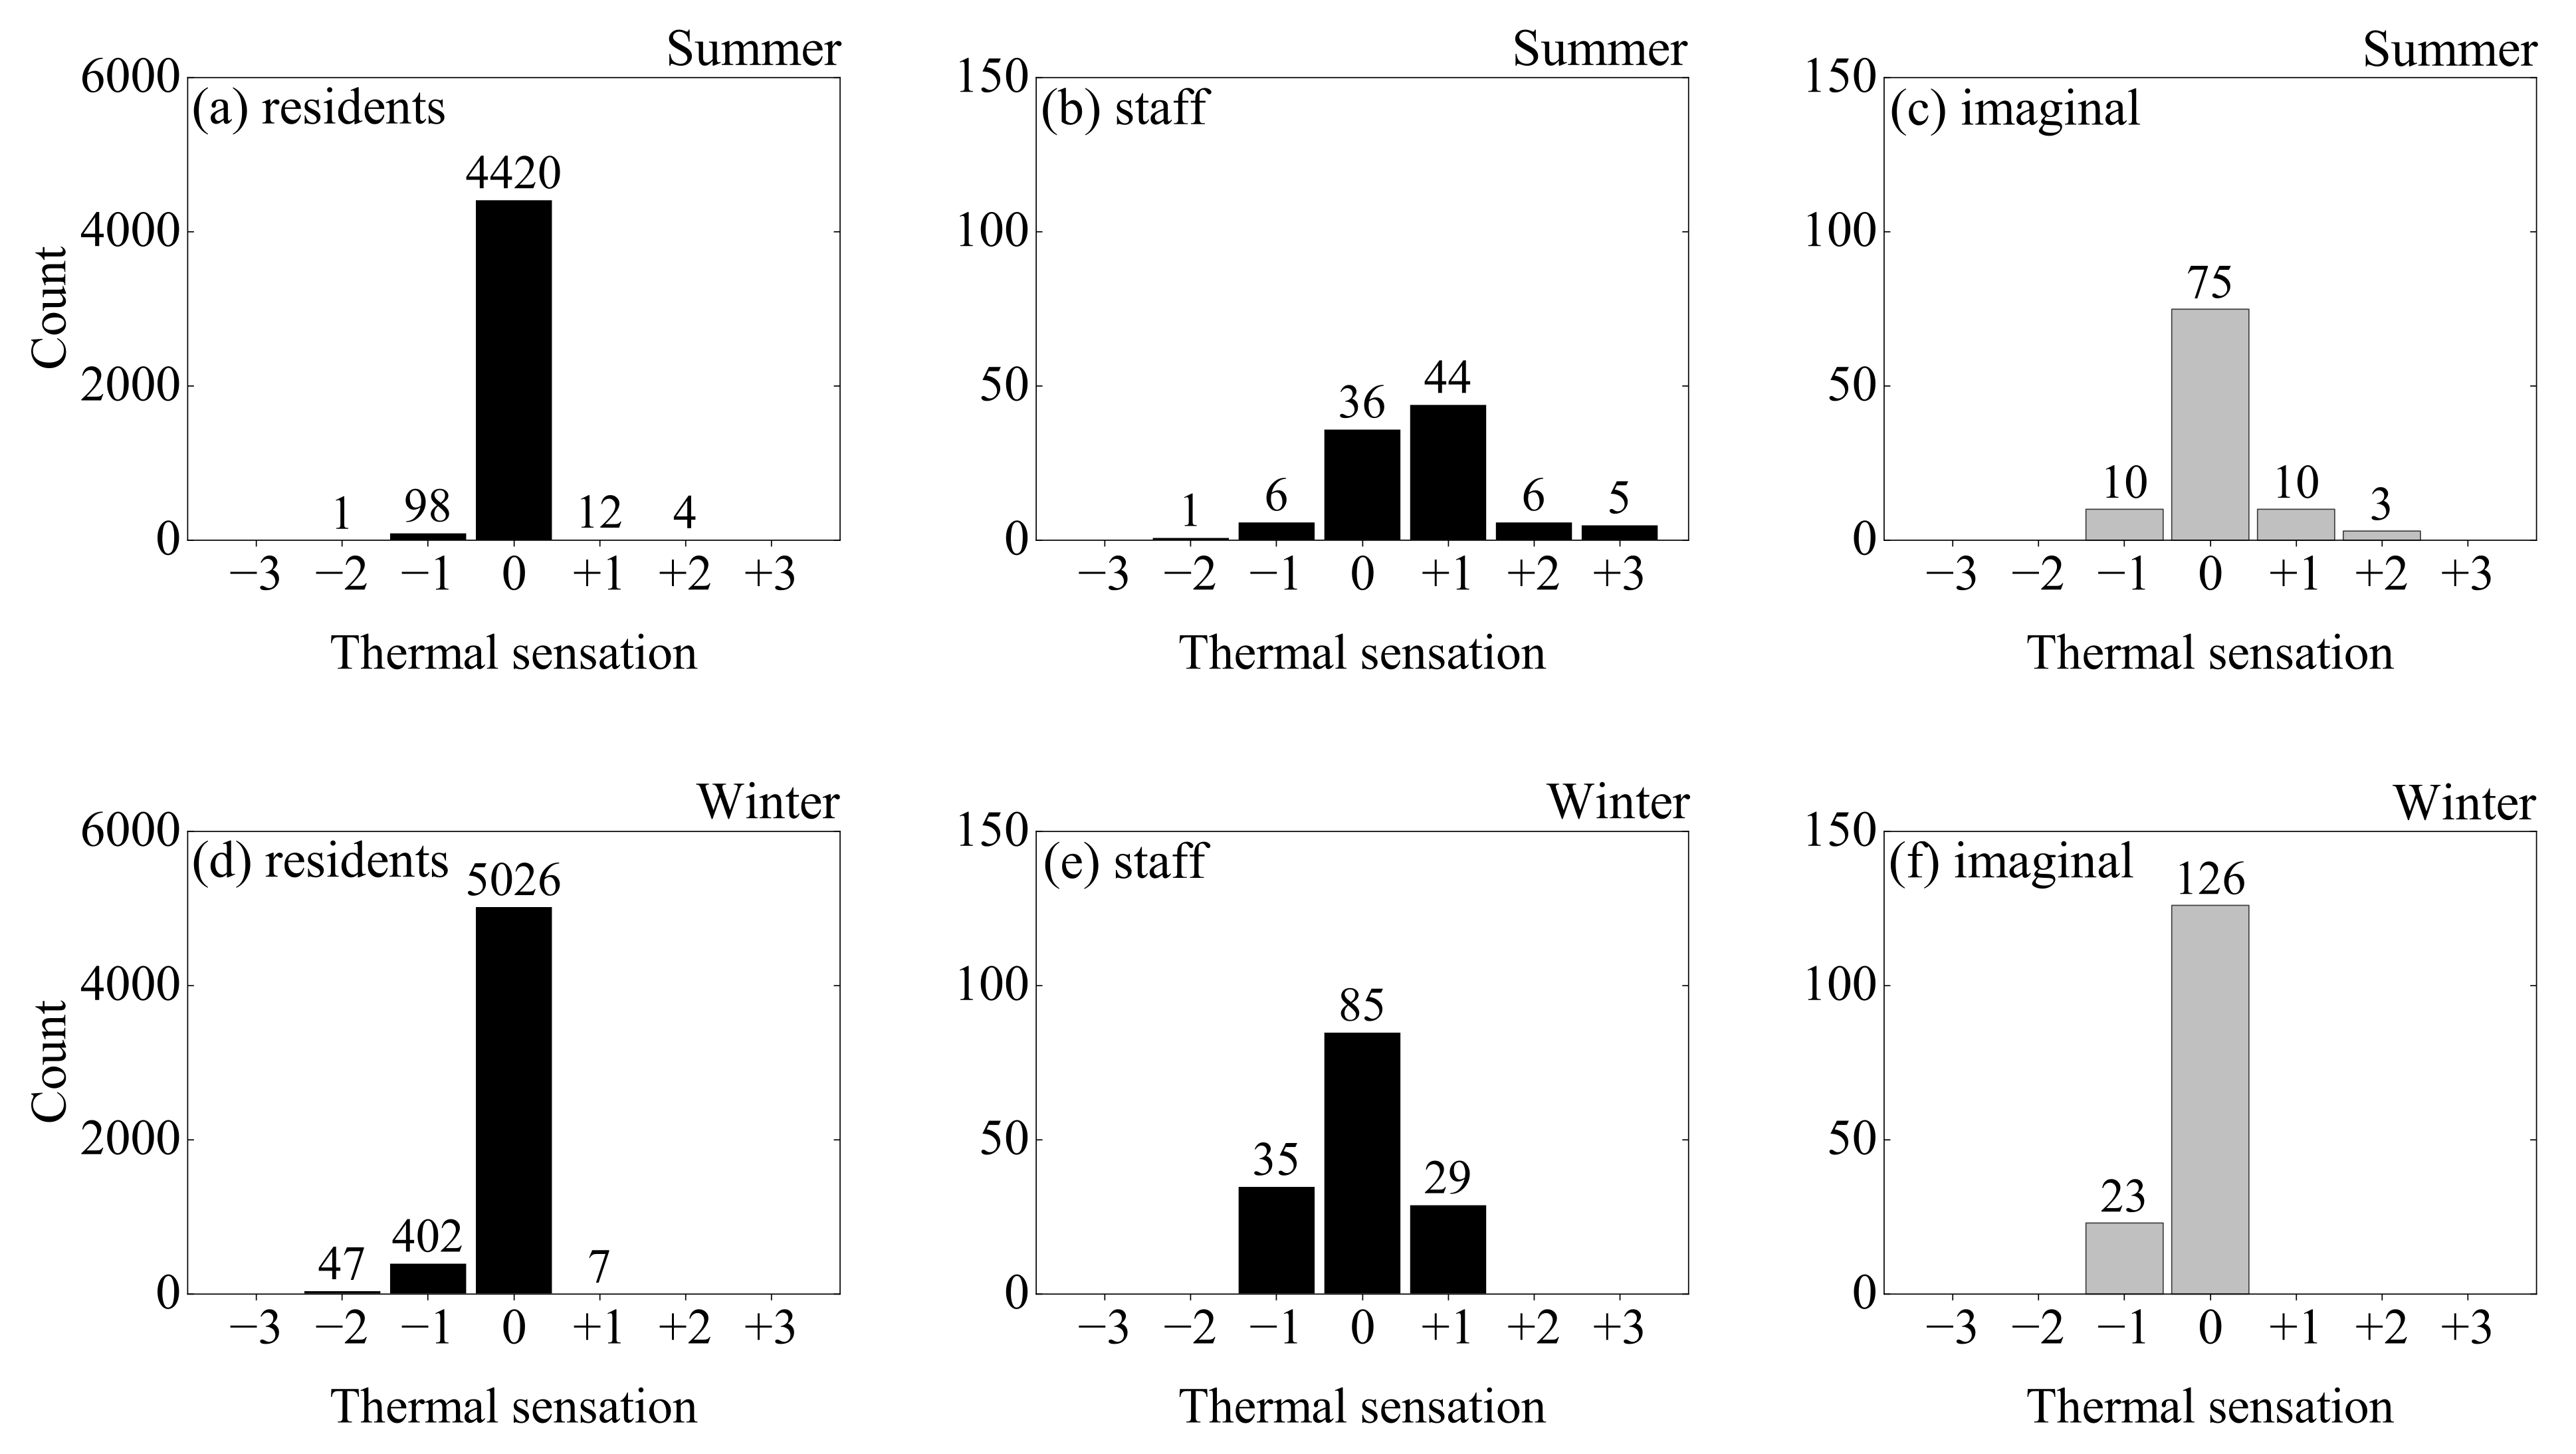
3.2. Distribution of Thermal Sensation
3.3. Linear Regression Analysis
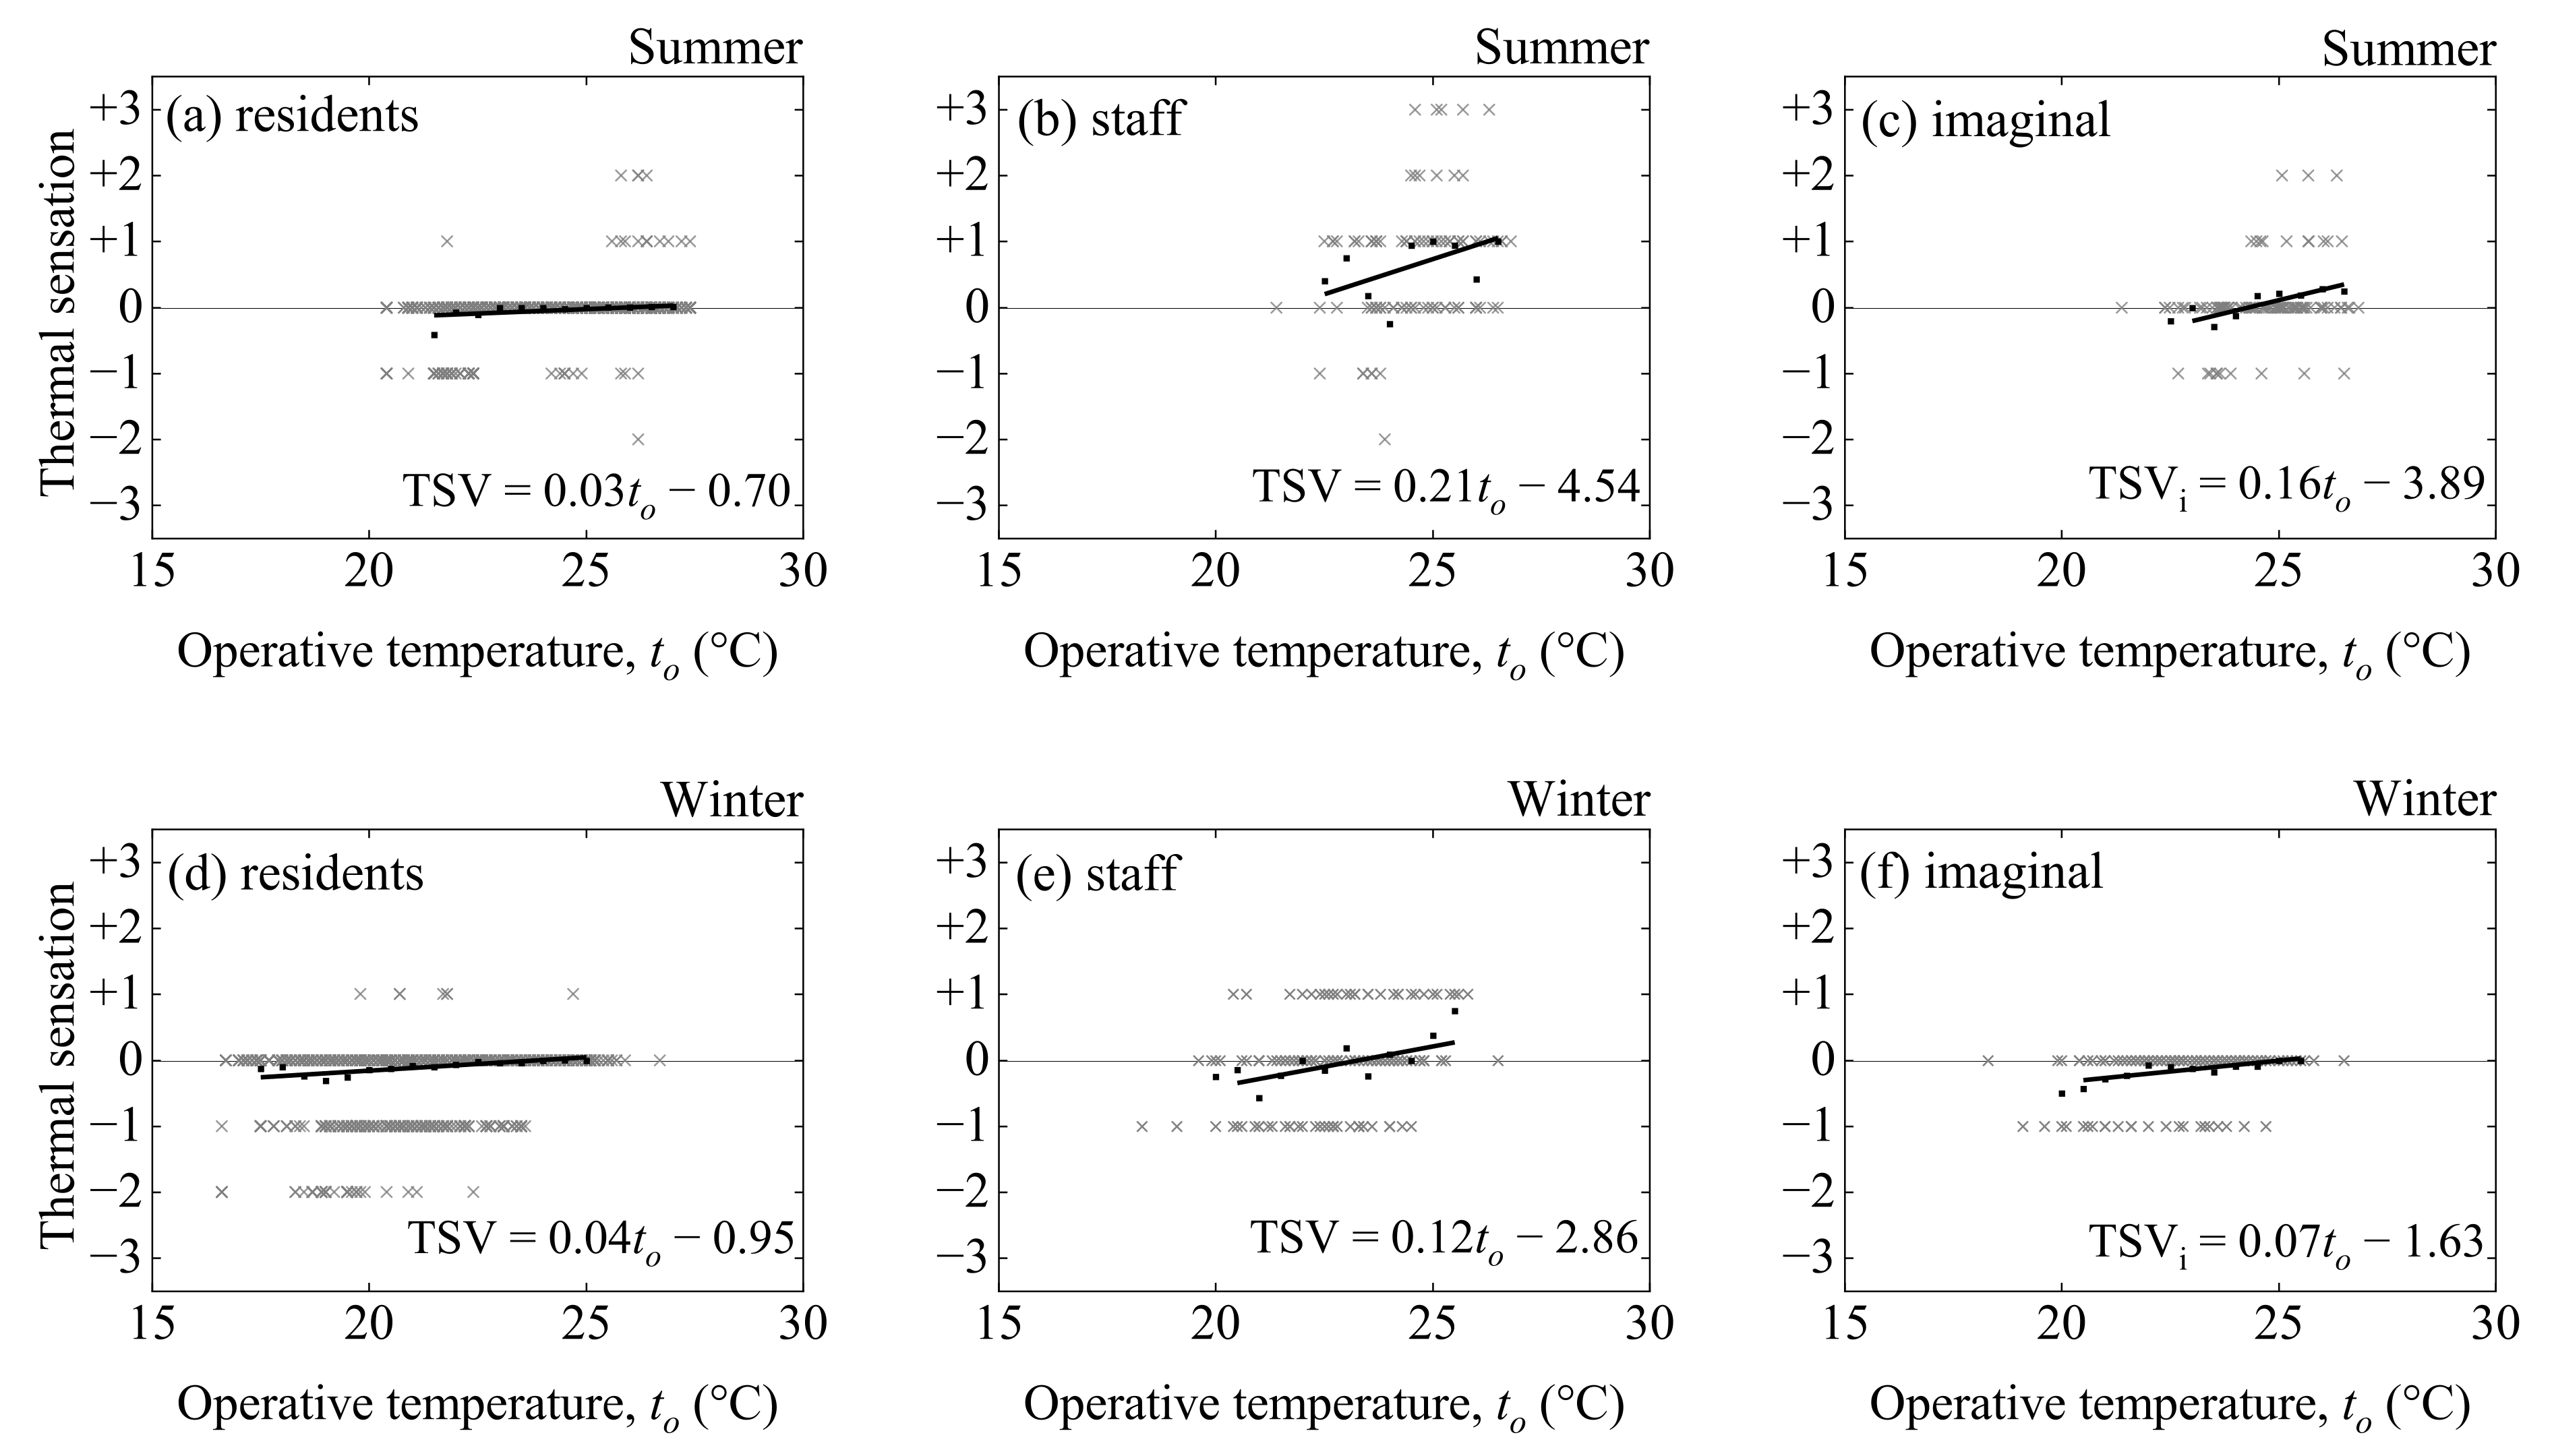
3.3.1. Linear Regression of TSV and TSVi
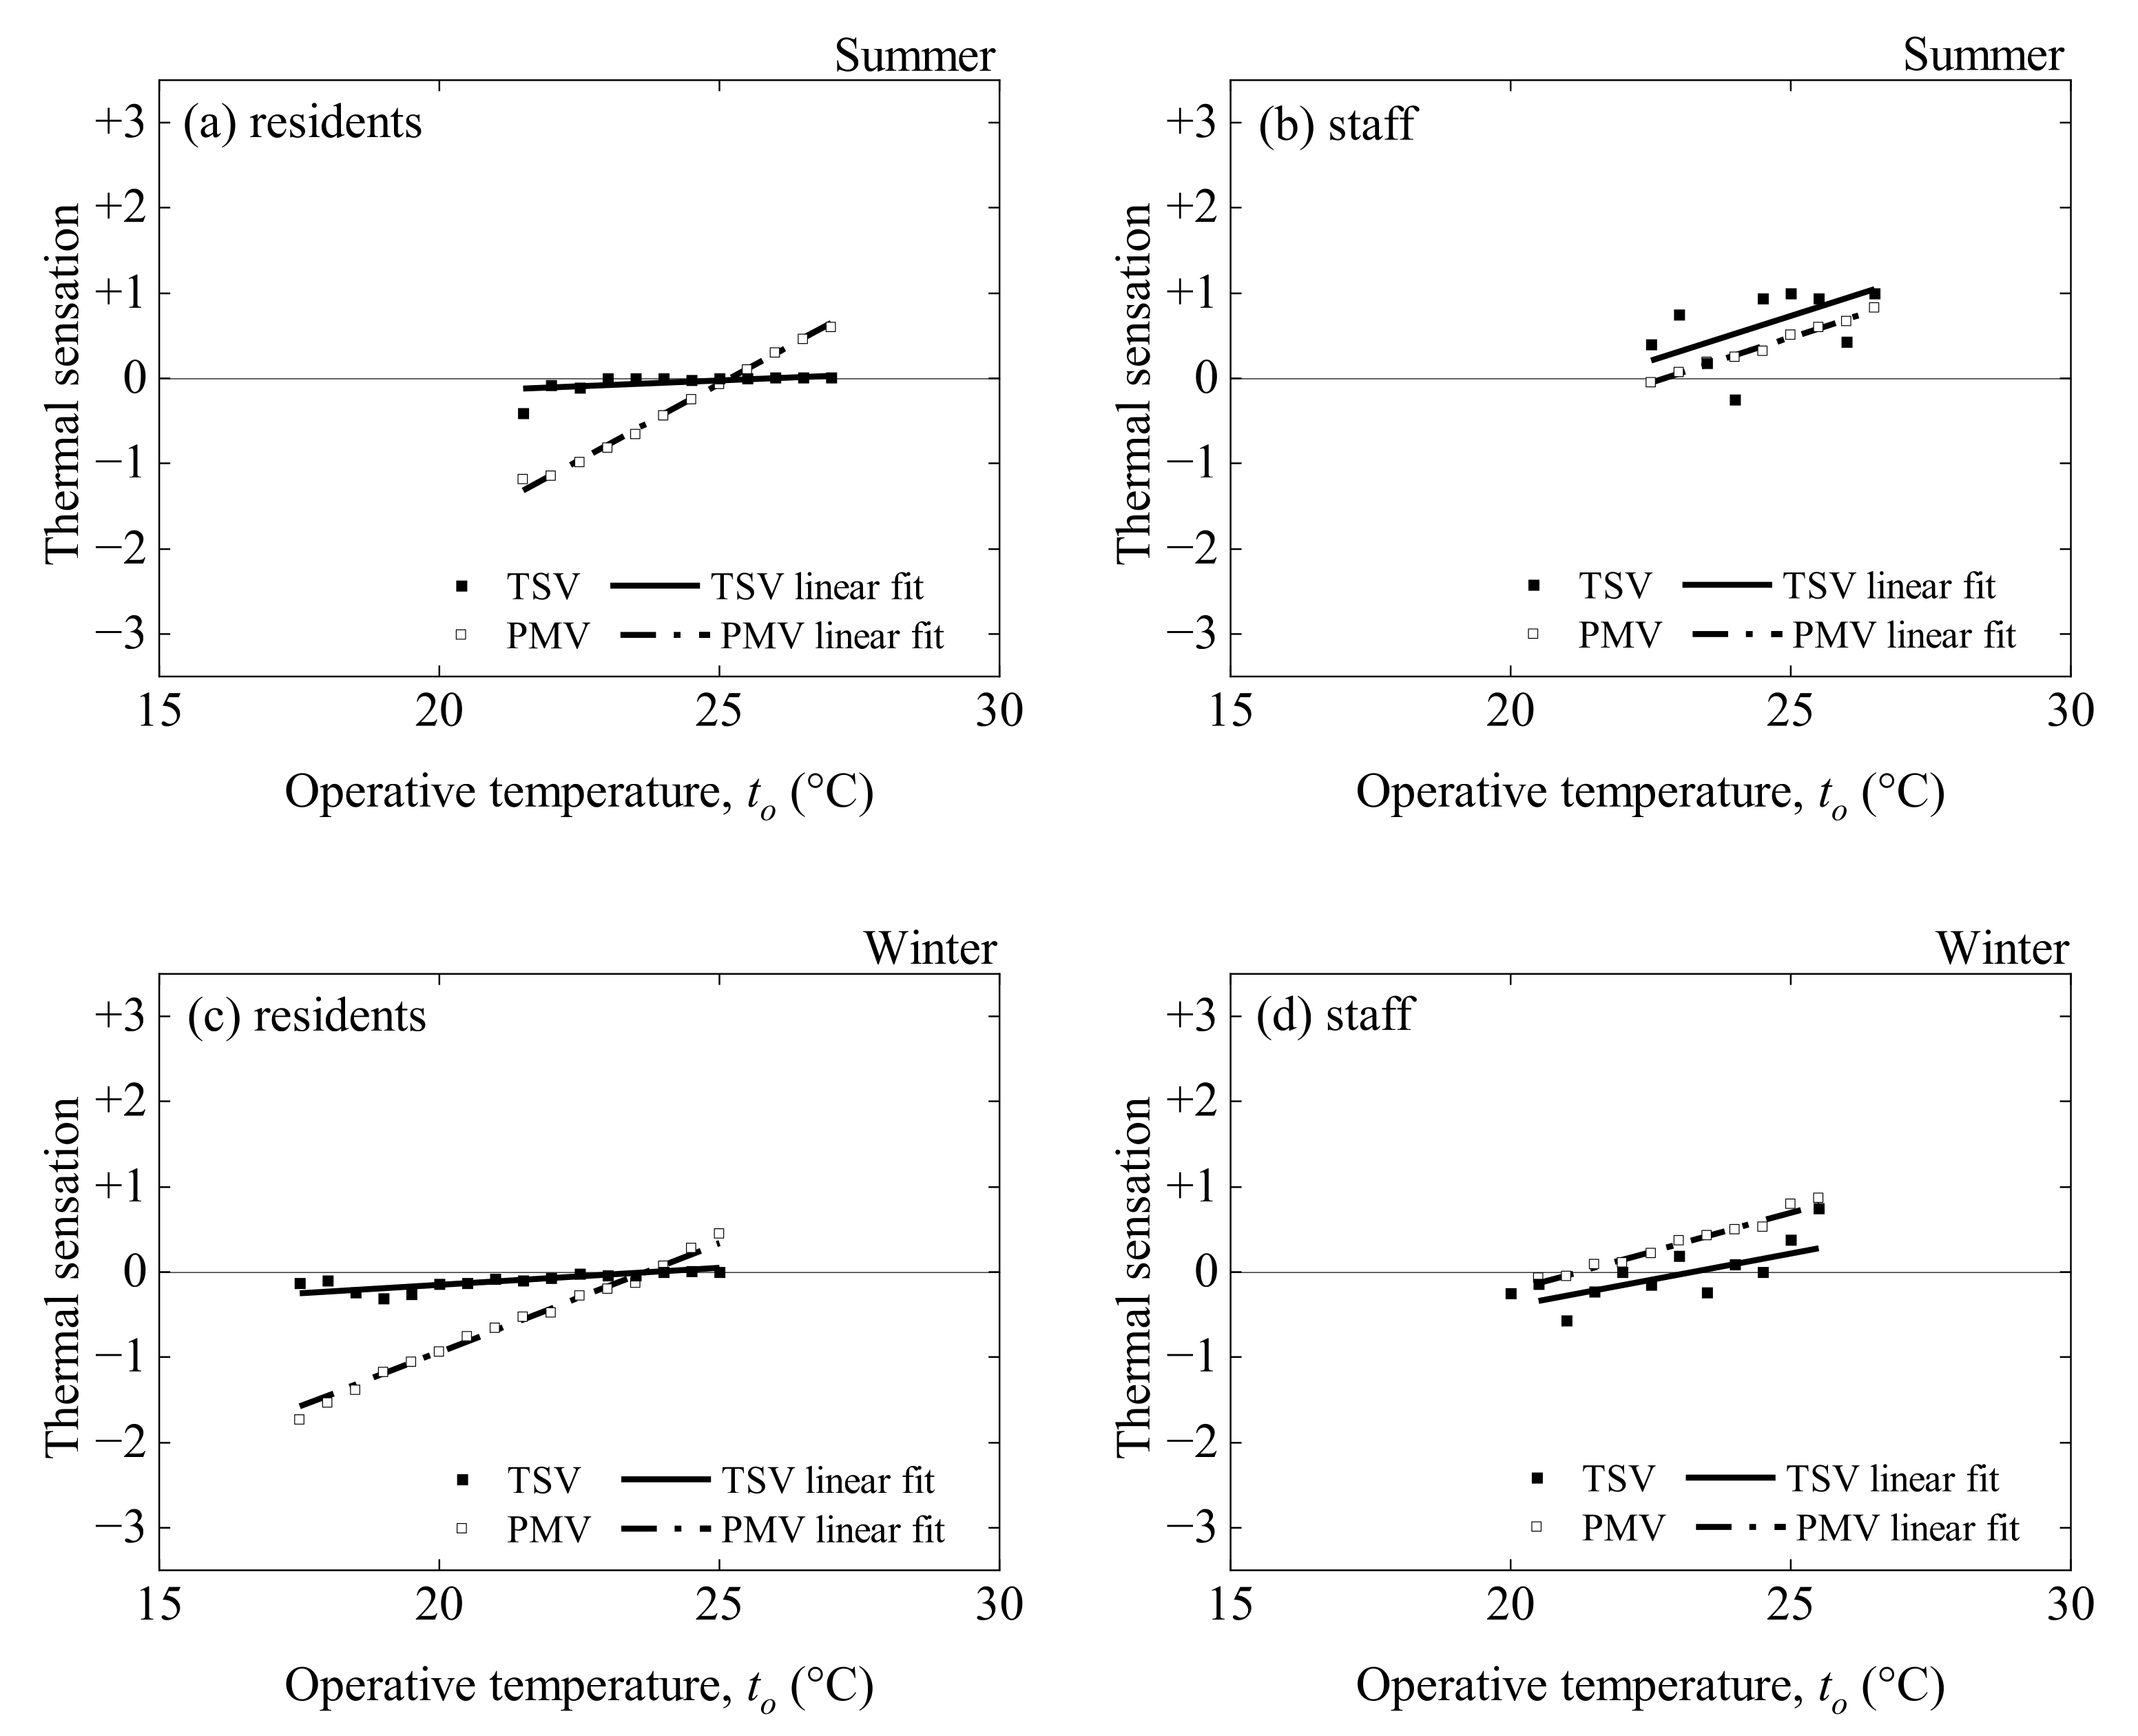
3.3.2. Linear Regression of PMV
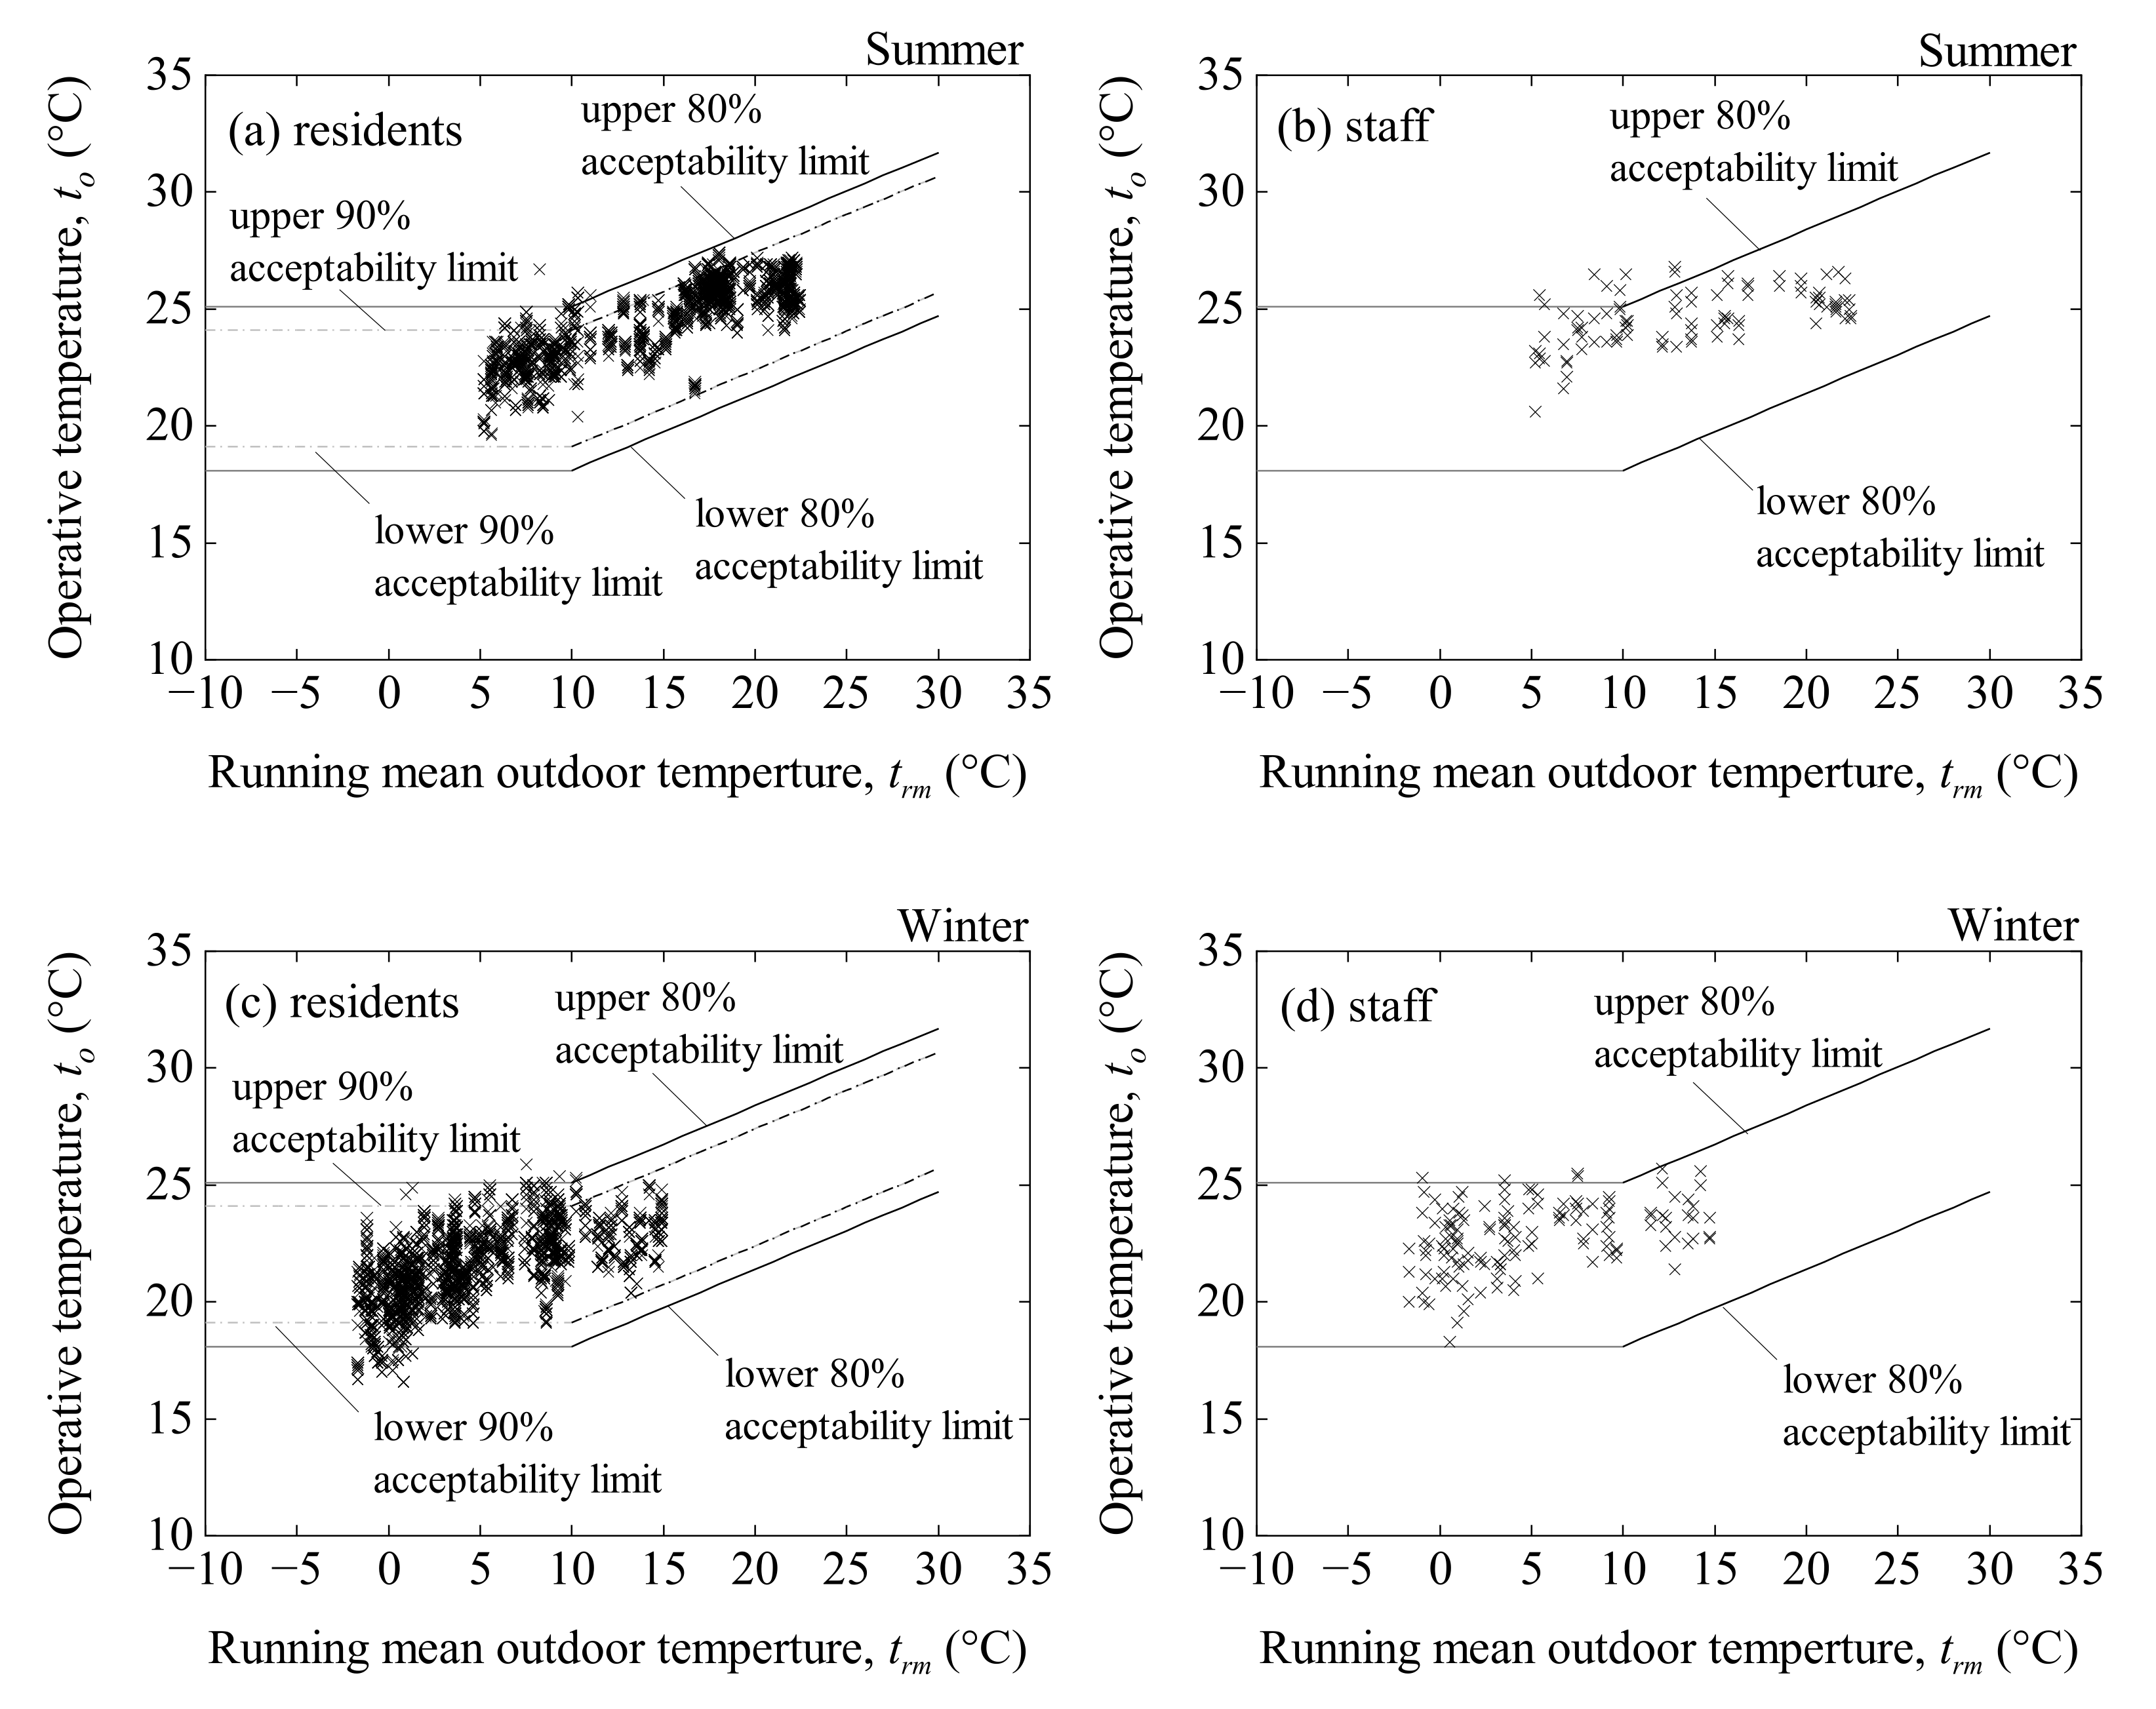
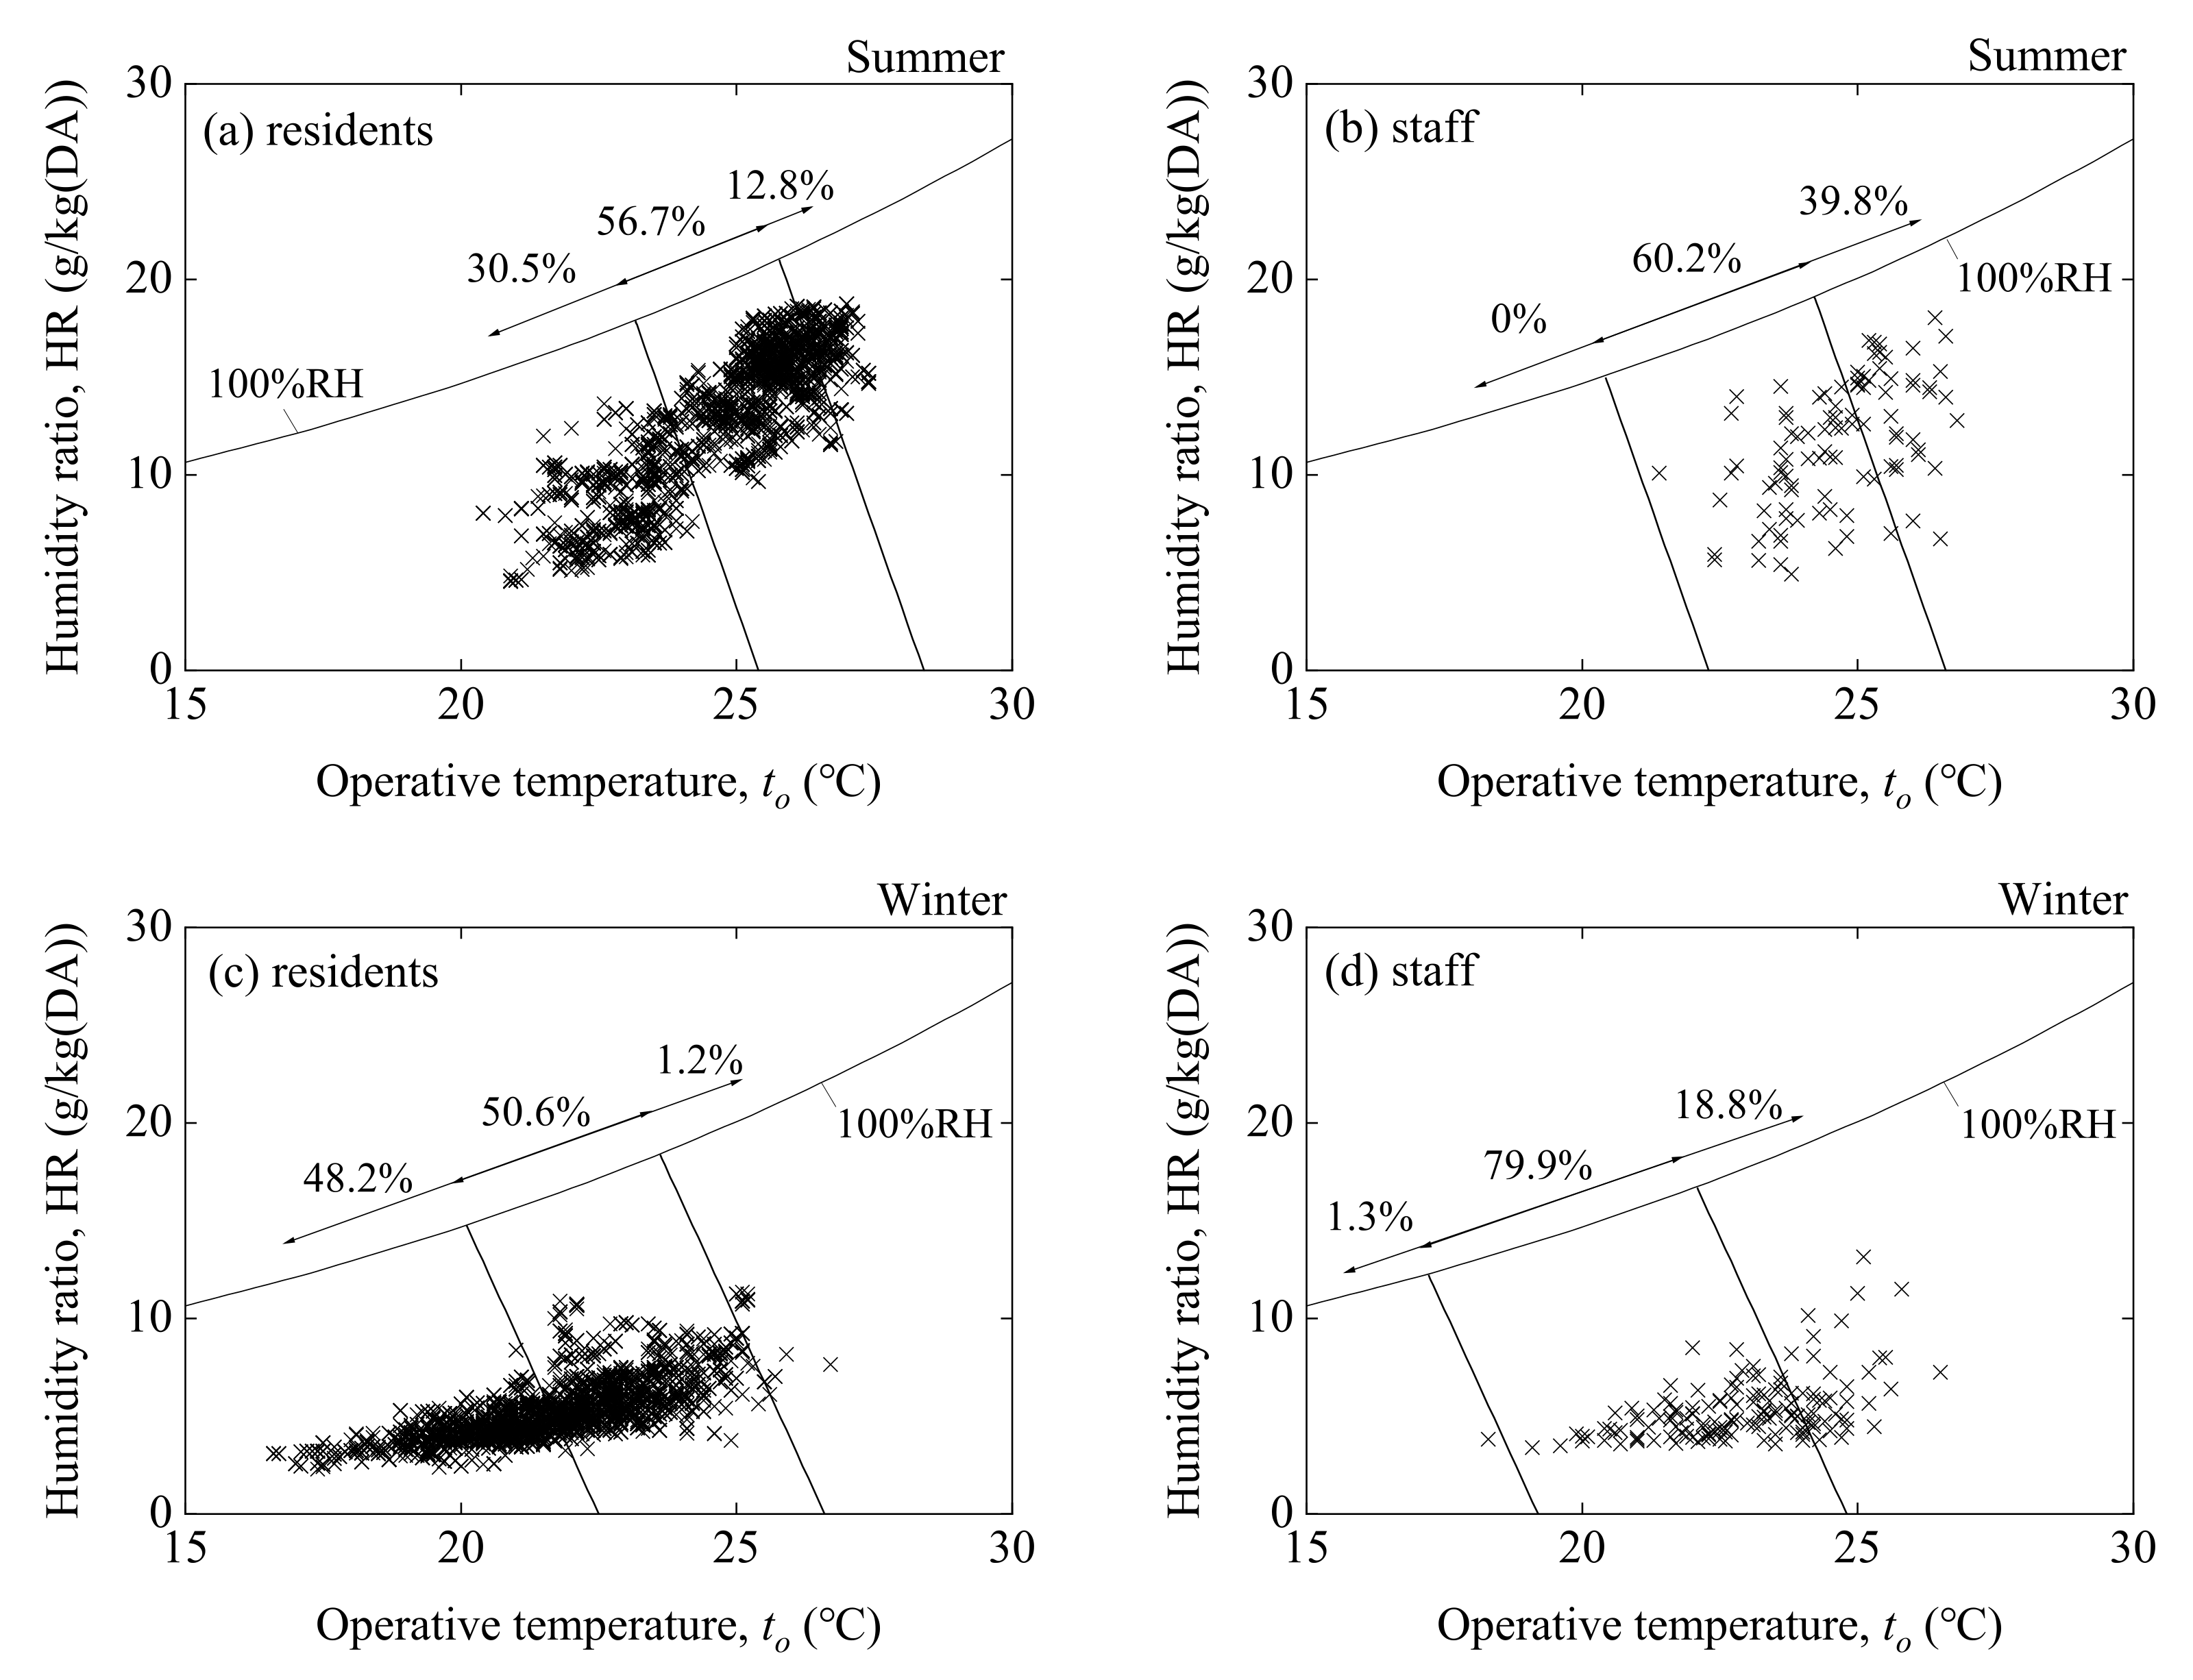
3.4. Comfort Zone
3.5. Adaptive Thermal Comfort Model
3.6. Health Risks and Thermal Comfort
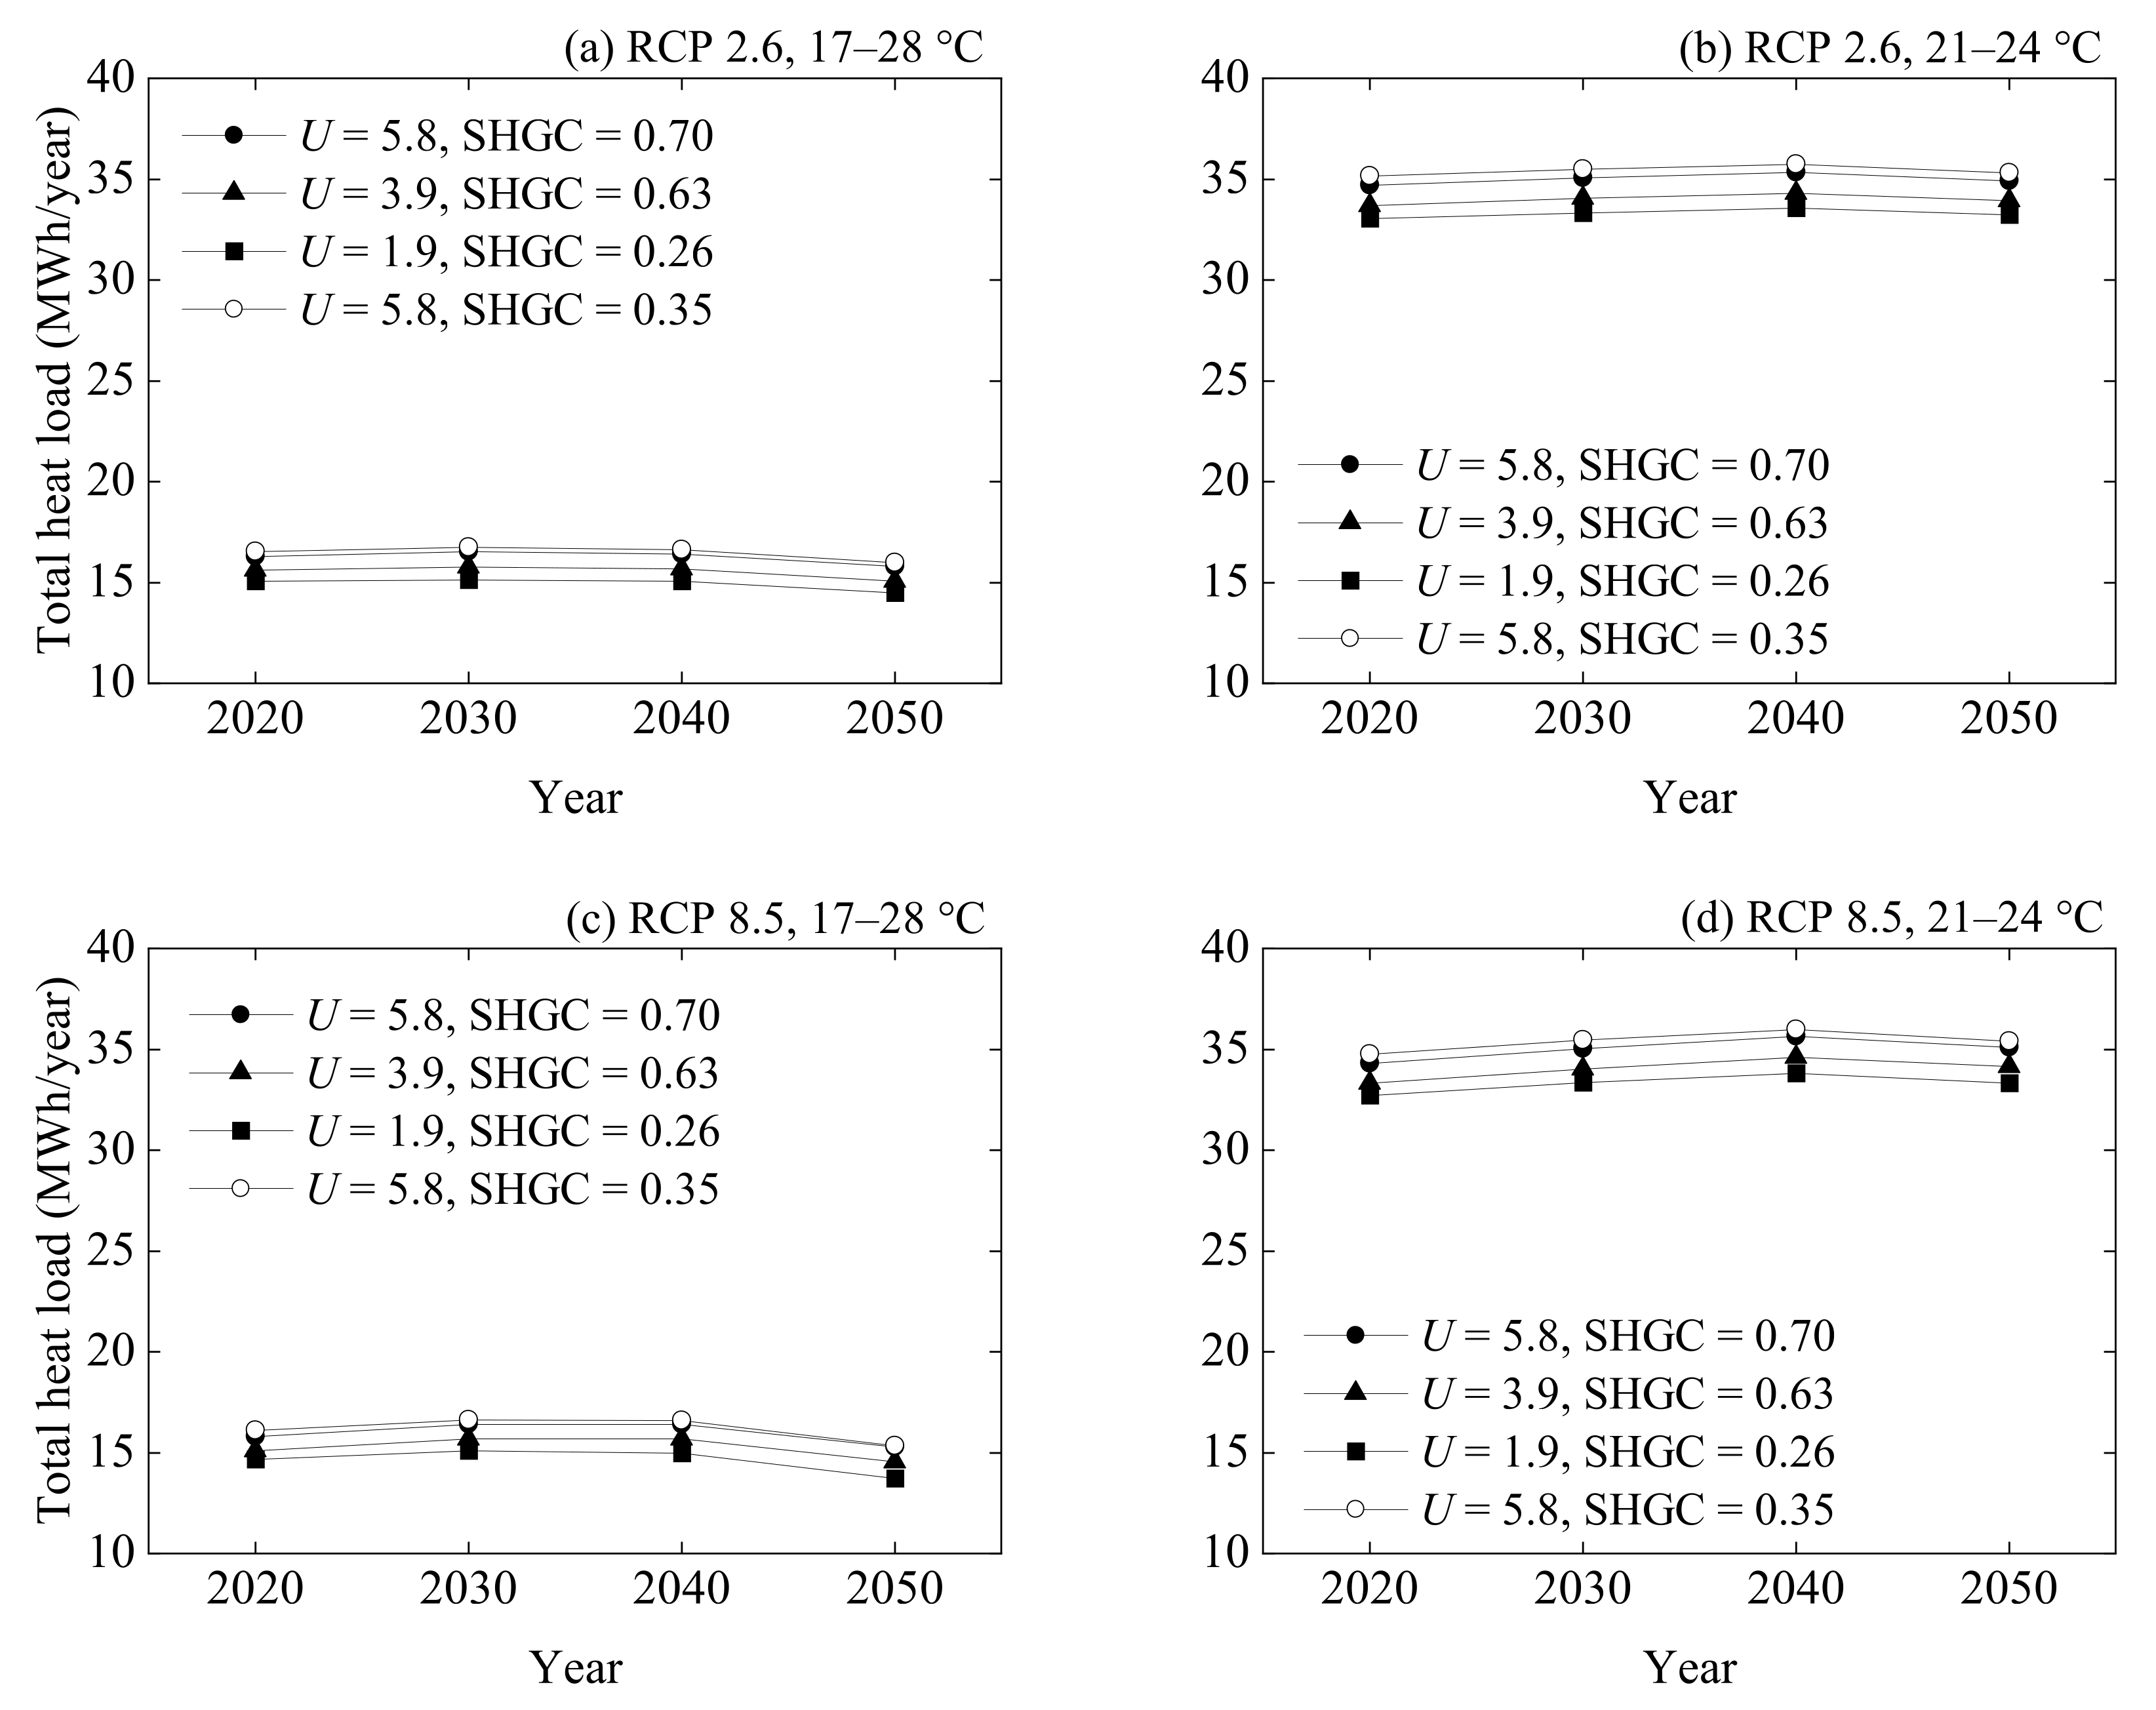
3.7. Future Forecasts of Total Heat Loads
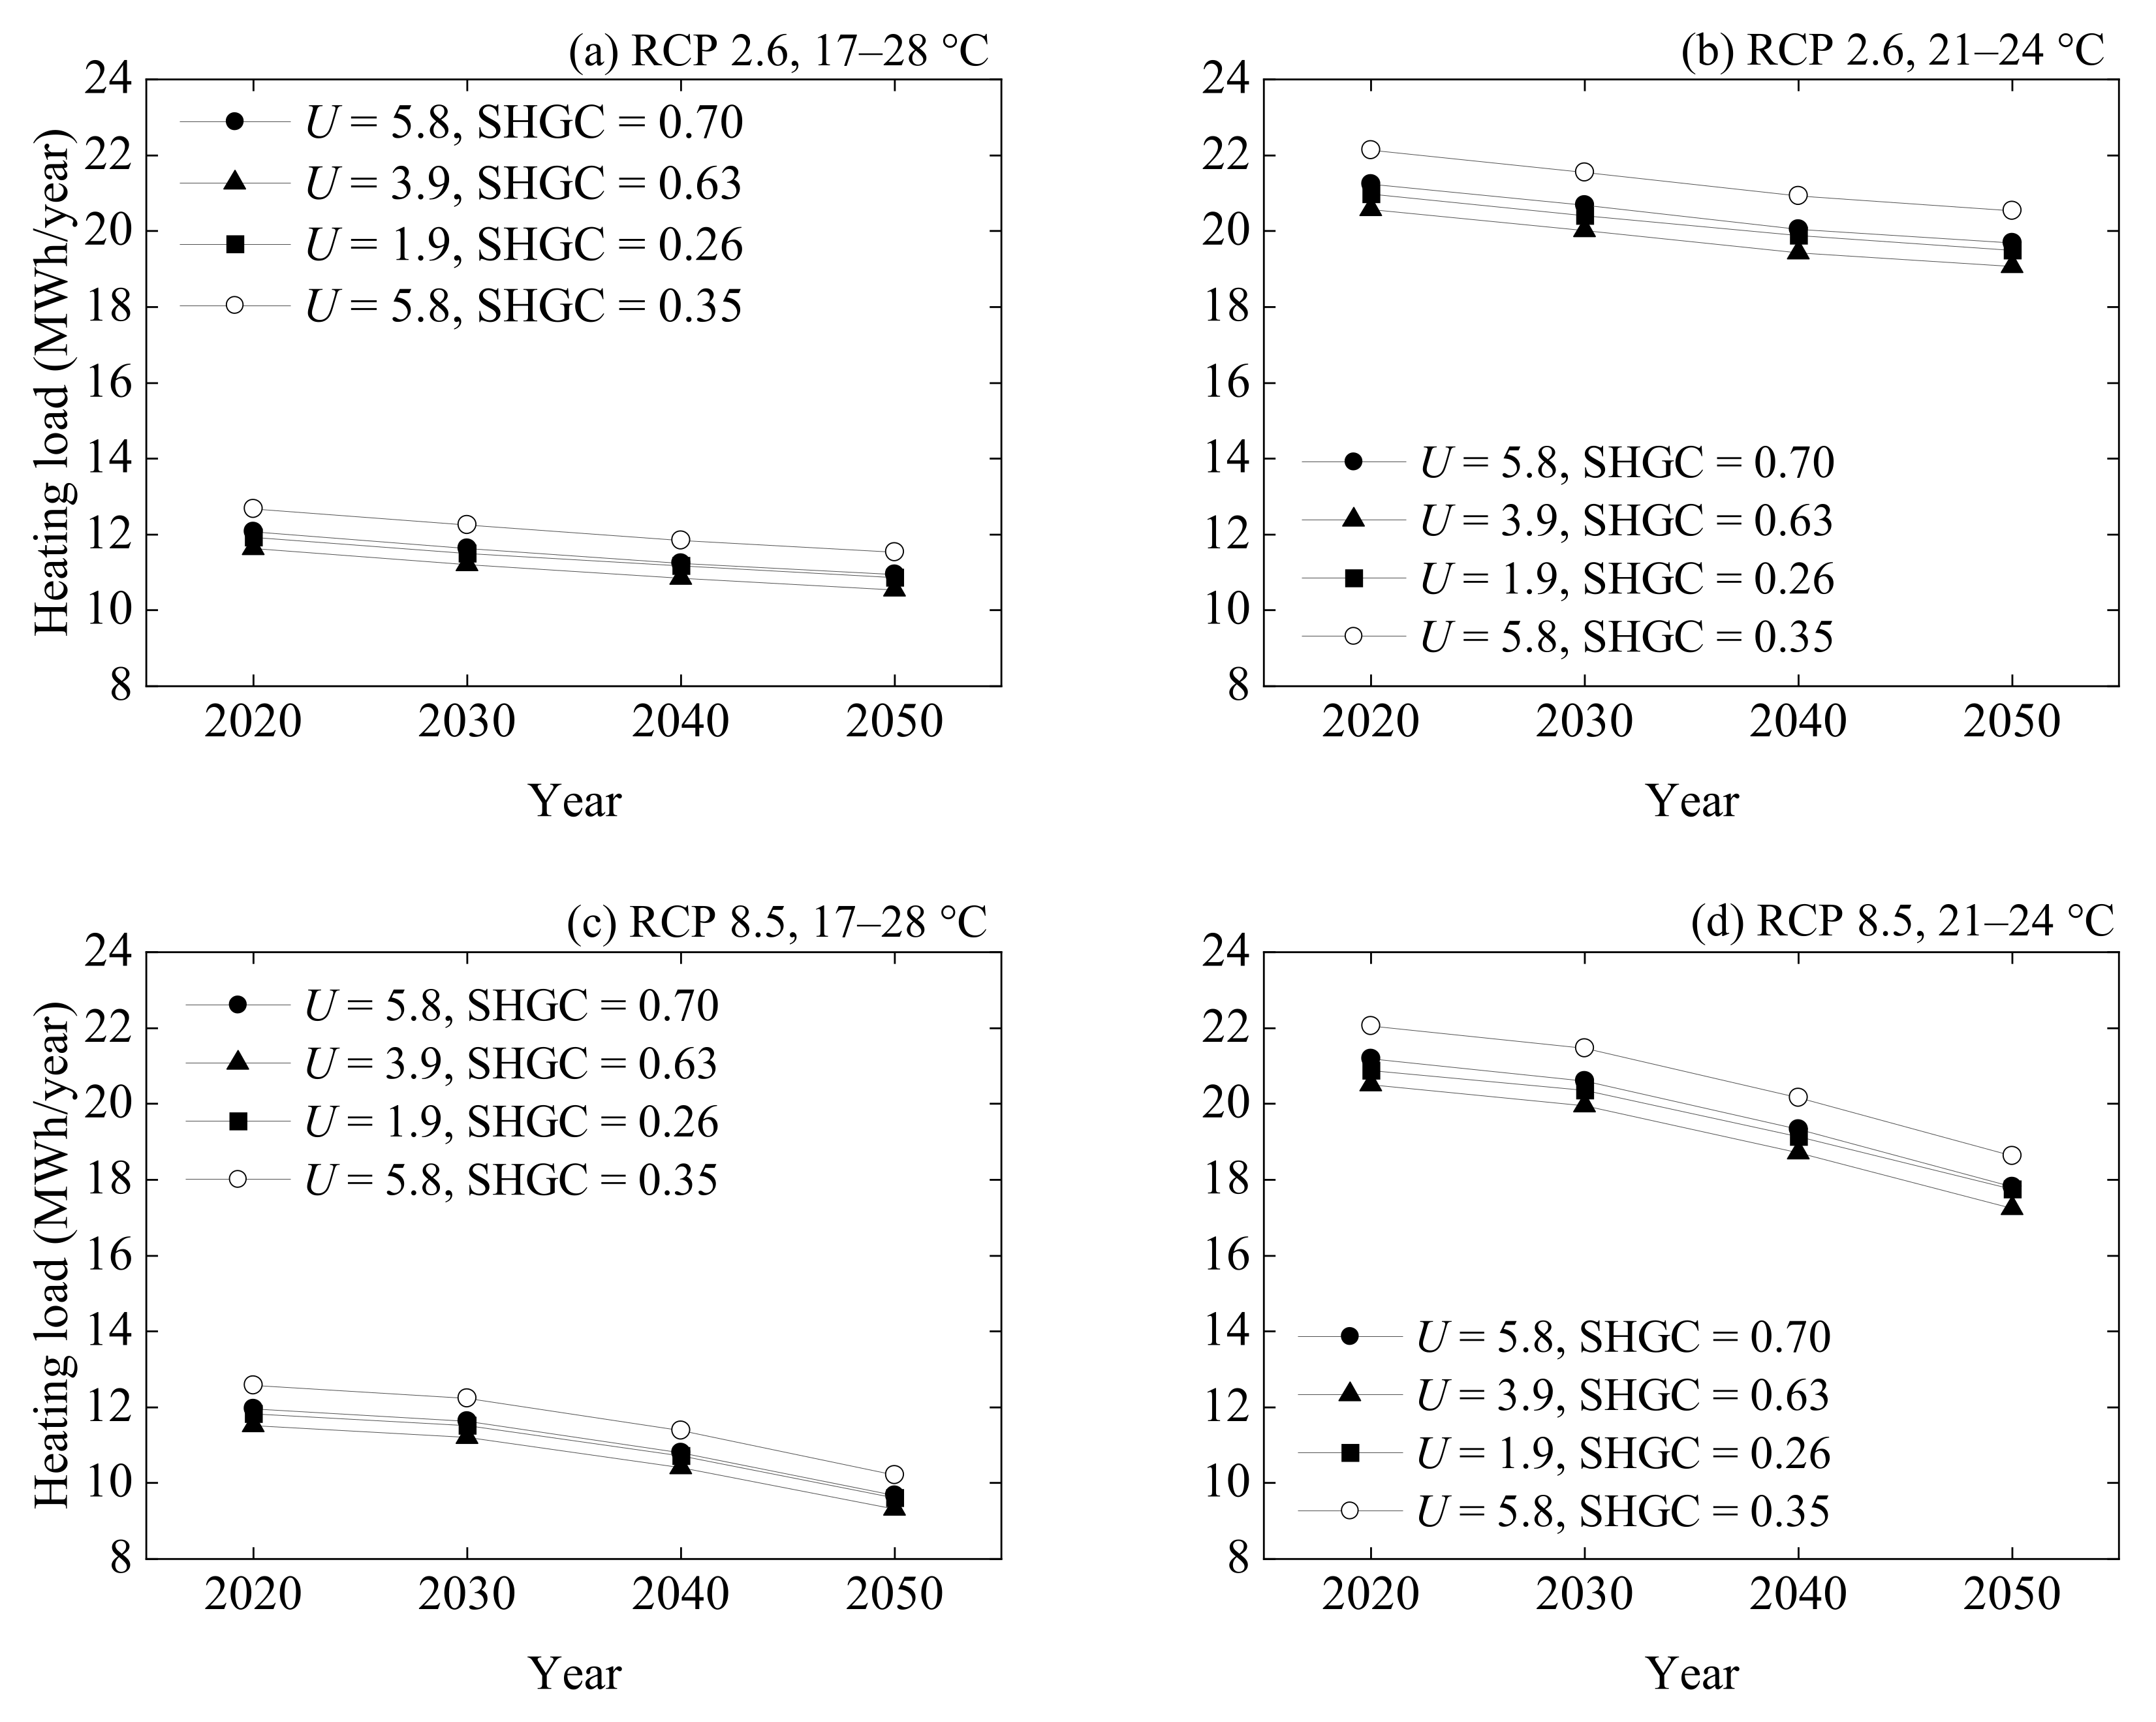
3.8. Future Forecasts of Heating Loads
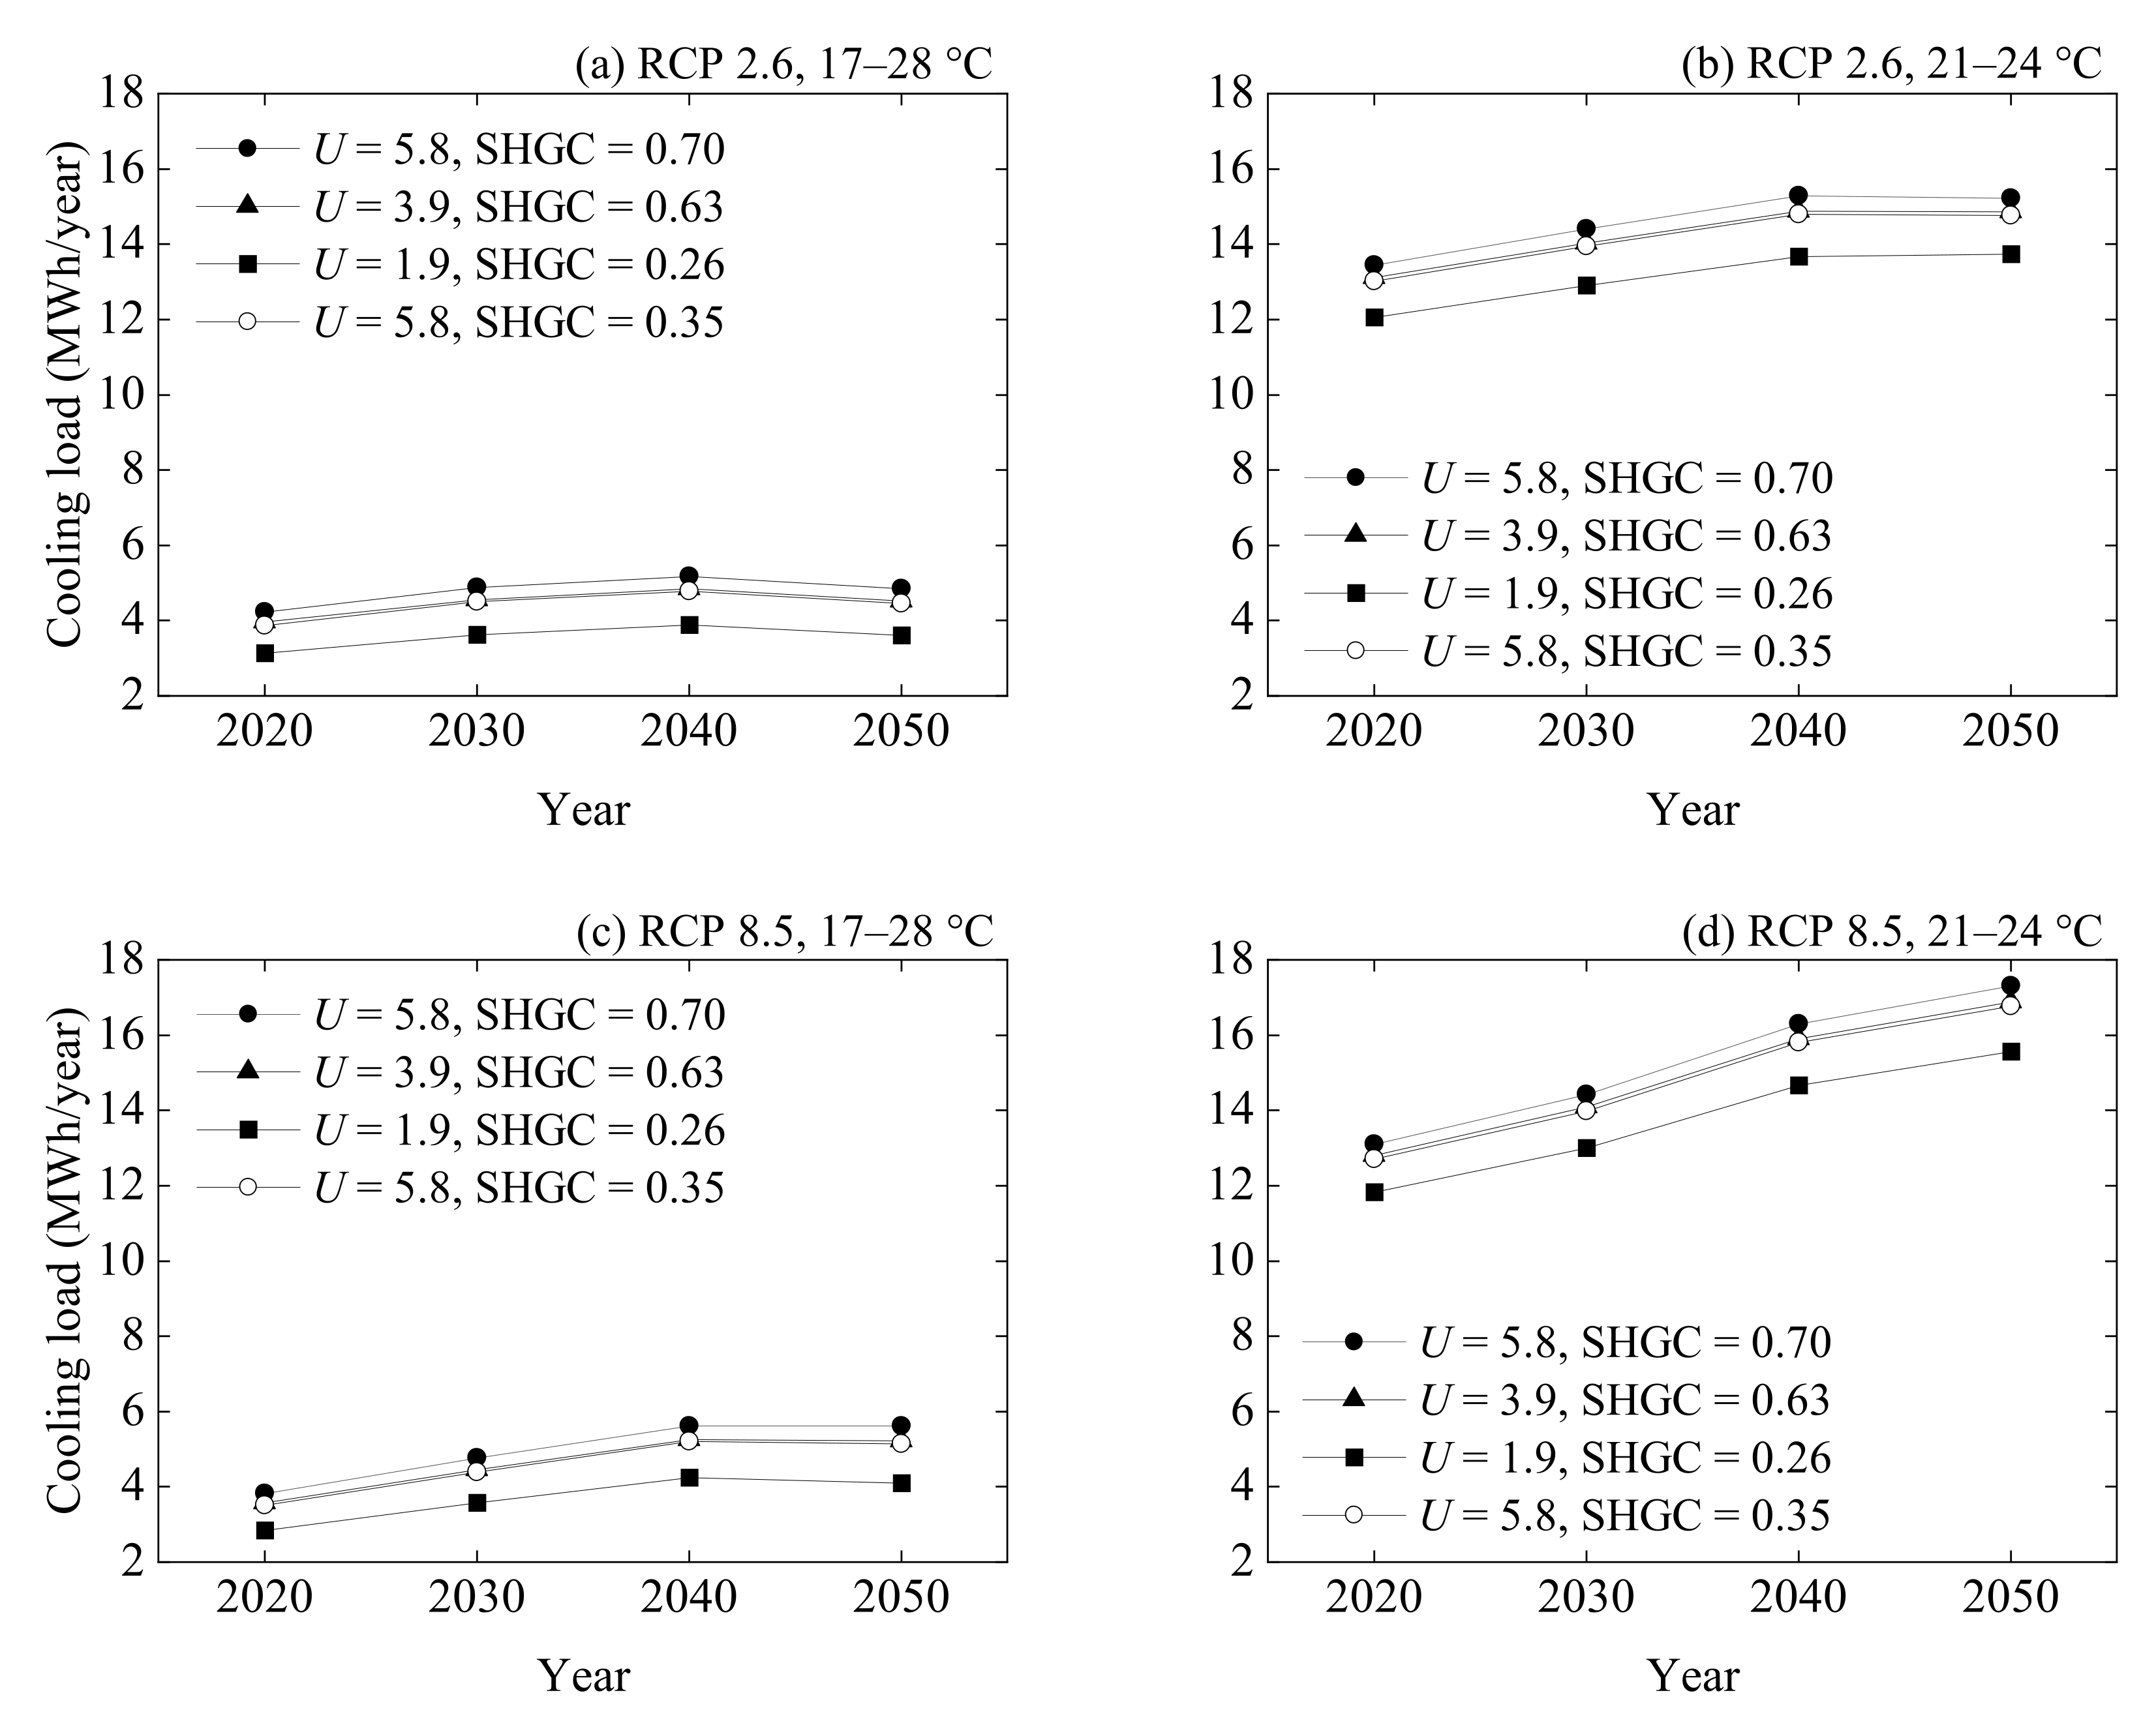
3.9. Future Forecasts of Cooling Loads
4. Conclusions
Author Contributions
Funding
Institutional Review Board Statement
Informed Consent Statement
Data Availability Statement
Acknowledgments
Conflicts of Interest
References
- Dias, J.B.; da Graça, G.C.; Soares, P.M.M. Comparison of methodologies for generation of future weather data for building thermal energy simulation. Energy Build 2020, 206, 109556. [Google Scholar] [CrossRef]
- Intergovernmental Panel on Climate Change. Summary for Policymakers: Climate Change 2021: The Physical Science Basis. In Contribution of Working Group I to the Sixth Assessment Report of the Intergovernmental Panel on Climate Change; Masson-Delmotte, V., Zhai, P., Pirani, A., Connors, S.L., Péan, C., Berger, S., Caud, N., Chen, Y., Goldfarb, L., Gomis, M.I., et al., Eds.; Cambridge University Press: Cambridge, UK, 2021. [Google Scholar]
- Ministry of the Environment. Climate Change Impact Assessment Report. Available online: https://www.env.go.jp/press/files/jp/115262.pdf (accessed on 1 October 2021). (In Japanese)
- Huynen, M.M.T.E.; Martens, P.; Schram, D.; Weijenberg, M.P.; Kunst, A.E. The impact of heat waves and cold spells on mortality rates in the Dutch population. Environ. Health Perspect. 2001, 109, 5–463. [Google Scholar] [CrossRef] [PubMed]
- Robine, J.-M.; Cheung, S.L.K.; Roy, S.L.; Oyen, H.V.; Griffiths, C.; Michel, J.-P.; Herrmann, F.R. Death toll exceeded 70,000 in Europe during the summer of 2003. C. R. Biol. 2008, 331, 171–178. [Google Scholar] [CrossRef] [PubMed]
- Fire and Disaster Management Agency. Available online: https://www.fdma.go.jp/disaster/heatstroke/post3.html (accessed on 1 October 2021). (In Japanese)
- Ministry of Health, Labour and Welfare. Available online: https://www.mhlw.go.jp/toukei/saikin/hw/jinkou/tokusyu/necchusho19/index.html (accessed on 1 October 2021). (In Japanese)
- Jiao, Y.; Yu, H.; Wang, T.; An, Y.; Yu, Y. Thermal comfort and adaptation of the elderly in free-running environments in Shanghai, China. Build. Environ. 2017, 118, 259–272. [Google Scholar] [CrossRef]
- Mendes, A.; Bonassi, S.; Aguiar, L.; Pereira, C.; Neves, P.; Silva, S.; Mendes, D.; Guimarães, L.; Moroni, R.; Teixeira, J.P. Indoor air quality and thermal comfort in elderly care centers. Urban Clim. 2015, 14, 486–501. [Google Scholar] [CrossRef] [Green Version]
- Wang, Z.; Yu, H.; Jiao, Y.; Wei, Q.; Chu, X. A field study of thermal sensation and neutrality in free-running aged-care homes in Shanghai. Energy Build. 2018, 158, 1523–1532. [Google Scholar] [CrossRef]
- Ministry of Internal Affairs and Communications. Available online: https://www.stat.go.jp/data/jinsui/index.html (accessed on 1 October 2021). (In Japanese)
- Hamza, N.; Gilroy, R. The challenge to UK energy policy: An ageing population perspective on energy saving measures and consumption. Energy Policy 2011, 39, 782–789. [Google Scholar] [CrossRef]
- Almeida-Silva, M.; Wolterbeek, H.T.; Almeida, S.M. Elderly exposure to indoor air pollutants. Atmos. Environ. 2014, 85, 54–63. [Google Scholar] [CrossRef]
- Fanger, P.O. Assessment of man’s thermal comfort in practice. Br. J. Ind. Med. 1973, 30, 313–324. [Google Scholar] [CrossRef] [Green Version]
- Natsume, K.; Ogawa, T.; Sugenoya, J.; Ohnishi, N.; Imai, K. Preferred ambient temperature for old and young men in summer and winter. Int. J. Biometeorol. 1992, 36, 1–4. [Google Scholar] [CrossRef]
- Tsuzuki, K.; Ohfuku, T. Thermal sensation and thermoregulation in elderly compared to young people in Japanese winter season. Proc. Indoor Air 2002, 2, 659–664. [Google Scholar]
- Collins, K.J.; Exton-Smith, A.N.; Doré, C. Urban hypothermia: Preferred temperature and thermal perception in old age. Br. Med. J. 1981, 282, 175–177. [Google Scholar] [CrossRef] [Green Version]
- Sassa, N.; Kubo, H.; Isoda, N. The characteristics of psychological and physiological response by preferred air temperature of the elderly. J. Environ. Eng. AIJ 2010, 75, 815–820. (In Japanese) [Google Scholar]
- Xiong, J.; Ma, T.; Lian, Z.; de Dear, R. Perceptual and physiological responses of elderly subjects to moderate temperatures. Build. Environ. 2019, 156, 117–122. [Google Scholar] [CrossRef]
- Liu, W.; Lian, Z.; Deng, Q.; Liu, Y. Evaluation of calculation methods of mean skin temperature for use in thermal comfort study. Build. Environ. 2011, 46, 478–488. [Google Scholar] [CrossRef]
- Forcada, N.; Gangolells, M.; Casals, M.; Tejedor, B.; Macarulla, M.; Gaspar, K. Summer thermal comfort in nursing homes in the Mediterranean climate. Energy Build. 2020, 229, 110442. [Google Scholar] [CrossRef]
- Forcada, N.; Gangolells, M.; Casals, M.; Tejedor, B.; Macarulla, M.; Gaspar, K. Field study on thermal comfort in nursing homes in heated environments. Energy Build. 2021, 244, 111032. [Google Scholar] [CrossRef]
- Tartarini, F.; Cooper, P.; Fleming, R. Thermal environment and thermal sensations of occupants of nursing homes: A field study. Procedia Eng. 2017, 180, 373–382. [Google Scholar] [CrossRef]
- Tartarini, F.; Cooper, P.; Fleming, R. Thermal perceptions, preferences and adaptive behaviours of occupants of nursing homes. Build. Environ. 2018, 132, 57–69. [Google Scholar] [CrossRef] [Green Version]
- Humphreys, M.A.; Nicol, J.F. The validity of ISO-PMV for comfort votes in every-day thermal environments. Energy Build. 2002, 34, 667–684. [Google Scholar] [CrossRef]
- Hughes, C.; Natarajan, S.; Liu, C.; Chung, W.J.; Herrera, M. Winter thermal comfort and health in the elderly. Energy Policy 2019, 134, 110954. [Google Scholar] [CrossRef]
- Wang, Z.; Cao, B.; Lin, B.; Zhu, Y. Investigation of thermal comfort and behavioral adjustments of older people in residential environments in Beijing. Energy Build. 2020, 217, 110001. [Google Scholar] [CrossRef]
- Jin, Y.; Wang, F.; Carpenter, M.; Weller, R.B.; Tabor, D.; Payne, S.R. The effect of indoor thermal and humidity condition on the oldest-old people’s comfort and skin condition in winter. Build. Environ. 2020, 174, 106790. [Google Scholar] [CrossRef]
- Wong, L.T.; Fong, K.N.K.; Mui, K.W.; Wong, W.W.Y.; Lee, L.W. A field survey of the expected desirable thermal environment for older people. Indoor Built Environ. 2009, 18, 4. [Google Scholar] [CrossRef]
- Yang, J.; Nam, I.; Sohn, J.-R. The influence of seasonal characteristics in elderly thermal comfort in Korea. Energy Build. 2016, 128, 583–591. [Google Scholar] [CrossRef]
- Hwang, R.-L.; Chen, C.-P. Field study on behaviors and adaptation of elderly people and their thermal comfort requirements in residential environments. Indoor Air 2010, 20, 235–245. [Google Scholar] [CrossRef] [PubMed]
- Giamalaki, M.; Kolokotsa, D. Understanding the thermal experience of elderly people in their residences: Study on thermal comfort and adaptive behaviors of senior citizens in Crete, Greece. Energy Build. 2019, 185, 76–87. [Google Scholar] [CrossRef]
- White-Newsome, J.L.; Sánchez, B.N.; Parker, E.A.; Dvonch, J.T.; Zhang, Z.; O’Neill, M.S. Assessing heat-adaptive behaviors among older, urban-dwelling adults. Maturitas 2011, 70, 85–91. [Google Scholar] [CrossRef] [Green Version]
- Kurabuchi, T.; Yanagi, U.; Ogata, M.; Otsuka, M.; Kogi, N.; Yamamoto, Y.; Hayashi, M.; Tanabe, S. Operation of air-conditioning and sanitary equipment for SARS-CoV-2 infectious disease control. Jpn. Archit Rev. 2021, 4, 4. [Google Scholar] [CrossRef]
- Chua, K.J.; Chou, S.K.; Yang, W.M.; Yan, J. Achieving better energy-efficient air conditioning—A review of technologies and strategies. Appl. Energy 2013, 104, 87–104. [Google Scholar] [CrossRef]
- Anand, P.; Cheong, D.; Sekhar, C. A review of occupancy-based building energy and IEQ controls and its future post-COVID. Sci. Total Environ. 2022, 804, 150249. [Google Scholar] [CrossRef]
- Olonscheck, M.; Holsten, A.; Kropp, J.P. Heating and cooling energy demand and related emissions of the German residential building stock under climate. Energy Policy 2011, 39, 4795–4806. [Google Scholar] [CrossRef]
- Rodrigues, E.; Fernandes, M.S. Overheating risk in Mediterranean residential buildings: Comparison of current and future climate scenarios. Appl. Energy 2020, 259, 114110. [Google Scholar] [CrossRef]
- Ivanko, D.; Walnum, H.T.; Nord, N. Development and analysis of hourly DHW heat use profiles in nursing homes in Norway. Energy Build. 2020, 222, 110070. [Google Scholar] [CrossRef]
- Yassaghi, H.; Hoque, S. An overview of climate change and building energy: Performance, responses and uncertainties. Buildings 2019, 9, 166. [Google Scholar] [CrossRef] [Green Version]
- Hirvonen, J.; Heljo, J.; Jokisalo, J.; Kurvinen, A.; Saari, A.; Niemelä, T.; Sankelo, P.; Kosonen, R. Emissions and power demand in optimal energy retrofit scenarios of the Finnish building stock by 2050. Sustain. Cities Soc. 2021, 70, 102896. [Google Scholar] [CrossRef]
- Sun, K.; Specian, M.; Hong, T. Nexus of thermal resilience and energy efficiency in buildings: A case study of a nursing home. Build. Environ. 2020, 177, 106842. [Google Scholar] [CrossRef]
- Peel, M.C.; Finlayson, B.L.; McMahon, T.A. Updated world map of the Köppen-Geiger climate classification. Hydrol. Earth Syst. Sci. 2007, 11, 1633–1644. [Google Scholar] [CrossRef] [Green Version]
- Japan Meteorological Agency. Available online: https://www.jma.go.jp/jma/menu/menureport.html (accessed on 31 July 2021). (In Japanese)
- International Organization for Standardization. ISO 7726: Ergonomics of the Thermal Environment—Instruments for Measuring Physical Quantities; International Organization for Standardization: Geneva, Switzerland, 1998. [Google Scholar]
- International Organization for Standardization. ISO 10551: Ergonomics of the Thermal Environment—Assessment of the Influence of the Thermal Environment Using Subjective Judgement Scales; International Organization for Standardization: Geneva, Switzerland, 1995. [Google Scholar]
- American National Standards Institute/American Society of Heating, Refrigerating and Air-Conditioning Engineers. ANSI/ASHRAE Standard 55-2017: Thermal Environmental Conditions for Human Occupancy; American Society of Heating, Refrigerating and Air Conditioning Engineers, Inc.: Atlanta, GA, USA, 2017. [Google Scholar]
- Architectural Institute of Japan. Standard for Measurement of Psychological and Physiological Responses to Thermal environments, Architectural Institute of Japan Environmental Standards; Architectural Institute of Japan: Tokyo, Japan, 2014. (In Japanese) [Google Scholar]
- International Organization for Standardization. ISO 7730: Ergonomics of the Thermal Environment—Analytical Determination and Interpretation of Thermal Comfort Using Calculation of the PMV and PPD Indices and Local Thermal Comfort Criteria; International Organization for Standardization: Geneva, Switzerland, 2005. [Google Scholar]
- National Center for Geriatrics and Gerontology. Available online: https://www.ncgg.go.jp/ri/topics/pamph.html (accessed on 1 November 2021). (In Japanese)
- Yamada, M.; Arai, H. Predictive value of frailty scores for healthy life expectancy in community-dwelling older Japanese adults. J. Am. Med. Dir. Assoc. 2015, 16, 1002.e7–1002.e11. [Google Scholar] [CrossRef]
- Tsutsumimoto, K.; Doi, T.; Shimada, H.; Makizako, H.; Hotta, R.; Nakakubo, S.; Suzuki, T. Combined effect of slow gait speed and depressive symptoms on incident disability in older adults. J. Am. Med. Dir. Assoc. 2016, 17, 123–127. [Google Scholar] [CrossRef] [Green Version]
- Shimada, H.; Makizako, H.; Doi, T.; Tsutsumimoto, K.; Suzuki, T. Incidence of disability in frail older persons with or without slow walking speed. J. Am. Med. Dir. Assoc. 2015, 16, 690–696. [Google Scholar] [CrossRef] [PubMed]
- Okura, M.; Ogita, M.; Yamamoto, M.; Nakai, T.; Numata, T.; Arai, H. Community activities predict disability and mortality in community-dwelling older adults. Geriatr. Gerontol. Int. 2018, 18, 1114–1124. [Google Scholar] [CrossRef] [PubMed]
- Yamada, M.; Arai, H.; Nishiguchi, S.; Kajiwara, Y.; Yoshimura, K.; Sonoda, T.; Yukutake, T.; Kayama, H.; Tanigawa, T.; Aoyama, T. Chronic kidney disease (CKD) is an independent risk factor for long-term care insurance (LTCI) need certification among older Japanese adults: A two-year prospective cohort study. Arch. Gerontol. Geriatr. 2013, 57, 328–332. [Google Scholar] [CrossRef] [PubMed]
- Ikeda, H.; Nakaya, T.; Nakagawa, A.; Maeda, Y. An investigation of indoor thermal environment in semi-cold region in Japan—Validity of thermal predictive indices in Nagano during the summer season. J. Build. Eng. 2021, 35, 101897. [Google Scholar] [CrossRef]
- International Organization for Standardization. ISO 17772-1: Energy Performance of Buildings—Indoor Environmental Quality—Part 1: Indoor Environmental Input Parameters for the Design and Assessment of Energy Performance of Buildings; International Organization for Standardization: Geneva, Switzerland, 2017. [Google Scholar]
- Intergovernmental Panel on Climate Change. Summary for Policymakers: Climate Change 2013: The Physical Science Basis. Contribution of Working Group I to the Fifth Assessment Report of the Intergovernmental Panel on Climate Change; Stocker, T.F., Qin, D., Plattner, G.-K., Tignor, M., Allen, S.K., Boschung, J., Nauels, A., Xia, Y., Bex, V., Midgley, P.M., Eds.; Cambridge University Press: Cambridge, UK, 2013. [Google Scholar]
- Crawley, D.B.; Lawrie, L.K.; Winkelmann, F.C.; Buhl, W.F.; Huang, Y.J.; Pedersen, C.O.; Strand, R.K.; Liesen, R.J.; Fisher, D.E.; Witte, M.J.; et al. EnergyPlus: Creating a new-generation building energy simulation program. Energy Build. 2001, 33, 319–331. [Google Scholar] [CrossRef]
- EnergyPlus. 2021. Available online: https://energyplus.net (accessed on 1 September 2021).
- Building Research Institute. Available online: https://www.kenken.go.jp/becc/building.html#2-3 (accessed on 15 June 2021). (In Japanese)
- American National Standards Institute/American Society of Heating, Refrigerating and Air-Conditioning Engineers/American Society for Health Care Engineering. ANSI/ASHRAE/ASHE Standard 170-2021: Ventilation of Health Care Facilities; American Society of Heating, Refrigerating and Air Conditioning Engineers, Inc.: Atlanta, GA, USA, 2021. [Google Scholar]
- LIXIL Corporation. Available online: https://www.biz-lixil.com/service/law/energy-saving/products/windows_doors-28_2.html#tub02 (accessed on 20 June 2021). (In Japanese).
- FILMCLAN Corporation. Available online: https://www.filmclan.jp/15243580676006 (accessed on 25 October 2021). (In Japanese).
- Ministry of Health, Labour and Welfare. Available online: https://www.mhlw.go.jp/stf/seisakunitsuite/bunya/0000132645.html (accessed on 10 November 2021). (In Japanese)
- Wu, Y.; Liu, H.; Li, B.; Kosonen, R.; Kong, D.; Zhou, S.; Yao, R. Thermal adaptation of the elderly during summer in a hot humid area: Psychological, behavioral, and physiological responses. Energy Build. 2019, 203, 109450. [Google Scholar] [CrossRef]
- Tao, Y.; Gou, Z.; Yu, Z.; Fu, J.; Chen, X. The challenge of creating age-friendly indoor environments in a high-density city: Case study of Hong Kong Kong’s care and attention homes. J. Build. Eng. 2020, 30, 101280. [Google Scholar] [CrossRef]
- Bills, R. Creating Comfort and Cultivating Good Health: The Links Between Indoor Temperature, Thermal Comfort and Health. In Proceedings of the 10th Windsor Conference—Rethinking Comfort, NCEUB 2018. Windsor, UK, 12–15 April 2018; pp. 886–900. [Google Scholar]
- Fanger, P.O. Thermal Comfort; Danish Technical Press: Copenhagen, Denmark, 1970. [Google Scholar]
- Jiao, Y.; Yu, H.; Yu, Y.; Wang, Z.; Wei, Q. Adaptive thermal comfort models for homes for older people in Shanghai, China. Energy Build. 2020, 215, 109918. [Google Scholar] [CrossRef]
- Nicol, J.F.; Humphreys, M.A. Adaptive thermal comfort and sustainable thermal standards for buildings. Energy Build. 2002, 34, 563–572. [Google Scholar] [CrossRef]
- de Dear, R.; Kim, J.; Candido, C.; Deuble, M. Adaptive thermal comfort in Australian school classrooms. Build. Res. Inf. 2015, 43, 383–398. [Google Scholar] [CrossRef]
- Guergova, S.; Dufour, A. Thermal sensitivity in the elderly: A review. Ageing Res. Rev. 2011, 10, 80–92. [Google Scholar] [CrossRef]
- Nakagawa, A.; Ikeda, H.; Maeda, Y.; Nakaya, T. A survey of high school students’ clothing in classroom. J. Build. Eng. 2020, 32, 101469. [Google Scholar] [CrossRef]
- Bienvenido-Huertas, D.; Pulido-Arcas, J.A.; Rubio-Bellido, C.; Pérez-Fargallo, A. Influence of future climate changes scenarios on the feasibility of the adaptive comfort model in Japan. Sustain. Cities Soc. 2020, 61, 102303. [Google Scholar] [CrossRef]
- American National Standards Institute/American Society of Heating, Refrigerating and Air-Conditioning Engineers/American Society for Health Care Engineering. ANSI/ASHRAE/ASHE Standard 170-2017: Ventilation of Health Care Facilities; American Society of Heating, Refrigerating and Air Conditioning Engineers, Inc.: Atlanta, GA, USA, 2017. [Google Scholar]
- Japanese Society for Biometeorology. Guidelines for the Prevention of Heat Stroke in Daily Life Ver.3.1 Finalized. Available online: https://seikishou.jp/post-217/ (accessed on 1 November 2021). (In Japanese).
- American Society of Heating, Refrigerating and Air Conditioning Engineers. ASHRAE Handbook—Fundamentals 2013 Chapter 10: Indoor Environmental Health; American Society of Heating, Refrigerating and Air Conditioning Engineers, Inc.: Atlanta, GA, USA, 2013. [Google Scholar]
- Public Health England. Cold Weather Plan For England—Making the Case: Why Long-Term Strategic Planning for Cold Weather is Essential to Health and Wellbeing; Public Health England: London, UK, 2017. [Google Scholar]
- Collins, K.J.; Dore, C.; Exton-Smith, A.N.; Fox, R.H.; Macdonald, I.C.; Woodward, P.M. Accidental hypothermia and impaired temperature homoeostasis in the elderly. Br. Med. J. 1977, 1, 353–356. [Google Scholar] [CrossRef] [Green Version]
- World Health Organization. WHO Housing and Health Guidelines; World Health Organization: Geneva, Switzerland, 2018. [Google Scholar]


| Season | Sample Size | Gender | Age Group | Age | |||||||
|---|---|---|---|---|---|---|---|---|---|---|---|
| Male | Female | 65–69 | 70–74 | 75–79 | 80–84 | 85–89 | 90–94 | 95+ | Mean | ||
| Summer | 4686 | 24 | 38 | 2 | 4 | 14 | 15 | 12 | 13 | 2 | 83.4 |
| Winter | 5331 | 19 | 28 | 2 | 4 | 7 | 15 | 9 | 8 | 2 | 83.4 |
| All season | 10,017 | 27 | 39 | 2 | 4 | 14 | 17 | 12 | 14 | 3 | 83.7 |
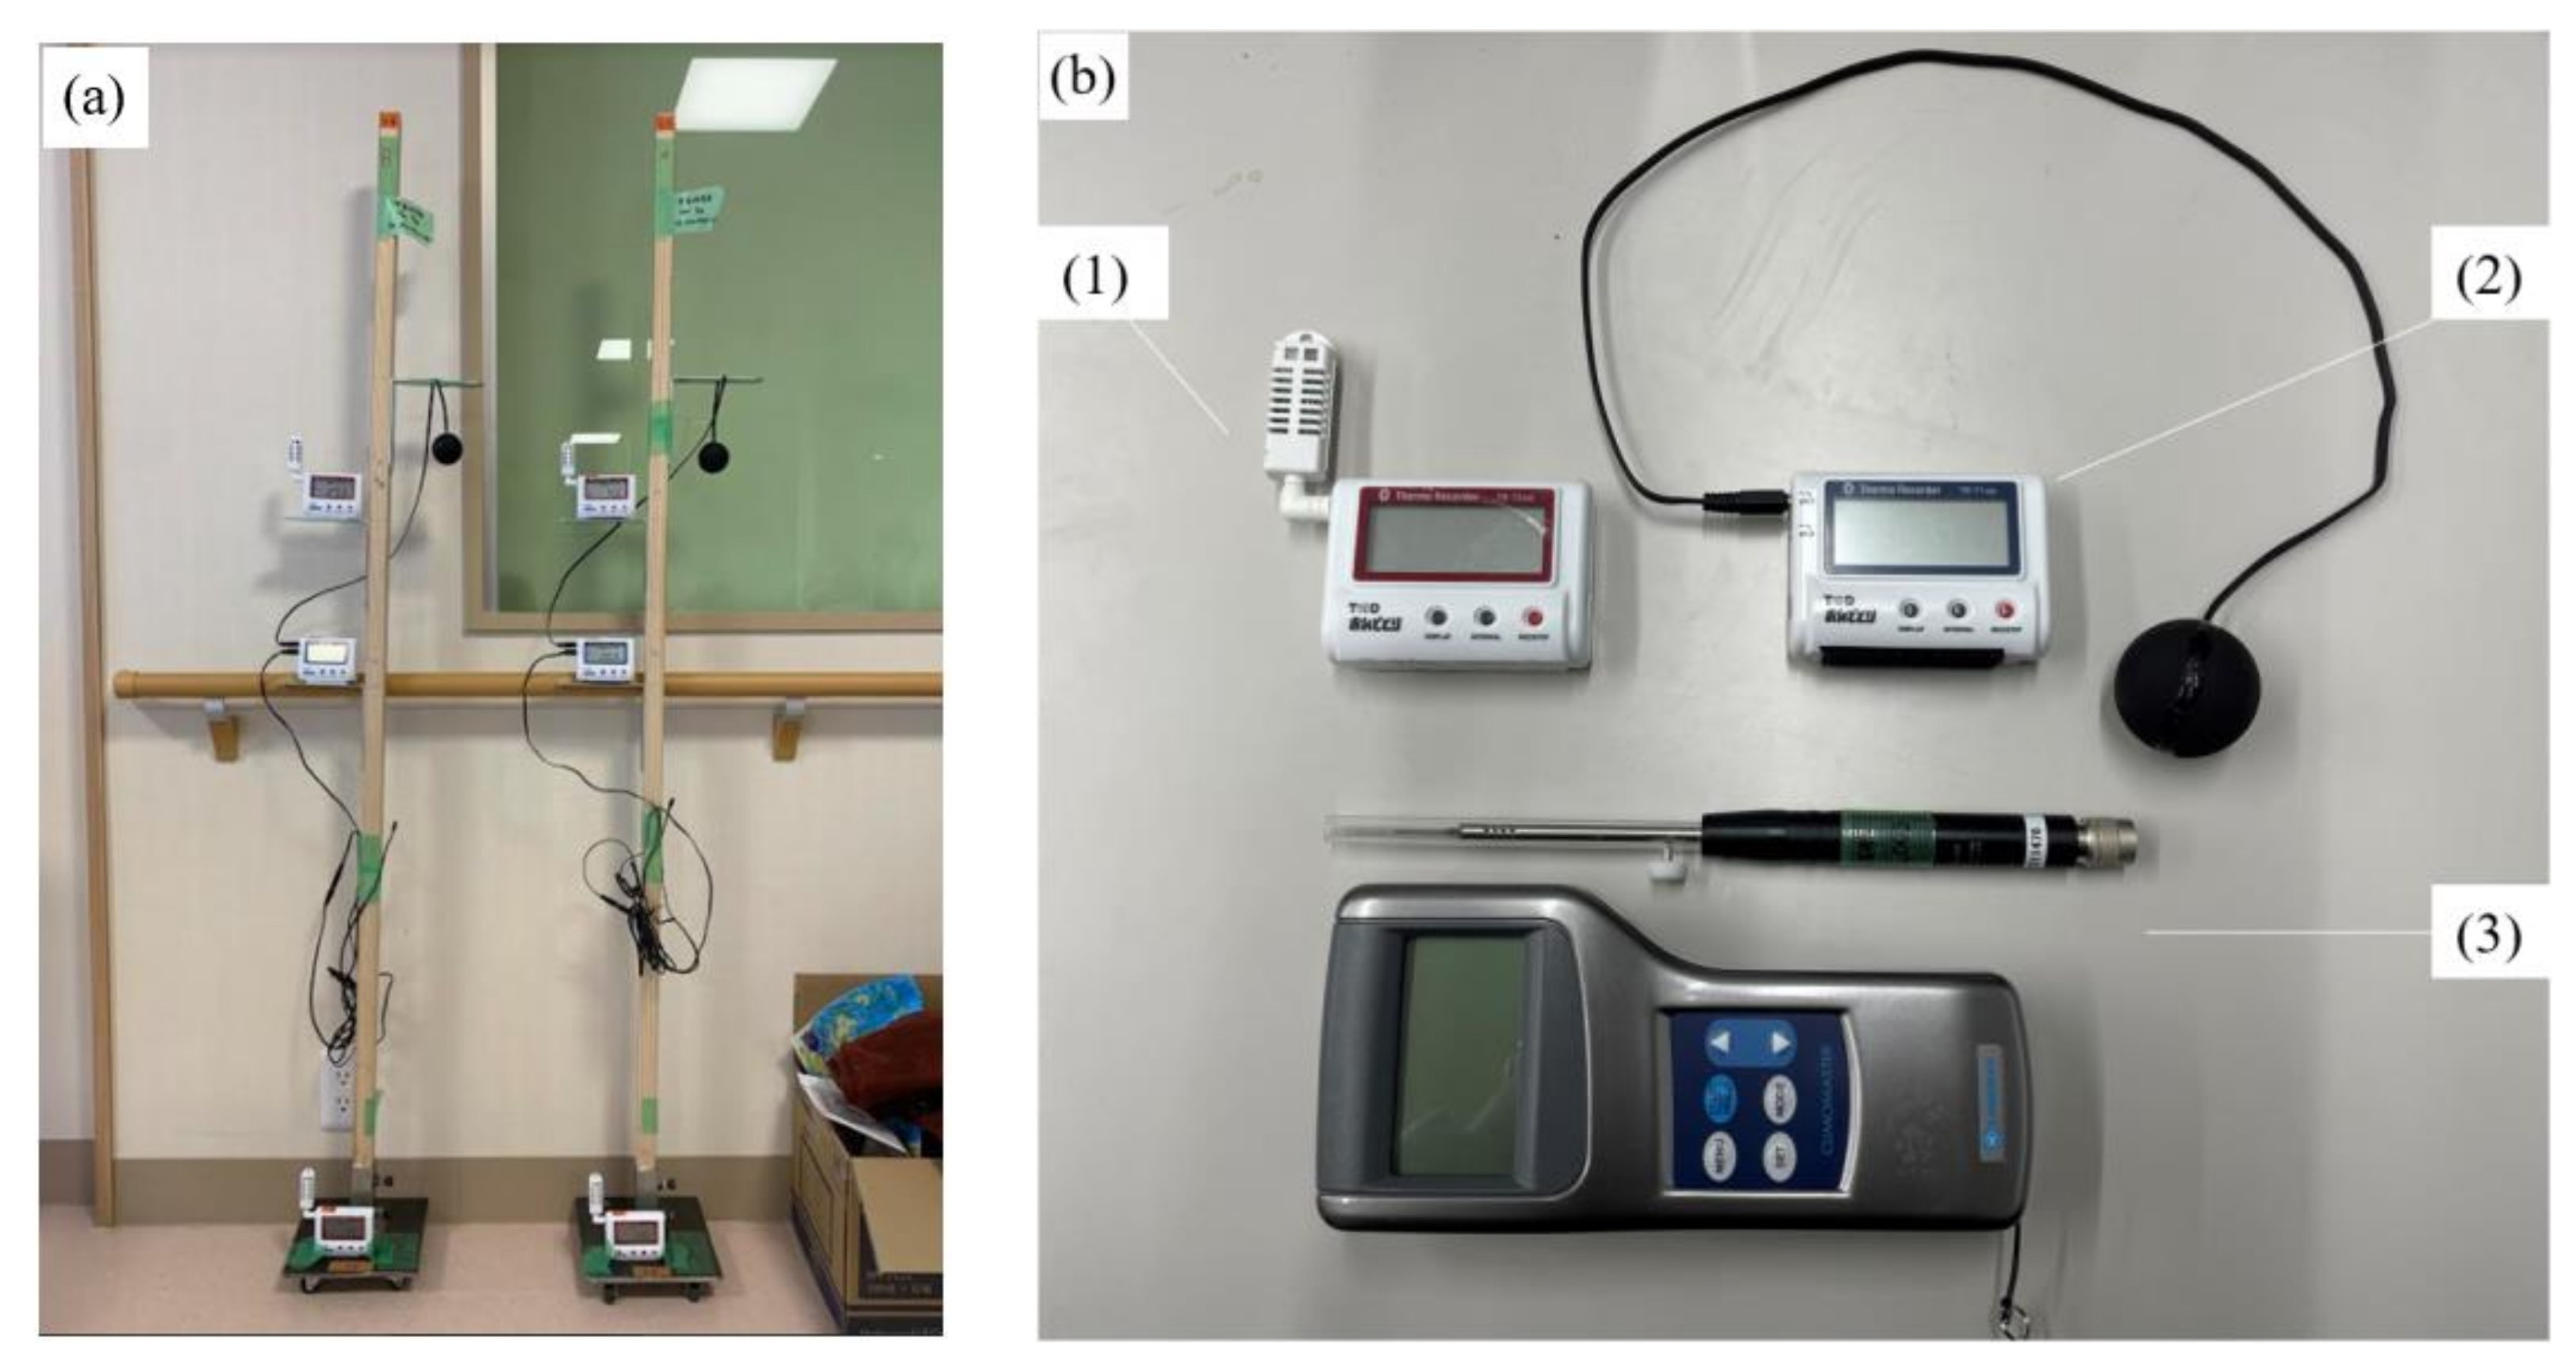
| Parmenter | Instrument | Resolution | Accuracy | Manufacture |
|---|---|---|---|---|
| ta | Thermo recorder TR-72wb | 0.1 °C | ±0.5 °C | T&D corporation |
| RH | 1% | ±5% | ||
| tg | Thermo recorder TR-71wb | 0.1 °C | ±0.3 °C | |
| V | Body: Climomaster 6501-B0Probe: Climomaster 6541-21 | 0.01 m/s | ±0.02 m/s | Kanomax corporation |
| Question | Scale |
|---|---|
| Attribute | age, gender, care level |
| Metabolic rates | 1: standing work, 2: light standing work, 3: sitting work 4: seated quiet, 5: reclining |
| Thermal sensation | −3: very cold, −2: cold, −1: slightly cold, 0: neutral +1: slightly hot, +2: hot, +3: very hot |
| Garment Description | Icl (clo) |
|---|---|
| Men’s briefs or bra + panties | 0.04 |
| Walking shorts | 0.08 |
| Straight trousers (thin) | 0.15 |
| Straight trousers (thick) | 0.24 |
| Short-sleeve dress shirt | 0.19 |
| Long-sleeve dress shirt | 0.25 |
| Long-sleeve sweatshirt | 0.34 |
| Jumper | 0.27 |
| Down jacket | 0.55 |
| Ankle-length athletic socks | 0.02 |
| Calf-length socks | 0.03 |
| Slippers (quilted, pile lined) | 0.03 |
| Gender | Number of People | Care Level | ||||
|---|---|---|---|---|---|---|
| 1 | 2 | 3 | 4 | 5 | ||
| Male | 27 | 5 | 7 | 6 | 6 | 3 |
| Female | 39 | 5 | 6 | 6 | 15 | 7 |
| Zone Type | Caloric Value of Human Body per Unit Area (W/m2) | Number of People per Unit Area (Person/m2) | Design Level per Unit Area a (W/m2) | Design Level per Unit Area b (W/m2) | Floor Area (m2) |
|---|---|---|---|---|---|
| Dining/Lounge | 59.5 | 0.50 | 20.0 | 0.0 | 79.33 |
| Office room | 23.8 | 0.20 | 20.0 | 15.0 | 39.96 |
| Kitchen | 11.9 | 0.10 | 20.0 | 10.0 | 25.11 |
| Bathroom | 7.4 | 0.08 | 12.0 | 3.0 | 38.07 |
| Treatment room | 23.8 | 0.20 | 20.0 | 15.0 | 25.49 |
| Meeting room | 23.8 | 0.20 | 20.0 | 15.0 | 9.50 |
| Existing office room | 11.9 | 0.10 | 12.0 | 12.0 | 200.88 |
| Bedrooms | 6.4 | 0.07 | 15.0 | 4.0 | 449.99 |
| Staff room | 7.4 | 0.08 | 12.0 | 3.0 | 49.02 |
| Toilet | 6.0 | 0.05 | 20.0 | 0.0 | 64.48 |
| Hallway | 6.0 | 0.05 | 20.0 | 0.0 | 368.27 |
| Element | Description | Thickness (mm) | k (W/(m·K)) | ρ (kg/m3) | cp (J/(kg·K)) | Solar Absorptance (–) | Visible Absorptance (–) | R-Value ((m2·K)/W) | U-Value (W/(m2·K)) |
|---|---|---|---|---|---|---|---|---|---|
| Exterior wall 1 | Layer 1 | 125 | 0.17 | 600 | 1100 | – | – | – | 1.26 |
| Layer 2 | 12.5 | 0.17 | 910 | 1100 | – | – | – | ||
| Exterior wall 2 | Layer 1 | 2 | 15 | 7400 | 470 | 0.44 | 0.23 | – | 0.32 |
| Layer 2 | 12.5 | 0.17 | 910 | 1100 | – | – | – | ||
| Layer 3 | 30 | 0.064 | 290 | 1420 | – | – | – | ||
| air gap | – | – | – | – | – | – | 0.15 | ||
| Layer 5 | 50 | 0.042 | 24 | 840 | – | – | – | ||
| Layer 6 | 12.5 | 0.17 | 910 | 1100 | – | – | – | ||
| Exterior wall 3 | Layer 1 | 0.5 | 45 | 7900 | 460 | 0.44 | 0.30 | – | 0.24 |
| Layer 2 | 34.2 | 0.023 | 35 | 1700 | – | – | – | ||
| Layer 3 | 100 | 0.042 | 24 | 840 | – | – | – | ||
| Layer 4 | 12.5 | 0.17 | 910 | 1100 | – | – | – | ||
| Interior wall | Layer 1 | 22 | 0.17 | 910 | 1100 | – | – | – | 2.45 |
| air gap | – | – | – | – | – | – | 0.15 | ||
| Layer 3 | 22 | 0.17 | 910 | 1100 | – | – | – |
| Element | Description | Thickness (mm) | k (W/(m·K)) | ρ (kg/m3) | cp (J/(kg·K)) | Solar Absorptance (–) | Visible Absorptance (–) | R-Value ((m2·K)/W) | U-Value (W/(m2·K)) |
|---|---|---|---|---|---|---|---|---|---|
| Roof 1 | Layer 1 | 65 | 1.4 | 2200 | 880 | – | – | – | 0.38 |
| air gap | – | – | – | – | – | – | 0.18 | ||
| Layer 3 | 100 | 0.042 | 24 | 840 | – | – | – | ||
| Layer 4 | 9.5 | 0.17 | 910 | 1100 | – | – | – | ||
| Roof 2 | Layer 1 | 0.8 | 45 | 7900 | 460 | 0.44 | 0.30 | – | 14.67 |
| Layer 2 | 3 | 0.044 | 50 | 1300 | – | – | – |
| Element | Description | Thickness (mm) | k (W/(m·K)) | ρ (kg/m3) | cp (J/(kg·K)) | Solar Absorptance (–) | Visible Absorptance (–) | R-Value ((m2·K)/W) | U-Value (W/(m2·K)) |
|---|---|---|---|---|---|---|---|---|---|
| 1F Floor | Layer 1 | 25 | 0.037 | 28 | 1300 | – | – | – | 1.36 |
| Layer 2 | 200 | 1.4 | 2200 | 880 | – | – | – | ||
| Layer 3 | 2 | 0.19 | 1300 | 1200 | – | – | – | ||
| 2F Floor | Layer 1 | 9.5 | 0.17 | 910 | 1100 | – | – | – | 0.37 |
| Layer 2 | 100 | 0.042 | 24 | 840 | – | – | – | ||
| air gap | – | – | – | – | – | – | 0.18 | ||
| Layer 4 | 65 | 1.4 | 2200 | 880 | – | – | – | ||
| Layer 5 | 2 | 0.19 | 1300 | 1200 | – | – | – | ||
| Exposed floor | Layer 1 | 0.8 | 210 | 2700 | 880 | 0.45 | 0.09 | – | 0.38 |
| Layer 2 | 100 | 0.042 | 24 | 840 | – | – | – | ||
| air gap | – | – | – | – | – | – | 0.18 | ||
| Layer 4 | 65 | 1.4 | 2200 | 880 | – | – | – | ||
| Layer 5 | 2 | 0.19 | 1300 | 1200 | – | – | – |
| Window Type | U-Value (W/(m2·K)) | SHGC (–) |
|---|---|---|
| (1) Single-glazed glass + Hybrid frame | 5.8 | 0.70 |
| (2) Double-glazed glass (dry air) + Metal frame | 3.9 | 0.63 |
| (3) Triple-glazed Low-E glass (gass) + Hybrid frame | 1.9 | 0.26 |
| (4) Single-glazed glass + Hybrid frame + Heat shield film | 5.8 | 0.35 |
| (a) Summer | |||||||
|---|---|---|---|---|---|---|---|
| Unit | Number | Mean | S.D. | Min. | Max. | Median | |
| ta | °C | 4633 | 25.0 | 1.4 | 20.7 | 27.6 | 25.5 |
| tg | °C | 4633 | 24.6 | 1.6 | 20.0 | 27.4 | 25.1 |
| tr | °C | 4633 | 24.6 | 1.6 | 19.8 | 27.4 | 25.1 |
| HR | g/kg(DA) | 4633 | 13.2 | 3.6 | 4.6 | 18.7 | 13.7 |
| RH | % | 4633 | 62 | 13 | 25 | 83 | 64 |
| V | m/s | 1 | 0.09 | – | 0.01 | 0.23 | – |
| Met (residents) | met | 4535 | 1.0 | 0.0 | 1.0 | 1.0 | 1.0 |
| Met (staff) | met | 29 | 1.5 | 0.2 | 1.2 | 1.6 | 1.6 |
| Icl (residents) | clo | 4535 | 0.59 | 0.09 | 0.36 | 1.20 | 0.59 |
| Icl (staff) | clo | 98 | 0.52 | 0.07 | 0.44 | 0.59 | 0.59 |
| TSV (residents) | – | 4535 | 0.0 | 0.2 | −2 | 2 | 0 |
| TSV (staff) | – | 98 | 0.6 | 0.9 | −2 | 3 | 1 |
| TSVi | – | 98 | 0.1 | 0.6 | −1 | 2 | 0 |
| PMV (residents) | – | 4535 | −0.1 | 0.6 | −1.9 | 1.2 | 0.0 |
| PMV (staff) | – | 98 | 0.4 | 0.3 | −0.3 | 1.0 | 0.4 |
| to | °C | 4633 | 24.8 | 1.5 | 20.4 | 27.4 | 25.3 |
| ET* | °C | 4633 | 25.0 | 1.7 | 20.4 | 28.1 | 25.5 |
| Δta | °C | 4633 | 0.5 | 0.4 | −0.1 | 3.7 | 0.5 |
| tout | °C | 4633 | 20.5 | 5.6 | 2.0 | 35.0 | 21.6 |
| trm | °C | 4633 | 16.5 | 3.8 | 7.6 | 22.4 | 17.3 |
| (b) Winter | |||||||
| Unit | Number | Mean | S.D. | Min. | Max. | Median | |
| ta | °C | 5631 | 22.5 | 1.6 | 17.4 | 27.1 | 22.6 |
| tg | °C | 5631 | 21.0 | 1.8 | 15.2 | 26.4 | 21.1 |
| tr | °C | 5631 | 20.9 | 1.8 | 15.1 | 26.4 | 21.0 |
| HR | g/kg(DA) | 5631 | 5.3 | 1.5 | 2.3 | 13.2 | 5.0 |
| RH | % | 5631 | 30 | 7 | 15 | 62 | 28 |
| V | m/s | 1 | 0.03 | – | 0.00 | 0.20 | – |
| Met (residents) | met | 5482 | 1.0 | 0.0 | 1.0 | 1.0 | 1.0 |
| Met (staff) | met | 59 | 1.4 | 0.2 | 1.2 | 1.6 | 1.6 |
| Icl (residents) | clo | 5482 | 1.05 | 0.20 | 0.59 | 2.02 | 0.93 |
| Icl (staff) | clo | 149 | 0.88 | 0.12 | 0.59 | 0.93 | 0.93 |
| TSV (residents) | – | 5482 | −0.1 | 0.3 | −2 | 1 | 0 |
| TSV (staff) | – | 149 | 0.0 | 0.7 | −1 | 1 | 0 |
| TSVi | – | 149 | −0.2 | 0.4 | −1 | 0 | 0 |
| PMV (residents) | – | 5482 | −0.5 | 0.5 | −2.4 | 0.9 | −0.5 |
| PMV (staff) | – | 149 | 0.3 | 0.3 | −0.5 | 1.1 | 0.3 |
| to | °C | 5631 | 21.7 | 1.7 | 16.6 | 26.7 | 21.8 |
| ET* | °C | 5631 | 21.3 | 1.7 | 16.1 | 26.1 | 21.5 |
| Δta | °C | 5631 | 1.7 | 1.2 | −1.2 | 5.3 | 1.8 |
| tout | °C | 5631 | 4.2 | 5.7 | −6.3 | 23.0 | 3.7 |
| trm | °C | 5631 | 4.2 | 3.5 | −1.7 | 11.0 | 3.8 |
| Season | Regression Equation | F | p | R2 | tn (°C) | Acceptable Range (°C) |
|---|---|---|---|---|---|---|
| Summer | (1) TSV (residents) = 0.03to − 0.70 | 5.6 | <0.05 | 0.30 | 25.9 | N.D. |
| (2) TSV (staff) = 0.21to − 4.54 | 3.1 | p = 0.12 | 0.21 | N.D. | N.D.–25.5 | |
| (3) TSVi = 0.16to − 3.89 | 15.7 | <0.05 | 0.65 | 24.3 | N.D. | |
| Winter | (4) TSV (residents) = 0.04to − 0.95 | 35.2 | <0.05 | 0.70 | 23.8 | N.D. |
| (5) TSV (staff) = 0.12to − 2.86 | 8.5 | p = 0.15 | 0.41 | 23.8 | N.D. | |
| (6) TSVi = 0.07to − 1.63 | 16.0 | <0.05 | 0.58 | 25.1 | N.D. |
| Study | Survey Tear | Location | Climate | Survey Type | Building Type | Ventilation Type | Season | Age Group | Sample Size | Regression Equation | tn (°C) |
|---|---|---|---|---|---|---|---|---|---|---|---|
| This study | 2020–2021 | Nagano, Japan | Cfa | field survey | care facility | AC | Summer | 69–96 | 4535 | TSV = 0.03to − 0.70 | 25.9 |
| Winter | 69–96 | 5482 | TSV = 0.04to − 0.95 | 23.8 | |||||||
| Y. Wu [66] | 2012 | Chongqing, China | Cfa | field survey | care facilities | NV | Summer | 60–100 | 119 | TSV = 0.13ta − 3.2 | 25.4 |
| Y. Jiao [8] | 2014–2017 | Shanghai, China | Cfa | field survey | care facilities | NV | Summer | aged 70+ | 330 | TSV = 0.12to − 3.15 | 25.4 |
| Winter | aged 70+ | 342 | TSV = 0.08to − 1.27 | 16.8 | |||||||
| Mid-season | aged 70+ | 368 | TSV = 0.04to − 0.94 | 26.1 | |||||||
| F. Tartarini [24] | 2015–2016 | southeast NSW, Australia | Cfa, Cfb | field survey | care facilities | AC and NV | Summer | – | 322 | – | 22.9 |
| Y. Tao [67] | 2015–2016 | Hong Kong | Cwa | field survey | care facilities | AC and NV | Summer | aged 65+ | 181 | – | 23.9–26.8 |
| Winter | aged 65+ | 213 | – | 22.7 | |||||||
| N. Forcada [21] | 2019 | Barcelona, Tarragona, and Valencia, Spain | Csa | field survey | care facilities | – | Summer | 46–99 | 480 | TSV = 0.28to − 7.17 | 25.3 |
| N. Forcada [22] | 2019 | Barcelona, Tarragona, and Valencia, Spain | Csa | field survey | care facilities | AC | Winter | 65–99 | 724 | TSV = 0.12to − 2.48 | 21.6 |
| Y. Jin [28] | – | Edinburgh, Scotland, UK | Cfb | field survey | care facility | AC | Winter | 83–94 | – | – | 22.7 |
| R.-L. Hwang [31] | 2007 | Taiwan | – | field survey | home | AC and NV | Summer | 60–82 | 160 | TSV = 0.39to − 9.84 | 25.2 |
| Winter | 60–82 | 192 | TSV = 0.28to − 6.50 | 23.2 | |||||||
| Y. Wu [66] | 2012 | Chongqing, China | Cfa | field survey | home | AC | Summer | 60–94 | 333 | TSV = −0.07ta + 3.3 | – |
| NV | Summer | TSV = 0.10ta − 2.3 | 22.4 | ||||||||
| R. Bills [68] | 2015–2016 | Adelaide, Australia | Csa | field survey | home | AC and NV | Summer | aged 65+ | 2647 | TSV = 0.14to − 2.97 | 22.0 |
| Winter | aged 65+ | TSV = 0.28to − 5.50 | 19.7 | ||||||||
| P. O. Fanger [69] | 1968 | Copenhagen, Denmark | Cfb | chamber experiment | – | – | Autumn | 68.0 ± 4.7 a | 128 | TSV = 0.32tam − 4.24 | 25.7 |
| J. Xiong [19] | 2016 | Shanghai, China | Cfa | chamber experiment | – | – | Summer | aged 70+ | – | – | 26.0 |
| Season | Regression Equation | F | p | R2 | tn (°C) | Acceptable Range (°C) |
|---|---|---|---|---|---|---|
| Summer | (7) PMV (residents) = 0.36to − 9.00 | 3409.9 | <0.05 | 1.00 | 25.2 | 23.8–26.6 |
| (8) PMV (staff) = 0.21to − 4.82 | 364.1 | <0.05 | 0.98 | 22.7 | N.D.–25.1 | |
| Winter | (9) PMV (residents) = 0.26to − 6.04 | 1070.8 | <0.05 | 0.99 | 23.7 | 21.7–N.D. |
| (10) PMV (staff) = 0.18to − 3.90 | 260.2 | <0.05 | 0.96 | 21.2 | N.D.–23.9 |
| Season | Attribute | Sample Size | Above Upper 80% Limit | Below Lower 80% Limit | ||
|---|---|---|---|---|---|---|
| Number | Percent | Number | Percent | |||
| Summer | residents | 4535 | 0 | 0.0 | 0 | 0.0 |
| staff | 98 | 4 | 4.1 | 0 | 0.0 | |
| Winter | residents | 5482 | 83 | 1.5 | 127 | 2.4 |
| staff | 149 | 9 | 6.0 | 0 | 0.0 | |
| Season | Sample Size | Above Upper 90% Limit | Below Lower 90% Limit | ||
|---|---|---|---|---|---|
| Number | Percent | Number | Percent | ||
| Summer | 4535 | 119 | 2.6 | 0 | 0.0 |
| Winter | 5482 | 396 | 7.2 | 381 | 7.0 |
Publisher’s Note: MDPI stays neutral with regard to jurisdictional claims in published maps and institutional affiliations. |
© 2022 by the authors. Licensee MDPI, Basel, Switzerland. This article is an open access article distributed under the terms and conditions of the Creative Commons Attribution (CC BY) license (https://creativecommons.org/licenses/by/4.0/).
Share and Cite
Kainaga, T.; Sagisaka, K.; Yamada, R.; Nakaya, T. A Case Study of a Nursing Home in Nagano, Japan: Field Survey on Thermal Comfort and Building Energy Simulation for Future Climate Change. Energies 2022, 15, 936. https://doi.org/10.3390/en15030936
Kainaga T, Sagisaka K, Yamada R, Nakaya T. A Case Study of a Nursing Home in Nagano, Japan: Field Survey on Thermal Comfort and Building Energy Simulation for Future Climate Change. Energies. 2022; 15(3):936. https://doi.org/10.3390/en15030936
Chicago/Turabian StyleKainaga, Tatsuki, Kengo Sagisaka, Rintaro Yamada, and Takashi Nakaya. 2022. "A Case Study of a Nursing Home in Nagano, Japan: Field Survey on Thermal Comfort and Building Energy Simulation for Future Climate Change" Energies 15, no. 3: 936. https://doi.org/10.3390/en15030936
APA StyleKainaga, T., Sagisaka, K., Yamada, R., & Nakaya, T. (2022). A Case Study of a Nursing Home in Nagano, Japan: Field Survey on Thermal Comfort and Building Energy Simulation for Future Climate Change. Energies, 15(3), 936. https://doi.org/10.3390/en15030936