Abstract
Water Distribution System (WDS) threats have significantly grown following the Maroochy shire incident, as evidenced by proofed attacks on water premises. As a result, in addition to traditional solutions (e.g., data encryption and authentication), attack detection is being proposed in WDS to reduce disruption cases. The attack detection system must meet two critical requirements: high accuracy and near real-time detection. This drives us to propose a two-stage detection system that uses self-supervised and unsupervised algorithms to detect Cyber-Physical (CP) attacks. Stage 1 uses heuristic adaptive self-supervised algorithms to achieve near real-time decision-making and detection sensitivity of 66% utilizing Boss. Stage 2 attempts to validate the detection of attacks using an unsupervised algorithm to maintain a detection accuracy of 94% utilizing Isolation Forest. Both stages are examined against time granularity and are empirically analyzed against a variety of performance evaluation indicators. Our findings demonstrate that the algorithms in stage 1 are less favored than those in the literature, but their existence enables near real-time decision-making and detection reliability. In stage 2, the isolation Forest algorithm, in contrast, gives excellent accuracy. As a result, both stages can collaborate to maximize accuracy in a near real-time attack detection system.
1. Introduction
The significant increase of reported attacks on the Water Distribution Systems (WDS) in the last two decades, has increased the need for further advancements in technologies that can leverage security to the water systems. Maroochy Shire council’s sewage control system was attacked in 2000 by a contractor that wanted to be hired. 150 pump stations have been accessed causing a loss of approximately $200,000 for cleaning 150 million liters of untreated water that was released into commercial and industrial areas such as parks and hotels within three months [1]. The water systems have witnessed more than 15 major attacks in the last two decades, from Maroochy water treatment to Riviera beach water utility in the US in 2019 [1]. Moreover, it was reported to be within the top four of the most targeted industries [2,3]. The consequences of a successful attack on the water industry will have a long-lasting severe effect on the financial and social status. Due to the poor preventive security mechanisms in the Maroochy shire water treatment facility, the attacker was capable of bypassing them with sufficient information about the facility. This reveals that the conventional preventive mechanisms are not sufficient to avoid the disruption of the networks.
Nevertheless, applying an attack detection system along with data encryption and system authentication will improve the security of the network, more complex attacks may be able to fool the water network with adequate knowledge about the system. An example of a man-in-the-middle attack was not detected on WDS using a similar attack detection due to the sufficient knowledge the attacker had [4]. A robust attack detection system still needs further developments to avoid unnoticed attacks especially with the nonexistence data of previous attacks. Additionally, the integration of cyber and physical systems added to the vulnerability of water systems to not only physical but also cyber-attacks.
Some of the typical Cyber-Physical (CP) attacks on WDS can be summarised as (1) manipulation of the physical systems such as sensors, actuators, and other WDS assets [5]. (2) compromising the links between the physical systems, and (3) direct attacks on the Supervisory Control and Data Acquisition (SCADA) system. In particular, the attacks on the SCADA system (as previously occurred in the Maroochy shire attack) are most difficult to detect wherein they can be detected using a traffic analysis system. The movement of the Cyber-Physical Systems (CPS) involves incorporating both cyber and physical technologies altogether, which can include an attack detection system on the security policies to analyze the whole network traffic and not only store data (in the cyber layer). Hence, a robust attack detection along with conventional mechanisms (e.g., efficient logging system) is essential, when an attack occurs. Therefore, once the attack detection system identifies an existence of a breach, the efficient logging system will be able to trace the root of the problem [6].
The introduced functionality of smart water management by CPS corresponds along with the expansion of the vulnerability of cyber-attacks from malicious intruders. This could lead to a disastrous impact due to the heavy dependence of water systems on computer networks. This means an attacker can use traditional techniques to take over the water network that can provide unauthorized access on Programmable Logic Controllers (PLCs) or the SCADA systems [1]. Appropriately securing critical water infrastructures using adequate preventive mechanisms is essential to become a reality in the next generation of WDS. Lots of data analytic progression are still underdeveloped on SCADA data to detect pipeline bursts, leakages, backflows, and contamination events [7]. Hence, data analytic techniques with near real-time data monitoring are proposed for preventing intrusions and malicious activities in the water networks. In practice, some CP attacks might fool the operator with the status of the network. For example, a CP attack can manipulate the water level sensors to turn on the pumps when the water level is high, which causes a flood, and vice versa. A typical WDS is a network wherein the system nodes are its assets/devices (e.g., sensors and pumps), and the edges are the physical links (e.g., pipelines). However, the effect of the edges (pipelines) in the water network and the detection of attacks can be solely dependent on measuring the network nodes.
Therefore, a robust attack detection system using machine-learning technologies that operate in the absence of labeled data is of paramount importance in water systems. In general, there are four types of methods in the machine-learning field: supervised, semi-supervised, self-supervised, and unsupervised learning. Supervised learning requires prior knowledge about the system (training data). Semi-supervised learning is a method that produces prior knowledge (training data) with the result of combing small labeled data with large unlabelled data. Self-supervised learning is a method that generates prior knowledge (training data) from normal attributes and without any provided labeled data, and unsupervised learning is a method that can do the processing without the knowledge of the prior attacks [8,9,10,11]. Hence, the usage of self-supervised and unsupervised learning are adequate with the unlabelled data especially in water systems as it lacks the availability of data that demonstrates all potential CP attacks. The dataset in a self-supervised method does not require a manual labeling mechanism by a human, but the labeling can be done by contrasting among the sensor readings. This recognition of normality makes it possible to identify abnormal sensor readings which are pointed out as an attack [12].
A self-supervised system is proposed to contrast the measurement readings to provide learning features via pseudo labeling (explained in Section 3). This is followed by novel heuristic systems that use the learned features to identify outliers ’attacks’. The novel heuristic systems incorporate well-known supervised algorithms as tools for evaluation with similar ones in the literature. The considered algorithms in the attack detection systems include K-Nearest Neighbour (KNN), Support Vector Machine (SVM), Random Forest (RForest), Extreme Gradient Boosting (XGBoost), and Bag-of-SFA (BOSS). Nevertheless, these heuristic algorithms can provide near real-time decision-making and reliable detection of CP attacks, but incorporating a second stage of the unsupervised algorithm (Isolation Forest ’iForest’) will sufficiently incorporate high accuracy in detecting attacks. To the best of our knowledge, no work in the literature has considered two stages detection system that relies on self and unsupervised algorithms.
Since the BATADAL dataset is relatively small in size (365 days × 24 h × 7 sensors = 61,000 measurements), it is adequate to encounter shallow machine learning algorithms over deep learning in terms of power consumption as stated in [13]. The contributions of this paper are as follows:
- Developing a two-stage detection architecture for alarming and confirming CP attacks using self-supervised and unsupervised algorithms:
- Adapting self-supervised learning method for WDS using the pseudo labeling approach for Stage 1 in which heuristic attack alarming system works:
- Applying novel heuristic algorithms in stage 1 (inspired by concept drift) using the learned features from the self-supervised system;
- Applying an unsupervised algorithm (iForest) for stage 2 to maintain high accuracy of attack detection;
- Combining both algorithms of self-supervised and unsupervised algorithms for forming two-stage alarming and confirming CP attacks; and
- Experimentally studying the versatility of different time granularity and discussing the performance of these different algorithms.
Since our approach requires only access to raw time-series data from sensors, it can be used on any existing system with the logging of sensory time-series data. A comparative study of novel heuristic algorithms is studied along with comparing the performance of state-of-the-art unsupervised algorithms.
Favorable results are reported and evidencing the efficacy of the proposed system. The results are evaluated based on many performance metrics such as accuracy, time-to-detect, sensitivity, precision, , Geometric Mean (, and Specificity.
This paper is organized as follows: Section 2 reviews the related works, and critically analyses the used algorithms in attack detection. Section 3 proposes the system architecture, discusses the methodology, and presents the dataset. Section 4 presents the results, highlights the findings that come from the results, and evaluates the performances of these algorithms. Section 5 concludes the work.
2. Related Works
To protect WDS, not only preventive mechanisms that reduce the possibility of penetration of the network have to be implemented such as traffic authentication, encryption, and access control. But also, systems that can process the network traffic are crucial to maintaining the availability of the service. Attack detection is a system that can analyze users, network, and services information to find an abnormal behavior from traffic promptly. Such an abnormality may not necessarily be the reason for a breach, but it may be a result of a faulty device that can be used to bring down the network. These abnormalities may endanger the entire network of water systems, in addition to CP attacks or intruders, and both should be detected.
The algorithms used in the literature can be categorized into parametric (also known as statistical) and non-parametric models. Parametric methods usually operate on statistical distribution and require prior knowledge, which can have multivariate. Non-parametric methods are used when the density distribution of the underlying data is not known in advance, and they can be used in dynamic environments. It usually works based on labeled training data, but it can also work without prior knowledge.
In parametric methods, the work in [14] implemented an anomaly detection scheme based on the Kullback-Leibler (KL) divergence algorithm that can detect Distributed Denial of Service (DDoS) attacks and other anomalies that cannot be detected using traditional schemes. The work in [15] has developed a scheme that can detect and recover the data loss problem using partial least squares and Principal Component Analysis (PCA). KL divergence, least squares, and PCA have been shown to have high detection accuracy, but they require prior knowledge and cannot predict the source of the attack.
Non-parametric models are considered as the ideal solution for WDS as the devices might suffer from the limitation of resources in a dynamic environment. Many algorithms are investigated in the literature such as KNN, SVM, Artificial Neural Network (ANN), an algorithm based on Genetic Algorithm (GA), and other hybrid systems. KNN is discussed in detecting outliers such as presented in [16]. SVM discussed several works to include detection of abnormalities like data tampering and generic attacks [17]. ANN considered detecting DDoS, generic attacks, and data tampering [18]. The work in [19] implemented a scheme based on an unsupervised approach using practical consideration. For the GA and hybrid schemes, most of them require prior knowledge to detect faulty nodes, DDoS, and other generic attacks [20].
In 2017, Riccardo Taormina, Stefano Galili, and others announced a competition named (The BATtle of the Attack Detection Algorithms ‘BATADAL’) on the implementation of an attack detection algorithm using the SCADA data extracted from C-Town water distribution via EPANET2. Attack scenarios are used to generate the attacked data measurements through EpanetCPA [13]. Seven participants have been evaluated in this competition based on several coefficients: ranking score (S), time-to-detection score (), accuracy (), true positives (), false positives (), true negatives () and false negatives () (see Table 1) [21]. Covariance and mean are the key extracted features in the approaches at the BATADAL using either PCA or convex optimization as in Aghashahi et al. [22], Giacomoni et al. [23] and Abokida et al. [24].

Table 1.
Comparison of algorithms that used on BATADAL dataset.
Most of the algorithms check for the consistency and violation of the SCADA data based on a set of rules and it can raise a flag in case of violation for further investigation as in Pasha et al. [25], Abokida et al. [24] and Housh & Ohar [26]. The detailed evaluation of BATADAL algorithms and competition information is discussed in [27]. Generally, all the algorithms used in the competition are based on supervised learning except for Chandy et al. work [28]. Ramotsoela et al. [6] further evaluated several algorithms on the BATADAL dataset (see Table 1). These algorithms are Quadratic Discriminant Analysis (QDA), Mahalanobis Distance (MD), Local Outlier Factor (LOF), Subspace Outlier Degree (SOD), Naive Bayes (NB), Once-Class Support Vector Machine (OSVM), Linear Discriminant Analysis (LDA) and Ensemble model of parametric & Non-parametric algorithms. Brentan et al. in [29] also utilized a two-step framework of attack detection in which fast Independent Component Analysis (fastICA) algorithm is applied followed by a statistical control algorithm. Moreover, Young et al. [30] constructed an attack detection model on the same dataset using 5NN, ANN, and an extreme learning machine. Finally, Mehdi and Bruno in [31] developed a detection system to avoid Prevented Actuation Attack, where the attacker target the communication between the PLCS and Pumps/Valves. it utilizes the probabilistic approach in detecting this attack, but they did not consider simulating their data on the BATADAL dataset.
Nevertheless, there are several models of attack detection on WDS as discussed, they still require further development to support high accuracy and near real-time decision-making. Moreover, the lack of the previously encountered CP attacks of this domain motivates us to bring many recent machine-learning concepts to the water industry such as self-supervised and concept drift in two-stage attack detection systems which have not been explored in the literature.
3. Architecture, Methodology and Dataset
3.1. Proposed Architecture
The proposed architecture consists of two parallel detection stages for alarming and confirming CP attacks where each stage features a unique detection method with a distinct benefit, such as fast detection in stage 1 and accuracy and precision in stage 2 (see Figure 1). The two stages begin concurrently, however one stage may take longer than the other in order to confirm the attack. Stage 1 aims to detect attacks near real-time decision-making and provide reliable attacks through a self-supervised and heuristic attack alarming system. It collects data from all WDS devices (e.g., tank pressure, pump flow, pipeline flow, pipeline status, and so on) in order to understand the pattern of the network’s average readings. This work focuses on classifying the water tank into one of the groups assigned to each water tank. The sensor labels have been used as the pseudo label making the problem a supervised/self-supervised one. The pseudo labeling is conducted through learning objective functions of pretext tasks. The output data is a classification of the WDS devices’ assignment to one of the groups based on the learned data.
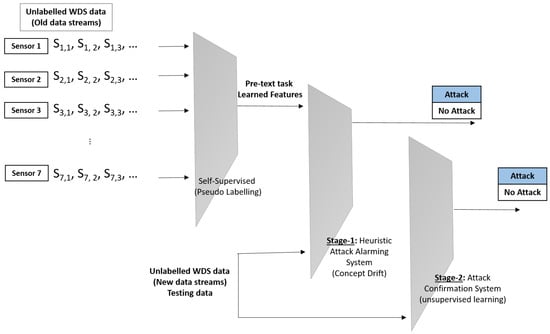
Figure 1.
Proposed two-stage detection architecture for alarming and confirming CP attacks.
Various pretext tasks are proposed in the literature for different applications such as computer vision, data measurements, and video processing. For computer vision processing, examples of these tasks are colorizing grayscale images [33], image inpainting [34] and image jigsaw puzzles [35]. The available tasks for data measurement tasks are Contrastive Predictive Coding (CPC) [36], momentum contrast [37]. For video processing, tracking movements of objects [38], validation of frame order [39], video colourisation [40] are the commonly used tasks. Hence, this work emphasizes contrasting sensor readings as pretext tasks for pseudo labeling in self-supervised algorithms. Two common properties of the pretext tasks are shared: (a) learned features through pretext tasks, and (b) automatically generated pseudo labeling the pretext tasks based on the attributes.
Then novel heuristic detection algorithms are performed on the learned features and generate pseudo labels. The heuristic detection algorithms are inspired by the concept drift where it takes learning features (and not previously encountered attacks) with the input data (WDS data) for attack detection. Concept drift is a phenomenon wherein the data distribution (input data) changes over time [41]. This can make the outlier detection inaccurate or hard to identify. With the concept of self-supervision, the input learned features of the attack detection change and cause the typical attack detection systems to not get any accurate results. Hence, adapting the novel attack detection systems to be able to use the learned features as input is paramount.
Stage 2 aims to confirm CP attacks using an accurate detection unsupervised algorithm which is iForest. This stage uses the same input as stage 1, but it does not rely on the previously learned facts. It discovers the underlying structure between WDS device measurements and reading patterns over time in order to classify the provided data into the allocated groups that represent water tanks. However, the accurate detection of the unsupervised algorithm, especially iForest, the combination of the self-supervised and unsupervised algorithms will provide reliable and accurate detection in near real-time decision-making.
Both stages take input data from all network devices, such as tank pressure, pump flow, pipeline flow, pipeline status, and pump status (see two examples of attacked data in Figure 2). Some of the attacks may have consequences on other network assets based on the correlation between the devices (see Table 1). These data are utilized in the processing to analyze the behavior of the water flow and detect any abnormalities.
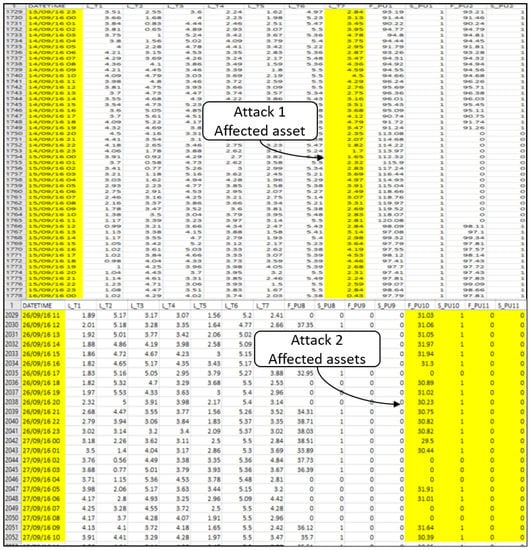
Figure 2.
Two examples of attacked data in the dataset.
Attacks on WDS are typically hard to characterize. First, these systems varied greatly according to the geographic location they are based at. Second, the type of attack and its consequences depend on the network topology of the system. Finally, the scarcity of such attacks is evident, as they are yet to be deeply studied, similar to other Cyber Security attacks. Providing such challenges, in this work, a novel method for attack detection in WDS is proposed inspired by the currently successful self-supervised machine learning approach. The proposed approach takes the data originating sensor or device in a WDS as a pseudo label, characterizing the typical data generation process of each device, in a supervised learning process (pretext task in the self-supervised learning terminology). This addresses the first challenge by making the proposed method agnostic to the geographic location where the WDS is deployed. By characterizing the data originating from each device in a WDS, the second challenge is addressed, as the network topology does not affect the effectiveness of the system, and as such, it is considered topology-invariant. As self-supervised learning naturally addresses the limited availability of data in the target domain, the last challenge is addressed, as labeled attacks are not needed, because the proposed method relies on misclassification of pseudo labels for attack detection. This is unlike the typical self-supervised learning, where the pretext task is only used for representation learning. In this work, however, we used the pretext task to characterize any unseen attack.
3.2. Methodology
The algorithms implemented in the two-stage detection architecture are SVM, KNN, RForest, XGBoost, and BOSS for stage 1, and iForest for stage 2. The objective for selecting these algorithms is to achieve high accuracy in near real-time decision making through simplicity and rapid assessment time. Stage 1 intended to quickly notify a possible warning using self-supervised learning, followed by an accurate confirmation of the attack using unsupervised learning.
Although several attack detection models using WDS have been examined, they still require additional refinement to support high accuracy and near real-time decision-making. Furthermore, the scarcity of previously known CP attacks in this domain pushes us to apply various recent machine-learning techniques to the water industry, such as self-supervised and concept drift in two-stage attack detection architecture, which have not been examined in the literature. However, two stages detection architecture is more complex than the typical one-stage detection in the literature review, this did not degrade the detection performance. The following are the descriptions of these Algorithms:
3.2.1. Support Vector Machine (SVM)
SVM is one of the powerful and widely used learning algorithms in classifying or constructing a separable hyper-plane where the prediction is made according to the calculation of the distance between the hyperplane and the testing data in a quadratic optimization problem [42]. It draws the boundaries based on the extreme points in the dataset through the optimization problem to maximize the margins for high confident detection [42]. It is considered the best algorithm in segregating two classes as mentioned in [43].
In general, It operates on the linearly separated data, but it can still transform the non-linear data separately into a higher dimensional space. Such a transformation requires a qualified kernel to avoid lots of computation using a trick known as the Kernel trick [43]. The kernel uses a dot product between every two vectors in all points for mapping purposes. It calculates confidence parameters on each training instance, the classifier revisits the lowest confidence data which means the worst of the misclassified data to guarantee a well-established convergence.
Consequently, it has fewer data points to carry mislabelling penalties. In addition, such a technique improves based on re-training and re-labeling the worst misclassified vectors till it converges. Thus, it is effective and memory-efficient in high dimensional data space (in different words for non-linear data and non-separable data). On the other hand, it does not estimate the probability of the classification directly such as other techniques such as RForest [42].
3.2.2. K-Nearest Neighbour (KNN)
KNN is a non-parametric technique for classification based on the plurality vote of the neighbours [44]. It is one of the simplest machine learning algorithms for classifications where weight is assigned to the contributions of the neighbors so that the nearer neighbors contribute more to the average than the more distant ones [44]. In contrast to other learning algorithms that allow discarding the training data after the model is assembled, KNN keeps all training examples in memory.
Once new, previously unseen data come in, the KNN algorithm finds k training examples closest to x and returns the majority of the label [45]. It assigns random k feature extraction, called centroids, to be classified into one of the k clusters based on the Euclidean distance technique. Then, the computation/classifications of the centroids are recomputed through the process while their locations do not change [45]. In particular, if K = 1 then the classifier only classifies to one distant neighbor, and for K = 5 means that the classifier classifies to five distant neighbors. Hence, when the value of K increases, the probability to make the right classification increases, but with the worst accuracy of false positive.
3.2.3. Random Forest (RForest)
Random forest is an acyclic graph that is used to make decisions because of its features of being a flexible and easy-to-use algorithm [42]. In each branching of the graph, a specific feature is examined and used to make decisions [45]. The name refers to a random bunch of trees wherein each ensemble decision tree is made with an individual classifier. The final decision of the RForest is based on the voting system of the attributes at each tree given in the regression of the classification process. Since there are a large number of relatively uncorrelated classifiers ‘trees’, this can contribute to making the most convenient classification [46].
As more decision trees engage in the process, the accuracy of the result can be improved once the prediction system is combined. It is known to have high accuracy of the classification even if the hyper-plane parameters did not change [47]. Moreover, the fact that it can be used in classification and regression makes it very attractive to be used [42]. In addition, RForest does not over-fit the data which is used to happen to a single tree. On the other hand, it is considered a complex and time-consuming learning algorithm compared to other machine learning algorithms such as SVM and KNN.
3.2.4. Extreme Gradient Boosting (XGBoost)
XGBoost is short for an extreme gradient Boosting algorithm. It is an efficient form of gradient boosting with a linear model solver and tree-based learning algorithm. Multiple Additive Regression Trees (MART), Gradient Boosted Regression Trees (GBRT), or Gradient Boosting Machine (GBM) are considered as special cases of the boosting algorithms for multiple trees.
It is considered as a new tree boosting method, which is similar to the MART method. It consists of several tree ensemble models with each set correlating to the Classification and Regression Trees (CART) for classification purposes. The instances receive a score on the corresponding cluster enrolled. The score is not only associated individually with the cluster as in the decision trees but also among all the clusters which make the interpretations richer [48].
3.2.5. Bag-of-SFA-Symbols (BOSS)
This is a technique that applies noise reduction to the raw time-series data. It filters and quantizes (through a sliding window) the extracted patterns for a string matching algorithm or symbolic representation, called SFA. Then a Sequence of Symbols (SFA word) for each sliding window is generated, leading to the generation of a histogram of these SFA words for indicating similarities [49].
This technique has several advantages such as quick responsivity (as it is using the hashing function), noise reduction capabilities, invariance to phase shifts, offsets, amplitudes, and occlusions. The BOSS algorithm has similar stages to Bag-of-Pattern (BOP), the algorithm has to filter slide windows to form a sequence of SFA words through discrete Fourier Transform (DFT) and discretization by quantization technique called Multiple Coefficient Binning (MCB). K-nearest neighbor classification algorithm based on a non-symmetrical function called bespoke distance is used. This algorithm concerns calculating the distance between the frequencies of SFA words, which occurred in the first histogram.
3.2.6. Isolation Forest (iForest)
Isolation forest is a technique inspired by RForest in terms of having ensemble decision trees. But, the classification in iForest identifies the anomalies instead of profiling them. It is an extension of the decision trees using a mechanism called isolation which is a procedure that involves iterative portioning of the input for separating attributes [50]. These trees are created by a random selection of attributes. Each node in the network has two divided parts: attributes and their value that leads to the optimal split.
During an attack, the affected instances have different attributes than the normal ones. Detection of those affected instances is even easier in the isolation process as they are closer to the root and easily distinguished from the normal ones. It calculates the average depth of all instances calculated by the ensemble individual tress. Since the outliers are less frequently occurring than normal observations, it is more accurate for classification since it is closer to the root of the trees with fewer splits needed. The partitioning process is first created based on a certain feature, and then a classification occurs (tree split) for this feature and so on [50].
3.3. Dataset
The data used in this work is the BATADAL competition dataset as discussed in [13]. The dataset has an hourly time interval from 4 July 2016 to 25 December 2016, and testing data that characterizes seven attacks from 4 January 2017 to 1 April 2017. This data was generated via the EPANETCPA toolbox that assesses several types of attacks (see Figure 3). This dataset is chosen to evaluate the self-supervised and unsupervised models with competitive state-of-the-art algorithms in the water industry [27].
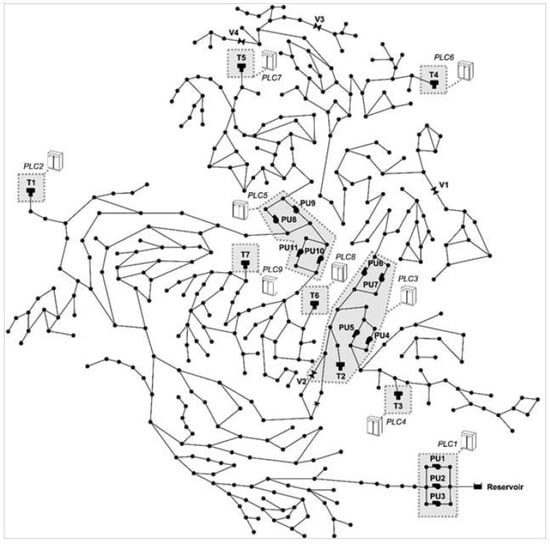
Figure 3.
C-Town water distribution [27] (Reproduced with permission from the data availability statement).
The C-Town water distribution system consists of 429 pipes, 388 Junctions, 7 water levels sensors in tanks (shorted to T), 9 PLCs, 11 pumps (distributed across five pumping stations and shorted to PU), 4 valves (shorted to v), and 1 reservoir. For instance, PLC1 is responsible for pumps (PU1 and PU2) based on the control signal which comes from the tank sensor (T1) through PLC2. PLCs control the pumps and valves through ON/OFF and OPEN/CLOSED commands. The whole process is monitored, supervised, and stored by the SCADA system, where only the water level sensors in the water tanks are presented in the forms of assigned groups to which all data processing is assigned. The data collected from the C-town water distribution has a value every timestamp for almost all the devices (e.g., pumps, tank sensors, junctions) concerning its function. For instance, the level sensors in the water tank represent the values of the water level tanks, pumps have the control signals, and the sensors in the pipelines and junctions have calculated values of the water flow and pressure. The attack detection processing considers the classification of the 7 water tanks sensors and also considers other WDS devices’ data (e.g., pumps, pipelines) that still take place in the classification process. The water consumption’s/readings of the WDS are assumed to be fairly regular all over the year [27]. The used dataset was generated from EPANETCPA through several attack scenarios. The seven attacks are briefly described as follows (see Table 2):
Table 2.
Attack Scenarios [27]. (Reproduced with permission from the data availability statement).
- Attacks #1 and #2 deal with channel manipulation of the transmitted signal from sensor T7 to the SCADA system. The signal is manipulated to have a wrong control signal (It shows HIGH while it is LOW) which can cause a drought.
- Attacks #3 and #4 show the same effect in the previous attacks, yet it shows an incorrect water level leading to the wrong operational action by keeping the pump working and causing flooding.
- Attacks #5, #6, and #7 manipulated the control signals that can cause the pumps to change their speed, which can cause flooding or drought.
4. Results, Discussion and Performance Evaluation
A proposal of a two-stage attack detection architecture is developed based on self-supervised and unsupervised algorithms. To apply self-supervised algorithms, a pseudo labeling algorithm is developed (through pretext tasks) using sensor labels only. It learns the WDS device’s reading, correlation, and structure while generating the classification groups that are referred to as labels by the water level sensors. In the contrast, the self-supervised algorithms are adaptable changed accordingly wherein learned features of the classification groups are used as input of stage 1 detection algorithms. Then, the iForest algorithm in stage 2 is developed to provide accurate confirmation of the attacks in comparison with other detection algorithms as stated in [51]. As shown, the dataset comprising the attacks affects some WDS device values based on the type of attack executed; moreover, some of them may influence other WDS devices (see Figure 2 and Table 2). Our proposals in both stages are compared with the ones in the literature and evaluated on several times-granularity of 6, 12, 24, 48 h (see Table 3). The system specification used for the simulation is i5-6200U, CPU 2.4 GHz, and 8192 MB Ram.
Table 3.
Performance Evaluation of our results for both stages at different granularity.
In general, the overall performance improves with smaller time granularity at the expense of FP & FN, which highlights a trade-off between detection of attacks and reliability of detection which is visible through the number of FP & FN. Apart from that, different granularity provides insights on what best algorithm can be used considering near real-time decision-making.
It is observed in stage 1, Boss, XGboost, and RForest are the most accurate among our self-supervised proposals, and they performed well in a similar dataset [52]. Nevertheless, these algorithms have less favorable performance than the ones in the literature, but our proposal is more versatile, reliable, and can adapt with different WDS data because of the concept drift and their ability in processing unstructured data as stated in [53] (see Table 4). In stage 2, the iForest outperforms Convolutional variational auto-encoder and OSVM ones with 180 FP in 6-hour granularity. The number of FP of the iForest algorithm can get less than 70 at the 12 h granularity, but the detector misses two attacks (see Table 3). The iForest outperforms the similar ones in the literature because the detection is based on the voting mechanism of several ensemble trees, wherein individual decision trees do the detection (See Table 5). However the iForest has a more favorable performance than our self-supervised algorithms, it is less reliable when detecting near real-time data. Hence, combining both algorithms is paramount to providing high normalized accuracy and a reliable detection system.
Table 4.
, , and S in the stage 1 using 6 h granularity.
Table 5.
, , and S in stage 2 of using 6 h granularity.
At 6 h granularity, only 1NN could not detect all attacks due to the nearest neighbor coefficient. 5NN and 7NN detected all attacks and it started to diverge with a higher number of FP. It can be observed that it is optimal to use 3NN since it detected all attacks with the least number of FP. We emphasized the 6 h because, at the large time granularity in this dataset, the attack may be masked by normal data, and thus may go undetected. In addition, the other time granularities are monotonically the same.
Our considered algorithms in both stages are evaluated using many performance metrics which are time assessment per time granular (), normalised accuracy (), time-to-detect (), weighted score function (s), , , precision, sensitivity, and specificity. The time assessment per time granular is the time taken to assess the algorithm regardless of the time granularity. The time assessment per time granular () of all algorithms varies from 16.7 to 165 ms based on the complexity of the algorithm (see Table 6). iForest and RForest have the fastest assessment time. The time assessment per time granular is calculated for the algorithm processing time and attack time (see Equation (1)).
Table 6.
Assessment time of our proposals in both stages.
Moreover, the normalised accuracy () is evaluated in the proposed algorithms. iForest has an accuracy of 94.86% for Stage 1 (see Table 6). is derived from the True Positives Ratio (TPR) and True Negatives Ratio (TNR) (see Equations (2)–(4)).
is considered in the evaluation, which refers to the time taken by the algorithm to detect attacks. A score of is considered to facilitate the evaluation of the work and to be used in the weighted optimisation problem (see Equation (5)).
where is the number of attacks, is the detected attack time, is the attack started time, and is the total attack duration. The results of the show that overall performance is less favourable than the supervised-based algorithms in BATADAL competition, except RForest [22] (see Table 4). A scoring metric of a weighted function of both factors is evaluated as:
where is a weight provided for the two factors . The results of the scoring metrics are compared to the BATADAL algorithms (see Table 5 and Table 6). The simulation is assumed to have equal requirements of high normalized accuracy and fast time-to-detect (equally weights). The weights in the function can be varied based on the need of the WDS, which means the operators may adjust more weight in the accuracy for having accurate attacks instead of quick detection of the attack, and vice versa. or Sensitivity and or Specificity are calculated for further evaluation of the performance with the relation between positive detection data, which are correctly considered as positive, and negative detected data (see Figure 4). These are mistakenly considered as positive, concerning all positive and negative detection of CP attacks, respectively (see Equations (3) and (4)).
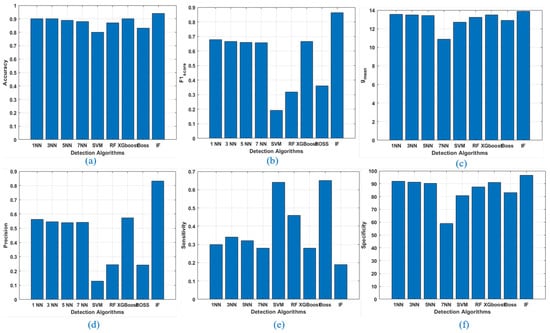
Figure 4.
Performance Evaluation for several metrics for 6 h granularity, (a) accuracy, (b) F1score, (c) gmean, (d) precision, (e) sensitivity, and (f) specificity.
Precision, score, and are additional performance metrics in our work and not considered in the BATADAL competition participants. Precision is the fraction of detecting data instances among the retrieved instances (see Equation (7)). metric shows the percentage of the true positives that were recalled (see Equation (8)). score is used to measure the accuracy of the test data, it corresponds to how many instances were classified correctly and how many instances did not miss (see Equation (9)). The Geometric Mean () is a metric that indicates how good the detector is (see Equation (10)).
The performance metrics are applied for 6 h of time granularity (see Figure 4). The variation of the performance of different KNN algorithms is almost the same. Our proposed algorithms in stage 1 are less favoured than the ones in the literature, such as MILP [55], ANN [24], QDA [6] and PCA [23]. But, they are more reliable and sensitive in detecting attacks (see Table 7). It is observed that our self-supervised algorithms such as SVM, BOSS, RForest in stage 1 outperformed the iForest algorithm in stage 2 in terms of sensitivity (see Table 7). In addition, Because Boss, XGboost, and RF have the highest normalized sensitivity of 65%, 46%, and 64%, respectively, Stage 1 intends to deliver alerts in near real-time decision-making utilizing heuristic self-supervised approaches. This is followed by a second stage of verifying attacks using iForest as an unsupervised technique which outperformed the others in terms of accuracy with 94%. Hence, a combination of the two algorithms in two-stage detection architecture provides reliable detection in near real-time decision-making.
Table 7.
metric of our proposed algorithms at different granularity.
Although this research focuses on detecting CP attacks in WDS, this methodology can also apply in other smart industries such as energy, oil and gas, transportation, and telecommunications with considering the application specifications and types of attacks. Additionally, different Machine learning internal adjustments may be required for the algorithms to perform effectively in different industries.
5. Conclusions
This paper proposes a two-stage detection architecture using self-supervised and unsupervised algorithms to provide CP attacks alarming and confirming systems. Stage 1 aims to provide alarms in near real-time decision-making using heuristic self-supervised methods since it has the highest sensitivity percentage for 65%, 46%, and 64% for Boss, XGboost, and RF, respectively. This is followed by stage 2 of confirming attacks using iForest as an unsupervised method which has a normalized accuracy of 94%. Both stages can work together to realize the full potential of the attack detection system.
The evaluation of all algorithms using several time-granularity is performed to show that they support the near real-time decision-making and incorporate both methods to help maintain a reliable attack detection system. The proposed architecture is arguably effective in maintaining reliable detection of attacks without previously unseen attacks and it proved to be practical due to its reliance on normal hydraulic data only.
However, the calculated weight of the system has been recommended that the water operators use an equal weight of accuracy and . The water operators may need to adjust these weights in some cases, especially when they suspect the existence of the attack to have more weight of accuracy.
Author Contributions
Conceptualization, H.M., W.W. and M.M.G.; methodology, H.M., W.W. and M.M.G.; validation, H.M., W.W. and M.M.G.; formal analysis, H.M., W.W. and M.M.G.; investigation, H.M., W.W. and M.M.G.; data curation, H.M.; writing—original draft preparation, H.M.; writing—review and editing, H.M., W.W. and M.M.G.; supervision W.W. and M.M.G.; funding acquisition W.W. All authors have read and agreed to the published version of the manuscript.
Funding
This research has received funding from the European Union’s Horizon 2020 research and innovation program under the Marie Sklodowska-Curie Training Networks (ITN)-IoT4Win grant agreement No. [765921].
Data Availability Statement
The dataset used in this paper is presented in the BATADAL competition (https://www.batadal.net/data.html, accessed on 16 December 2021).
Acknowledgments
This research has received funding from the European Union’s Horizon 2020 research and innovation program under the Marie Skłodowska-Curie Training Networks (ITN)-IoT4Win grant agreement No. [765921].
Conflicts of Interest
The authors declare that they have no conflict of interest.
References
- Krithivasan, K.; Pravinraj, S.; VS, S.S. Detection of Cyberattacks in Industrial Control Systems Using Enhanced Principal Component Analysis and Hypergraph-Based Convolution Neural Network (EPCA-HG-CNN). IEEE Trans. Ind. Appl. 2020, 56, 4394–4404. [Google Scholar]
- US Department of Homeland Security. ICS-CERT (Industrial Control Systems-Cyber Emergency Response Team) (2017) NCCIC/ICS-CERT Year in Review: FY 2016. 2017. Available online: https://www.cisa.gov/uscert/sites/default/files/Annual_Reports/Year_in_Review_FY2016_Final_S508C.pdf (accessed on 20 January 2022).
- Mahmoud, H.; Wu, W. Cyber-Physical System Security Open Challenges in Smart Water Networks. In Proceedings of the 17th International Computing & Control for the Water Industry Conference, Exeter, UK, 1–4 September 2019. [Google Scholar] [CrossRef]
- Miciolino, E.E.; Setola, R.; Bernieri, G.; Panzieri, S.; Pascucci, F.; Polycarpou, M.M. Fault diagnosis and network anomaly detection in water infrastructures. IEEE Des. Test 2017, 34, 44–51. [Google Scholar] [CrossRef]
- Ezell, B.C.; Haimes, Y.Y.; Lambert, J.H. Risks of cyber attack to water utility supervisory control and data acquisition systems. Mil. Oper. Res. 2001, 6, 23–33. [Google Scholar] [CrossRef]
- Ramotsoela, D.T.; Hancke, G.P.; Abu-Mahfouz, A.M. Attack detection in water distribution systems using machine learning. Hum.-Centric Comput. Inf. Sci. 2019, 9, 13. [Google Scholar] [CrossRef]
- Adepu, S.; Palleti, V.R.; Mishra, G.; Mathur, A. Investigation of Cyber Attacks on a Water Distribution System. arXiv 2019, arXiv:1906.02279. [Google Scholar]
- Zhai, X.; Oliver, A.; Kolesnikov, A.; Beyer, L. S4l: Self-supervised semi-supervised learning. In Proceedings of the IEEE International Conference on Computer Vision, Seoul, Korea, 27–28 October 2019; pp. 1476–1485. [Google Scholar]
- Hendrycks, D.; Mazeika, M.; Kadavath, S.; Song, D. Using self-supervised learning can improve model robustness and uncertainty. arXiv 2019, arXiv:1906.12340. [Google Scholar]
- Jing, L.; Tian, Y. Self-supervised visual feature learning with deep neural networks: A survey. IEEE Trans. Pattern Anal. Mach. Intell. 2020, 43, 4037–4058. [Google Scholar] [CrossRef]
- Abbas, A.; Abdelsamea, M.M.; Gaber, M. 4S-DT: Self Supervised Super Sample Decomposition for Transfer learning with application to COVID-19 detection. arXiv 2020, arXiv:2007.11450. [Google Scholar] [CrossRef]
- Wang, Y.; Mei, J.; Zhang, L.; Zhang, B.; Zhu, P.; Li, Y.; Li, X. Self-supervised feature learning with crf embedding for hyperspectral image classification. IEEE Trans. Geosci. Remote. Sens. 2018, 57, 2628–2642. [Google Scholar] [CrossRef]
- Taormina, R.; Galelli, S.; Douglas, H.; Tippenhauer, N.O.; Salomons, E.; Ostfeld, A. A toolbox for assessing the impacts of cyber-physical attacks on water distribution systems. Environ. Model. Softw. 2019, 112, 46–51. [Google Scholar] [CrossRef]
- Xie, M.; Hu, J.; Guo, S.; Zomaya, A.Y. Distributed segment-based anomaly detection with Kullback–Leibler divergence in wireless sensor networks. IEEE Trans. Inf. Forensics Secur. 2016, 12, 101–110. [Google Scholar] [CrossRef]
- Magán-Carrión, R.; Pulido-Pulido, F.; Camacho, J.; García-Teodoro, P. Tampered data recovery in WSNs through dynamic PCA and variable routing strategies. J. Commun. 2013, 8, 738–750. [Google Scholar] [CrossRef]
- Liu, J.; Deng, H. Outlier detection on uncertain data based on local information. Knowl.-Based Syst. 2013, 51, 60–71. [Google Scholar] [CrossRef]
- Shilton, A.; Rajasegarar, S.; Palaniswami, M. Combined multiclass classification and anomaly detection for large-scale wireless sensor networks. In Proceedings of the 2013 IEEE Eighth International Conference on Intelligent Sensors, Sensor Networks and Information Processing, Melbourne, VIC, Australia, 2–5 April 2013; pp. 491–496. [Google Scholar]
- Yusuf, S.A.; Brown, D.J.; Mackinnon, A.; Papanicolaou, R. Application of dynamic neural networks with exogenous input to industrial conditional monitoring. In Proceedings of the 2013 International Joint Conference on Neural Networks (IJCNN), Dallas, TX, USA, 4–9 August 2013; pp. 1–8. [Google Scholar]
- Bankovic, Z.; Fraga, D.; Vallejo, J.C.; Moya, J.M. Improving reputation systems for wireless sensor networks using genetic algorithms. In Proceedings of the 13th Annual Conference on Genetic and Evolutionary Computation, Dublin, Ireland, 12–16 July 2011; pp. 1643–1650. [Google Scholar]
- Ma, T.; Wang, F.; Cheng, J.; Yu, Y.; Chen, X. A hybrid spectral clustering and deep neural network ensemble algorithm for intrusion detection in sensor networks. Sensors 2016, 16, 1701. [Google Scholar] [CrossRef] [PubMed] [Green Version]
- Taormina, R.; Galelli, S. Real-time detection of cyber-physical attacks on water distribution systems using deep learning. In Proceedings of the World Environmental and Water Resources Congress 2017, Sacramento, CA, USA, 21–25 May 2017; pp. 469–479. [Google Scholar]
- Aghashahi, M.; Sundararajan, R.; Pourahmadi, M.; Banks, M.K. Water Distribution Systems Analysis Symposium–Battle of the Attack Detection Algorithms (BATADAL). In Proceedings of the World Environmental and Water Resources Congress 2017, Sacramento, CA, USA, 21–25 May 2017; pp. 101–108. [Google Scholar]
- Giacomoni, M.; Gatsis, N.; Taha, A. Identification of cyber attacks on water distribution systems by unveiling low-dimensionality in the sensory data. In Proceedings of the World Environmental and Water Resources Congress 2017, Sacramento, CA, USA, 21–25 May 2017; pp. 660–675. [Google Scholar]
- Abokifa, A.A.; Haddad, K.; Lo, C.S.; Biswas, P. Detection of cyber physical attacks on water distribution systems via principal component analysis and artificial neural networks. In Proceedings of the World Environmental and Water Resources Congress 2017, Sacramento, CA, USA, 21–25 May 2017; pp. 676–691. [Google Scholar]
- Pasha, M.F.K.; Kc, B.; Somasundaram, S.L. An approach to detect the cyber-physical attack on water distribution system. In Proceedings of the World Environmental and Water Resources Congress 2017, Sacramento, CA, USA, 21–25 May 2017; pp. 703–711. [Google Scholar]
- Housh, M.; Ohar, Z. Model-based approach for cyber-physical attack detection in water distribution systems. Water Res. 2018, 139, 132–143. [Google Scholar] [CrossRef]
- Taormina, R.; Galelli, S.; Tippenhauer, N.O.; Salomons, E.; Ostfeld, A.; Eliades, D.G.; Aghashahi, M.; Sundararajan, R.; Pourahmadi, M.; Banks, M.K.; et al. Battle of the attack detection algorithms: Disclosing cyber attacks on water distribution networks. J. Water Resour. Plan. Manag. 2018, 144, 04018048. [Google Scholar] [CrossRef] [Green Version]
- Chandy, S.E.; Rasekh, A.; Barker, Z.A.; Campbell, B.; Shafiee, M.E. Detection of cyber-attacks to water systems through machine-learning-based anomaly detection in scada data. In Proceedings of the World Environmental and Water Resources Congress 2017, Sacramento, CA, USA, 21–25 May 2017; pp. 611–616. [Google Scholar]
- Brentan, B.; Rezende, P.; Barros, D.; Meirelles, G.; Luvizotto, E.; Izquierdo, J. Cyber-Attack Detection in Water Distribution Systems Based on Blind Sources Separation Technique. Water 2021, 13, 795. [Google Scholar] [CrossRef]
- Choi, Y.H.; Sadollah, A.; Kim, J.H. Improvement of Cyber-Attack Detection Accuracy from Urban Water Systems Using Extreme Learning Machine. Appl. Sci. 2020, 10, 8179. [Google Scholar] [CrossRef]
- Hosseinzadeh, M.; Sinopoli, B. Active Attack Detection and Control in Constrained Cyber-Physical Systems Under Prevented Actuation Attack. arXiv 2021, arXiv:2101.09885. [Google Scholar]
- Brentan, B.M.; Campbell, E.; Lima, G.; Manzi, D.; Ayala-Cabrera, D.; Herrera, M.; Montalvo, I.; Izquierdo, J.; Luvizotto, E., Jr. On-line cyber attack detection in water networks through state forecasting and control by pattern recognition. In Proceedings of the World Environmental and Water Resources Congress 2017, Sacramento, CA, USA, 21–25 May 2017; pp. 583–592. [Google Scholar]
- Zhang, R.; Isola, P.; Efros, A.A. Colorful image colorization. In Proceedings of the European Conference on Computer Vision, Amsterdam, The Netherlands, 11–14 October 2016; pp. 649–666. [Google Scholar]
- Pathak, D.; Krahenbuhl, P.; Donahue, J.; Darrell, T.; Efros, A.A. Context encoders: Feature learning by inpainting. In Proceedings of the IEEE Conference on Computer Vision and Pattern Recognition, Las Vegas, NV, USA, 27–30 June 2016; pp. 2536–2544. [Google Scholar]
- Noroozi, M.; Favaro, P. Unsupervised learning of visual representations by solving jigsaw puzzles. In Proceedings of the European Conference on Computer Vision, Amsterdam, The Netherlands, 11–14 October 2016; pp. 69–84. [Google Scholar]
- Van den Oord, A.; Li, Y.; Vinyals, O. Representation Learning with Contrastive Predictive Coding. arXiv 2018, arXiv:1807.03748. [Google Scholar]
- He, K.; Fan, H.; Wu, Y.; Xie, S.; Girshick, R. Momentum Contrast for Unsupervised Visual Representation Learning. arXiv 2020, arXiv:1911.05722. [Google Scholar]
- Wang, X.; Gupta, A. Unsupervised Learning of Visual Representations using Videos. arXiv 2015, arXiv:1505.00687. [Google Scholar]
- Misra, I.; Zitnick, C.L.; Hebert, M. Shuffle and Learn: Unsupervised Learning using Temporal Order Verification. arXiv 2016, arXiv:1603.08561. [Google Scholar]
- Vondrick, C.; Shrivastava, A.; Fathi, A.; Guadarrama, S.; Murphy, K. Tracking Emerges by Colorizing Videos. arXiv 2018, arXiv:1806.09594. [Google Scholar]
- Demšar, J.; Bosnić, Z. Detecting concept drift in data streams using model explanation. Expert Syst. Appl. 2018, 92, 546–559. [Google Scholar] [CrossRef]
- Yazici, M.; Basurra, S.; Gaber, M. Edge machine learning: Enabling smart internet of things applications. Big Data Cogn. Comput. 2018, 2, 26. [Google Scholar] [CrossRef] [Green Version]
- Han, J.; Pei, J.; Kamber, M. Data Mining, Concepts and Techniques; Morgan Kaufmann Publishers: Waltham, MA, USA, 2011. [Google Scholar]
- Altman, N.S. An introduction to kernel and nearest-neighbor nonparametric regression. Am. Stat. 1992, 46, 175–185. [Google Scholar]
- Burkov, A. The Hundred-Page Machine Learning Book; Taylor and Francis Publisher: Quebec City, QC, Canada, 2019. [Google Scholar]
- Louppe, G. Understanding random forests: From theory to practice. arXiv 2014, arXiv:1407.7502. [Google Scholar]
- Mestre, D.; Fonseca, J.M.; Mora, A. Monitoring of in-vitro plant cultures using digital image processing and random forests. In Proceedings of the 8th International Conference of Pattern Recognition Systems (ICPRS 2017), Madrid, Spain, 11–13 July 2017. [Google Scholar]
- Torlay, L.; Perrone-Bertolotti, M.; Thomas, E.; Baciu, M. Machine learning–XGBoost analysis of language networks to classify patients with epilepsy. Brain Inform. 2017, 4, 159–169. [Google Scholar] [CrossRef]
- Schäfer, P. The BOSS is concerned with time series classification in the presence of noise. Data Min. Knowl. Discov. 2015, 29, 1505–1530. [Google Scholar] [CrossRef]
- Susto, G.A.; Beghi, A.; McLoone, S. Anomaly detection through on-line isolation Forest: An application to plasma etching. In Proceedings of the 2017 28th Annual SEMI Advanced Semiconductor Manufacturing Conference (ASMC), Saratoga Springs, NY, USA, 15–18 May 2017; pp. 89–94. [Google Scholar]
- Zhao, Y.; Nasrullah, Z.; Li, Z. Pyod: A python toolbox for scalable outlier detection. arXiv 2019, arXiv:1901.01588. [Google Scholar]
- Fernández-Delgado, M.; Cernadas, E.; Barro, S.; Amorim, D. Do We Need Hundreds of Classifiers to Solve Real World Classification Problems? J. Mach. Learn. Res. 2014, 15, 3133–3181. [Google Scholar]
- Cheng, Z.; Yang, Y.; Jiang, S.; Hu, W.; Ying, Z.; Chai, Z.; Wang, C. Time2Graph+: Bridging Time Series and Graph Representation Learning via Multiple Attentions. IEEE Trans. Knowl. Data Eng. 2021, 11, 1041–4347. [Google Scholar] [CrossRef]
- Abokifa, A.A.; Haddad, K.; Lo, C.; Biswas, P. Real-time identification of cyber-physical attacks on water distribution systems via machine learning–based anomaly detection techniques. J. Water Resour. Plan. Manag. 2019, 145, 04018089. [Google Scholar] [CrossRef]
- Housh, M.; Ohar, Z. Integrating physically based simulators with event detection systems: Multi-site detection approach. Water Res. 2017, 110, 180–191. [Google Scholar] [CrossRef] [PubMed]
Publisher’s Note: MDPI stays neutral with regard to jurisdictional claims in published maps and institutional affiliations. |
© 2022 by the authors. Licensee MDPI, Basel, Switzerland. This article is an open access article distributed under the terms and conditions of the Creative Commons Attribution (CC BY) license (https://creativecommons.org/licenses/by/4.0/).