Abstract
The development of many intelligent technologies, such as artificial intelligence and the Internet of Things, has brought new opportunities for water industry intelligence. Based on intelligent pressure regulation technology, this paper built an intelligent management platform, designed an intelligent pressure-regulating device, and combined both to form an intelligent pressure-regulating vehicle (IPRV). The IPRV has the functions of developing a pressure-regulating scheme, equipment selection, pressure reduction potential analysis, etc. It can bring convenience to the field test of the water supply network. In the field test, an intelligent pressure-regulating device was used to obtain the network data in the pilot site called S-cell. After utilizing the intelligent management platform to analyze the measured data, the water usage pattern and pressure reduction potential of the S-cell were obtained, and an optimal pressure-regulating strategy was formulated. The water pressure at the critical node always met the water demand at the critical node during the field test. In addition, no complaints were received from other users. The results show that the IPRV is not only convenient for utility managers to make decisions on building pressure-reducing stations, but also meets user needs, realizing a win–win situation for both users and companies.
1. Introduction
The urban water supply network is the “life network” of a city, which delivers drinking water to the homes of the residents living in the city every hour of every day. In order to maintain the normal operation of the water supply network, adequate water and energy sources are necessary. However, network leaks are increasing water and energy consumption, posing a potential threat to the city’s “life network”. Therefore, water supply network leakage control has increasingly attracted the attention of water companies [1]. Compared to methods such as leak detection and repair and pipeline rehabilitation, pressure management is a cost-effective water leakage control measure and is almost the only cost-effective control background leakage method [2,3,4].
The construction of pressure-reducing stations is a common measure to achieve pressure management for district metered areas (DMAs) or zones [5]. The following are four primary pressure management methods that employ a pressure-reducing valve (PRV) and have been widely accepted by researchers; namely: fixed outlet, time modulated, flow modulated and critical pressure control [6]. In order to build suitable pressure-reducing stations, there are many studies dedicated to making decisions on siting pressure-reducing stations, selecting PRVs, and developing pressure-regulating strategies. Mathematical modeling is a common approach to building suitable pressure-reducing stations [7,8]. However, the methodologies presented were not tested under uncertainties in the networks. Due to the uncertainties in DMAs or zones, the pressure-reducing stations built accordingly may not meet the actual needs of pressure management well, resulting in financial waste [9]. Thus building temporary pressure-reducing stations for field experiments to detect where and how to build the optimal pressure-reducing station becomes a better choice [10,11]. However, each field experiment necessitates the creation of a new temporary pressure-reducing station, which not only wastes funds but also causes water outages during the experiment, potentially causing customer dissatisfaction. In addition, it is very cumbersome to repeat the design and build temporary pressure reduction stations for experiments at different locations. During the field experiment, intelligent pressure-regulating technology was born as a result of the widespread popularity of artificial intelligence [12] and supervisory control and data acquisition (SCADA) [13]. It can gather network operating data in real-time and realize pressure management without influencing customer water consumption. In the long run, computers will make the majority of operational choices for water companies.
This paper addresses problems in pressure-reducing management for water industries, which are: 1. difficult decisions on pressure-reducing station construction without completed information [9], and 2. high cost and operational difficulties of field experiments once the pressure-reducing station has been built [10,11]. This paper aims to build a device based on intelligent pressure regulation technology, SCADA, and Internet of Things (IoT) technology [14]. The contribution of this designed IPRV has provided an innovative way of data acquisition compared to a traditional pressure-reducing station, which is more flexible due to its ability to plug in and measure and achieve more accurate measurements due to the adoption of new value, reusable technologies, which leads to it being cost effective and sustainable. The IPRV enables the provision of continuous and completed data, and provides potential pressure-reducing strategies to facilitate decision making and save money on field experiments. To test the IPRV’s capabilities for pressure management, the S-cell of T Village in China was selected as the field test case to conduct the field experiments of pressure management.
The construction of the IPRV and the characteristics of some important components of the IPRV are described in Section 2, the experimental method for conducting the field experiments using the IPRV is presented in Section 3, and the results of the field experiments are analyzed and discussed in Section 4.
2. Construction of the IPRV
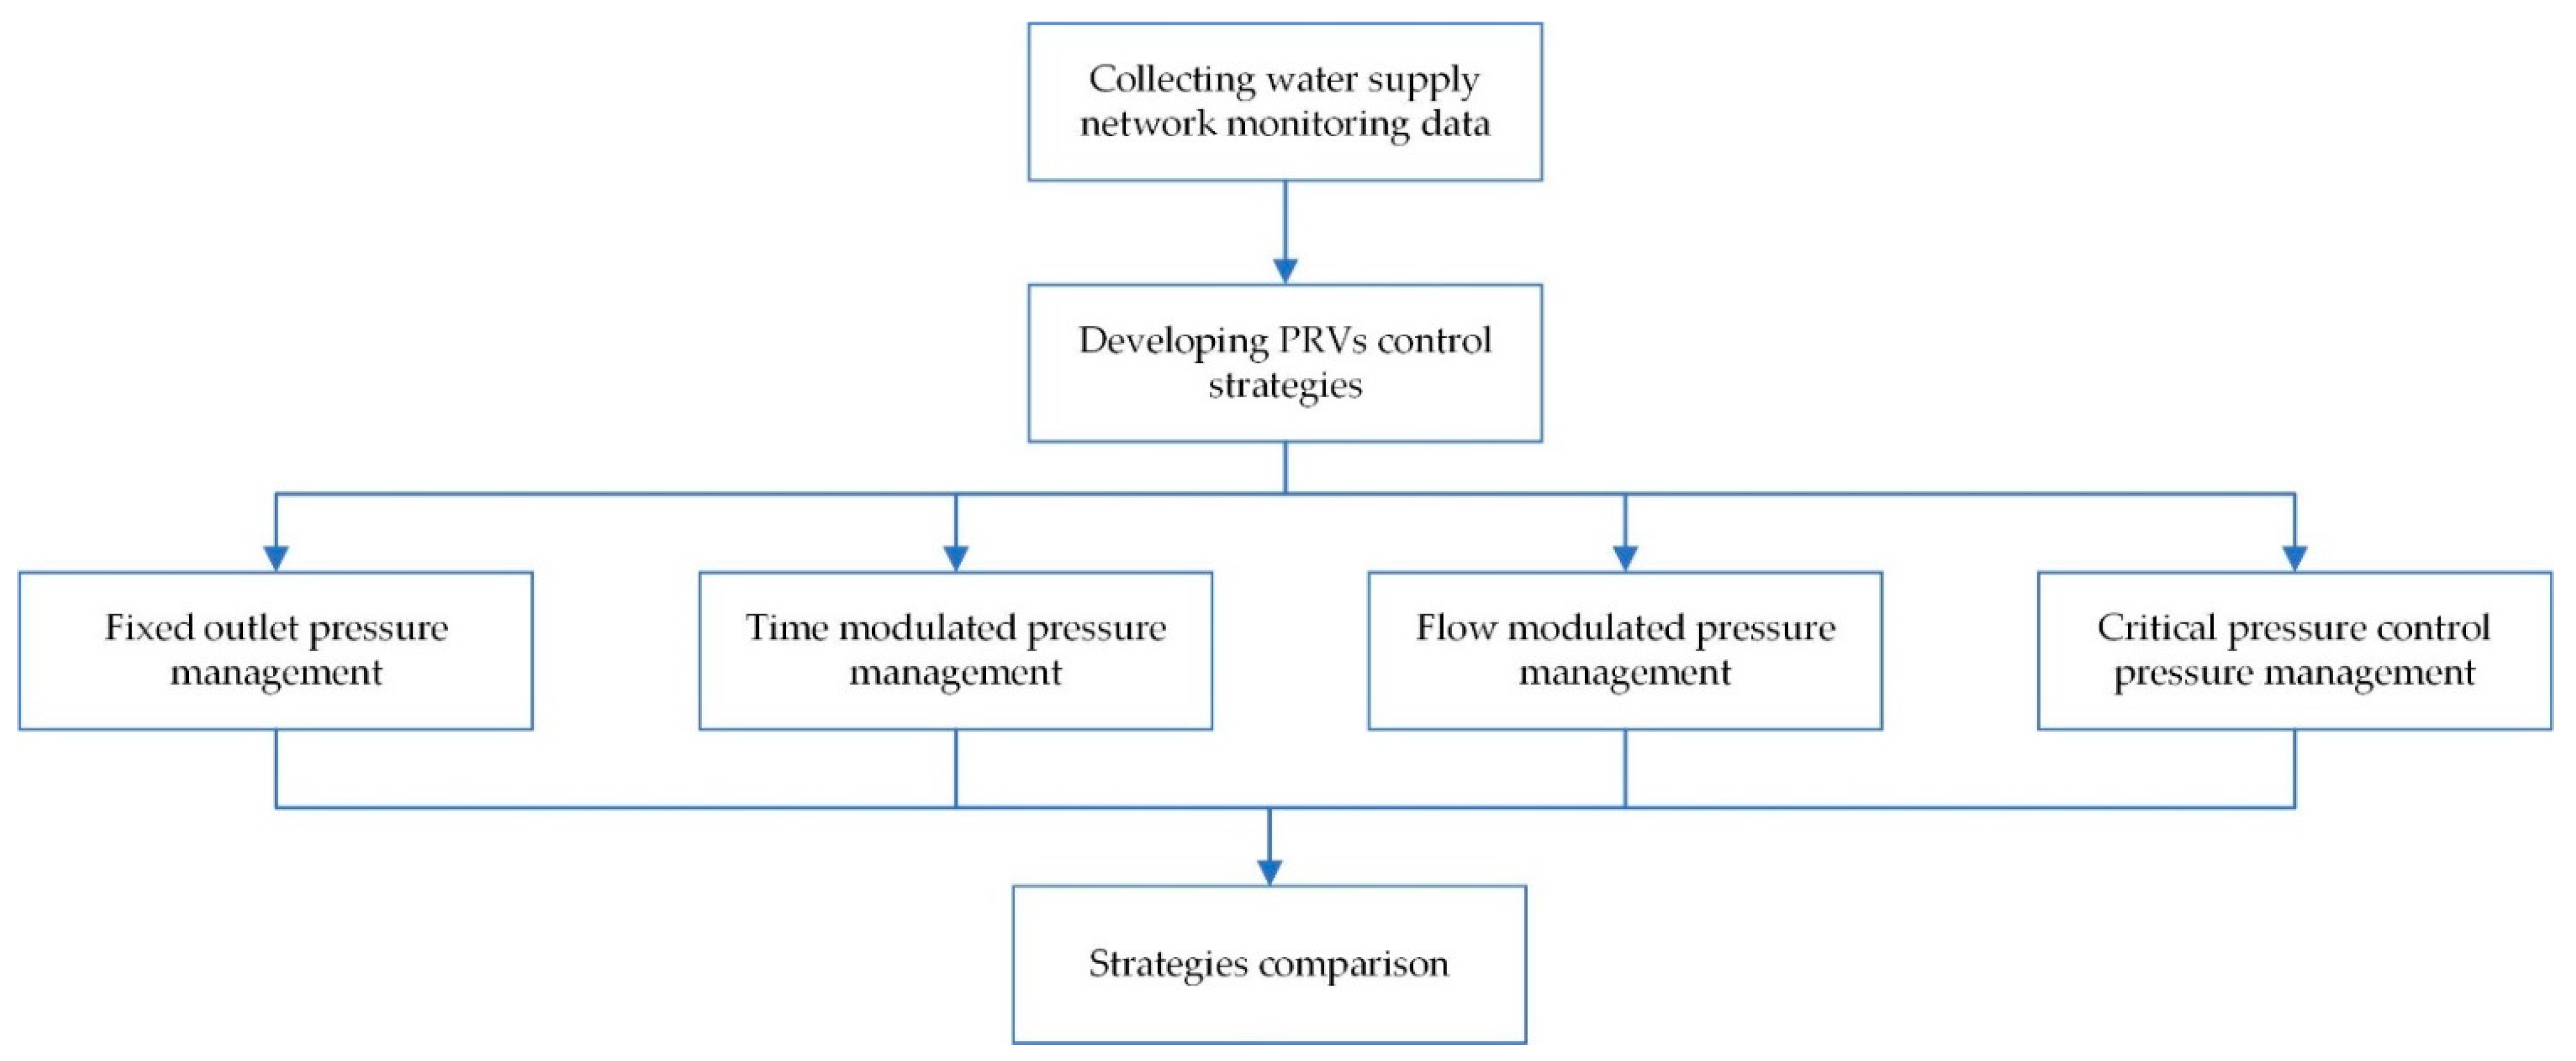
The intelligent pressure regulation technology flow chart is shown in Figure 1. The intelligent pressure regulation technology was divided into three stages: collecting water supply network monitoring data, developing PRVs control strategies, and comparing strategies. Based on the intelligent pressure regulation technology and the IoT technology, the IPRV was constructed.
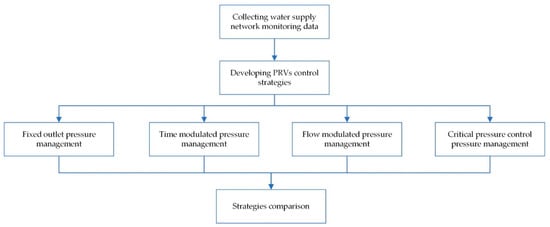
Figure 1.
Intelligent pressure regulation technology.
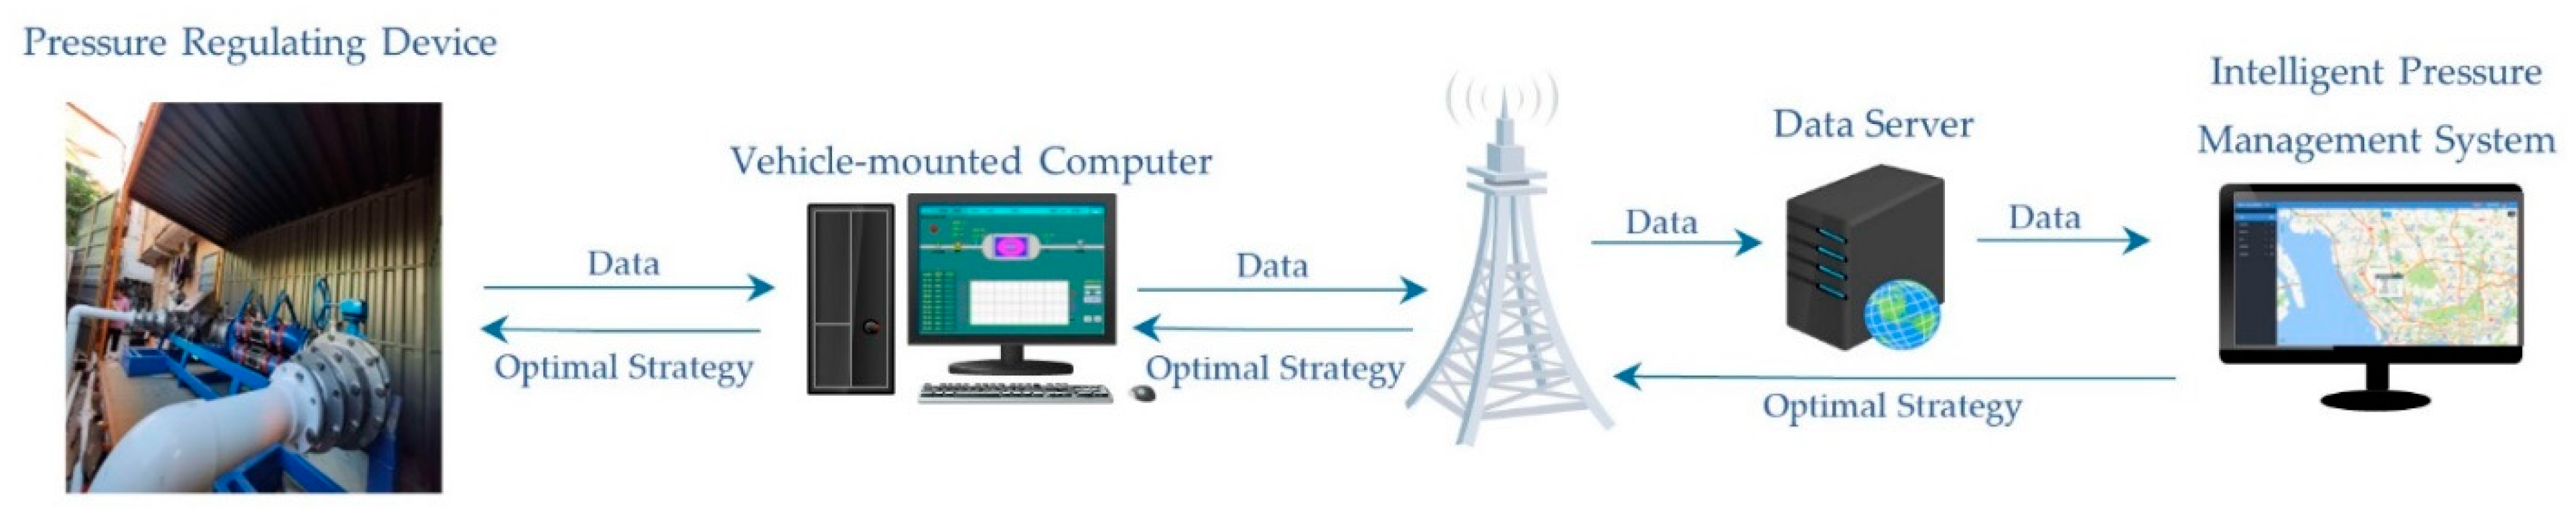
The IPRV consists of a pressure-regulating device, vehicle-mounted computer, data server, and intelligent pressure management system. If manual adjustment is used, the frequent adjustment of PRVs is not only time-consuming and labor-intensive, increasing labor costs, but may also cause pressure fluctuations in the pipe network due to improper operation of workers, resulting in water hammer. Therefore, we designed an integrated control box to realize the automatic adjustment of PRVs in time. By inputting the pressure setting value after the valve through the vehicle-mounted computer, the integrated control box can complete the automatic pressure regulation. The design scheme of the IPRV is shown in Figure 2.
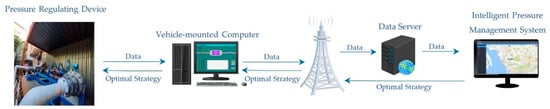
Figure 2.
Concept of the IPRV.
In Figure 2, the pressure-regulating device includes two important parts; namely: the integrated control box and the PRVs. The integrated control box supplies power to the pressure sensor, flow meter, and PRVs and collects the pressure signal, flow signal, and the PRVs opening signal at the same time. The controller in the integrated control box is used to adjust the PRVs, and the collected data are stored in the vehicle-mounted computer. The collected data are sent and synchronized to a cloud server. The intelligent pressure management system analyzes the historical data to obtain the optimal pressure-regulating strategy and then synchronizes the optimal strategy to the integrated control box via the vehicle-mounted computer. All parts of the pressure-regulating device are loaded in a truck and are then ready to be transported anywhere for pressure management experiments. The pressure-regulating device design scheme for the IPRV is shown in Figure 3; the sensing and control design scheme for the IPRV is shown in Appendix A.1; and the management system design scheme for the IPRV is shown in Appendix A.2.

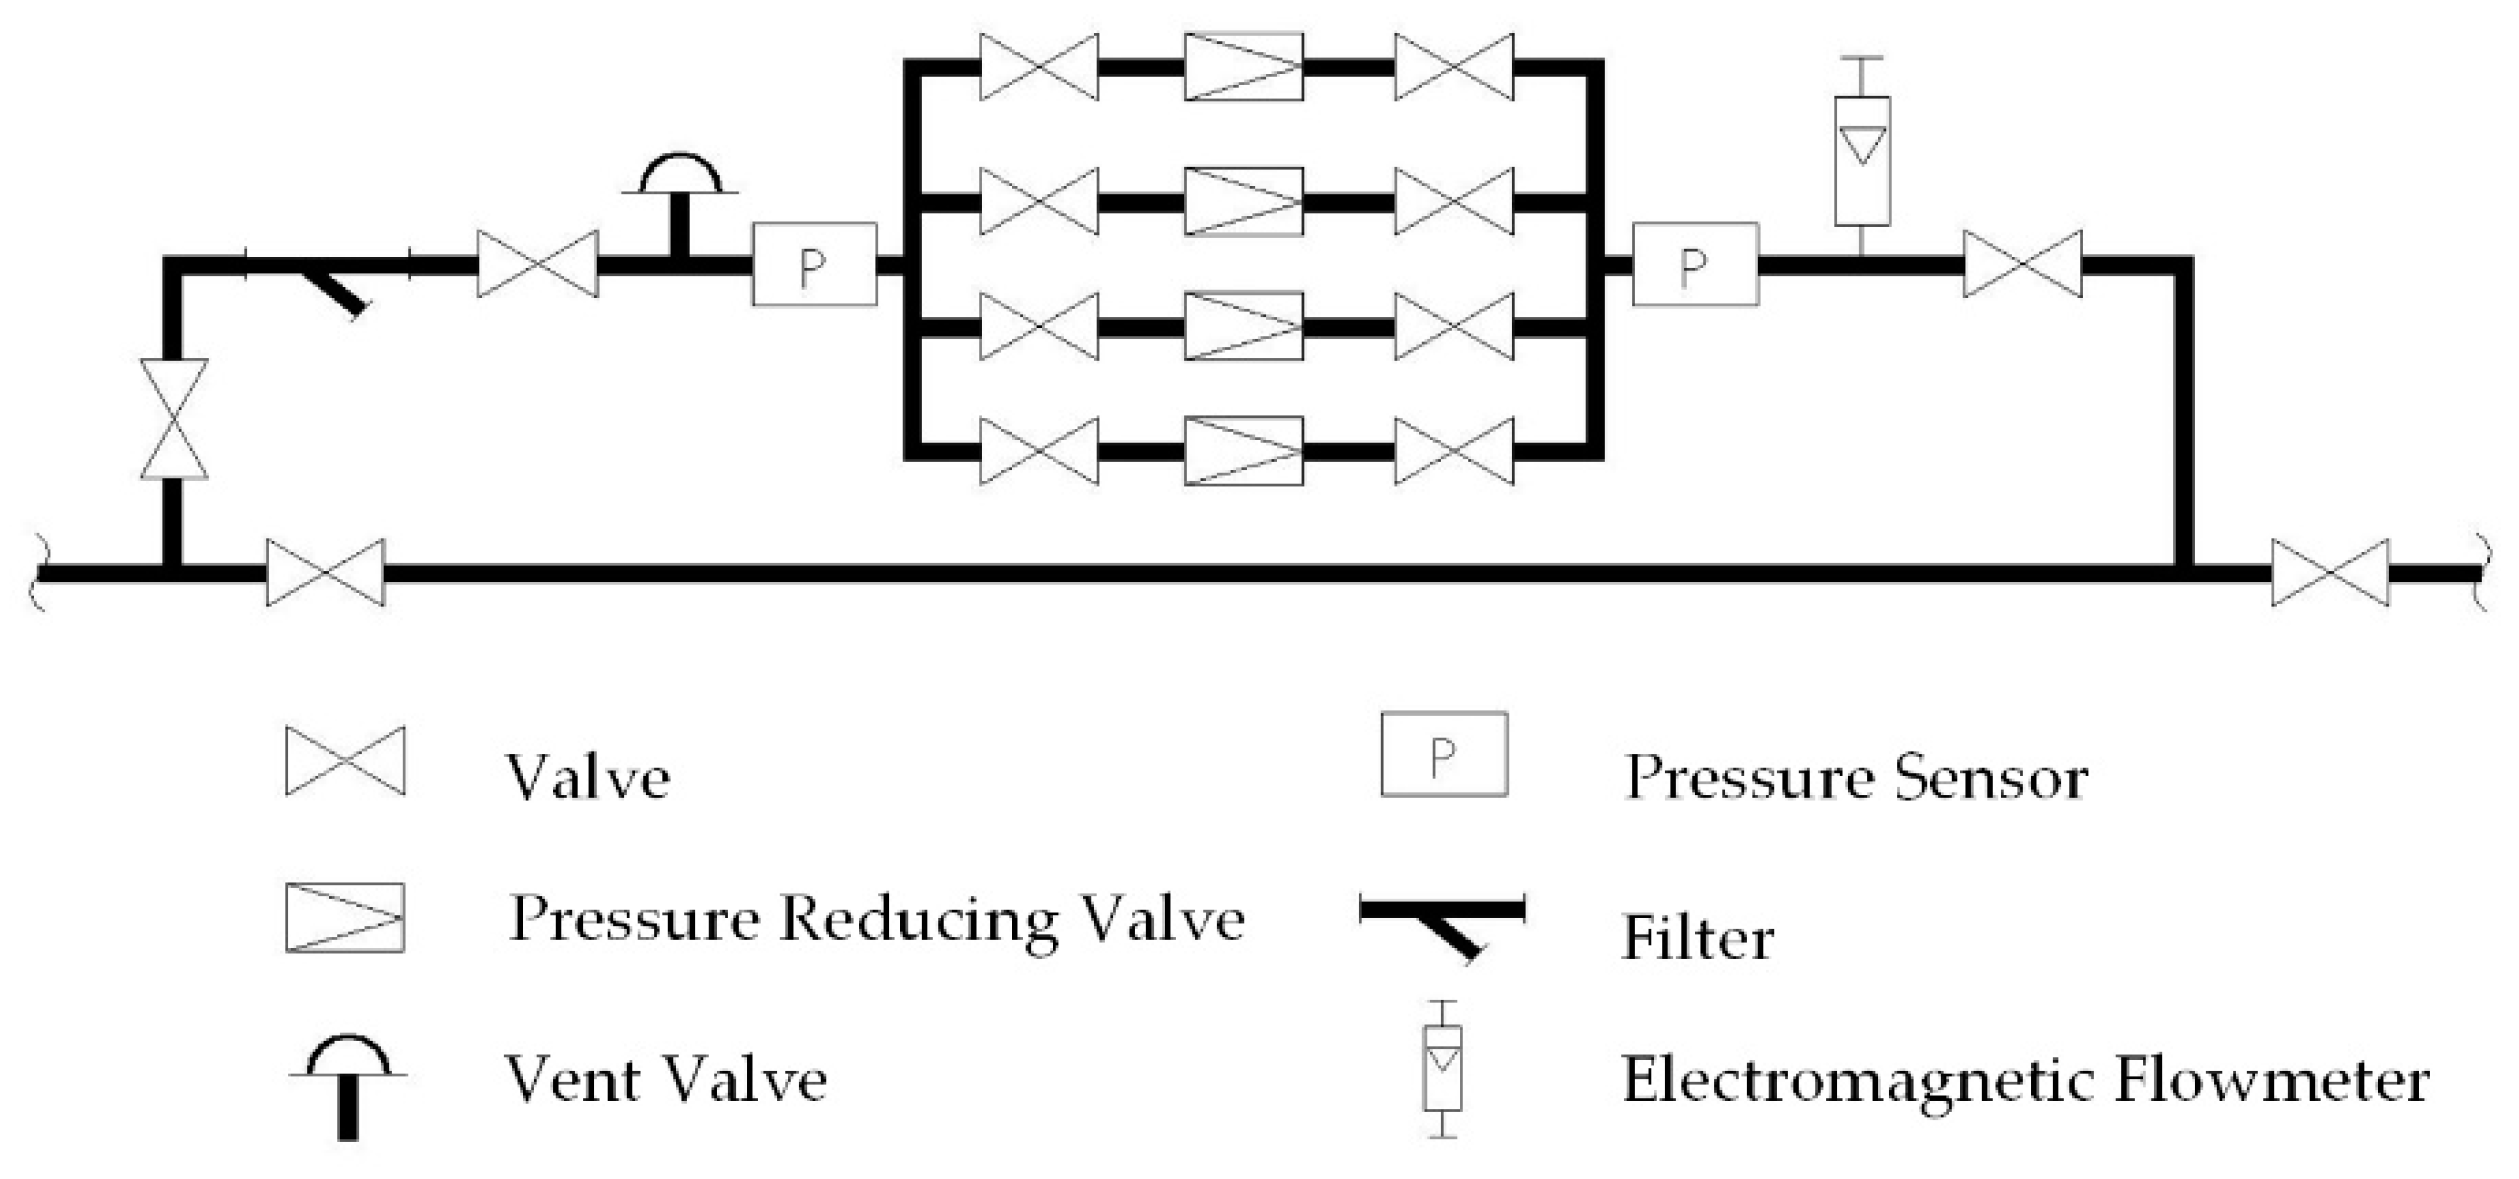
Figure 3.
Pressure-regulating device scheme.
As shown in Figure 3, the core components of the pressure-regulating device were four PRVs. Pressure regulation is achieved by four-piston PRVs, which have the following advantages: 1. A large range of pressure regulation and high regulating accuracy; four PRVs can be flexibly combined, the overall regulating range can cover almost all municipal water pressure requirements; 2. A sensitive piston: with a fast opening/closing function, which can protect the system from pressure fluctuation and water hammer and achieve accurate control of pressure, flow rate and level during pressure management; 3. A high-rated flow coefficient with low head loss at high flow rates, reducing operating costs and providing the ability to control pressure when inlet pressure falls below a preset value; and 4. Linear fluid for improved flow capacity, reduced water oscillation to reduce cavitation, and very little noise and water vibration at high flow rates. A manual butterfly valve and a flexible joint were set on each side of the PRVs. There was a pressure sensor at the inlet and outlet of the PRVs. An automatic vent valve was set in front of the pressure sensor at the inlet end, and an electromagnetic flowmeter was set after the pressure sensor at the outlet end. The integrated control box on the pressure-reducing device enables four types of pressure management methods.
All parts of the pressure-regulating device are integrated and do not need to be reinstalled after each pressure management experiment and the pressure-reducing device is designed to connect to a wide range of pipe diameters, from DN100 to DN600. According to the flow and diameter requirements of the testing network, the pressure-regulating device can be connected to the testing network by changing the size of the reducers.
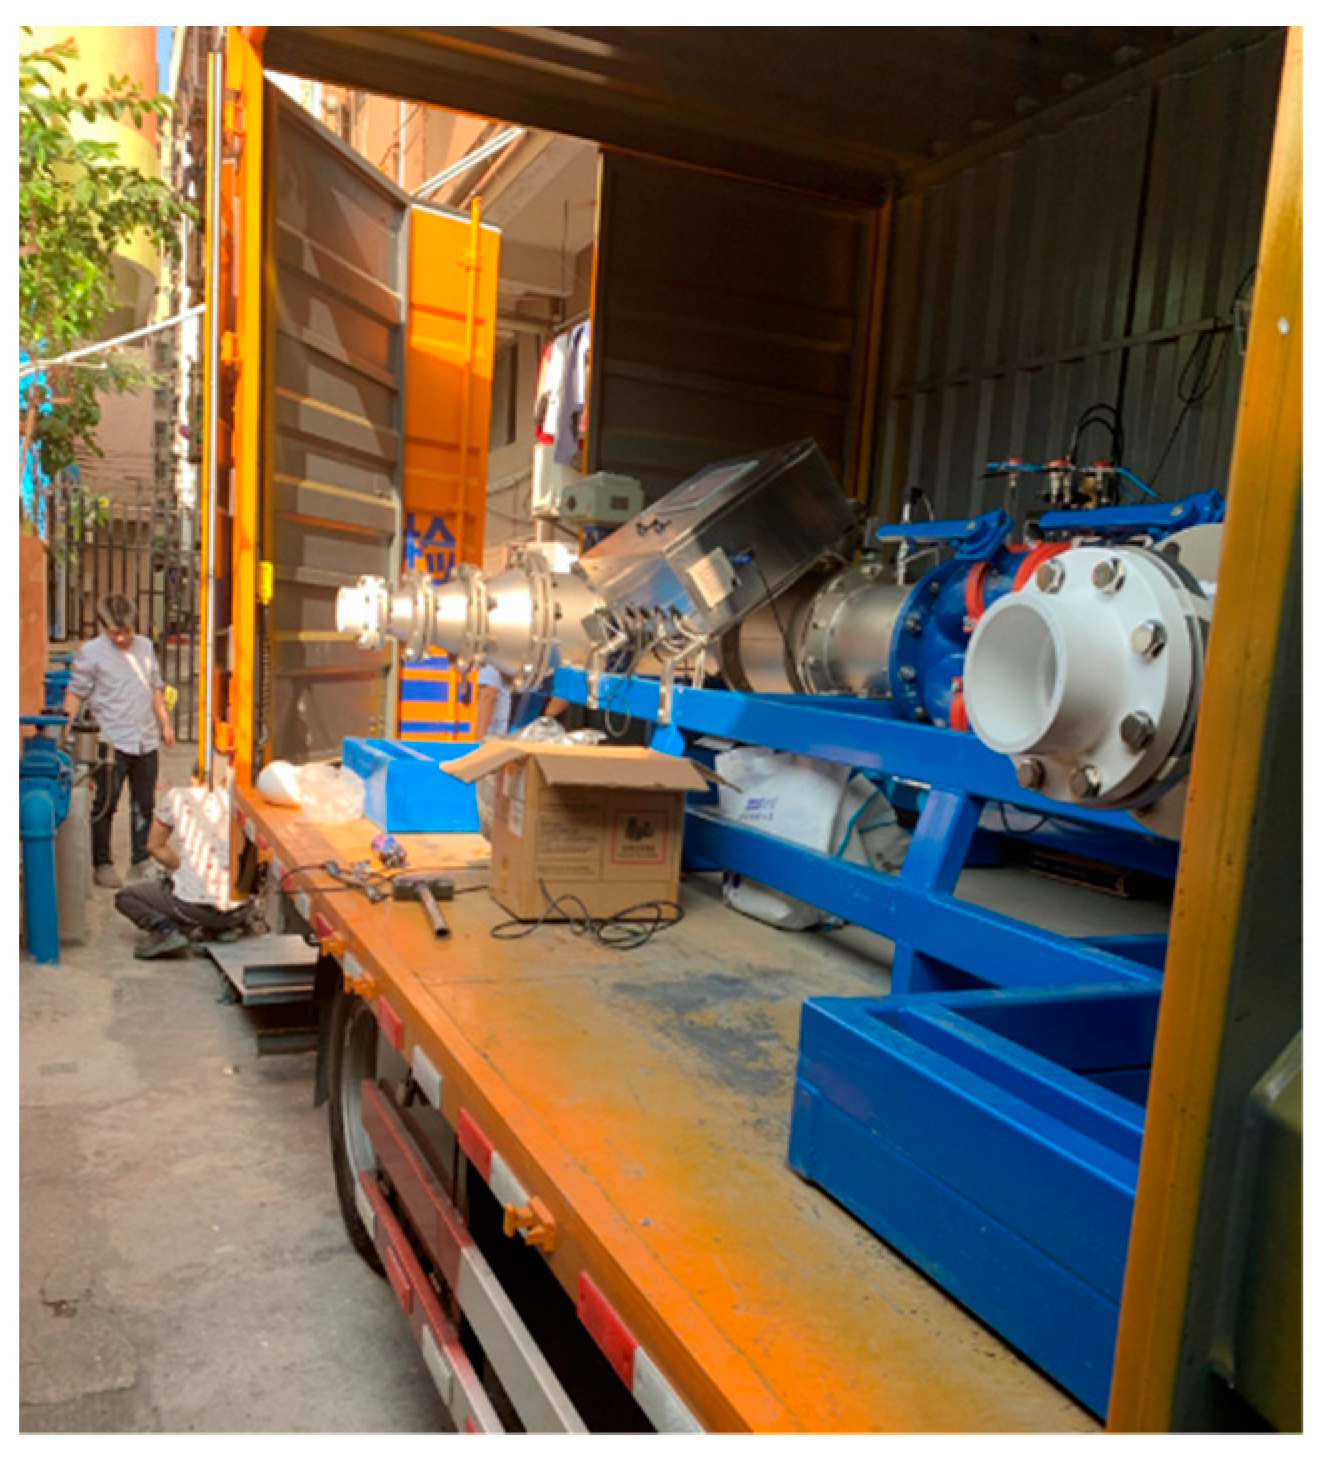
Figure 4 shows the physical diagram of the pressure-regulating device; Figure 5 shows the physical diagram of the IPRV.
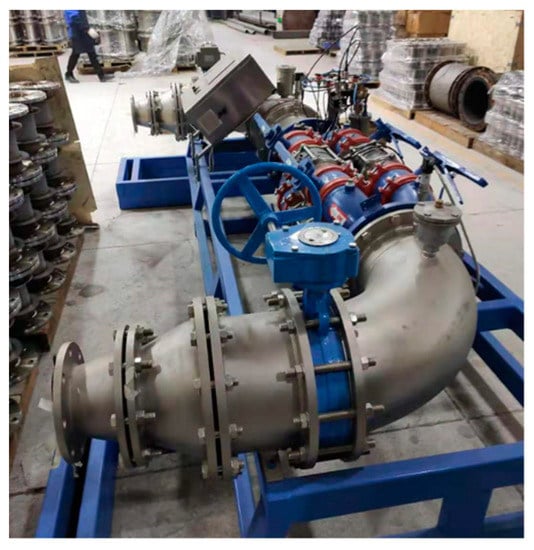
Figure 4.
The pressure-regulating device.
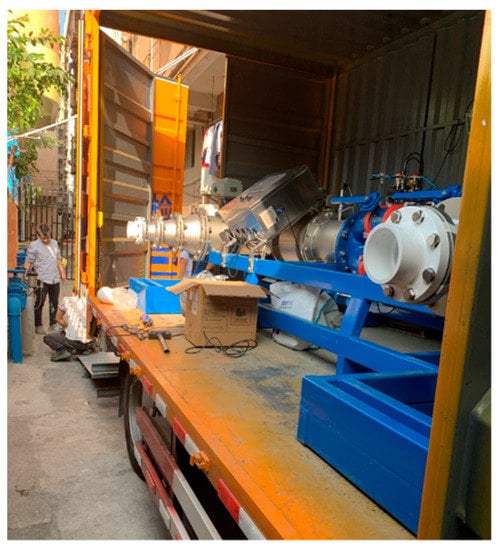
Figure 5.
The IPRV at the pilot site.
The design of replaceable reducers and multiple high-precision PRVs can be freely combined, so that the IPRV can meet the requirements of the pressure management of different experimental networks, greatly improving the scope of application of the IPRV. The design of the pressure-regulating device on the truck and the quick installation and dismantling make the IPRV extremely flexible and easy to use, and pressure management experiments are no longer limited by time and space.
The main design parameters for IPRV are shown in Appendix A.3.
3. Field Testing
The S-cell is located in a southeastern coastal city in China. The total service area of the S-cell is about 25,000 m3, the number of water supply service users is 210, and there is only one inlet in the S-cell. According to the recommended standard of DMAs in IWA [5], the S-cell can be treated as a typical DMA. The topology of the water supply network in the S-cell is clear. In addition, the types of users in the S-cell are mainly residents and restaurants, with a small number of stores, hospitals, and factories, which are normal representative. Therefore, the S-cell was selected as the field test case. The basic information of the S-cell is shown in Table 1.

Table 1.
Basic information of S-cell.
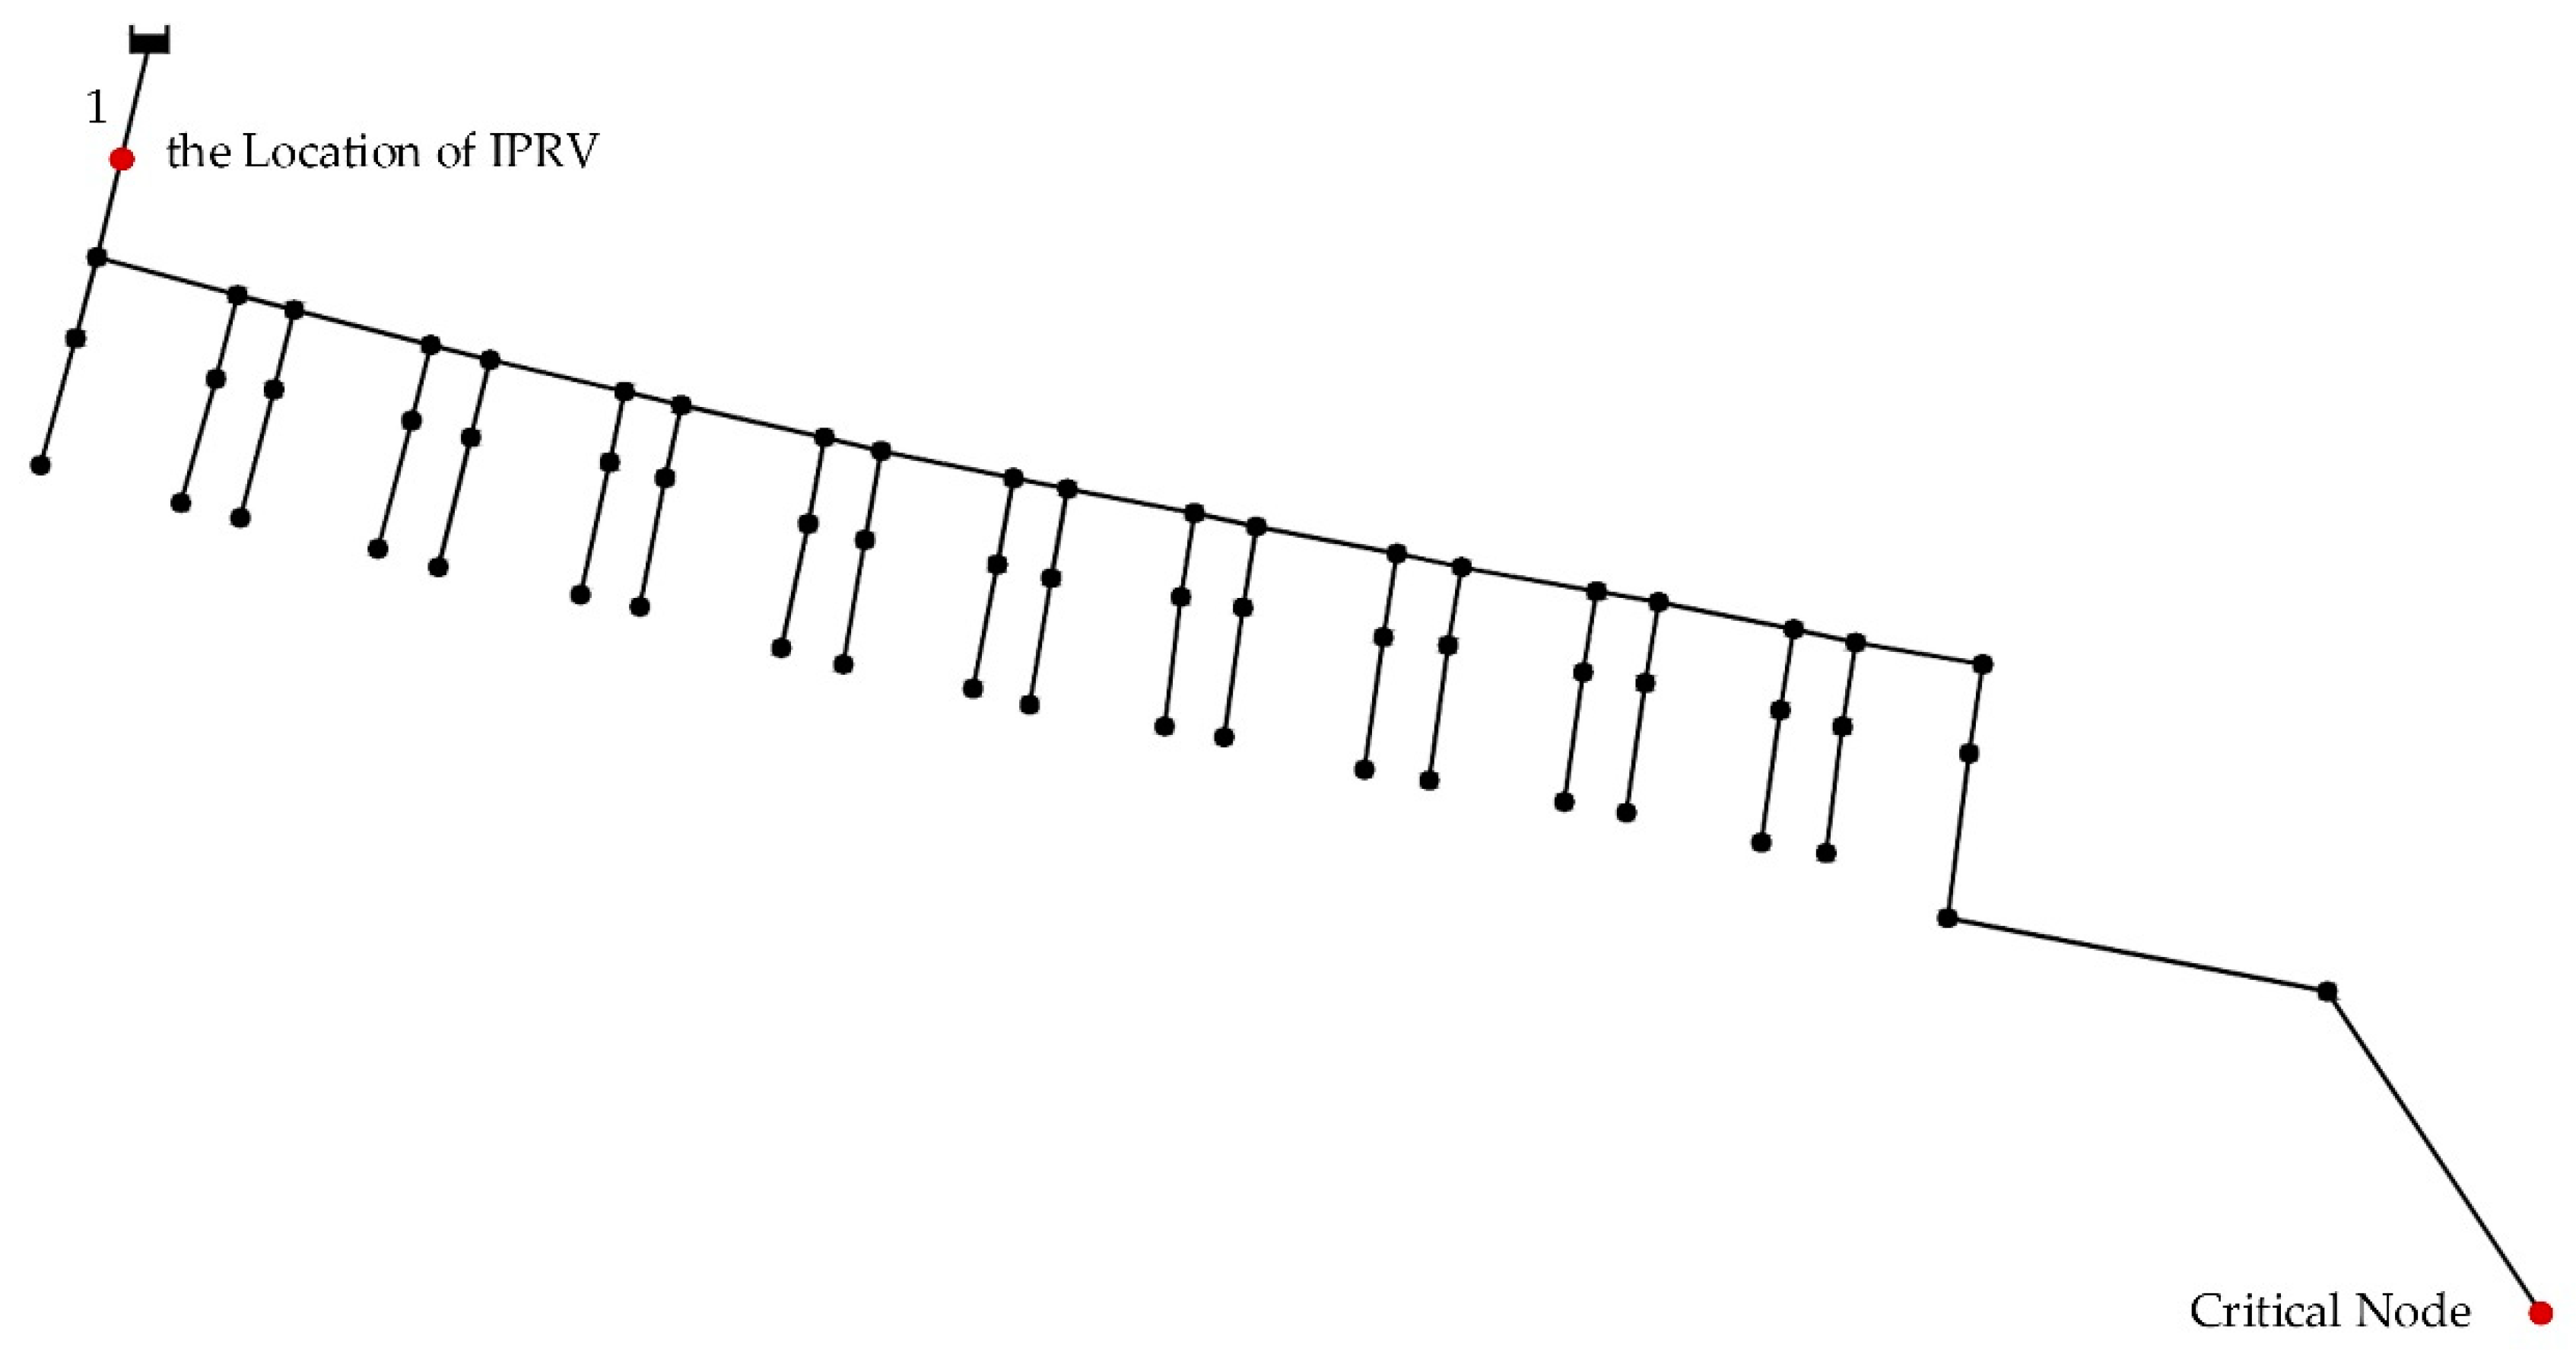
Based on the paper diagram provided by the water supply enterprise and the site survey, the information on the length and diameter of the main and branch pipes and the elevation of each node were determined. The S-cell network topology was constructed, as shown in Figure 6.
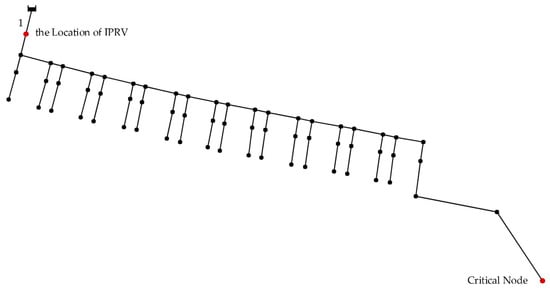
Figure 6.
S-cell network topology.
As shown in Figure 6, the S-cell has a single inlet namely the No. 1 pipeline. Taking into full consideration the location of the general meter at the entrance of the network in the S-cell and the surrounding environment, the IPRV was parked near the general meter at the entrance of the pipe network, on the No. 1 pipeline, as shown in Figure 6. The import and export of the pressure-regulating device were connected to the two tees at the front of the general meter through PVC pipes. The valves between the two tees were closed, so that the water from the network was supplied to the users after the pressure-regulating device. In order to ensure the safety of water for users, the pressure-regulating device was flushed repeatedly with water from the network before it was put into operation. During the actual measurement, a pressure gauge was installed at the critical node of the pipe network as shown in Figure 6, to observe the real-time fluctuation of the pressure during the regulating process.
Based on the hydraulic data obtained from the IPRV, the S-cell water usage pattern analysis, pressure-reducing potential analysis, and pressure-regulating strategy development were realized.
3.1. Water Usage Pattern
A one-week experiment was conducted from 1 January to 7 January, 2020, and measured data were collected at 5-min intervals. The collected data included: flow at the zone inlet point (Q), pressure at the PRVs inlet point (P1), pressure at the PRVs outlet point (P2), and pressure at the critical node (P3). Each group of data is identified by the time t at which the data were taken, the measured data were organized into tables by the management system (see [15]). The water usage pattern of the S-cell users can be judged from the measured data of Q.
3.2. Pressure-Reducing Potential
Since the ultimate goal of pressure management is to reduce network leakage, studies often determine whether a DMA or a zone is necessary for pressure management based on the leakage rate. The minimum night flow method (MNF method) is often used as an important method for network leakage analysis, involving the determination of the minimum night flow and the determination of the legal water consumption of the customer at night, which can yield the night leakage of a DMA or a zone [12]. Cheung [13] through a study of Brazilian water consumption data, concluded that the MNF occurs between 1:00 a.m. and 4:00 a.m. It shows that the MNF method does not work for daily leakage analysis, resulting in a one-sided analysis that does not effectively show the true leakage level of the DMA or the zone. This will make it impossible for utility managers to accurately determine whether the DMA or the zone needs pressure management.
For a more accurate assessment of the pressure-reducing potential in a DMA or a zone, this study installs a pressure gauge at the critical node, monitoring the pressure value at the critical node in real-time through the IPRV, then, to meet the minimum pressure required at each moment of the critical node, through hydraulic calculations to obtain the pressure-reducing potential of each moment at the inlet of the network. Unlike the MNF method, which can only be used at night, the IPRV allows for a 24-h continuous assessment of the pressure-reducing potential.
3.3. Optimal Pressure-Regulating Strategy
Through utilizing the IPRV, the pressure data at the critical node and the pressure at the inlet of the DMA can be obtained for 24 h continuously. We use the pressure data at the critical node and the pressure at the inlet of the DMA for hydraulic calculations to obtain the optimal pressure setting after the PRVs at each time and for rigor comparison and analysis based on the advantages and disadvantages of each of the four pressure management methods for the condition of the water distribution system, the optimal pressure-regulating strategy is designed.
The P2 setting value (P2-set) for each time period requires the following conditions to be met:
P2-set ≥ H
In Equation (1), H is the minimum demand pressure at the S-cell inlet point. Because of the high adjustment accuracy (±0.01 MPa) of the PRVs loaded on the IPRV (Appendix A.2), fine pressure adjustment can be achieved. The IPRV monitors and records real-time pressure at the critical node after each adjustment of the PRV and compares it until the optimal P2-set satisfying Equation (1) is obtained.
4. Results and Discussion
4.1. Water Usage Pattern
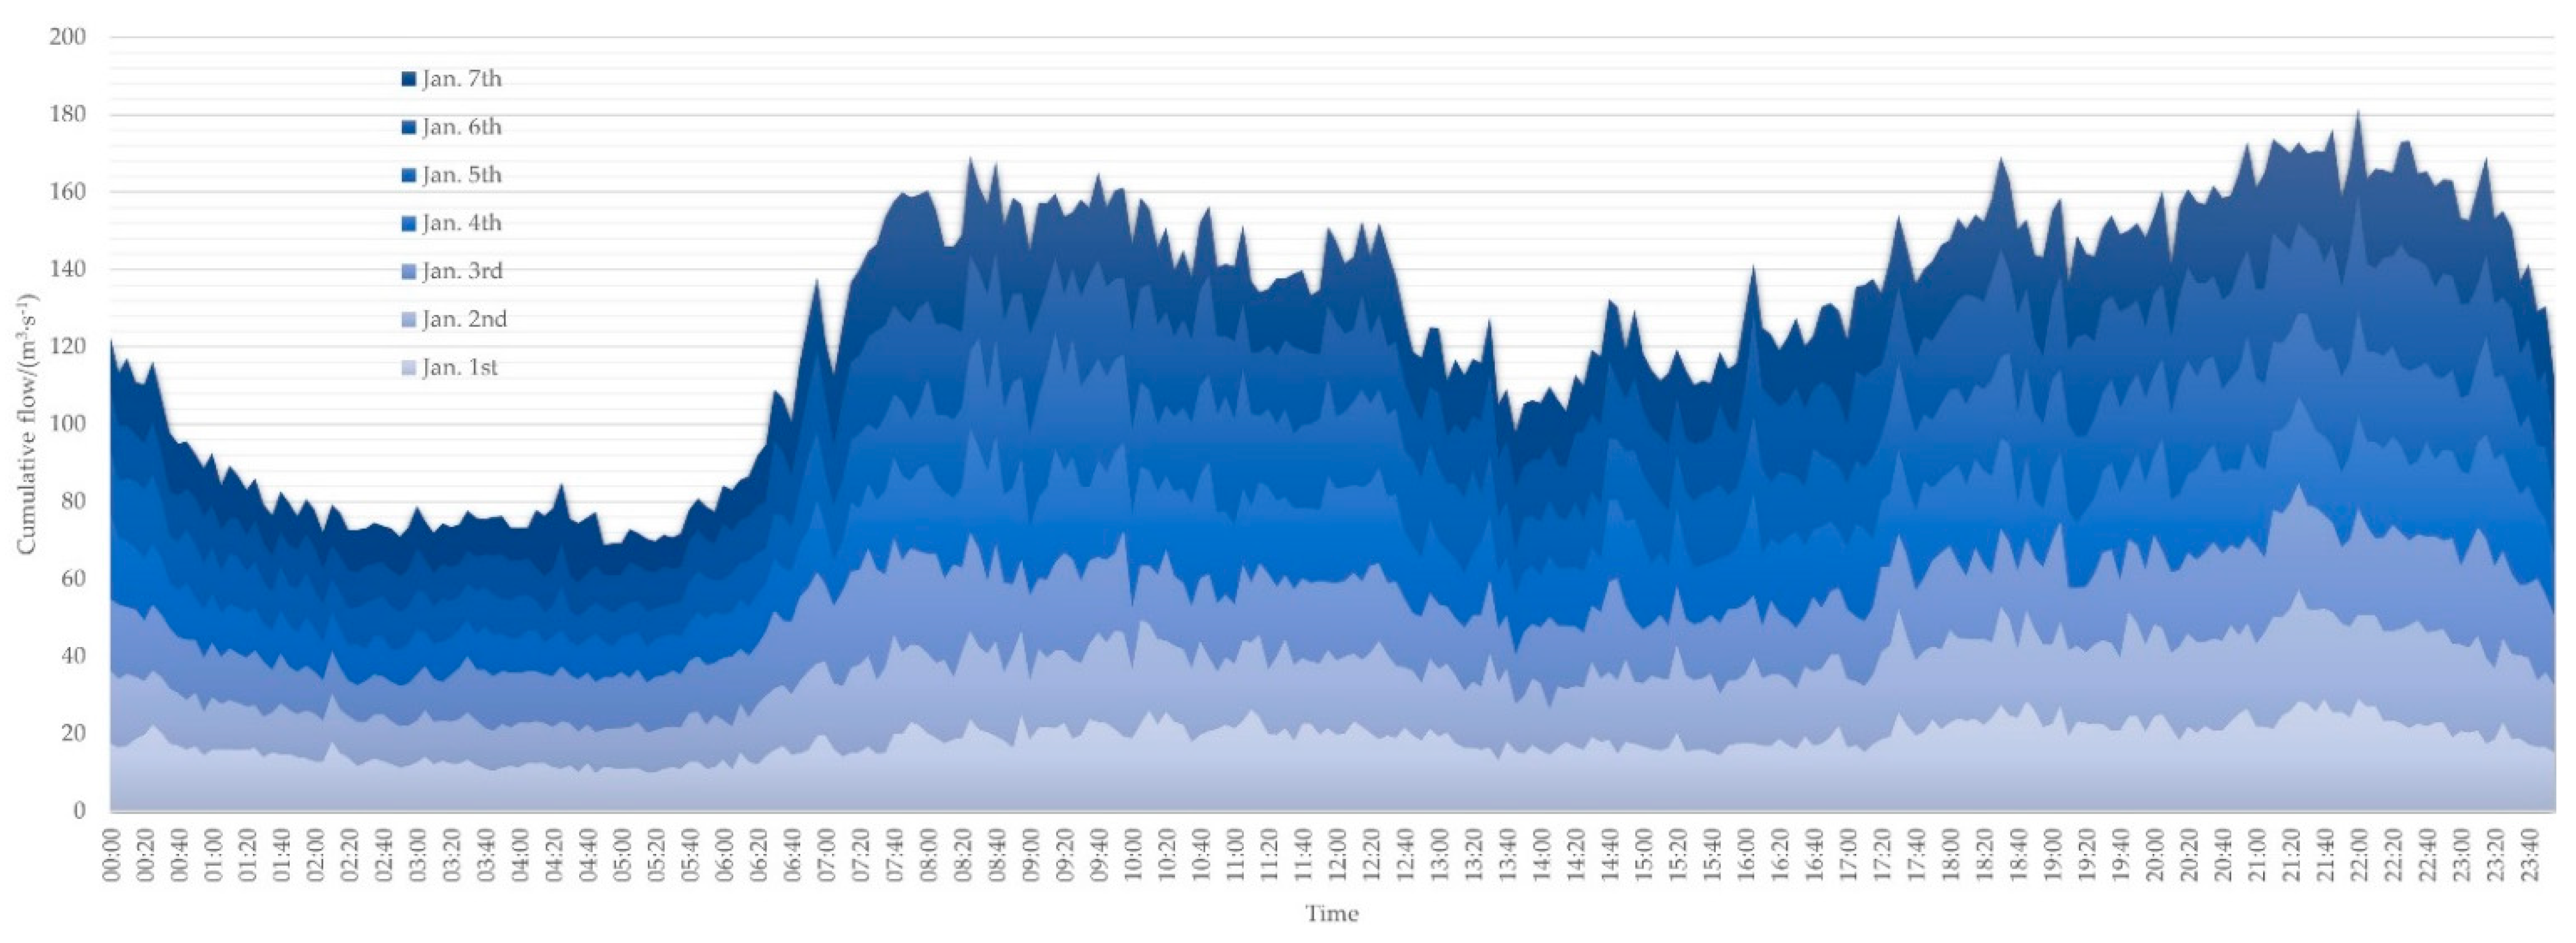
The flow versus time (Q-t) stacking area map for each day of the week was plotted from the measured Q data, as shown in Figure 7.

Figure 7.
Q-t stacking area map.
Figure 7 shows that there were two peaks and two troughs in the water consumption curve of the S-cell. To further analyze the water usage pattern, the whole day was divided into four water consumption periods based on the accumulated water consumption at each time of the day during the week: from 0:00 to 5:00; from 5:00 to 14:00; from 14:00 to 18:00; and from 18:00 to 24:00.
The proportion of water consumption in each period from 1 to 7 January is shown in Table 2.
Table 2.
Proportion of water consumption in four periods.
From Table 2, the variance of the proportion of the same water consumption period on different dates was below 0.0002. The division of water consumption periods was reasonable and consistent with the actual change pattern of water consumption, which could be used for subsequent analysis.
4.2. Pressure-Reducing Potential
In calculating the minimum demand pressure at the inlet of the S-cell (H), the following equation was used:
H = H1 + H2 + H3 + H4 + H5
In Equation (2), H1 is the elevation difference between the critical node and the inlet point. Based on the pipe network topology information, H1 = 1.2 m. H2 is the maximum head loss from the inlet point to the critical node. According to the [15], the maximum value of the difference between P1 and P3 at each moment was 8.02 m. According to the following equation:
Max (P1 − P3) = H1 + H2,
It can be calculated that H2 = 9.22 m. H3 is the setting height of the water appliance in the most unfavorable condition. The water appliance in the most unfavorable condition was a wash basin and was set on the fifth floor at the critical node. The height of the floor was 3 m, and the height of the wash basin from the floor was 1.2 m; hence, H3 = 13.2 m. H4 is the minimum working pressure of the water appliance in the most unfavorable condition. The minimum working pressure of the wash basin was 10 m; hence, H4 = 10 m. H5 is the head loss from the critical node to the water appliance in the most unfavorable condition, according to experience taken as 2 m.
Therefore, H = −1.2 + 9.22 + 13.2 + 10 + 2 = 33.22 m.
The minimum pressure-reducing potential was calculated from the following equation:
Hp = P1-min − H
In Equation (4), Hp is the minimum pressure-reducing potential. P1-min is the lowest value of P1 in the [15]. Removing the abnormal value of P1 in the [15], P1-min was 0.4644 MPa. Therefore, Hp = 46.44 − 33.22 = 13.22 m.
The above process was only a conservative estimate of the pressure reduction potential for the S-cell. The water consumption was different in each time period, resulting in different maximum head losses. When designing the pressure regulation scheme, each time period could be analyzed, and the pressure reduction potential of the S-cell was greater. Therefore, the S-cell had a large pressure reduction potential.
4.3. Optimal Pressure-Regulating Strategy
The IPRV developed the optimal strategies for each time period based on the water usage pattern. The strategies for each time period were as follows.
- 0:00–5:00.
The optimal strategy for this period was fixed outlet pressure management. Because the pressure at the S-cell inlet point was stable during this period, it is more economical and effective to use the fixed outlet pressure management. To ensure normal water usage, the P2 setting value (P2-set) must meet the water pressure requirements of customers. The P2-set calculation formula is as follows:
P2-set = H
To obtain H, it is necessary to first calculate H2. The results of H2 calculations during 0:00–5:00 are shown in Table 3.
Table 3.
H2 (m) during 0:00–5:00.
We took the maximum value (2.58 m) of H2 to calculate P2-set, hence P2-set = 0.2658 MPa. Since the sensitivity of the IPRV was 0.01 MPa, the value of P2-set was changed to 0.27 MPa.
- 5:00–14:00.
The optimal strategy for this period was critical pressure control pressure management. Because the pressure at the S-cell inlet point fluctuated greatly during this period, this method was more effective in minimizing the operating pressure of the network while meeting the pressure of the critical node. The results of H2 calculations during 5:00–14:00 are shown in Table 4.
Table 4.
H2 (m) during 5:00–14:00.
The results of P2-set are shown in Table 5, with a regulation period of 1 h.
Table 5.
P2-set (MPa) during 5:00–14:00.
- 14:00–18:00.
The optimal strategy for this period was fixed outlet pressure management. Because the pressure at the S-cell inlet point was stable during this period, it was more economical and effective to use the fixed outlet pressure management. The results of H2 calculations during 0:00–5:00 are shown in Table 6.
Table 6.
H2 (m) during 14:00–18:00.
We took the maximum value (8.86 m) of H2 to calculate P2-set, hence P2-set = 0.3286 MPa. Since the sensitivity of the IPRV is 0.01 MPa, the value of P2-set was changed to 0.33 MPa.
- 18:00–24:00.
The optimal strategy for this period was time-modulated pressure management. This was the result of a comprehensive consideration of the water usage pattern, water security, and operating costs. The results of H2 calculations during 18:00–24:00 are shown in Table 7.
Table 7.
H2 (m) during 18:00–24:00.
The results of P2-set are shown in Table 8, with a regulation period of 1 h.
Table 8.
P2-set (MPa) during 18:00–24:00.
The four time period strategies were aggregated to determine the S-cell pressure-regulating scheme, as shown in Table 9. During the strategy development process, the water pressure at the critical node was always above the demand water pressure, which could meet the water demand at the critical node. No complaints were received from other users during the experiment. This shows that the IPRV can develop the optimal pressure regulation strategy without affecting the users’ water consumption.
Table 9.
S-cell regulating scheme.
In the optimal pressure-regulating strategy shown in Table 9, P2-set for the S-cell was in the range of 0.27 to 0.34 MPa, and P2-set should be adjusted with 0.01MPa accuracy. In order to prevent sudden accidents in the network, resulting in the flow and pressure exceeding the workpiece interval of the PRV, the adjustable range of pressure after the valve should be slightly greater than 0.27~0.34 MPa (e.g., 0.20~0.40 MPa). During certain periods (i.e., from 5:00 to 14:00 and from 18:00 to 24:00), the PRV must be readjusted every hour to meet the requirements of the optimal pressure-regulating strategy.
5. Conclusions
To address the two problems, namely: 1. The difficult decisions on pressure-reducing station construction, and 2. The high cost and operational difficulties of field experiments, this study designed and developed an IPRV based on the intelligent pressure regulation technology and the SCADA. After field testing, we demonstrated that the IPRV has the following benefits:
- The IPRV is a portable and easy-to-utilize smart device for pressure-reducing management. It can perform any tests acutely and quickly after installation, and solves problem 1, which is caused by repeating the designing and building of temporary pressure-reducing stations for experiments at different locations. The intelligent pressure control platform is installed in a freight vehicle that can be transported anywhere and at any time, removing time and space limits from pressure regulation experiments, which is an innovative way for continuous data acquisition and performing pressure-reducing simulation and analysis to enable the generation of suitable pressure-reducing strategies to support decision making. The IPRV smart device consists of replaceable reducers and multiple high-precision PRVs, which can be freely combined, so that the IPRV can meet the requirements of pressure management of different experimental scenarios of networks, greatly improving the scope of application of the IPRV.
- The network parameters may change due to environmental uncertainties, resulting in the network hydraulic model simulation results deviating from the actual [9]. The IPRV can continuously provide companies with the analysis results of pressure reduction potential based on the real-time monitoring data, which helps utility managers to evaluate the necessity of regional pressure regulation thus addressing problem 1.
- Because of the high adjustment accuracy of the PRVs loaded on the IPRV, fine pressure adjustment can be achieved in the field experiment to obtain multiple pressure-reducing strategies and the optimal choice, which is extremely difficult and costly by using the traditional way, thus addressing problem 2. The IPRV will facilitate utility managers to make decisions timely and accurately on the construction of pressure-reducing stations for pressure-reducing management and greatly save the cost without blindly construction of pressure-regulating stations. Utilizing the IPRV for pressure management experiments can ensure the safety of users’ water demand at the same time as saving energy and cost through the pressure management for the water utilities achieving a win-win situation for both users and the company.
In addition, cloud computing, mobile terminal devices, and big data analytic technologies are being used in the IPRV to achieve the IoT during pressure management experiments.
Author Contributions
Conceptualization, J.G.; data curation, T.Z. and J.C., methodology, J.C.; validation, K.L.; formal analysis, K.L.; investigation, W.W.; resources, J.G.; writing—original draft preparation, J.C., T.Z. and K.L.; writing—review and editing, W.W. and K.L.; visualization, K.L.; supervision, J.G. and W.W.; project administeration, L.D., P.X., T.Z. and W.W.; funding acquisition, J.G. and W.W. All authors have read and agreed to the published version of the manuscript.
Funding
This research was funded by the State Key Laboratory of Urban Water Resource and Environment (Harbin Institute of Technology), grant number 2021TS15. This work was supported, in part, by The European Union’s Horizon 2020 research and innovation program under the Marie Skłodowska-Curie Training Networks (ITN)-IoT4Win grant agreement No [765921].
Institutional Review Board Statement
Not applicable.
Informed Consent Statement
Not applicable.
Data Availability Statement
The data presented in this study are openly available in (FigShare) at (10.6084/m9.figshare.17104244), reference number [15].
Acknowledgments
We thank State Key Laboratory of Urban Water Resource and Environment (Harbin Institute of Technology), grant number 2021TS15, and the European Union’s Horizon 2020 research and innovation program under the Marie Skłodowska-Curie Training Networks (ITN)-IoT4Win grant agreement No [765921] for the funding, and we also thank ShenZhen ANSO Measurement and Control Instruments CO., Ltd. for assistance with the experiments.
Conflicts of Interest
The authors declare no conflict of interest. The funders had no role in the design of the study; in the collection, analyses, or interpretation of data; in the writing of the manuscript; or in the decision to publish the results.
Appendix A
Appendix A.1. Sensing and Control Design Scheme
The sensing and control design scheme is shown in Figure A1.
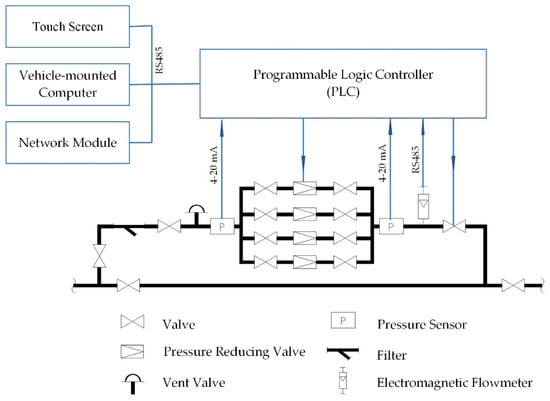
Figure A1.
Sensing and control design scheme of the IPRV.
Figure A1.
Sensing and control design scheme of the IPRV.
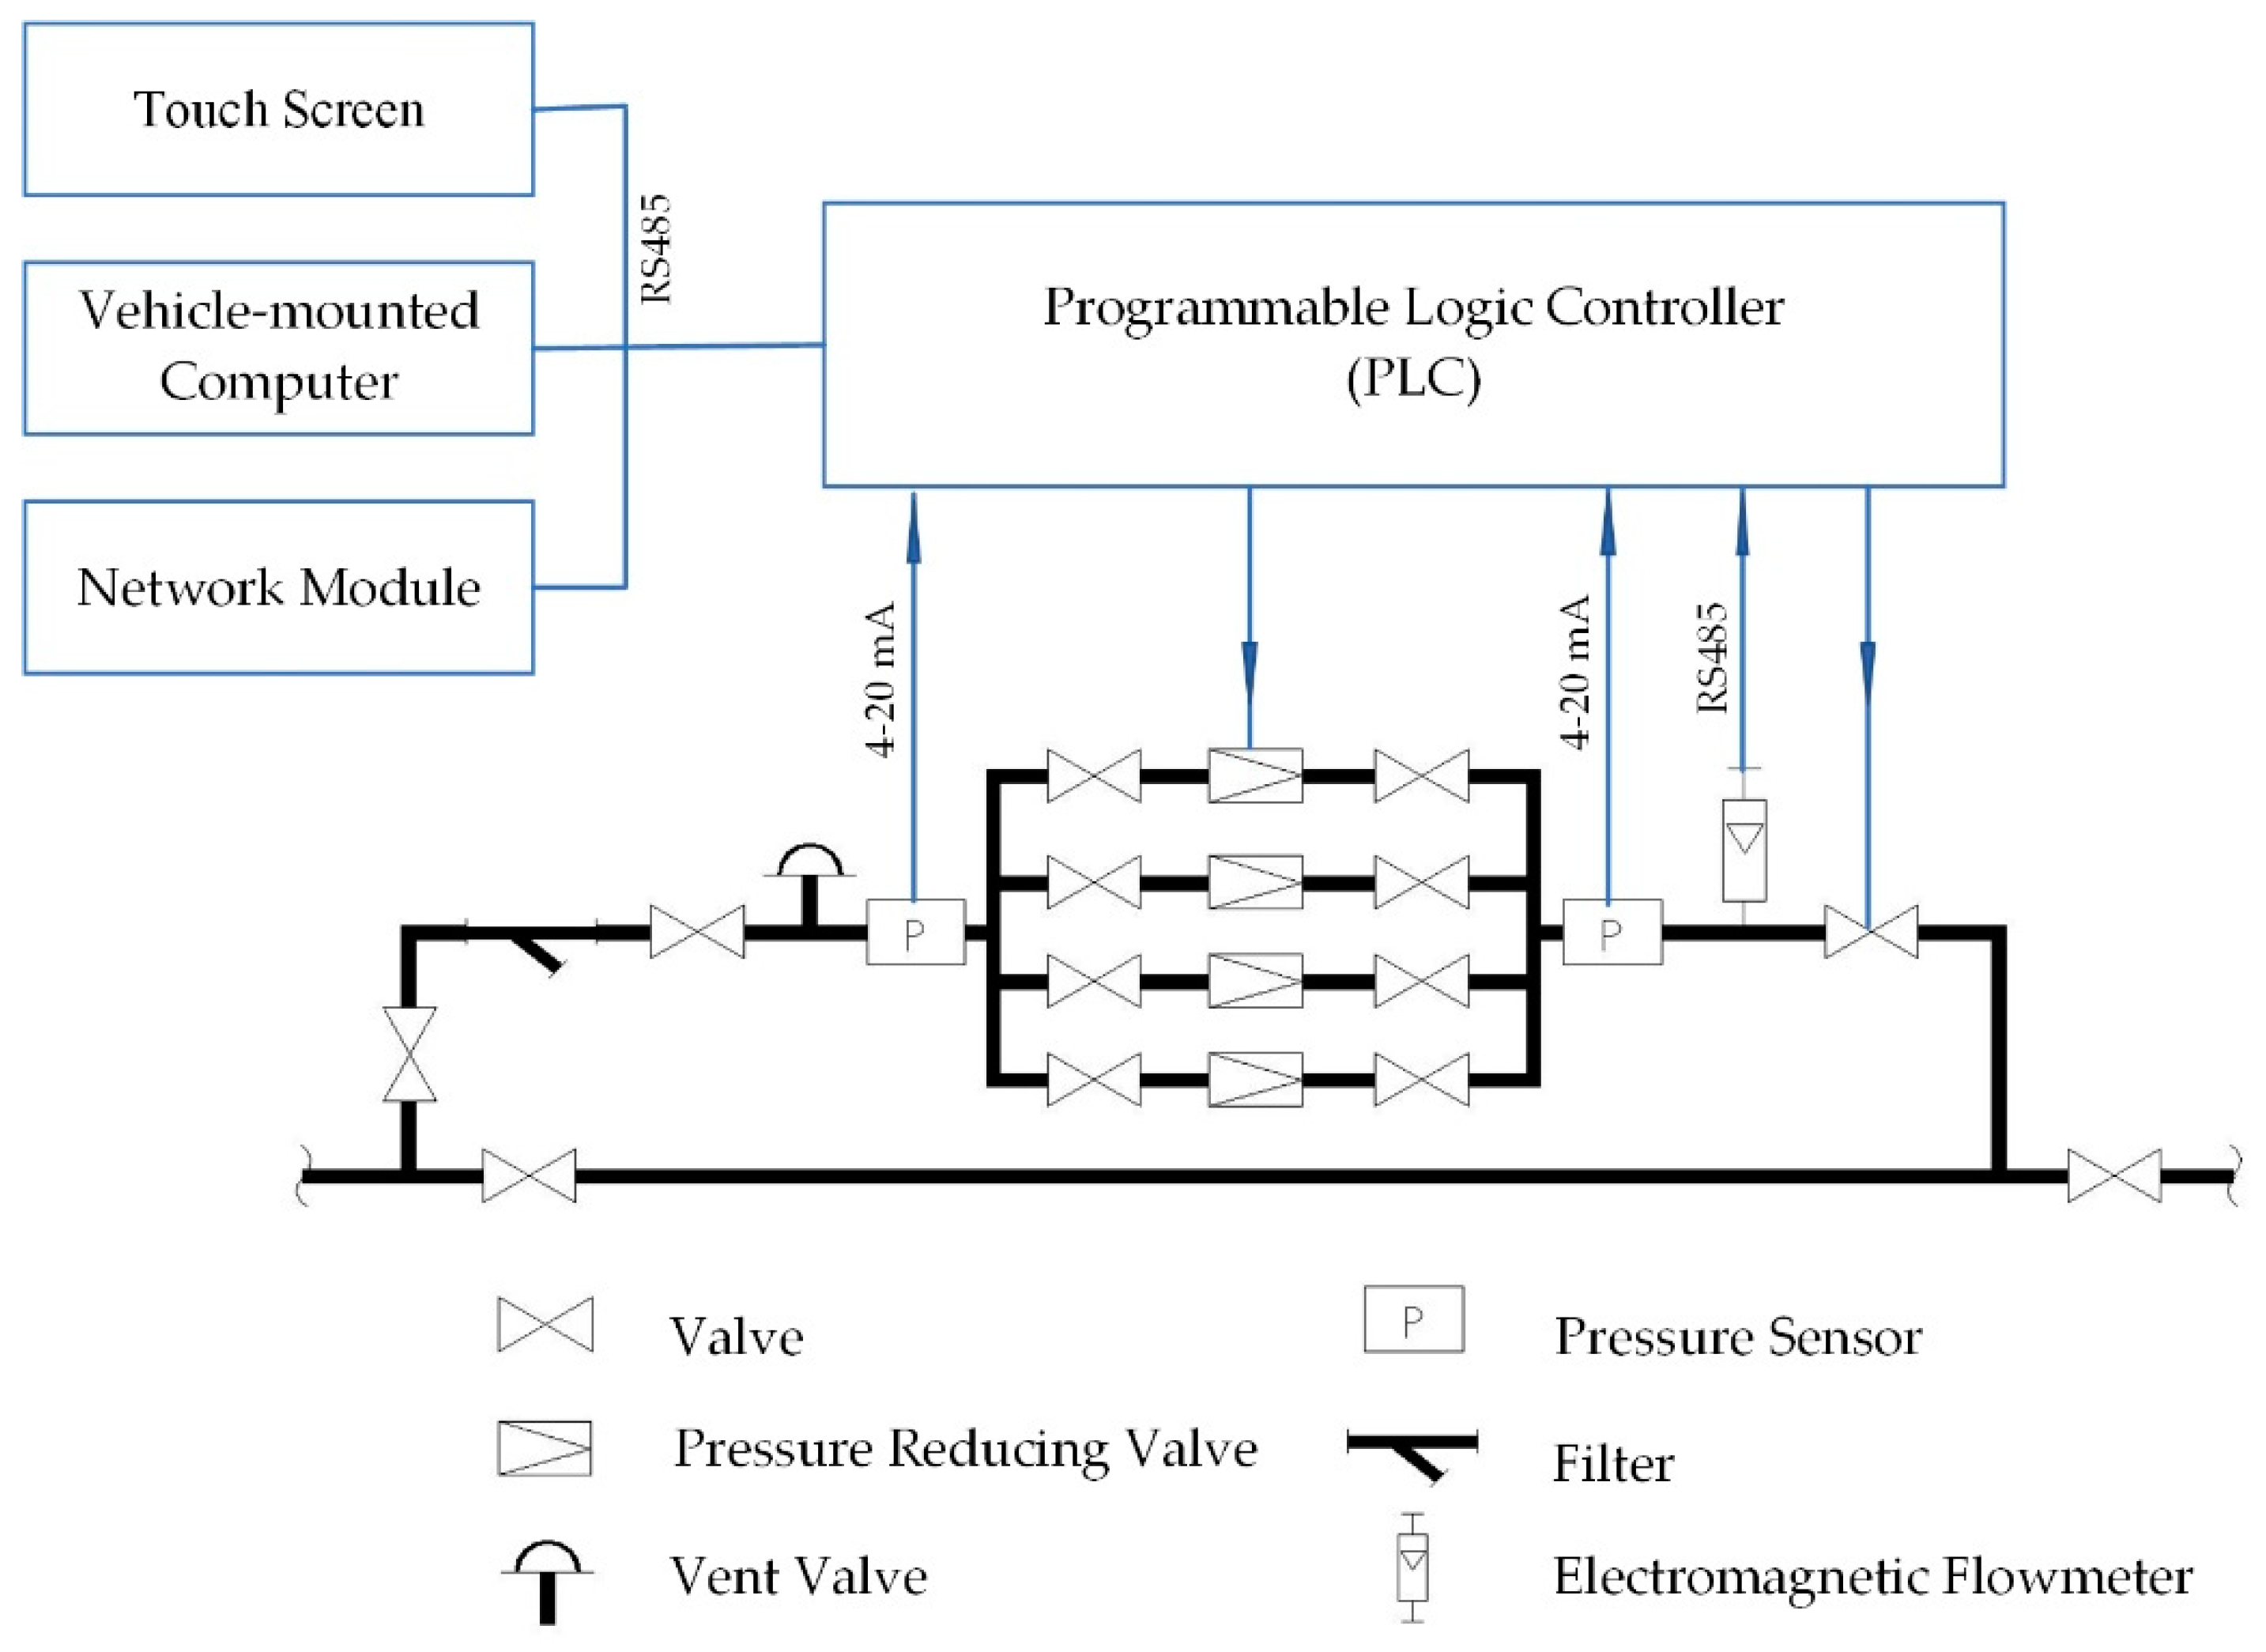
The pressure-regulating device consists of an integrated control box, touch screen, vehicle-mounted computer and network module. The integrated control box consists of a programmable logic controller (PLC), power supply module, pressure-regulating controller, pressure collecting module, and flow collecting module.
- PLC: The PLC consists of a CPU, instruction and data memory, input/output interface, power supply, digital-to-analog conversion, and other functional units. It includes various functions, such as logic control, timing control, analog control, and communication protocol.
- Power supply module: The power supply module converts the voltage from the utility or generator to the voltage needed by other devices. When the utility power is interrupted, it can supply power to each device of the regulator in an emergency to ensure its normal operation.
- Pressure-regulating controller: The pressure-regulating controller can automatically adjust the PRV outlet pressure value to the target value set by the system with a precision of ±10 kPa.
- The control dashboard can display the data and status of each device of the current pressure regulator. PLC operation parameters can be input through the touch screen.
- Vehicle-mounted computer: The vehicle-mounted computer runs the pressure regulator control software, which can read the data of the PLC in the integrated control box and store these data in the database.
Appendix A.2. Management System Design
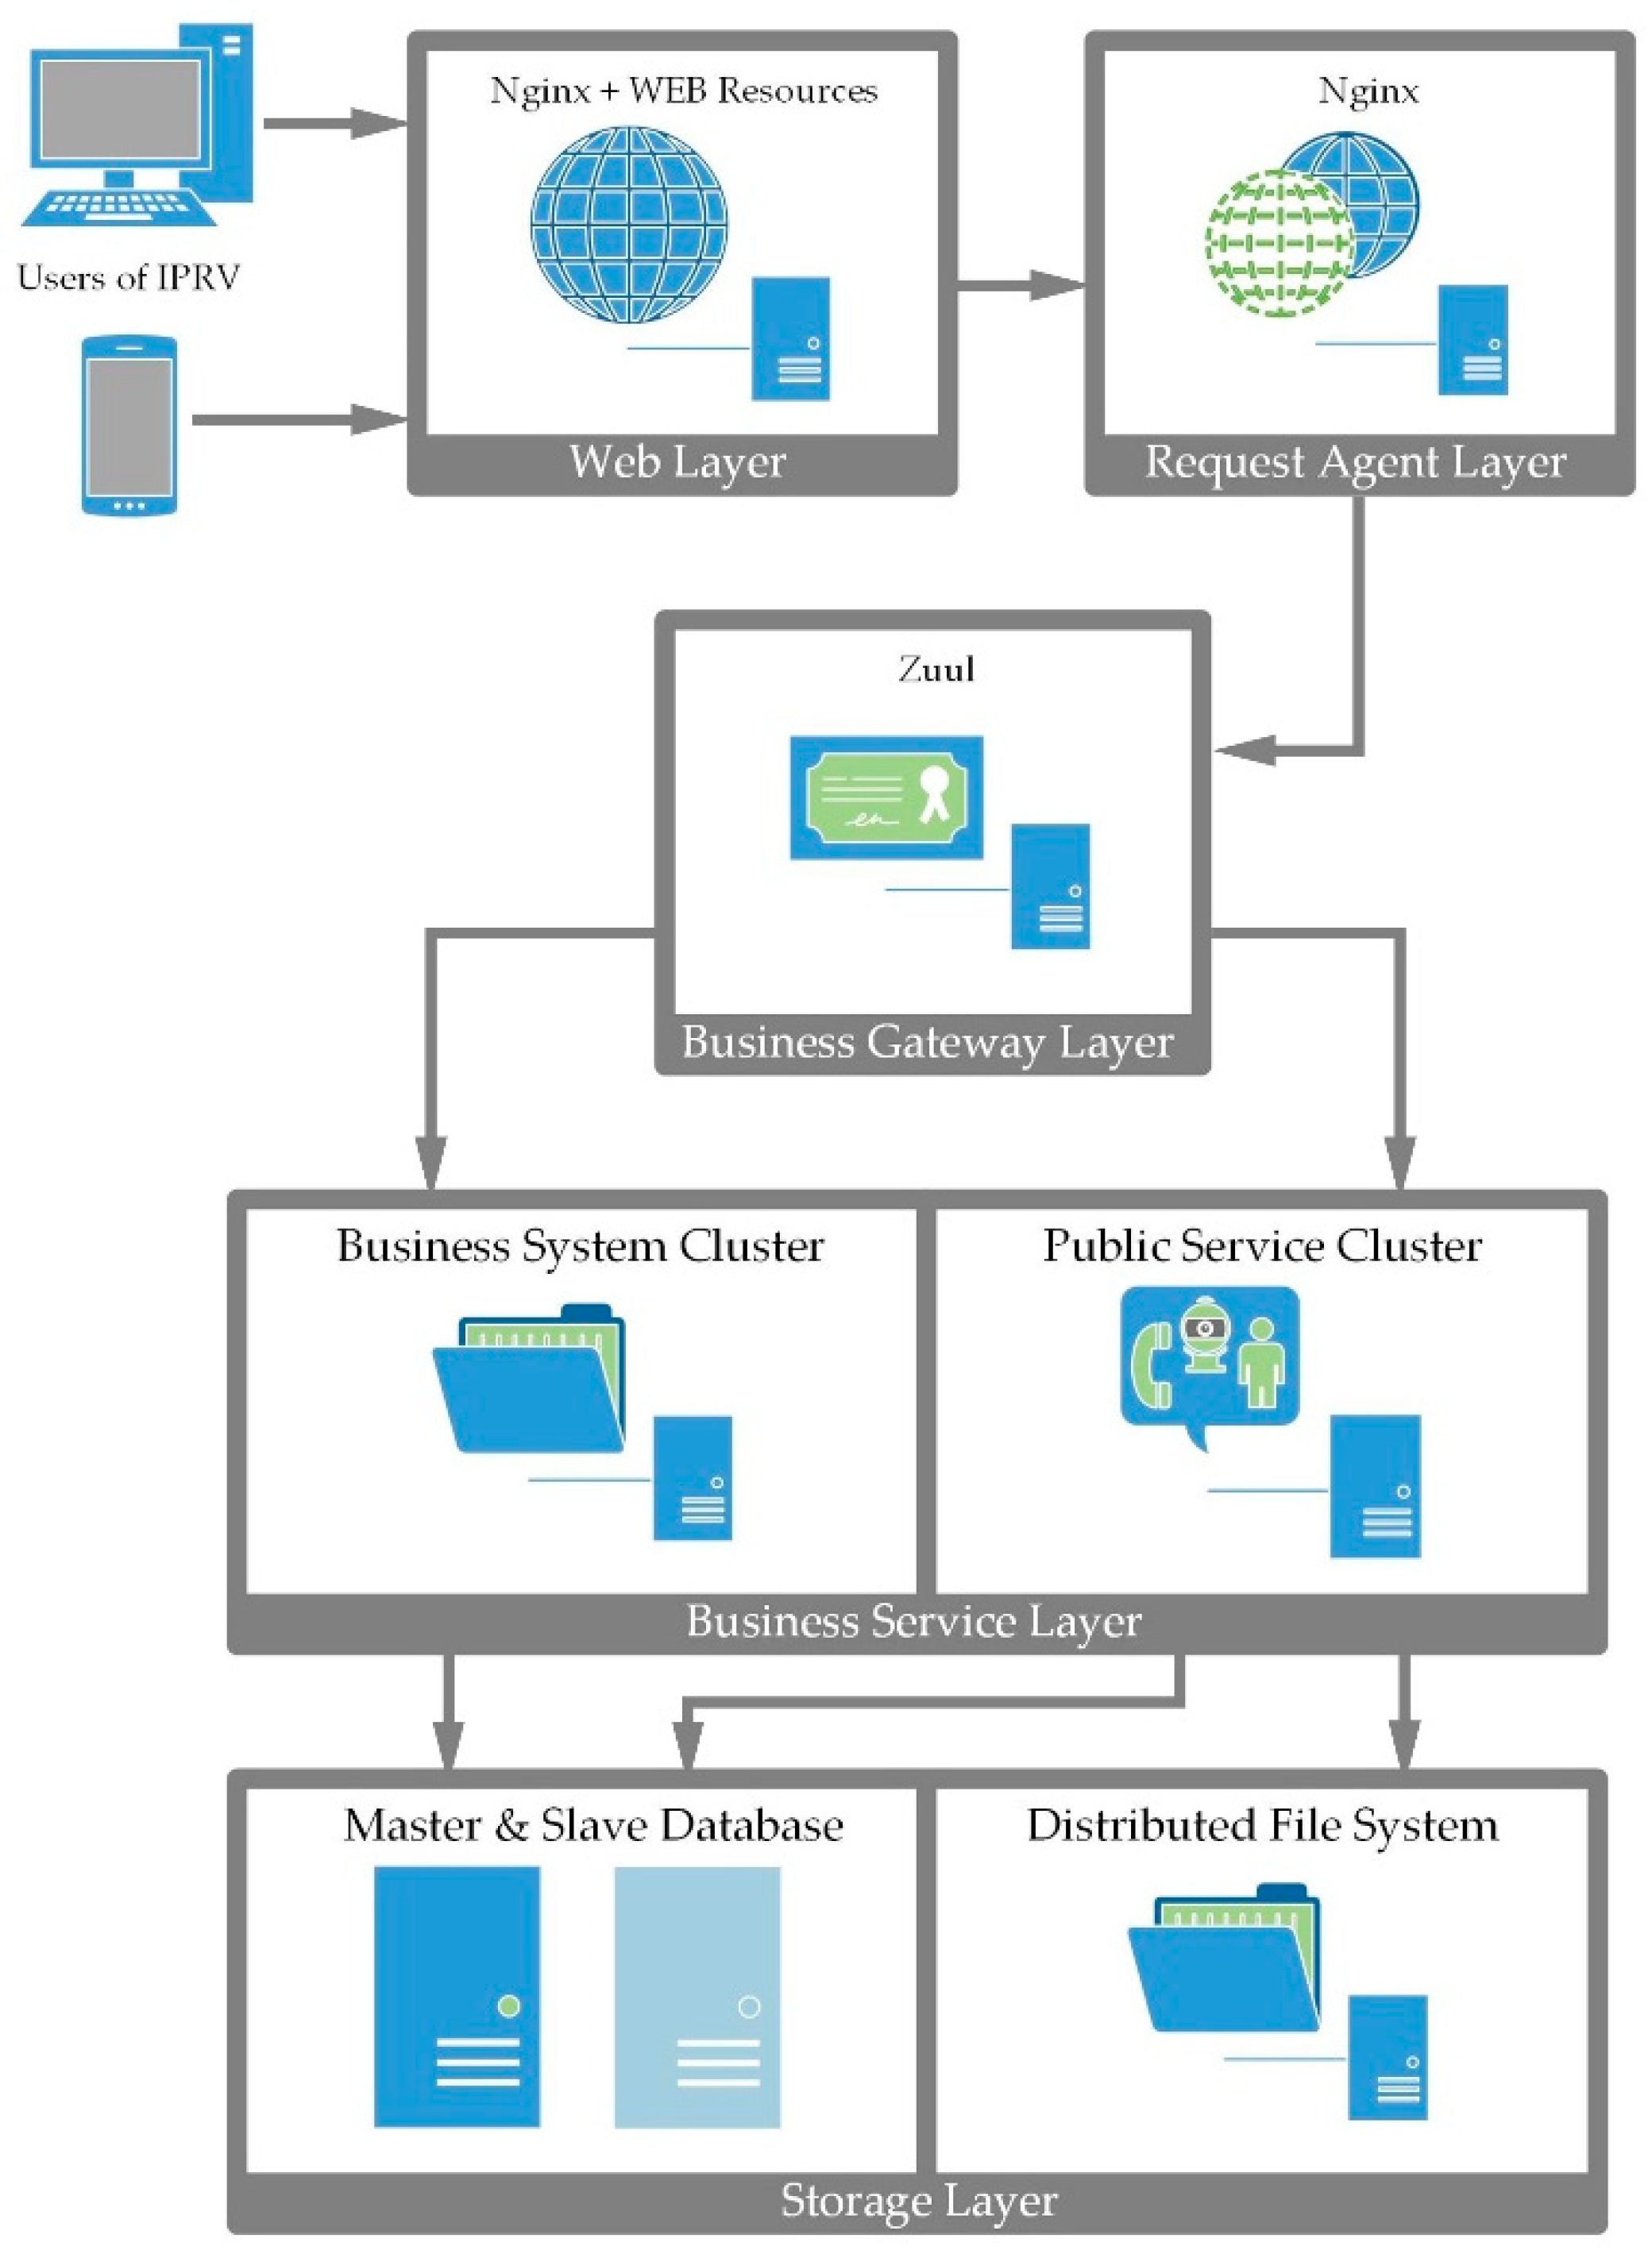
- IPRV Management System Framework.
The intelligent pressure management system was divided into a storage layer, a service layer, a communication layer, and a presentation layer.
The storage layer contains a database including Oracle [16], Hbase [17] and MongoDB [18], caching of hotspot data, and basic configurability data. It supports the storage of Redis [19], various documents, and images. The technology used is FastDFS [20].
The service layer contains the business system and the basic components. The basic components include gateway, registration center, monitoring and protection components, and basic service modules. All business systems are supported by the components to achieve the applications of business and technology.
The communication layer supports http and https, the full-duplex communication protocol WebSocket, and part of the Netty-based development of web applications [21].
The presentation layer provides a standard Restful API for clients (third-party services, Web browsers, mobile applications, tablet applications, etc.) to call and parse and visualize on the browser
- Technology Selection.
The key enabling technologies and toolkits of the intelligent pressure management system are listed in Table A1.
Table A1.
Key technology selection.
Table A1.
Key technology selection.
| Technology | Application |
|---|---|
| Spring Cloud [22] | Building a microservices framework |
| Spring boot [23] | Spring mvc + automatic configuration |
| Mybatis [24] | Lightweight persistence layer framework |
| JPA [25], Hirbernate [26] | Heavyweight persistence layer framework |
| Redis [19] | Caching middleware |
| RabbitMQ [27] | Message queue middleware |
| ELK [28] | Log collection and analysis |
| FastDFS [20] | Distributed file storage |
| Apollo [29] | Distributed configuration center |
- Management System Deployment.
The management system deployment scheme is shown in Figure A2.

Figure A2.
Management system deployment of IPRV.
Figure A2.
Management system deployment of IPRV.
- Dashboard Overview.
As shown in Figure A3, the intelligent pressure management system dashboard includes six functional modules: general overview, operation management, strategy analysis, report, information management and system setup. Each functional module contains multiple sub-functional modules, as detailed in Figure A3.

Figure A3.
Dashboard overview.
Figure A3.
Dashboard overview.
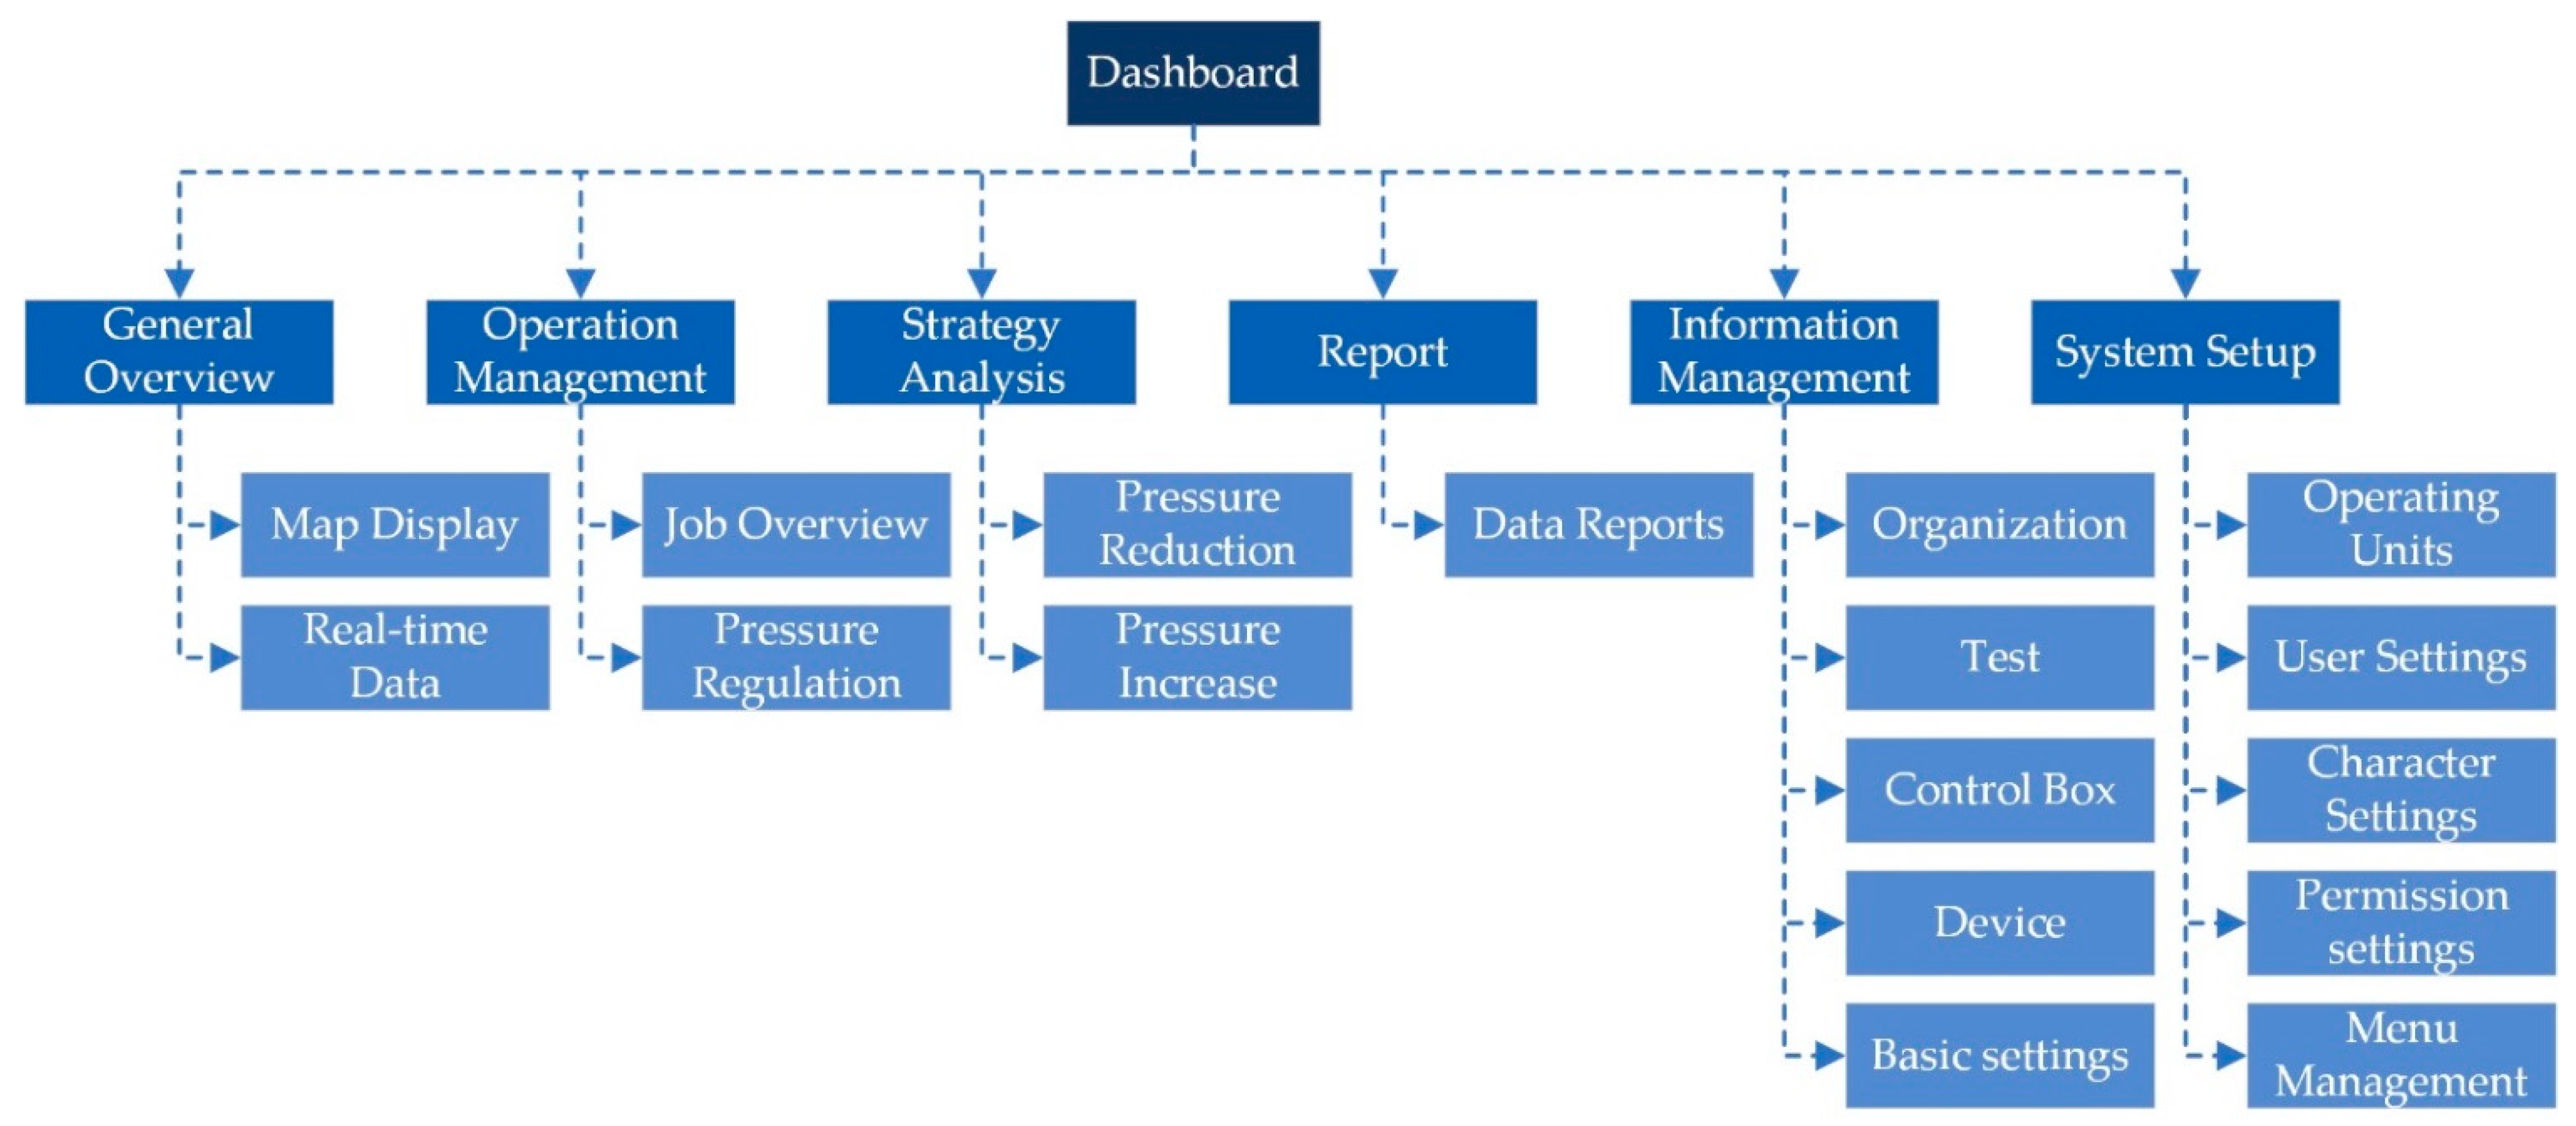
The map display function is combined with the positioning information of the map, and the geographic location of the test point is shown on the map, which can be switched between the normal map and the satellite map by clicking the button in the upper right corner. When the test point is selected, the nearest piece of data can be displayed on the icon.
Click on the test site icon to see all real-time data and status of the test site in the monitoring interface: inlet pressure, outlet pressure, instantaneous flow rate, accumulated flow rate, valve status (green for pump and valve open, gray for closed), booster pump operation parameters.
Appendix A.3. IPRV system Main Design Parameters
- P3 adjustment accuracy: ±0.01 MPa;
- P3 adjustment range: 0.1~1.2 MPa;
- Pipe diameter range: DN100~DN600;
- Flow range: 0~2000 m3/h.
- Pressure transmitter interface: Standard range is 0–1.0 MPa; accuracy is 0.2% FS;
- Built-in storage space: up to 1 month of historical data can be saved;
- Data saving interval: 1–120 min;
- Upload interval: 5 min–24 h;
- Operating temperature: −10 °C to +65 °C;
- Enclosure protection level: IP68.
References
- Malm, A.; Moberg, F.; Rosen, L.; Pettersson, T.J.R. Cost-Benefit Analysis and Uncertainty Analysis of Water Loss Reduction Measures: Case Study of the Gothenburg Drinking Water Distribution System. Water Resour. Manag. 2015, 29, 5451–5468. [Google Scholar] [CrossRef]
- De Miranda, S.; Molari, L.; Scalet, G.; Ubertini, F. Simple Beam Model to Estimate Leakage in Longitudinally Cracked Pressurized Pipes. J. Struct. Eng. 2012, 138, 1065–1074. [Google Scholar] [CrossRef]
- Shafiee, M.E.; Berglund, A.; Berglund, E.Z.; Brill, E.D.; Mahinthakumar, G. Parallel Evolutionary Algorithm for Designing Water Distribution Networks to Minimize Background Leakage. J. Water Resour. Plan. Manag. 2016, 142, 4015007. [Google Scholar] [CrossRef]
- Gao, J.; Zheng, C.; Wu, W.; Qi, S.; Xu, X. Does Pressure Reduction Test Have Significant Effect on Evaluating Pressure Management to Reduce Physical Leakage Amount? In Proceedings of the Computing and Control for the Water Industry (ccwi2015): Sharing the Best Practice in Water Management; Ulanicki, B., Kapelan, Z., Boxall, J., Eds.; Elsevier Science Bv: Amsterdam, The Netherlands, 2015; Volume 119, pp. 1020–1029. [Google Scholar]
- Adedeji, K.B.; Hamam, Y.; Abe, B.T.; Abu-Mahfouz, A.M. Pressure Management Strategies for Water Loss Reduction in Large-Scale Water Piping Networks: A Review. In Proceedings of the Advances in Hydroinformatics; Gourbesville, P., Cunge, J., Caignaert, G., Eds.; Springer: Singapore, 2018; pp. 465–480. [Google Scholar]
- Pearson, D. Standard Definitions for Water Losses; IWA Publishing: London, UK, 2019; ISBN 978-1-78906-088-1. [Google Scholar]
- Hindi, K.S.; Hamam, Y.M. Locating Pressure Control Elements for Leakage Minimization in Water Supply Networks: An Optimization Model. Eng Optim 1991, 17, 281–291. [Google Scholar] [CrossRef]
- Nicolini, M.; Zovatto, L. Optimal Location and Control of Pressure Reducing Valves in Water Networks. J. Water Resour. Plan. Manag.-Asce 2009, 135, 178–187. [Google Scholar] [CrossRef]
- Mosetlhe, T.C.; Hamam, Y.; Du, S.; Monacelli, E. A Survey of Pressure Control Approaches in Water Supply Systems. Water 2020, 12, 1732. [Google Scholar] [CrossRef]
- Meyer, N.; Engelbrecht, M.; Wright, D. Large Scale Pressure Management Implementation in the City of Cape Town. In Proceedings of the IWA Water Loss Conference, Cape Town, South Africa, 29 April 2009. [Google Scholar]
- McKenzie, R.; Wegelin, W. Implementation of Pressure Management in Municipal Water Supply Systems. In Proceedings of the EYDAP Conference “Water: The Day After”, Athens, Greece, 6–8 November 2009. [Google Scholar]
- Mahmoud, H.; Wu, W.; Gaber, M.M. A Time-Series Self-Supervised Learning Approach to Detection of Cyber-Physical Attacks in Water Distribution Systems. Energies 2022, 15, 914. [Google Scholar] [CrossRef]
- Cheng, W.P.; Yu, T.C.; Xu, G. Real-Time Model of a Large-Scale Water Distribution System. In Proceedings of the 16th Water Distribution System Analysis Conference (wdsa2014): Urban Water Hydroinformatics and Strategic Planning, Bari, Italy, 14–17 July 2014; Giustolisi, O., Brunone, B., Laucelli, D., Berardi, L., Campisano, A., Eds.; Elsevier Science Bv: Amsterdam, The Netherlands, 2014; Volume 89, pp. 457–466. Available online: https://publons.com/journal/148471/16th-water-distribution-system-analysis-conference/ (accessed on 18 January 2022).
- Radhakrishnan, V.; Wu, W. IoT Technology for Smart Water System. In Proceedings of the 2018 IEEE 20th International Conference on High Performance Computing and Communications, Exeter, UK, 28–30 June 2018; Available online: http://wikicfp.com/cfp/servlet/event.showcfp?eventid=71155©ownerid=95562 (accessed on 18 January 2022).
- Li, K. Data 20201.1-20201.7; Figshare; 10.6084/m9.figshare.17104244. 2021. Available online: https://figshare.com/articles/dataset/data_20201_1-20201_7_xlsx/17104244 (accessed on 18 January 2022).
- Oracle|Cloud Applications and Cloud Platform. Available online: https://www.oracle.com/index.html (accessed on 18 January 2022).
- Apache HBase—Apache HBaseTM Home. Available online: https://hbase.apache.org/ (accessed on 18 January 2022).
- MongoDB: The Application Data Platform. Available online: https://www.mongodb.com (accessed on 18 January 2022).
- Redis. Available online: https://redis.io/ (accessed on 18 January 2022).
- Happyfish100-Overview. Available online: https://github.com/happyfish100 (accessed on 18 January 2022).
- Netty: Home. Available online: https://netty.io/ (accessed on 18 January 2022).
- Spring Cloud. Available online: https://spring.io/projects/spring-cloud (accessed on 18 January 2022).
- Spring Boot. Available online: https://spring.io/projects/spring-boot/ (accessed on 18 January 2022).
- Mybatis—MyBatis 3|Introduction. Available online: https://mybatis.org/mybatis-3/ (accessed on 18 January 2022).
- Spring Data JPA. Available online: https://spring.io/projects/spring-data-jpa (accessed on 18 January 2022).
- Hibernate. Everything Data. Available online: https://hibernate.org/ (accessed on 18 January 2022).
- Messaging That Just Works—RabbitMQ. Available online: https://www.rabbitmq.com/ (accessed on 18 January 2022).
- ELK Stack: Elasticsearch, Logstash and Kibana. Available online: https://www.elastic.co/cn/what-is/elk-stack (accessed on 18 January 2022).
- Apollo. Available online: https://apollo.auto/ (accessed on 18 January 2022).

Publisher’s Note: MDPI stays neutral with regard to jurisdictional claims in published maps and institutional affiliations. |
© 2022 by the authors. Licensee MDPI, Basel, Switzerland. This article is an open access article distributed under the terms and conditions of the Creative Commons Attribution (CC BY) license (https://creativecommons.org/licenses/by/4.0/).