1. Introduction
This paper maps and explores the evolution of EU R&D funding for electricity grid technologies in 2002–2020 to identify changes in topics, networks and actors, and how these changes are related to the renewable energy transition unfolding in the same period. We are particularly interested in understanding how the portfolio of funded R&D projects associate with partly conflicting energy transition pathways towards centralised and decentralised system configurations.
1.1. Energy Transitions and Electricity Grids
Taking measures against global climate change implies achieving transitions towards sustainability in sociotechnical systems such as electricity, transport and food [
1]. As transitions advance, they can change in scope and depth [
2]. Early phases of transitions are characterised by innovations in niche technologies such as electric vehicles or renewable energy. Once diffusion of these novel technologies accelerates in later phases, they can generate ‘knock-on effects’ and structural tensions with repercussions for the wider sociotechnical system, such as electricity grids that are largely unaffected in early phases of energy transitions [
3,
4]. Innovation and transformation in the electricity grid is central for successfully integrating variable renewables while keeping the wider electricity system stable. Recent research has shown that there are important complementarities between renewable energy technologies and different grid technologies [
4,
5], that the strategies of grid actors and regulators are important for achieving change [
6], and that there is widespread disagreement and contestation over how the grid should develop [
7,
8]. At the same time, there is limited transition studies research on innovation in electricity grids in the context of transitions. With this paper, we contribute to narrowing this gap in the literature.
1.2. Energy Transition Pathways
Historically, transitions have unfolded according to different patterns across time, place and systems, giving rise to the notion of transition pathways. A pathway can be viewed—in retrospect and as a future pathway vision—as a semi-coherent pattern of changes in the configuration of a socio-technical system over time [
9]. In the energy transition pathways, the degree of disruption to the status quo has especially demarcated distinct pathways, including whether incumbent energy actors are disrupted or continue to dominate [
10], and whether the wider system architecture is reinforced or disrupted, such as a shift from centralised to decentralised architecture [
11,
12].
Researchers have identified renewable energy transition pathways for the electricity system that reinforce the traditional centralised architecture and pathways that entail a radically different, distributed architecture [
11,
13]. Traditionally, in Europe, electricity has been produced in central production units, being large powerplants either based on fossil resources, nuclear energy or hydro power. Now, however, there is growing momentum in decentralised and distributed power production (such as wind, solar, biomass and biogas), and the dominance of centralised production units is in decline. This ongoing but nascent shift from centralised to distributed electricity production affects the requirements for the electricity grid. The centralised electricity production required an electricity grid that guaranteed the stable, long-distance transmission of electricity from a few large power plants to all electricity consumers. The transmission of electricity in a decentralised energy system entails other grid technologies such as distribution grids, small-scale storage and demand-response solutions.
However, replacing fossil resources with renewable energy entails other types of challenges: The electricity production based on the intermittent resources wind or PV is not offering per se such a stable base load as an energy system based on coal, natural gas or nuclear energy. This problem can be addressed by connecting these power plants, which are widely geographically distributed, and by using flexibility measures provided by demand response technology, smart grids, large scale energy storage capacity. However, all these new system elements must be integrated, and make the energy system much more complex and difficult to manage.
It has been proposed to deploy more electricity transmission across national borders to gain more flexibility, as the Nordic electricity market has demonstrated balancing between increasing shares of wind power in Denmark and hydropower in Norway. It has been proposed to create more such transmission lines to other European countries like Germany, the Netherlands and the United Kingdom. A distributed energy system can also be facilitated by more flexible energy usage, for instance by deploying demand-response technology in households, introducing prosumers into the energy system and exploiting battery electric vehicles for providing vehicle-to-grid services. All these activities are distributed and require coordination in a network of smart grids. This coordination requires the integration of the power grid with the ICT network. However, the broad deployment of ICT can also be interpreted as a loss of control, and as a possibility for misconduct and manipulation. Therefore, our study also offers insights into the varying roles of ICT in energy transitions, which is not well understood [
14]. Centralised and decentralised energy transition pathways thus entail rather different technologies and innovations to be realised both in grids and power product1.3. Contestations and Tensions in Transitions
In contrast to past transitions, the ongoing sustainability transition is purposive with a major role for public policy as a driving force [
15]. The latter implies that issues related to the desired direction and pace become a matter of public debate, thus bringing out the normative aspects of transitions [
16]. As actors across policy, business and civil spheres have different interests, transitions typically redistribute wealth and influence, and transitions are often characterised by political struggles and tensions between social groups [
17,
18]. Geels et al. highlighted that energy transitions could not easily be modelled as a process of steady increasing deployment of low-carbon technologies for these reasons [
19] (p. 1f.). The dynamics of such transition processes must be considered. This point means that we have to analyse: (a) a wider spectre of actors with their competing interests, beliefs and practices; (b) the non-linear changes of user practices, discourses and political struggles around these transitions; (c) the alignment between long-term benefits of low-carbon developments and other objectives of relevant stakeholders; and (d) the directionality of public policy towards low-carbon transitions (ibid.).
These insights imply that different transition pathways are typically supported by different actors and groups. Similarly, a different set of policies will be required to support diverse pathways. By analysing how actors and policies influence the direction of a transition, research can provide an important information platform for decision making [
20]. In the case of the electricity system, research has shown that pro-transition traditional energy companies—incumbents—strongly prefer a highly centralised renewable energy system in the future, while new actors in the electricity system—challengers—tend to prefer a highly decentralised future system [
10,
21]. Incumbents often have significant political influence to attract resources to support their visions and avoid major disruptions [
22]. At the same time, the decentralised pathway depends to a larger extent on immature technologies that require protective market niches, as well as innovation and R&D support to take off. Focusing on EU energy policies that influence operations and investments in the electricity market (‘demand pull’), recent research shows that the current policy mix largely supports a centralised pathway [
7]. We complement the latter study by considering which pathway EU science and technology funding (‘supply push’) favour.
1.3. Case Study: EU R&D Funding for Grid Technologies
The transition of the European energy system towards a more renewable system has attracted increasing attention in the general public over the last decades by politicians, investors, energy companies, grid companies and researchers. Europe is a global leader in renewable energy transition, and EU policies have had a major impact on this issue. Focusing on the EU is thus a suitable case for considering the role of grid technology innovations in transitions.
This paper explores to what extent and how European framework programmes for research and development have addressed and facilitated the development of innovations and knowledge production supportive of centralised and/or decentralised pathways. We suggest that R&D projects on transmission grid technologies indicates support for a centralised pathway and that R&D projects on distribution grid technologies indicates support for a decentralised pathway. The paper is based on a mixed-method approach to analyse European R&D projects that studied electricity grid planning, development and innovation in Europe and which were funded since 2002, and on an analysis of the calls for proposals issued by the three European Framework Programmes, FP6, FP7 and Horizon 2020.
Against the background of existing literature and study case details, we propose a set of hypotheses to guide our analysis:
The more renewable and variable energy technologies diffuse, the more need for and attention to innovation and change in electricity grids. Therefore, we expect to see that R&D funding to grid technologies increases over time, and to see more and more focus on renewables integration.
Because of the inertia of established system configuration and limited diffusion of distributed renewables around the year 2002, we expect transmission grids (centralised pathway) to be prioritised in the first period. In contrast, distribution grid projects (decentralised pathway) became more and more important at the end of the focus period, due to the increasing decentralisation of energy production.
Because of the rising complexity of interaction between multiple grid and power generation technologies, we expect that R&D projects focusing on coordination tools such as ICTs (generic electricity grid issues) become more important over time, since these technologies can facilitate the interaction of different elements and layers of the whole energy system.
We further expect that the actors involved and their collaboration patterns in European R&D projects differ across transmission, that distribution projects, new actors such as ICT firms and energy communities etc. get involved, and that the collaboration patterns have changed over time.
2. Materials and Methods
A mixed-method approach has been applied, consisting of (a) identification and classification of research and development projects, (b) document analysis of Framework programmes and calls and (c) social network analysis of the identified projects in the three framework programmes.
The two first approaches were used to identify the sample of relevant projects: using keywords to identify projects and call information in the three EU Framework Programmes and projects answering those calls. The first approach delivers more projects than the second, because other funding instruments like a Marie Skłodowska-Curie stipend or more generic instruments can fund electricity grid projects. The second approach is necessary to ensure that important projects are not overlooked and helps to verify the selection based on the keywords: if the most important calls have been identified through the keywords, these keywords are at least relevant to define the sample.
When the work on transmission grids and distribution grids started in 2015, a more “rigid” view on the energy system was prevalent, distinguishing between distribution grids, transmission grids and some more generic issues on electricity grids. This view had an important impact on the research process, as it has turned out that this distinction has become much fuzzier over the last years.
We present the methods and outcomes in more detail in the following sub-sections.
2.1. Analysis of Funded R&D Projects
In the total population of funded R&D projects across three EU FPs relevant projects were identified using keywords described in
Table 1. R&D projects were coded according to whether they address issues at the transmission grid level, the distribution grid levels, or projects that focus on electricity grid but in a more generic way. Two hundred and forty-four (244) projects were identified. Of those, 197 projects were interlinked or networked, which means more than one organisation was involved.
Social network analysis has been applied to explore the collaboration patterns of the involved actors. The benefit of social network analysis is that it enables researchers to study relations between different types of organisations—in this case of universities, private companies, etc.—across different activities and across different R&D projects. This approach allows us to show collaboration patterns and trends with their changes over time. SNA allows identifying clusters of organisations that collaborate, how these clusters change over time and the role of specific organisations in these networks by using different centrality measures. The SNA has been conducted for three FP periods to show changes over time, but we do not include here the analysis of the Horizon 2020 projects, since Horizon 2020 has not ended yet and the SNA would be not viable. Key statistical indicators are calculated for each category of projects, and the two programme periods FP6 and FP7. SNA techniques to measure different types of centrality in the networks have been applied, such as average network density, fragmentation and degree centrality. It has been distinguished between different types of partners, such as private companies, higher education institutions, research organisations, public agencies and other actors.
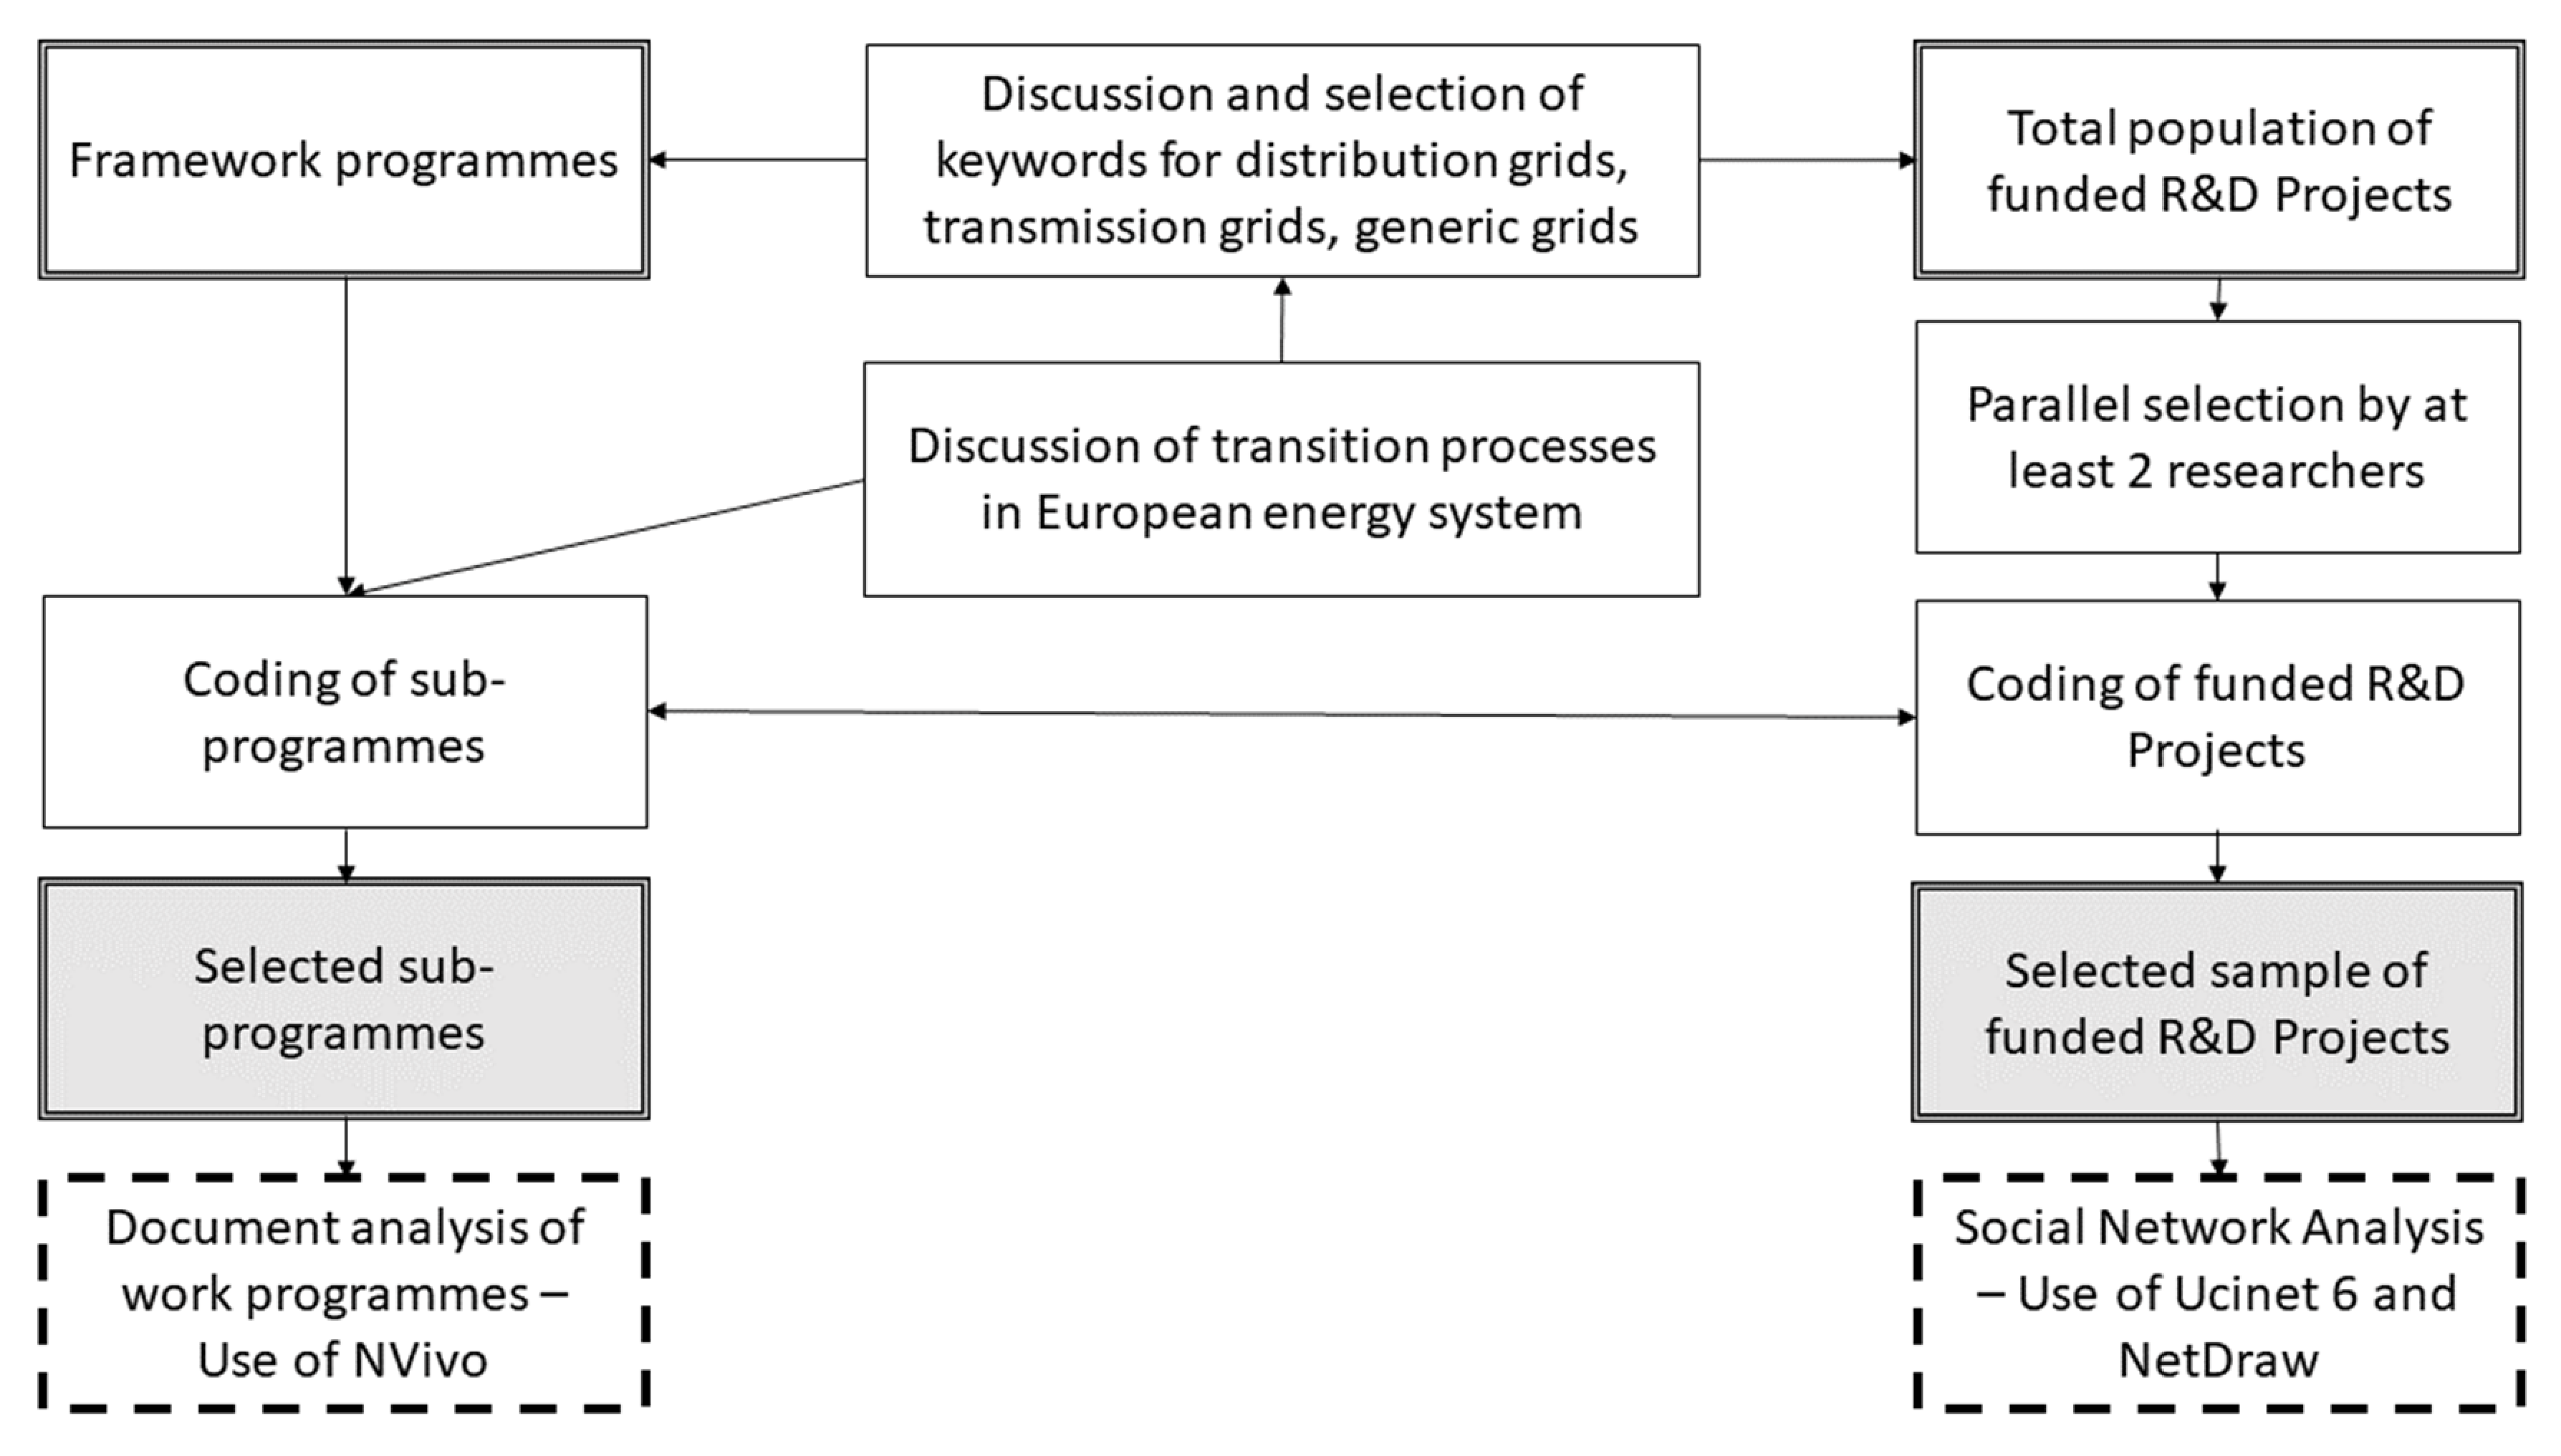
The European R&D projects were selected in the following process. The methodological approach is summarised in the following flow chart (
Figure 1). For the qualitative document analysis, NVivo was used, while for the social network analysis Ucinet 6 was applied [
14] and the network diagrams were created with the help of NetDraw [
15]. This flow chart distinguishes between three processes: (1) discussion of transition processes and relevant key-words; (2) selection and analysis of R&D projects; and (3) selection and analysis of work pro-grammes and sub-programmes.
2.1.1. Relevance of Projects
The scope of relevant projects is defined as follows. The projects can address technical, institutional and regulatory issues and behavioural changes across low-, medium- and high-voltage networks both on- and offshore. Within this broad definition, relevant projects must first and foremost focus on electricity grids as such rather than a particular component attached to the grid (e.g., storage, RES-E, Electrical vehicles). Therefore, projects should have grids as the main focal area of research rather than a secondary or tertiary area of focus. However, since there are many projects where grids are a part of the study, projects were included when the researchers studied a specific technology and its implications for the grid. Here, the delineation is associated with the degree to which the grids are studied. If the implications for the grid are explored, the project was included. Projects were excluded if the project merely studies a particular technology (of great importance to grid evolution such as storage) but does not study its implications for grid transformation.
Some projects study a specific technology or sets of technologies such as EVs, Solar PV, Battery or energy efficiency in buildings and connect their topic to the issue of electricity grid transformation. However, these projects do not intend to study grids as such. Most of these technologies have some implications for the grid, but not all of these projects study these implications. The same is true for projects considering concepts or technologies (ICT systems and market designs) for operating “smart” electricity grids.
As a general rule, despite it being an ‘umbrella term’, all projects on ‘smart grids’ are included when they study the development of a smart grid or carry out systems analyses. The same is true for off-grid systems (micro-grids). When the project is about developing off-grid technology, it is included. It is not included if it only addresses some system components, which could also be applied for different sectors. The grid aspect needs to be in the foreground. Intra-building grid projects were excluded, i.e., electric systems inside buildings, even though these examples can be viewed as micro grids.
2.1.2. Coding Process
The total population of funded R&D projects was searched in the Cordis database across three EU FPs using keywords linked to power grids.
All projects were assessed for relevance by reading the abstracts of the R&D projects. At least two researchers coded the same projects to check for common understanding in the early phase. When there was disagreement, the researchers discussed the issue to reach a consensus. Subsequently, one researcher coded the majority of projects. The latter person marked borderline projects that an additional researcher checked. Furthermore, discussions about deviations occurred to reach a consensus. In addition, the coding was checked via random sampling by another researcher.
Within thematically relevant projects, projects were excluded that were about research training (schools), social networking and secretariats, as these cases do not have strong research content.
In the theory section, the idea of competing pathway visions for the energy transition along the lines of more or less disruption was discussed [
10]. In the case of the power sector, this can be operationalised as visions for a renewable and centralised power system (less disruption) and a renewable and decentralised power system (more disruptive). These visions translate into whether transmission or distributions grids are the key locus of change for integrating rising shares of variable renewables. Based on these perspectives, R&D projects were coded according to whether they address problems/issues at the transmission or the distribution grid levels. See
Table 1 for examples of how projects were sorted. In addition to these two project categories, a residual category was created, referred to as generic projects. These projects focus on the electricity grid, but do not explicitly refer to transmission or distribution grids. Major themes in this category are, for example: (i) energy system modelling that includes analysis of the whole system (i.e., across levels), as well as generation and uses; (ii) energy system management via improved and integrated ICT systems where the focus is on generating, managing and using more and more real-time data to improve system operation and smartly integrate RES, but without focusing on whether this is primarily at the distribution or transmission level; and (iii) projects on new energy services provided by storage, aggregators or virtual power plants that do not specify whether this is mainly an issue for transmission or distribution grid actors—indeed, although these technologies are often deployed as local and small-scale, they can equally have an impact on the transmission grid and be large-scale.
The following
Table 1 shows the scope of the three topic areas, and uses thematic keywords for each of them.
Table 1.
Coding system for the three categories of electricity grid technology and research.
Table 1.
Coding system for the three categories of electricity grid technology and research.
| | Category 1:
Distribution Grid | Category 2:
Transmission Grid | Category 3:
Generic Grid Issues |
|---|
| General description | Distribution grid.
DSOs are the main actors. Impacts of small-/medium-sized decentralised generation on the grid. Includes smart grids projects at the community level | Transmission grid.
TSOs are the main actors. Impacts of large-scale renewables on the grid. | Often concerning topics that cross the TSO-DSO divide.
Technology providers. |
| Thematic keywords | Smart neighbourhoods
Smart cities
DSOs
EVs on the grid
Distributed generation
Smart-meters
Low-voltageIsland grids/off-grids/mini-grids | Transmission grid technologies (e.g., HVDC, HVAC, FACTS)
Super grid
Interconnectors
Pan-European network
TSOs
High-voltage | Aggregators/aggregation services
Ancillary services
Power grid systems modelling
Impact of RES on power grids
VPPs
Energy system management incl. systems of systems
Generic tech components |
2.1.3. Social Network Analysis
Social network analysis (SNA) has been applied to analyse what actors have been involved in the European R&D projects on the electricity grid, and if this has changed over time. It has been distinguished between different types of partners, such as private companies, higher education institutions, research organisations, public agencies and other types of actors. In addition, it has been distinguished between national and international collaboration patterns based on the localisation of the partners.
Key statistical indicators are given for all three programme periods:
− Number of projects analysed
− Number of interlinking projects and share of all projects
− Number of sub-networks
− Number of networked nodes
− Average network density, incl. Standard deviation
− Fragmentation of the network, incl. Distance-Weighted Fragmentation
− The size of the largest sub-network is measured in the number of nodes based on x projects and the share of all projects and the whole network.
SNA techniques to measure different types of centrality in the networks have been applied, such as average network density, fragmentation and degree centrality. Network density measures the proportion of possible ties that are actualised among the nodes in a social network [
23]. Fragmentation is the proportion of pairs of nodes that cannot reach each other, and is calculated with Ucinet 6. Degree centrality is defined as the number of links a node has [
24].
The SNA calculations have been done with the SNA software Ucinet 6, developed by Borgatti, Everett and Freeman [
25]. The SNA maps have been created with the help of the software NetDraw, developed by Borgatti [
26]. The SNA maps are based on Freeman degree centrality measures and spring-embedding is applied as the graph-theoretical layout. It is possible to zoom into the different network diagrams. However, the main purpose of the diagrams is to show the main patterns of collaboration: different cluster, their size and centrality. More specific information about the most important organisations for each of the six samples has also been calculated, but is not included in this paper. It can be received on request.
2.2. Analysis of the Conceptual Focus of These Three Framework Programmes
The three last European framework programmes have addressed energy-related issues, but different priorities. In the following, we give a summary of the research priorities related to energy grids, and we highlight how we have understood the calls and working programmes in these different framework programmes: do they request research about distribution grids and transmission grids, or do they cover more general issues related to electricity grids. The three framework programmes give a timeline of European research over the last 18 years.
Table 2 lists the sub-programmes analysed and the total funding for the sub-programmes FP6 SUSTDEV, FP7 ENERG, FP7-ICT and Horizon 202-10. Secure, clean and efficient energy.
The most important work programmes were identified by analysing the information about the calls the respective projects applied for and concentrated on those calls where projects with several participants received funding, and which were relevant for energy grid studies.
The respective working programmes and calls were downloaded, and NVivo was used to code these documents. For the coding, the same codes were used as for the selection of projects (see
Table 1). After the coding process, the research priorities were summarised, sometimes pointing out changes or new priorities that appeared during a programme and how the different priorities interact and evolve.
The results are summarised in
Table 3. Under FP6, all calls under the Thematic Priority 6.1 Sustainable Energy Systems were analysed, and here all projects were networked projects. Under FP7, all project calls under FP7-Energy (32 projects) and FP7-ICT (33 projects) were included. Under Horizon 2020, the calls included in the work programmes for 10. Secure, clean and efficient energy was analysed, specifically the calls under Competitive Low Carbon Energy (LCE) (58 projects). In addition, small and medium enterprise instruments (SMEINST) were also scrutinised, with 31 projects.
3. Results
This section consists of three parts: first, the changes in the analytical focus of the framework programmes; second, the social network analysis of the identified projects; and finally, the development of funding of electricity grid research under the European FPs.
3.1. Changes in the Analytical Focus of the Funders
Here is a summary of the development of the analytical focus of the funding programmes.
3.1.1. 6th Framework Programme: Sustainable Development, Global Change and Ecosystems
Under the 6th Framework Programme, which lasted from September 2002 to December 2006, energy was addressed under Sustainable Development, Global Change and Ecosystems: thematic priority 6. The first sub-priority area (6.1) was devoted to sustainable energy systems. It was expected that research activities should address the development of “renewable energy sources and their integration in the energy system, including storage, distribution and use” [
27] (p. 1). Another sub-priority was asking for projects about sustainable surface transport targeting “clean urban transport and rational use of the car in the city”, but here electrical vehicles were not specifically included, as the focus was on biofuels, natural gas and hydrogen [
27] (p. 2), [
28] (p. 14).
The work programme for the priority area 6.1 Sustainable energy systems distinguished between research activities impacting (a) in the short and medium term and (b) in the medium and longer term. Under the first alternative, research was placed on “Cost-effective supply of renewable energies” and on “Large-scale integration of renewable energy sources into energy supplies” [
28]. In both fields, relevant research topics were covered for energy grid-related research:
For electricity, the strategically important areas in which research should be concentrated were (among others): the reduction of development constraints for the deployment of offshore wind “by demonstrating technical control mechanisms to maintain the stability of the grid (grid-based control, turbine control and consumption control)” [
28] (p. 7) which we placed under the generic research topic, and similarly addressed the integration of solar photovoltaic electricity with the local distribution grids (the distribution grid priority in our analysis) and the development of new devices and systems to manage these installations (ibid.) (again the generic research priority). In general, it can be concluded that research topics covering distribution grid and generic issues are highly linked in the work programme. The same applies to the transmission grid and generic issues, but to a lesser extent.
For the large-scale integration of renewable energy sources into energy supplies, the work programme stressed the need for researching “interactions between centralised and decentralised energy supplies and demands at the systems level, which is typically more complex when advanced energy management systems are employed” [
28] (p. 8)—again, a research topic stressing generic issues in combination with the distribution grid focussing on “integration of distributed electricity generation … with demand-side management programmes, local energy management techniques and the co-ordinated provision of sustainable energy services …” (ibid.). Advanced energy management systems were seen as a solution for enhanced distributed electricity generation problems and different levels of renewable energy integration [
29] (p. 10).
The work programme stated that it is necessary to prepare the European energy system for large-scale integration of distributed energy resources (DER), “transforming the conventional electricity transmission and distribution grid into a unified and interactive energy service network using common European planning and operation methods and systems” [
28] (p. 20). Here, the development of systems for grid-connected applications and the development of key enabling technologies for distributed energy networks were seen as central (ibid.). The interaction between energy research and information and communication technology (ICT) was stressed in this programme [
28] (p. 22). In the updated work programme revised in 2004, a specific call on grid issues was launched (SUSTDEV-1.1.7) [
29] (p. 17). Here, two topics were central: (a) distributed electricity generation and the security of the distribution grid; and (b) management of electricity grids which are linked to large-scale decentralised electricity generation and which deploy innovative control technologies and intelligent management systems (with related ICT), and “which address the large scale transmission of renewable electricity at the trans-regional or EU level” [
29] (p. 17). In connection to decentralised energy management systems for maximising the value of distributed electricity generation from renewable sources, the development of large-scale virtual power plants was proposed, but also the development of advanced power electronic converters and of high-temperature superconducting (HTS) device technologies [
29] (p. 33f.), which are all topics we see as belonging to generic grid issues. The programme requested research to facilitate the future European Electricity Transmission Network, a research topic we define as a transmission grid.
3.1.2. 7th Framework Programme: Energy and ICT
In the 7th Framework Programme, there were two specific programmes relevant for research about electricity grids: Theme 5 Energy; and Theme 3 ICT. We cover both in this short mapping.
Under the Specific Programme ”Cooperation”: Theme 5 Energy, there was placed Activity Energy. 7: Smart Energy Networks [
30] (p. 61 ff.). This activity covered not just smart grids but advanced energy networks in general, including research on distribution grids and more generic technologies, but also transmission grids.
During the first work programme period (2007–2008), the activity funded research and innovation for (1) interactive distribution networks, including the development of open-access standards for smart multi-metering services, for (2) a smart Pan-European transmission network, including the integration with the Russian electricity network and Diagnostics, Surveillance, Maintenance and Control of Power Transmission and Grid Connections and for (3) more generic and cross-cutting issues such as energy network assets management, new tools for integrating distributed renewable energy resources and scenarios for energy infrastructure development. We see the distinction between these three themes as the paradigm behind the classification we applied in our research on energy grids.
During the second work programme period (2009–2011), research and innovation funding was concentrated on topics related to (1) the importance of electrical vehicles in smart distribution grids, (2) the optimisation of the transmission grid with large scale renewables and storage and the development of innovative tools for the coordination, operation and assessment of the Pan-European transmission grid and (3) more generic issues such as the development of innovative operational and monitoring tools for large power systems, the development of high-temperature superconducting (HTS)-based devices that have the potential to improve the performance, stability and efficiency of electricity and the development of energy storage systems for stationary applications to increase the capacity of future electricity distribution networks to host variable distributed energy resources.
The last work programme period (2012–2013) funding under Activity Energy. 7: Smart Energy Networks was mainly directed towards distribution grids, including the use of distributed intelligence, the empowerment of smart customers, the deployment of stationary batteries in smart grids and networking of research on smart meters and smart grids—those topics were also central cross-cutting issues, which we categorised as generic grid topics. Regarding transmission grids, the working plan called for projects on European Electricity Highways to ensure the reliable delivery of renewable electricity and pan-European market integration. In 2012, a joint call on smart cities was launched by the energy programme and the ICT programme for 2013, asking for project proposals addressing energy systems in smart cities from the two angles.
The other large FP7 programme covering research on electricity grids was Theme 3 ICT. Under this programme, a specific challenge was placed: Challenge 6: ICT for Mobility, Environmental Sustainability and Energy Efficiency. The project calls relevant for energy grids were issued under Challenge 6: ICT for a low carbon economy and addressed mainly distribution grids and generic technology to support them.
During the first work programme (2007–2008), the grid-related funding was directed towards integrating smart houses and smart grids in local electricity grids through smart ICT-devices—here was focus on the generic dimension, but with relevance for distribution grids. The ICT programme also had a joint call with the Security Work Programme. Here, the focus was on the processes and tools supporting of critical infrastructure protection, among others of energy networks.
In the second programme period (2009–2011) this became much more important, but still the calls were centred on topics related to distribution grids and generic grid-related ICT, here covering topics like smart miniaturised systems and highly energy-efficient ICT components and solutions for facilitating electrical vehicles, smart energy grids, smart urban mobility, the development of ICT-based monitoring and control systems to tackle the complex distribution grids, and to enable the development of energy-positive buildings and neighbourhoods and ICT tools for the future electricity market, including the development of virtual power plants—all issues related to either generic grid issues or distribution grids. The ICT programme also issued a joint call with the Energy programme, targeting ICT solutions for smart electricity distribution networks.
In the third programme period (2012–2013), Challenge 6 addressed topics such as the possible interaction between smart energy grids (with a focus on distribution networks) and telecommunication networks, the development of ICT tools for smart cities and neighbourhoods, of electronics in electric vehicles to foster e-mobility and of comprehensive energy management systems to enable better integration of electric vehicles in smart grids.
3.1.3. Horizon 2020: Secure, Clean and Efficient Energy
There were two channels in the Horizon 2020 Programme that were relevant for funding research about electricity grids issues: Work programme 10. Secure, clean and efficient energy and 7. Innovation in SMEs with the H2020 SME Instrument.
Two of three programme periods were analysed: 2014–2015 and 2016–2017, under the Work programme 10. During the first period, the work programme funded projects in three calls: ”Energy Efficiency“, ”Competitive Low-Carbon Energy“ and ”Smart Cities and Communities“, particularly the two last ones with relevance for electricity grid research [
42]. This work gave applicants more freedom to suggest innovative solutions to outlined challenges, and the topics were generally broader and allowed several approaches. Under “Competitive Low-Carbon Energy” research about Modernising the European electricity grid was funded, and here is especially relevant research about the distribution grid and the retail market (LCE-7-2014). The call also funded projects to increase flexibility through enhanced energy storage technologies and the interaction of local small-scale storage with the electricity grid (LCE-8-2014). Both had relevance for research about distribution grids and electricity grids in general. Transmission grid research was funded through the same call on Modernising the European electricity grid, but here about meshed offshore-grids (LCE-5-2015) and transmission grids and wholesale electricity market (LCE-6-2015). Besides these targeted calls, the work programme also invited larger projects which could, through joint actions, demonstrate pre-commercial innovative energy solutions on smart grids in an ERA-NET of regional and European smart grid initiatives (LCE-18-2014/15).
In the second work programme period, the call ”Competitive Low-Carbon Energy“ again was most relevant for grid-related research, with three topics especially relevant for both distribution grid research and generic grid research and combining both: Next generation innovative technologies enabling smart grids, storage and energy system integration with an increasing share of renewables (LCE-1-2016/17), Demonstration of smart grid, storage and system integration technologies with an increasing share of renewables (LCE-2-2016) and Support to R&I strategy for smart grid and storage (LCE-3-2016) [
43]. In the same call for 2017, funding was provided for four projects on system integration with smart transmission grid and storage technologies with an increasing share of renewables (LCE-4-2017) and six projects targeting tools and technologies for coordination and integration of the European energy system (LCE-5-2027).
The last period of the work programme included a comprehensive call about the Smart citizen-centred energy system, including several topics relevant for grid research, such as smart grids and energy islands, but also regional cross-border cooperation in transmission grids and a call about smart cities and communities targeting smart neighbourhoods, as well as issues related to distribution grids. We did not download any data from this programme period.
In the Horizon 2020 Programme, several topics were tailored to the needs of SMEs, particularly the SME instrument Phase 1 and Phase 2. While there was a rather high number of projects with relation to energy grids (altogether 26) funded in Phase 1, which funded exploration and assessment of the technical feasibility and commercial potential of new innovation, the funding sum pro project in phase 1 was rather low: 50,000 € pro project. In phase 2, which helped firms develop their business concepts further into a market-ready product, service or process, there were fewer projects on electricity grids in our sample (5 projects), but funding became much higher.
In the first programme period (2014–2015), the working programme highlighted more generally the possibilities for funding related to the different societal challenges, among them also 10. Energy, specifically, stimulates SMEs’ innovation potential for a low carbon energy system [
45]. In the second programme period (2016–2017), this was much more specified, listing a range of topics related to “Secure, Clean and Efficient Energy”, among them smart cities, low-carbon electricity supply and the single, smart European electricity grid [
46] (p. 7f.).
3.2. Social Network Analysis of Identified Projects
For this paper we provide just the analysis for projects funded under FP6 and FP7. The subsections provide short summaries about main indicators for the two framework programmes, distinguishing between distribution grid projects (Code 1), transmission grid projects (Code 2) and generic grid projects (Code 3) for both programmes—see
Table 4 and
Table 5.
3.2.1. FP6
Distribution Grid Projects
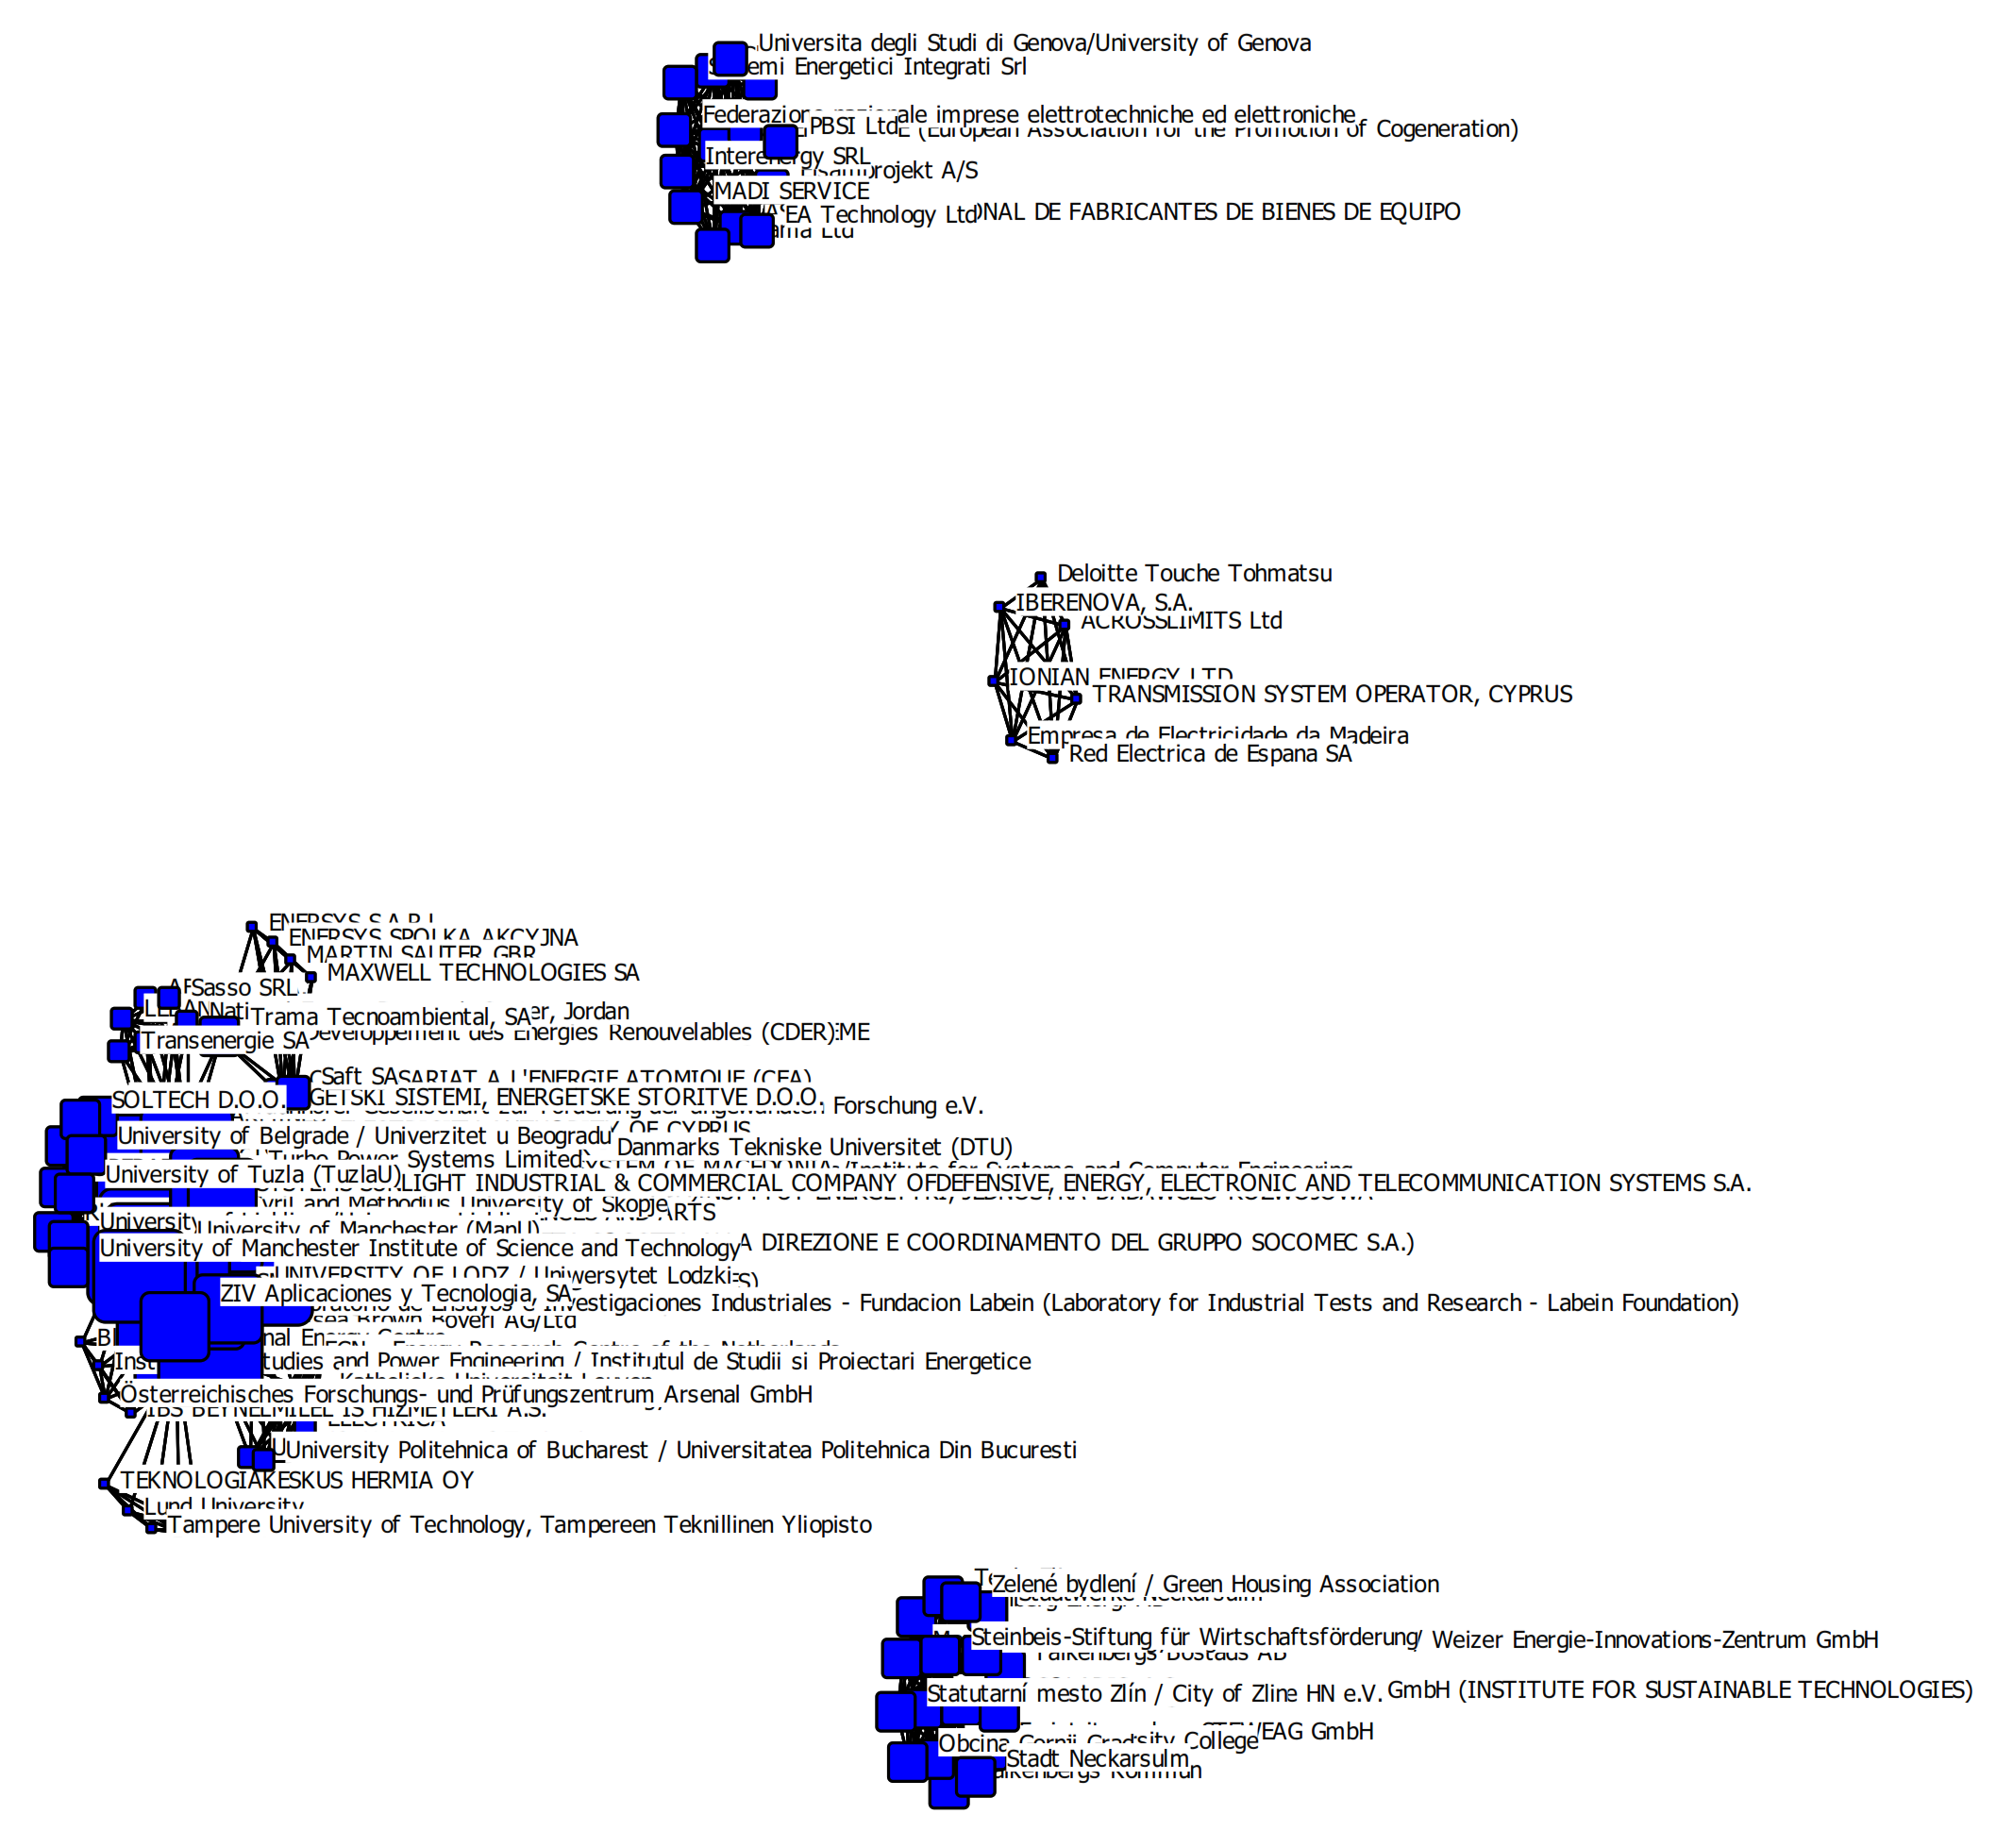
The social network analysis revealed four sub-networks for distribution grids under FP6, consisting of 111 nodes.
Figure 2 is a visual expression of all four sub-networks, based on Freeman degree centrality. The smallest sub-network (in the centre) consists of seven nodes (based on one project), the upper sub-network consists of 14 nodes (based on one project), the sub-network at the bottom consists of 17 nodes (all based on one project).
There are 11 FP6 projects about distribution grids. All of them include more than one participant. Those 11 are included in the social network analysis. The SNA for the FP6 distribution grid projects identified 111 nodes. The SNA identified four sub-networks. The overall fragmentation of the FP6 distribution projects network is 0.529. The average density of the network is 0.0061, with a standard deviation of 0.0068.
What can we say about the participants in the distribution grid projects? The network consists of 111 nodes, the main part—47% of all the participants—is a private corporation. Research organisations follow, with 18%, other types of organisations with 17% and higher education institutions with 16%. Public agencies (3%) are not very prominent in the network.
Key statistics:
Number of projects analysed: 11
Number of interlinking projects: 11
Number of sub-networks: 4
Number of networked nodes: 111
Average network density (matrix average) = 0.0061
- ○
Standard deviation = 0.0068
Fragmentation of the network: 0.529
- ○
Distance-Weighted Fragmentation: 0.711
Size of largest sub-network: 73 nodes based on eight projects
Transmission Grid Projects
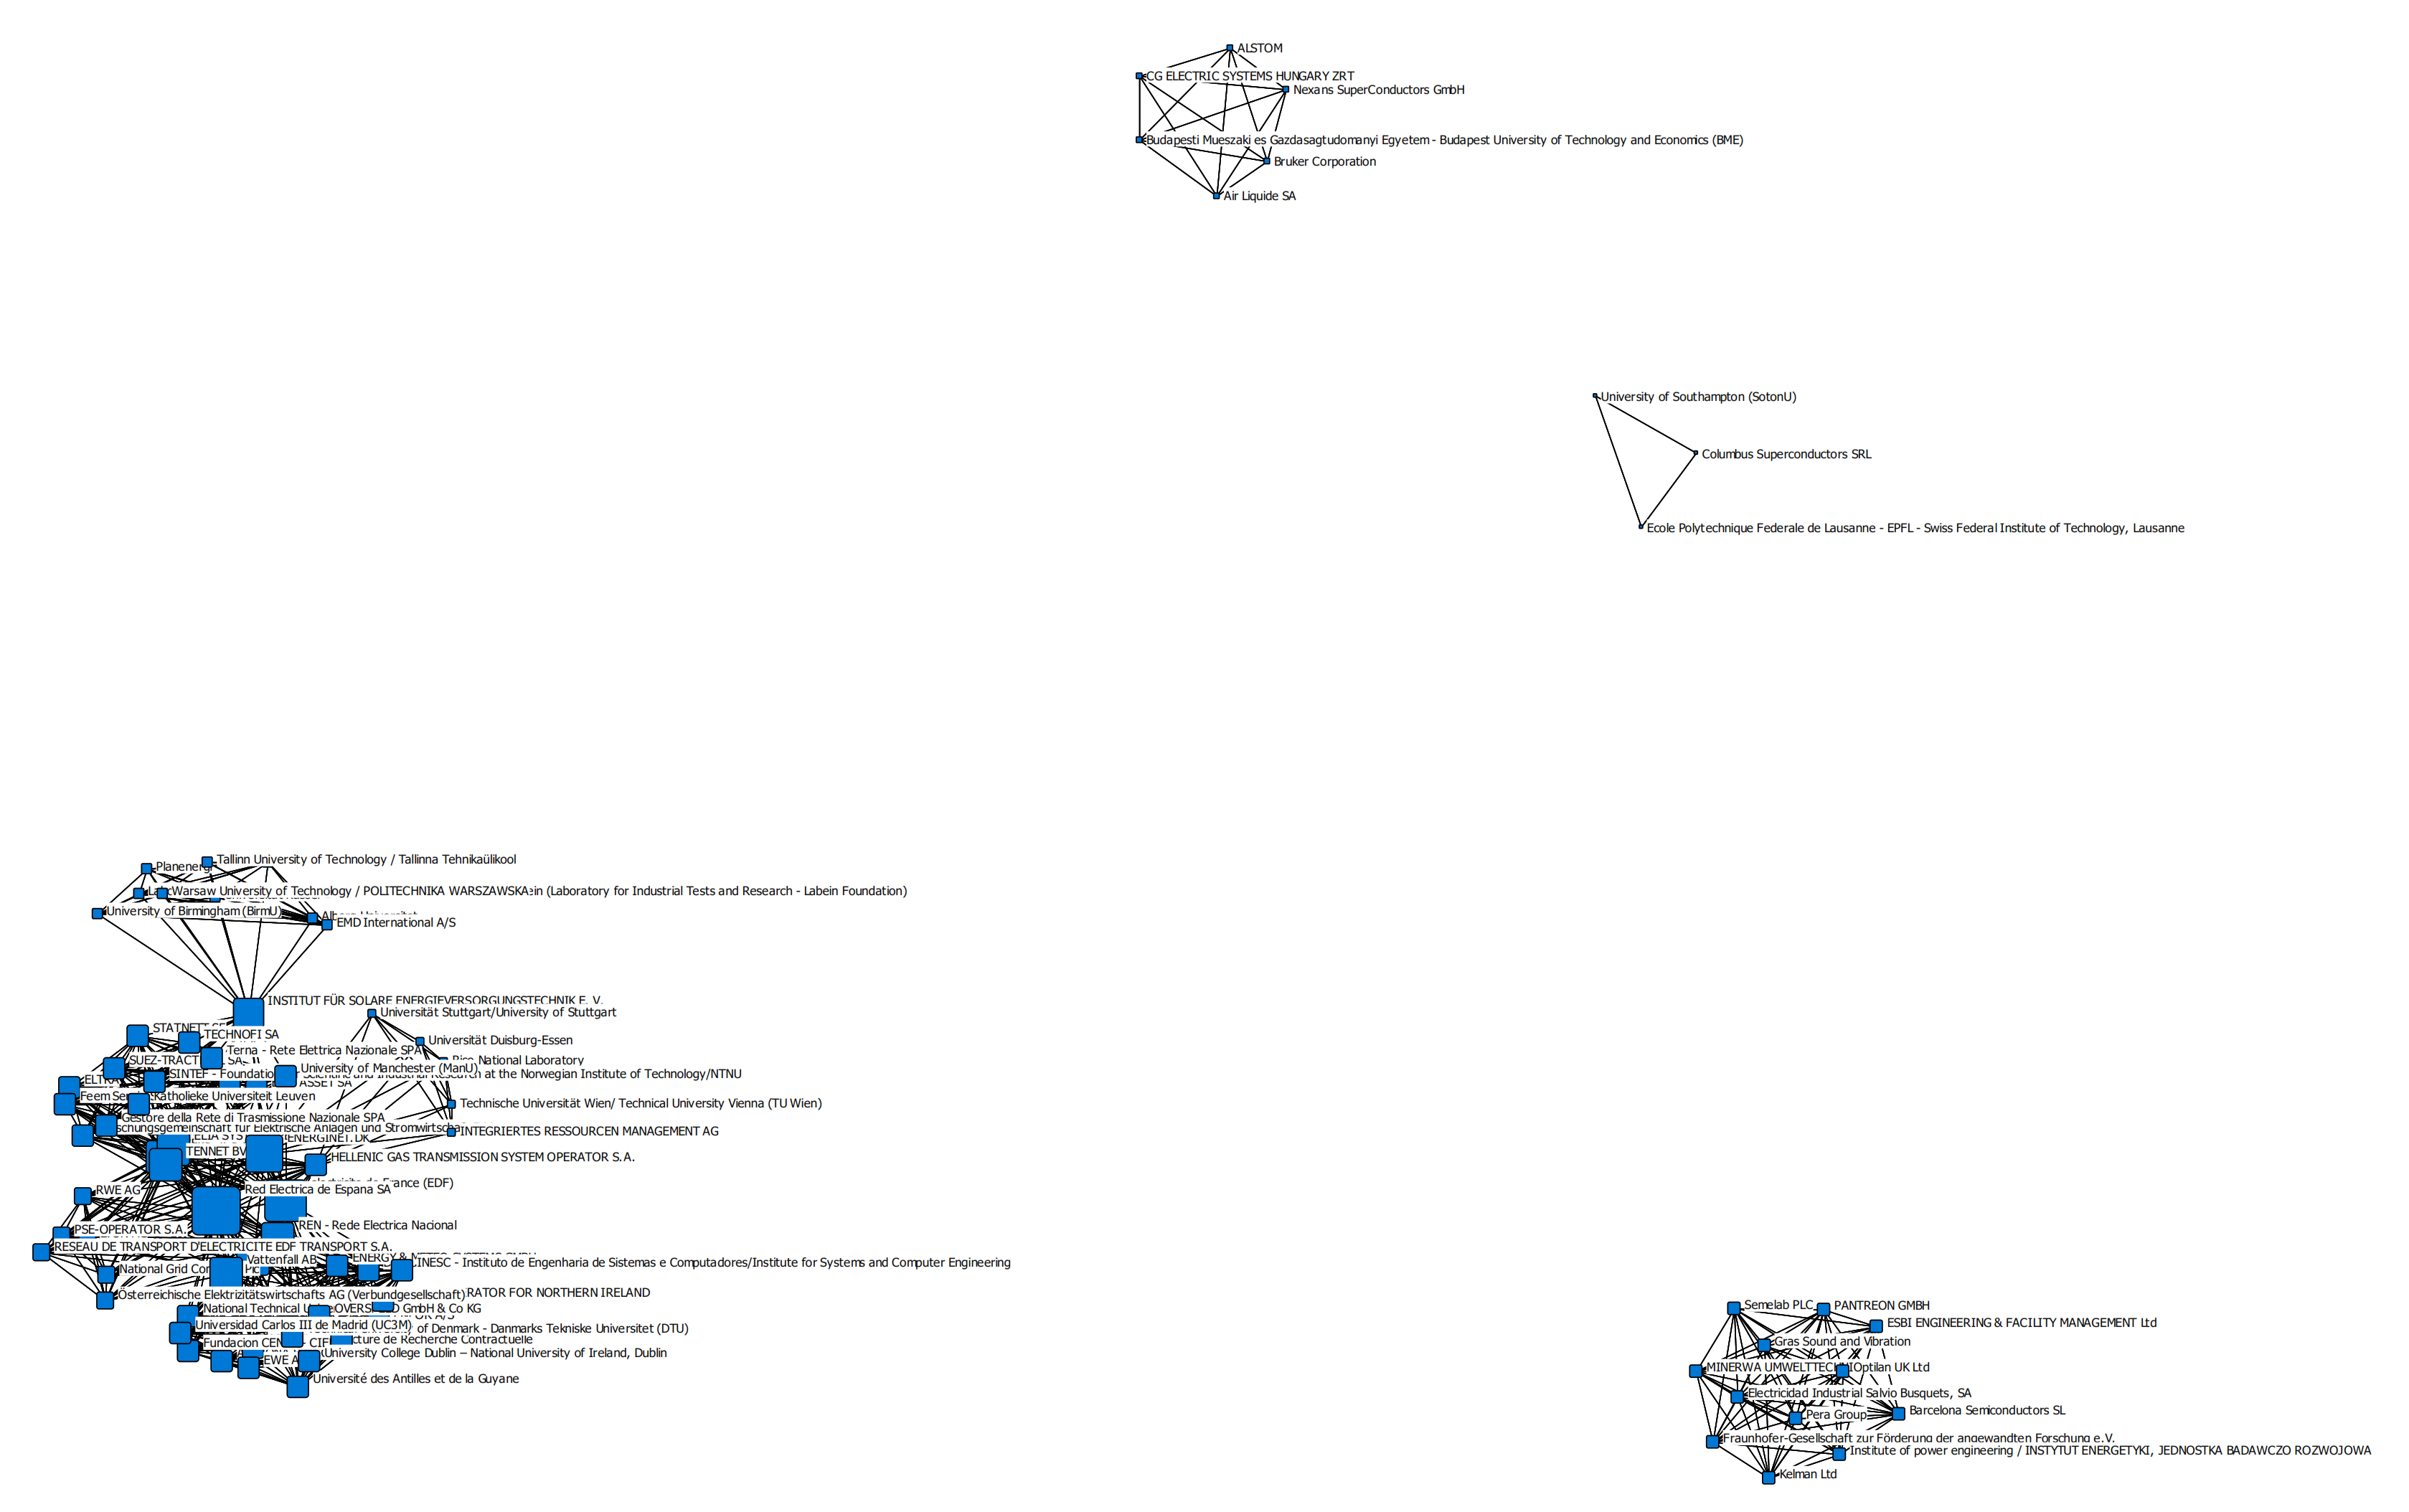
The social network analysis revealed four sub-networks for transmission grids under FP6, consisting of 81 nodes.
Figure 3 is a visual expression of all four sub-networks, based on Freeman degree centrality. The smallest sub-network (in the centre) consists of 3 nodes (based on one project), the upper sub-network consists of 6 nodes (based on one project) and the sub-network at the bottom consists of 12 nodes (based on one project). The largest network includes 60 nodes.
There are eight FP6 projects about transmission grids; all of these include more than one participant. Those eight projects are included in the social network analysis. The SNA for the FP6 transmission grid projects identified 81 nodes. The SNA identified four sub-networks. The overall fragmentation of the FP6 distribution projects network is 0.428. The average density of the network is 0.0063 with a standard deviation of 0. 0126.
What can we say about the participants in the transmission grid projects? The network consists of 81 nodes, the main part—52% of all the participants—is a private corporation. Higher education institutions follow with 23%, other types of organisations and research organisations with 12%. Public agencies (3%) are not included in the network.
Key statistics:
Number of projects analysed: 8
Number of interlinking projects: 8
Number of sub-networks: 4
Number of networked nodes: 81
Average network density (matrix average) = 0.0063
- ○
Standard deviation = 0.0126
Fragmentation of the network: 0.428
- ○
Distance-Weighted Fragmentation: 0.634
Size of largest sub-network: 60 nodes based on five projects
Generic Grid Projects
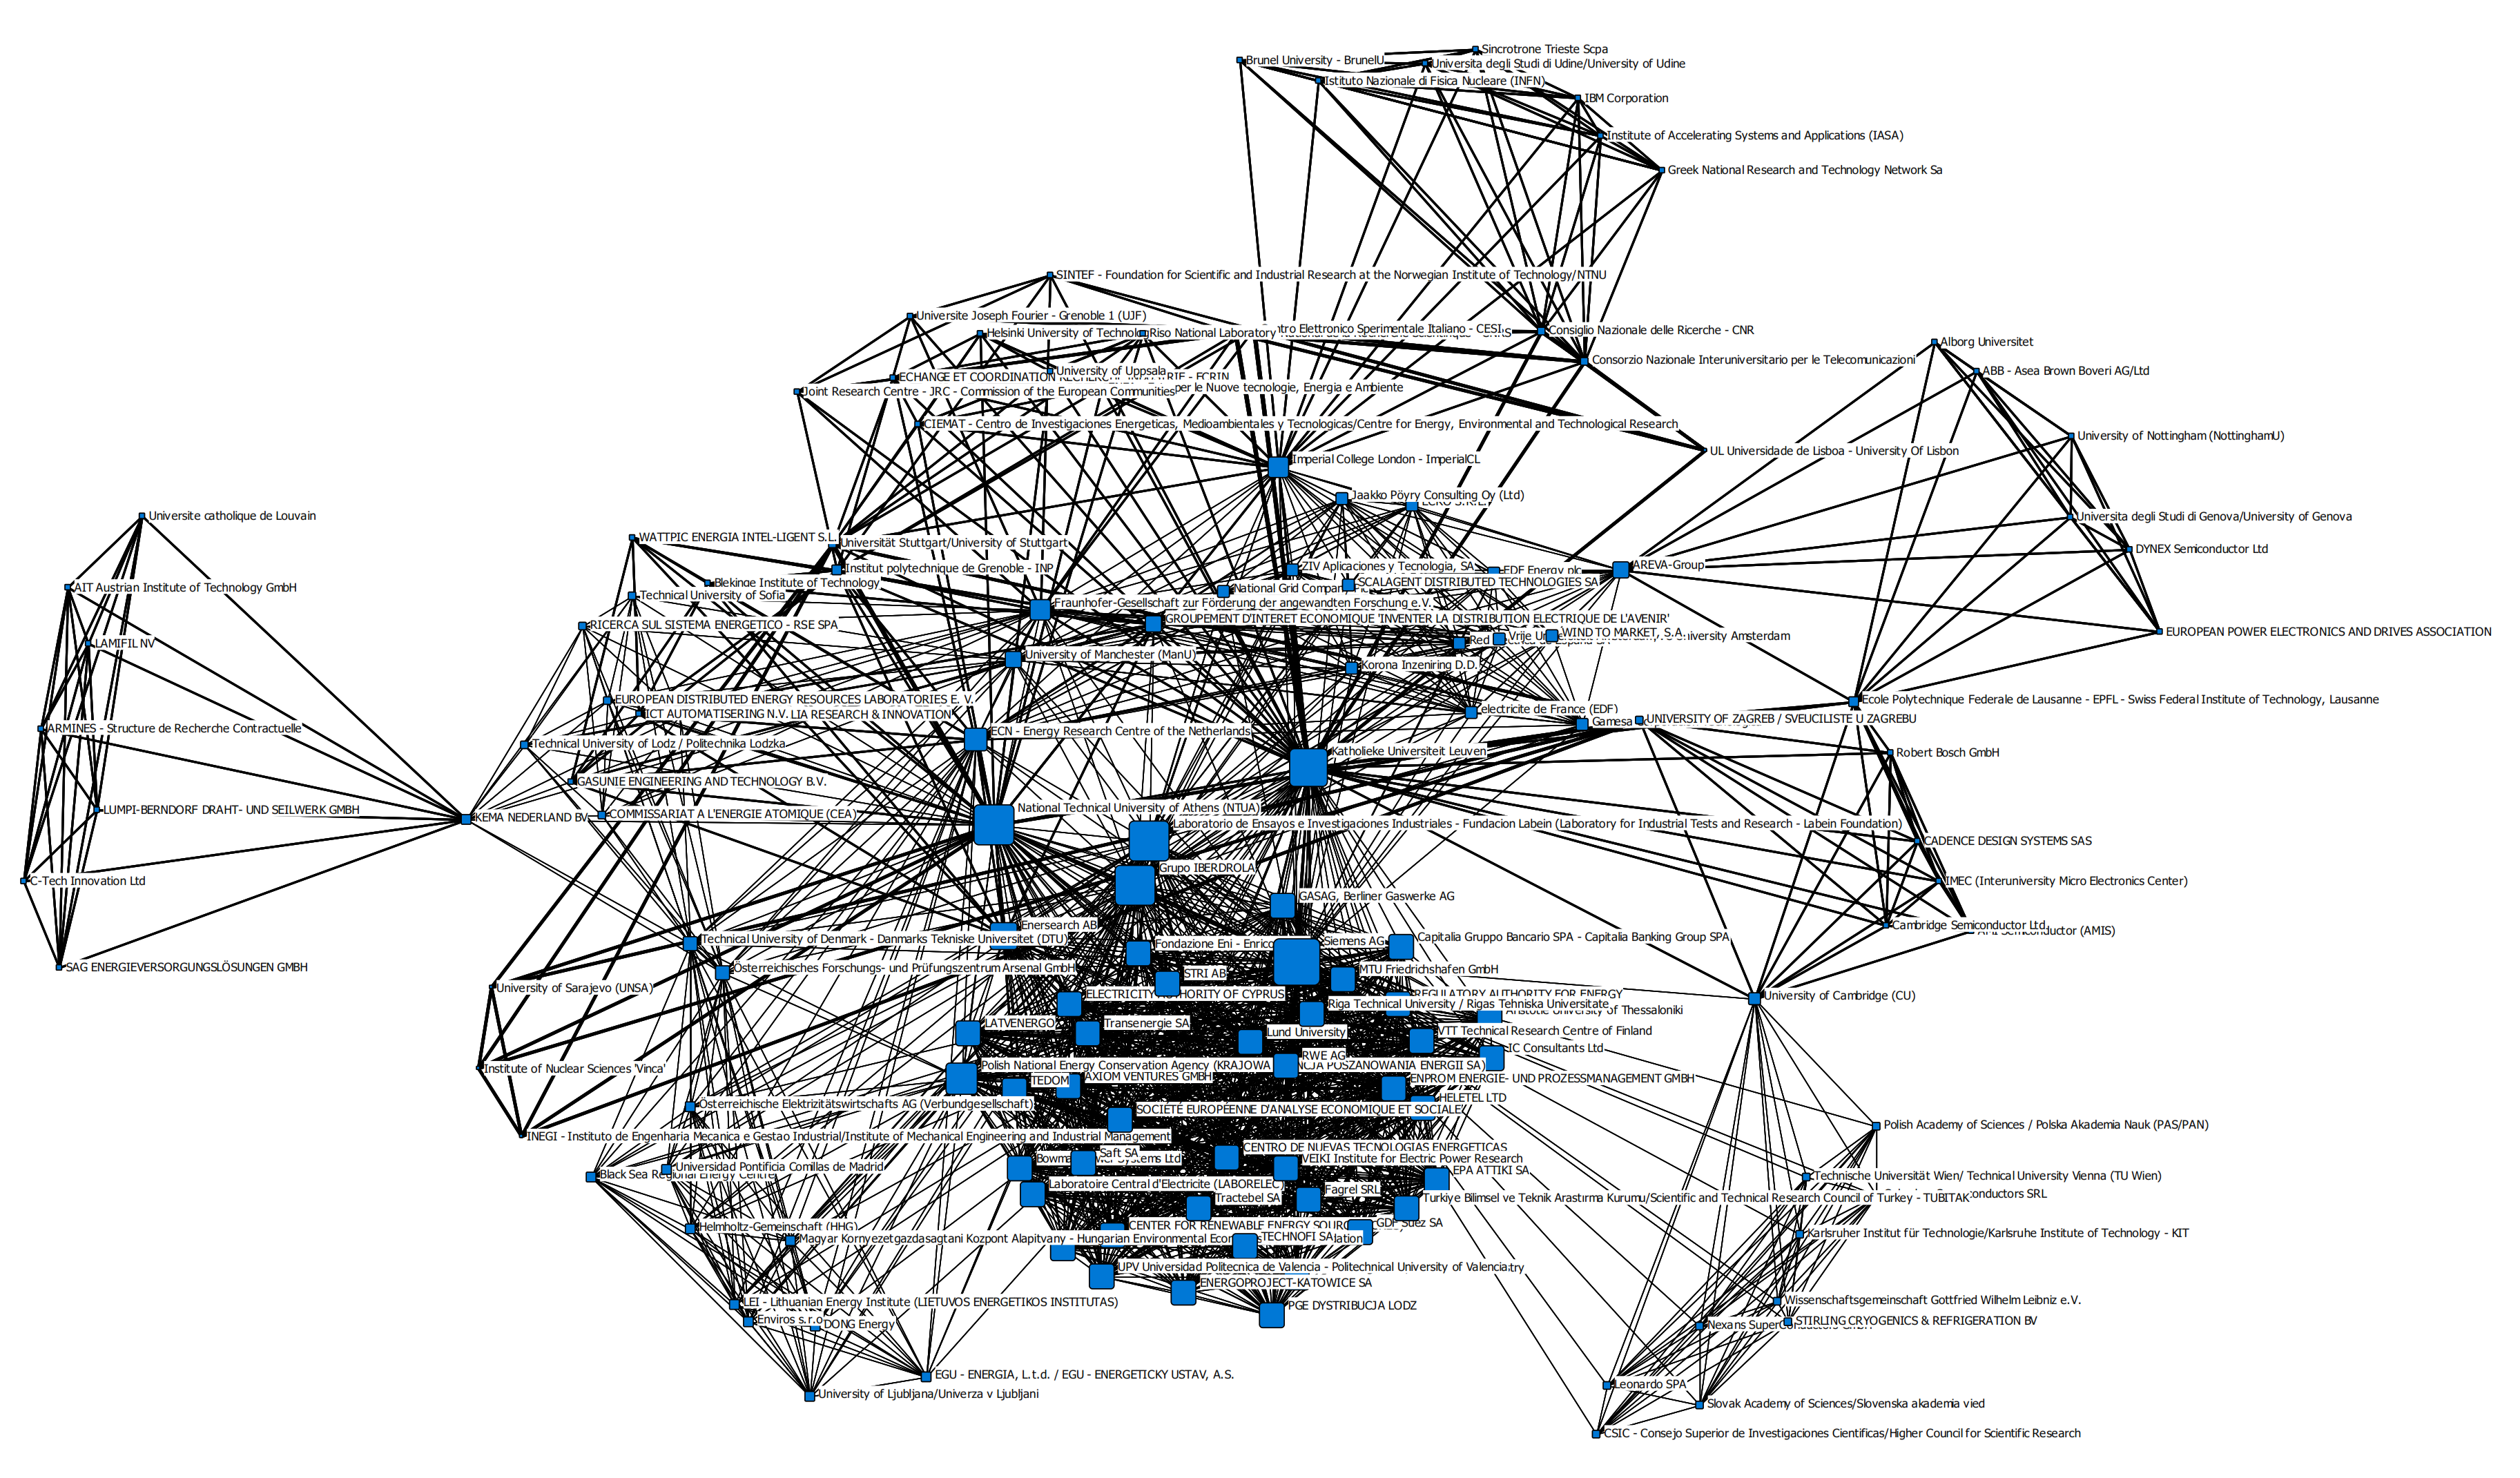
The social network analysis revealed one networks for generic grid projects under FP6, consisting of 142 nodes.
Figure 4 is a visual expression of this network, based on Freeman degree centrality.
There are 14 FP6 projects about generic grids. All of them include more than one participant. Those 14 are included in the social network analysis. The SNA for the FP6 generic grid projects identified 142 nodes. The SNA identified one network. The overall fragmentation of the FP6 generic grid projects network is 0.000. The average density of the network is 0.0042 with a standard deviation of 0.0066.
The network consists of 142 nodes, the main part—41% of all the participants—is a private corporation. Research organisations follow with 29% and higher education institutions with 25%. Other types of organisations (4%) and public agencies (1%) are not central in the network.
Key statistics:
Number of projects analysed: 14
Number of interlinking projects: 14
Number of sub-networks: 1
Number of networked nodes: 142
Average network density (matrix average) = 0.0042
- ○
Standard deviation = 0.0066
Fragmentation of the network: 0.000
- ○
Distance-Weighted Fragmentation: 0.467
Size of largest sub-network: 142 nodes based on 14 projects
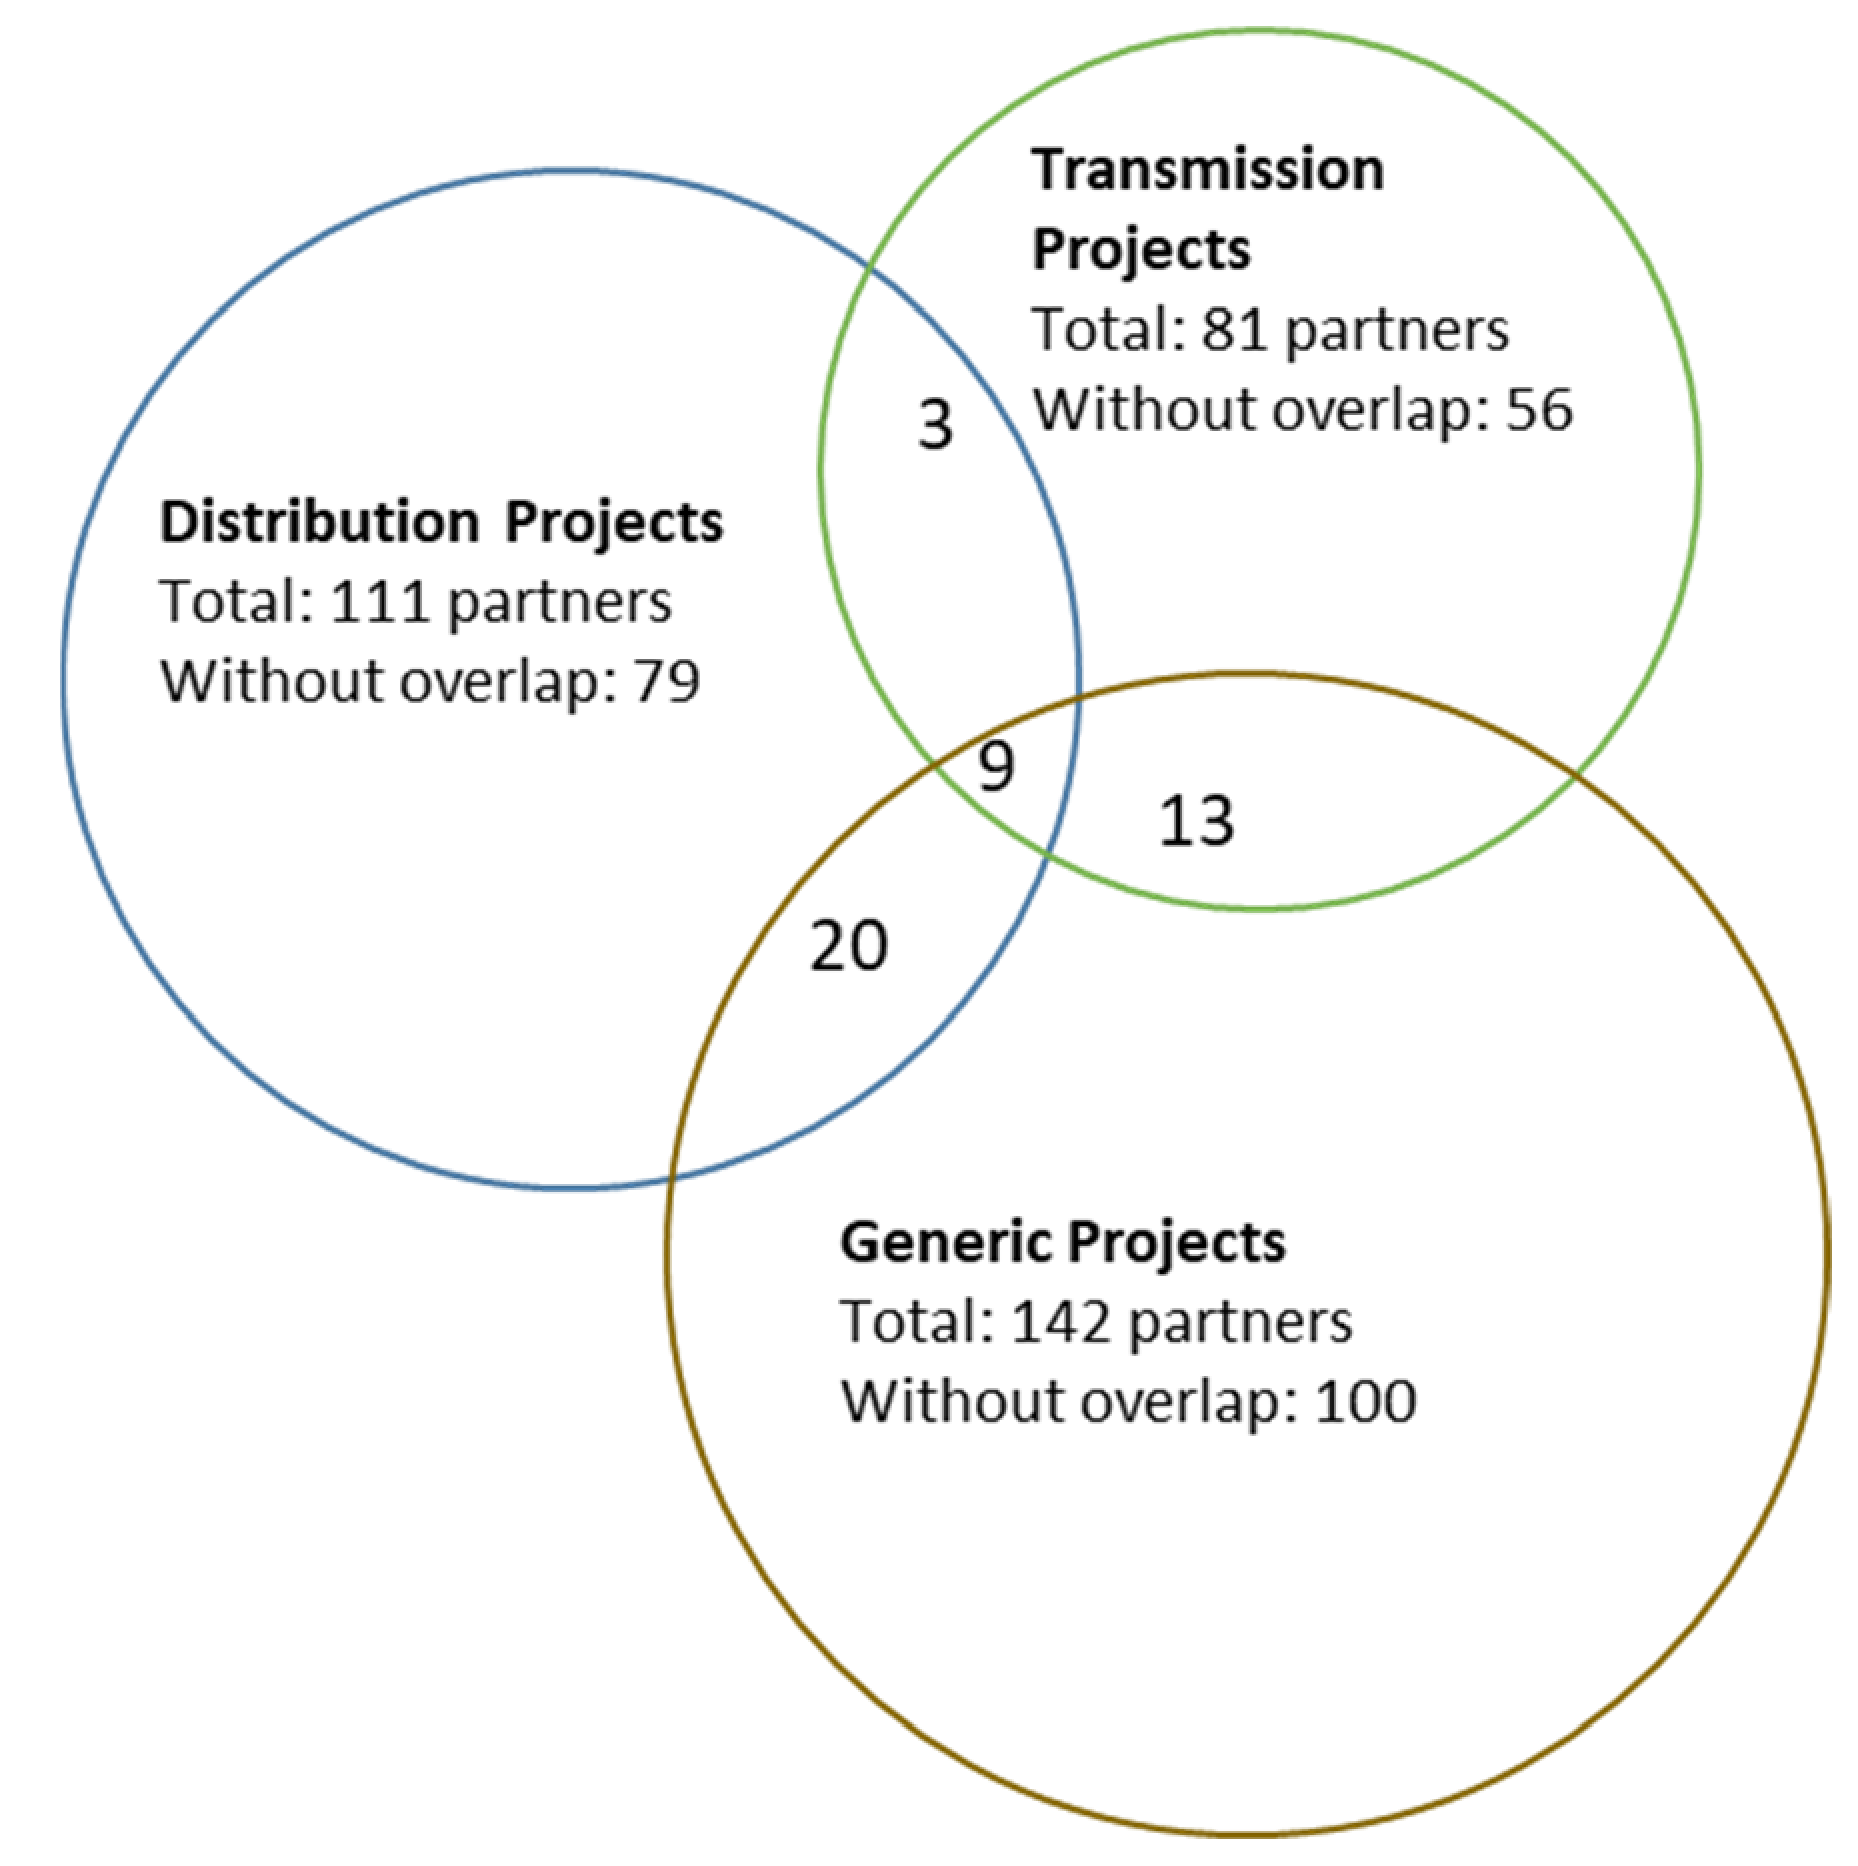
Overlap between the Three FP6 Samples
There is some overlap between the three FP6 samples: organisations that are part of distribution grid projects are also part of transmission grid projects and/or of generic grid projects. The following
Figure 5 shows these different overlaps. There are just nine organisations engaged in all three types of projects and the overlap is smallest between distribution grid and transmission grid projects compared to the two other options.
Which are those nine organisations active in all three types of projects? They are mostly universities. Private companies are less prominent, but the most active research organisations are even more active than universities.
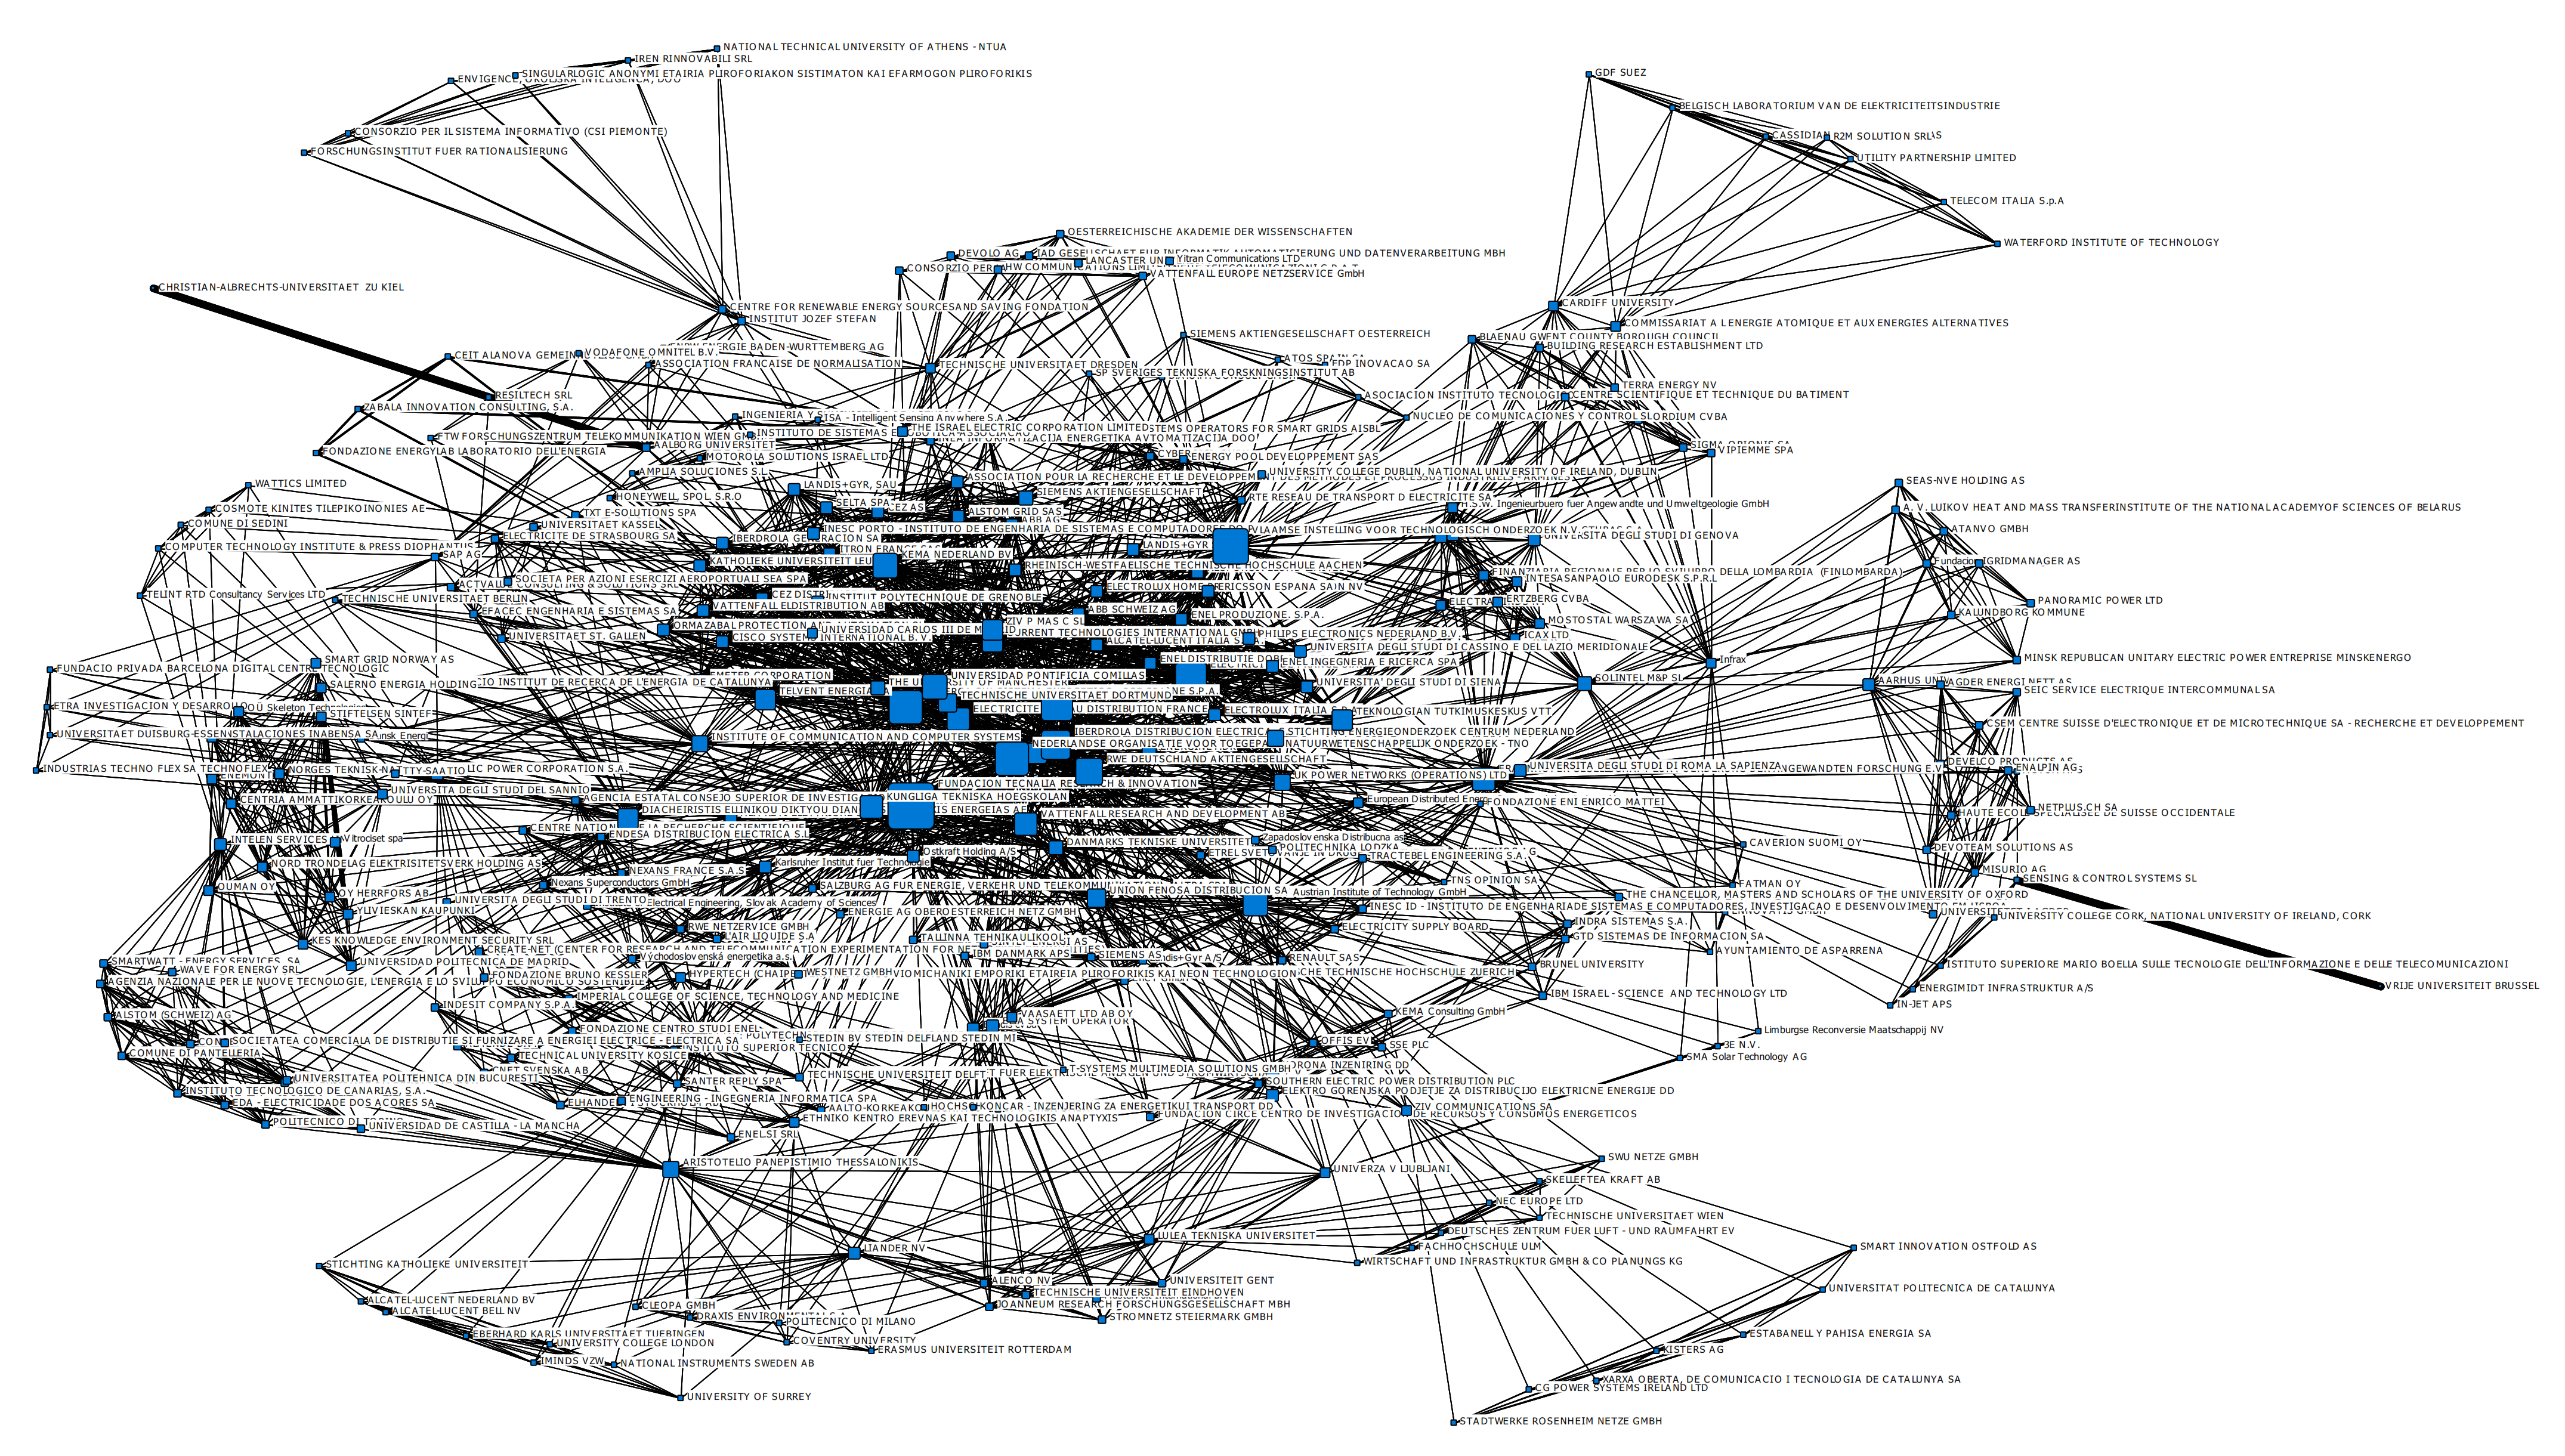
3.2.2. FP7
Distribution Grid Projects
The social network analysis revealed two sub-networks for distribution grids under FP7, one sub-network consisting of just two nodes and the other sub-network consisting of 337 nodes.
Figure 6 is a visual expression of the larger sub-network, based on Freeman degree centrality.
There are 48 FP7 projects about distribution grids. Forty-six of them include more than one participant. Those 46 are included in the social network analysis. The SNA for the FP7 distribution grid projects identified 339 nodes based on these 46 projects. The SNA identified two sub-networks; one of them included just two partners and was excluded. The overall fragmentation of the FP7 distribution projects network is 0.012. The average density of the network is 0.0081 with a standard deviation of 0.01730.
What can we say about the participants in the distribution grid projects? The network consists of 339 nodes, the main part—204 or 60% of all the participants—is a private corporation. Higher education institutions follow with 70 nodes (21%) and research organisations with 51 nodes (15%). Public agencies (3%) and other nodes (1%) are not very prominent in the network.
Key statistics:
Number of projects analysed: 48
Number of interlinking projects: 46
Number of sub-networks: 2
Number of networked nodes: 339
Average network density (matrix average) = 0.0081
- ○
Standard deviation = 0.01730
Fragmentation of the network: 0.012
- ○
Distance-Weighted Fragmentation: 0.590
Size of largest sub-network: 337 nodes based on 45 projects
Transmission Grid Projects
The social network analysis revealed two sub-networks for transmission grids under FP7, one sub-network consisting of seven nodes and the other sub-network consisting of 201 nodes.
Figure 7 is a visual expression of the larger sub-network, based on Freeman degree centrality.
There are 22 FP7 projects about transmission grids. Nineteen of them include more than one participant. Those 19 are included in the social network analysis. The SNA for the FP7 transmission grid projects identified 208 nodes based on 19 projects out of 22 projects. The SNA identified two sub-networks; one of them included seven partners and was excluded for the graphical presentation. The overall fragmentation of the FP7 transmission projects network is 0.065. The average density of the network is 0.0032 with a standard deviation of 0.0041.
The network consists of 208 nodes, the main part—113, or 54% of all the participants—is a private corporation. Higher education institutions follow, with 48 nodes (23%) and research organisations with 35 nodes (17%). Public agencies (1%) and other types of nodes (5%) are not very prominent in the network.
Key statistics:
Number of projects analysed: 22
Number of interlinking projects: 19
Number of sub-networks: 2
Number of networked nodes: 208
Average network density (matrix average) = 0.0032
- ○
Standard deviation = 0.0041
Fragmentation of the network: 0.065
- ○
Distance-Weighted Fragmentation: 0.496
Size of largest sub-network: 201 nodes based on 18 projects
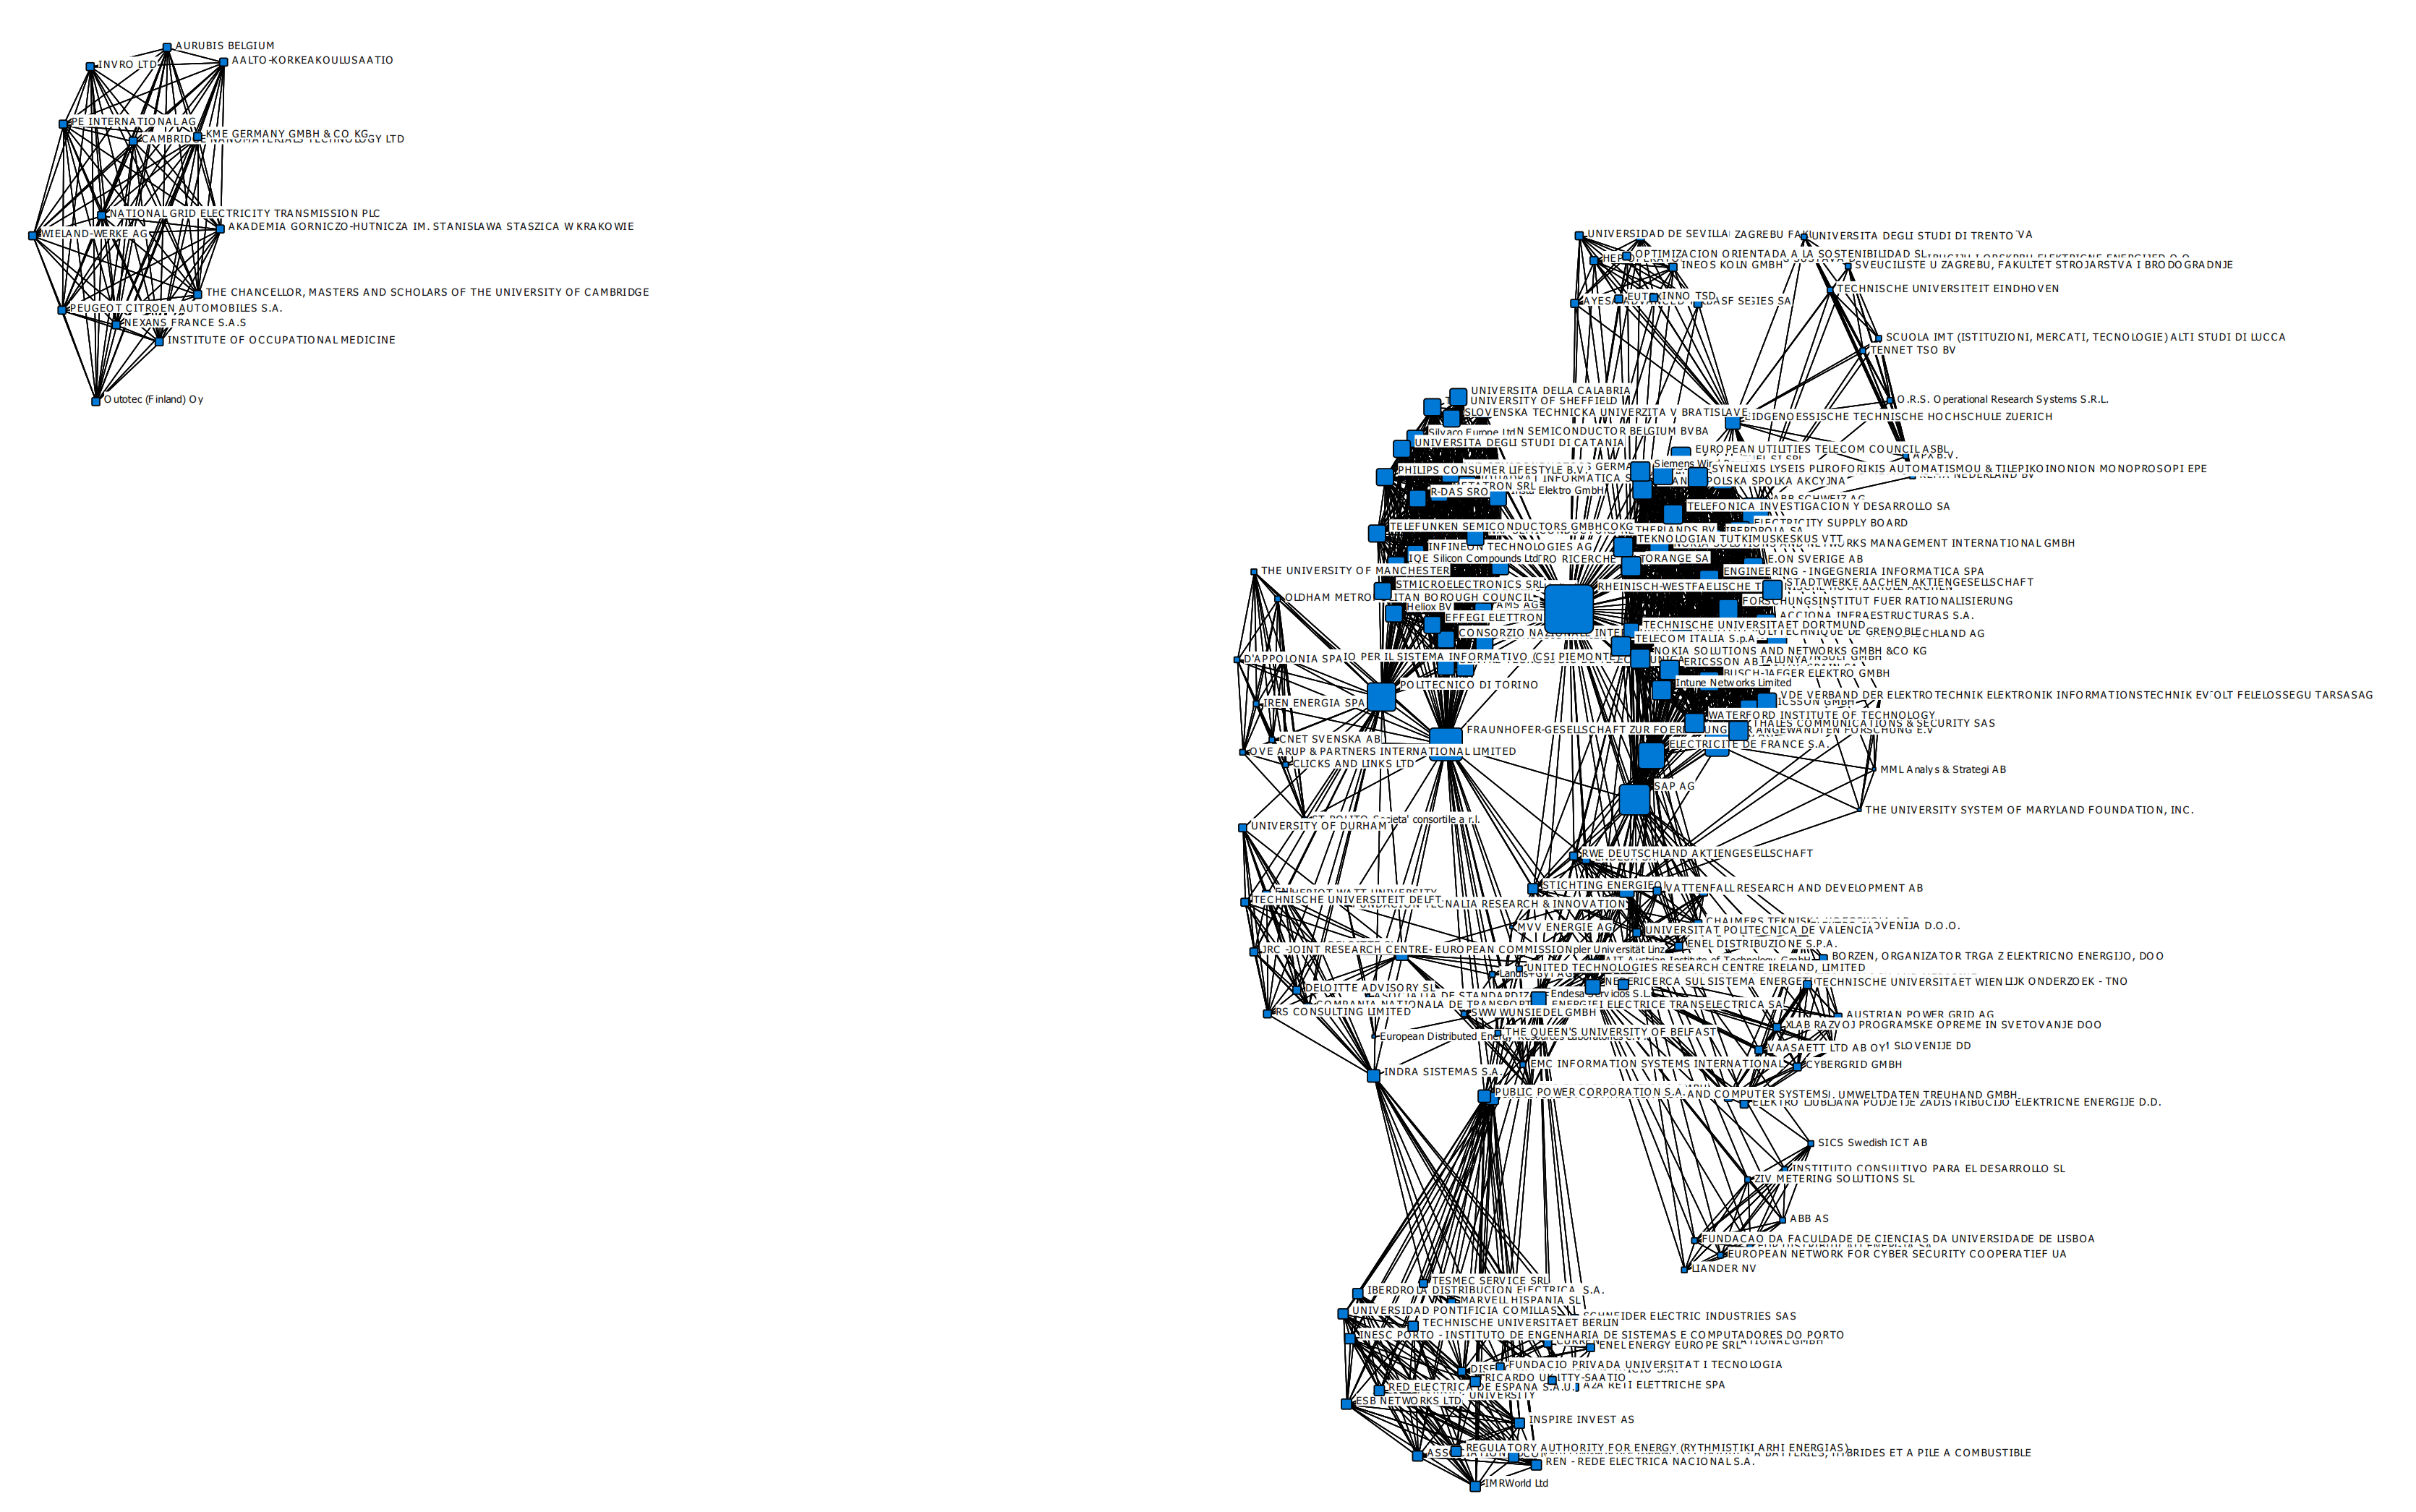
Generic Grid Projects
The social network analysis revealed six sub-networks for generic grids under FP7. The smaller sub-networks consist of three, four, six and seven nodes. The second largest sub-network consists of 14 nodes and the largest sub-network consists of 178 nodes. The SNA identified six sub-networks; four included seven or fewer partners and were excluded in the graphical presentation.
Figure 8 is a visual expression of the two larger sub-networks, based on Freeman degree centrality.
There are 28 FP7 projects about generic grids. Twenty of them include more than one participant. Those 20 are included in the social network analysis. The SNA for the FP7 generic grid projects identified 212 nodes based on 20 projects out of 28 projects. The overall fragmentation of the FP7 generic projects network is 0.290. The average density of the network is 0.0050 with a standard deviation of 0.0100. The network consists of 212 nodes, the main part—136 or 64% of all the participants—is a private corporation. Higher education institutions follow, with 42 nodes (20%), and research organisations with 24 nodes (11%). Public agencies (2%) and other types of nodes (2%) are not very prominent in the network.
Key statistics:
Number of projects analysed: 28
Number of interlinking projects: 20
Number of sub-networks: 6
Number of networked nodes: 212
Average network density (matrix average) = 0.0050
- ○
Standard deviation = 0.0100
Fragmentation of the network: 0.290
- ○
Distance-Weighted Fragmentation: 0.662
Size of largest sub-network: 178 nodes based on 15 projects
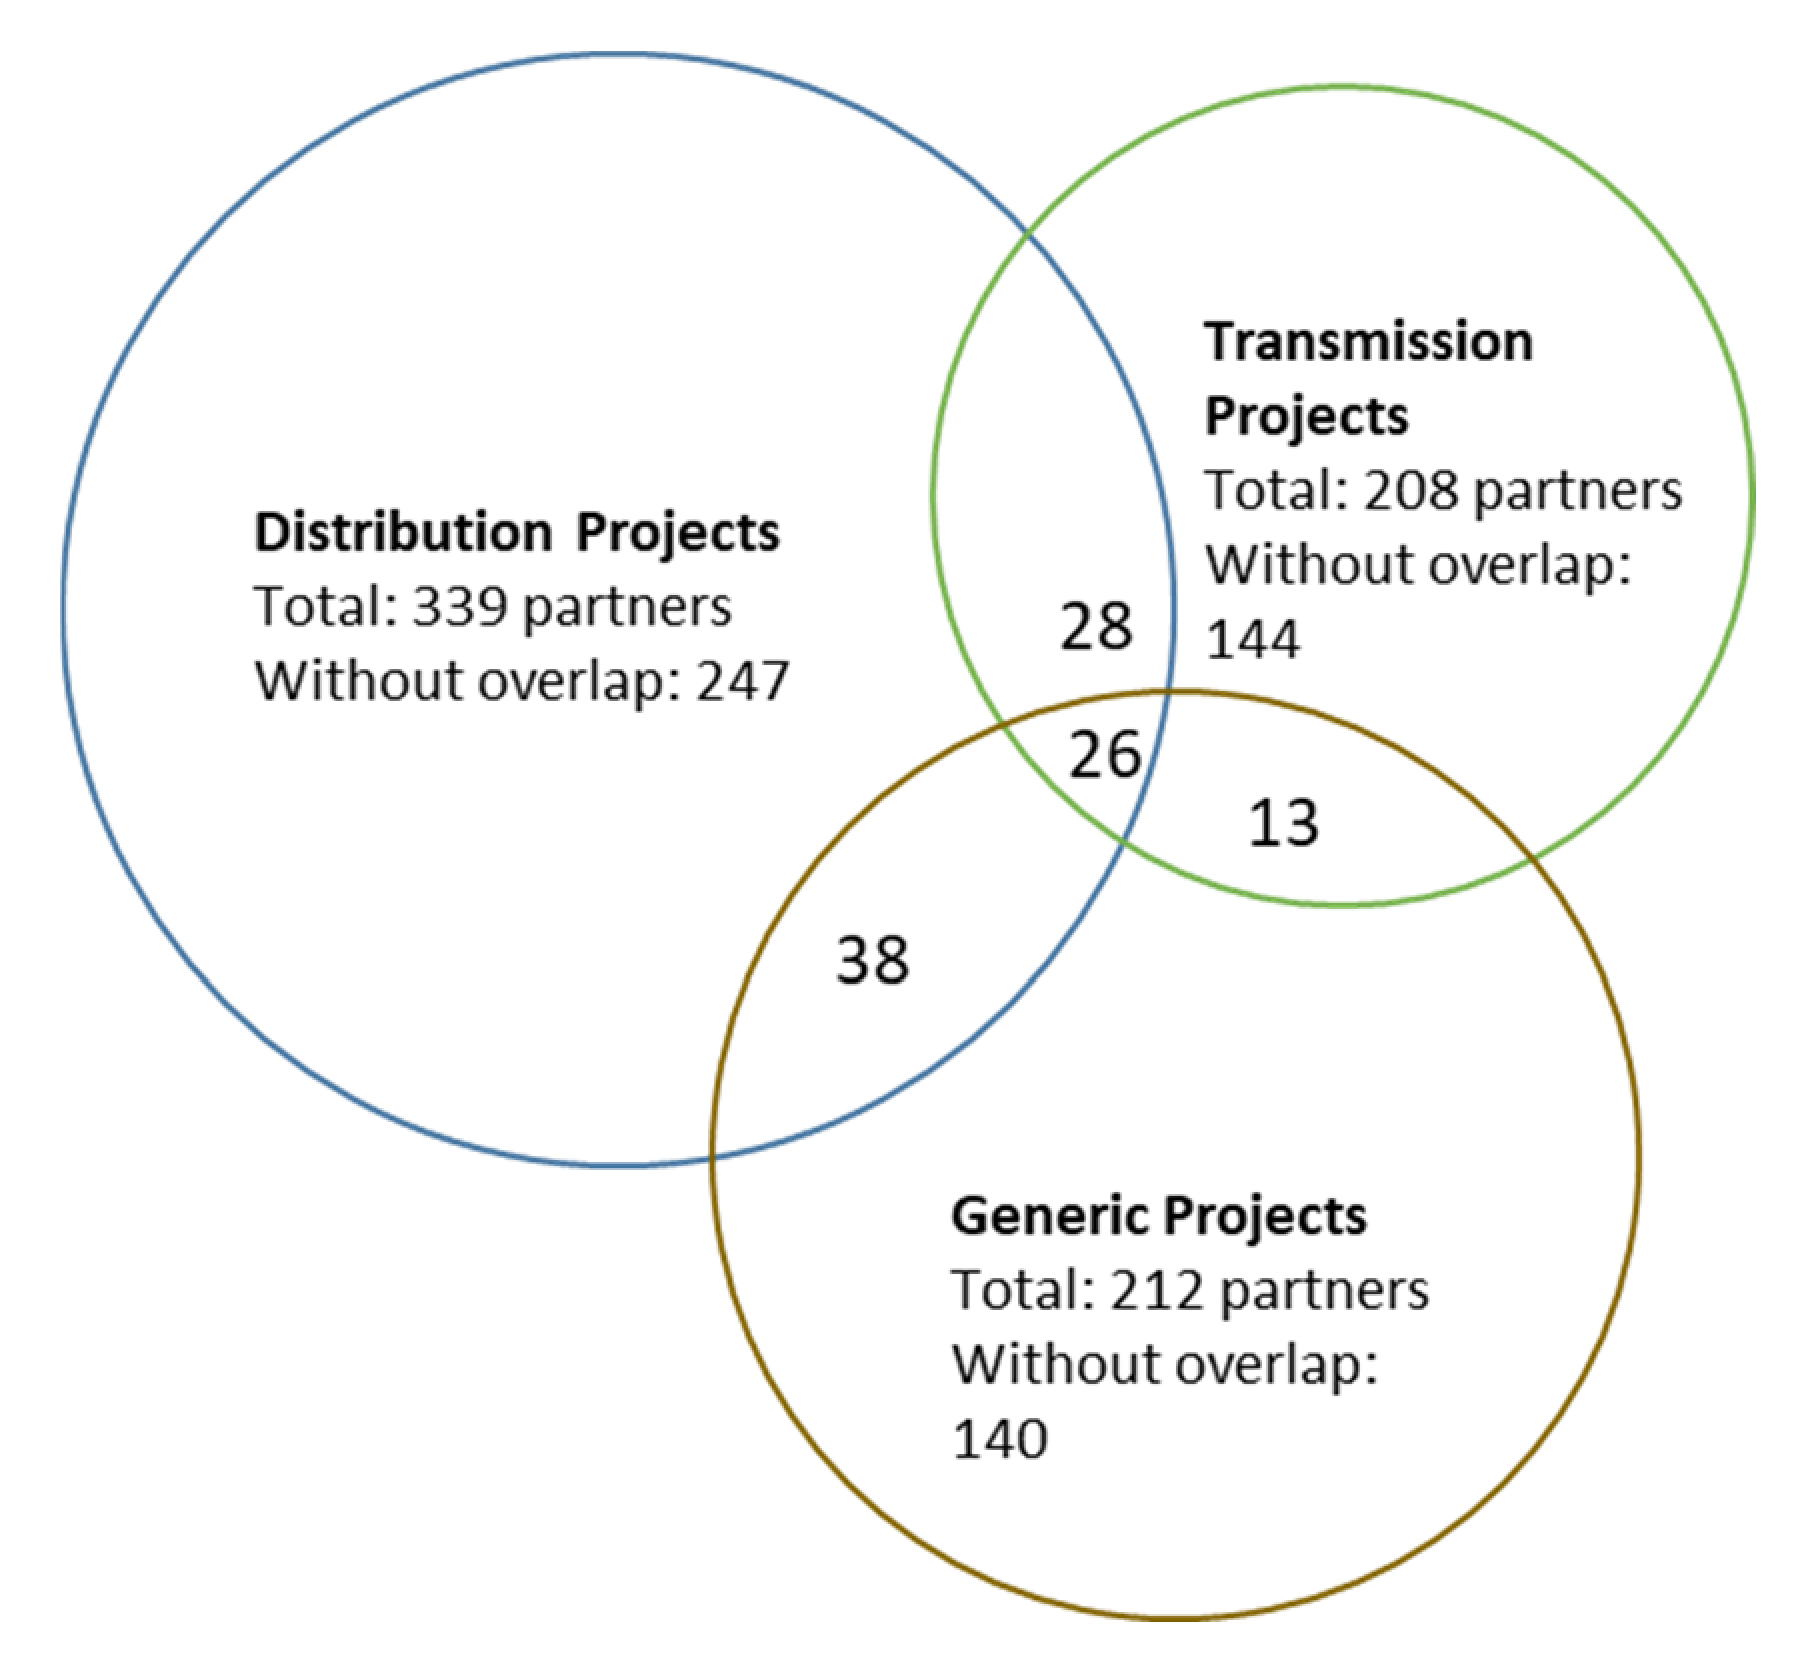
Overlap between the Three FP7 Samples
There is some overlap between the three FP7 samples: organisations that are part of distribution grid projects are also part of transmission grid projects and/or of generic grid projects. The following figure shows these different overlaps of participating organisations. There are just 26 organisations engaged in all three types of projects. The overlap is smaller between transmission and generic grid projects than the overlap between distribution grid projects and generic grid projects (
Figure 9).
The higher overlap between distribution and generic projects must be understood based on the increased focus on information and communication technology and generic grid issues under FP7 (see
Section 2.2).
Which are those 26 organisations active in all three types of projects? They are mostly universities. An explanation for the dominance of universities could be that universities encompass different departments which might address different types of the FP7 projects, which is not distinguished in this analysis. This factor might also be a limitation of this analysis. Private companies are less prominent, but the most active research organisations are even more active than the universities (RICERCA SUL SISTEMA ENERGETICO and FUNDACION TECNALIA RESEARCH & INNOVATION in Spain and FRAUNHOFER in Germany).
3.3. Funding of Electricity Grid Ressearch
Table 6 summarises the funding on electricity grid issues by the three framework programmes since 2002. Here, it is shown that transmission projects never were a top priority, neither in terms of the number of projects nor funding. The same trend can be seen for the networked projects analysed in the SNA (see
Table 7). Furthermore, transmission grid projects are less visible.
However, these results must be interpreted with care: (a) The last projects under Horizon 2020 starting in 2020 and 2021 are not included here, which means that funding will increase for grid issues in Horizon 2020. (b) There is a tendency to cover several of the three areas in one project, especially over the last three years. The distinctions between the three areas have become much more in flux.
4. Discussion and Conclusions
While the last data on Horizon 2020 projects are not included, the results allow us to answer our research question: Has the importance of transmission grid vs. distribution grid changed over time? Yes, the importance has changed over time, but transmission grid research is still important, but very often linked with generic issues.
The development of the analytical focus in the framework programmes has changed as follows: The FP6 research topics covering distribution grid and generic issues are highly linked in the work programme. The same applies to transmission grid and generic issues, but to a lesser extent. In the updated programme, distributed electricity generation, the security of the distribution grid and management of electricity grids linked to decentralised electricity generation became central. In particular, the latter was linked to innovative control technologies and intelligent management systems, which in turn pointed to the need for ICT, which was emphasised in FP7.
In the FP7, the focus was put on smart energy networks not just smart grids but advanced energy networks in general, including research on distribution grids and more generic technologies but also transmission grids. The distinction made by FP7 between interactive distribution networks, a smart Pan-European transmission network and more generic and cross-cutting issues such as energy network assets management etc., can be seen as the paradigm behind the classification which we applied in our research on energy grids. In FP7, however, the close interaction with the ICT work programme became important: first on the integration of smart houses and smart grids in local electricity grids through smart ICT-devices, later other topics received attention, such as smart energy grids, the development of ICT-based monitoring and control systems to tackle the complex distribution grids and to enable the development of energy-positive buildings and neighbourhoods, and ICT tools for the future electricity market, including the development of virtual power plants—all issues related to either generic grid issues or distribution grids. In the third programme period, the possible interaction between smart energy grids and telecommunication networks were targeted, but also the development of ICT tools for smart cities and neighbourhoods, etc.
In Horizon 2020, more attention was on integrative solutions and the borderlines between distribution grids and generic grids or between transmission grids and generic grids became much fuzzier. Joint calls for integrative solutions made it more difficult still to disentangle the conceptual focus of the different calls.
The results also allow us to discuss the four hypotheses:
The first hypothesis claimed that we expect to see increased R&D funding to grid technologies and more focus on renewables integration. This has been confirmed in the study of the work programmes.
The second hypothesis stated that transmission grid research was prioritised. However, the results have shown that research and innovation on transmission grid was never a top priority: distribution grid and generic issues have had higher priority and transmission grid research have often been linked to them. One reason for this may be that the distribution grid is much larger than transmission grids, and that many more actors are involved.
The
third hypothesis claimed that generic electricity grid issues became much more important in the last period, since these technologies can facilitate the interaction of the whole energy system, not just at the TSO-level or at the local/regional level. This situation can be confirmed since generic electricity grid issues became much more important in the third period than in the beginning. FP6 was just a tiny start. We also observe that generic grid issues relating to ICTs overlap with both distribution and transmission projects, but to a lesser degree with transmission grid projects. This suggests that ICTs are agnostic to the direction of the transition (centralised or decentralised) [
14]. It also shows that the R&D funding pattern is compatible with the idea of SuperSmart grids where ICTs facilitate seamless interplay between centralised and decentralised solutions [
47].
Regarding the fourth hypothesis—if and how collaboration patterns changed—we want to highlight three issues:
The SNA indicators reveal that the number of sub-networks is increasing in all three areas which indicates that many new actors are entering R&D projects over the period. We also see that fragmentation has decreased for distribution grids but increased in the area of transmission grids, which points to closer collaboration patterns for distribution grid projects. We see that the average network density has increased for generic grid projects but decreased for transmission grid projects, which is another indication for closer collaboration patterns in the distribution grid projects. Networked nodes have dropped for transmission grids, but increased for generic grid projects.
The development of organisation types per programme and area shows some joint characteristics: the strong position of private corporations in all three areas over time. Differences can be found concerning other actors, with a rather high share in the first programme and for distribution and transmission grid projects, but not for generic grid projects and for public actors’ involvement in the last period for generic grid projects. The share of research organisations has decreased for all three areas, while the share of higher education institutions is more stable.
There are new linkages between energy research actors and ICT research, facilitated by joint calls. When looking at the importance of individual organisations, the results confirm other research showing that the electricity system incumbents are locked-into the traditional regime of centralised electricity grids with large-scale plants and transmission lines as their key business model and know-how. Those companies are more at the core of the transmission projects. In contrast, various non-incumbent companies, including ICT companies, municipalities and new entrants, are involved in the distribution grid and the more generic grid projects.
The distinctions between the three areas have become much more in flux over the last years. The analysis of the funded projects has shown some overlap between the three thematic areas: organisations that are part of distribution grid projects are also part of transmission grid projects and/or of generic grid projects. There is also a tendency to cover several of the three areas in one project. However, involving ICT research in grid research has become pervasive.
Overall, EU R&D funding for electricity grids has supported solutions for centralised and decentralised system configurations as well as hybrids between them. At the same time, energy market policies in the EU tend to favour a centralised pathway [
7]. Our results thus suggest that there is a ‘misalignment’ between market pull and supply push for new innovations in the energy transition in the EU.
What are the recommendations for policymakers based on this research? We can highlight the following issues:
The energy transition is a moving target, so policymakers need reflexivity and learning to continuously adapt policies to changing circumstances.
We confirm that grid innovations are crucial. Policymakers need a whole systems perspective to understand the need for complementary innovations, especially in later phases of transitions when renewable energy technologies diffuse widely [
48].
Transition policies should consider changes of actors and their social networks, such as new strategies, changes in investment patterns and coalitions and new requirements for capabilities.
As the renewable energy system becomes more distributed, many more and different types of actors such as NGOs, municipalities, trade unions and so on become important actors in the energy transition. It is thus important for the relevance and usefulness of R&D projects that this type of actors can participate. Such involvement can be achieved by specified requirements in the calls for projects.
Policy makers should be mindful of the high and increasing importance of ICT in transmission and distribution projects. ICTs are vital for establishing smart energy concepts and connecting complex transmission and distribution systems.


