Abstract
To investigate primary breakup close to an injector, this paper presents both experimental and numerical research on high-pressure common-rail diesel injection. We propose a new method named SD-ELSA model to realize automatically identifying droplet features for high-pressure diesel spray based on the classic ELSA (Eulerian Lagrangian Spray Atomization) model; this method is suitable for varied injection operation conditions. The SD-ELSA first identifies the liquid bulk due to breakup of the continuous phase in near field, and then converts the Eulerian liquid bulk into Lagrangian particles to complete the calculation of the total spray atomization. The SD-ELSA model adopts two key criteria, i.e., the sphericity (S) and the particle diameter (D); the qualified liquid mass is transformed into Lagrangian particle, realizing the coupling of the Eulerian–Lagrangian model. The SD-ELSA model illustrates the total diesel spray atomization process from the breakup liquid column to the droplets.
1. Introduction
Diesel fuel spray has been a research hotspot because the fuel injection and spray characteristics directly act on the air–fuel mixing and the subsequent combustion process. Most research focuses on the macroscopic fuel spray characteristics for better understanding the fuel injection penetration and spray process. Hiroyasu et al. [1] investigated high-speed diesel injection through a injector into a chamber by testing the fuel spray progression and measuring the breakup length, and they reported that the spray structure had two categories: incomplete and complete sprays. Our research team observed a completely high-pressure diesel spray process in a constant-volume bomb system by using a schlieren system together with a digital high-speed camera, and found that the diesel spray was a dynamic process and the spray penetration has a two-period feature [2]. Gad et al. [3] measured the diesel fuel spray characteristics using a digital camera of particle image velocimetry (PIV), and the images revealed that there was bulk liquid fuel in the spray as the spray was not stabilized or formed. Si et al. [4] observed the near-field diesel spray obtained by a high-speed video camera and a continuous wave laser sheet, and they reported that the diesel spray experienced the liquid, large droplets and numerous tiny droplets. Nygard et al. [5] analyzed the generation and transport of vortices in the jet process, and through simulation and experimental studies, found that intermittent injection strategy had good effects on the formation of mixture and entrainment of environmental gas.
The macroscopic fuel spray characteristics reveal that liquid diesel fuel expresses continuous liquid phase and liquid droplets. For the diesel fuel injection, in chronological order, at first the liquid column jets out of the nozzle, as shown in Figure 1a, and this liquid column is a continuous liquid jet. Then, due to the background air friction, a liquid film forms at the liquid column head, and the liquid column has a mushroom head, as shown in Figure 1b. With the continuous jetting, the balance between the surface tension and the air friction on the liquid film is disturbed to break up, as shown in Figure 1c. Surface waves appear on the liquid film surface. With the enhanced surface wave, the liquid column splits to form liquid sheets and large droplets, which is primary breakup, as shown in Figure 1d. The liquid column becomes slim and the mushroom head deforms. Anez et al. [6] reported the deforming process of the mushroom liquid head by simulating the fuel spray based on different turbulence models. As the large droplet diameter is above the critical value, it breaks up to small liquid droplets, which is the second breakup, as shown in Figure 1e. Then, the liquid column has broken to droplets stable in the spray.
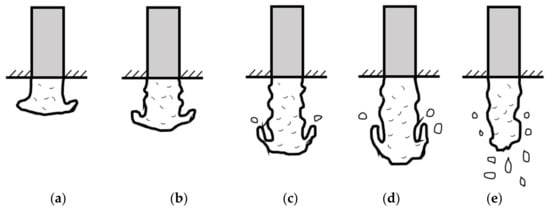
Figure 1.
Liquid fuel spray breakup. (a) liquid column; (b) mushroom head occurs; (c) liquid film broken up; (d) large droplets occur; (e) small droplets.
More and more researchers are paying attention to the microcosmic characteristics of fuel spray. Many optical observations have revealed that at the very beginning of diesel spray, first jets out of the nozzle is actually a liquid column that is a continuous liquid jet. Lai et al. [7] examined the diesel spray by a phase-Doppler particle analyzer (PDPA) system, and the optical images clearly showed liquid bulks existed during the early start of the injection, and many droplets appeared in the far field of the spray. Miesse [8] committed experimental test and verified the liquid column and its breaking up process under condition of varied Weber number. With the continuous developing fuel spray, the liquid column breaks up into numerous droplets. Therefore, both continuous liquid and disperse droplets exist in the fuel spray. There are numerical droplets that appear in the spray due to breakup, and it is not easy to obtain all details in the spray only by optical test. Even now, the diesel fuel spray processes including such phenomena as primary atomization and nozzle cavitation, are not fully clear; moreover, the full set of equations for the fuel spray are known [9]. The computational fluid dynamics (CFD) simulation of fuel spray has become one of the most useful methods for modern diesel engine. Many researchers are devoted to achieving accurate modelling of the spray atomization phenomena.
Moreover, most liquid column and films are within the near field, but these liquids in the near field spray are quite different with those in far field. Crua et al. [10] used an ultra-high-speed camera to observe the dynamics of the early spray formation and primary breakup of diesel injection, and succeeded in capturing the breakup images including the first emerging liquid fuel with the shape of an undisrupted oblate spheroid, and dispersed tiny bubbles and droplets in the far field. Since there are continuous liquid phases in the near field, the continuous Eulerian model with the volume of fluid method (VOF) is suitable for near-field spray. Grosshans et al. [11] proved that the VOF/DAC/DAN method can accurately and efficiently simulate the primary crushing process of liquid jet. Ghiji et al. [12] modelled the diesel spray dynamics by using a compressible Eulerian/VOF/LES model together with optical experiment, and succeeded in capturing an umbrella-shaped leading edge and the early stages of shedding of droplets. Guo et al. [13] used a VOF model to simulate the diesel spray including the flow inside the nozzle, and found that the stagnant air bubbles inside the nozzle caused a great influence on the near-nozzle spray patterns through the mechanisms of the mushroom-like structure and tail. The Eulerian method can predict the changing of the liquid–gas interface. However, it increases the requirement on the strong hardware source for supporting the heavy calculation burden due to the huge grids number for better accuracy.
Generally, the ELSA (i.e.: Eulerian Lagrangian Spray Atomization) model has been devoted to modeling the spray for high-pressure diesel fuel injection, to realistically illustrate the spray zone and its atomization. Blokkeel et al. [14] developed a 3D numerical model to simulate the primary breakup of diesel spray based on KIVA II, and they adopted an Eulerian formulation for spray near the nozzle and a Lagrangian formulation for diluted spray. Vallet et al. [15] proposed an Eulerian model to investigate the atomization of a liquid injection, and this model included the liquid dispersion in the gas phase, defined as the ELSA model. Belhadef et al. [16] proposed an Eulerian model to simulate the liquid sheet atomization, and used the mean liquid–gas interface density balance equation to derive the parameter SMD, i.e., the Sauter Mean Diameter of droplets. Lebas et al. [9] compared the modelling of primary breakup between the ELSA model and DNS (Direct Numerical Simulations) model based on fixed modelling parameters and constants, and they reported that the ELSA model can reduce the effect of gas temperature changes. For most CFD simulations of diesel spray, the ELSA model utilizes the Eulerian method of the near-field flow, and adopts the discrete droplet method (DDM) of the far-field flow [17]. However, there are great differences between the near-field and far-field spray, and the DDM method shows strong limitations. The DDM method assumes that the particle group enters into the calculation domain from the inlet boundary for injection. Som et al. [18] used the Kelvin–Helmholtz (KH) model based on the DDM method to investigate the primary breakup, and reported that the KH model over-predicted the spray velocity compared with the experimental data. Patterson et al. [19] modelled the diesel spray using the Kelvin–Helmholtz wave model based on the KIVA-Il CFD code, and the results showed that the model predicting spray penetration still had a few differences compared with the test results. In practical diesel injection, in the near field of the injector nozzle outlet, the first diesel fuel appears as a continuous liquid phase, which experiences the interaction with the background air. There are few droplets in the near field of fuel spray, which is not the same situation as the particle inlet boundary of the DDM model. Thus, the breakup model of DDM method has a biggish difference with the practical diesel spray. The DDM method works well only when the volume fraction of the liquid phase is small within the model grids and when the droplets locate evenly inside the model space; however, it is not easy to meet these two requirements for the near-field spray [20]. The DDM method is not able to describe the liquid film breakup process on the interface between the near field and far field.
Nowadays, the research on the ELSA model calculates the Eulerian model and Lagrangian model based on the space partition meshes, which need to revise every calculation condition to identify the Eulerian continuous phase interface. The coupling of Euler to Lagrange is critical for the ELSA model accuracy. Furthermore, the ELSA method needs to revise the meshes and the model boundary setting to identify the continuous phase interface, once the spray operation conditions such as the fuel injection pressure or the background pressure change. This method shows bad adaptability for varied injection operation conditions.
To better understand the primary breakup of diesel spray, this paper presents both experimental and numerical investigations. An optical test rig of high-pressure common-rail injector is designed and the fuel injection characteristic is tested. Furthermore, based on the commercial code FLUENT, this work develops a numerical method to model the high-pressure diesel spray with more attention on the primary breakup, and the model is verified by the optical test results. The proposed new numerical method is based on the ELSA model to realize automatic identifying of droplet features for high-pressure diesel spray, and this improved method is suitable for varied injection operation conditions. This new method uses two key criterions, i.e., the sphericity (S) and the particle diameter (D); the qualified liquid mass is transformed into Lagrangian particle, and the coupling of Eulerian–Lagrangian models is realized. This new method is named the SD-ELSA model. The SD-ELSA first identifies the liquid bulk due to breakup of the continuous phase in near field, and then converts the Eulerian liquid bulk into Lagrangian particle to complete the calculation of the total spray atomization.
2. SD-ELSA Model Analysis
During the primary breakup process, there are two zones: one is the liquid column zone and the other is droplet zone, which may be simulated by the ELSA model. In the context of the ELSA model for two-phase flows, an Eulerian approach is adopted to describe the spray dense zone and it also uses a standard Lagrangian approach. For the ELSA model simulation, first the gird partition is done to define the liquid phase domain for Eulerian model, and then the disperse phase domain for Lagrangian model. The Eulerian model calculates the total field until the liquid phase is within the Lagrangian domain. In the Lagrangian domain, the Lagrangian model continues calculating the disperse phase until the end of the simulation. For the ELSA model, the pre-set grid partition (Eulerian domain and Lagrangian domain) is constant for one given operation condition (i.e., the inlet pressure or back pressure). Once the operation boundaries change (such as the inlet pressure or back pressure), the grid needs to be reconstructed for new grid partition. Thus, this method is not convenient.
To realize the effective convergence between the Eulerian approach and Lagrangian approach, in this work, an improved under so-called SD-ELSA model is developed. This SD-ELSA model adopts two key parameters, i.e., the sphericity and the average stochastic particle diameter, as the transition criteria between the Eulerian and Lagrangian parts. According to the SD-ELSA model, liquid droplets of both primary and secondary breakups transfer from Eulerian liquid-phase block to dispersed phase particles, which realizes the dynamic convergence between Eulerian and Lagrangian equations. The simulation procedure of the SD-ELSA model is illustrated in Figure 2. This SD-ELSA model may be flexible in identifying the phase interface due to these two criteria. Similar to the ELSA simulation procedure, at first the model calculation is based on the Eulerian model and adopts the Volume of Fluid (VOF) model to calculate the liquid droplets. Once the dispersed particles meet the two criteria, the SD-ELSA model uses Lagrangian method i.e., DDM model to calculate those disperse phase domain. For this SD-ELSA method, the Lagrangian domain is dynamic not constant as ELSA model. Thus, the SD-ELSA method realizes the automatic identification of the phase interface even the operation boundary condition changes.
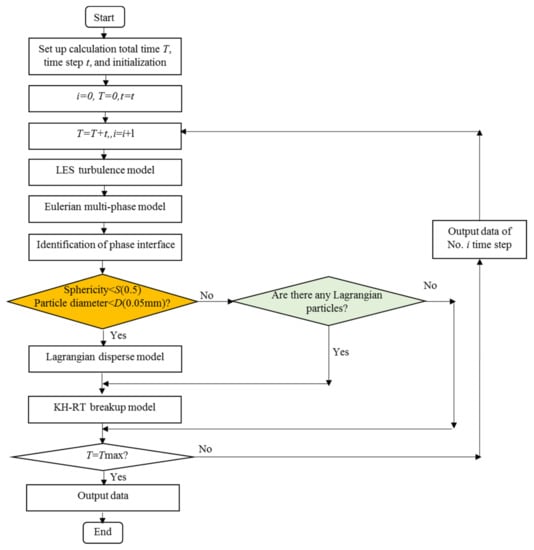
Figure 2.
Simulation procedure of SD-ELSA model.
2.1. Turbulence Model
For the high-pressure diesel injection, the diesel spray is transient flow and the turbulence phase interface is unstable, which results in strong anisotropy during the total spray breakup process. This work adopts the large eddy simulation (LES) approach as the turbulence model. Eulerian gas phase is described by compressible Navier–Stokes equations. The Favre-filtered LES formulation for the continuity, momentum, species and energy equations is the following:
Here
where is the spatial filtered variation, is the Favre filtered scalar, and .
In the filtered momentum and energy equations, denotes the conventional viscous stress and thermal flux.
2.2. Spray Model
For the spray model, the SD-ELSA model takes advantages of the Eulerian description on the near nozzle flow. For each phase in the two-phase flow near nozzle zone, the Eulerian method is adopted to solve the mass, momentum and energy equations. The governing equations refer to Reference [21]. For the dispersed particles, the Lagrangian method is used to solve the mass, momentum and energy equations. The breakup model is set as KH-RT model.
2.3. Transition of Phase Interface
To converge the Eulerian model to the Lagarangian model, in this work based on the spray transient process we adopt two key parameters as the critical criteria: the sphericity of the breakup droplet and the particle average diameter. Sphericity (S) is used to judge whether the phase interface is a sphere. The model has greater accuracy for the particle transition to disperse phase in the sphere phase interface. Average particle diameter (D) is used to judge the size of the transited disperse particle, which is ready for the secondary breakup model.
2.3.1. Sphericity S
The sphericity is defined as the following.
where Vp is the volume of the particle, and Sp is the surface area of the particle. Because the sphericity of the particle varies under different conditions, the criterion S should be set based on the practical real operation conditions.
2.3.2. Average Particle Diameter D
At present, all the equations of average particle diameter (D) are deduced based on the disturbance breakup theory of liquid volume surface wave. Classic liquid droplet breakup models include TAB, WAVE and KH_RT models. The TAB model builds the liquid droplet deform equation based on analogy analysis in the vibration of the droplet to the spring, and it judges the breakup according to the deformation. Both WAVE and KH-RT models consider that the droplet peels of the spray surface due to the enhance of unsteady surface wave.
The liquid breaks up first from the film breaking up [22]. On time scale, the first formed large droplet is induced by the instability of the liquid film breakup that the air resistance becomes greater than the surface tension, as illustrated in following equation.
where pl and pgj, respectively, are the liquid pressure and gas pressure due to the disturbance, vl is the tangential velocity along the liquid jet direction, and x is the displacement of the liquid film along the jet direction.
The amplitude of the surface wave increases with the increase in time and film expansion, and it is described by the following equation.
Under the action of gravity, the droplet diameter deriving from a static liquid film is described as Equation (7) [19].
Here, σl is the liquid surface tension, and ρl is the liquid density.
When the liquid film breaks up during the high-speed flow, the liquid droplet has a diameter as following.
Considering the interaction among the surface tension, the air resistance and the gravity, Equation (8) changes to:
Here, D is the nozzle diameter, and v is the film velocity.
The converging between Eulerian and Lagrangian parts may be done based on the above transition method.
3. SD-ELSA Numerical Model Building and Validation
3.1. Geometry and Mesh Modelling
The high-pressure diesel spray is tested based on a constant volume bomb (CVB) test rig under the condition of varied injection pressure and back pressure, as shown in Figure 3a. The CVB is a cuboid with size of 330 mm × 300 mm ×300 mm, and it has a cylinder core chamber. A high-pressure diesel multi-hole injector is located on the top center of the CVB. To realize the single-hole injection, a matching nozzle cover is designed which has a vertical hole with a diameter of 0.3 mm. This work constructs the geometry CVB model and its grids by using ICEM CFD code. Figure 3b shows the 3D model mesh based on the diesel injection prototype CVB system. The practical CVB large size requires huge numbers of the grid that requires a lot of consuming computing resources. This work optimizes the diesel fuel spray model mesh which is generated based on a geometry model of a cylinder with size of diameter × length = 60 mm × 120 mm. In this CVB model, an orifice with the diameter of 0.3 mm and the length/diameter ratio of 5 mm is in the middle. The CVB model adopts an O-block grid, and it is set as a four-layer refined gird from the injector to the CVB wall. Furthermore, the variable sections, such as orifice zone including its entrance/outlet corners are critical because the inner flows inside the variable-section zones are complicated. Therefore, the local mesh encryption of these zones are adopted. The total number of the CVB model cells is 33,026,604 with 33,275,416 nodes. The total number of the CVB model cells is 33,026,604 with 33,275,416 nodes and in total, 99,273,135 quadrilateral interior faces.
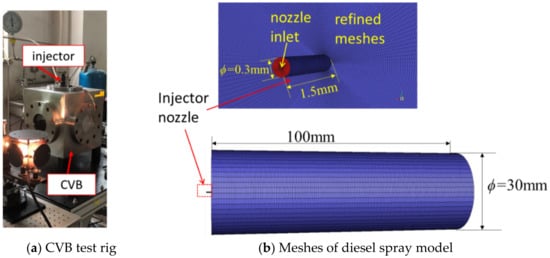
Figure 3.
Numerical model of diesel spray in CVB.
3.2. Physical Setups
To complete the model simulation, we use the ICEM CFD code to construct the geometry CVB model and its grids, and the solution of the model is based on FLUENT. The viscous model is set as large eddy simulation (LES) model together with Subgrid-Scale Model of WMLES S-Omega. Under the condition of high Reynolds number, WMLES (Wall-Modeling LES) S-Omega model is selected for the sublattice scale model of LARGE eddy simulation [23]. This model makes up for the disadvantages of high resolution requirement of Wall boundary layer in large eddy simulation, very dense computing grid and small time step. LES method has been widely applied in the academic research, and it requires excessively high for wall boundary layers. In this case, the WMLES (Wall-Modeling LES) S-Omega model computes Wall bounded flows at high Reynolds numbers, without the need to significantly improve grid resolution at high Reynolds numbers like traditional LES. This makes up for the shortcomings of large eddy simulation.
The near nozzle zone is set to VOF model and the Explicit is set. The far zone is set to DDM model and KH-RT breakup model is adopted. For the far field part of diesel atomization, The Discrete Droplet Model is adopted for simulation based on the calculation amount and calculation accuracy requirement. DDM Model can track the movement of injection droplets in constant volume projectile, including evaporation, crushing, polymerization, turbulent deformation and other physical processes. In the DDM model, each discrete particle package also follows three conservation equations. In the continuity equation of the discrete phase, , and represent the source terms resulting from droplet evaporation, fragmentation, and final collision polymerization, respectively [17,24].
The KH-RT model is developed from the WAVE model, which takes into account the competing effects of instability caused by aerodynamic rupture and droplet acceleration. KH-RT breakup model combines the effects of Kelvin–Helmholtz waves driven by aerodynamic forces with Rayleigh–Taylor instabilities. For both the KH and RT mechanism to be suitable for high speed liquid jet and rapid deceleration process of the droplet, the model introduced the KH and RT wave in the process of atomization broken competition to determine the main parameters in the process of crushing, based on the working condition of diesel spray in this paper for the high-pressure jet, so for the liquid mass into discrete particle and the diesel dual fuel jet, the KH-RT crushing model was used to calculate the atomization crushing process [19,25]. Table 1 presents the details of the boundaries and the model parameters.

Table 1.
Model physical parameters setup.
3.3. Solver
For the solver used in this method, the Solution Methods is set as the pressure–velocity coupling with PISO scheme which is good for the simulation of high-speed incompressible diesel and compressible background gas environment. For the spatial discretization, the gradient is set as Least Squares Cell Based together with pressure of PRESTO! algorithm. To improve the solution accuracy, the Momentum is set as Bounded Central Differencing.
3.4. Grid Independence Analysis
It is critical for a numerical model to set suitable grids This work completed different simulations based on varied model grid numbers. Figure 4 gives the simulation results of varied grids under condition of the injection pressure pinjection = 100 MPa and the back pressure pb = 1 MPa. It shows that the liquid column length increases and then becomes stable. During the stable stage, it slightly decreases when the grid number increases, and this liquid column length curve remains constant after the grid number is ≥30 million as shown in Figure 4a, proving the grid independence of this CVB spray model. Hence, for better simulation accuracy, this work adopts the model grid of about 30 million. Figure 4b also gives discretization error [26] of a 30 million grid. It shows that the model with the grid of totally 30 million is suitable.
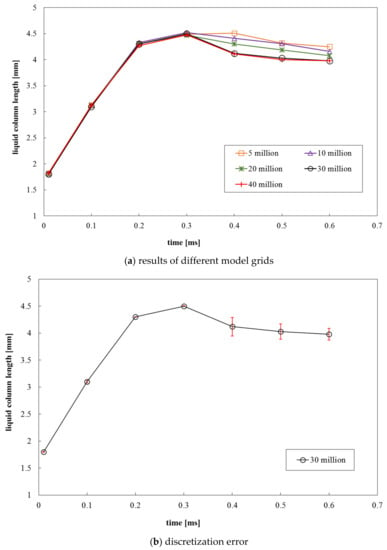
Figure 4.
Grid independency result.
3.5. Model Validation
To validate the numerical CVB model, the diesel injector is tested under the condition of varied injection pressure and back pressure. More details of the test rig, test devices and the experimental procedures are presented in our previously published research [2]. Figure 5 presents the comparison of the model and the test results under the condition of varied injection pressures. Under conditions of different injection pressures, the diesel spray penetration distance increases as the injection develops. The results show that the SD-ELSA results have good agreement with the optical experimental data for each operation condition. The SD-ELSA model error is illustrated in Figure 5b. It reveals that for varied injection pressure conditions, this SD-ELSA model has a relative low error, no more than 5% as the injection time is above 0.1 ms, and it is a little bit higher (no more than 20%) during the very early injection stage (time < 0.1 ms).
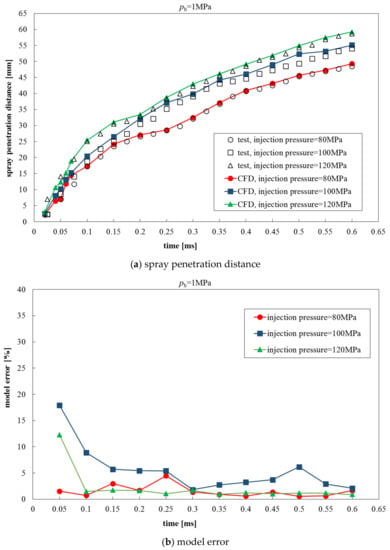
Figure 5.
Model validation.
Figure 6 shows both the optical test results and the SD-ELSA model three-dimensional simulation results of the diesel fuel spray under condition of pinjection = 100 MPa and pb = 1 MPa. The SD-ELSA model is solved based on two critical transition criteria (S and D) between the Eulerian and Lagrangian parts, and realizes the dynamic convergence between Eulerian and Lagrangian equations. The optical experimental images show that the diesel fuel penetrates rapidly inside the CVB. At the beginning of the injection, the spray shape is quite tiny and thin. Then it forms a cone shape, and the cone shape becomes longer and wider as the injection time increases. The SD-ELSA model results have good agreement with the optical test results, not only the spray penetration distance but also the spray shape.
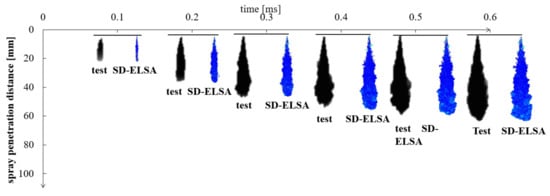
Figure 6.
Diesel spray process. (pinjection = 100 MPa, pb = 1 MPa).
4. Results Analysis
The diesel fuel spray process shows good similarity under conditions of varied injection pressures either for the optical test or the model simulation result. Here we only present the SD-ELSA simulation result under condition of pinjection = 100 MPa and the back pressure pb = 1 MPa to analyze the details of the spray. Figure 7 shows the diesel liquid volume fraction of the spray developing process just in the center plane. It clearly shows the phase transformation of the diesel fuel breakup process. During the early injection stage (within 0.01 ms), the diesel fuel is maintained as a liquid and a liquid column appears. Then (about 0.05 ms), the front of the liquid column breaks up and the liquid column splits to form liquid sheets and large droplets which surround the center liquid column. During this stage (<0.1 ms), the primary breakup occurs, and many droplets appear. After that (0.2–0.4 ms), more vapor appears and the spray becomes stable. At last, the diesel fuel continues spray with a stable cone, and the vapor surrounds the liquid center.
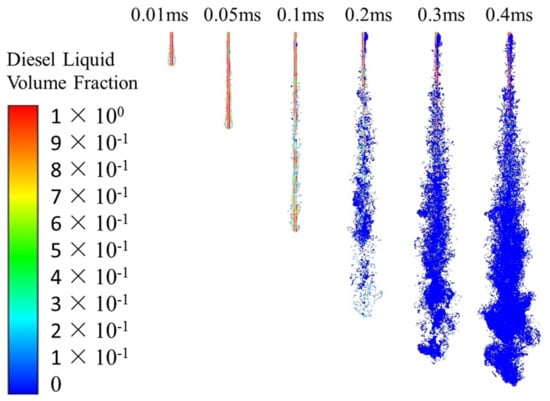
Figure 7.
Diesel spray process of SD-ELSA model. (pinjection = 100 MPa, pb = 1 MPa).
Figure 8 gives the comparison results of the calculation time between the SD-ELSA method and VOF model. Both models are used to simulate the diesel fuel spray during the early breakup stage within 0.4 ms. The results show that the calculation time of VOF model linearly increases for this total simulation duration. The calculation time curve of SD-ELSA method first coincides with that of VOF model, but after primary breakup occurs at time = 0.1 ms, which is also illustrated in Figure 7, the SD-ELSA curve separates from the VOF curve. The calculation time of SD-ELSA model continues increasing but by a smaller margin than that of the VOF curve. This is because before 0.1 ms, the diesel fuel is still liquid, and maintains a shape of liquid column which splits to form liquid sheets and large droplets surrounding the center liquid column within 0.1 ms. During the early stage, the SD-ELSA method adopts VOF model to calculate the fuel spray. Once the liquid droplet meets the requirement of these two critical criterions, the SD-ELSA method adopts DDM model to transfer the droplet into dispersed particle, which requires 10 h to complete the calculation for each 0.02 ms. The calculation time of VOF at 0.4 ms is twice of that of SD-ELSA method.
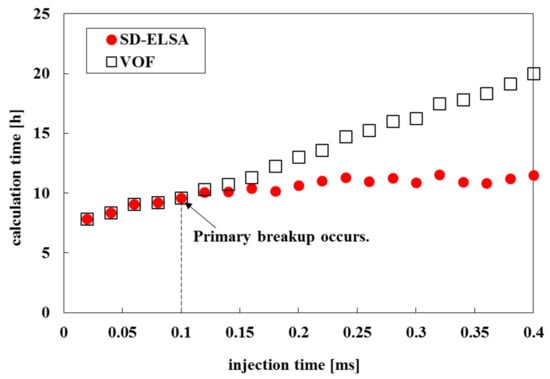
Figure 8.
Comparison of calculation time between SD-ELSA and VOF model. (pinjection = 100 MPa, pb = 1 MPa).
Figure 9 gives the details of the primary breakup of the SD-ELSA model. To clearly illustrate the exterior shape of the spray, here it is the three-dimensional contour of the fuel spray. At the very beginning (0.01 ms), the diesel spray is almost a liquid column and it is the continuous phase. Moreover, a film on the liquid column head forms with a mushroom shape. At time = 0.02 ms, the liquid column film becomes unstable and begins to break up into primary large droplets at the film edge, and the liquid column shrinks. After that, with the continuous spray (from 0.03 ms ~ 0.05 ms), due to the further breakup of the transition model, those primary large droplets transfer into disperse particles. Meanwhile, the results reveal that the atomization particles not only penetrate along the vertical spray direction, but also expand to the horizon direction, which means the phase interface changes with the developing of the spray. The shape of the spray becomes long in vertical direction and wide in horizon direction, thus it has a semi cone profile. As the film front meets the liquid column, the column breaks up to produce transition particles around the liquid column. With the further breakup of the liquid column, more particle droplets dramatically appear with decreasing diameter. It is notable that the liquid column always exists during the total spray breakup process. Then, many tiny particles appear and surround the fuel spray core. This reveals that the SD-ELSA model effectively captures the dynamic phase interface.
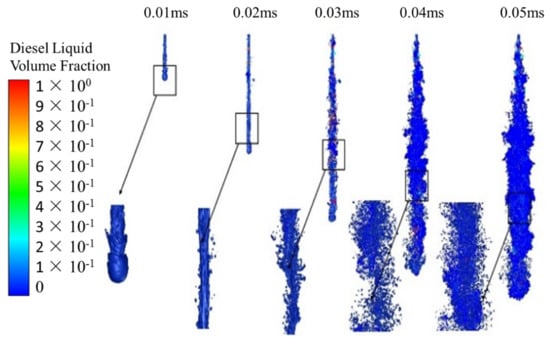
Figure 9.
Primary breakup of SD-ELSA model. (pinjection = 100 MPa, pb = 1 MPa).
Figure 10 is the fuel spray just in the center plane of the nozzle of early spray stage. It clearly shows the developing process of the droplets. During the primary breakup stage (<0.06 ms), there is mainly liquid phase in the spray. From 0.06 ms, vapors appear just surrounding the liquid phase in the middle of spray. With the developing of the spray, there are more and more vapors (the discrete phase), and the liquid diesel gradually disappears (the continuous phase). At 0.2 ms, the discrete vapor phase dominates.
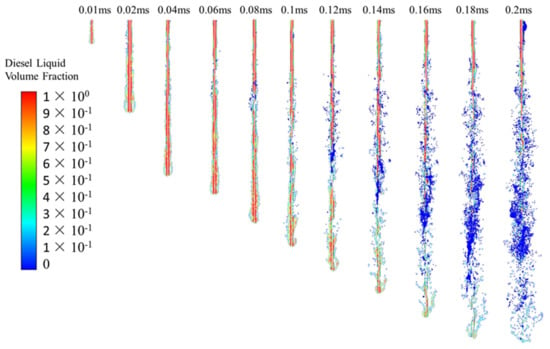
Figure 10.
Fuel spray process in center plane. (pinjection = 100 MPa, pb = 1 MPa).
Figure 11 presents the formation process of droplets during the primary breakup stage based on the SD-ELSA model. At the very beginning of diesel fuel injection (0.002 ms), the diesel maintains continuous liquid column which has a mushroom head. With the continuous injection (0.01 ms), the liquid column shrinks and the liquid film has a rough and uneven surface due the enhanced surface wave. Soon (0.02 ms), the liquid shrinks further and many droplets occur with different sizes and shapes. For this SD-ELSA model, the two parameters average droplet diameter D and sphericity S are crucial. The droplets in the close zone have varied sphericities.
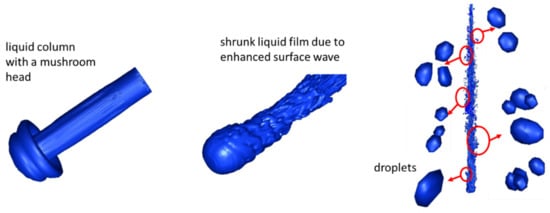
Figure 11.
Formation process of droplets. (pinjection = 100 MPa, pb = 1 MPa).
Figure 12 shows the droplets from the close-nozzle spray, exactly the same as Figure 11. The sphericity S of the droplet is derived by Equation (1) once the volume and the surface area of the droplet are obtained based on the model result. Figure 13 gives the calculated sphericity S under condition of varied injection pressures. It reveals that most droplets have sphericity range in 0.3~0.5. Especially, as S = 0.5, the droplets number are over 2000 to 6000 for different pressure conditions. Thus, for this SD-ELSA model simulation, the threshold sphericity S is set to 0.5.
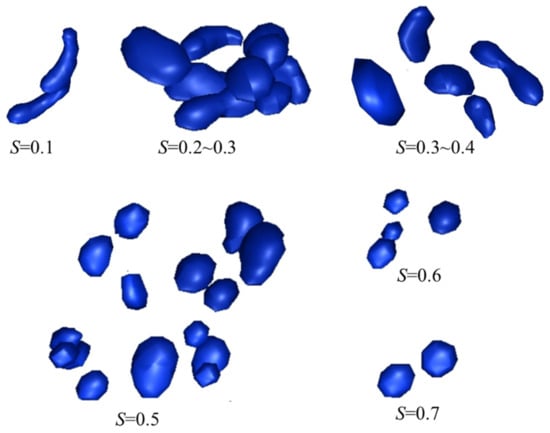
Figure 12.
Droplets. (pinjection = 100 MPa, pb = 1 MPa).
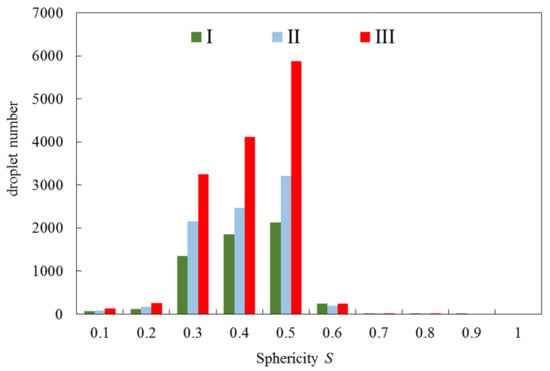
Figure 13.
Sphericity of droplets. I: pinjection = 80 MPa, pb = 1 MPa; II: pinjection = 100 MPa, pb = 1 MPa; III: pinjection = 120 MPa, pb = 1 MPa.
Figure 14 presents the average droplet diameter D under condition of varied injection pressure. It shows that the droplet average diameter D decreases with the continuous developing of the fuel spray. However, since the primary breakup occurs in the early injection stage and in the close nozzle zone, i.e., 0.2~0.4 ms, the average droplet diameter ranges from 0.046 mm to 0.054 mm (marked by red dash rectangle) for different injection pressure conditions. Therefore, for this SD-ELSA model simulation, the threshold average droplet diameter D is set to 0.05 mm. This reveals that the high-pressure diesel fuel spray experiences the liquid column and the atomizing droplet, and the liquid column gradually transfers to the droplet. During the diesel spray atomization and breakup process, the liquid column still exists, and the simulation results of SD-ELSA model clearly show the liquid column breakup process. The SD-ELSA model illustrates the total diesel spray atomization process from the breakup of liquid column to the droplets.
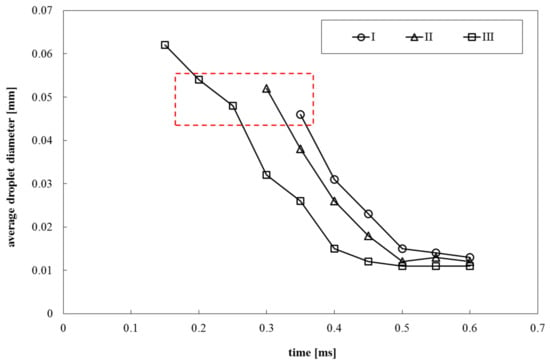
Figure 14.
Average droplet diameter D. I: pinjection = 80 MPa, pb = 1 MPa; II: pinjection = 100 MPa, pb = 1 MPa; III: pinjection = 120 MPa, pb = 1 MPa.
5. Conclusions
This study proposed an improved model method of diesel fuel spray based on a classic ELSA model. A three-dimensional model of high-pressure diesel injection was built and verified by experimental results based on optical tests in a constant volume bomb. The main conclusions are summarized as the following.
The SD-ELSA model was developed based on the classic ELSA model. It adopts two key parameters as the critical criteria, the sphericity (S) of the breakup droplet and the particle average diameter (D), to converge a dynamically Eulerian model to a Lagarangian model. The sphericity (S) is used to judge whether the phase interface is a sphere, and the average particle diameter (D) is used to judge the size of the transited disperse particle. The SD-ELSA model has good agreement with the optical experimental results. The SD-ELSA model illustrates the total diesel spray atomization process from the breakup of liquid column to the droplets. The simulation results of SD-ELSA model clearly present the liquid column breakup process. The results demonstrate that the SD-ELSA method is effective for automatically identifying the computing zone of the Eulerian–Lagrangian model, and it predicts the diesel spray with good accuracy.
Author Contributions
Conceptualization, Y.L. and T.Q.; methodology, D.Z. (Dingwu Zhou); software, Y.W. and K.W.; validation, D.Z. (Dingwu Zhou), Y.W. and K.W.; formal analysis, Y.D.; investigation, D.Z. (Dingwu Zhou); resources, D.Z. (Dan Zhou); data curation, Y.W.; writing—original draft preparation, D.Z. (Dingwu Zhou); writing—review and editing, Y.L. All authors have read and agreed to the published version of the manuscript.
Funding
National Natural Science Foundation (91641106), the Beijing Natural Science Foundation (3172007), the Hunan Natural Science Foundation (2021JJ60056).
Institutional Review Board Statement
Not applicable.
Informed Consent Statement
Not applicable.
Data Availability Statement
This study does not report any data.
Acknowledgments
The authors would like to express their sincere thanks to Beijing University of Technology for their financial support of this work.
Conflicts of Interest
The authors declare no conflict of interest.
References
- Hiroyasu, H.; Arai, M. Structures of fuel sprays in diesel engines. Intertional Congress and Exposition. SAE Tech. Pap. 1990, 904475. [Google Scholar] [CrossRef]
- Lei, Y.; Liu, J.X.; Qiu, T.; Mi, J.C.; Liu, X.W.; Zhao, N.; Peng, G.Y. Effect of injection dynamic behavior on fuel spray penetration of common-rail injector. Energy 2019, 188, 116060. [Google Scholar] [CrossRef]
- Gad, H.M.; Ibrahim, I.A.; Abdel-baky, M.E.; Abd EIsamed, A.K.; Farag, T.M. Experimental study of diesel fuel atomization performance of air blast atomizer. Exp. Therm. Fluid Sci. 2018, 99, 211–218. [Google Scholar] [CrossRef]
- Si, Z.B.; Shimasaki, N.; Nishida, K.; Ogata, Y.; Guo, M.; Tang, C.L.; Huang, Z.H. Experimental study on impingement spray and near-field spray characteristics under high-pressure cross-flow conditions. Fuel 2018, 218, 12–22. [Google Scholar] [CrossRef]
- Nygard, A.; Altimira, M.; Semlitsch, B.; Wittberg, L.P.; Fuchs, L. Analysis of Vortical Structures in Intermittent Jets. Springer Proc. Phys. 2015, 185, 3–10. [Google Scholar]
- Anez, J.; Ahmed, A.; Hecht, N.; Duret, B.; Reveillon, J.; Demoulin, F.X. Eulerian-Lagrangian spray atomization model coupled with interface capturing method for diesel injectors. Int. J. Multiph. Flow 2019, 113, 325–342. [Google Scholar] [CrossRef]
- Lai, M.C.; Wang, T.C.; Xie, X.B.; Han, J.S.; Henein, N.; Schwarz, E.; Bryzik, W. Microscopic characterization of diesel sprays at VCO nozzle exit. SAE Tech. Pap. 1998, 982542. [Google Scholar] [CrossRef]
- Miesse, C.C. Correlation of experimental data on the disintegration of liquid jets. Ind. Eng. Chem. 1955, 47, 1690–1701. [Google Scholar] [CrossRef]
- Lebas, R.; Menard, T.; Beau, P.A.; Berlemont, A.; Demoulin, F.X. Numerical simulation of primary break-up and atomization: DNS and modelling study. Int. J. Multiph. Flow 2009, 35, 247–260. [Google Scholar] [CrossRef]
- Crua, C.; Shoba, T.; Heikal, M.; Gold, M.; Higham, C. High-speed microscopic imaging of the initial stage of diesel spray formation and primary breakup. SAE Tech. Pap. 2010, 2247. [Google Scholar] [CrossRef]
- Grosshans, H.; Movaghar, A.; Cao, L.; Oevermann, M.; Szász, R.-Z.; Fuchs, L. Sensitivity of VOF simulations of the liquid jet breakup to physical and numerical parameters. Comput. Fluids 2016, 136, 312–323. [Google Scholar] [CrossRef][Green Version]
- Ghiji, M.; Goldsworthy, L.; Brandner, P.A.; Garaniya, V.; Hieldet, P. Analysis of diesel spray dynamics using a compressible Eulerian/VOF/LES model and microscopic shadowgraphy. Fuel 2017, 188, 352–366. [Google Scholar] [CrossRef]
- Guo, G.M.; He, Z.X.; Lai, M.C.; Duan, X.B.; Leng, X.Y.; Duan, L.; Chen, Z. Optical experiment and Large Eddy Simulation on effects of in-nozzle stagnant air bubbles and diesel on near-nozzle spray structure variation in diesel injector. Fuel 2019, 255, 115721. [Google Scholar] [CrossRef]
- Blokkeel, G.; Barbeau, B.; Borghi, R. A 3D Eulerian Model to Improve the Primary Breakup of Atomizing Jet. SAE Tech. Pap. 2003, 5. Available online: https://www.jstor.org/stable/44741254 (accessed on 3 January 2022).
- Vallet, A.; Burluka, A.A.; Borghi, R. Development of a Eulerian model for the “atomization” of a liquid jet. At. Sprays 2001, 11, 619–642. [Google Scholar] [CrossRef]
- Belhadef, A.; Vallet, A.; Amielh MAnselmet, F. Pressure-swirl atomization: Modeling and experimental approaches. Int. J. Multiph. Flow 2012, 39, 13–20. [Google Scholar] [CrossRef]
- Dukowicz, J.K. A particle-fluid numerical model for liquid sprays. J. Comput. Phys. 1980, 35, 229–253. [Google Scholar] [CrossRef]
- Som, S.; Aggarwal, S.K. Effects of primary breakup modeling on spray and combustion characteristics of compression ignition engines. Combust. Flame 2010, 157, 1179–1193. [Google Scholar] [CrossRef]
- Patterson, M.A.; Reitz, R.D. Modeling the effects of fuel spray characteristics on diesel engine combustion and emissions. SAE Tech. Pap. 1998, 980131. [Google Scholar] [CrossRef]
- Hoyasa, S.; Gil, A.; Margot, X.; Khuong-Anh, D.; Ravet, F. Evaluation of the Eulerian-Lagrangian Spray Atomization (ELSA) model in spray simulations: 2D cases. Math. Comput. Model. 2013, 57, 1686–1693. [Google Scholar] [CrossRef]
- Nowruzi, H.; Ghadimi, P.; Yousefifard, M. Large Eddy Simulation of ultra-high injection pressure diesel spray in marine diesel engines. Trans. FAMENA 2015, 38, 65–76. [Google Scholar]
- Su, T.F.; Patterson, M.A.; Reitz, R.D.; Farrell, P.V. Experimental and numerical studies of high pressure multiple injection sprays. SAE Tech. Pap. 1996, 960861. [Google Scholar] [CrossRef]
- Shur, M.L.; Spalart, P.R.; Strelets, M.K.; Travin, A.K. A hybrid RANS-LES approach with delayed-DES and wall-modelled LES capabilities. Int. J. Heat Fluid Flow 2008, 29, 1638–1649. [Google Scholar] [CrossRef]
- Hwang, C.J.; Chang, G.C. Numerical study of gas-particle flow in a solid rocket nozzle. AIAA J. 1988, 26, 682–689. [Google Scholar] [CrossRef]
- Beale, J.C.; Reitz, R.D. Modeling spray atomization with the Kelvin-Helmholtz/Rayleigh-Taylor hybrid model. At. Sprays 1999, 9, 623–650. [Google Scholar]
- Celik Ismail, B.; Urmila, G.; Patrick, J.R.; Christopher, J.F.; Hugh, C.; Peter, E.R. Procedure for Estimation and Reporting of Uncertainty Due to Discretization in CFD Applications. J. Fluids Eng. 2008, 130, 780011–780014. [Google Scholar]
Publisher’s Note: MDPI stays neutral with regard to jurisdictional claims in published maps and institutional affiliations. |
© 2022 by the authors. Licensee MDPI, Basel, Switzerland. This article is an open access article distributed under the terms and conditions of the Creative Commons Attribution (CC BY) license (https://creativecommons.org/licenses/by/4.0/).