Article

Data-Driven Optimal Design of a CHP Plant for a Hospital Building: Highlights on the Role of Biogas and Energy Storages on the Performance

Department of Industrial Engineering, University of Rome Tor Vergata, Via del Politecnico 1, 00133 Rome, Italy
*
Authors to whom correspondence should be addressed.
Energies 2022, 15(3), 858; https://doi.org/10.3390/en15030858
Submission received: 23 December 2021 / Revised: 14 January 2022 / Accepted: 21 January 2022 / Published: 25 January 2022

Abstract

:
Combined heat and power (CHP) generation plants are an assessed valuable solution to significantly reduce primary energy consumption and carbon dioxide emissions. Nevertheless, the primary energy saving (PES) and CO2 reduction potentials of this solution are strictly related to the accurate definition and management of thermal and electric loads. Data-driven analysis could represent a significant contribution for optimizing the CHP plant design and operation and then to fully deploy this potential. In this paper, the use of a bi-level optimization approach for the design of a CHP is applied to a real application (a large Italian hospital in Rome). Based on historical data of the hospital thermal and electric demand, clustering analysis is applied to identify a limited number of load patterns representative of the annual load. These selected patterns are then used as input data in the design procedure. A Mixed Integer Linear Programming coupled with a Genetic Algorithm is implemented to optimize the energy dispatch and size of the CHP plant, respectively, with the aim of maximizing the PES while minimizing total costs and carbon emissions. Finally, the effects of integrating biogas from the Anaerobic Digestion (AD) of the Spent Coffee Ground (SCG) and Energy Storage (ES) technologies are investigated. The results achieved provide a benchmark for the application of these technologies in this specific field, highlighting performances and benefits with respect to traditional approaches. The effective design of the CHP unit allows for achieving CO2 reduction in the order of 10%, ensuring economic savings (up to 40%), when compared with a baseline configuration where no CHP is installed. Further environmental benefits can be achieved by means of the integration of AD and ES pushing the CO2 savings up to 20%, still keeping the economical convenience of the capital investment.

1. Introduction

Global warming, rapid population growth (the population is forecast to reach 9.7 billion people by the 2050 [1]), and, more recently, the global COVID-19 pandemic are critical societal, economic, and engineering challenges. During the recent COP 26 in Glasgow, the most recent international agreement concerning global warming, a limit to the rise in global average temperature to 1.5 Celsius degrees has been fixed, and for the first time, individual countries have been forced to phase down unabated coal power and inefficient subsidies for fossil fuels [2]. Furthermore, besides greenhouse gas (GHG) reduction, waste management and virgin raw material utilization are also very relevant challenges. A move to a “Circular Economy” development model—namely, a significant reduction of wastes and virgin raw materials utilization—cannot be postponed in order to satisfy the worldwide growing demand for energy and goods with an effective management of the available resources and almost waste-free utilization processes.
Moreover, the current pandemic situation due to the SARS-CoV-2 virus has introduced structural changes in energy demand and consumption, posing several challenges to the system operators, with particular reference to towards an increased resilience of the energy system [3]. As a matter of fact, the long-term strategic vision for a prosperous, modern, competitive, and climate-neutral economy [4] requires a severe change of paradigm in power generation, energy sources management, efficiency, and resiliency of the whole energy supply chain.
In this context, the waste management hierarchy guidelines [5] address the transition from a “Linear economy” model toward the “Circular Economy” one, requiring a systematic reduction of the amount of waste and a maximization of its value by an increase in the use of the secondary raw materials. In this context, the concept of Biorefining emerges. It is defined by IEA as: “The sustainable processing of biomass into a spectrum of marketable biobased products and bioenergy/biofuels, is an innovative and efficient approach to use available biomass resources for the synergistic coproduction of power, heat, and biofuels alongside food and feed ingredients, pharmaceuticals, chemicals, materials, minerals and short-cyclic CO2” [6]. This definition underlines how the effectiveness of biorefinery processes strongly depends on the biomass input.
In recent years, there has been great interest in the biorefinery of spent coffee grounds (SCG): i.e., the residual coffee powder from making the beverage. Nowadays, SCG are beginning to be considered not as waste but as a resource. Several papers consider SCG as feedstock for biofuel production: in [7], the use of the SCG collected in the Technical University of Denmark was analyzed for the production of bioethanol to partially cover the campus energy demands; in [8], an assessment of pellets made from pepper stem and SCG was evaluated, obtaining an ideal ratio of 8:2 with an optimal torrefaction temperature of 230 °C; in [9], the addition of SCG in wood-based feedstocks (sawdust, shavings) is discussed, where the authors show advantages from the energy point of view, increasing the heating value, and at the same time suggesting a low ratio to ensure keeping good mechanical resistance properties.
The interest in SCG comes not only from the scientific sector but also from private companies. For example, in the UK “Bio-Bean” has collected SCG across the country over the last few years and converted them into a solid biofuel for domestic heat and secondary raw materials [10]. This interest arises from the intrinsic characteristics of SCG that makes it an ideal resource for the bioeconomy. Indeed, coffee is one of the most consumed beverages in the world [11,12,13,14]; it is also one of the commodities traded most [13,14,15] and its consumption is constantly rising year by year [11,12,15,16]. Moreover, SCG are among the major parts of coffee powder. In fact, while only around 30% of the total mass is solubilized in the beverage [11], the remainder becomes SCG. This aspect, coupled with the high waste intensity of the coffee powder processing, makes the coffee industry a huge producer of waste [11,13,14]. Therefore, SCG is not only a resource, but it is also an ideal input for a biorefinery. Its composition and characteristics have given rise to several studies showing several possibilities to valorize SCG for energy purposes. In the literature, several papers are available regarding the value chain of SCG for energy applications [11,15,17,18,19,20]. Nevertheless, in these papers, the economic challenges related to the SCG collection and distribution are not detailed, although it is one of the more critical economic aspects of SCG valorization due to the low density of availability of this biomass.
Another crucial aspect of the energy transition towards a more sustainable energy system are conversion and final use efficiencies [21]. Financial incentives for Combined Heat and Power (CHP) generation are still used in the EU [22] to support the widespread diffusion of such a technology. CHP can significantly reduce the primary energy usage and increase the local power production, consequently decreasing the transportation losses. Many scientific articles highlight its role in the energy transition, either for urban or industrial contexts [23].
To properly take advantage of the CHP plant potential, advanced and smart design strategies are key: non-optimal operation of the plant can, in fact, lead to performance below the predicted level and a consequent loss of energy efficiency, as well as economic revenue [24]. In detail, in the standard design methodologies of CHP plants, the dynamics of heat and power demand are quite often not properly taken into account and average values are taken as reference. As described in [25], a dynamic design procedure can solve these limits, but it requires previous knowledge of representative loads for the application that should further not be influenced by singularities related to the specific observation period. In [25], clustering the load starting from the historical data in order to obtain a typical load profile not affected by singularities [25] is a solution introduced to address this problem.
Besides the development of smart design strategies, the problem of the optimization scheduling of Multi Energy Systems (MESs) based on the CHP system, RES, and ES is also crucial and is well studied in the literature [26,27,28,29,30]. There are several approaches to deal with this problem, among them the improved differential evolutionary algorithm [27,31] and Particle Swarm Optimization, and other types of evolutionary algorithm in a bi-level optimization framework, which combines Mixed Integer Linear Programming (MILP) and Evolutionary Algorithm [28,32,33,34,35,36], have been extensively investigated in the recent literature.
The work presented in this paper is based on the latter approach that has been effectively tested in previous work by the authors for different applications, ranging from university buildings [33] to Net Zero Energy Factories [32]. In the context previously defined, the main contribution of the present study is the application of the proposed methodology to simultaneously optimize the economic and environmental targets considering of a CHP civil application integrating Anaerobic Digestion (AD) of the SCG and its value chain, as well as Energy Storage (ES) technologies. Referring to the specific case of a large hospital building, the study allows us to understand the limits of the proposed approach with respect to traditional solutions; therefore, it provides a unique reference benchmark for the energy performance of this type of application. The major novelties of the study can be summarized in the following points:
  • Proposes a bi-level optimal design for the integration of Biogas from Anaerobic Digestion (AD) and Energy Storage (ES) technologies (Thermal Energy Storage—TES and Battery Energy Storage System (BESS) for CHP applications;
  • Uses the developed design and control algorithm on a real case study (the energy system of a hospital facility located in Rome) to evaluate the potential benefits arising from the innovative approach. Hospitals have in fact often used CHP power systems due to the relevant electric and thermal power consumed and the demands’ contemporaneity;
  • Provides energy and environmental KPIs as a benchmark for a real case study for a hospital building.

2. Materials and Methods

2.1. System Layout

This study presents the definition of an optimal CHP and Anaerobic Digestion configuration for the hospital “Policlinico Tor Vergata,” located in Rome, Italy.
This application has been chosen as hospitals are ideal applications for CHP powerplants as they are able to successfully match electricity and heat demands during the whole year [37]; on the other hand, some economic advantages arise from the CHP installation:
  • The in situ cogeneration of electricity and heat is cheaper than the separated generation.
  • Financial incentives are available in Italy (as in the rest of the EU) for the CHP units that achieve specific performance goals [37].
The building (Figure 1) is characterized by an overall surface of about 140,000 m2 with a central structure of four horizontal levels, intended for diagnosis and treatment, and two eleven-level building units with vertical development, designed for hospital stays (500 beds).
The hospital is equipped with a 350 kW NaBr absorption solar cooling system, a 100 kWp photovoltaic (PV) power plant, and a 2 MW CHP plant based on a reciprocating Internal Combustion Engine (ICE) fueled by natural gas. Among the available CHP technologies, the ICE was selected to match the power to heat ratio (PHR) of the building. Its size was defined based on a static characterization of the thermal and electric load, i.e., using the load duration curves (Figure 2). In particular, the 2 MW power output value was chosen to have the CHP plant operating at the nominal design set-point for the whole year.
The current system configuration further makes the system eligible for high-efficiency incentives (HE-CHP), according to the Italian law, as the PES, calculated with Equation (1) [37], is 23.78%:
P E S = 1 1 η t h   c h p η t h   r i f + η e l   c h p η e l   r i f · 100
where η t h   c h p ( η e l   c h p ) is the ratio between the heat (electric energy) produced in CHP mode and the primary energy used by the CHP unit, whereas η t h   r i f ( η e l   r i f ) is the reference efficiency for standalone thermal (electric) energy conversion.
However, the present CHP unit design has been developed using a rather conservative approach to primary energy savings and does not explicitly consider the overall carbon emission reduction. Thus, in this study, the dynamic characterization of both thermal and electric loads is integrated into the design method of the CHP plant to explore the additional technical, economic, and environmental benefits of other design choices and evaluate the potential role of energy storage systems as well. The following sections describe the proposed dynamic load modeling and the novel method used for the optimal design of the CHP unit.
Furthermore, the present study investigates the integration of the AD of SCG in the energy system of the PTV using biogas for co-burning with or completely substituting the fossil methane to fuel the CHP unit. To minimize costs and the carbon footprint, a specific SCG supply chain is designed using SDG collected in the city coffee shops and its neighborhood close to the hospital building. The amount of coffee powder in each coffee shop is computed based on the average number of coffees sold every day in a single shop in Italy: around 175 cups, which means about 1.5 kg of coffee per shop per day [38]. Every day a truck collects the SCG and deliveries them from the bars to the AD unit of the PTV. The CO2 emitted by the truck is computed as a GHG emission of the ES, but the CO2 emitted from the combustion of biogas is not taken into account, as it is a part of the carbon cycle of the biomass itself. The data on coffee to SCG and the characteristics of SCG were measured in the laboratory of the University of Rome Tor Vergata through several experimental tests (Mass conversion coffee—SCG = 2.27 and Volatile Solids/SCG mass = 31.5%). Further details about the whole process modeling, from transportation to biogas production, are reported in the Appendix A for the sake of clarity.

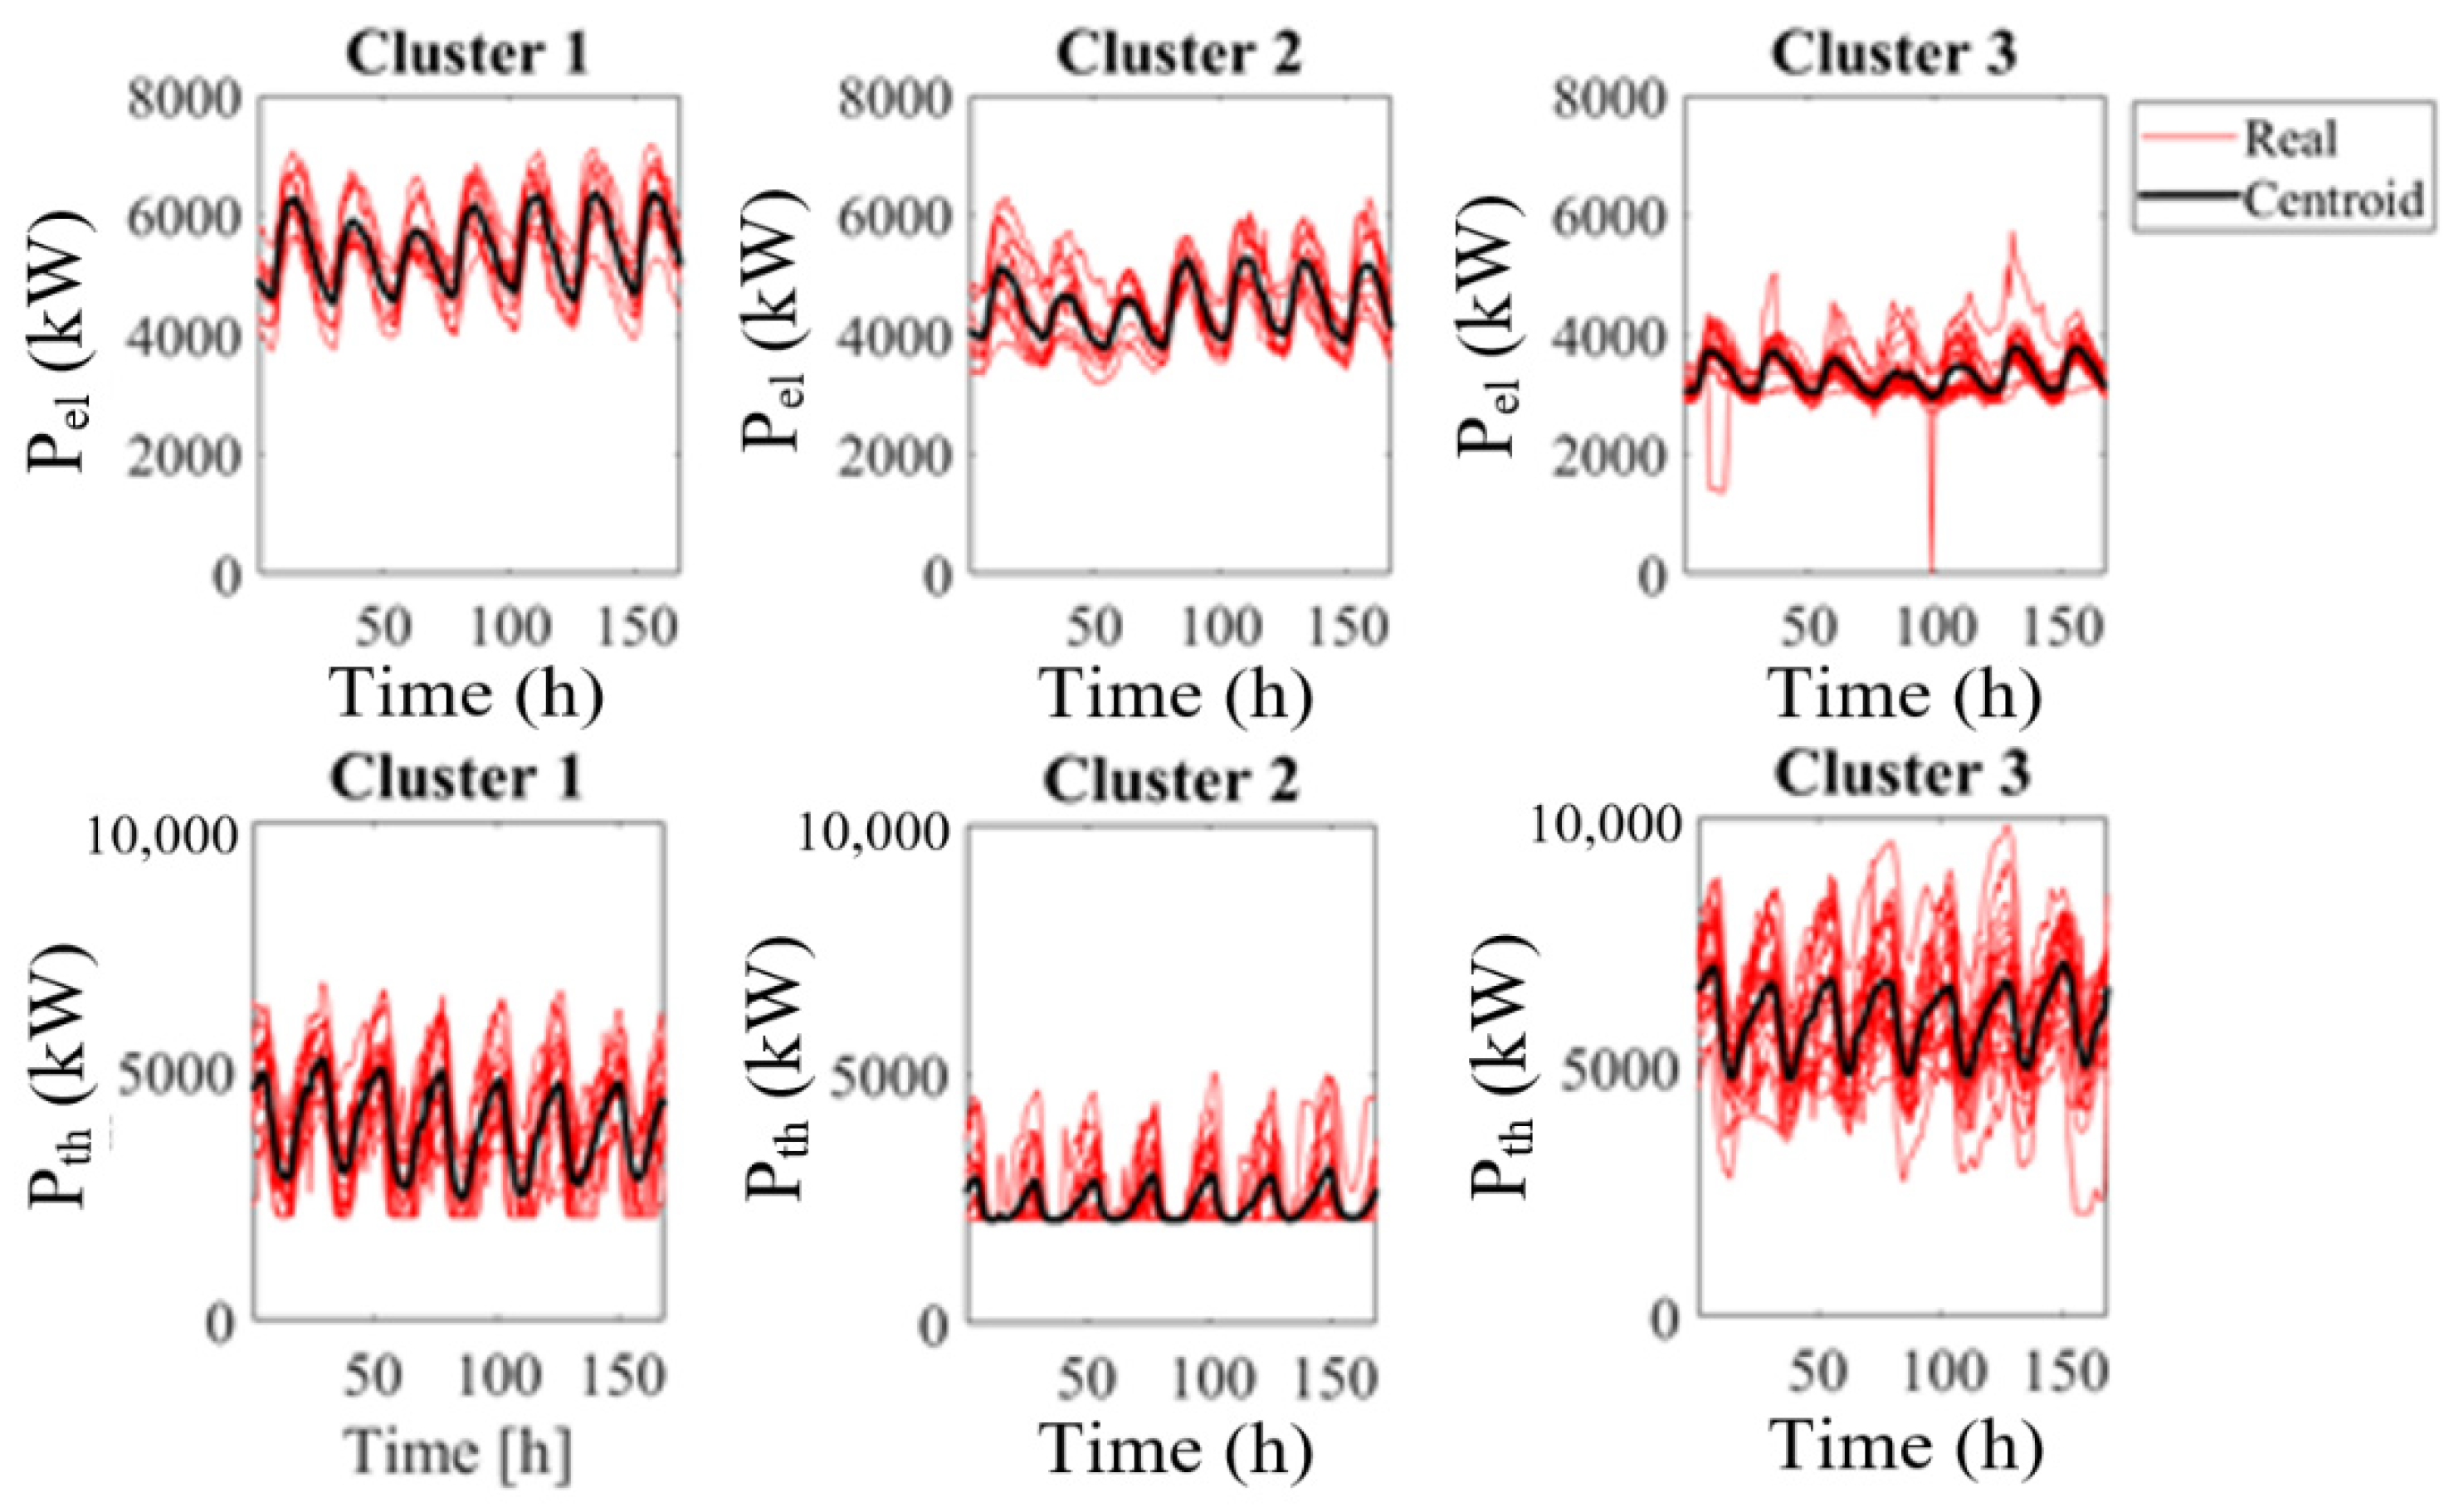
2.2. Modeling of Thermal and Electric Load

A comprehensive characterization of thermal and electric loads for the hospital is crucial to assess the further potential in PES and carbon emission reduction with different CHP configurations. An approach based on an unsupervised machine learning method (clustering) is proposed, with the main scope of defining representative load profiles and avoiding the influence of singularities in the optimization of the CHP configuration. Real historical data over one year from the hospital building is used as an input for the proposed model.
According to the analysis proposed in [39], a time horizon of one week has been chosen for load profile clustering as a good compromise between the final number of clusters and pattern variation. Considering the optimal number of clusters, defined with a silhouette criterion, the annual thermal and electric weekly load profiles have been assigned to three different clusters with a k-mean algorithm. The so-defined clusters are then able to take into account typical seasonal variations and a rather accurate dynamic representation of load profile patterns. The consistency of this assumption has been validated by looking at the high value of the silhouette parameter of each weekly curve and the detected similarity of clusters as observed during the year. The final clusters and centroids for both thermal and electric loads are shown in Figure 3.

2.3. Optimal Design Method

System configuration and control should be defined, taking into account not only economic targets, but also environmental ones as both objectives contribute to the reduction in primary energy consumption to unlock the potential benefits of a CHP plant. Moreover, a long enough time horizon considered during the design procedure allows to represent the potential set of operating conditions more accurately. According to such remarks, a bi-level optimization approach has been adopted in this study: a low-level mixed integer linear programming (MILP) algorithm to optimally schedule the CHP unit (considering the eventual biogas from the AD), TES, and BESS, and an upper-level genetic algorithm (GA) to define the component sizes. Both control and design algorithms implement a multi-objective optimization, where the decision variables are defined to maximize the PES and minimize the capital expenditures and the operating expenses, in particular, to minimize economic ( O b j e c o ) and environmental ( O b j e b v ) objectives. A detailed description of the bi-level optimization approach is described in Appendix B.

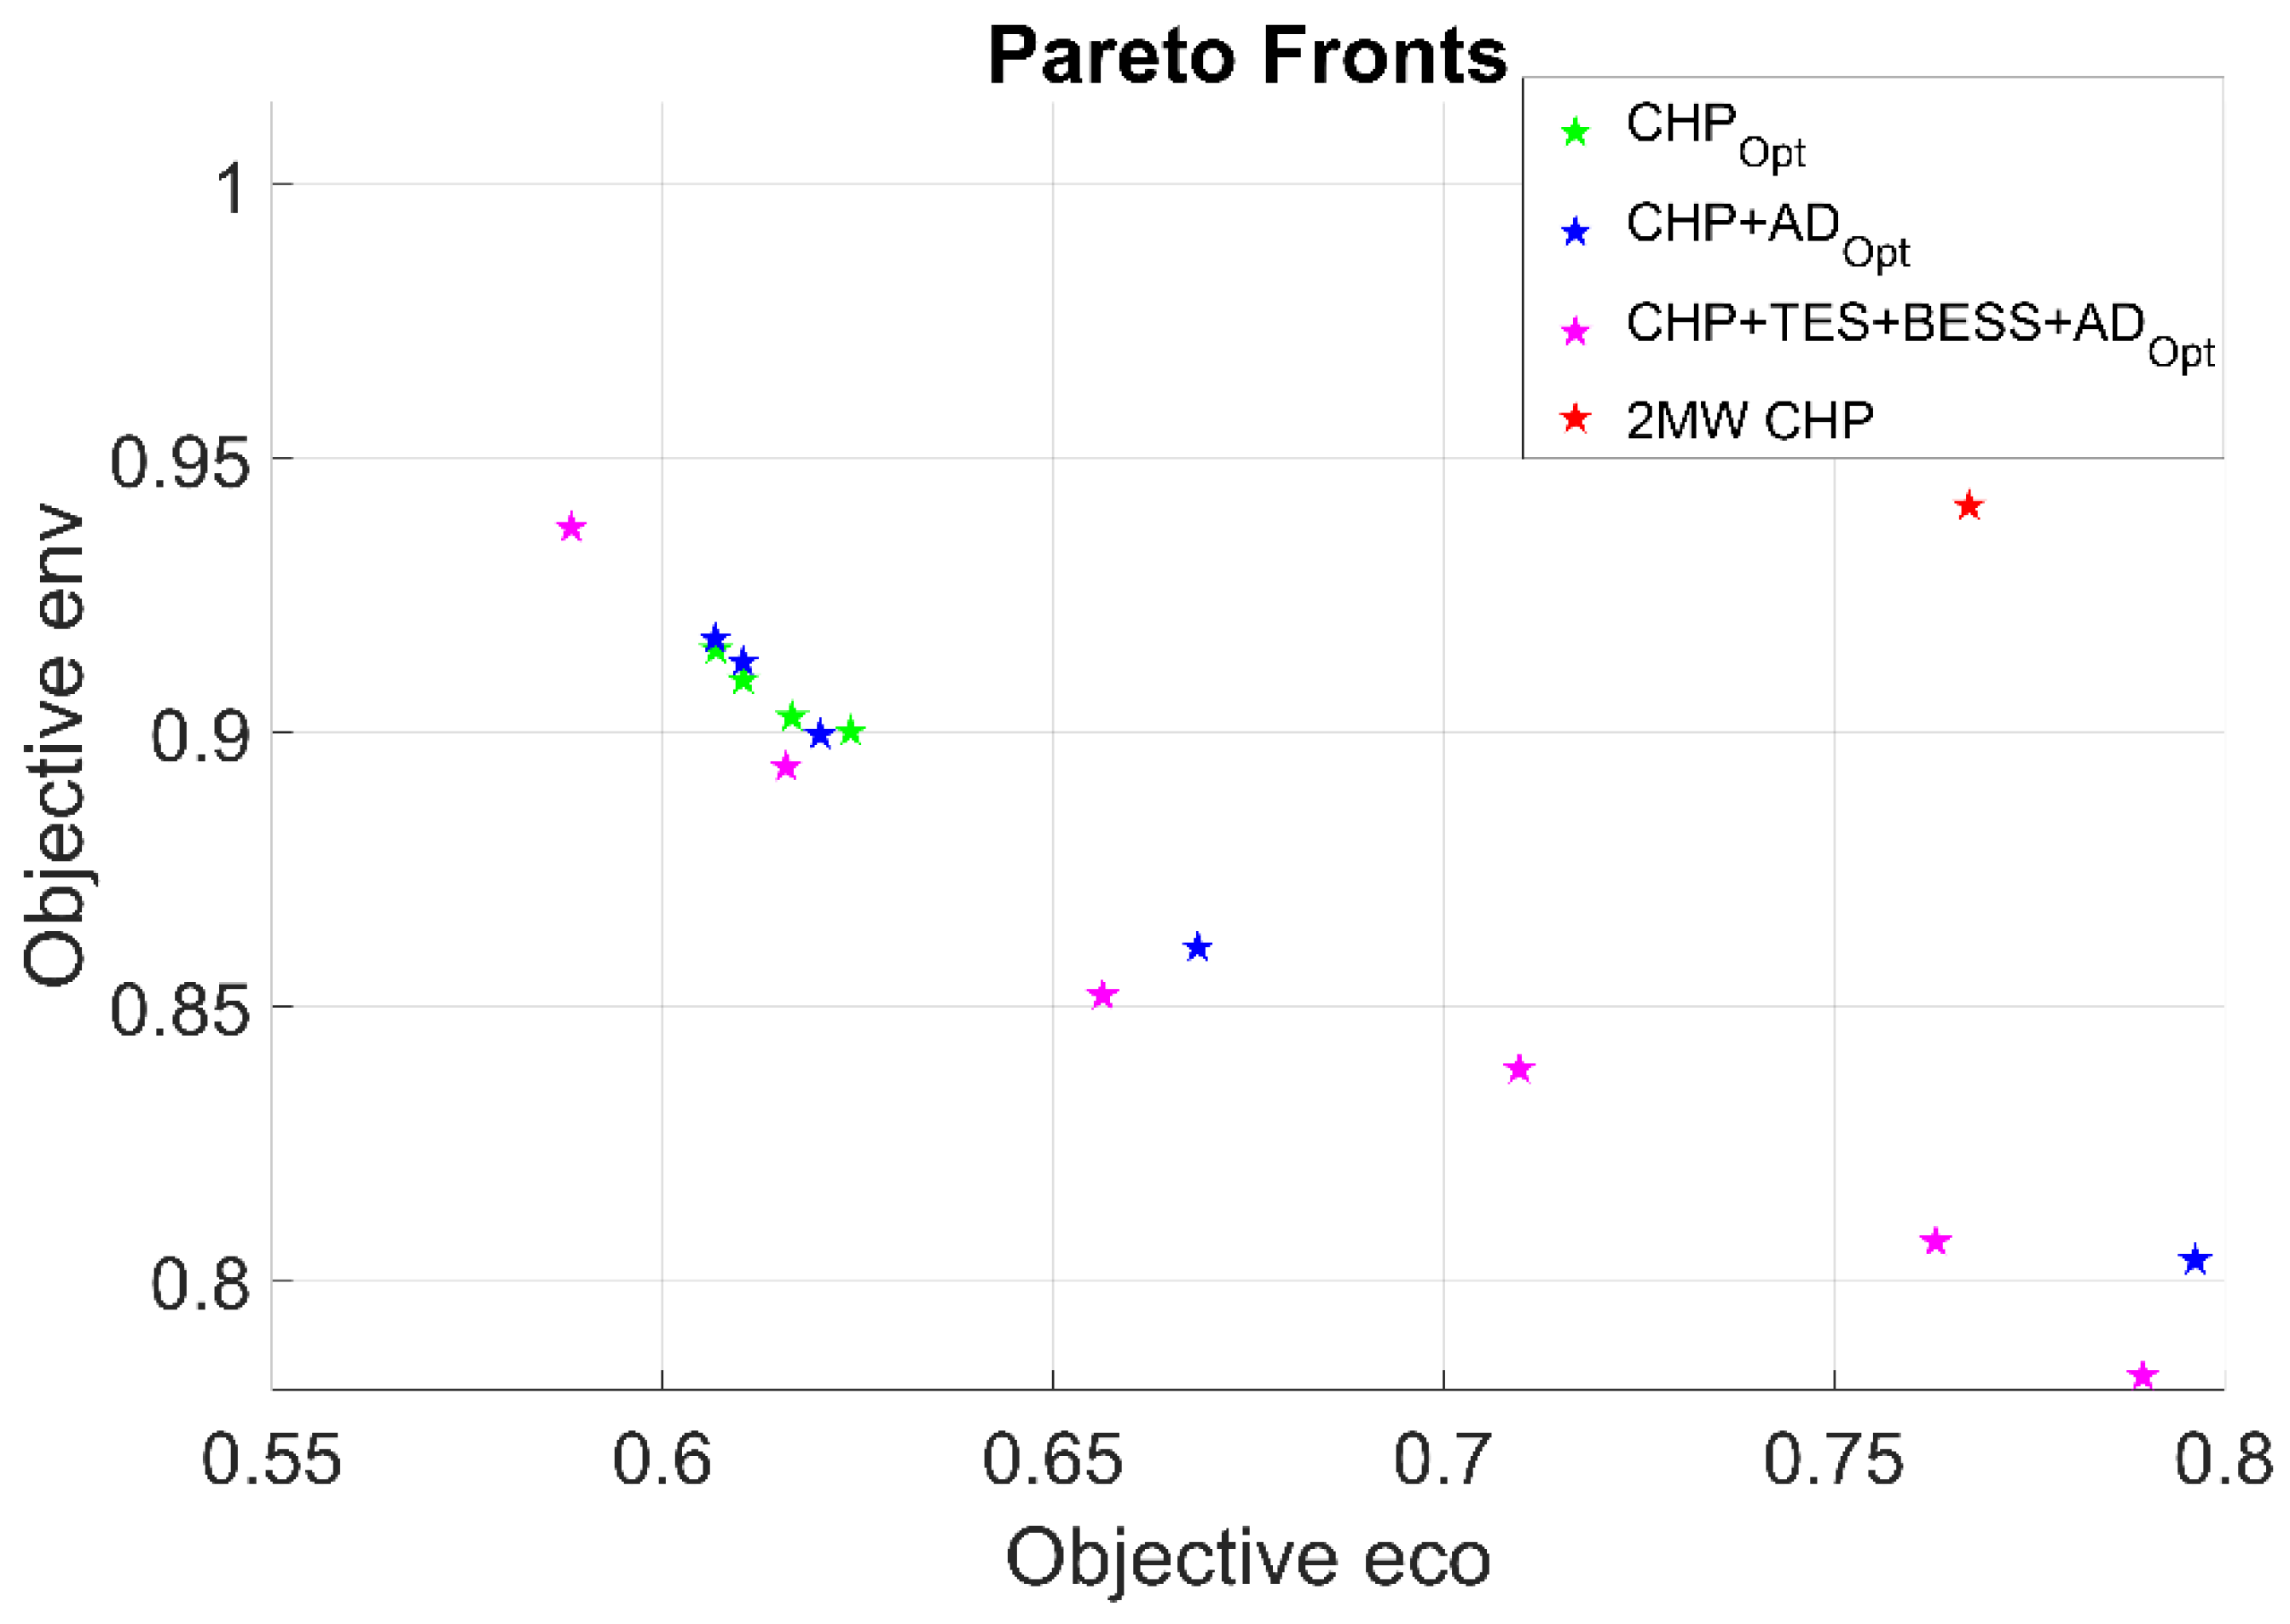
Optimal Solution through the Pareto Plot

Solutions to multi-objective problems are multiple; all of the non-dominant solutions can be found on the Pareto front. The choice between these equivalent solutions can be made by using several approaches. Since the objective of the design optimization is the minimization of both economic and environmental impact, the ideal solution can be considered as the origin of the objective axes (zero emissions and costs). Therefore, the best solution among the sizing points of the Pareto front is the design that minimizes the distance from this ideal reference. The optimal design can then be perturbated by introducing two weighting factors to observe the influence of stressing the importance of one objective with respect to the other (Equation (2)).
For each optimal Pareto front, five different combinations of economic and environmental weights are tested, as reported in Table 1.
D i s t = α e c o O b j e c o 2 + α e n v O b j e n v 2

3. Results

In the following section, the results of the optimal design process are shown for three different scenarios.
Each scenario increases the complexity of the hospital Energy System with the aim of highlighting the role of each technology in maximizing the advantage from the CHP in terms of cost and emissions.
First of all, in “SCENARIO 1”, the sizing of only the CHP unit is performed. This analysis aims to show the advantages of the CHP dynamic sizing.
In “SCENARIO 2”, the AD is added to the energy system. The presence of the AD increases the complexity of the sizing phase; in fact, its effects are dual. On the one hand, costs and emissions of SCG delivery to the hospital represent a new source of expenditure and environmental impact of the energy system. On the other hand, the biogas produced reduces the purchase of natural gas from the national grid, and consequently its cost and related emissions. Therefore, SCENARIO 2 allows us to analyze these aspects, seeking for an optimal configuration.
Finally, in “SCENARIO 3” the integration of ESs is analyzed to show how they can further improve the overall performance of the system. In particular, it is expected that TES would give advantages using the heat surplus of CHP units, whereas the BESS would help stabilize its electrical power production. The performance of the TES could be further enhanced using an advanced system such as TES with nano-incorporated phase change materials, which increase its performance in terms of velocity of charging/discharging and thermal behavior [40].
The three simulated scenario are summarized in the following:
  • SCENARIO 1—Optimal design of the CHP plant;
  • SCENARIO 2—Optimal design of the CHP plant integrated with the AD reactor;
  • SCENARIO 3—Optimal design of the CHP plant and the AD reactor, integrating TES and BESS.
All the results have been presented as relative variation with respect to the reference case where no CHP plant is installed, i.e., electric power provided by the grid, whereas thermal demand is supplied by the traditional boiler.

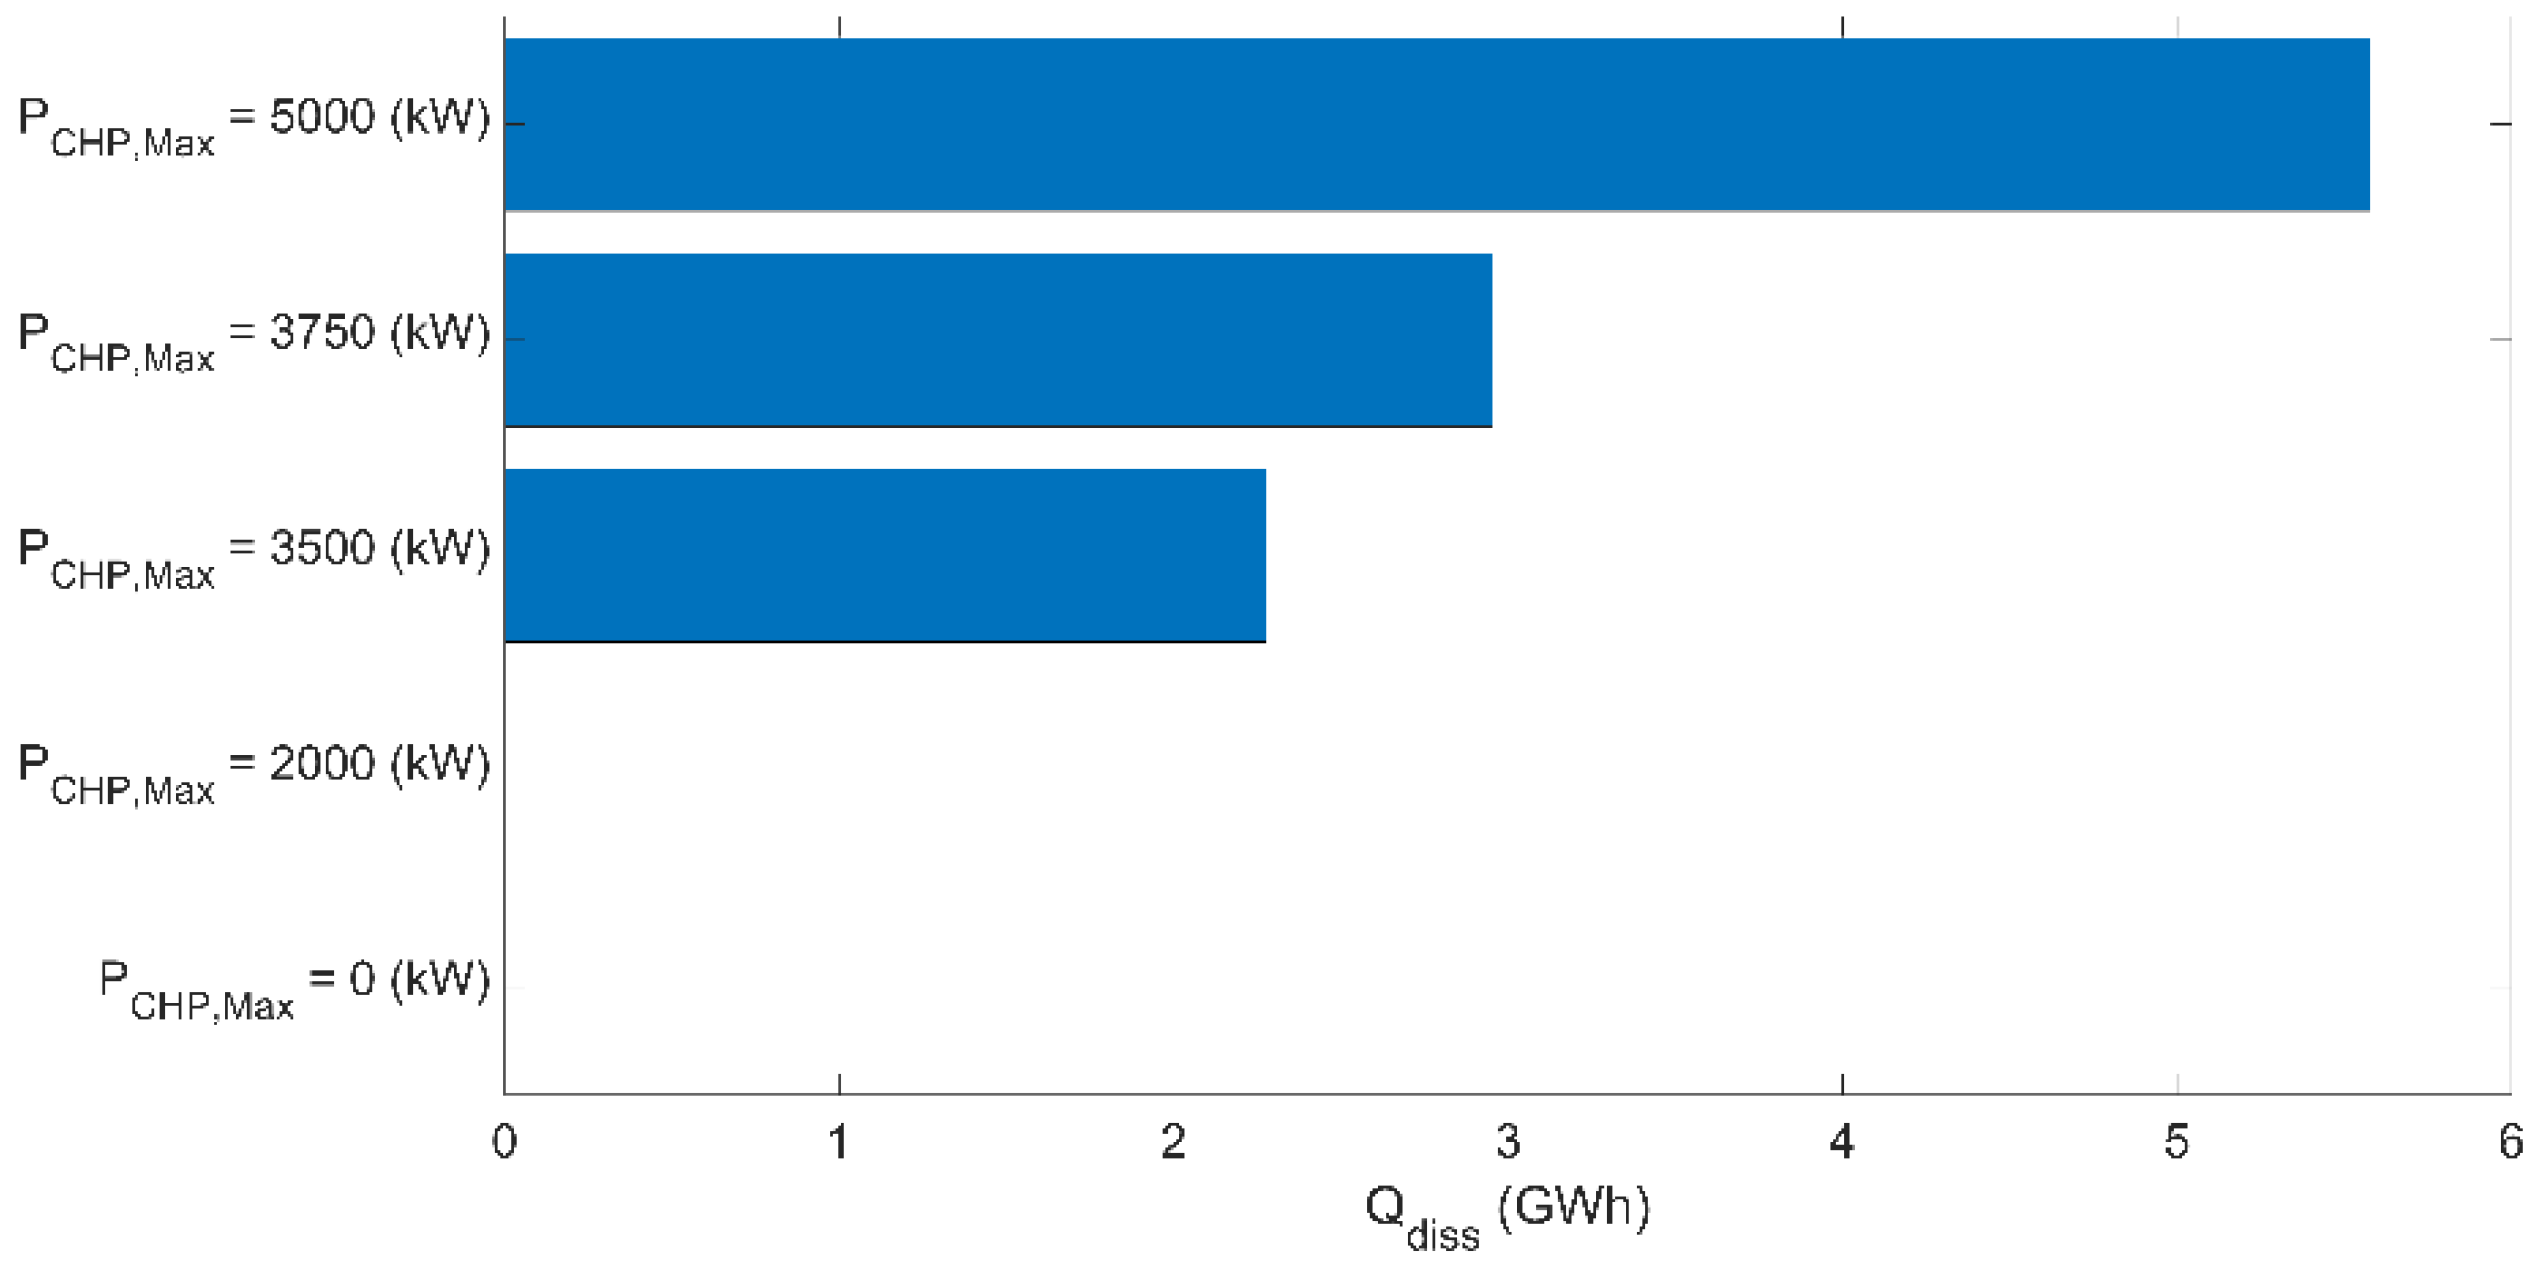
3.1. Scenario 1—CHP Optimal Design

In Figure 4, the Pareto fronts for all the simulated scenarios are reported in order to analyze the trade-off between the two objective variables reported as relative values with respect to the static design solution. In particular, the one referred to in Scenario 1 is reported in green stars. It can be noticed that, regardless of the CHP size, the advantages with respect to the reference case vary in a limited range. CO2 emissions are reduced between 8 to 10% at maximum, and cost benefits range from 37 to 40%. As a matter of fact, positive effects are observed both on the environmental and economic objectives in the optimal design range; however, limits are encountered due to the intrinsic characteristics of the thermal and electric demands.
Observing Figure 4, it can be noticed that potential benefits can be achieved also with respect to the static design solution both for the economic and environmental targets. Indeed, the dynamic optimization tends to increase the CHP size (Table 2) which is, however, limited by two main factors:
  • The loss of efficiency due to the waste heat occurring when electric and heat demands are not matched (Figure 5).
  • The investment and maintenance costs that increase with the CHP size.
Further considerations can be made by looking directly at the results of the best design choice based on the minimization of the distance from the ideal target (Table 2).
The CHP demonstrates its economic convenience up to a size of 5 MW, after which the positive effects saturate due to the reduction in the total efficiency and incentives. However, this configuration—obtaining the maximization of the weight of the economic objective—reduces the environmental benefits through PES, thus avoiding CO2 emissions. Increasing the weight of the environmental objective, the optimal CHP size progressively decreases, saturating at a size of 3.5 MW. Indeed, a CHP plant with a smaller size would lead to a reduction in PES as well.

3.2. Scenario 2—CHP and AD Optimal Design

The addition of AD in the energy system has a complex impact on the system performance. On one side, it increases its resilience to external disturbance; on the other side, it increases costs and partially favors the reduction in CO2 emissions. Considerations about the two latter aspects can be made looking at the results of the Pareto front and the sizing results as a function of the weighting factor (Figure 4—blue stars, and Table 3).
First of all, it can be noticed that the integration of biogas into the energy system allows for extending the limit of the maximum achievable benefits in terms of the environmental target. Savings up to 20% in CO2 emissions can be obtained by increasing the weight of the environmental factor in the objective function. It is worth recalling that the analysis also accounts for CO2 emissions related to feedstock transportation. However, due to the high cost of the SCG transportation system, the economic target results are negatively affected by this design solution, although savings up to 20% are achieved with respect to the reference case. In fact, if the weight of the economic target is increased, the optimization algorithm leads back to a design solution without the AD integration (Table 3).

3.3. Scenario 3—CHP, TES, BESS and AD Optimal Design

In CHP applications, ES technologies can help to increase the flexibility of the energy system, allowing for a greater match between electric and thermal demands. As a result, the integration of TES and a BESS positively affects the performance under several perspectives (Figure 4). In particular, it allows:
  • The extension of the maximum benefits achievable (up to 42% and 22%, respectively, for costs and emissions reductions);
  • The reduction in the carbon emissions at a given economic target.
Table 4 reports on the optimal design solution for different weighting factors. It can be observed that TES favors the most economically convenient solutions, extending the limits of the maximum size of the CHP plant. BESS instead plays a crucial role towards the reduction in the CO2 emissions since it allows for achieving high PES values also at a smaller CHP size.

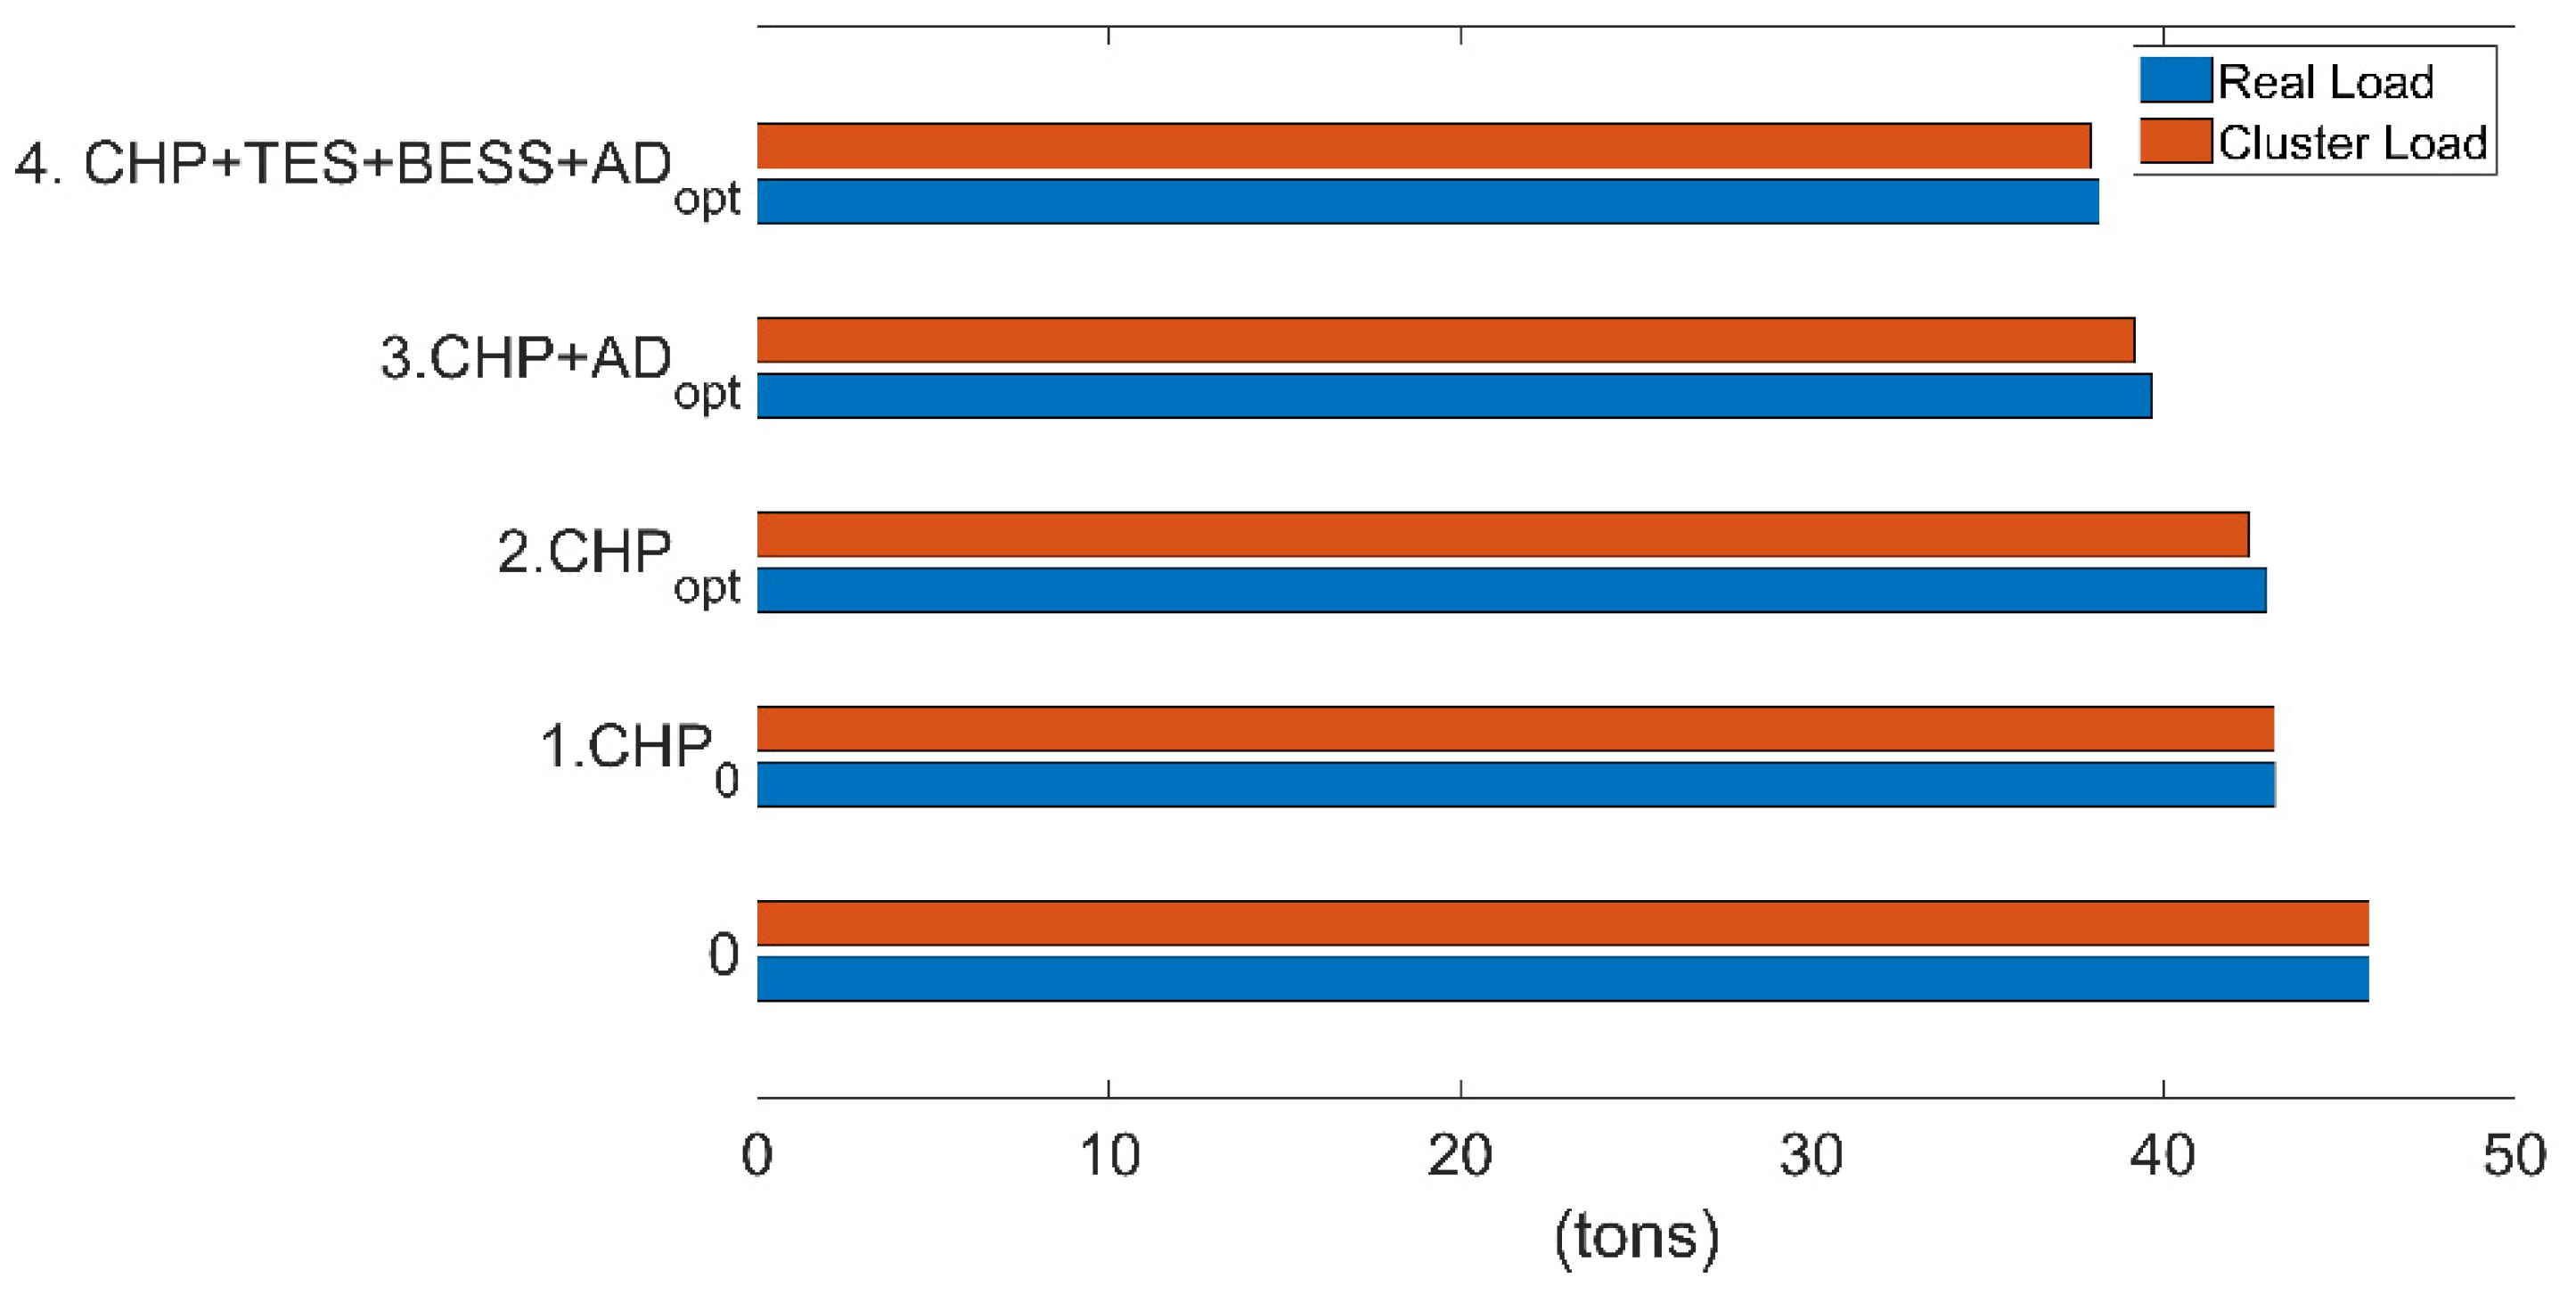
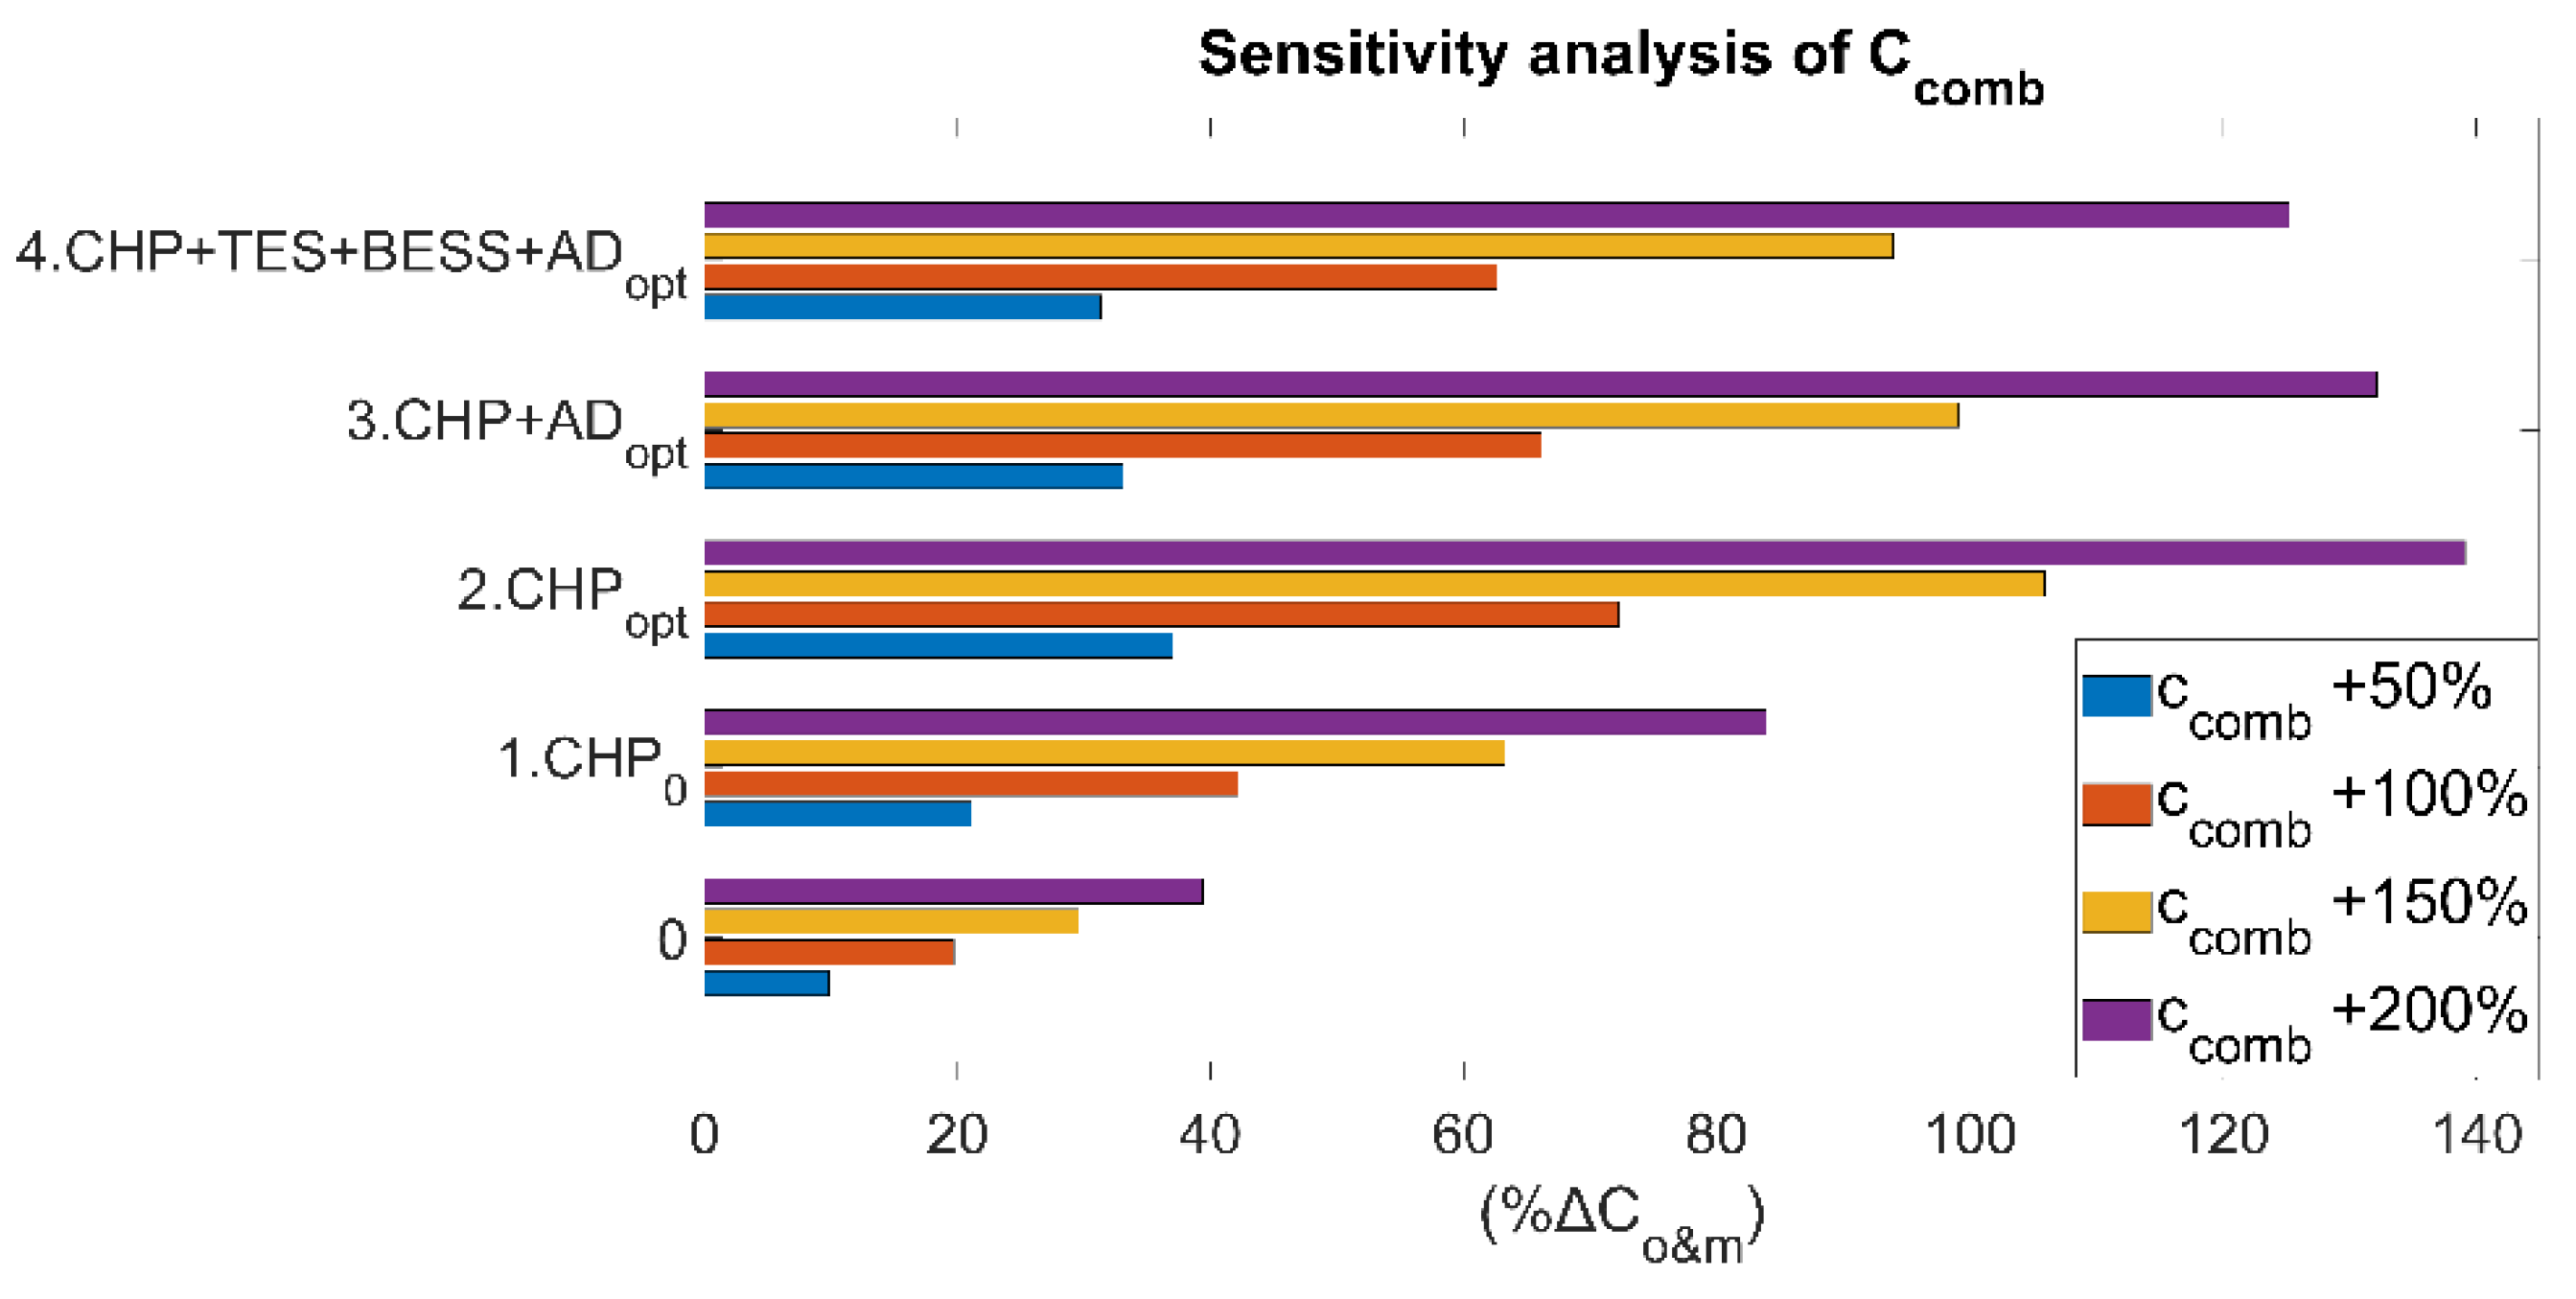
4. Discussion of the Results

Further analysis has been carried out on the balanced design solutions (αeco = αenv = 0.5) to thoroughly understand the differences among the performances of the scenarios.
First, the hospital energy system performances obtained using the clustered and the real data are compared in order to assess the robustness of the proposed approach. Figure 6 and Figure 7 show the total annual costs and the CO2 emissions per bed for all the simulated scenarios evaluated using either the real or the clustered load data. Results are always close each other (max deviation of about 2%), confirming that the synthesized load is representative of the dynamic behavior of the hospital electric and thermal demands. Moreover, the analysis offers significant benchmark parameters. In particular, it can be observed that the energy cost per bed in a standard configuration (CASE 0) is slightly below kEUR 12, and that the CHP unit can allow, if properly designed, to reduce this value up to a minimum of about 7 kEUR. The introduction of the AD and ESs leads to a slight increase in the total energy cost per bed (5.07% and 8.94%, respectively, for Scenario 2 and 3). However, the cost increase is counterbalanced by the reduction in the CO2 emissions that decrease by about 7.62% and 10.82% with respect to Scenario 1, respectively, for Scenarios 2 and 3.
A further discussion can be made observing the fraction of fossil primary energy consumption (FPEC) required to supply the energy consuming technologies (Figure 8). It can be, in fact, observed that moving towards more complex systems, the fraction of energy consumed at the boiler is significantly reduced (from 38 to about 15%). On the other hand, due to the increased CHP size, the percentage of FPEC is increased. The AD integration, as well as the integration of the ES technologies, leads to a general reduction in the overall FPEC (from 99 GWh to 91 and 88 GWh). The influence of the CHP on the FPEC is slightly decreased and it is compensated by a soft increase in either the boiler or the grid fractions. It is worth noting that for this calculation an efficiency of 47.6% for the grid is used as reported in [41].
Recent energy crises have made the resilience to energy sources market fluctuations crucial while evaluating the performance of an energy system. For this reason, a sensitivity analysis to the electricity and methane prices is performed.
As reported in Figure 9, all the configurations of the CHP powerplant perform better if compared with the reference case in response to changes in electricity price. Moreover, due the high size of the CHP plant, the energy system presents high sensitivity to the natural gas price (Figure 10). Due to the high cost of transportation of SCG, the natural gas savings by the AD has a marginal effect from the economic point of view. However, in Figure 10 it can be appreciated how the increase in the complexity of the energy system also increases its resilience to natural gas price fluctuations.

5. Conclusions

In this study, an optimal design methodology for a combined heat and power plant coupled to a thermal and electric energy storage system has been proposed and applied to a hospital building. System component sizes have been defined using a bi-level multi-objective optimization approach with the aim of minimizing both CO2 emissions and total costs (capital expenditures and operating expenses). Clustering analyses have been performed to carry out the design optimization with representative annual thermal and electric load profiles. The effects of the integration of different energy storage (ES) technologies and biogas produced by the anaerobic digestion (AD) of spent coffee grounds (SCG) into the combined heat and power (CHP) plant installed at the Tor Vergata Hospital (PTV) are evaluated in terms of primary energy savings, GHG emissions, and economic convenience of the overall energy system.
The major findings of the work can be resumed in the following points.
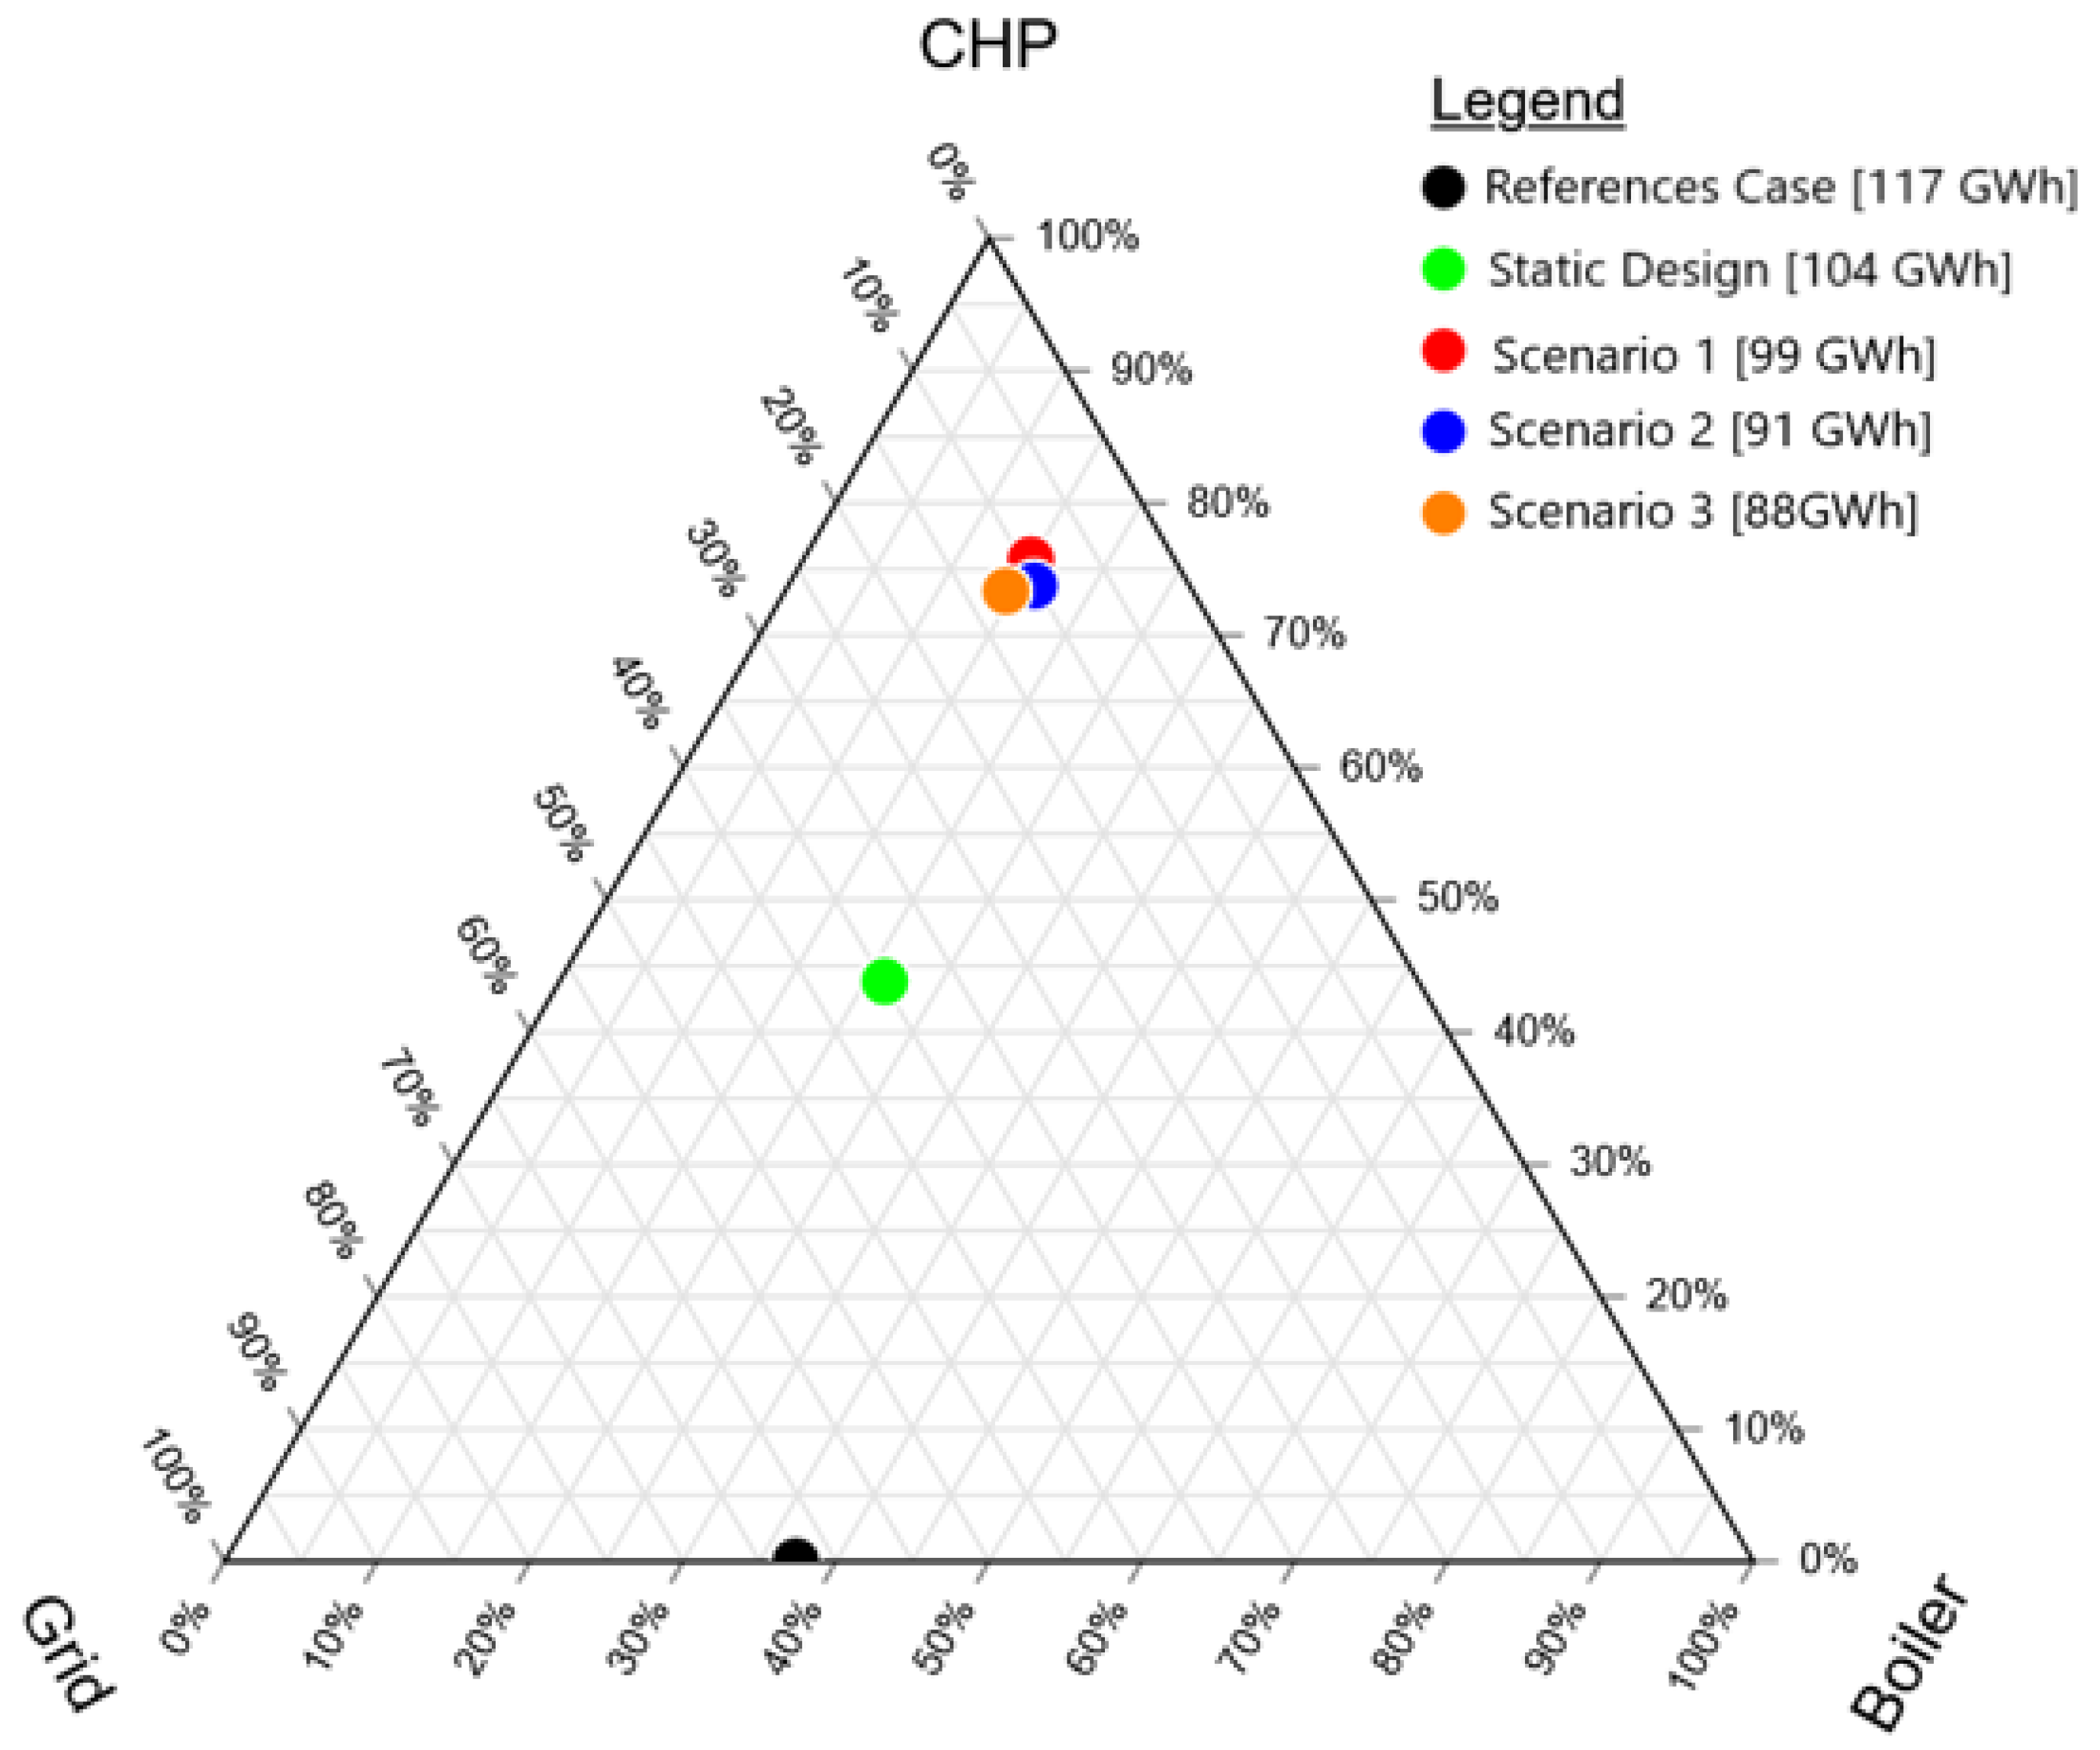
  • Compared with a static design, a dynamic procedure would allow for achieving better performance in terms of both economic and environmental perspectives.
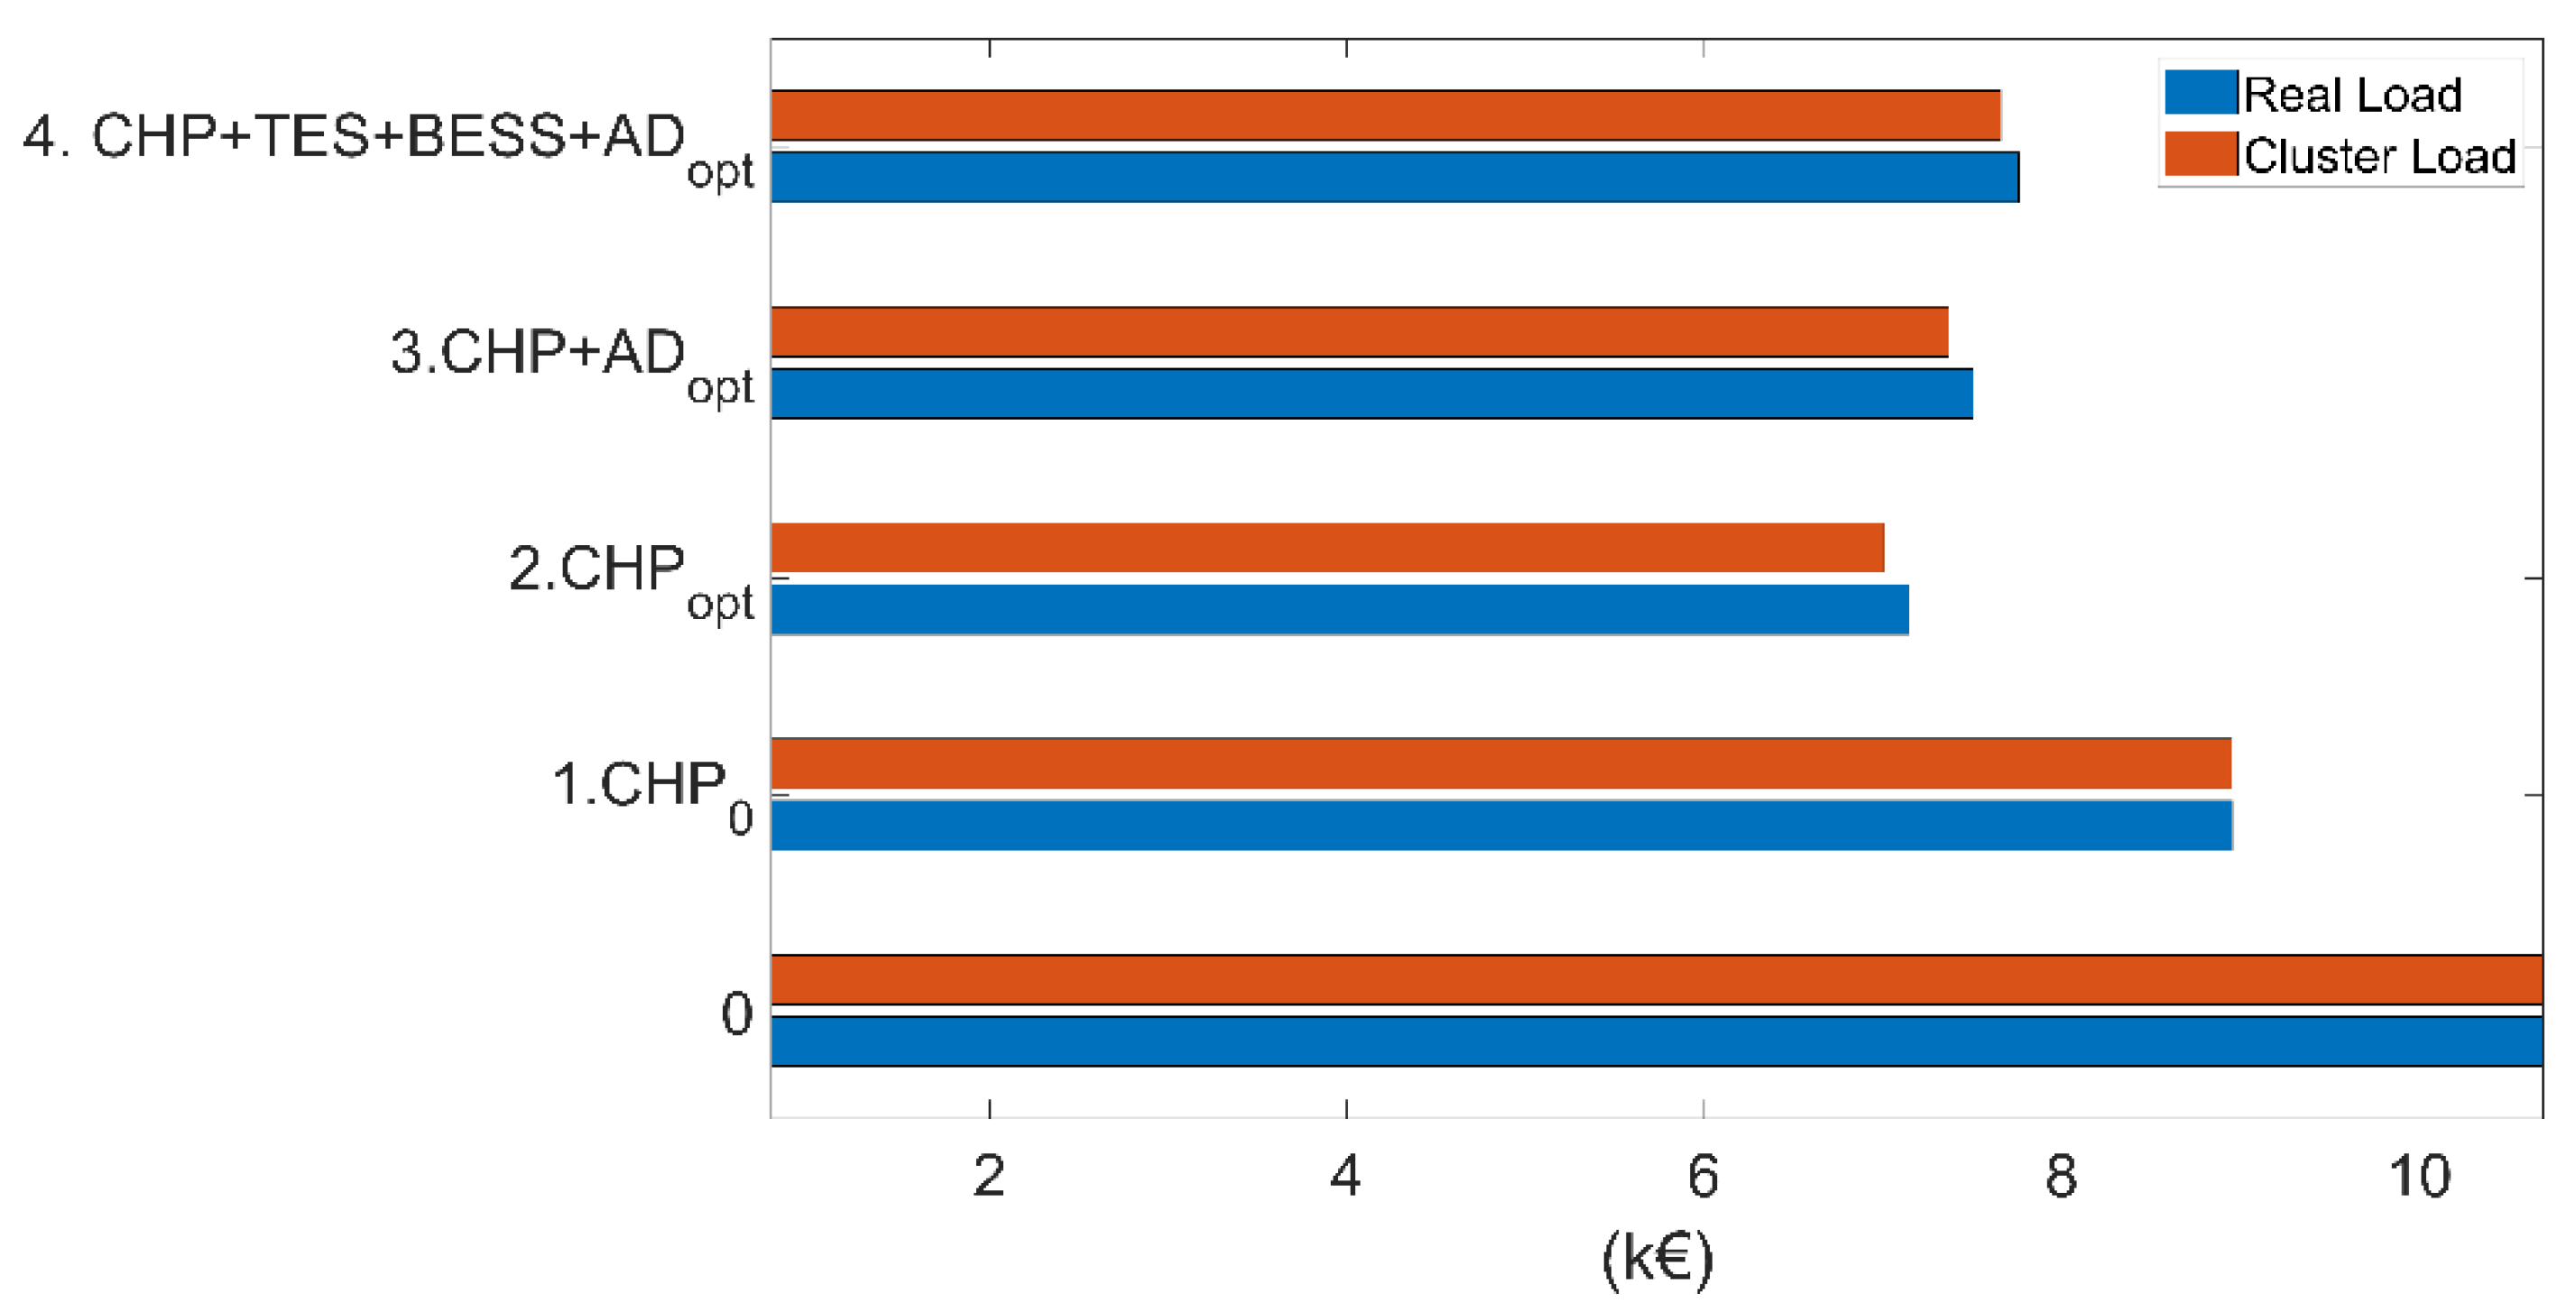
  • The minimum total energy cost per bed is achieved for the optimized CHP plant at about 7 kEUR/per bed, whereas to achieve the best performance in terms of CO2 emissions, the integration of the AD process and ES technologies is needed, allowing to reduce the carbon foot print up to about 38 tons/per bed.
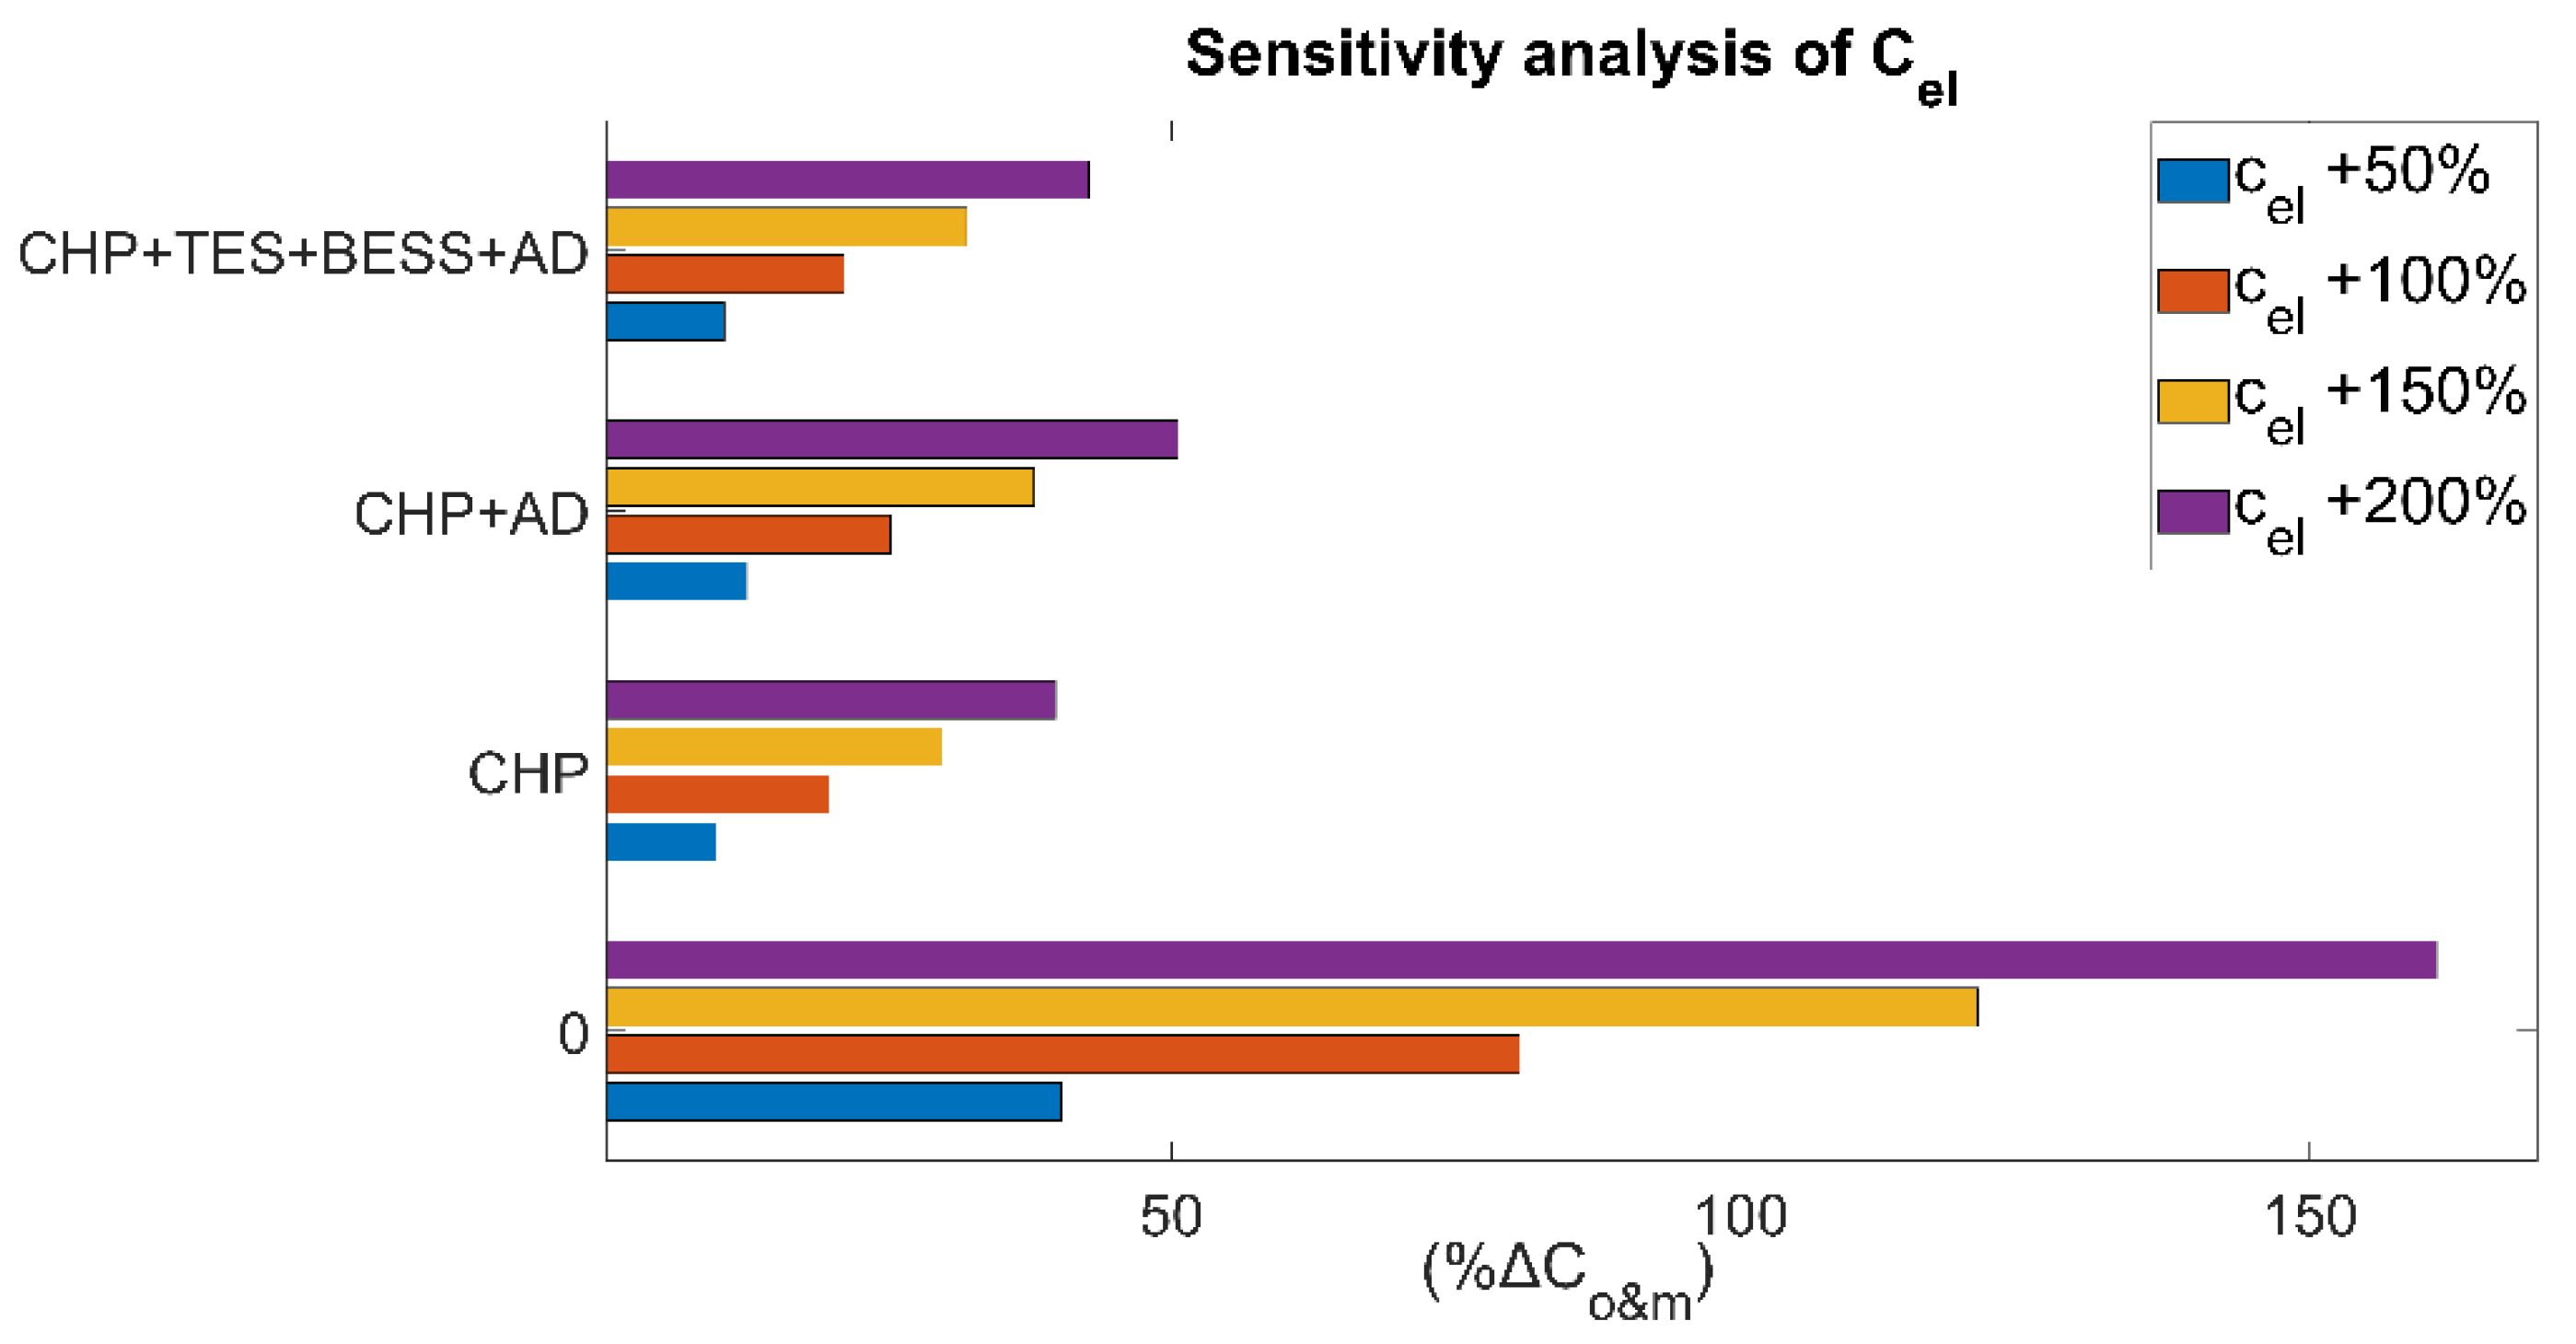
  • The introduction of biogas from SCG AD helps to extend the positive influence on CO2 emissions (saving up to 20% with respect to the reference case), but it negatively affects the economic performance due to the high costs of transportation.
  • Further benefits both in terms of economic and environmental targets can be achieved through a proper design of the Thermal and Battery Energy Storages—with maximum obtainable savings up to 42% and 22%, respectively, increasing costs and the emission weighing factor.

Author Contributions

Conceptualization, L.B. and S.C.; methodology, L.B.; software, E.D.M.; validation, E.D.M. and L.B.; formal analysis, E.D.M.; data curation, E.D.M. and L.B.; writing—original draft preparation, E.D.M. and L.B.; writing—review and editing, V.M. and S.C.; supervision, S.C. All authors have read and agreed to the published version of the manuscript.

Funding

This research received no external funding.

Conflicts of Interest

The authors declare no conflict of interest.

Nomenclature

ElementDescription
ADAnaerobic Digestion
BESSBattery Energy Storage System
CHPCombined Heat and Power
CRFActualization Factor
ESEnergy Storage
FPECFossil Primary Energy Consumption
GAGenetic Algorithm
GHGGreenhouse Gas
HE-CHPhigh-efficiency incentives
ICEInternal Combustion Engine
MESsMulti Energy Systems
PESPrimary Energy Saving
PHRPower to Heat Ratio
PVPhotovoltaic
PTVPoliclinico Tor Vergata
SCGSpent Coffee Ground
TESThermal Energy Storage
α e c o
Economic weight
α e n v
Environmental weight
O b j e c o
Economic Objective
O b j e n v
Environmental Objective
η e l   c h p
Electric efficiency of CHP unit
η t h   c h p
Thermal efficiency of CHP unit
η e l   r i f
Reference efficiencies for standalone electric energy conversion
η t h   r i f
Reference efficiencies for standalone thermal energy conversion

Appendix A

In this section, the data used for the Anaerobic Digestion modeling are explained. All the information for AD is computed as a function of the hourly production of biomethane ( C H 4 A D ,   k W h ). This is evaluated using Cumulative Methane Production (CMPHRT) during the Hydraulic Retention Time (HRT) of the SCG.
These data are taken from the scientific literature [16,42,43] as:
  • HRT: 28 days
  • CMPHRT: 0.314 lCH4/gVS;
  • TREACTOR: 35 °C.
The electrical power required by the digester (PAD) is calculated as 9.32% of the power obtainable by the electric conversion of the biogas into electricity, as reported in [44], whereas the thermal power needed for the AD process (QAD) is the heat flow required to keep constant the temperature of the reactor. It is, therefore, equal to the heat dispersion due to the heat flow along the reactor walls and the sensible heat losses in the daily charge/discharge of reactor for heating the SCG in input and exit of the warm digestate and it has been estimated by numerical simulation equal to 28.9% of the power obtainable by the electric conversion of the biogas into electricity.
The CO2 emissions related to the transportation of SCG ( C O 2 , A D )   have been accounted as described in Equation (A5) [45].
The operation and maintenance costs, as well as the investment costs are evaluated as a function of the nominal ICE power [46] and the digester size, both function of the nominal power of the AD system [47].
Thus, the final equations are:
C i n v , A D = 0.0751 · C H 4 A D 2   + 879.5 · C H 4 A D   + 17736
C o s t o & m , A D = 0.0.396 · C H 4 A D 2 + 72.65 · C H 4 A D   + 454.56
P A D = 0.0363 · C H 4 A D    
Q A D = 0.289 · C H 4 A D    
C O 2 , A D = 8.418 · C H 4 A D 2

Appendix B

The dynamic design of the energy system is carried out by using a bi-level optimization approach. The upper-level multi-objective GA has annual cost and annual emissions of CO2 as objective functions. They are described in Equations (A6) and (A7), respectively:
O b j e c o = C i n v + C o & m = C F R C i n v , c h p · P m a x , c h p + C i n v , T E S · C T E S 1 + c o & m , T E S + C i n v , B E S S · C B E S S 1 + c o & m , B E S S + C i n v , A D f C H 4 A D + + i = 0 n w e e k k = 0 h w e e k E k , g r i d i · c e l + E k , c h p i · c m , c h p η t h   c h p η e l   r i f η t h   r i f + 1 η e l   c h p + 1 η e l   c h p · c c + 1 η e l   c h p · c N G c N G · C H 4 A D + E k , b o i l e r i η b o i l e r · c N G + E k , t h i d i s s η T r i f · c c + E k T E S i · δ s d c h , T E S + 1 η T E S · c c + E c h k , B E S S i · δ s d c h , B E S S + 1 η B E S S · c c + E k P V i · c o & m , P V + C o s t o & m , A D f C H 4 A D
O b j e n v = C O 2 , N G + C O 2 ,   g r i d + C O 2 ,   A D = i = 0 n w e e k k = 0 h w e e k E k , i g r i d · e C O 2 , g r i d + E k , i c h p η e l   c h p C H 4 A D + E k , i b o i l e r η e l   b o i l e r · e C O 2 , N G + C O 2 , A D f C H 4 A D
The components sizing constraints are reported in Table A1.
Table A1. Component sizing constraints.
# Lower LimitUpper Limit
1 P m a x , c h p 07000(kW)
2 C T E S 045,000(kWh)
3 C B E E S 06000(kWh)
4 C H 4 A D 02000(kWh)
GA choses the sizes of the energy system elements, then the optimal energy flow is scheduled by a low-level Mixed Integer Linear Programming (MILP) algorithm.
The objective function of MILP algorithm is the operating and maintenance evaluated as reported in Equation (A8).
O b j M I L P = i = 0 n w e e k k = 0 h w e e k E k , g r i d i · c e l + E k , c h p i · c m , c h p η t h   c h p η e l   r i f η t h   r i f + 1 η e l   c h p + 1 η e l   c h p · c c + 1 η e l   c h p · c N G c N G · C H 4 A D + E k , b o i l e r i η b o i l e r · c N G + E k , t h i d i s s η T r i f · c c + E k T E S i · δ s d c h , T E S + 1 η T E S · c c + E c h k , B E S S i . δ s d c h , B E S S + 1 η B E S S · c c + E k P V i · c o & m , P V + C o s t o & m , A D f C H 4 A D
The constraints of the MILP in its more general definition are:
P g r 0
P c a l 0
P t h   d i s s 0
P c h p   m a x P c h p P c h p   m i n * b i n c h p
1 b i n c h p 0
E b a t t   m a x E b a t t 0
E b a t t   m a x d t * b i n b a t t   c h P b a t t   c h 0
1 b i n b a t t   c h 0
1 b i n b a t t   d i s c h 0
E t e s   m a x E t e s 0
E t e s   m a x d t * b i n t e s   c h P t e s   c h 0
E t e s   m a x d t * b i n t e s   d i s c h P t e s   d i s c h 0
1 b i n t e s   c h 0
1 b i n t e s   d i s c h 0
b i n t e s   c h + b i n t e s   d i s c h 1
P g r + P c h p 1 d t * s d r b a t t * η b a t t * P b a t t   c h + P b a t t   d i s c h = P e l P p v
P c a l + P c h p * η t h   c h p η e l   c h p P t h   d i s s 1 d t * s d r t e s * η t e s * P t e s   c h + P t e s   d i s c h = P t h
Table A2. Nomenclature of the equations.
ElementDescription
ccHigh Efficiency incentives (EUR/kWh)
c e l Electricity cost (EUR/kWhel)
c N G Natural Gas cost (EUR/kWhth)
C B E S S Battery Energy Storage System Capacity (kWh)
C T E S Thermal Energy Storage Capacity (kWh)
C i n v Capital cost of ES (EUR)
C i n v , A D Capital cost of Thermal Anaerobic Digestion System (EUR)
C i n v , B E S S Capital cost of Battery Energy Storage System (EUR/kWh)
C i n v , c h p Annual Capital cost of CHP unit (EUR/kWh)
C i n v , T E S Capital cost of Thermal Energy Storage (EUR/kWh)
c m , c h p Maintenance cost of CHP unit (EUR/kWhth)
C o & m Operation and Maintenance cost of the system (EUR)
C o s t o & m , A D Total Transport, Operation and Maintenance cost of the Anaerobic Digestion System (EUR)
C o & m , B E S S Operation and Maintenance cost of the Battery Energy Storage System (EUR/kWh)
C o & m , p v Operation and Maintenance cost of PV (EUR/kWh)
C o & m , T E S Operation and Maintenance cost of the Thermal Energy Storage (EUR/kWh)
C H 4 A D Hourly production of methane form Anaerobic Digestion (kWh)
C O 2 , A D Carbon Footprint due to the SCG transportation (tCO2)
C O 2 , g r i d Carbon Footprint due to the grid (tCO2)
C O 2 , N G Carbon Footprint due to the NG consumption (tCO2)
e C O 2 , g r i d Emission factor of the electric grid (gCO2/kWhel)
e C O 2 , N G Emission factor of the natural gas (gCO2/kWhth)
E c h k , B E S S i Charging energy of the Battery Energy Storage System at time step k of week i (kWh)
E k ,   b o i l e r i Thermal energy of the boiler at time step k of week i (kWh)
E k ,   c h p i Electric energy of the CHP at time step k of week i (kWh)
E k ,   D i s s i Dissipated Thermal Energy of the CHP unit (thermal energy not used in CHP mode) at time step k of week i (kWh)
E k ,   g r i d i Electric energy from the grid at time step k of week i (kWh)
E k ,   P V i Electric energy produced by PV at time step k of week i (kWh)
E k ,   T E S i Thermal energy from the TES at time step k of week i (kWh)
h w e e k number of hours in a week (168)
n w e e k number of weeks in a year (52)
P m a x , c h p Maximum Power of the CHP Unit
δ s d c h , B E E S Self-discharge index of the Electric Energy Storage
δ s d c h , T E S Self-discharge index of the Thermal Energy Storage
η B E S S Round-trip efficiency of Battery Energy Storage System
η b o i l e r Boiler efficiency
η e l ,   c h p Electric conversion efficiency of the CHP Unit
η t h   ,   c h p Thermal conversion efficiency of the CHP unit
η e l ,   r i f Reference electric efficiency
η t h ,   r i f Reference thermal efficiency
η T E S Round-trip efficiency of Thermal Energy Storage

References

  1. Available online: https://www.un.org/development/desa/en/news/population/world-population-prospects-2019.html (accessed on 13 December 2021).
  2. Available online: https://unfccc.int/process-and-meetings/the-paris-agreement/the-glasgow-climate-pact-key-outcomes-from-cop26 (accessed on 13 December 2021).
  3. Jiang, P.; Van Fan, Y.; Klemeš, J.J. Impacts of COVID-19 on energy demand and consumption: Challenges, lessons and emerging opportunities. Appl. Energy 2021, 285, 116441. [Google Scholar] [CrossRef] [PubMed]
  4. European Commission. A Clean Planet for All. A European Long-Term Strategic Vision for a Prosperous, Modern, Competitive and Climate Neutral Economy. 2018. Available online: https://eur-lex.europa.eu/legal-content/EN/TXT/PDF/?uri=CELEX:52018DC0773&from=EN (accessed on 15 December 2021).
  5. European Parliament and the Council. Directive 2008/98/EC of the European Parliament and of the Council. In Fundamental Texts On European Private Law; European Parliament and The Council: Strasbourg, France, 2020; pp. 3–30. [Google Scholar]
  6. Available online: https://www.ieabioenergy.com/blog/task/biorefining-sustainable-processing-of-biomass-into-a-spectrum-of-marketable-biobased-products-and-bioenergy/ (accessed on 14 December 2021).
  7. Kirk, N.K.; Navarrete, C.; Juhl, J.E.; Martínez, J.L.; Procentese, A. The “zero miles product” concept applied to biofuel production: A case study. Energies 2021, 14, 565. [Google Scholar] [CrossRef]
  8. Park, S.; Jeong, H.-R.; Shin, Y.-A.; Kim, S.-J.; Ju, Y.-M.; Oh, K.-C.; Cho, L.-H.; Kim, D. Performance optimisation of fuel pellets comprising pepper stem and coffee grounds through mixing ratios and torrefaction. Energies 2021, 14, 4667. [Google Scholar] [CrossRef]
  9. Brunerová, A.; Roubik, H.; Brožek, M.; Haryanto, A.; Hasanudin, U.; Iryani, D.A.; Herak, D. Valorization of bio-briquette fuel by using spent coffee ground as an external additive. Energies 2019, 13, 54. [Google Scholar] [CrossRef] [Green Version]
  10. Available online: https://www.bio-bean.com/ (accessed on 10 December 2021).
  11. Massaya, J.; Pereira, A.P.; Mills-Lamptey, B.; Benjamin, J.; Chuck, C.J. Conceptualization of a spent coffee grounds biorefinery: A review of existing valorisation approaches. Food Bioprod. Process. 2019, 118, 149–166. [Google Scholar] [CrossRef]
  12. Battista, F.; Zanzoni, S.; Strazzera, G.; Andreolli, M.; Bolzonella, D. The cascade biorefinery approach for the valorization of the spent coffee grounds. Renew. Energy 2020, 157, 1203–1211. [Google Scholar] [CrossRef]
  13. Atabani, A.E.; Al-Muhtaseb, A.H.; Kumar, G.; Saratale, G.D.; Aslam, M.; Khan, H.A.; Sid, Z.; Mahmoud, E. Valorization of spent coffee grounds into biofuels and value-added products: Pathway towards integrated bio-refinery. Fuel 2019, 254, 115640. [Google Scholar] [CrossRef]
  14. Rajesh Banu, J.; Kavitha, S.; Kannah, R.Y.; Kumar, M.D.; Preethi Atabani, A.E.; Kumar, G. Biorefinery of spent coffee grounds waste: Viable pathway towards circular bioeconomy. Bioresour. Technol. 2020, 302, 122821. [Google Scholar] [CrossRef]
  15. Mayson, S.; Williams, I.D. Applying a circular economy approach to valorize spent coffee grounds. Resour. Conserv. Recycl. 2021, 172, 105659. [Google Scholar] [CrossRef]
  16. Kim, J.; Kim, H.; Baek, G.; Lee, C. Anaerobic co-digestion of spent coffee grounds with different waste feedstocks for biogas production. Waste Manag. 2017, 60, 322–328. [Google Scholar] [CrossRef]
  17. Rivera, X.C.S.; Gallego-Schmid, A.; Najdanovic-Visak, V.; Azapagic, A. Life cycle environmental sustainability of valorisation routes for spent coffee grounds: From waste to resources. Resour. Conserv. Recycl. 2020, 157, 104751. [Google Scholar] [CrossRef]
  18. Van Keulen, M.; Kirchherr, J. The implementation of the circular economy: Barriers and enablers in the coffee value chain. J. Clean. Prod. 2021, 281, 125033. [Google Scholar] [CrossRef]
  19. Matrapazi, V.K.; Zabaniotou, A. Experimental and feasibility study of spent coffee grounds upscaling via pyrolysis towards proposing an eco-social innovation circular economy solution. Sci. Total Environ. 2020, 718, 137316. [Google Scholar] [CrossRef] [PubMed]
  20. Vakalis, S.; Moustakas, K.; Benedetti, V.; Cordioli, E.; Patuzzi, F.; Loizidou, M.; Beratieri, M. The “COFFEE BIN” concept: Centralized collection and torrefaction of spent coffee grounds. Environ. Sci. Pollut. Res 2019, 26, 35473–35481. [Google Scholar] [CrossRef] [PubMed]
  21. Vicidomini, M.; Wang, Q.; Chu, W.; Calise, F.; Duić, N. Recent Advances in technology, strategy and application of sustainable energy systems. Energies 2020, 13, 5229. [Google Scholar] [CrossRef]
  22. The European Parliament and the Council of the European Union. Directive 2012/27/EU of the European Parliament and of the Council of 25 October 2012 on Energy Efficiency. 2012. Available online: https://www.legislation.gov.uk/eudr/2012/27/contents (accessed on 3 December 2021).
  23. Calise, F.; Vicidomini, M.; Costa, M.; Wang, Q.; Østergaard, P.A.; Duić, N. Toward an efficient and sustainable use of energy in industries and cities. Energies 2019, 12, 3150. [Google Scholar] [CrossRef] [Green Version]
  24. Paine, S.; James, P.; Bahaj, A.B. Evaluating CHP management and outputs using simple operational data. Int. J. Low-Carbon Technol. 2018, 13, 109–115. [Google Scholar] [CrossRef] [Green Version]
  25. Vialetto, G.; Noro, M. An innovative approach to design cogeneration systems based on big data analysis and use of clustering methods. Energy Convers. Manag. 2020, 214, 112901. [Google Scholar] [CrossRef]
  26. Testi, D.; Conti, P.; Schito, E.; Urbanucci, L.; D’Ettorre, F. Synthesis and optimal operation of smart microgrids serving a cluster of buildings on a campus with centralized and distributed hybrid renewable energy units. Energies 2019, 12, 745. [Google Scholar] [CrossRef] [Green Version]
  27. Wang, Y.; Yu, H.; Yong, M.; Huang, Y.; Zhang, F.; Wang, X. Optimal scheduling of integrated energy systems with combined heat and power generation, photovoltaic and energy storage considering battery lifetime loss. Energies 2018, 11, 1360. [Google Scholar] [CrossRef] [Green Version]
  28. Kaffash, M.; Ceusters, G.; Deconinck, G. Interval optimization to schedule a multi-energy system with data-driven PV uncertainty representation†. Energies 2021, 14, 2739. [Google Scholar] [CrossRef]
  29. Alavijeh, N.M.; Steen, D.; Norwood, Z.; Tuan, L.A.; Agathokleous, C. Cost-effectiveness of carbon emission abatement strategies for a local multi-energy system—A case study of chalmers university of technology campus. Energies 2020, 13, 1626. [Google Scholar] [CrossRef] [Green Version]
  30. Wang, Y.; Lu, Y.; Ju, L.; Wang, T.; Tan, Q.; Wang, J.; Tan, Z. A Multi-objective scheduling optimization model for hybrid energy system connected with wind-photovoltaic-conventional gas turbines, CHP Considering heating storage mechanism. Energies 2019, 12, 425. [Google Scholar] [CrossRef] [Green Version]
  31. Ghiasi, M.; Niknam, T.; Dehghani, M.; Siano, P.; Alhelou, H.H.; Al-Hinai, A. Optimal multi-operation energy management in smart microgrids in the presence of ress based on multi-objective improved de algorithm: Cost-emission based optimization. Appl. Sci. 2021, 11, 3661. [Google Scholar] [CrossRef]
  32. Bartolucci, L.; Cordiner, S.; Mulone, V.; Santarelli, M.; Lombardi, P.; Arendarski, B. Towards net zero energy factory: A multi-objective approach to optimally size and operate industrial flexibility solutions. Int. J. Electr. Power Energy Syst. 2021, 137, 107796. [Google Scholar] [CrossRef]
  33. Bartolucci, L.; Cordiner, S.; Mulone, V.; Pasquale, S.; Sbarra, A. Design and management strategies for low emission building-scale Multi Energy Systems. Energy 2022, 239, 122160. [Google Scholar] [CrossRef]
  34. Wu, C.; Gu, W.; Xu, Y.; Jiang, P.; Lu, S.; Zhao, B. Bi-level optimization model for integrated energy system considering the thermal comfort of heat customers. Appl. Energy 2018, 232, 607–616. [Google Scholar] [CrossRef]
  35. Carrasqueira, P.; Alves, M.J.; Antunes, C.H. Bi-level particle swarm optimization and evolutionary algorithm approaches for residential demand response with different user profiles. Inf. Sci. 2017, 418, 405–420. [Google Scholar] [CrossRef] [Green Version]
  36. Morvaj, B.; Evins, R.; Carmeliet, J. Bi-level optimisation of distributed energy systems incorporating non-linear power flow constraints. In Proceedings of the International Conference CISBAT 2015 Future Buildings and Districts Sustainability from Nano to Urban Scale, Lausanne, Switzerland, 9–11 September 2015; pp. 859–864. [Google Scholar]
  37. Gestore dei Servizi Energetici (GSE). Guida alla cogenerazione ad alto rendimento. Aggiorn. Ed. 2018, 6, 1–18. [Google Scholar]
  38. Available online: https://aprireunbar.com/2017/03/13/quante-tazzine-prepara-in-media-un-bar-e-quanto-costa-una-tazzina-di-caffe-in-italia/ (accessed on 3 December 2021).
  39. Bischi, A.; Taccari, L.; Martelli, E.; Amaldi, E.; Manzolini, G.; Silva, P.; Campanari, S.; Macchi, E. A rolling-horizon optimization algorithm for the long term operational scheduling of cogeneration systems. Energy 2019, 184, 73–90. [Google Scholar] [CrossRef]
  40. Alhuyi Nazari, M.; Maleki, A.; El Haj Assad, M.; Rosen, M.A.; Haghighu, A.; Sharabaty, H.; Chen, L. A review of nanomaterial incorporated phase change materials for solar thermal energy storage. Sol. Energy 2020, 228, 725–743. [Google Scholar] [CrossRef]
  41. Gazzetta Ufficiale dell’Unione Europea. Direttiva (UE) 2018/2002 del Parlamento Europeo e Del Consiglio. Available online: https://eur-lex.europa.eu/legal-content/IT/TXT/PDF/?uri=CELEX:32018L2002&from=EN (accessed on 13 December 2021).
  42. Atelge, M.R.; Atabani, A.E.; Abut, S.; Kaya, M.; Eskicioglu, C.; Semaan, G.; Lee, C.; Yildiz, Y.S.; Unalan, S.; Mohanasundraram, R.; et al. Anaerobic co-digestion of oil-extracted spent coffee grounds with various wastes: Experimental and kinetic modeling studies. Bioresour. Technol. 2020, 322, 124470. [Google Scholar] [CrossRef] [PubMed]
  43. Vítěz, T.; Koutný, T.; Šotnar, M.; Chovanec, J. On the spent coffee grounds biogas production. Acta Univ. Agric. Silvic. Mendel. Brun. 2016, 64, 1279–1282. [Google Scholar] [CrossRef] [Green Version]
  44. Zepter, J.M.; Engelhardt, J.; Gabderakhmanova, T.; Marinelli, M. Empirical validation of a biogas plant simulation model and analysis of biogas upgrading potentials. Energies 2021, 14, 2424. [Google Scholar] [CrossRef]
  45. Bortolini, M.; Faccio, M.; Ferrari, E.; Gamberi, M.; Pilati, F. Fresh food sustainable distribution: Cost, delivery time and carbon footprint three-objective optimization. J. Food Eng. 2016, 174, 56–67. [Google Scholar] [CrossRef]
  46. EPA. U.S. Environmental Protection Agency Combined Heat and Power Partnership. 2017. Available online: https://www.epa.gov/chp (accessed on 3 December 2021).
  47. Banzato, D. Analisi Economica Degli Impianti di Digestione Anaerobica. 2016. Available online: http://levicases.unipd.it/wp-content/uploads/2016/11/Banzato-modalità-compatibilità.pdf (accessed on 3 December 2021).
Figure 1. Tor Vergata Polyclinic.
Energies 15 00858 g001
Figure 2. Load duration curve of thermal end electric load of the hospital.
Energies 15 00858 g002
Figure 3. Thermal and electric clusters with clusters centroid.
Energies 15 00858 g003
Figure 4. Optimal design Pareto front—Scenario 1.
Energies 15 00858 g004
Figure 5. Heat waste as a function of the CHP size for Scenario 1.
Energies 15 00858 g005
Figure 6. Total annual cost per bed.
Energies 15 00858 g006
Figure 7. CO2 annual emission per bed.
Energies 15 00858 g007
Figure 8. Fossil primary energy consumption fraction among the different consumption technologies.
Energies 15 00858 g008
Figure 9. Sensitivity analysis of cost of electricity.
Energies 15 00858 g009
Figure 10. Sensitivity analysis of cost of methane.
Energies 15 00858 g010
Table 1. Weight of economic and environmental weight.
#Combinationαecoαenv
110
20.750.25
30.50.5
40.250.75
501
Table 2. Result of choice of CHP size from Pareto front.
#αecoαenvSizeCHPDistance from Ideal
11050000.606715
20.750.2547500.696809
30.50.537500.773042
40.250.7535000.839668
50135000.90013
Table 3. Result of choice of CHP and AD sizes from Pareto front.
#αecoαenvSizeCHP (kWel)SizeAD
(kWth)
Distance from Ideal
110500000.606715
20.750.2550002500.696498604
30.50.537508500.768223141
40.250.75375019500.800594604
501350020000.804014218
Table 4. Result of choice of CHP, TES, BESS, and AD sizes from pareto front.
#αecoαenvSizeCHP (kWel)SizeAD (kWth)SizeTES (kWhth)SizeBESS (kWhel)Distance from Ideal
1105750035,00000.588610647
20.750.255750035,00000.692419719
30.50.5350090030,00030000.760299511
40.250.754000200035,00030000.784488196
5013500200025,00060000.78281029
Publisher’s Note: MDPI stays neutral with regard to jurisdictional claims in published maps and institutional affiliations.

