
Online Wind-Atlas Databases and GIS Tool Integration for Wind Resource Assessment: A Spanish Case Study

 ,
,  ,
,  and
and 
Abstract
1. Introduction
2. Methodology
3. Systematic Reviews
4. Meta-Analysis
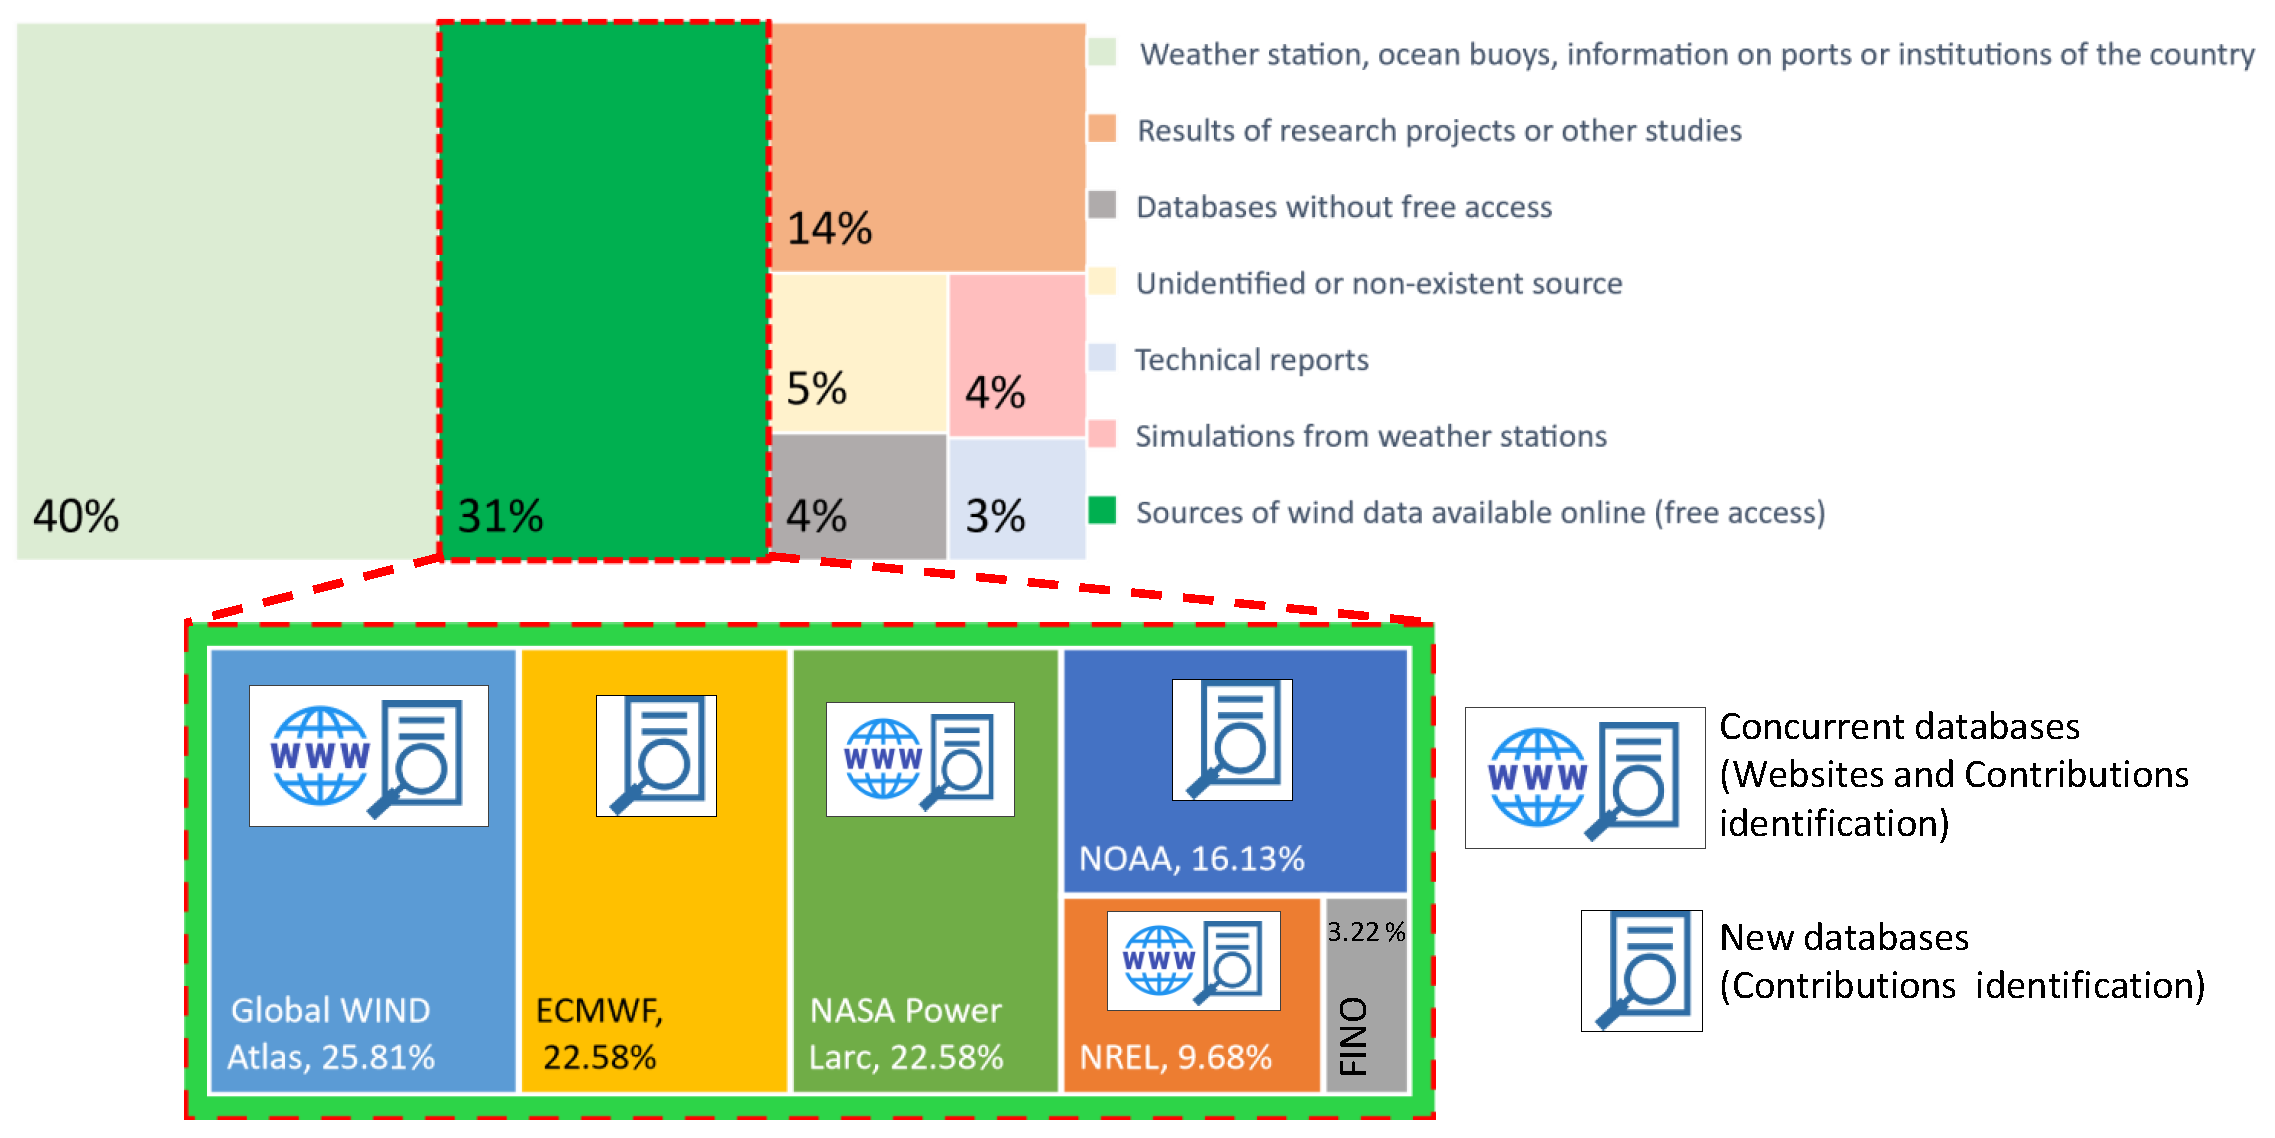
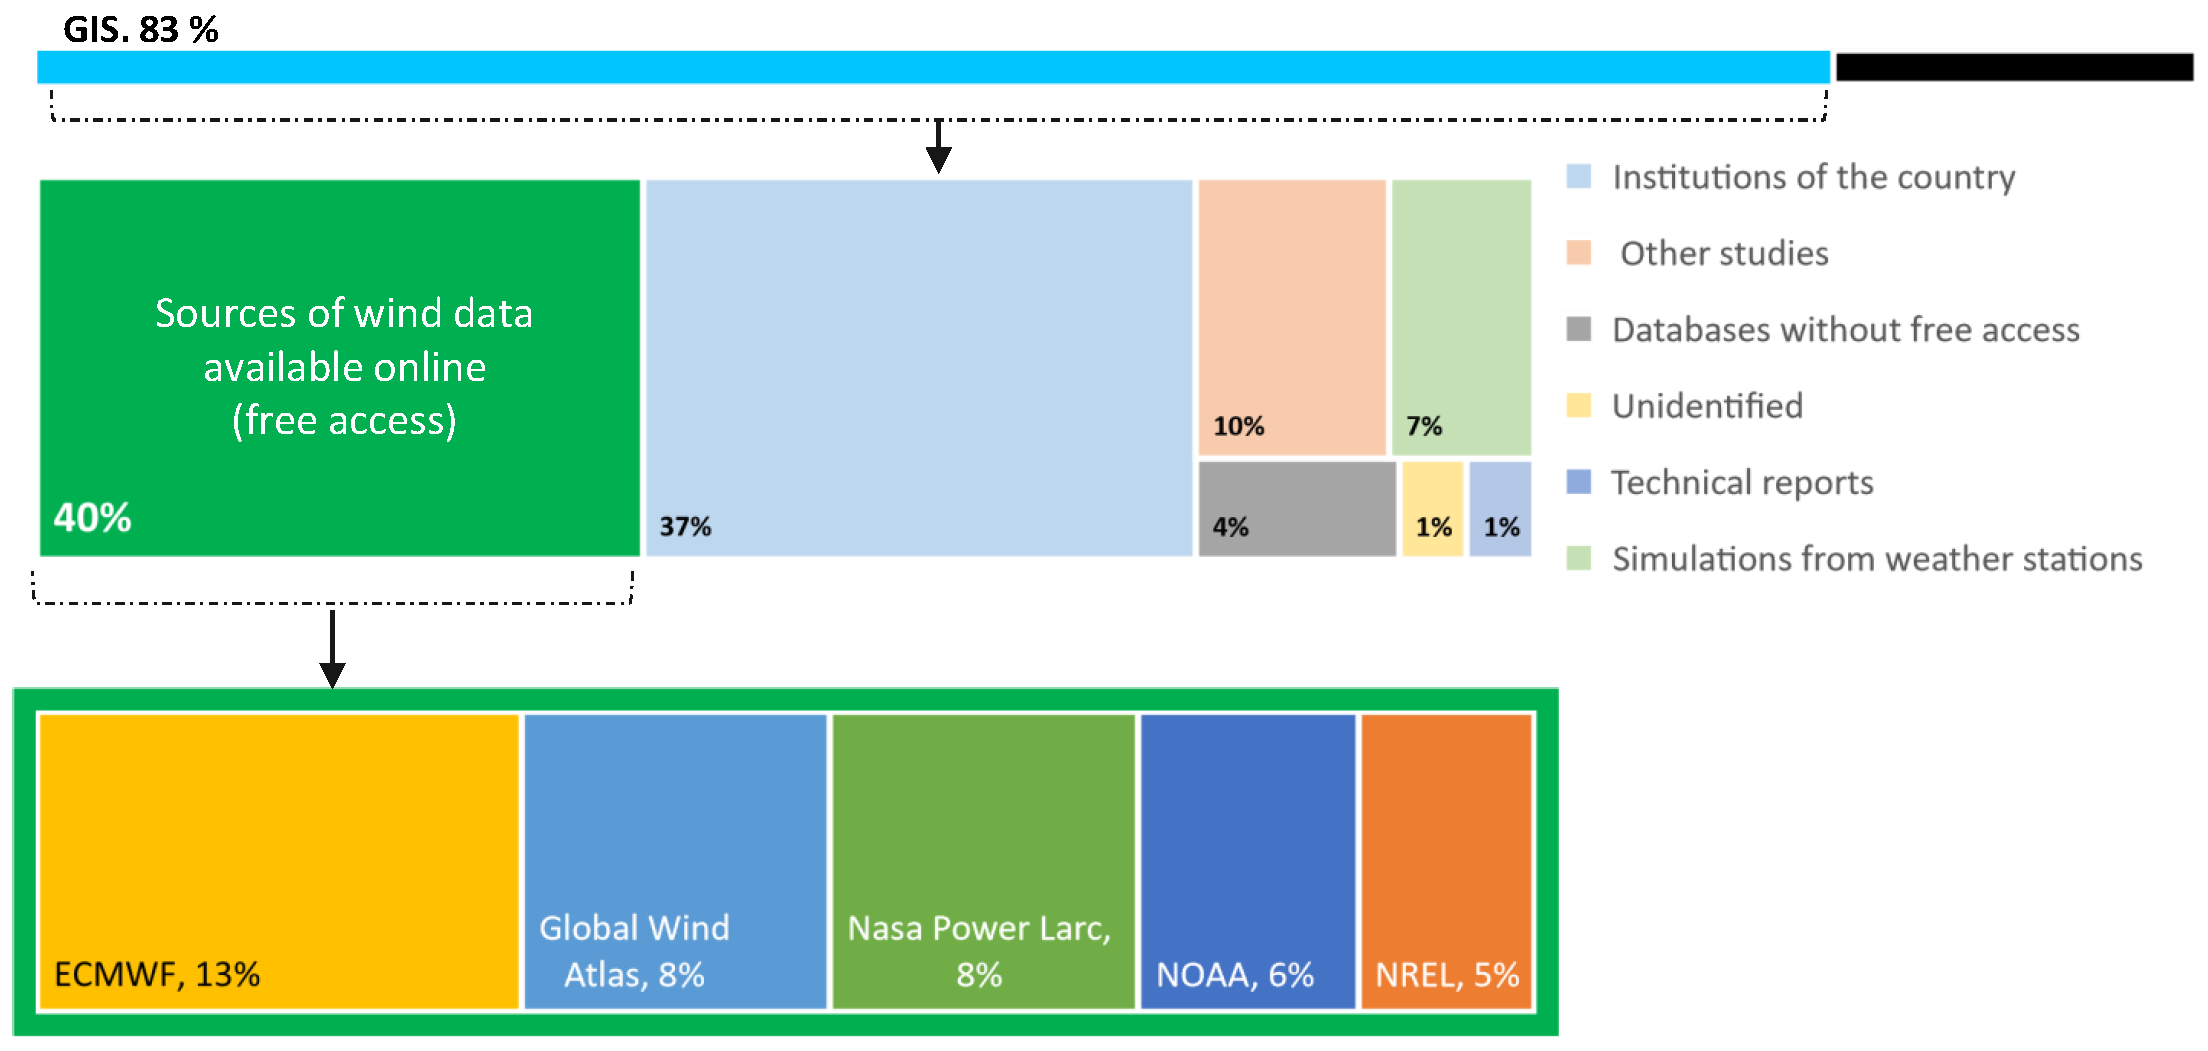
4.1. Characterization of Wind Data Sources
- ERA5: Available from 1979 to within the last five days, providing hourly estimations of a relevant number of atmospheric, oceanic, and land climate data. Such data cover the Earth through a 30 km grid and resolve the atmosphere from the surface up to a height of 80 km subdividing into a series of 137 levels. A recent ERA5 reanalysis data reliability for wind-resource assessment can be found in [134].
- ERA5-Land: Covers the period from 1981 to two to three months ago, providing only a 9 km high resolution. Available data are hourly, daily, and monthly and can only be downloaded on a regular latitude/longitude grid of 0.1° × 0.1° through the CDS catalog [135].
- Mesoscale model: 50 m, 75 m, 100 m, and 150 m.
- Microscale model: 50 m, 100 m, and 200 m.
- Large-scale atmospheric data are used as input of the medium-scale mesoscale atmospheric models from re-analysis datasets.
- The output from the mesoscale modeling is generalized to be used as input for the microscale modeling.
- The output of the microscale modeling shows a high and relevant resolution topography with hills, summits, and forests.
4.2. Comparison of Wind Data Sources
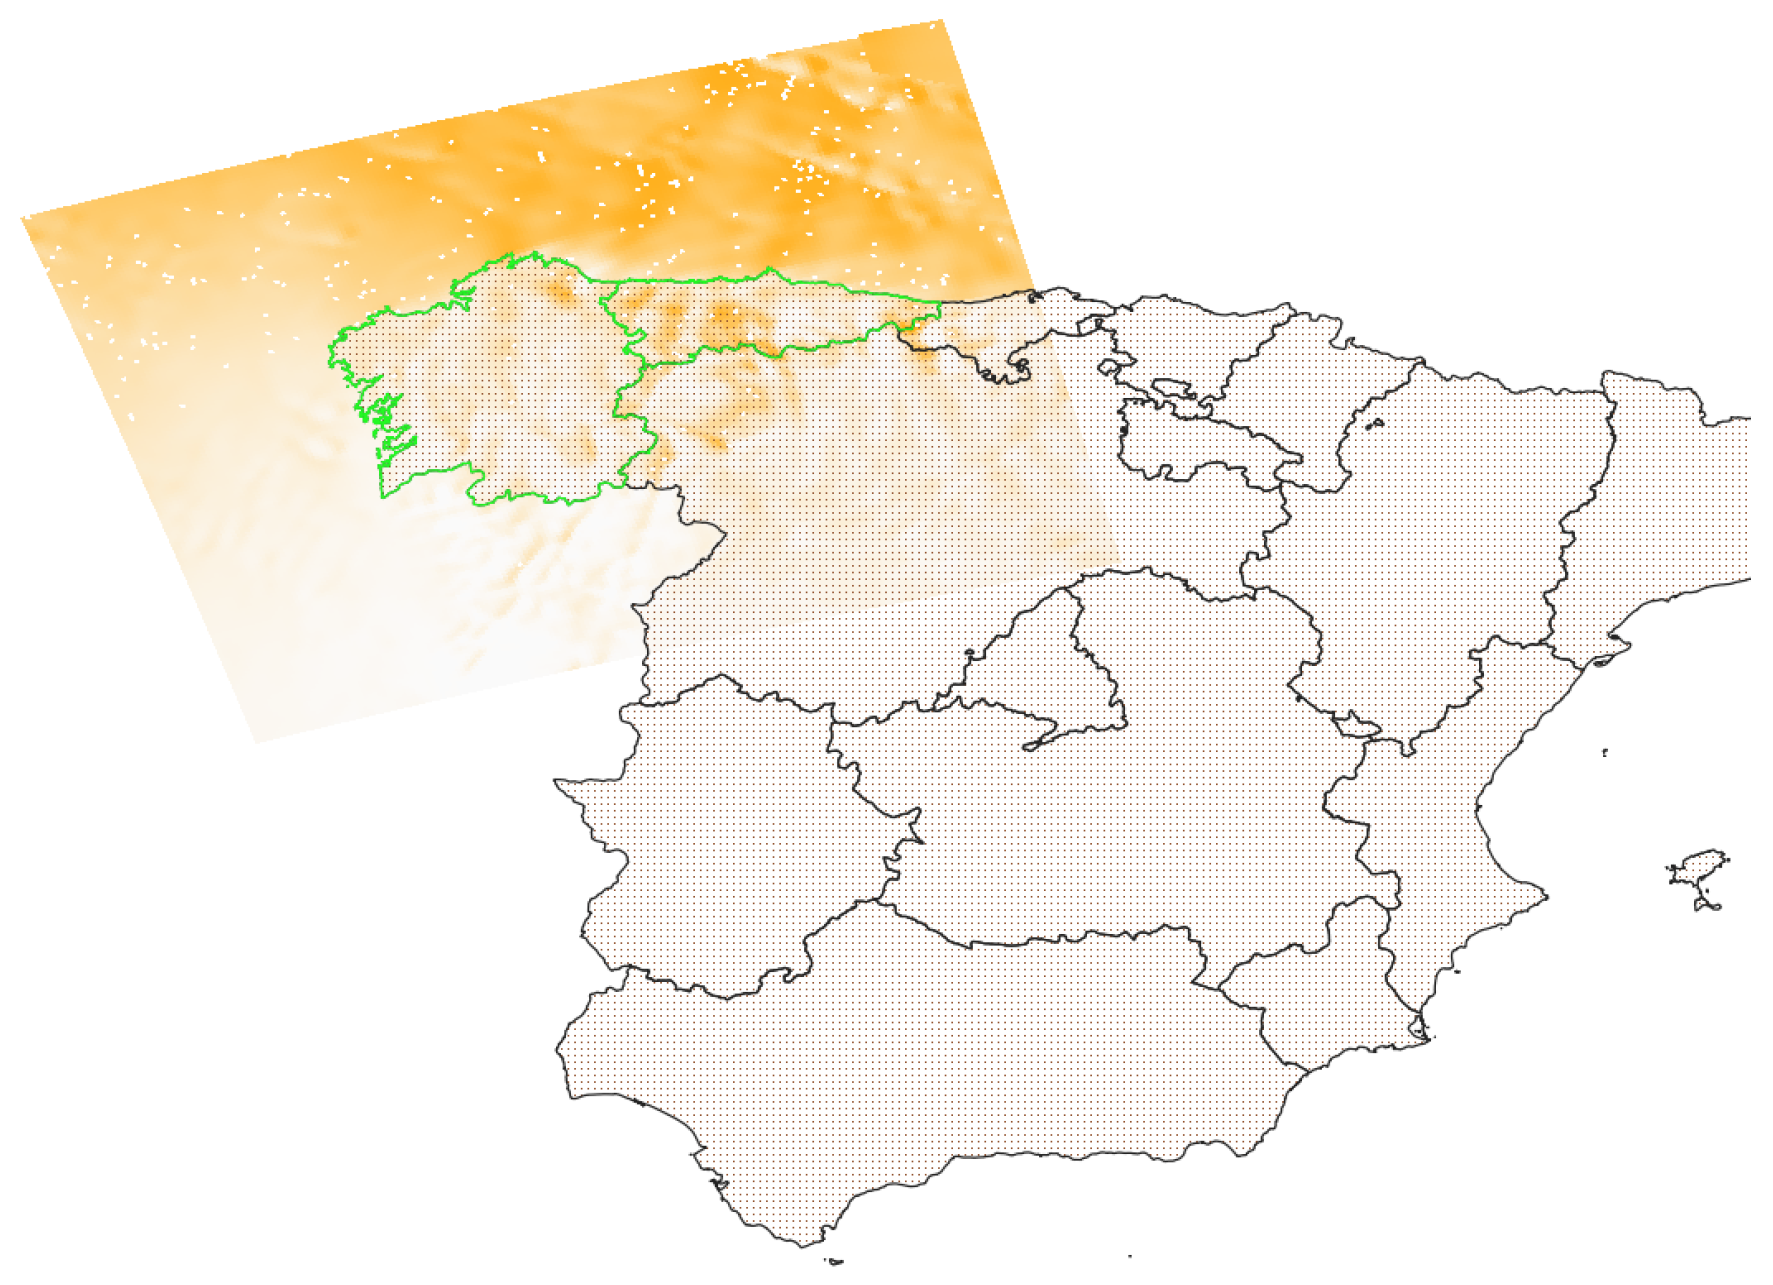
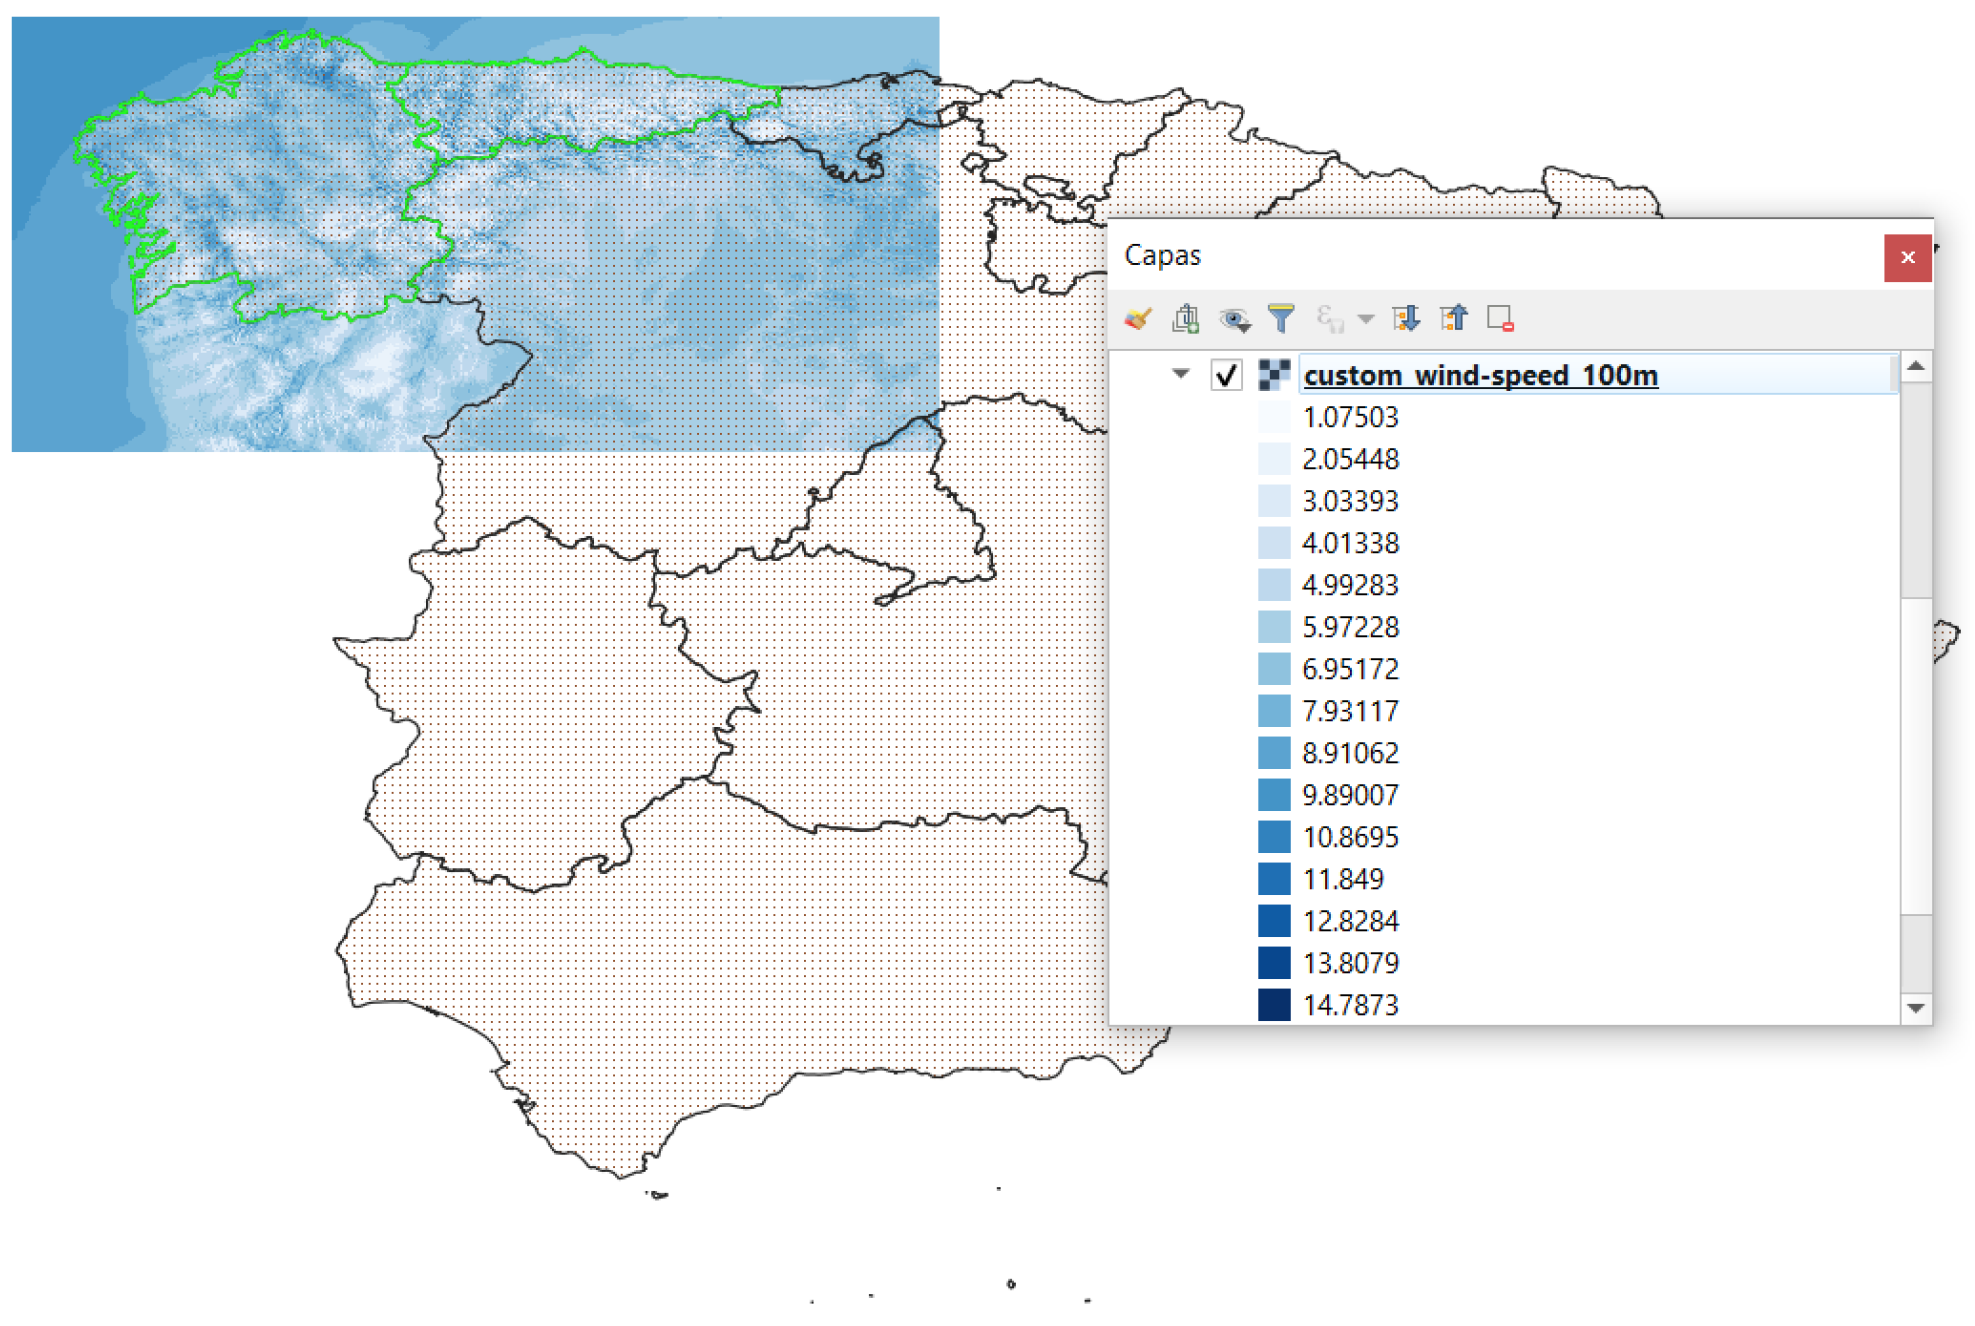
5. GIS Tool Integration
6. Discussion
7. Conclusions
Author Contributions
Funding
Institutional Review Board Statement
Informed Consent Statement
Data Availability Statement
Acknowledgments
Conflicts of Interest
Abbreviations
| ECMWF | European Centre for Medium-Range Weather Forecasts |
| EMHIRES | European Meteorological High-Resolution Renewable Energy Source |
| ENSPRESO | Energy System Potentials for Renewable Energy Sources |
| ESMAP | Energy Sector Management Assistance Program |
| GFS | Globe Forecast System |
| GIS | Geographic Information System |
| GWA | Global Wind Atlas |
| MERRA | Modern-Era Retrospective Analysis for Research and Applications |
| NASA | National Aeronautics and Space Administration |
| NCEP | National Centers for Environmental Prediction |
| NEWA | New European Wind Atlas |
| NOAA | Global Marine Data Map |
| NREL | National Renewable Energy Laboratory |
| POWER | Prediction Of Worldwide Energy Resources |
| PRISMA | Preferred Reporting Items for Systematic Reviews and Meta-Analyses |
| SPAB | Special Protection Area for Birds |
| U.S. | United States |
| WAsP | Wind Atlas Analysis and Application Program |
| WMO | World Meteorological Organization |
| WRF | Weather, Research, and Forecasting |
| VWF | Virtual Wind Farm |
References
- Derlukiewicz, N.; Mempel-Śnieżyk, A.; Mankowska, D.; Dyjakon, A.; Minta, S.; Pilawka, T. How do Clusters Foster Sustainable Development? An Analysis of EU Policies. Sustainability 2020, 12, 1297. [Google Scholar] [CrossRef]
- Arroyo M., F.R.; Miguel, L.J. Low-Carbon Energy Governance: Scenarios to Accelerate the Change in the Energy Matrix in Ecuador. Energies 2020, 13, 4731. [Google Scholar] [CrossRef]
- Renn, O.; Marshall, J.P. Coal, nuclear and renewable energy policies in Germany: From the 1950s to the “Energiewende”. Energy Policy 2016, 99, 224–232. [Google Scholar] [CrossRef]
- Cihat Onat, N.; Aboushaqrah, N.N.; Kucukvar, M.; Tarlochan, F.; Magid Hamouda, A. From sustainability assessment to sustainability management for policy development: The case for electric vehicles. Energy Convers. Manag. 2020, 216, 112937. [Google Scholar] [CrossRef]
- Agyeman, J.K.; Ameyaw, B.; Li, Y.; Appiah-Kubi, J.; Annan, A.; Oppong, A.; Twumasi, M.A. Modeling the long-run drivers of total renewable energy consumption: Evidence from top five heavily polluted countries. J. Clean. Prod. 2020, 277, 123292. [Google Scholar] [CrossRef]
- Lamperti, F.; Dosi, G.; Napoletano, M.; Roventini, A.; Sapio, A. Climate change and green transitions in an agent-based integrated assessment model. Technol. Forecast. Soc. Chang. 2020, 153, 119806. [Google Scholar] [CrossRef]
- Möller, B.; Hong, L.; Lonsing, R.; Hvelplund, F. Evaluation of offshore wind resources by scale of development. Energy 2012, 48, 314–322, 6th Dubrovnik Conference on Sustainable Development of EnergyWater and Environmental Systems, SDEWES 2011. [Google Scholar] [CrossRef]
- Zhang, Y.; Ai, Q.; Xiao, F.; Hao, R.; Lu, T. Typical wind power scenario generation for multiple wind farms using conditional improved Wasserstein generative adversarial network. Int. J. Electr. Power Energy Syst. 2020, 114, 105388. [Google Scholar] [CrossRef]
- Fernández-Guillamón, A.; Das, K.; Cutululis, N.; Molina-García, A. Offshore Wind Power Integration into Future Power Systems: Overview and Trends. J. Mar. Sci. Eng. 2019, 7, 399. [Google Scholar] [CrossRef]
- Global Wind Energy Council (GWEC). Global Wind Report 2020; Technical Report; GWEC: Brussels, Belgium, 2021. [Google Scholar]
- Gil-García, I.C.; García-Cascales, M.S.; Fernández-Guillamón, A.; Molina-García, A. Categorization and Analysis of Relevant Factors for Optimal Locations in Onshore and Offshore Wind Power Plants: A Taxonomic Review. J. Mar. Sci. Eng. 2019, 7, 391. [Google Scholar] [CrossRef]
- Nedaei, M.; Assareh, E.; Biglari, M. An extensive evaluation of wind resource using new methods and strategies for development and utilizing wind power in Mah-shahr station in Iran. Energy Convers. Manag. 2014, 81, 475–503. [Google Scholar] [CrossRef]
- Barbosa de Alencar, D.; De Mattos Affonso, C.; Limão de Oliveira, R.C.; Moya Rodríguez, J.L.; Leite, J.C.; Reston Filho, J.C. Different Models for Forecasting Wind Power Generation: Case Study. Energies 2017, 10, 1976. [Google Scholar] [CrossRef]
- Demolli, H.; Dokuz, A.S.; Ecemis, A.; Gokcek, M. Wind power forecasting based on daily wind speed data using machine learning algorithms. Energy Convers. Manag. 2019, 198, 111823. [Google Scholar] [CrossRef]
- Yang, W.; Wang, J.; Lu, H.; Niu, T.; Du, P. Hybrid wind energy forecasting and analysis system based on divide and conquer scheme: A case study in China. J. Clean. Prod. 2019, 222, 942–959. [Google Scholar] [CrossRef]
- Zhang, L.; Dong, Y.; Wang, J. Wind Speed Forecasting Using a Two-Stage Forecasting System With an Error Correcting and Nonlinear Ensemble Strategy. IEEE Access 2019, 7, 176000–176023. [Google Scholar] [CrossRef]
- Kim, C.K.; Jang, S.; Kim, T.Y. Site selection for offshore wind farms in the southwest coast of South Korea. Renew. Energy 2018, 120, 151–162. [Google Scholar] [CrossRef]
- Fazelpour, F.; Tarashkar, N.; Rosen, M.A. Short-term wind speed forecasting using artificial neural networks for Tehran, Iran. Int. J. Energy Environ. Eng. 2016, 7, 377–390. [Google Scholar] [CrossRef]
- Rezaeiha, A.; Montazeri, H.; Blocken, B. A framework for preliminary large-scale urban wind energy potential assessment: Roof-mounted wind turbines. Energy Convers. Manag. 2020, 214, 112770. [Google Scholar] [CrossRef]
- El Khchine, Y.; Sriti, M.; El Kadri Elyamani, N.E. Evaluation of wind energy potential and trends in Morocco. Heliyon 2019, 5, e01830. [Google Scholar] [CrossRef]
- Bahrami, A.; Teimourian, A.; Okoye, C.O.; Shiri, H. Technical and economic analysis of wind energy potential in Uzbekistan. J. Clean. Prod. 2019, 223, 801–814. [Google Scholar] [CrossRef]
- Talama, F.; Kutty, S.S.; Kumar, A.; Khan, M.; Ahmed, M.R. Assessment of wind energy potential for Tuvalu with accurate estimation of Weibull parameters. Energy Explor. Exploit. 2020, 38, 1742–1773. [Google Scholar] [CrossRef]
- Sumair, M.; Aized, T.; Gardezi, S.A.R.; Rehman, S.U.U.; Rehman, S.M.S. Wind potential estimation and proposed energy production in Southern Punjab using Weibull probability density function and surface measured data. Energy Explor. Exploit. 2020, 39, 2150–2168. [Google Scholar] [CrossRef]
- Vargas, S.A.; Esteves, G.R.T.; Maçaira, P.M.; Bastos, B.Q.; Cyrino Oliveira, F.L.; Souza, R.C. Wind power generation: A review and a research agenda. J. Clean. Prod. 2019, 218, 850–870. [Google Scholar] [CrossRef]
- Ali, S.; Taweekun, J.; Techato, K.; Waewsak, J.; Gyawali, S. GIS based site suitability assessment for wind and solar farms in Songkhla, Thailand. Renew. Energy 2018, 132, 1360–1372. [Google Scholar] [CrossRef]
- Aydin, N.Y.; Kentel, E.; Duzgun, S. GIS-based environmental assessment of wind energy systems for spatial planning: A case study from Western Turkey. Renew. Sustain. Energy Rev. 2010, 14, 364–373. [Google Scholar] [CrossRef]
- Ayodele, T.; Ogunjuyigbe, A.; Odigie, O.; Munda, J. A multi-criteria GIS based model for wind farm site selection using interval type-2 fuzzy analytic hierarchy process: The case study of Nigeria. Appl. Energy 2018, 228, 1853–1869. [Google Scholar] [CrossRef]
- Baseer, M.; Rehman, S.; Meyer, J.; Alam, M.M. GIS-based site suitability analysis for wind farm development in Saudi Arabia. Energy 2017, 141, 1166–1176. [Google Scholar] [CrossRef]
- Díaz-Cuevas, P. GIS-Based Methodology for Evaluating the Wind-Energy Potential of Territories: A Case Study from Andalusia (Spain). Energies 2018, 11, 2789. [Google Scholar] [CrossRef]
- Mederos, A.M.; Padrón, J.M.; Lorenzo, A.F. An offshore wind atlas for the Canary Islands. Renew. Sustain. Energy Rev. 2011, 15, 612–620. [Google Scholar] [CrossRef]
- Cradden, L.; Kalogeri, C.; Barrios, I.M.; Galanis, G.; Ingram, D.; Kallos, G. Multi-criteria site selection for offshore renewable energy platforms. Renew. Energy 2016, 87, 791–806. [Google Scholar] [CrossRef]
- Magar, V.; Gross, M.; González-García, L. Offshore wind energy resource assessment under techno—economic and social—ecological constraints. Ocean Coast. Manag. 2018, 152, 77–87. [Google Scholar] [CrossRef]
- Moore, A.; Price, J.; Zeyringer, M. The role of floating offshore wind in a renewable focused electricity system for Great Britain in 2050. Energy Strateg. Rev. 2018, 22, 270–278. [Google Scholar] [CrossRef]
- Rediske, G.; Burin, H.; Rigo, P.; Rosa, C.; Michels, L.; Siluk, J. Wind power plant site selection: A systematic review. Renew. Sustain. Energy Rev. 2021, 148, 111293. [Google Scholar] [CrossRef]
- Majidi Nezhad, M.; Nastasi, B.; Groppi, D.; Lamagna, M.; Piras, G.; Astiaso Garcia, D. Green Energy Sources Assessment Using Sentinel-1 Satellite Remote Sensing. Front. Energy Res. 2021, 9, 777. [Google Scholar] [CrossRef]
- Bosilovich, M.; Lucchesi, R.; Suarez, M. MERRA-2: File Specification; Technical Report; NASA Goddard Space Flight Center: Greenbelt, MD, USA, 2016. Available online: https://gmao.gsfc.nasa.gov/pubs/docs/Bosilovich785.pdf (accessed on 30 November 2021).
- Yue, C.D.; Chiu, Y.S.; Tu, C.C.; Lin, T.H. Evaluation of an Offshore Wind Farm by Using Data from the Weather Station, Floating LiDAR, Mast, and MERRA. Energies 2020, 13, 185. [Google Scholar] [CrossRef]
- Santos, J.; Sakagami, Y.; Haas, R.; Passos, J.; Machuca, M.; Radünz, W.; Dias, E.; Lima, M. Wind speed evaluation of MERRA-2, ERA-interim and ERA-5 reanalysis data at a wind farm located in brazil. In Proceedings of the ISES Solar World Congress, Santiago de Chile, Chile, 4–7 November 2019. [Google Scholar]
- Kim, H.G.; Kim, J.Y.; Kang, Y.H. Comparative Evaluation of the Third-Generation Reanalysis Data for Wind Resource Assessment of the Southwestern Offshore in South Korea. Atmosphere 2018, 9, 73. [Google Scholar] [CrossRef]
- Jourdier, B. Evaluation of ERA5, MERRA-2, COSMO-REA6, NEWA and AROME to simulate wind power production over France. Adv. Sci. Res. 2020, 17, 63–77. [Google Scholar] [CrossRef]
- Gruber, K.; Regner, P.; Wehrle, S.; Zeyringer, M.; Schmidt, J. Towards global validation of wind power simulations: A multi-country assessment of wind power simulation from MERRA-2 and ERA-5 reanalyses bias-corrected with the global wind atlas. Energy 2022, 238, 121520. [Google Scholar] [CrossRef]
- Rabbani, R.; Zeeshan, M. Exploring the suitability of MERRA-2 reanalysis data for wind energy estimation, analysis of wind characteristics and energy potential assessment for selected sites in Pakistan. Renew. Energy 2020, 154, 1240–1251. [Google Scholar] [CrossRef]
- Moraes, L.; Bussar, C.; Stoecker, P.; Jacqué, K.; Chang, M.; Sauer, D. Comparison of long-term wind and photovoltaic power capacity factor datasets with open-license. Appl. Energy 2018, 225, 209–220. [Google Scholar] [CrossRef]
- Tammelin, B.; Vihma, T.; Atlaskin, E.; Badger, J.; Fortelius, C.; Gregow, H.; Horttanainen, M.; Hyvönen, R.; Kilpinen, J.; Latikka, J.; et al. Production of the Finnish wind atlas. Wind Energy 2013, 16, 19–35. [Google Scholar] [CrossRef]
- Moher, D.; Liberati, A.; Tetzlaff, J.; Altman, D.G. Preferred reporting items for systematic reviews and meta-analyses: The PRISMA statement. Int. J. Surg. 2010, 8, 336–341. [Google Scholar] [CrossRef]
- Rezaei, M.; Mostafaeipour, A.; Qolipour, M.; Tavakkoli-Moghaddam, R. Investigation of the optimal location design of a hybrid wind-solar plant: A case study. Int. J. Hydrog. Energy 2018, 43, 100–114. [Google Scholar] [CrossRef]
- Solangi, Y.A.; Tan, Q.; Khan, M.W.A.; Mirjat, N.H.; Ahmed, I. The Selection ofWind Power Project Location in the Southeastern Corridor of Pakistan: A Factor Analysis, AHP, and Fuzzy-TOPSIS Application. Energies 2018, 11, 1940. [Google Scholar] [CrossRef]
- Ali, S.; Lee, S.M.; Jang, C.M. Determination of the Most Optimal On-Shore Wind Farm Site Location Using a GIS-MCDM Methodology: Evaluating the Case of South Korea. Energies 2017, 10, 2072. [Google Scholar] [CrossRef]
- Villacreses, G.; Gaona, G.; Martínez-Gómez, J.; Jijón, D.J. Wind farms suitability location using geographical information system (GIS), based on multi-criteria decision making (MCDM) methods: The case of continental Ecuador. Renew. Energy 2017, 109, 275–286. [Google Scholar] [CrossRef]
- Kazak, J.; van Hoof, J.; Szewranski, S. Challenges in the wind turbines location process in Central Europe. The use of spatial decision support systems. Renew. Sustain. Energy Rev. 2017, 76, 425–433. [Google Scholar] [CrossRef]
- Weiss, C.V.C.; Tagliani, P.R.A.; Espinoza, J.M.A.; de Lima, L.T.; Gandra, T.B.R. Spatial planning for wind farms: Perspectives of a coastal area in southern Brazil. Springer 2018, 20, 665–666. [Google Scholar] [CrossRef]
- Sánchez-Lozano, J.; García-Cascales, M.; Lamata, M. GIS-based onshore wind farm site selection using Fuzzy Multi-Criteria Decision Making methods. Evaluating the case of Southeastern Spain. Appl. Energy 2016, 171, 86–102. [Google Scholar] [CrossRef]
- Hofer, T.; Sunak, Y.; Siddique, H.; Madlener, R. Wind farm siting using a spatial Analytic Hierarchy Process approach: A case study of the Städteregion Aachen. Appl. Energy 2016, 163, 222–243. [Google Scholar] [CrossRef]
- Watson, J.J.; Hudson, M.D. Regional Scale wind farm and solar farm suitability assessment using GIS-assisted multi-criteria evaluation. Landsc. Urban Plan. 2015, 138, 20–31. [Google Scholar] [CrossRef]
- Schweizer, J.; Antonini, A.; Govoni, L.; Gottardi, G.; Archetti, R.; Supino, E.; Berretta, C.; Casadei, C.; Ozzi, C. Investigating the potential and feasibility of an offshore wind farm in the Northern Adriatic Sea. Appl. Energy 2016, 177, 449–463. [Google Scholar] [CrossRef]
- Argin, M.; Yerci, V. Offshore wind power potential of the Black Sea region in Turkey. Int. J. Green Energy 2017, 14, 811–818. [Google Scholar] [CrossRef]
- Wu, B.; Yip, T.L.; Xie, L.; Wang, Y. A fuzzy-MADM based approach for site selection of offshore wind farm in busy waterways in China. Ocean Eng. 2018, 168, 121–132. [Google Scholar] [CrossRef]
- Vasileiou, M.; Loukogeorgaki, E.; Vagiona, D.G. GIS-based multi-criteria decision analysis for site selection of hybrid offshore wind and wave energy systems in Greece. Renew. Sustain. Energy Rev. 2017, 73, 745–757. [Google Scholar] [CrossRef]
- Kim, T.; Park, J.I.; Maeng, J. Offshore wind farm site selection study around Jeju Island, South Korea. Renew. Energy 2016, 94, 619–628. [Google Scholar] [CrossRef]
- Cavazzi, S.; Dutton, A. An Offshore Wind Energy Geographic Information System (OWE-GIS) for assessment of the UK’s offshore wind energy potential. Renew. Energy 2016, 87, 212–228. [Google Scholar] [CrossRef]
- Li, M.; Xu, Y.; Guo, J.; Li, Y.; Li, W. Application of a GIS-Based Fuzzy Multi-Criteria Evaluation Approach for Wind Farm Site Selection in China. Energies 2020, 13, 2426. [Google Scholar] [CrossRef]
- Dhunny, A.; Doorga, J.; Allam, Z.; Lollchund, M.; Boojhawon, R. Identification of optimal wind, solar and hybrid wind-solar farming sites using fuzzy logic modelling. Energy 2019, 188, 116056. [Google Scholar] [CrossRef]
- Ali, S.; Jang, C.M. Selection of Best-Suited Wind Turbines for New Wind Farm Sites Using Techno-Economic and GIS Analysis in South Korea. Energies 2019, 12, 3140. [Google Scholar] [CrossRef]
- Konstantinos, I.; Georgios, T.; Garyfalos, A. A Decision Support System methodology for selecting wind farm installation locations using AHP and TOPSIS: Case study in Eastern Macedonia and Thrace region, Greece. Energy Policy 2019, 132, 232–246. [Google Scholar] [CrossRef]
- Yan, H.; Wang, Y.; Zhou, X.; Liang, L.; Yin, Z.; Wang, W. Dynamic Thermal Rating of Overhead Transmission Lines Based on GRAPES Numerical Weather Forecast. J. Inf. Process. Syst. 2019, 15, 724–736. [Google Scholar] [CrossRef]
- Gherboudj, I.; Ghedira, H. Assessment of solar energy potential over the United Arab Emirates using remote sensing and weather forecast data. Renew. Sustain. Energy Rev. 2016, 55, 1210–1224. [Google Scholar] [CrossRef]
- Deng, H.; Li, Y.; Zhang, Y.; Zhou, H.; Cheng, P.; Wang, J.; Aqeel-Ashraf, M. Prediction of Hub Height Winds over the Plateau Terrain by using WRF /YSU/Noah and Statistical Forecast. Earth Sci. Res. J. 2017, 21, 37–43. [Google Scholar] [CrossRef]
- Pyrchla, J.; Kowalewski, M.; Leyk-Wesolowska, M.; Pyrchla, K. Integration and Visualization of the Results of Hydrodynamic Models in the Maritime Network-Centric GIS of Gulf of Gdansk. In Proceedings of the 2016 Baltic Geodetic Congress (BGC Geomatics), Gdansk, Poland, 2–4 June 2016; pp. 159–164. [Google Scholar] [CrossRef]
- Jiang, P.; Li, X.; Dong, Y. Research and Application of a New Hybrid Forecasting Model Based on Genetic Algorithm Optimization: A Case Study of Shandong Wind Farm in China. Math. Probl. Eng. 2015, 2015, 740490. [Google Scholar] [CrossRef]
- Bellis Laura, M.; Verónica, A.; Andrés, L.; Juan, P.A.; Sofia, L.; Clemoveki, K.; Carlos, M.S. Design and implementation of an operational meteo fire risk forecast based on open source geospatial technology. In Proceedings of the 2015 IEEE International Geoscience and Remote Sensing Symposium (IGARSS), Milan, Italy, 26–31 July 2015. [Google Scholar] [CrossRef]
- Adams, M.; Herbster, C. Using GIS Tools to Compare Hurricane Matthew and Irma Impacts to Florida Embry–Riddle Aeronautical University. 2018. Available online: https://commons.erau.edu/cgi/viewcontent.cgi?article=1269&context=discovery-day (accessed on 30 November 2021).
- Chang, P.C.; Yang, R.Y.; Lai, C.M. Potential of Offshore Wind Energy and Extreme Wind Speed Forecasting on the West Coast of Taiwan. Energies 2015, 8, 1685–1700. [Google Scholar] [CrossRef]
- Siyal, S.H.; Mörtberg, U.; Mentis, D.; Welsch, M.; Babelon, I.; Howells, M. Wind energy assessment considering geographic and environmental restrictions in Sweden: A GIS-based approach. Energy 2015, 83, 447–461. [Google Scholar] [CrossRef]
- Höltinger, S.; Salak, B.; Schauppenlehner, T.; Scherhaufer, P.; Schmidt, J. Austria’s wind energy potential – A participatory modeling approach to assess socio-political and market acceptance. Energy Policy 2016, 98, 49–61. [Google Scholar] [CrossRef]
- Pamučar, D.; Gigović, L.; Bajić, Z.; Janošević, M. Location Selection for Wind Farms Using GIS Multi-Criteria Hybrid Model: An Approach Based on Fuzzy and Rough Numbers. Sustainability 2017, 9, 1315. [Google Scholar] [CrossRef]
- Morano, P.; Tajani, F.; Locurcio, M. GIS application and econometric analysis for the verification of the financial feasibility of roof-top wind turbines in the city of Bari (Italy). Renew. Sustain. Energy Rev. 2017, 70, 999–1010. [Google Scholar] [CrossRef]
- Lotfi, R.; Mostafaeipour, A.; Mardani, N.; Mardani, S. Investigation of wind farm location planning by considering budget constraints. Int. J. Sustain. Energy 2018, 37, 799–817. [Google Scholar] [CrossRef]
- Tsoutsos, T.; Tsitoura, I.; Kokologos, D.; Kalaitzakis, K. Sustainable siting process in large wind farms case study in Crete. Renew. Energy 2015, 75, 474–480. [Google Scholar] [CrossRef]
- Pillai, A.C.; Chick, J.; Khorasanchi, M.; Barbouchi, S.; Johanning, L. Application of an offshore wind farm layout optimization methodology at Middelgrunden wind farm. Ocean Eng. 2017, 139, 287–297. [Google Scholar] [CrossRef]
- Gimpel, A.; Stelzenmüller, V.; Grote, B.; Buck, B.H.; Floeter, J.; Núñez-Riboni, I.; Pogoda, B.; Temming, A. A GIS modelling framework to evaluate marine spatial planning scenarios: Co-location of offshore wind farms and aquaculture in the German EEZ. Mar. Policy 2015, 55, 102–115. [Google Scholar] [CrossRef]
- Fetanat, A.; Khorasaninejad, E. A novel hybrid MCDM approach for offshore wind farm site selection: A case study of Iran. Ocean Coast. Manag. 2015, 109, 17–28. [Google Scholar] [CrossRef]
- Wu, Y.; Zhang, J.; Yuan, J.; Geng, S.; Zhang, H. Study of decision framework of offshore wind power station site selection based on ELECTRE-III under intuitionistic fuzzy environment: A case of China. Energy Convers. Manag. 2016, 113, 66–81. [Google Scholar] [CrossRef]
- Schallenberg-Rodríguez, J.; Montesdeoca, N.G. Spatial planning to estimate the offshore wind energy potential in coastal regions and islands. Practical case: The Canary Islands. Energy 2018, 143, 91–103. [Google Scholar] [CrossRef]
- Sterl, S.; Liersch, S.; Koch, H.; van Lipzig, N.P.M.; Thiery, W. A new approach for assessing synergies of solar and wind power: Implications for West Africa. Environ. Res. Lett. 2018, 13, 094009. [Google Scholar] [CrossRef]
- Mahdy, M.; Bahaj, A.S. Multi criteria decision analysis for offshore wind energy potential in Egypt. Renew. Energy 2018, 118, 278–289. [Google Scholar] [CrossRef]
- Mytilinou, V.; Lozano-Minguez, E.; Kolios, A. A Framework for the Selection of Optimum Offshore Wind Farm Locations for Deployment. Energies 2018, 11, 1855. [Google Scholar] [CrossRef]
- Satir, M.; Murphy, F.; McDonnell, K. Feasibility study of an offshore wind farm in the Aegean Sea, Turkey. Renew. Sustain. Energy Rev. 2018, 81, 2552–2562. [Google Scholar] [CrossRef]
- Astariz, S.; Iglesias, G. Selecting optimum locations for co-located wave and wind energy farms. Part I: The Co-Location Feasibility index. Energy Convers. Manag. 2016, 122, 589–598. [Google Scholar] [CrossRef]
- Mekonnen, A.D.; Gorsevski, P.V. A web-based participatory GIS (PGIS) for offshore wind farm suitability within Lake Erie, Ohio. Renew. Sustain. Energy Rev. 2015, 41, 162–177. [Google Scholar] [CrossRef]
- Repetto, M.; Burlando, M.; Solari, G.; De Gaetano, P.; Pizzo, M. Integrated tools for improving the resilience of seaports under extreme wind events. Sustain. Cities Soc. 2017, 32, 277–294. [Google Scholar] [CrossRef]
- Jin, X.; Wang, F.; Chen, L.; Li, J.; Zhao, W. Visualization of Storm Surge based on GIS. In Proceedings of the International Conference on Advances in Mechanical Engineering and Industrial Informatics, Zhengzhou, China, 11–12 April 2015. [Google Scholar] [CrossRef]
- Latinopoulos, D.; Kechagia, K. A GIS-based multi-criteria evaluation for wind farm site selection. A regional scale application in Greece. Renew. Energy 2015, 78, 550–560. [Google Scholar] [CrossRef]
- Atici, K.B.; Simsek, A.B.; Ulucan, A.; Tosun, M.U. A GIS-based Multiple Criteria Decision Analysis approach for wind power plant site selection. Util. Policy 2015, 37, 86–96. [Google Scholar] [CrossRef]
- Vagiona, D.G.; Kamilakis, M. Sustainable Site Selection for Offshore Wind Farms in the South Aegean—Greece. Sustainability 2018, 10, 749. [Google Scholar] [CrossRef]
- Noorollahi, Y.; Yousefi, H.; Mohammadi, M. Multi-criteria decision support system for wind farm site selection using GIS. Sustain. Energy Technol. Assess. 2016, 13, 38–50. [Google Scholar] [CrossRef]
- Chen, W.; Zhu, Y.; Yang, M.; Yuan, J. Optimal Site Selection of Wind-Solar Complementary Power Generation Project for a Large-Scale Plug-In Charging Station. Sustainability 2017, 9, 1994. [Google Scholar] [CrossRef]
- Rao, M.; Sridharamurthy, K.; Ayappan, S.; Sreeram, G.; Nayak, J.; Shankar, M.; Krishnappa, D. How Farmers Benefit from Integration of EO, Meteorological, Positioning and Field Data in an Analytics Engine—The AGRI-GIS Example of S Odisha, India. 2018. Available online: http://eprints.nias.res.in/id/eprint/1739 (accessed on 30 November 2021).
- Al-Yahyai, S.; Charabi, Y. Assessment of large-scale wind energy potential in the emerging city of Duqm (Oman). Renew. Sustain. Energy Rev. 2015, 47, 438–447. [Google Scholar] [CrossRef]
- ECMWF. European Centre for Medium-Range Weather Forecasts. 2020. Available online: https://www.ecmwf.int/ (accessed on 30 November 2021).
- Ntoka, C. Offshore Wind Park Sitting and Micro-Sitting in Petalioi Gulf, Greece. 2013. Available online: https://www.semanticscholar.org/ (accessed on 30 November 2021).
- Chaouachi, A.; Covrig, C.F.; Ardelean, M. Multi-criteria selection of offshore wind farms: Case study for the Baltic States. Energy Policy 2017, 103, 179–192. [Google Scholar] [CrossRef]
- Nagababu, G.; Kachhwaha, S.S.; Savsani, V. Estimation of technical and economic potential of offshore wind along the coast of India. Energy 2017, 138, 79–91. [Google Scholar] [CrossRef]
- Davò, F.; Alessandrini, S.; Sperati, S.; Delle Monache, L.; Airoldi, D.; Vespucci, M.T. Post-processing techniques and principal component analysis for regional wind power and solar irradiance forecasting. Sol. Energy 2016, 134, 327–338. [Google Scholar] [CrossRef]
- Huld, T.; Amillo, A.M.G. Estimating PV Module Performance over Large Geographical Regions: The Role of Irradiance, Air Temperature, Wind Speed and Solar Spectrum. Energies 2015, 8, 5159–5181. [Google Scholar] [CrossRef]
- Donida Labati, R.; Genovese, A.; Piuri, V.; Scotti, F.; Sforza, G. A Decision Support System for Wind Power Production. IEEE Trans. Syst. Man Cybern. Syst. 2019, 50, 290–304. [Google Scholar] [CrossRef]
- McKenna, R.; Hollnaicher, S.; vd Leye, P.O.; Fichtner, W. Cost-potentials for large onshore wind turbines in Europe. Energy 2015, 83, 217–229. [Google Scholar] [CrossRef]
- Majidi Nezhad, M.; Groppi, D.; Marzialetti, P.; Fusilli, L.; Laneve, G.; Cumo, F.; Garcia, D.A. Wind energy potential analysis using Sentinel-1 satellite: A review and a case study on Mediterranean islands. Renew. Sustain. Energy Rev. 2019, 109, 499–513. [Google Scholar] [CrossRef]
- Nagababu, G.; Kachhwaha, S.S.; Naidu, N.K.; Savsani, V. Application of reanalysis data to estimate offshore wind potential in EEZ of India based on marine ecosystem considerations. Energy 2017, 118, 622–631. [Google Scholar] [CrossRef]
- NOAA. Global Marine Data Map. 2020. Available online: https://gis.ncdc.noaa.gov/maps/ncei/marine (accessed on 30 November 2021).
- Waewsak, J.; Landry, M.; Gagnon, Y. Offshore wind power potential of the Gulf of Thailand. Renew. Energy 2015, 81, 609–626. [Google Scholar] [CrossRef]
- Shahriari, M.; Cervone, G.; Clemente-Harding, L.; Delle Monache, L. Using the analog ensemble method as a proxy measurement for wind power predictability. Renew. Energy 2020, 146, 789–801. [Google Scholar] [CrossRef]
- Grassi, S.; Veronesi, F.; Schenkel, R.; Peier, C.; Neukom, J.; Volkwein, S.; Martin, R.; Hurni, L. Mapping of the global wind energy potential using open source GIS data. In Proceedings of the 2nd International Conference on Energy and Environment, Guimarães, Portugal, 18–19 June 2015; pp. 647–653. [Google Scholar]
- Wing, O.E.; Sampson, C.C.; Bates, P.D.; Quinn, N.; Smith, A.M.; Neal, J.C. A flood inundation forecast of Hurricane Harvey using a continental-scale 2D hydrodynamic model. J. Hydrol. X 2019, 4, 100039. [Google Scholar] [CrossRef]
- Unger, J.D. Analysis of Hurricane Track Forecast Accuracy during the 2018 Season. 2019. Available online: https://trace.tennessee.edu/cgi/viewcontent.cgi?article=1394&context=pursuit (accessed on 30 November 2021).
- New European Wind Atlas. Wind Atlas data from European Wind Atlas Project. 2020. Available online: https://map.neweuropeanwindatlas.eu/ (accessed on 30 November 2021).
- Vortex. Wind Speed Maps. 2020. Available online: https://interface.vortexfdc.com/ (accessed on 30 November 2021).
- Renewables.Ninja. World Geographic Information Wind Speed. 2020. Available online: https://www.renewables.ninja/ (accessed on 30 November 2021).
- WindFinder. Wind Predictions. 2020. Available online: https://es.windfinder.com/#8/43.2932/-7.8387/report (accessed on 30 November 2021).
- Global Wind Atlas. Wind Speed Maps, by Vortex. 2020. Available online: https://globalwindatlas.info/area/Spain/ (accessed on 30 November 2021).
- Deǧirmenci, S.C.; Bingöl, F.; Sofuoglu, S.C. MCDM analysis of wind energy in Turkey: Decision making based on environmental impact. Environ. Sci. Pollut. Res. 2018, 25, 19753–19766. [Google Scholar] [CrossRef]
- Enevoldsen, P.; Permien, F.H.; Bakhtaoui, I.; von Krauland, A.K.; Jacobson, M.Z.; Xydis, G.; Sovacool, B.K.; Valentine, S.V.; Luecht, D.; Oxley, G. How much wind power potential does europe have? Examining european wind power potential with an enhanced socio-technical atlas. Energy Policy 2019, 132, 1092–1100. [Google Scholar] [CrossRef]
- Bosch, J.; Staffell, I.; Hawkes, A.D. Temporally-explicit and spatially-resolved global onshore wind energy potentials. Energy 2017, 131, 207–217. [Google Scholar] [CrossRef]
- Bosch, J.; Staffell, I.; Hawkes, A.D. Temporally explicit and spatially resolved global offshore wind energy potentials. Energy 2018, 163, 766–781. [Google Scholar] [CrossRef]
- NREL. Computational Wind Studies. 2020. Available online: https://www.nrel.gov/ (accessed on 30 November 2021).
- Sarpong, D.; Baffoe, P.E. Selecting Suitable Sites for Wind Energy Development in Ghana. Ghana Min. J. 2016, 16, 8–20. [Google Scholar] [CrossRef][Green Version]
- Ahmed, A.; Khalid, M. Multi-step Ahead Wind Forecasting Using Nonlinear Autoregressive Neural Networks. Energy Procedia 2017, 134, 192–204, Sustainability in Energy and Buildings 2017: Proceedings of the Ninth KES International Conference, Chania, Greece, 5–7 July 2017. [Google Scholar] [CrossRef]
- Anwarzai, M.A.; Nagasaka, K. Utility-scale implementable potential of wind and solar energies for Afghanistan using GIS multi-criteria decision analysis. Renew. Sustain. Energy Rev. 2017, 71, 150–160. [Google Scholar] [CrossRef]
- FiNO3. Baltic and North Sea Maritime Platform. 2020. Available online: https://www.fino3.de/en/about.html (accessed on 30 November 2021).
- Nie, B.; Li, J. Technical potential assessment of offshore wind energy over shallow continent shelf along China coast. Renew. Energy 2018, 128, 391–399. [Google Scholar] [CrossRef]
- NasaPowerLarc. Weather Forecasts. 2020. Available online: https://power.larc.nasa.gov/data-access-viewer/ (accessed on 30 November 2021).
- Mentis, D.; Hermann, S.; Howells, M.; Welsch, M.; Siyal, S.H. Assessing the technical wind energy potential in Africa a GIS-based approach. Renew. Energy 2015, 83, 110–125. [Google Scholar] [CrossRef]
- Jangid, J.; Bera, A.K.; Joseph, M.; Singh, V.; Singh, T.; Pradhan, B.; Das, S. Potential zones identification for harvesting wind energy resources in desert region of India—A multi criteria evaluation approach using remote sensing and GIS. Renew. Sustain. Energy Rev. 2016, 65, 1–10. [Google Scholar] [CrossRef]
- Mentis, D.; Siyal, S.H.; Korkovelos, A.; Howells, M. A geospatial assessment of the techno-economic wind power potential in India using geographical restrictions. Renew. Energy 2016, 97, 77–88. [Google Scholar] [CrossRef]
- Gualtieri, G. Reliability of ERA5 Reanalysis Data for Wind Resource Assessment: A Comparison against Tall Towers. Energies 2021, 14, 4169. [Google Scholar] [CrossRef]
- Muñoz Sabater, J. ERA5-Land Hourly Data from 1981 to Present. Copernicus Climate Change Service (C3S) Climate Data Store (CDS). 2020. Available online: https://cds.climate.copernicus.eu/cdsapp#!/dataset/10.24381/cds.e2161bac?tab=overview (accessed on 30 November 2021). [CrossRef]
- Ruiz, P.; Nijs, W.; Tarvydas, D.; Sgobbi, A.; Zucker, A.; Pilli, R.; Jonsson, R.; Camia, A.; Thiel, C.; Hoyer-Klick, C.; et al. ENSPRESO—An open, EU-28 wide, transparent and coherent database of wind, solar and biomass energy potentials. Energy Strateg. Rev. 2019, 26, 100379. [Google Scholar] [CrossRef]
- Gonzalez Aparicio, I.; Huld, T.; Careri, F.; Monforti, F.; Zucker, A. EMHIRES dataset Part II: Solar power generation. In European Meteorological Derived HIgh Resolution RES Generation Time Series for Present and Future Scenarios. Part II: PV Generation Using the PVGIS Model; Publications Office of the European Union: Luxembourg, 2017. [Google Scholar]
- NOAA. Global Climate Station Summaries. 2020. Available online: https://www7.ncdc.noaa.gov/CDO/cdoselect.cmd (accessed on 30 November 2021).
- Aymamí, J.; García, A.; Lacave, O.; Lledó, L.; Mayo, M.; Parés, S. Resource Analysis. Spanish Wind Atlas. Technical Study PER 2011–2020; IDAE: Madrid, Spain, 2011; Available online: https://www.idae.es/uploads/documentos/documentos_11227_e4_atlas_eolico_A_9b90ff10.pdf (accessed on 30 November 2021).
- Witha, B.; Hahmann, A.; Sile, T.; Dörenkämper, M.; Ezber, Y.; García-Bustamante, E.; González-Rouco, J.F.; Leroy, G.; Navarro, J. WRF Model Sensitivity Studies and Specifications for the NEWA Mesoscale Wind Atlas Production Runs; NEWA–New European Wind Atlas: Barcelona, Spain, 2019. [Google Scholar] [CrossRef]
- Tine, B.; Yalamarthy, K.P.; Elsabbagh, F.; Hyesoon, K. Vortex: Extending the RISC-V ISA for GPGPU and 3D-Graphics. In Proceedings of the MICRO-54: 54th Annual IEEE/ACM International Symposium on Microarchitecture, Athens, Greece, 18–22 October 2021; pp. 754–766. [Google Scholar]
- Staffell, I.; Pfenninger, S. Using bias-corrected reanalysis to simulate current and future wind power output. Energy 2016, 114, 1224–1239. [Google Scholar] [CrossRef]
- ESMAP. Assistance Program for the Energy Sector Management. 2020. Available online: https://www.esmap.org/ (accessed on 30 November 2021).
- DTU. Technical University of Denmark. 2020. Available online: https://www.dtu.dk/english (accessed on 30 November 2021).
- Kim, J.Y.; Oh, K.Y.; Kim, M.S.; Kim, K.Y. Evaluation and characterization of offshore wind resources with long-term met mast data corrected by wind lidar. Renew. Energy 2019, 144, 41–55. [Google Scholar] [CrossRef]
- Shen, S.; Leptoukh, G.; Loboda, T.; Csiszar, I.; Romanov, P.; Gerasimov, I. The NASA NEESPI data portal to support studies of climate and environmental changes in non-boreal Europe. In Regional Aspects of Climate-Terrestrial-Hydrologic Interactions in Non-boreal Eastern Europe; Springer: Dordrecht, The Netherlands, 2009; pp. 9–16. [Google Scholar]
- Abdelaal, A.; Abbas, E.A.; Beheary, M.S. Assessment of dust major ions and suspended heavy metal contents in atmospheric particulate matter of Port Said city, Egypt. Arab. J. Geosci. 2021, 14, 1–17. [Google Scholar] [CrossRef]
- Ledari, D.G.; Hamidi, M.; Shao, Y. Numerical simulation of the 18 February 2017 frontal dust storm over southwest of Iran using WRF-Chem, satellite imagery, and PM10 concentrations. J. Arid Environ. 2022, 196, 104637. [Google Scholar] [CrossRef]
- Wei, J.C.; Ichoku, C.M.; Petrenko, M.; Yang, W.; Albayrak, A.; Zhao, P.; Johnson, J.E.; Kempler, S. NASA GES DISC Aerosol analysis and visualization services. AGU Fall Meet. Abstr. 2015, 2015, A31D-0098. [Google Scholar]
- Tariq, S.; Qayyum, F.; Ul-Haq, Z.; Mehmood, U. Long-term spatiotemporal trends in aerosol optical depth and its relationship with enhanced vegetation index and meteorological parameters over South Asia. Environ. Sci. Pollut. Res. 2022, 1–18. [Google Scholar] [CrossRef]
- Bhadauriya, S.; Chaudhary, N.; Mamatha, S.; Ray, S. Relationship Between Rice Residue Burning and Increasing Air Pollution in North-West India. Int. Arch. Photogramm. Remote Sens. Spat. Inf. Sci. 2020, 43, 1423–1430. [Google Scholar] [CrossRef]
- Jury, M.R. Meteorology of air pollution in Los Angeles. Atmos. Pollut. Res. 2020, 11, 1226–1237. [Google Scholar] [CrossRef]
- Sharma, R.; Sachdeva, K.; Sharma, A.R. Surface ozone in Indian urban region. In Asian Atmospheric Pollution; Elsevier: Amsterdam, The Netherlands, 2022; pp. 323–333. [Google Scholar]
- Jamali, A.A.; Kalkhajeh, R.G.; Randhir, T.O.; He, S. Modeling relationship between land surface temperature anomaly and environmental factors using GEE and Giovanni. J. Environ. Manag. 2022, 302, 113970. [Google Scholar] [CrossRef] [PubMed]
- Arribas, L.; Lechón, Y.; Perula, A.; Domínguez, J.; Ferres, M.; Navarro, J.; Zarzalejo, L.F.; García Barquero, C.; Cruz, I. Review of Data and Data Sources for the Assessment of the Potential of Utility-Scale Hybrid Wind–Solar PV Power Plants Deployment, under a Microgrid Scope. Energies 2021, 14, 7434. [Google Scholar] [CrossRef]
- Polo, J.; Bernardos, A.; Navarro, A.; Fernandez-Peruchena, C.; Ramírez, L.; Guisado, M.V.; Martínez, S. Solar resources and power potential mapping in Vietnam using satellite-derived and GIS-based information. Energy Convers. Manag. 2015, 98, 348–358. [Google Scholar] [CrossRef]
- Grassi, S.; Chokani, N.; Abhari, R.S. Large scale technical and economical assessment of wind energy potential with a GIS tool: Case study Iowa. Energy Policy 2012, 45, 73–85. [Google Scholar] [CrossRef]
- Gielen, D.; Gorini, R.; Wagner, N.; Leme, R.; Gutierrez, L.; Prakash, G.; Asmelash, E.; Janeiro, L.; Gallina, G.; Vale, G.; et al. Global Energy Transformation: A Roadmap to 2050. 2019. Available online: https://www.irena.org/-/media/Files/IRENA/Agency/Publication/2019/Apr/IRENA_Global_Energy_Transformation_2019.pdf (accessed on 30 November 2021).
- Spyridonidou, S.; Vagiona, D.G.; Loukogeorgaki, E. Strategic Planning of Offshore Wind Farms in Greece. Sustainability 2020, 12, 905. [Google Scholar] [CrossRef]
- Enevoldsen, P.; Permien, F.H. Mapping the Wind Energy Potential of Sweden: A Sociotechnical Wind Atlas. J. Renew. Energy 2018, 2018, 1650794. [Google Scholar] [CrossRef]
- de Santoli, L.; Mancini, F.; Astiaso Garcia, D. A GIS-based model to assess electric energy consumptions and usable renewable energy potential in Lazio region at municipality scale. Sustain. Cities Soc. 2019, 46, 101413. [Google Scholar] [CrossRef]
- Gigović, L.; Pamučar, D.; Božanić, D.; Ljubojević, S. Application of the GIS-DANP-MABAC multi-criteria model for selecting the location of wind farms: A case study of Vojvodina, Serbia. Renew. Energy 2017, 103, 501–521. [Google Scholar] [CrossRef]
- Grau, L.; Jung, C.; Schindler, D. On the Annual Cycle of Meteorological and Geographical Potential of Wind Energy: A Case Study from Southwest Germany. Sustainability 2017, 9, 1169. [Google Scholar] [CrossRef]


| Field | Description |
|---|---|
| Wind data | Wind variables that can be obtained: wind speed, direction, and typical deviation |
| Methodology | Procedure used to obtain wind variables and identify data truthfulness |
| It is necessary to know the procedure used to obtain wind variables | |
| Height | Height suitable for the wind turbine nacelle to be placed |
| Sampling campaign | A higher number of period available, facilitating wind-resource analysis |
| Frequency | Reducing uncertainty, giving accurate estimations |
| Download format | Text, csv format, spreadsheet |
| Type of location | Onshore, offshore or both |
| Source | Type | Website | Contribution | |
|---|---|---|---|---|
| WI | CI | |||
| Weather station, ocean buoys, | ||||
| information on ports or institutions of the country | X | [17,25,27,28,29,32,46,47,48,49,50,51,52,53,54,55,56,57,58,59,60,61,62,63,64,65,66,67,68,69,70,71,72,73,74,75,76,76] | ||
| Results of research projects or other studies | X | [77,78,79,80,81,82,83,84,85] | ||
| Databases without free access | X | [33,86,87,88] | ||
| Unidentified or non-existent source | X | [64,89,90,91,92] | ||
| Technical reports | X | [92,93,94] | ||
| Simulations from weather stations | X | [95,96,97,98] | ||
| ECMWF | X | [99] | [31,100,101,102,103,104,105,106,107,108,108] | |
| NOAA | X | [109] | [110,111,112,113,114] | |
| NEWA | X | [115] | ||
| Vortex | X | [116] | ||
| Renewables.Ninja | X | [117] | ||
| WindFinder | X | [118] | ||
| Global Wind Atlas | X | X | [119] | [85,120,121,122,123] |
| NREL | X | X | [124] | [125,126,127] |
| FINO | X | X | [128] | [129] |
| NASA Power Larc | X | X | [130] | [107,108,122,123,131,132,133] |
| Source | Wind Data | Height (m) | Sampling Campaign |
|---|---|---|---|
| ECMWF [99] | WS and WD | 10 and 30 | Annual, monthly, and daily |
| NOAA [109] | WS | Superficial | Annual and monthly |
| NEWA [115] | WS and WD | Microscale: 50, 75, 100, 150 | Daily (until 31 December 2018) |
| Mesoscale: 50, 100, 200 | |||
| Vortex [116] | WS, WD, and WP | Depends on coordinates | Annual, monthly, and daily |
| Renewables.Ninja [117] | WS and WP | Between 10 m and 150 m | Hourly (until 31 December 2019) |
| WindFinder [118] | WS and WD | Superficial | Forecast (7–8 h) frequency of 3 h |
| Global Wind Atlas [119] | Avg. WS, WD, and WP | 10, 50, 100, 150, and 200 | Annual, monthly, and daily |
| Roughness | |||
| NREL [124] | WS | Onshore: 10–200, offshore: 90 | 2007–2013 |
| FiNO3 [128] | WS and WD | Between 34 and 91 | Hourly, every 10 min |
| NASA Power Larc [130] | WS (max. and min.) | 50 | Annual and daily (60 per day) |
| Source | Methodology | Updating Data | Source | Cell Grid |
|---|---|---|---|---|
| ECMWF [99] | Satellite simulation | - | SB | 10 km2 |
| NOAA [109] | Weather Station and | 1 h | SB | 40,000 km2 |
| satellite simulation | ||||
| (satellite measurements) | ||||
| NEWA [115] | WRF (simulation) | - | SB | Microscale: 2500 m2 |
| Mesoscale: 9 km2 | ||||
| Vortex [116] | WRF | 10 min | SB | 30 km2 |
| (prediction and simulation) | ||||
| Renewables Ninja [117] | MERRA | 1 h | SB | Only coordinates |
| (satellite observations) | ||||
| WindFinder [118] | GFS | 3 h | SB | - |
| (forecast simulation) | ||||
| Global Wind Atlas [119] | WAsP (simulation) | 1 h | SB | 30 km2 |
| NREL [124] | Satellite simulation | 1 h | SB | 30 km2 |
| FiNO3 [128] | Wheather station | 10 min | GB | Only coordinates |
| NASA Power Larc [130] | MERRA-2 | 25 min | SB | Every 2500 km2 |
| References by Objective | |||
|---|---|---|---|
| GIS Resource | Optimization | Forecasting | Potential |
| Institutions of the country | [17,25,29,48,49,50,51,52,53,54,58,59,60,61,93,159] | [64,67,68,69,70,71,97,111] | [60,73,74,75,76,85,92] |
| Other studies | [64,78,80,83,94] | - | [160,161,162] |
| Databases without free access | [33,62,86] | - | - |
| Unidentified | - | [105] | - |
| Technical reports | - | [91] | - |
| Simulations | [28,92,95] | [90] | [110,163] |
| ECMWF [99] | [31,101,102] | [66,84,103,104] | [102,106,107,108] |
| NOAA [109] | [110] | [65,112,113,114] | - |
| NEWA [115] | - | - | - |
| Renewables.Ninja [117] | - | - | - |
| Global Wind Atlas [119] | [85,120] | [72,121,122] | [98,123] |
| NREL [124] | [125] | [126] | [27,127] |
| FINO [128] | - | - | - |
| NASA Power Larc [130] | - | [66] | [107,108,123,131,132,133] |
| Source | GIS Integration | Download Format | Sample Time | Download Limit |
|---|---|---|---|---|
| NOAA [109] | Coordinate data | .csv | - | - |
| NEWA [115] | Color mapping | Shape (.nc) | 30 min | Hourly, day by day |
| Vortex [116] | - | - | - | - |
| Renewables Ninja [117] | Coordinate data | .csv | 1 h | Hourly, year by year |
| WindFinder [118] | - | - | - | - |
| Global Wind Atlas [119] | Color mapping | Shape (.tiff) | - | - |
| NREL [124] | Color mapping | Shape (.shp) y .csv | - | - |
| FiNO3 [128] | Coordinate data | .csv | 10 min | Hourly, year by year |
| NASA Power Larc [130] | Coordinate data | .csv | Daily | Daily, year by year |
| Source | Daily | Monthly | Yearly |
|---|---|---|---|
| NEWA [115] | 2.46% | ||
| Renewables Ninja [117] | 2.78% | 10.51% | 11.60% |
| Nasa Power Larc [130] | 29.05% |
| Source | HT | CSV | GIS | INT | RT |
|---|---|---|---|---|---|
| ECMWF | X | X | X | ||
| NOAA | X | X | |||
| NEWA | X | X | |||
| Vortex | X | X | X | ||
| Renewables.Ninja | X | ||||
| WindFinder | X | X | X | ||
| Global Wind Atlas | X | X | |||
| NREL | X | X | |||
| FINO | X | ||||
| NASA Power Larc | X | X |
Publisher’s Note: MDPI stays neutral with regard to jurisdictional claims in published maps and institutional affiliations. |
© 2022 by the authors. Licensee MDPI, Basel, Switzerland. This article is an open access article distributed under the terms and conditions of the Creative Commons Attribution (CC BY) license (https://creativecommons.org/licenses/by/4.0/).
Share and Cite
Sánchez-del Rey, A.; Gil-García, I.C.; García-Cascales, M.S.; Molina-García, Á. Online Wind-Atlas Databases and GIS Tool Integration for Wind Resource Assessment: A Spanish Case Study. Energies 2022, 15, 852. https://doi.org/10.3390/en15030852
Sánchez-del Rey A, Gil-García IC, García-Cascales MS, Molina-García Á. Online Wind-Atlas Databases and GIS Tool Integration for Wind Resource Assessment: A Spanish Case Study. Energies. 2022; 15(3):852. https://doi.org/10.3390/en15030852
Chicago/Turabian StyleSánchez-del Rey, Agustín, Isabel Cristina Gil-García, María Socorro García-Cascales, and Ángel Molina-García. 2022. "Online Wind-Atlas Databases and GIS Tool Integration for Wind Resource Assessment: A Spanish Case Study" Energies 15, no. 3: 852. https://doi.org/10.3390/en15030852
APA StyleSánchez-del Rey, A., Gil-García, I. C., García-Cascales, M. S., & Molina-García, Á. (2022). Online Wind-Atlas Databases and GIS Tool Integration for Wind Resource Assessment: A Spanish Case Study. Energies, 15(3), 852. https://doi.org/10.3390/en15030852