Review

Electric Vehicles: V2G for Rapid, Safe, and Green EV Penetration

Department of Architecture and Built Environment, Faculty of Engineering, The University of Nottingham, Nottingham NG7 2RD, UK
*
Author to whom correspondence should be addressed.
Energies 2022, 15(3), 803; https://doi.org/10.3390/en15030803
Submission received: 29 December 2021 / Revised: 13 January 2022 / Accepted: 18 January 2022 / Published: 22 January 2022
(This article belongs to the Topic Sustainable Energy Technology)

Abstract

:
Low carbon and renewable energy sources (RESs) are fast becoming a key sustainable instrument in meeting the global growth of electricity demand while curbing carbon emissions. For example, the gradual displacement of fossil-fuelled vehicles with electrically driven counterparts will inevitably increase both the power grid baseload and peak demand. In many developed countries, the electrification process of the transport sector has already started in tandem with the installation of multi-GW renewable energy capacity, particularly wind and solar, huge investment in power storage technology, and end-user energy demand management. The expansion of the Electric Vehicle (EV) market presents a new opportunity to create a cleaner and transformative new energy carrier. For instance, a managed EV battery charging and discharging profile in conjunction with the national grid, known as the Vehicle-to-Grid system (V2G), is projected to be an important mechanism in reducing the impact of renewable energy intermittency. This paper presents an extensive literature review of the current status of EVs and allied interface technology with the power grid. The main findings and statistical details are drawn from up-to-date publications highlighting the latest technological advancements, limitations, and potential future market development. The authors believe that electric vehicle technology will bring huge technological innovation to the energy market where the vehicle will serve both as a means of transport and a dynamic energy vector interfacing with the grid (V2G), buildings (V2B), and others (V2X).

1. Introduction

Reliable and affordable energy has been the main driver of global economic development and, in turn, an enhanced standard of living. However, deriving most of this energy from fossil fuel sources has severely impacted the Earth, with global warming posing an existential threat. Current estimates indicate an ascending trajectory in global energy consumption from the current level of about 583.9 EJ [1]. Similarly, according to the International Energy Agency (IEA) under the stated policy scenarios in 2019, it is expected that the electricity demand will increase to 37,000 TWh in 2040, which is nearly 3 times higher than that of 2000 [2], as illustrated in Figure 1. The data presented in Figure 1 were provided by International Energy Agency (IEA) [3].
Presently, fossil-based energy sources remain the most widely used form of energy to meet the increasing energy demand. It is widely believed that this is unsustainable as it contributes to the depletion of fossil fuel reserves and increased concentration of greenhouse gases (GHG) in the atmosphere [1,4]. This has been identified as a direct precursor of global warming and the ensuing extreme global weather conditions [5,6,7].
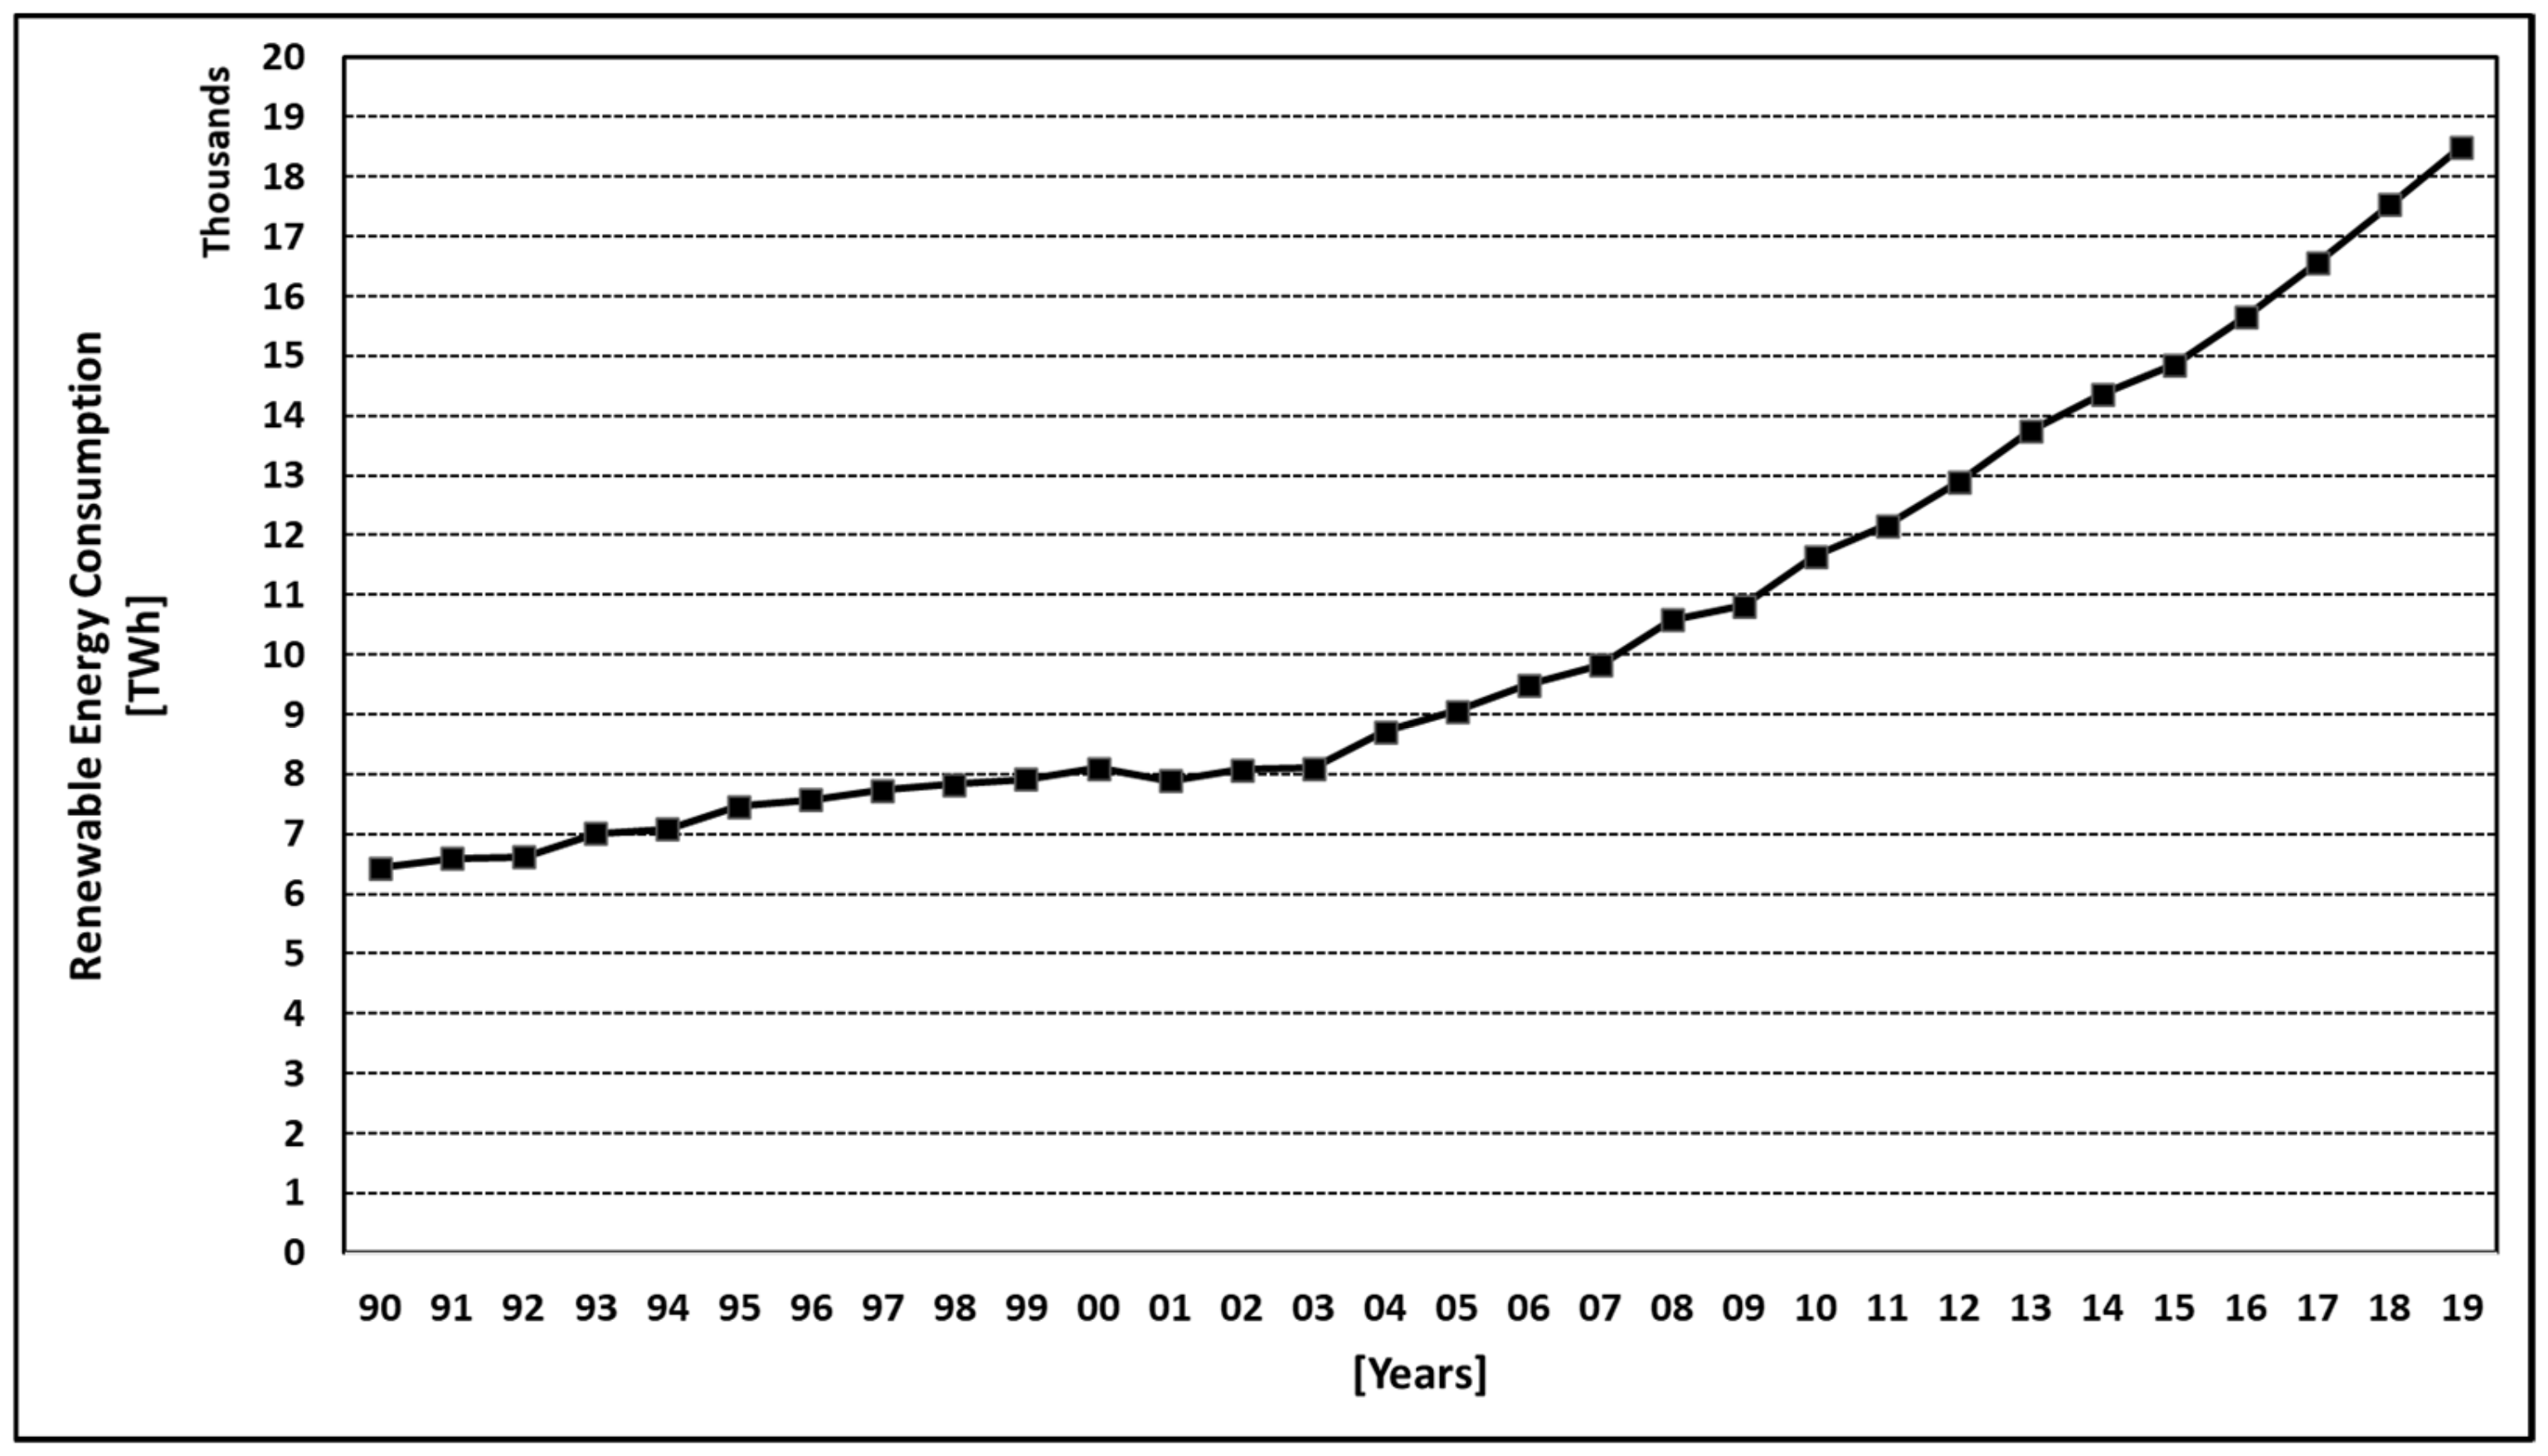
The energy challenge presented in Figure 1 is enormous as sustaining the projected growth of electricity consumption competes with the need to decarbonise the energy system as a whole. RESs, particularly wind and solar, are being implemented in large-scale schemes as a direct replacement for fossil-fuelled power generation plants that will form the backbone of future power generation infrastructure [8]. In developed countries, Renewable Energy (RE) generation capacity has been increasing rapidly over the last few years. Figure 2 shows the increasing primary energy consumption from RESs between 1990 and 2019. The data presented in Figure 2 were provided by Our World in Data [9].
For instance, in the last 5 years, the most dominant form of REs is solar and wind energy, which have grown annually by 27% and 13%, respectively [9]. Despite the progress made in many developed countries, renewables continue to account for a mere 5% of global primary energy consumption [1]. Today, the deployment of renewables at scale remains expensive and confined to countries with technical know-how and developed financial markets. In addition, the intermittency of RESs results in power quality and power flow problems, which require installation of fossil-fuelled spare power generation capacity, Demand Side Management (DSM), and Energy Storage Technologies (ESTs) [8,10,11,12,13].
Another vital sector of the economy that has presented huge challenges for decarbonise is transportation. According to IEA, in 2020, carbon emissions from transportation accounted for 24% of global emissions [14]. Currently, this is being addressed through a concerted research effort, investment in new manufacturing processes, and policy frameworks to develop EV technology to cut carbon emissions of the transportation sector as part of many developed countries commitments under successive climate change accords. The development of EVs is gathering pace in many countries, with the total number of light-duty EVs exceeding 10 million by the end of 2020 [15]. However, true decarbonisation is only possible with a fully decarbonised electricity grid, as the two sectors present a complementary synergy that can be developed into a holistic and effective decarbonisation solution [16]. V2G technology is a promising innovation providing a way to use EVs to store excess energy from RESs in the EV’s battery pack and release it back to the grid during the peak hours of energy demand, maximising the efficiency of large-scale RE integration. Another future development, which is close to market commercialisation, is ancillary services (ASs) such as management systems of frequency and voltage regulation of the grid [17,18]. This is further strengthened by current data on usage of private cars, which show the daily road mileage of most vehicles in the United Kingdom (UK) is approximately 20 m and that the vehicles are in the park mode for about 90% of the daily hours [19,20].
It is in this context that this paper attempts to provide an extended overview of the current state of EVs’ technological developments and market trends. The paper also examines the challenges to overcome, and the solutions being pursued by many world-leading manufacturers of EVs.

2. Overview of Electric Vehicle (EV) Technology

At the core of an EV powered by an onboard battery pack is an efficient electric motor and associated electrified powertrain. The powertrain consists of a traction inverter which optimises the motor torque, a battery management system which monitors the state of charge/discharge and health of the battery, and an onboard battery charger for recharging the battery from an AC source when the vehicles are parked.
Currently, there are four main types of EVs, namely Battery Electric Vehicles (BEVs), Plug-in Hybrid EVs (PHEVs), Hybrid EVs (HEVs), and Fuel Cell EVs (FCEVs). The configuration of the electric drivetrains of each type of these EVs is shown in Figure 3.
BEVs are EVs that are entirely powered by electricity supplied by the onboard battery packs. The first commercial EV, the Electrobat, was manufactured by Morris and Salom in 1894 with a maximum speed of 32 km/h and a driving range of 40 km. However, the advent of petrol and diesel engines provided superior traction power, travel range, and lower running cost, confining EV to niche markets (e.g., golf carts, warehouse forklifts, and delivery vehicles) [21]. In addition, early EVs used lead-acid batteries, which are cumbersome and have low energy density. The renaissance of EVs was practically driven by the advances of solid-state power electronics (in the 1970s) and the introduction of more powerful and lighter rechargeable lithium-ion (Li-ion) battery technology in the 1990s [21,22,23].
HEVs, by comparison, are powered by an internal combustion engine (ICE) and an electric motor, which is driven by the energy stored in the battery. Unlike BEVs, the battery of a HEV is charged through the mechanism of regenerative braking and by the ICE. The history of HEVs dates back to 1897 when Darracq discovered regenerative braking, which made it possible to increase the range of EVs and improve fuel efficiency. The first example of manufactured HEVs was in Belgium and France in 1899. The first HEVs consisted of an ICE, an electric motor, and a lead-acid battery. The vehicle was designed to charge the batteries by the ICE when it was coasting or idling. The first commercial success of HEVs was the introduction in 1997 of the Prius sedan car model by Toyota, followed by Honda’s Insight and Civic Hybrid models [21].
Like HEVs, PHEVs have an ICE and an electric motor. PHEVs, however, are equipped with a plug-in charger for battery recharging from an external power outlet. The first invention of modern PHEVs is attributed to Prof. Dr Andy Frank in the 1990s. Since then, due to huge investments in this technology, PHEVs are one of the most preferred EVs today [24].
Finally, the fourth type of EVs is FCEVs, which use an onboard fuel cell that converts hydrogen fuel directly into electrical power and stores it in a battery to drive the electric motor and power other car ancillaries. In 1966, General Motors produced the first FCEV, called the GMC Electrovan, with a maximum speed of 112 km/h and a range of 193 km. However, this vehicle could not be put into mass production due to the requirement for hydrogen generation and fuel cell stack costs [25].
The main advantages and drawbacks of the four types of EVs are summarised in Table 1. The information presented in Table 1 is adapted from [26,27,28,29].
Today, it can be said that the age of the EV is upon us and is in essence being imposed by the catastrophic effects of global warming. The first signs of a reduction in the carbon emissions of the transport sector have started to emerge [30] and this trend should become even clearer as the EV market continues to grow in the future.

3. The EV Market Potential

The global EV market size has been growing rapidly in the last decade, with the total number of light-duty and heavy-duty EVs reaching 10 million and 1 million, respectively by the end of 2020 [15]. According to BloombergNEF (BNEF) [31], the market outlook is for EVs to account for 58% of new car sales by 2040. It is also predicted that 8% of the total global vehicle stock, which is approximately 116 million, will be made up of PHEVs and BEVs by 2030. The UK National Grid [32] also estimates that the number of light-duty EVs in the UK will reach 36 million by 2040. Similarly, the IEA [33] estimates that there were 3 million additional EVs registered around the world in 2020, of which the BEVs share was about 66% greater than that of PHEVs [33]. The number of registered new BEVs was also estimated to increase to 4 million by the end of 2021, which is nearly double the number of registered EVs in 2020 [33,34]. Available data also support the assumption that the market for PHEVs will shrink in favour of BEVs with the advancement of battery technology and cost.
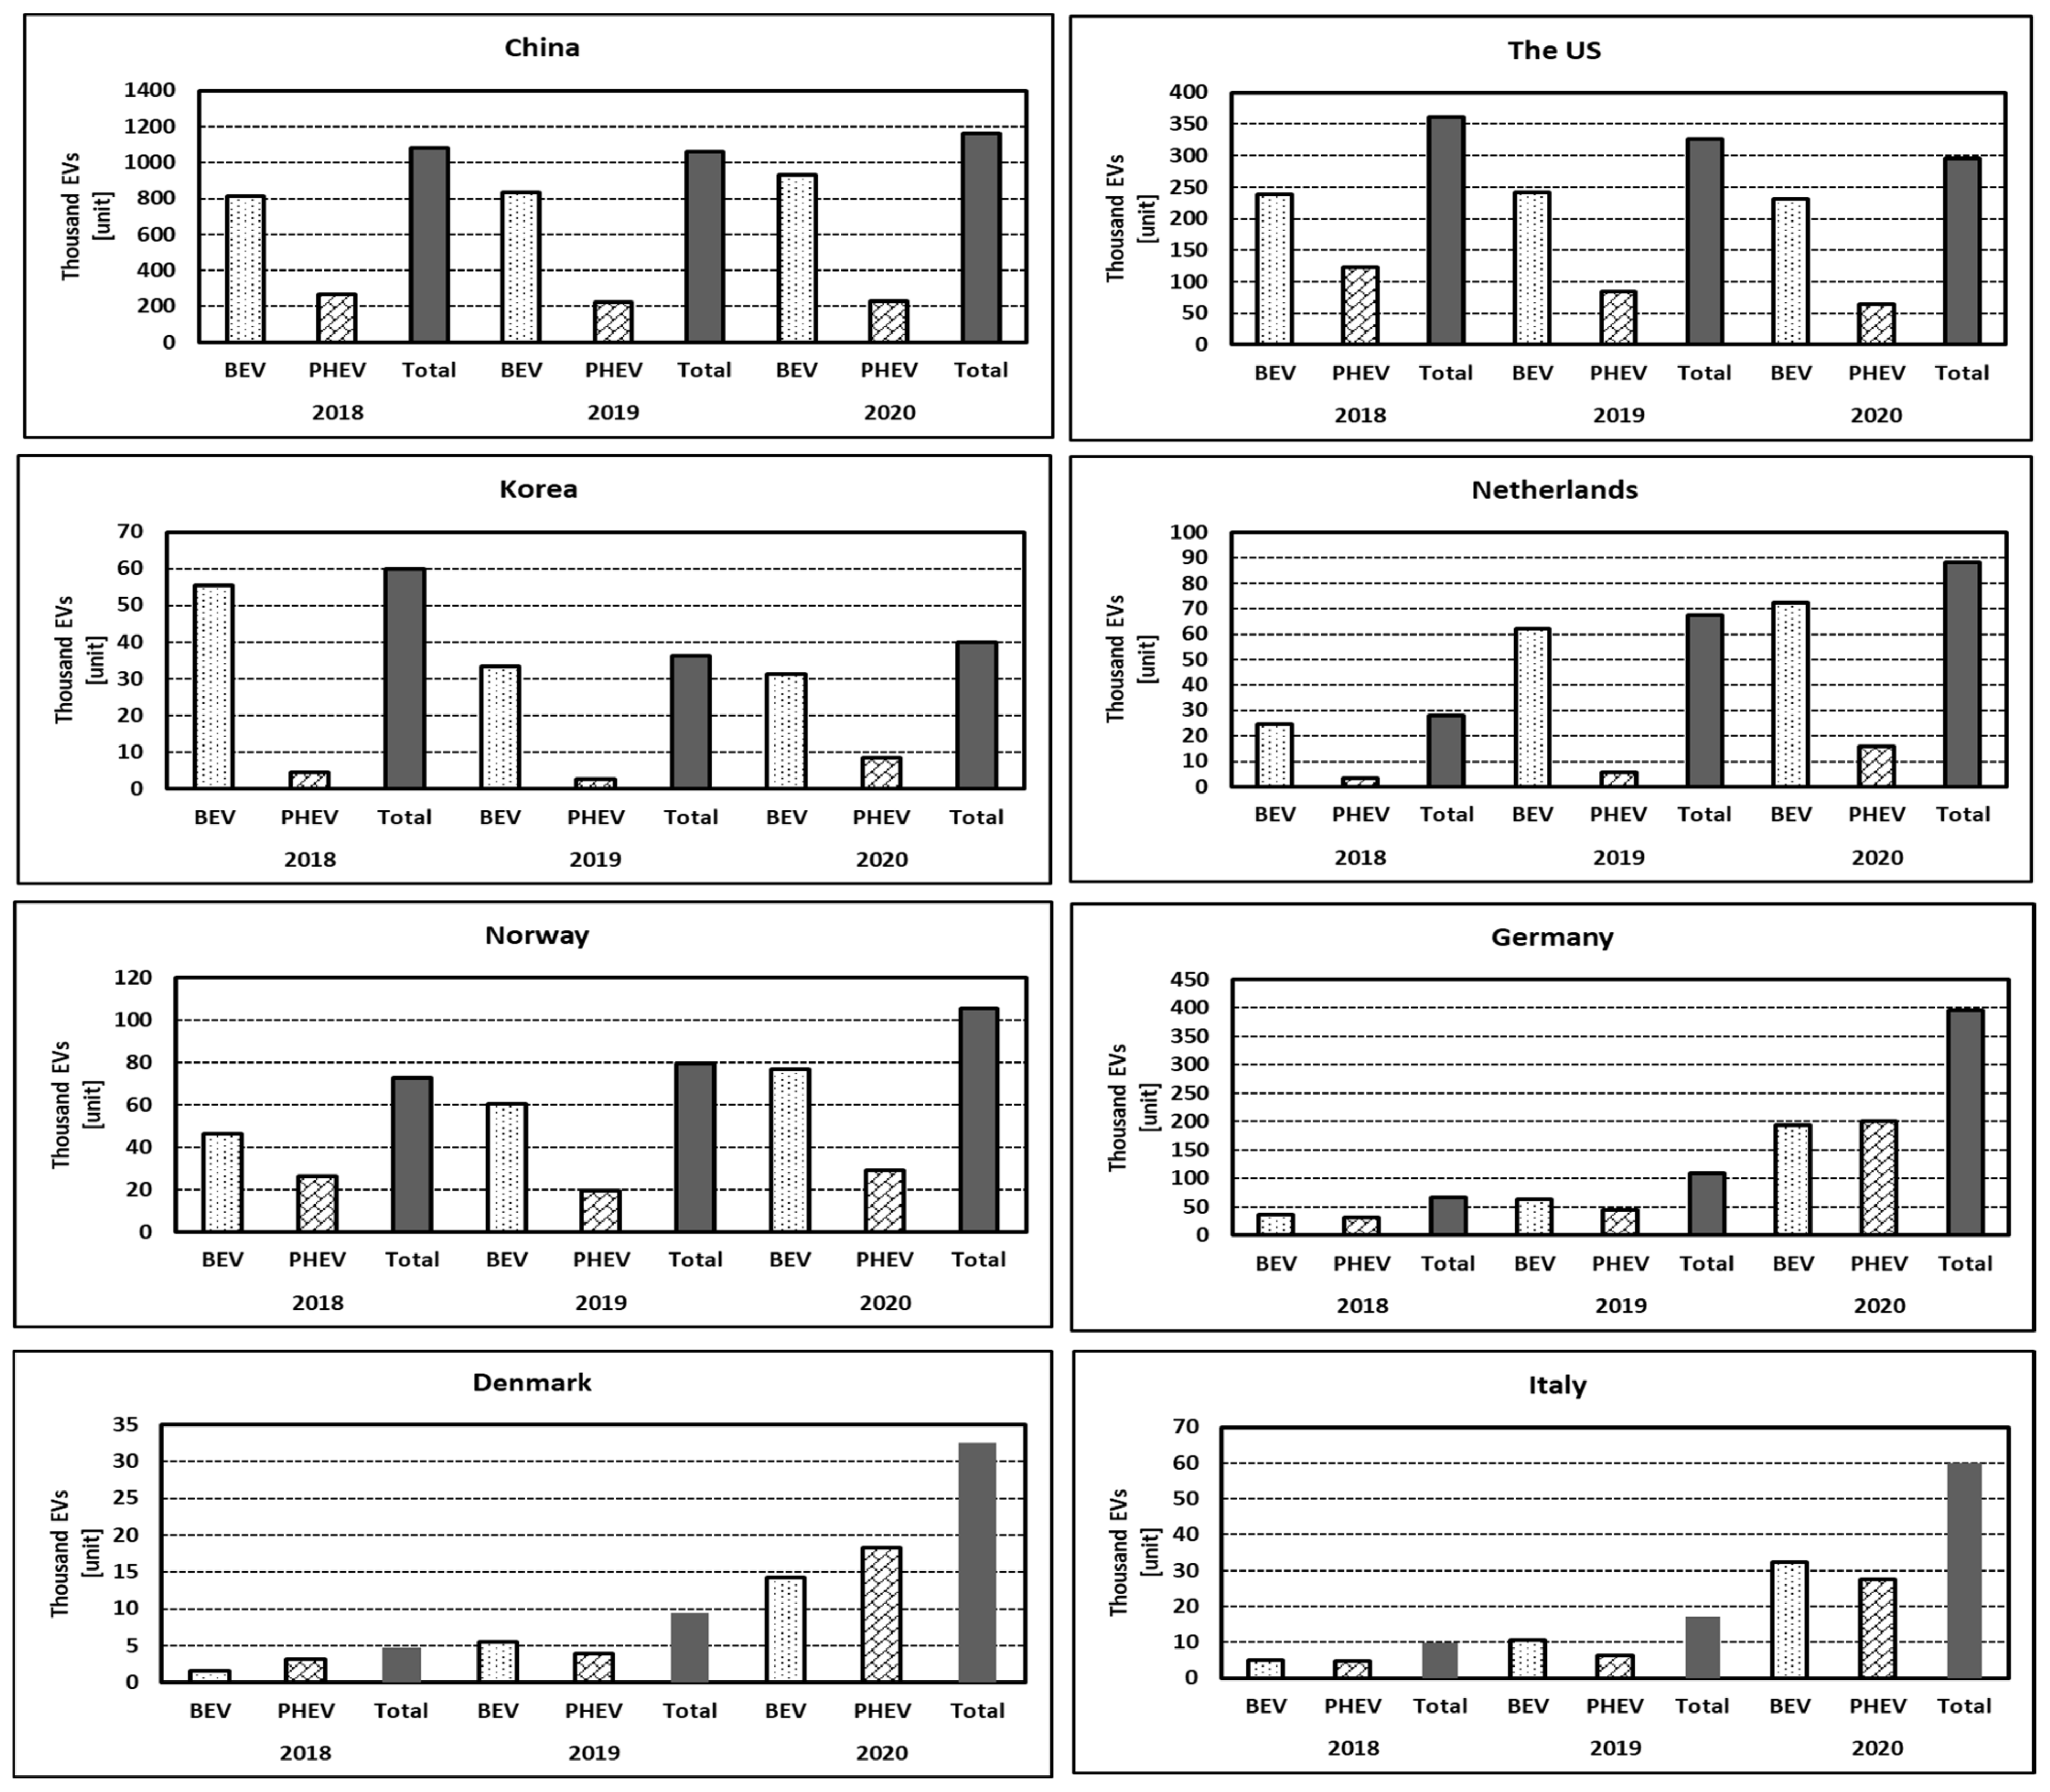
The world EV market is dominated by China, the United States (US), and Europe. The Chinese market accounted for more than 50% of global sales (1.06 million EVs) followed by Europe (561,000 EVs) and the US (327,000 EVs) in 2019 [35]. The European market, however, is developing at the fastest rate; in 2020, the number of EVs sold in Europe increased to 1.4 million, compared to China (1.2 million EVs) and the US (295,000 EVs). In Europe, the German EV market share is the biggest, with new registrations of 395,000, followed by France (185,000 EVs) and the UK (176,000 EVs) [33]. A more detailed breakdown of the world EV market is summarised in Figure 4. The data presented in Figure 4 were provided by IEA [36]. It can be seen the share of EV sales in the European Union (EU) countries is growing strongly, with countries such as Norway and the Netherlands representing 75% and 25%, respectively, of new registered cars. This is likely to accelerate further as many of these countries will be phasing out the sale of petrol and diesel cars and installing EV battery charging infrastructure in the next decade [37,38].
More detailed information related to the global EV market is summarised in Table 2 and Table 3. The information presented in Table 2 and Table 3 was adapted from IEA [36] and from [33,39,40], respectively.
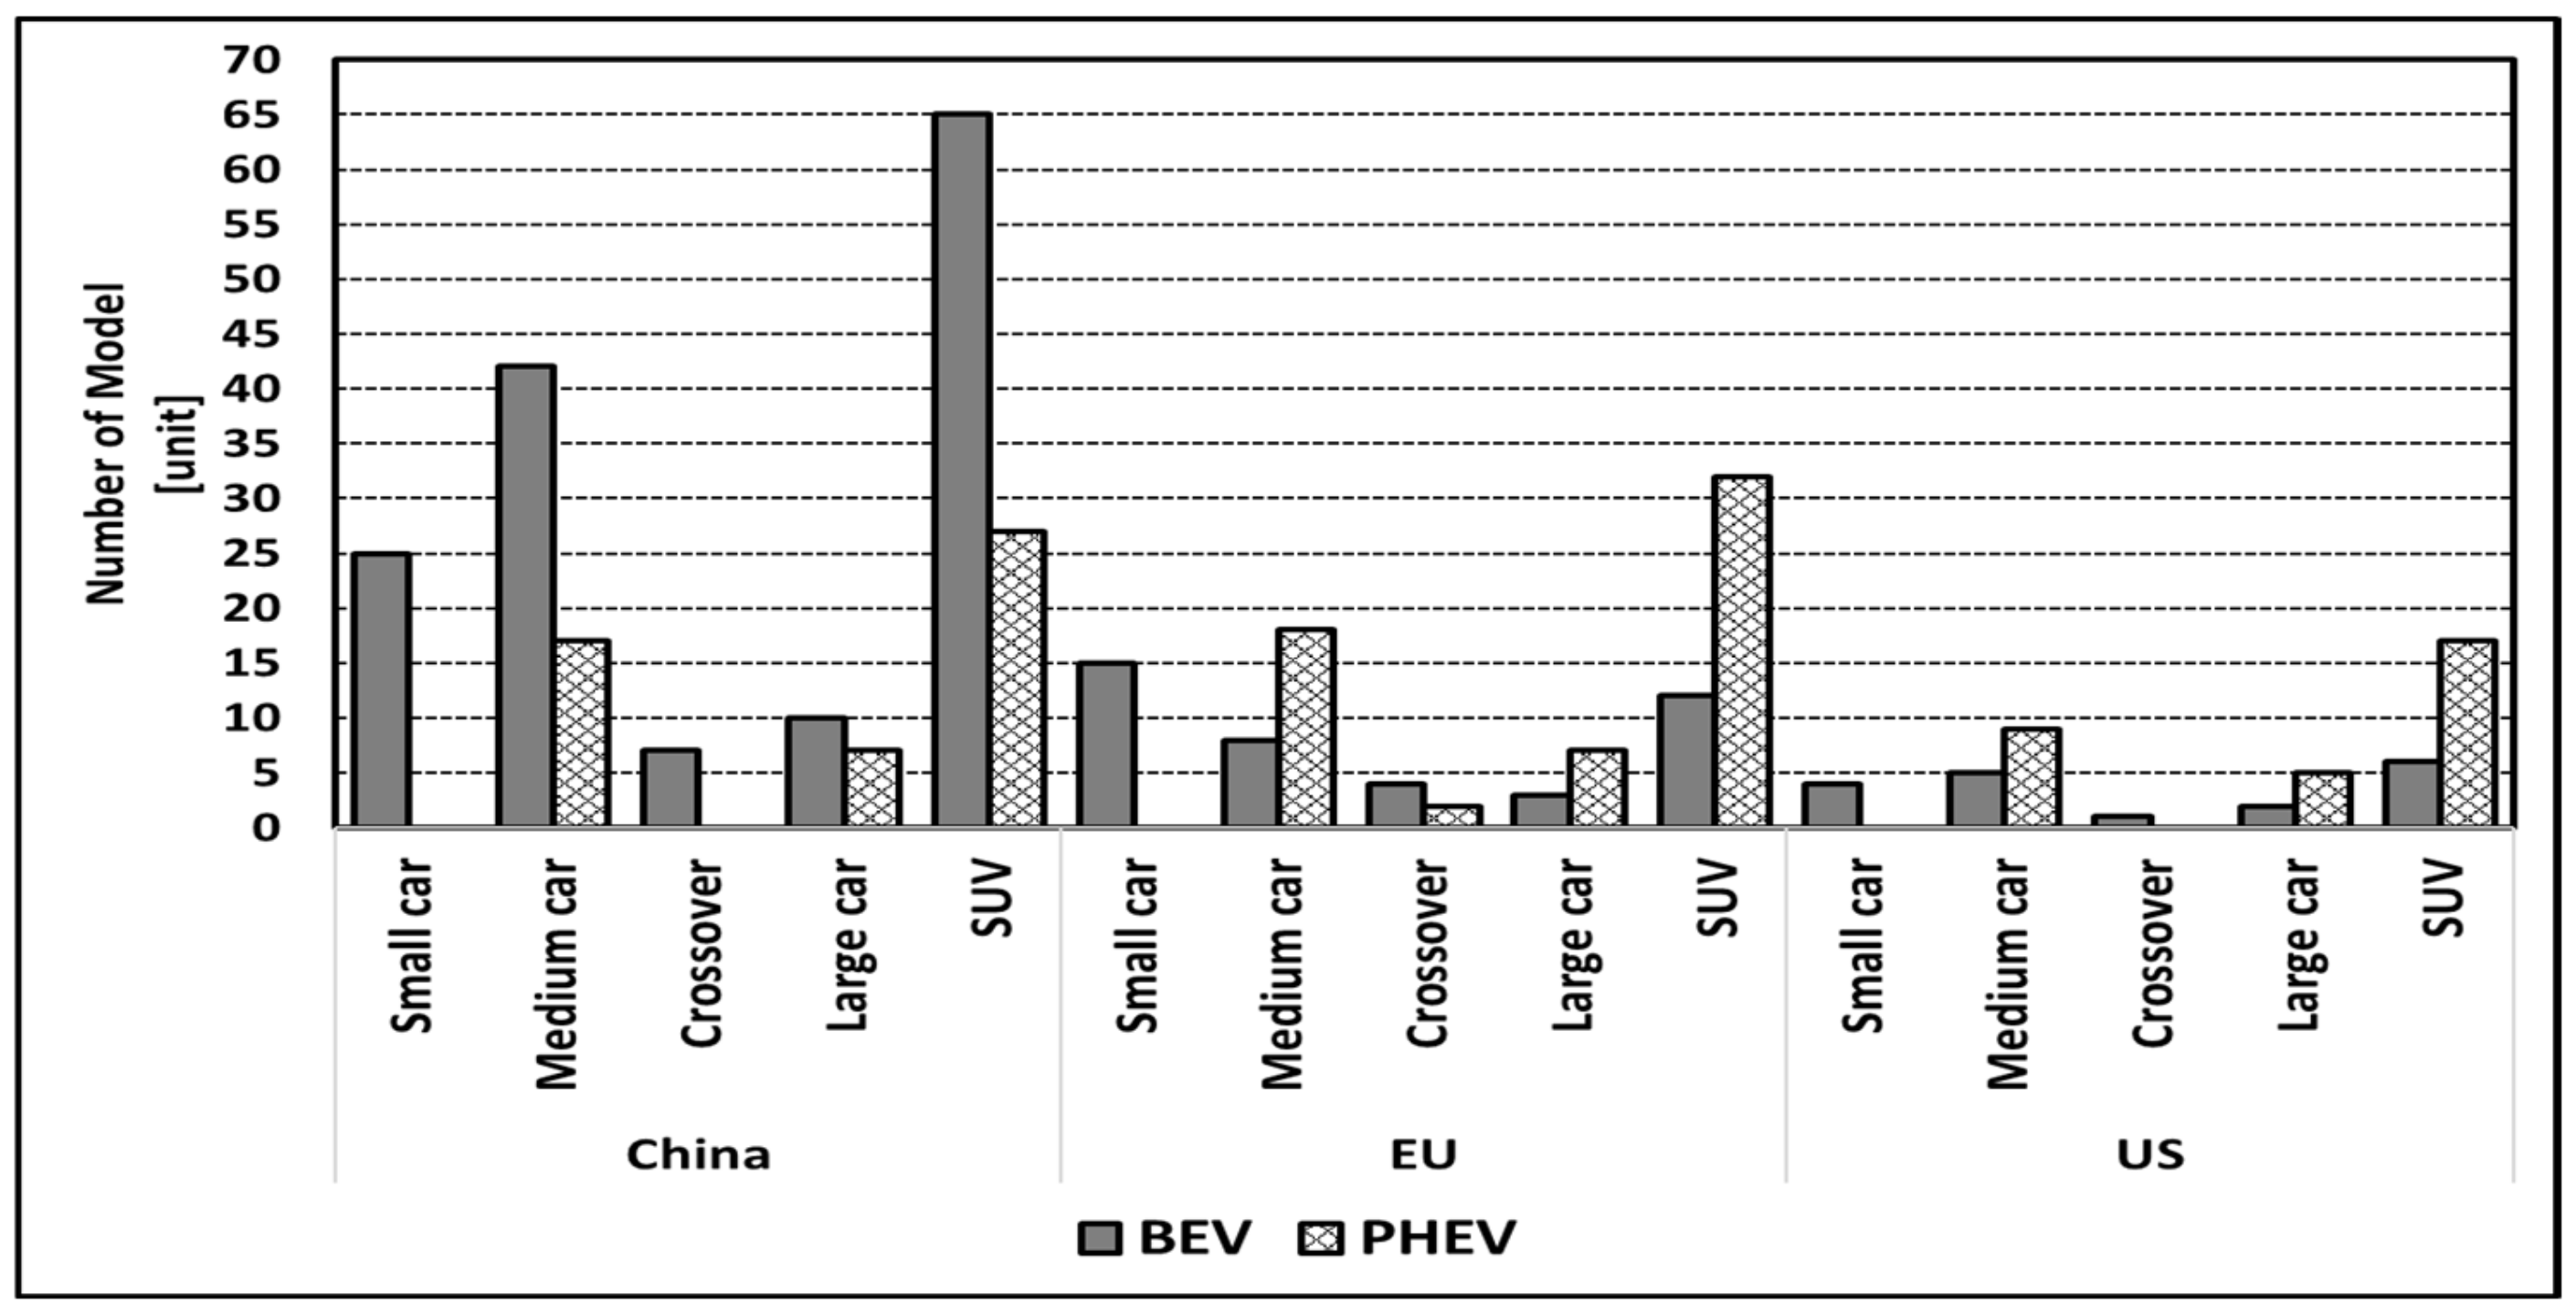
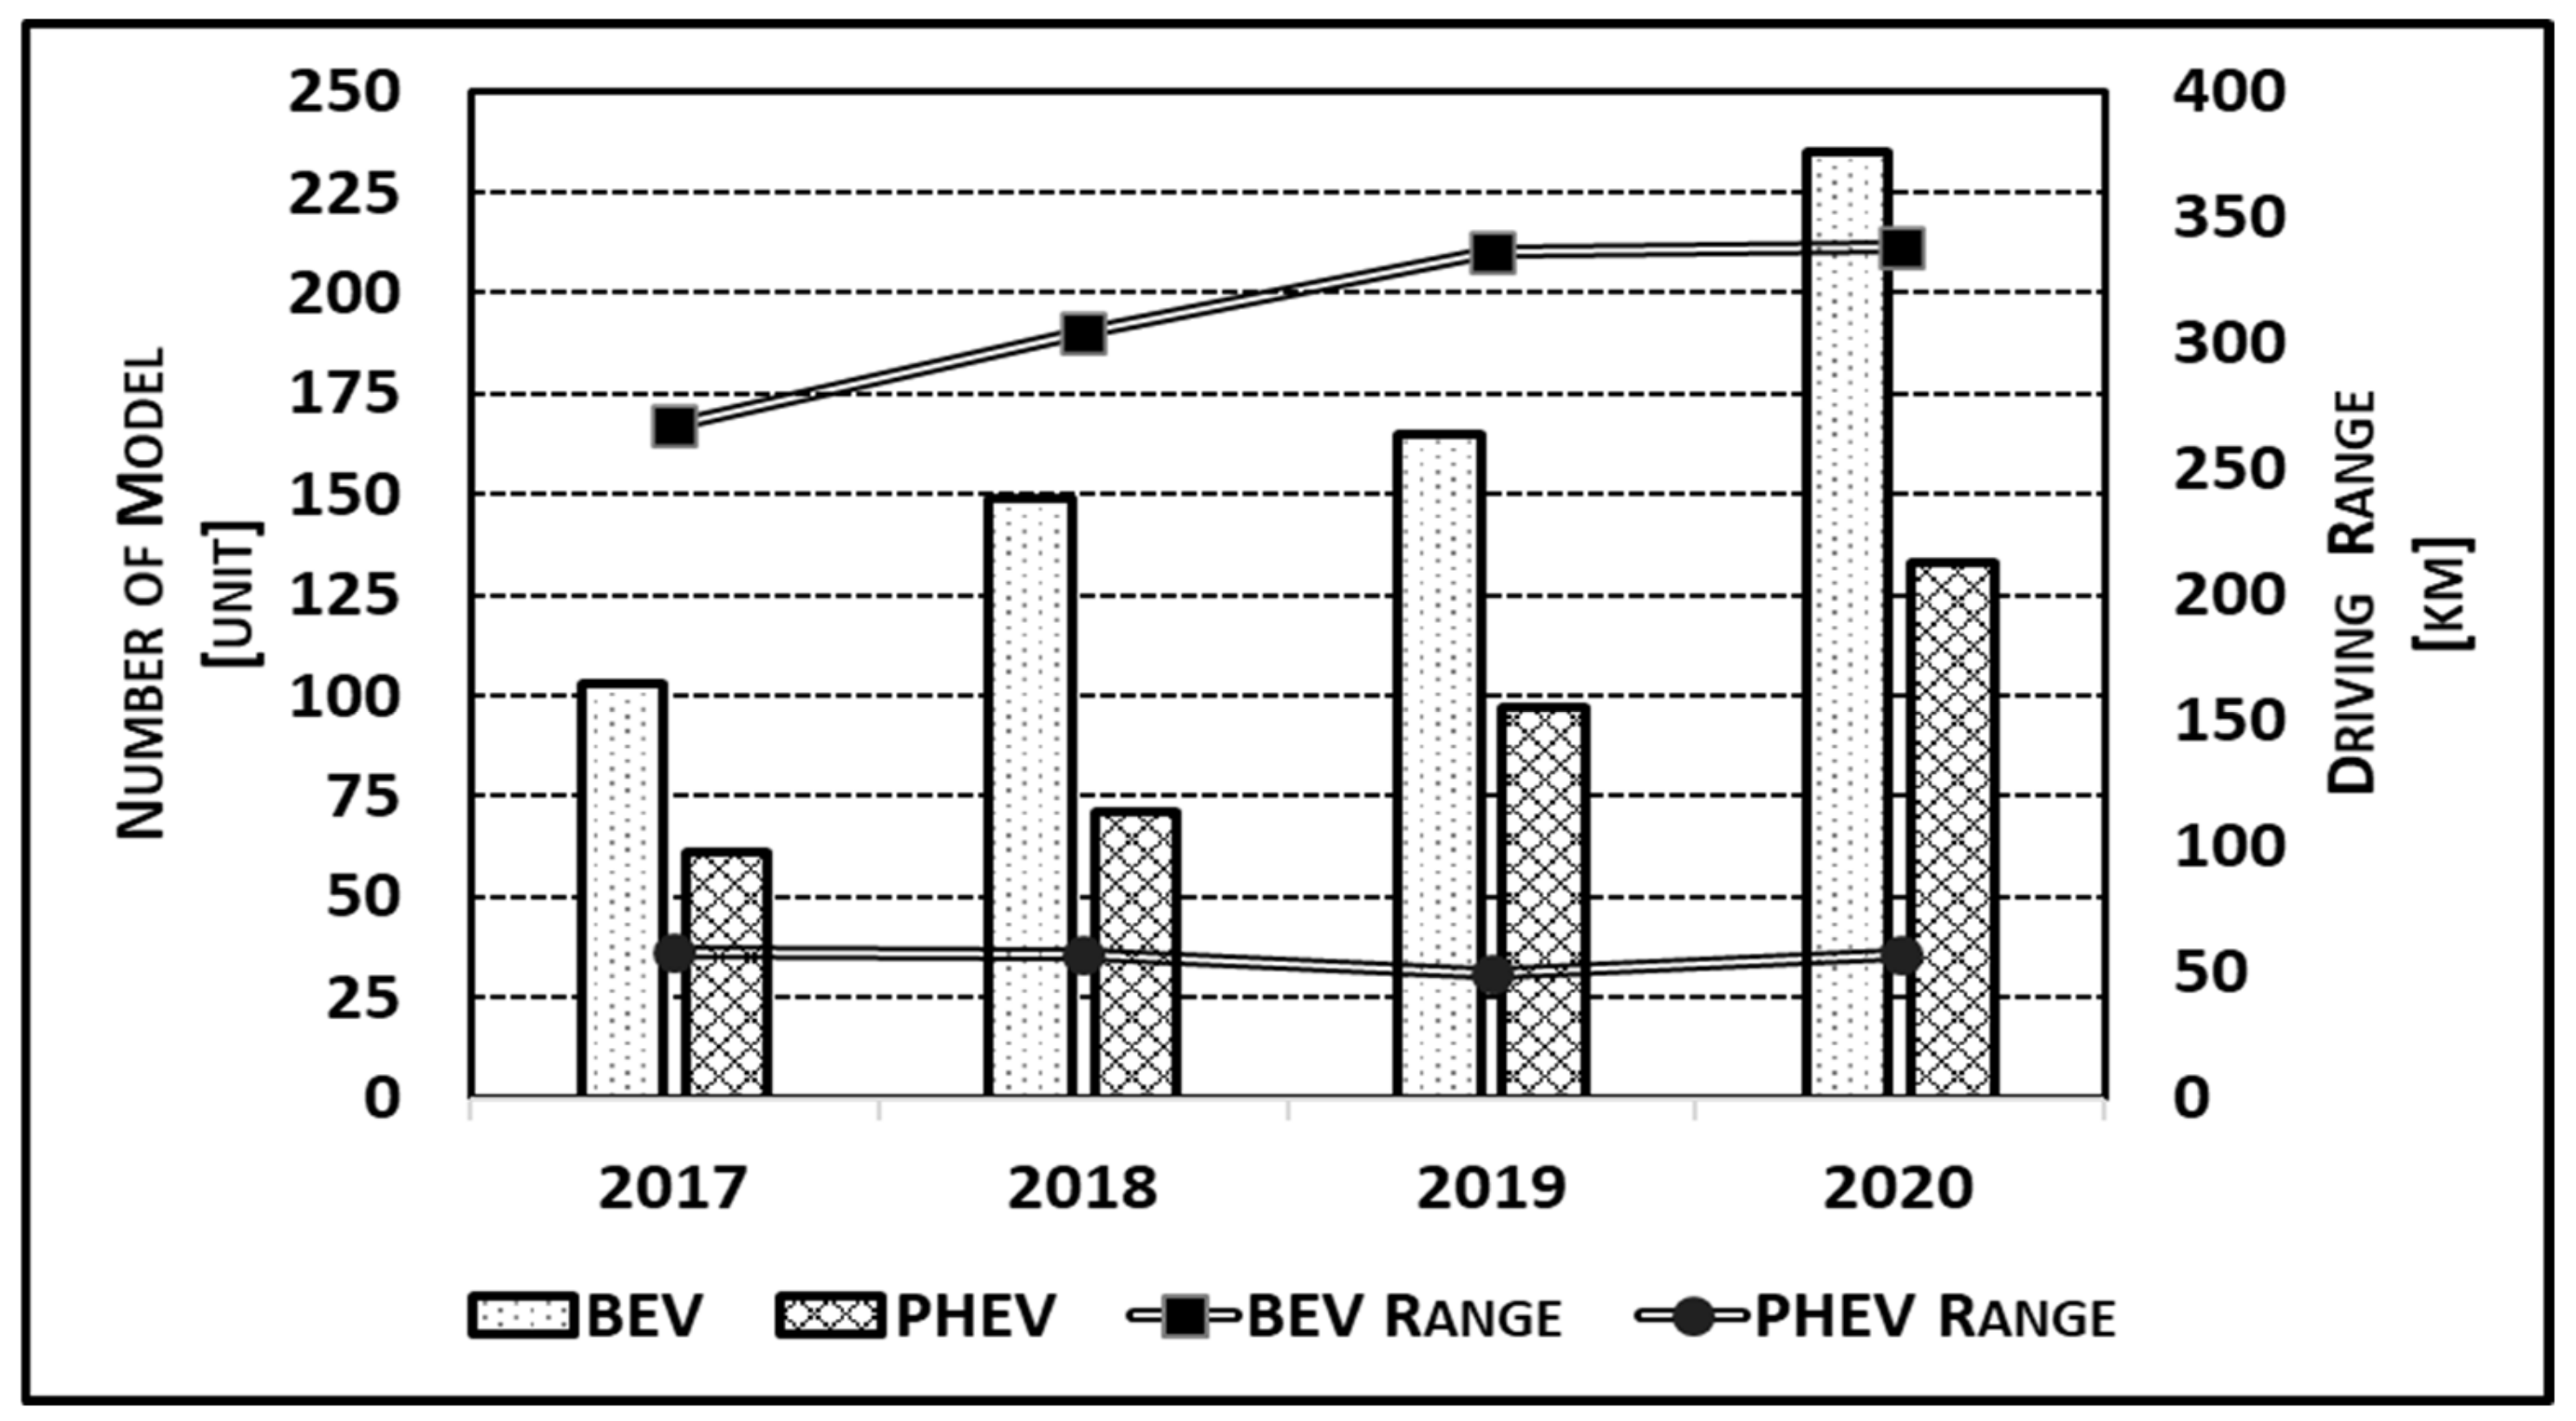
The expansion of the EV market also allows innovation in manufacturing with the introduction of new models. To date, there are some 370 different EV models from a number of traditional automotive companies and new entrants. In Europe, for example, the number of new EV models in 2020 has doubled compared to the previous year [33]. Figure 5 shows the available EV model types in the world in 2020. The data presented in Figure 5 were provided by IEA [36]. As can be seen from the figure, the Chinese market has the highest number of models (149 BEVs and 51 PHEVs), followed by the European market (42 BEVs and 59 PHEVs), and the US market (18 BEVs and 31 PHEVs). It is also worth noting that, unlike the Chinese market, the number of available PHEV models in Europe and the US is higher than that of BEVs. It can also be seen that SUV car models are more popular, with new models accounting for 55% of the new models in the world in 2020 [33].
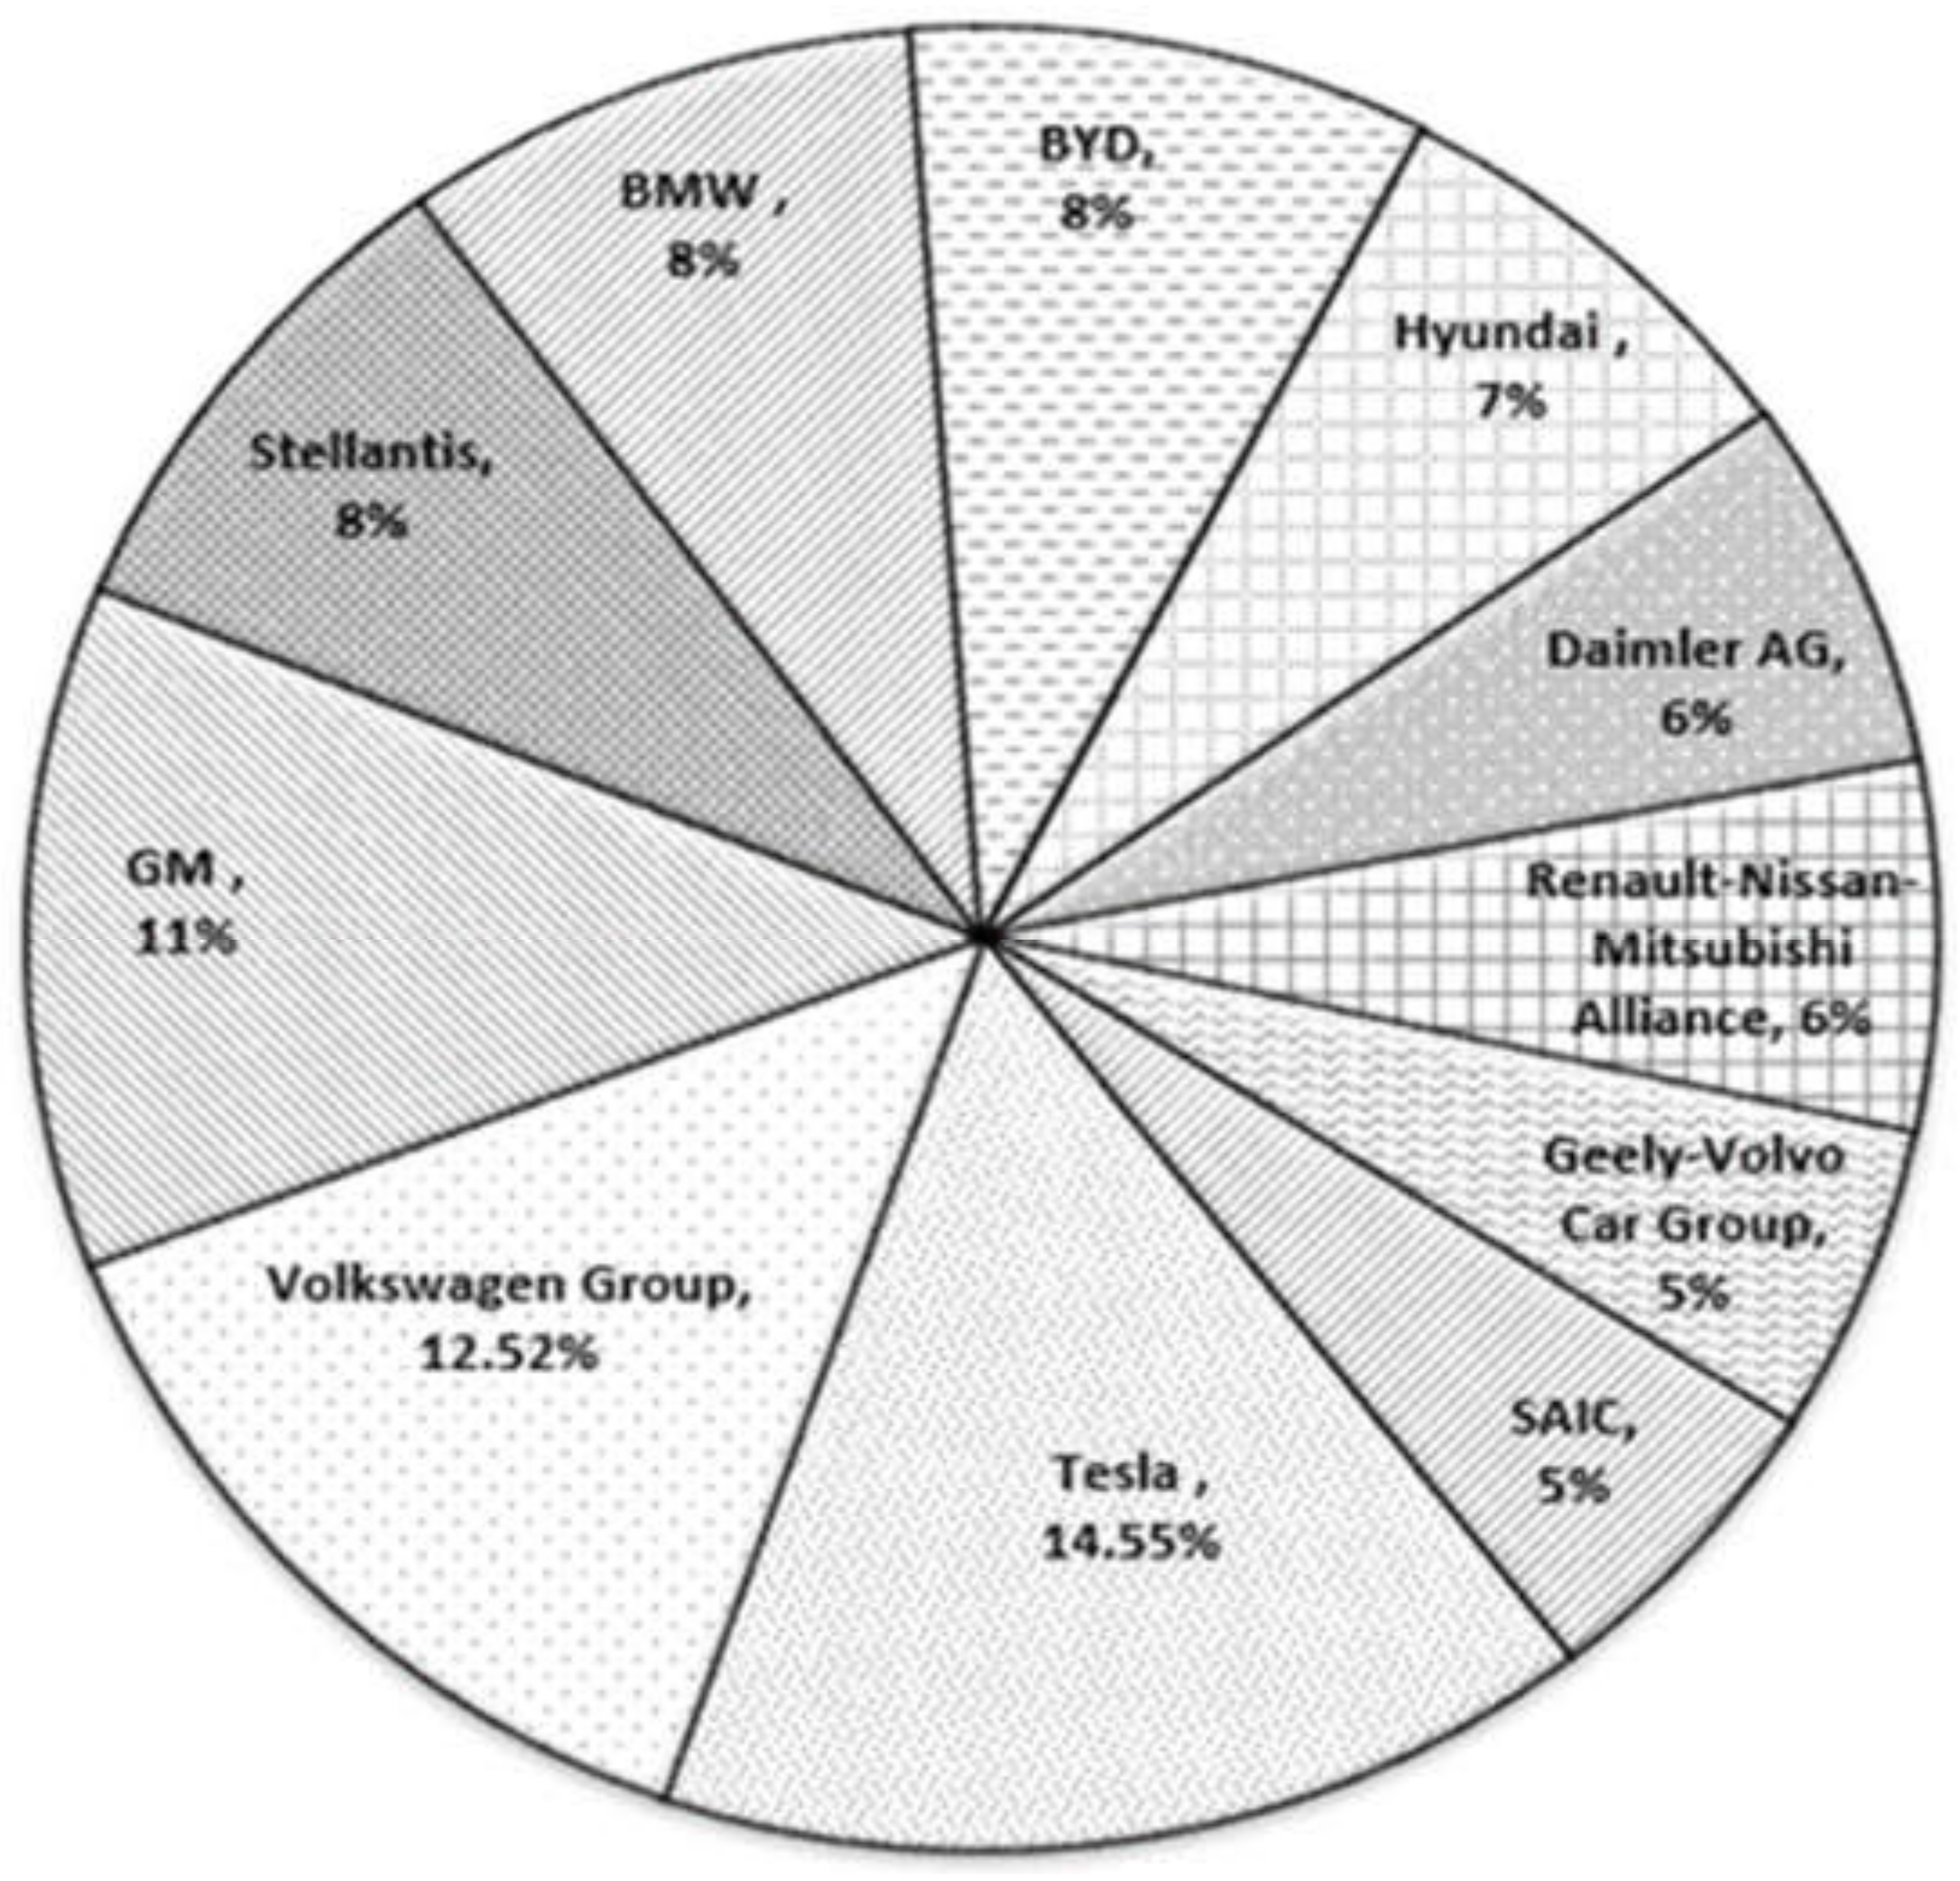
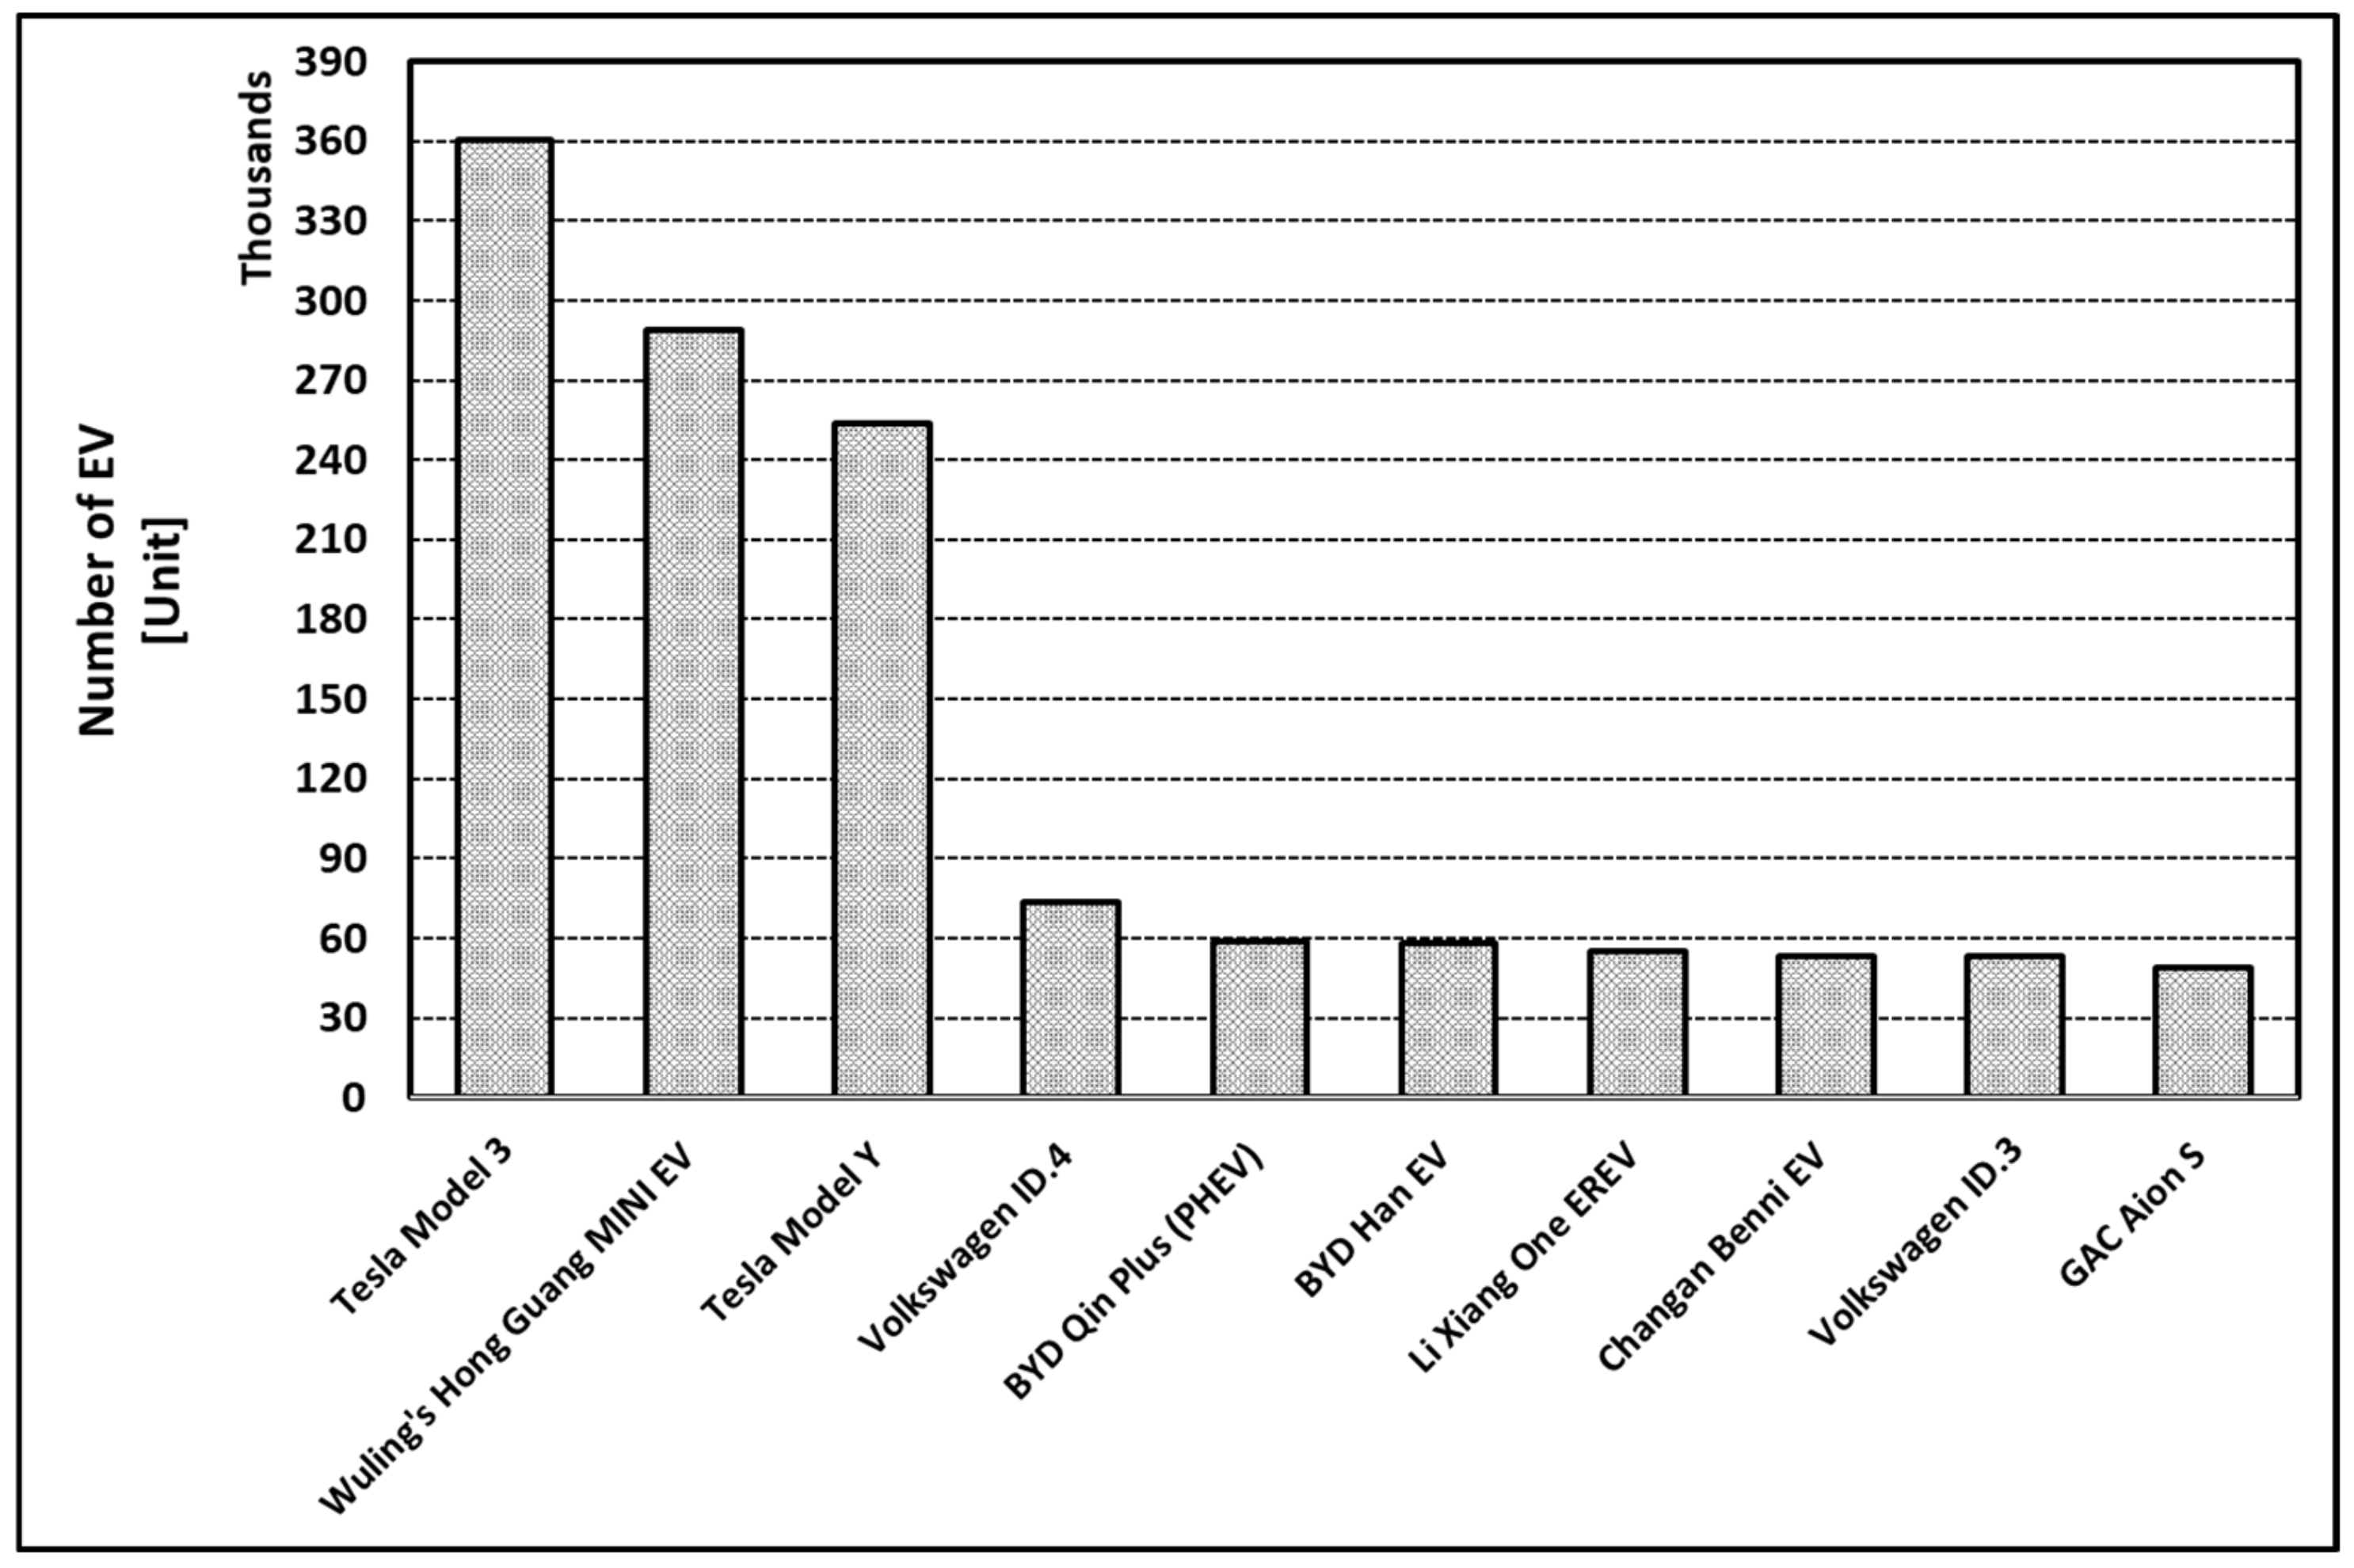
Similarly, the market breakdown by EV manufacturer brands, presented in Figure 6, shows that Tesla’s share of the market is the largest and is projected to maintain its current strong growth. The data presented in Figure 6 were provided by Statista [41], which is a statistic portal. The number of Tesla EVs produced in 2020 was 509,737 cars; however, by the end of 2021, the production was projected to increase to over 627,350 units, of which 228,882 units are of Tesla flagship Model 3/Y and 8941 units of Model S/X [42]. Additionally, in 2021, Tesla’s Model 3 and Model Y were ranked first and third, respectively, in the number of cars sold, as shown in Figure 7. The data presented in Figure 7 were provided by INSIDEEVs [43].
In Europe, Volkswagen Group, which owns Porsche, Bugatti, Skoda, Lamborghini, and SEAT, is also a strong brand with the highest growth in the EV market. The group has made a huge investment in EV manufacturing and, in 2021, increased its share of the world market, ranking second behind Tesla [41]. The group also sold a total of 293,100 units of BEV in Q3 of 2021, increasing its global BEV sales by 138% compared to 2020. The company increased its PHEV sales by 133% and achieved 246,000 unit sales in Q3 2021 [44,45]. The company also has a stated target for half of all car sales to be of BEVs by 2030 and to switch all manufacturing of cars to 100% zero-emission vehicles by 2040 [46,47].
In the US, General Motors (GM) group has a strong investment plan of USD 35 billion for e-mobility, with the aim to introduce 30 new EV models by 2025 [47]. In the first half of 2021, BEVs accounted for 221,000 units of GM’s EV sales. Furthermore, mini-size EVs supplied by SGMW, a joint venture between GM, SAIC Motor Corporation Limited, and Liuzhou Wuling Motors Co Limited, gained market share since its inception in 2002, with total sales of 180,000 EVs in 2021 [34,48].
Nevertheless, the EV market is still in its infancy stage, with many new entrants each year, which will stimulate competition and drive innovation that may lead to new champions emerging in the future.
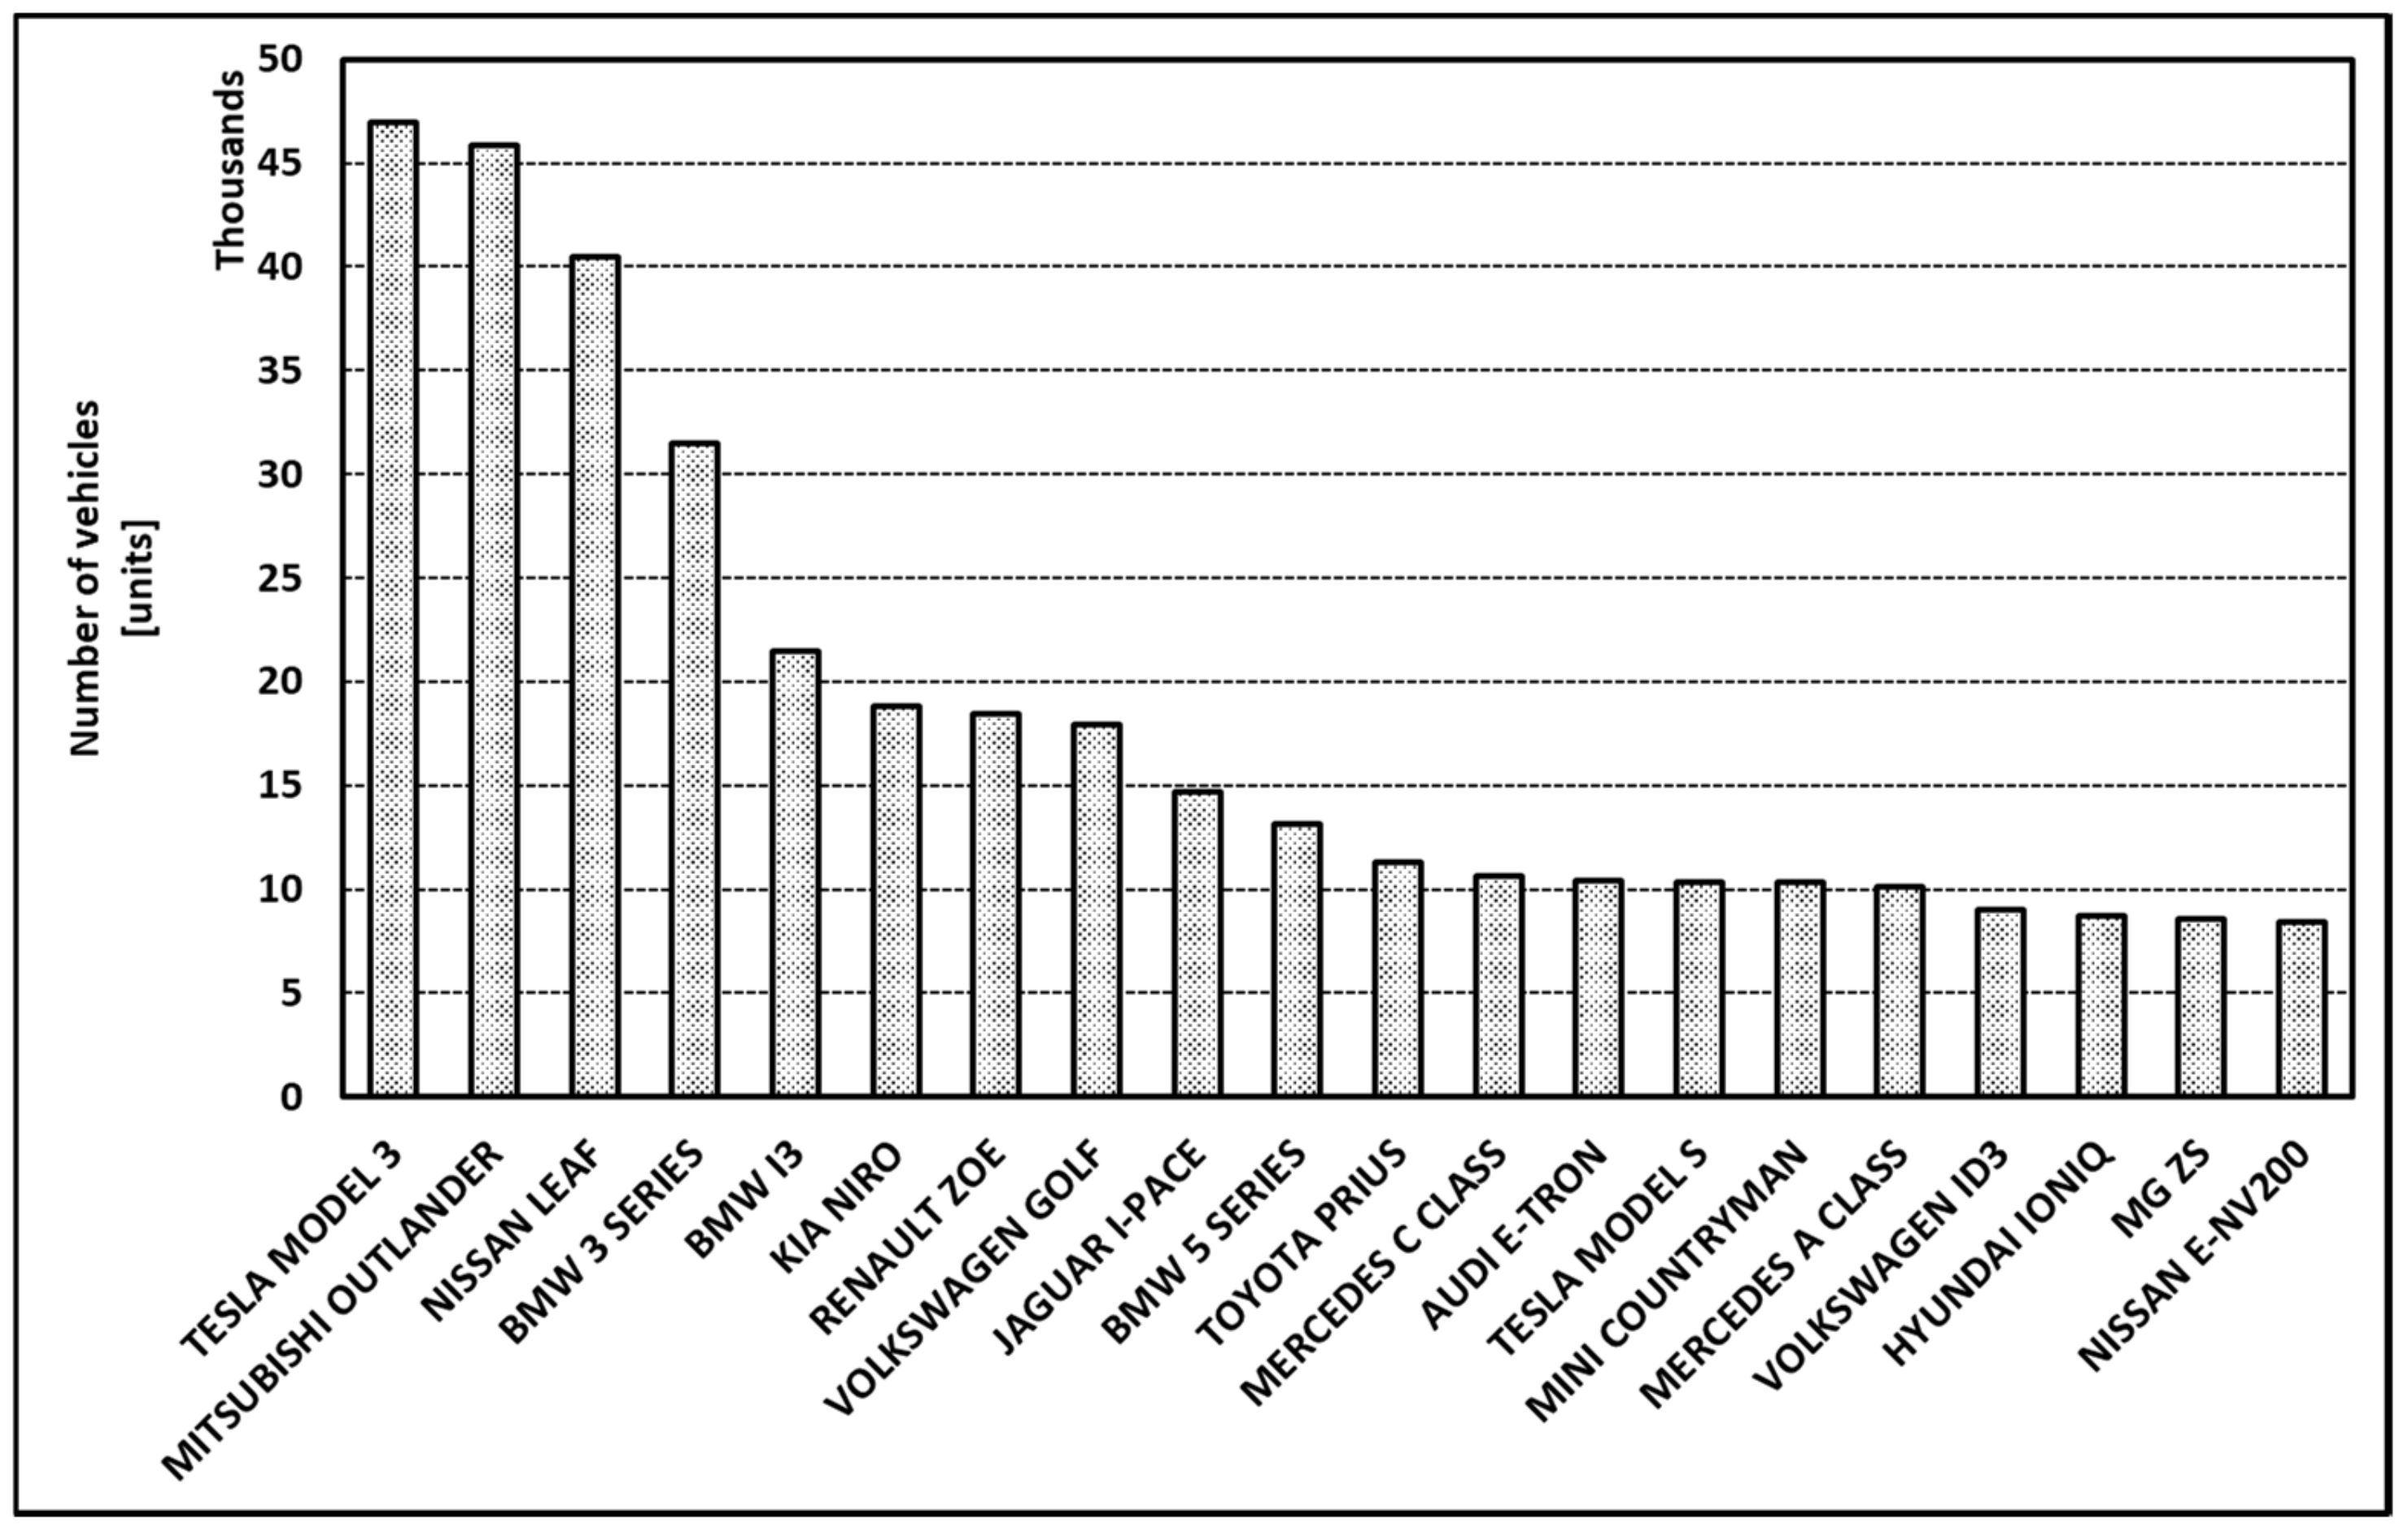
In the UK, according to the Department for Transport (DfT) [49], the number of licensed EVs increased from 8919 in 2010 to 564,694 (295,584 BEV, 246,814 PHEV, and 22,296 others) in Q2 of 2021. The main EV share of the car market is also growing, with all popular EV models being available; the most-sold models are shown in Figure 8. The data presented in Figure 8 were provided by DfT [49]. The EV market in the UK has a strong presence of Japanese brands such as Mitsubishi and Nissan.

4. Potential EV Mass Market Challenges

The high standard of driving experience of current petrol and diesel cars is the expected benchmark for new EVs, including comfort, mileage range, safety, and affordability. Deviation from this expectation may result in the EV market not reaching the planned targets. Therefore, technical development of battery technology for energy density and speed of recharging, refilling infrastructure, and affordable and reliable grid power are some of the challenges to be overcome and to enhance the confidence of the EV market.

4.1. Charging Station Infrastructure

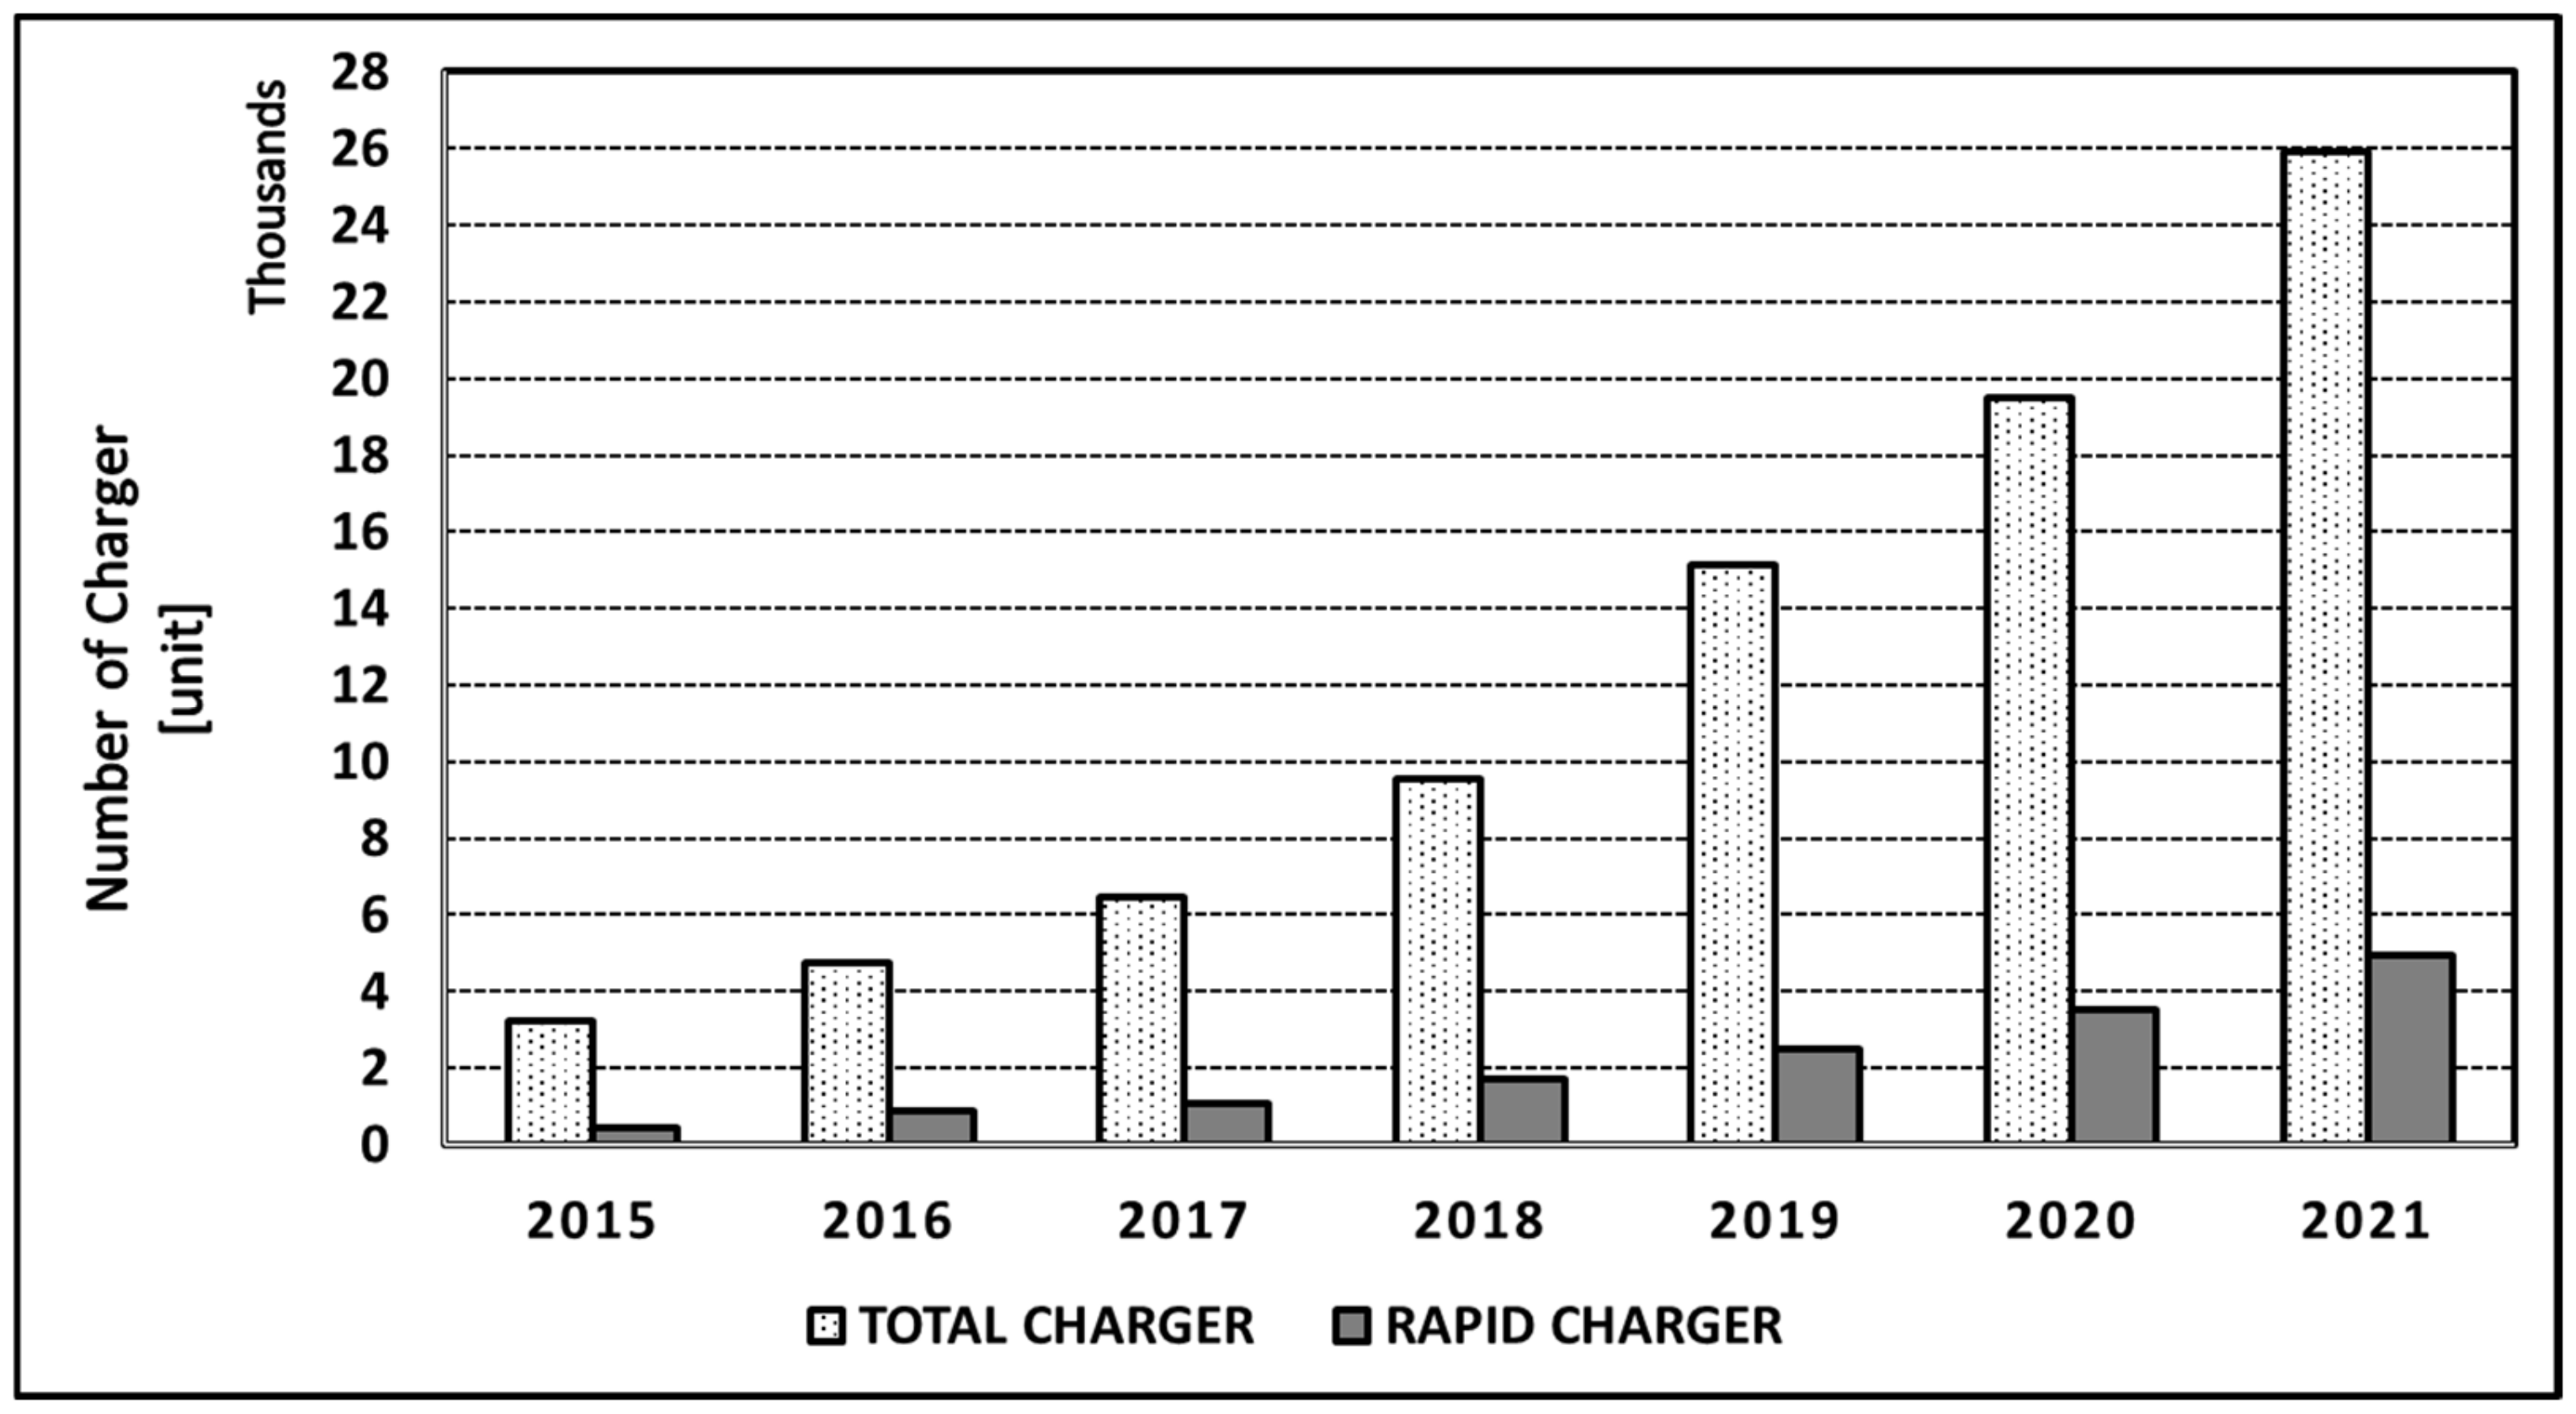
One of the major concerns attributed to EVs is range anxiety, particularly on long journeys where recharging stations may be sparse. Therefore, the number of charging stations must be developed in phase with the increase in EV usage. It is estimated that there were 10.8 million charging stations in the world at the end of 2020, of which 9.5 million were slow chargers installed in homes and workplaces. There is currently a concerted effort in many developed countries to address this concern and make plug-in recharging stations available in public car parks, filling stations, and workplaces [33]. For example, in the UK, the number of public EV plug-in chargers has increased by almost 13 times since 2015, to reach 25,927 charging points distributed throughout the country. In addition, at the end of 2021, one-fifth of these charging installations were rapid-type chargers [50]. Figure 9 shows the increasing trend in the installation of public EV chargers and rapid chargers in the UK over the last seven years. The data presented in Figure 9 were collected from ZAP-MAP [51] by DfT [50].
Furthermore, the EV charger status of some countries is summarised in Table 4. The information presented in Table 4 was adapted from IEA [36].
Compared to the conventional car industry, where major manufacturers use standardised components and parts such as a universal fuel nozzle, the EV industry is still in an early stage of development, and there are currently many manufacturers vying for a share of the market using their own manufacturing standards and component specifications. Therefore, new industry policy frameworks may be sought to encourage collaboration and standardisation of manufacturing processes to minimise component supply bottlenecks. An obvious example is the many types of EV battery chargers (slow, fast, and rapid) and plug-in connectors’ physical configurations that vary between manufacturers and countries.
Currently, there are four main types of plug-in chargers in the UK namely: slow, fast and rapid chargers, in addition to Tesla’s supercharger. As shown in Table 5, the slow charger has a power rating of 3 to 6 kW and is suitable for home or workplace plug-in. The fast chargers are rated between 7 and 22 kW and are installed in public premises such as supermarkets, car parks, and leisure centres. The rapid chargers have a power rating higher than 43 kW and are mainly intended for use in dedicated petrol and service stations for EVs equipped with the rapid charging standard. The chargers are also classified according to the physical configuration of the connector, including a UK standard 3-pin plug, type 1 and 2, Commando, CHAdeMO, and CCS connector depending on the charger type. Although type 1 and type 2 connectors can be used for slow and fast charging, Type 2, CHAdeMO, and CCS connectors are used for rapid charging. In addition, European-based manufacturers such as Audi, BMW, Renault, Mercedes, Volkswagen, and Volvo generally prefer to use type 2 and CCS connectors for the vehicle-side connectors, whereas Asian-based manufacturers such as Nissan and Mitsubishi prefer to use type 1 and CHAdeMO connectors. A different connector configuration is used for the DC rapid charger. As EV manufacturers attempt to gain world market share by offering competitive prices, the differences in charger technologies may start to narrow in a few standard types [52].
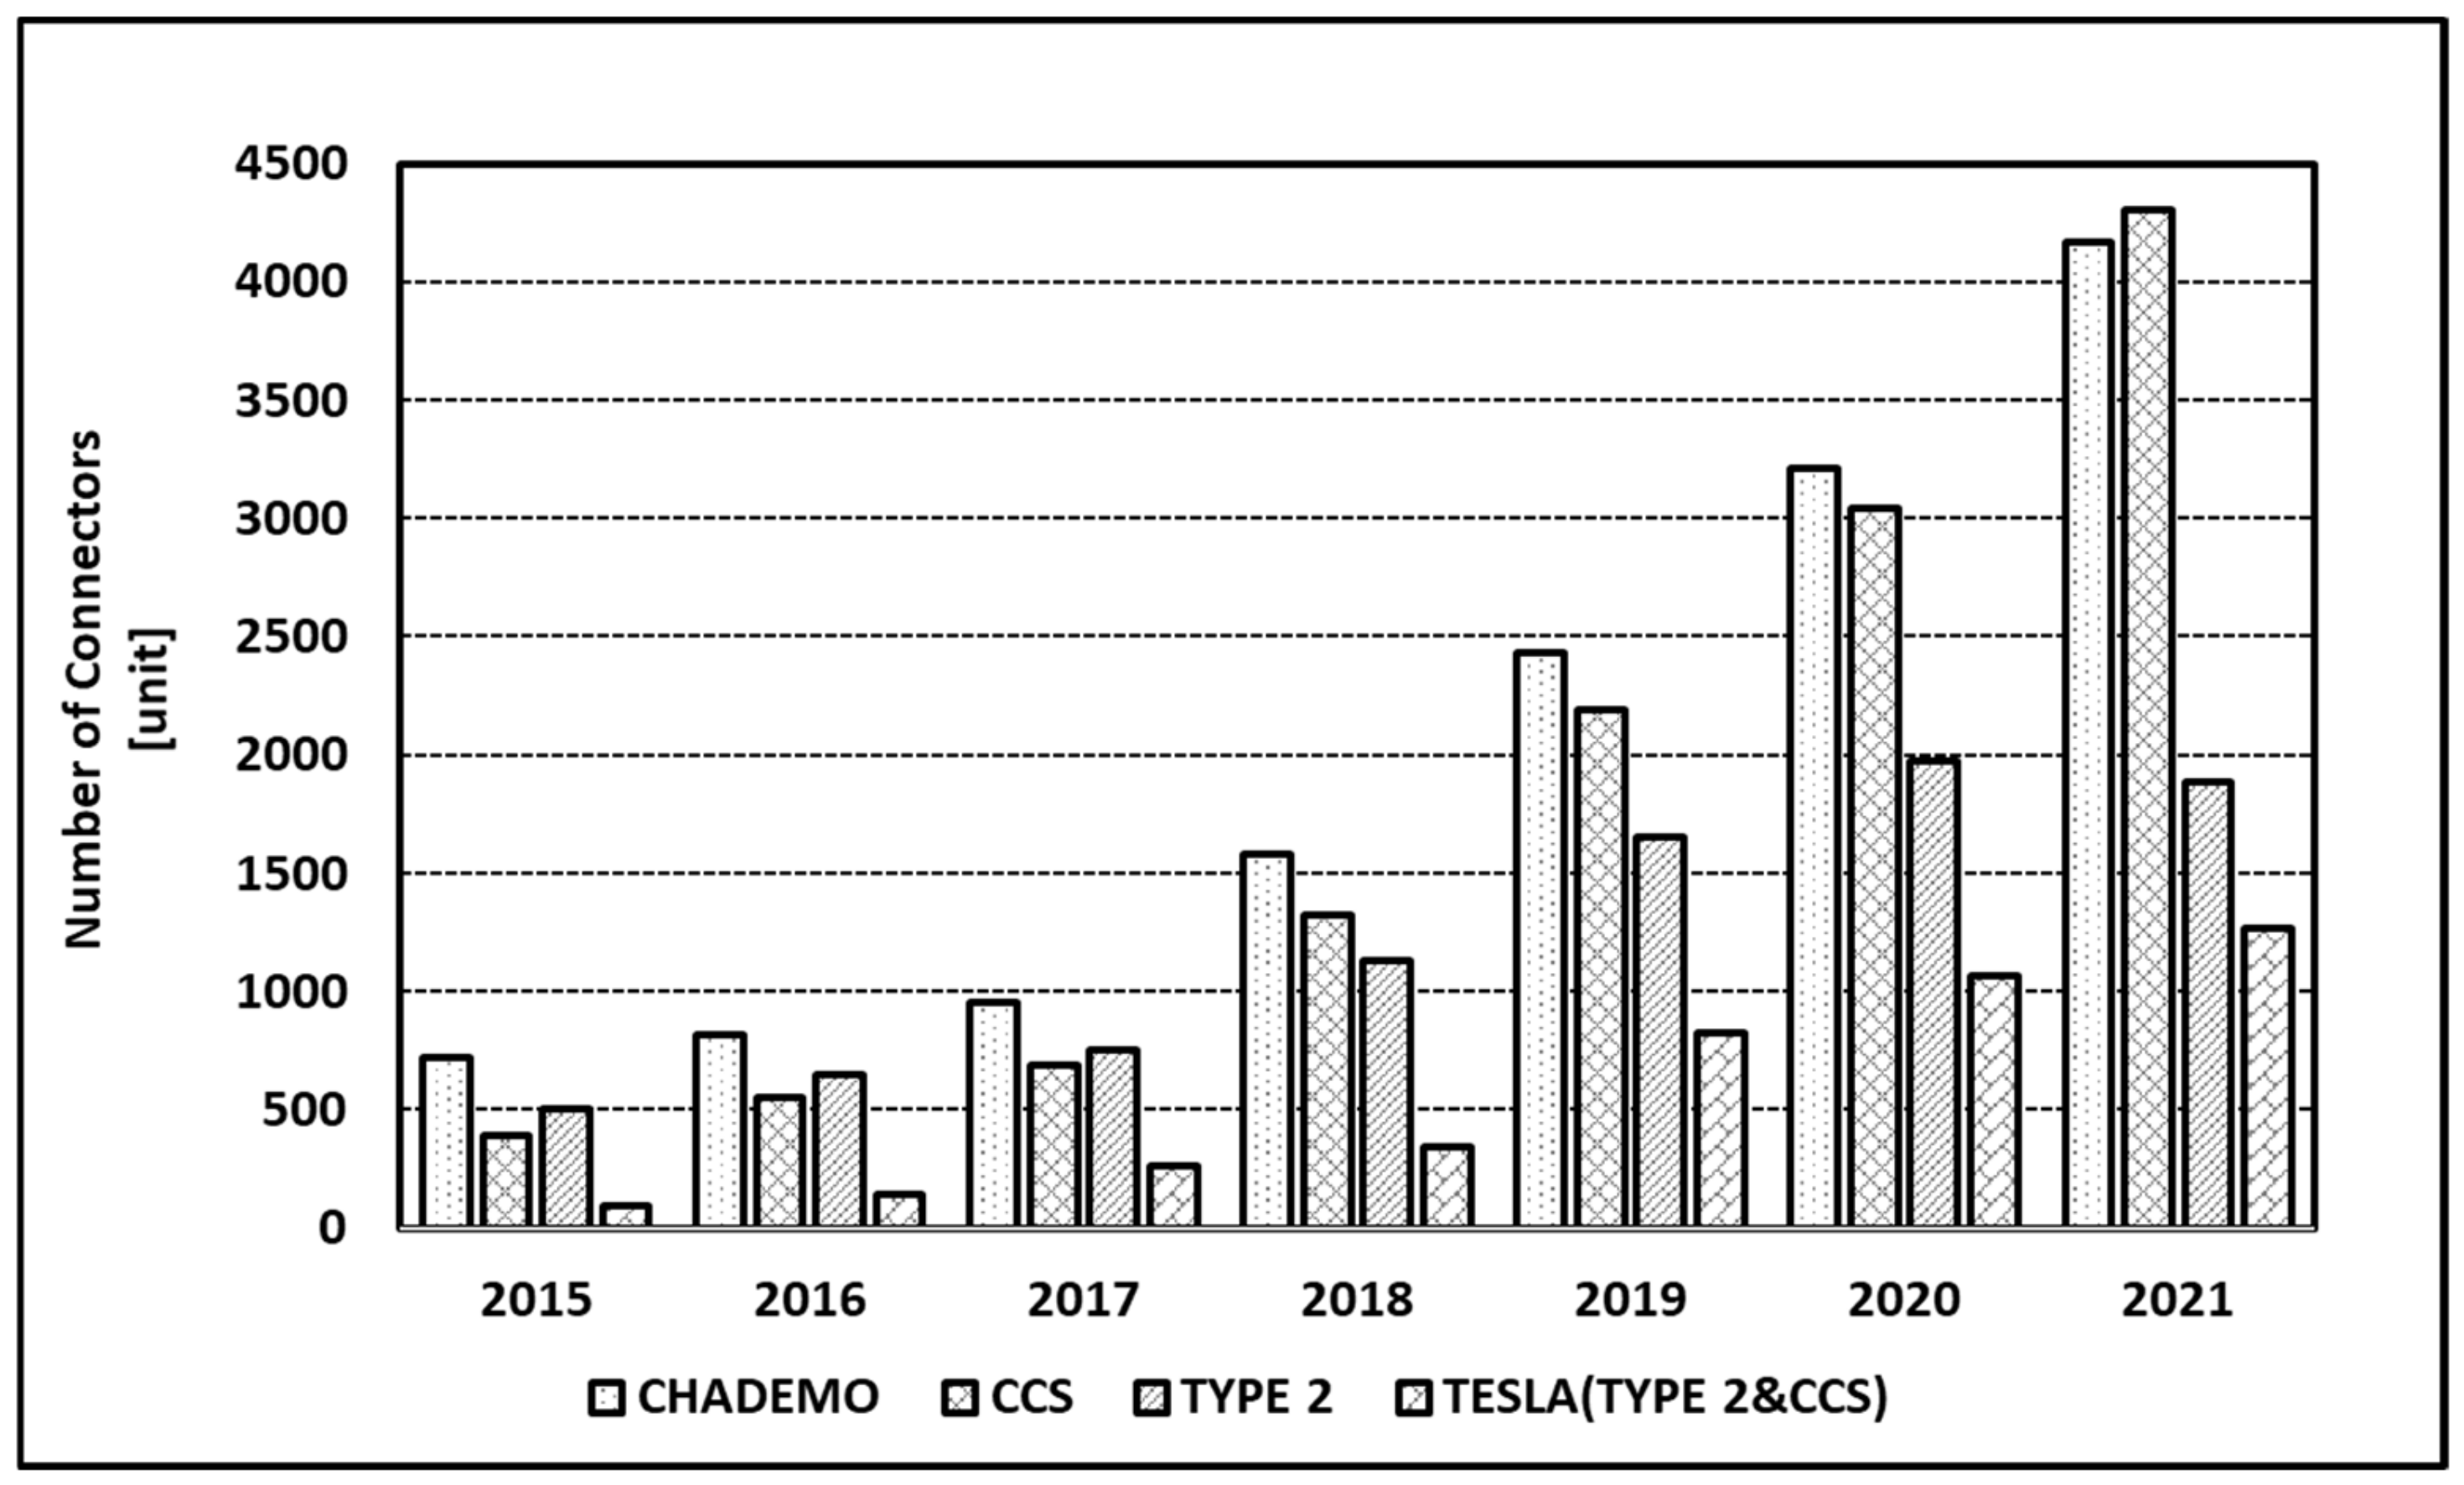
It is also projected that future EV plug-in connectors will be equipped with communication capability to interface between the battery management system, the power grid, and the charging site (home, workplace, etc.) to realise the full potential of V2G, V2B, and V2X technology. In the UK market for fast EV chargers, CHAdeMO and CCS connectors are emerging as the dominant type, due to consistently increasing their market share for the last five years, as shown in Figure 10. The data presented in Figure 10 were provided by Zap-Map [53], which is the EV and charging point platform.
There are several international standards used to determine the power output of an EV charger. Power parameters of plug and socket systems in the UK are fixed with the BS 1363-13 standard. Additionally, BS EN 61851 and BS EN 62196 are the two basic standards used in the UK for charging electric vehicles. BS EN 62196 includes details about plugs and sockets used in EVs, whereas the BS EN 61851 standard covers the parameters associated with EV chargers. According to the BS EN 61851 standard, there are four different charging modes in the UK, Modes 1, 2, 3, and 4 [54]. Because there is no residual current device in Mode 1 charging, it is not allowed to be used in the UK [55].
The British Standards Institution (BSI) [56], the UK National Standards Body, has also published two new standards, namely, PAS 1878 and PAS 1879, in order to support low carbon emission systems in 2021. According to the BSI report, whereas PAS 1878 specifies the criteria required for any energy appliance to work and be produced, such as an energy-smart appliance, PAS 1879 defines the rules of the demand-side response service for electricity consumers and supports the operation of smart energy devices. It is likely that these two standards will be used in the application of smart EV charging stations in the future.

4.2. Recharging Time

Compared to conventional vehicles where refuelling is a quick process, the best EV battery charging technology is still slow. For example, the slow charger used in individual homes or workplaces takes up to 10 h to fully charge an EV battery. The fast and rapid chargers rated between 7 and 43 kW that are found at public sites, such as supermarkets, car parks, and leisure areas, can achieve full charging in a time scale as short as one hour, whereas rapid chargers having a power rating higher than 43 kW can fully recharge an EV’s battery in less than 60 min. The rapid battery charger is becoming commonplace; however, the technology remains expensive and is not suitable for all EVs or all sites.
A research study by Zhao et al. [57] found the utilisation of rapid charging, performed by increasing the charging current and voltage, carries a higher risk of fire and the authors suggested that the battery needs to be well insulated.

4.3. EVs Battery Development and Driving Rang

Another main challenge facing mass marketing of EVs is the limited driving range of EVs, which is associated particularly with the low energy density of EV batteries. Furthermore, the battery pack requires a sophisticated electronic management system and constitutes a large part of the overall EV’s cost. Today, significant research programmes are being implemented by the industry and academics to develop new materials to increase battery energy density and lower the cost.
In an effort to enhance energy storage density, three main battery technology candidates are being used namely: Li-ion, lead-acid, and nickel-metal hydride (NiMH) batteries. Today, Li-ion batteries, which entered the market in the early 1990s, have the largest market share due to their high efficiency and energy density, fast charge capability, and long service life. However, the drawback of Li-ion batteries is the high cost of Li ore, making long term commercial prospects unsustainable [58,59]. This has led many researchers to consider introducing novel designs, such as replacing graphite electrodes with a cheap silicon material to increase Li-ion batteries’ energy density, decrease charging time, and reduce degradation [60,61,62]. For example, Wang et al. [60] observed that replacing the anode of a Li-ion battery with silicon can increase the energy density and lifespan of the battery.
In comparison, lead-acid batteries were introduced in the 1960s and achieved huge success due to their simplicity, low cost, and recyclability. Today, they are preferred for applications in HEVs and large-scale power storage schemes due to their high efficiency (80–90%) and average service life of around 1500 cycles [63].
NiMH batteries are also relatively new (first commercialised in 1991). They have higher energy density than lead-acid battery counterparts, but they are also more expensive [64]. They have been used in EVs by manufacturers such as General Motors, Honda, and Ford.
To understand the patterns of daily driving behaviour of road users, the Joint Research Centre (JRC) conducted a survey study [65] in which about 1000 vehicle owners, in 28 European countries, participated. It was found that the duration of the most frequent journeys of the participants was 39 min, whereas the average journey was 25 km (15.5 m) per day. A similar study conducted in the US in 2016 by the National Renewable Energy Laboratory (NREL) [66] found that, for an average American shopper, an EV having a range of 300 m is appropriate. Furthermore, the UK DfT [20] recommended in 2019 that the average annual mileage consumption of UK’s car owners is about 7400 m per vehicle, i.e., about 20 m per day per vehicle.
These studies demonstrate that current BEVs are capable of achieving a range of over 200 m. A literature review shows that the average range of the BEV models has increased [33]. Table 6 shows some BEVs with a high range. The data presented in Table 6 were provided by EV Database [67].
Available data from current BEVs manufacturers also suggest that battery capacity is appropriate for the average daily driving range. Additionally, the performance of EVs is increasing consistently with the ever-increasing range, as can be seen in Figure 11. The data presented in Figure 11 were provided by IEA [36]. However, charging station infrastructure and rapid charging issues still need to be addressed to eliminate long-distance trip challenges.

4.4. Cost and Affordability

The current cost of EVs is higher than equivalent petrol or diesel cars but, as the market expands, the manufacturing cost will decrease through standardisation of processes and rationalisation of components supply chains. However, a significant part of the reduction in the cost of an EV will still depend on the availability of valuable metals used in battery and other components manufacturing. These critical metals include misch metal alloys used in NiMH batteries, lithium and cobalt in Li-ion batteries, platinum in the fuel cell, and neodymium and dysprosium used in permanent magnet electric motors [68]. For instance, a light vehicle with a battery capacity of 30–45 kWh requires up to 80 kg of lithium in the manufacturing of the battery [69]. As a result of the increase in the share of Li-ion batteries in the EV market, it is projected that world demand for lithium will increase from 65 kilotons (kt) in 2000 to 530 kt by 2025 [70]. It is also a fact that some of these critical rare earth metals are mined unsustainably and from limited sites in unstable regions of the world. Therefore, developing efficient recycling and recovery processes for these materials may contribute to reducing EV costs.

4.5. Manufacturing and Recycling

Although the impact of EVs in reducing operational carbon emissions cannot be ignored, it is necessary to examine the carbon emissions caused by their charging needs and the life-cycle emissions of EVs to take a broader perspective.
It can be said that the source of electric energy that EVs use as fuel can change the effect of EVs on the reduction in carbon emissions. Today, EVs generally use grid systems for their charging needs if no external source is used. Because the energy sources used in electricity generation vary, the carbon footprint of the grid system may differ according to energy policies, geographical locations, and even time of the day. For example, in Estonia, which uses a large amount of coal for electricity generation, the GHG emission rate from electricity generation is 831 gCO2e/kWh in 2019, whereas this rate is only 19 gCO2e/kWh in Norway because of their high-RES usage rate [71,72]. Therefore, the quantity of GHG emissions released into the atmosphere to charge an EV in Estonia is much higher than that in Norway. A study conducted by Hoehne and Chester [73] showed that late-night EV charging causes more GHG emissions because energy sources used to meet peak time demands during the day in the US contain less CO 2 . Similarly, Lin and Wu [74] stated that increasing EV demand in China may increase coal-based electricity generation and therefore carbon emissions. However, the researchers added that 2348 million tons of carbon emissions could be avoided by 2040 if low carbon scenarios with a high usage share of RESs can be realized. As a result, considering the future EV predictions, it is vital to meet the charging needs with low-carbon energy sources. On the contrary, e-mobility, which increases with the aim of reducing emissions, may accidentally increase carbon rates in the atmosphere.
In order to produce a vehicle in the automobile manufacturing industry, many processes are carried out from the mining to the assembly of vehicle parts, and a large amount of energy is used for these processes. Sato and Nakata [75] detailed all the materials used to produce an ICE vehicle and calculated that 62 GJ of energy is required to produce a Honda Accord. The research also showed that 28% of the electricity in the production phase is used for alumina reduction processes. Similar to ICE vehicles, the EV manufacturing industry includes high energy-consuming processes, such as mining and assembly processes for the EVs and their components, such as batteries and motors. Although this situation varies depending on the variety of energy sources used, under the global average electricity production rates, EVs may cause higher manufacturing emissions than conventional ICE vehicles due to high energy consumption in battery production processes [76,77]. Kurland [78], for instance, noted that the use of electrical energy is between 50 and 65 kWh per kWh battery in a Li-ion battery cell production facility. However, in this study, the electrical energy required for mining processes was not taken into account. In addition, Cox et al. [77] showed that high-capacity batteries cause 40% more life cycle emissions compared to low-capacity batteries. However, a study by Hall and Lutsey [79] emphasised that this high emission in EV manufacturing can be reduced within 2 years compared to operational emissions of ICE vehicles. To compare the energy used in the production of EVs and ICE vehicles, and the GHG emissions generated, in another study, Bieker [80] conducted a life-cycle assessment. The researcher claimed that producing a BEV battery with a capacity of 45 kWh in Europe may result in 2.7 tCO2e of GHG emissions, and the production of a Li-ion battery with an NMC811-graphite cathode would cause 20% less GHG emissions by 2030. Another notable result of the study is that the life cycle emissions of BEVs cause 63–69% less GHG emissions compared to petroleum vehicles. The research would have been more interesting if a wider range of battery GHG emissions were examined by exploring the recycling and reuse of batteries for other purposes.
Along with the increasing number of EVs, used batteries may become an environmental waste problem due to hazardous chemicals within them. According to the sustainable development scenarios of the IEA [81], it is supposed that the Li-ion battery capacity spent by EVs will reach 10.1 GWh in 2025 and 1089.6 GWh in 2040. Therefore, waste management mechanisms, such as the recycling of end-of-life batteries, should be encouraged and regulated. More importantly, if these battery wastes can be recycled and reused, they can become an important opportunity due to the precious metals they contain, such as lithium (Li), nickel (Ni), and cobalt (Co). It is known that the demand for Li-ion batteries is also increasing with the increasing number of EVs. IHS Markit [82] declared that estimates show that 9300 kt of Li, 9800 kt of Co and 55,000 kt of Ni metal will be needed to meet the demand of Li-ion batteries between 2020 and 2050. Moreover, they claimed that if suitable recycling mechanisms can be established, the required 48% of Li, 47% of Ni, and 60% of Co metals may be able to be met by recycling. However, the current global raw material recycling rate is just 1301 kt/year [82]. Many techniques, such as pyrometallurgical (smelting), hydrometallurgical (leaching) and direct recycling approaches, have been introduced to recycle Li-ion batteries; however, a comprehensive technique that can recycle all battery types has not been discovered yet [83]. Although it is seen that battery recycling is a promising opportunity to recover precious metals and, therefore, a reduction in GHG emissions, their use remains limited due to some challenges. One of the biggest challenges of the recycling industry is the problem of cost. A recycling facility involves high investment costs and can only be economical with high-capacity batteries or large quantities of batteries arriving at the facility [84]. Gaines et al. [83] noted that it is not easy to remove batteries from vehicles, and discussed the difficulties of collecting the spent EV batteries from EV owners. They underlined that transportation of the collected batteries to the facility where the recycling process will be carried out can cause serious costs. The researchers also emphasized that there are possible flaming and fire risks due to the occurrence of chemical reactions during the transportation of Li-ion batteries, which have high energy potential. Interestingly, the study claimed that the legal regulations created to prevent these dangers may play a role in increasing transportation costs. The study also indicated that metals and fluorides that are harmful to health may be released during the melting of the batteries in the facility, which makes the recycling processes dangerous. In summary, the recycling technology of batteries is in an early stage and, therefore, further technical, economic, and logistical studies are required to gain additional understanding about recovering precious metals from EV batteries.

5. Impact of EVs Uptake on Power Grid Capacity

One of the key energy performance indicators of an EV is electrical energy consumption per mile driven (mile/kWh). This efficiency indicator, coupled with the growing number of EVs on the market, will have a significant impact on the power grid to satisfy the additional load from EV demand. Globally, according to BNEF’s EV outlook of 2021 [31], a fully decarbonised transport industry could add about 8500 TWh of electricity consumption by 2050, which is 25% greater than the baseline case. Adding such a demand on the grid without developing adequate energy management mechanisms can lead to overloading of the grid and reduce the reliability and quality of the power supply.
To date, few studies have examined the implication of the increase in EV numbers on the grid system [85,86,87,88,89,90,91]. A study conducted by Papadopoulos et al. [92] examined how charging EVs may affect the grid power demand profile in the UK by 2030. The study shows that, compared to the baseline scenario of no EVs, the high uptake of EVs will double power demand from the grid at the evening peak demand, throughout the year. A peak demand of up to 100 GW is expected in winter. However, if decarbonisation of heat in domestic buildings progresses at planned using heat pumps, additional strain will be placed on the national grid, with peak demand for heat also coinciding with the evening peak demand for electricity. However, increasing the peak load is an undesirable situation for the grid because it requires relatively high energy in a short time, and may incur further costs due to loss of load and power quality [93]. Therefore, in order to deal with this challenge, a flexible grid with a large and fast-response reserve capacity may be required.
A study by Clement et al. [85] investigated the impact of controlled and uncontrolled EV battery charging on the grid power quality and losses under different market uptake levels. It was found that grid voltage supply may deviate by more than the maximum accepted norm of 10%, and Distribution Network Operators (DNOs) may resort to increasing electricity tariffs to compensate for any additional power loss. Two notable studies on the impact of EVs on the UK grid showed that grid power demand will increase. One of these studies was carried out by Mu et al. [88], who investigated large scale penetration of EVs using a spatial-temporal model to assess the load of EVs on branches in a distribution network under a 50% penetration scenario. The study found the use of an uncontrolled charge and smart charge increases the peak load by 74% and 47%, respectively. The other study was conducted by Qian et al. [89], who adopted a stochastic approach and found that 20% EV penetration would increase the grid peak load by 35.8% under the uncontrolled charging scenario.

6. Potential Solutions of EVs’ Uptake|Vehicle-to-Grid (V2G) Energy Carrier

6.1. V2G Concept

The energy management of additional power demand on national grids using EVs presents another challenge in the decarbonisation agenda of the transport sector. A report published by the UK National Grid company [94] in 2021 entitled ‘Future Energy Scenarios’ projected that energy consumption for transportation will decrease to 139 TWh by 2050 from the 2020 level of 400 GWh. In addition, it estimates that a load of 38 GW can be managed through peak shaving with the use of EVs and smart charging. This report demonstrates that, as the number of EVs plugged into the grid increases, coupled with advancement in battery technology and smart management systems, EVs will form an integral part of future smart grids. The concept of using EVs to recharge when RE generation is high and discharge when peak demand is high was proposed by Kempton and Letendre [17] in 1997. A study by Toniato et al. [95] aimed to model the reduction in the peak load demand for charging a fleet of 138 V2G-enabled e-busses at a depot. First, the daily use of the 138 diesel buses was examined and, under the uncontrolled charging scenario, the optimization algorithm showed the average peak load was 7959 kW and occurred between 7 and 8 p.m., whereas, by using V2G technology, the peak load can be reduced by as much as 83%. The feasibility of V2G was also demonstrated by Fathabadi [96] using 15 EV chargers equipped with V2G technology and fed during off-peak hours from wind-generated power and discharged back to the grid during peak hours to balance supply and demand of electricity.
A basic schematic outline of this interaction of charging and discharging EVs with the grid, otherwise known as V2G, is shown in Figure 12.
Furthermore, V2G technology can be used for ancillary services such as energy arbitrage, peak load shaving, spinning reserve, regulation, and RE support, providing benefits to grids, EV manufacturers, EV customers, energy suppliers, network operators etc.

6.2. Financial Revenue Incentives of V2G

The prospective dual usage of EVs for transportation and electrical power storage services for the grid (V2G) makes the EV a potential source of income for the owner. Most of the studies on the feasibility of V2G were conducted in the past two decades and focused particularly on the US energy market. In assessing the potential monetary benefit of V2G, Kempton and Tomic [97] suggested that the use of EVs for transportation needs accounts for only about 4% of the daytime, whereas the remaining 96% of the time could potentially be used to earn income by providing a grid service. The authors developed a mathematical model in which they considered parameters such as peak power demand, spinning reserve, baseload power demand, and regulation services, and found that, under ideal scenario conditions, EV owners could annually earn about USD 4900 using V2G in the United States of America (USA). With a similar optimistic conclusion, Noori et al. [98] constructed a model in which payments and regulation uncertainty and battery degradation were among the considered parameters. The study found, with V2G services, annual gains of approximately USD 2600 in the USA. Similarly, Ginigeme and Wang [99] developed a charge control algorithm to integrate EVs with V2G into the grid using a real-time pricing model. It was established that, with the proposed strategy, the annual revenue per vehicle from the V2G was around USD 550. In a less optimistic study, Peterson et al. [100], found that the annual revenue of EVs in three different regions of the USA from energy arbitrage with V2G can be USD 140–250 (under best conditions) and a mere USD 6–72 under a more realistic scenario. In another study, the authors developed an algorithm for charging/discharging EVs equipped with V2G and showed that charging costs can be reduced by 13.6% for a fleet of 5000 EVs [101].
The EV users’ willingness to adopt V2G under contract to provide grid services was studied by Hidrue and Parsons [102] in a survey of 3029 participants. It was found that the participants were concerned about range anxiety, freedom restrictions with V2G contract, and battery replacement cost.

6.3. Effects of V2G on the EV Batteries’ Longivity

The number of charge/discharge cycles of a Li-ion battery ranges between 500 and 3000 cycles [103]. However, the lifespan of the batteries may not only be related to a single phenomenon, as the life cycle of batteries can be affected by factors such as depth of discharge (DoD) level, temperature, and charging power parameters [104,105]. It is often noted that V2G rapidly reduces the EV battery life span, as it charges and discharges the batteries many times during the day. Conversely, because EVs that provide a regulation service, unlike deep charging/discharging, operate within a small fraction of the battery capacity, the wear effect of the daily driving of the vehicles may be much higher than the V2G effect [98]. Similarly, a broader perspective was adopted by Peterson et al. [106], who argued that battery degradation caused by daily transportation may have double the impact compared to V2G usage for load shifting in PHEVs. However, studies in the literature also state that the degradation effect of V2G cannot be ignored. For example, Bishop et al. [107], examining the corrosive effects of V2G on PHEV and BEV batteries, observed that, even in the best scenarios, the V2G service may lead to multiple battery changes over the lifetime of the vehicle. Although the study analysed the degradation by considering different battery capacities, charge regimes, and DoD levels, and presented remarkable findings, this research would have been more convincing if it had included the cost analysis of the degradation.
Furthermore, some studies in the literature focus on the use of V2G with control algorithms. Guo et al. [108] used various charging regimes and V2G technology to assess battery degradation in EVs. In the study, which mainly focused on capacity losses in Li-ion batteries, a charge management strategy was proposed to reduce degradation. Researchers argued that using the proposed charging strategy can reduce degradation by 13.51% and increase the battery life of EVs. With a similar result, Uddin et al. [109] developed a comprehensive battery aging model using data from degradation experiments to assess the degradation caused by energy arbitrage in EV batteries with V2G. As a result, the researchers claimed that using V2G with the proposed strategy can reduce the capacity fade in Li-ion batteries by 9.1% and power fade by 12.1%. However, the ambient temperature value accepted as constant in the study will likely affect the results. This may be because Zhou et al. [110] found that there is a causal relationship between ambient temperature, DoD, and battery degradation. They concluded that rising temperature and growing DoD values can simultaneously increase the degradation effect on the EV batteries.

6.4. Effects of V2G on the Environment

According to the 2020 IEA Report, transportation accounted for 24% of the carbon emissions created by burning fuel [14]. In the UK, transportation is responsible for 29.8% of CO 2 emissions occurring within the country [111]. Because EVs use electricity as a fuel, unlike vehicles with ICE, it is predicted that they will play an effective role in reducing CO 2 emissions from transportation [30,73]. Additionally, EVs also seem to be capable of preventing NO x and SO x gas emissions, which are harmful to the environment and human body because they do not lead to exhaust gas emissions [112]. As previously noted, it is possible that EVs, which will reach large numbers in the future, may cause significant environmental problems when charging with high carbon emission networks. To avoid this problem, the main principle should be that countries utilise more RESs in their energy generation policies and that they encourage EV owners to use a controlled charging strategy such as V2G.
Turton and Moura [113] examined the benefits of V2G technology until 2100 and examined its effects under some energy scenarios. Although the researchers hypothesized that V2G would have serious positive environmental impacts under a USD   135 / tCO 2 e carbon tax scenario, they concluded that in 2100, even under existing scenarios, V2G could reduce CO 2 emissions by 6.5%. In addition, a recent study by Jiao et al. [114] found that V2G contracts offered to EV owners in the future may also have a role in reducing carbon emissions. This study effectively illustrates that V2G contracts may be important with regard to environmental issues in the future. Therefore, further studies should be carried out to establish more environmentally friendly V2G contracts.
Several attempts have been made to emphasize that the use of V2G system for various purposes, such as regulation, reserves, and demand and supply balancing, can reduce carbon emissions [115,116]. Zhao et al. [117] published a paper in which they analysed the environmental effects of using V2G-capable electric trucks for the regulation service on the grid. The researchers examined five independent system operator regions, and pointed out that an electric truck serving the grid for this purpose can prevent CO2 emissions of between 200 and 500 tCO2 over its lifetime (15 years). Similarly, regulation services through light-duty V2G-capable EVs formed the central focus of a study by Noori et al. [98], in which the author found that, in a region where the majority of vehicles on the roads are expected to be EVs by 2030, regional emissions savings of up to 500,000 tCO2 per year will be achieved. Another study by Sioshansi and Denholm [118] highlighted the environmental effects of providing a spinning reserve service with PHEVs with V2G. Unlike in other studies, the researchers analysed CO2 emissions and other harmful pollutants such as SO2 and NOx. The results suggest that adjusting the charging times of vehicles according to the availability of generators with high energy efficiency will result in a significant reduction in emissions from energy generation. A remarkable finding of the study is that replacing 1% of an EV fleet with EVs offering V2G service can reduce generator CO2 emissions by 25%. Furthermore, the authors reported that reductions in CO2 and NOx emissions are less than those in SOx in the process of V2G usage for the spinning reserve service because this service is usually provided with natural gas sources containing a small amount of sulphur. Hoehne and Chester [73], who investigated the environmental effects of providing a demand and supply balance in the grid by using the batteries of PHEVs with V2G, revealed that the designed smart charging strategy has the potential to reduce carbon emissions by 59% in V2G mode usage, and compared time-adjusted charging strategies (charging in only certain hours). The most striking result to emerge from the study is that the use of V2G may also increase CO2 emissions in the scenarios. The researchers observed that carbon emissions were increased by 369 gCO2/mile when EVs were charged for V2G use after 12 p.m. in the Midwest region of the USA. The result is linked to the electricity generation profile of the region after 12 p.m. The finding clearly indicates the necessity of considering V2G technology and RESs together so that V2G does not become a technology that increases CO2 emissions.

6.5. Integration of RESs via V2G

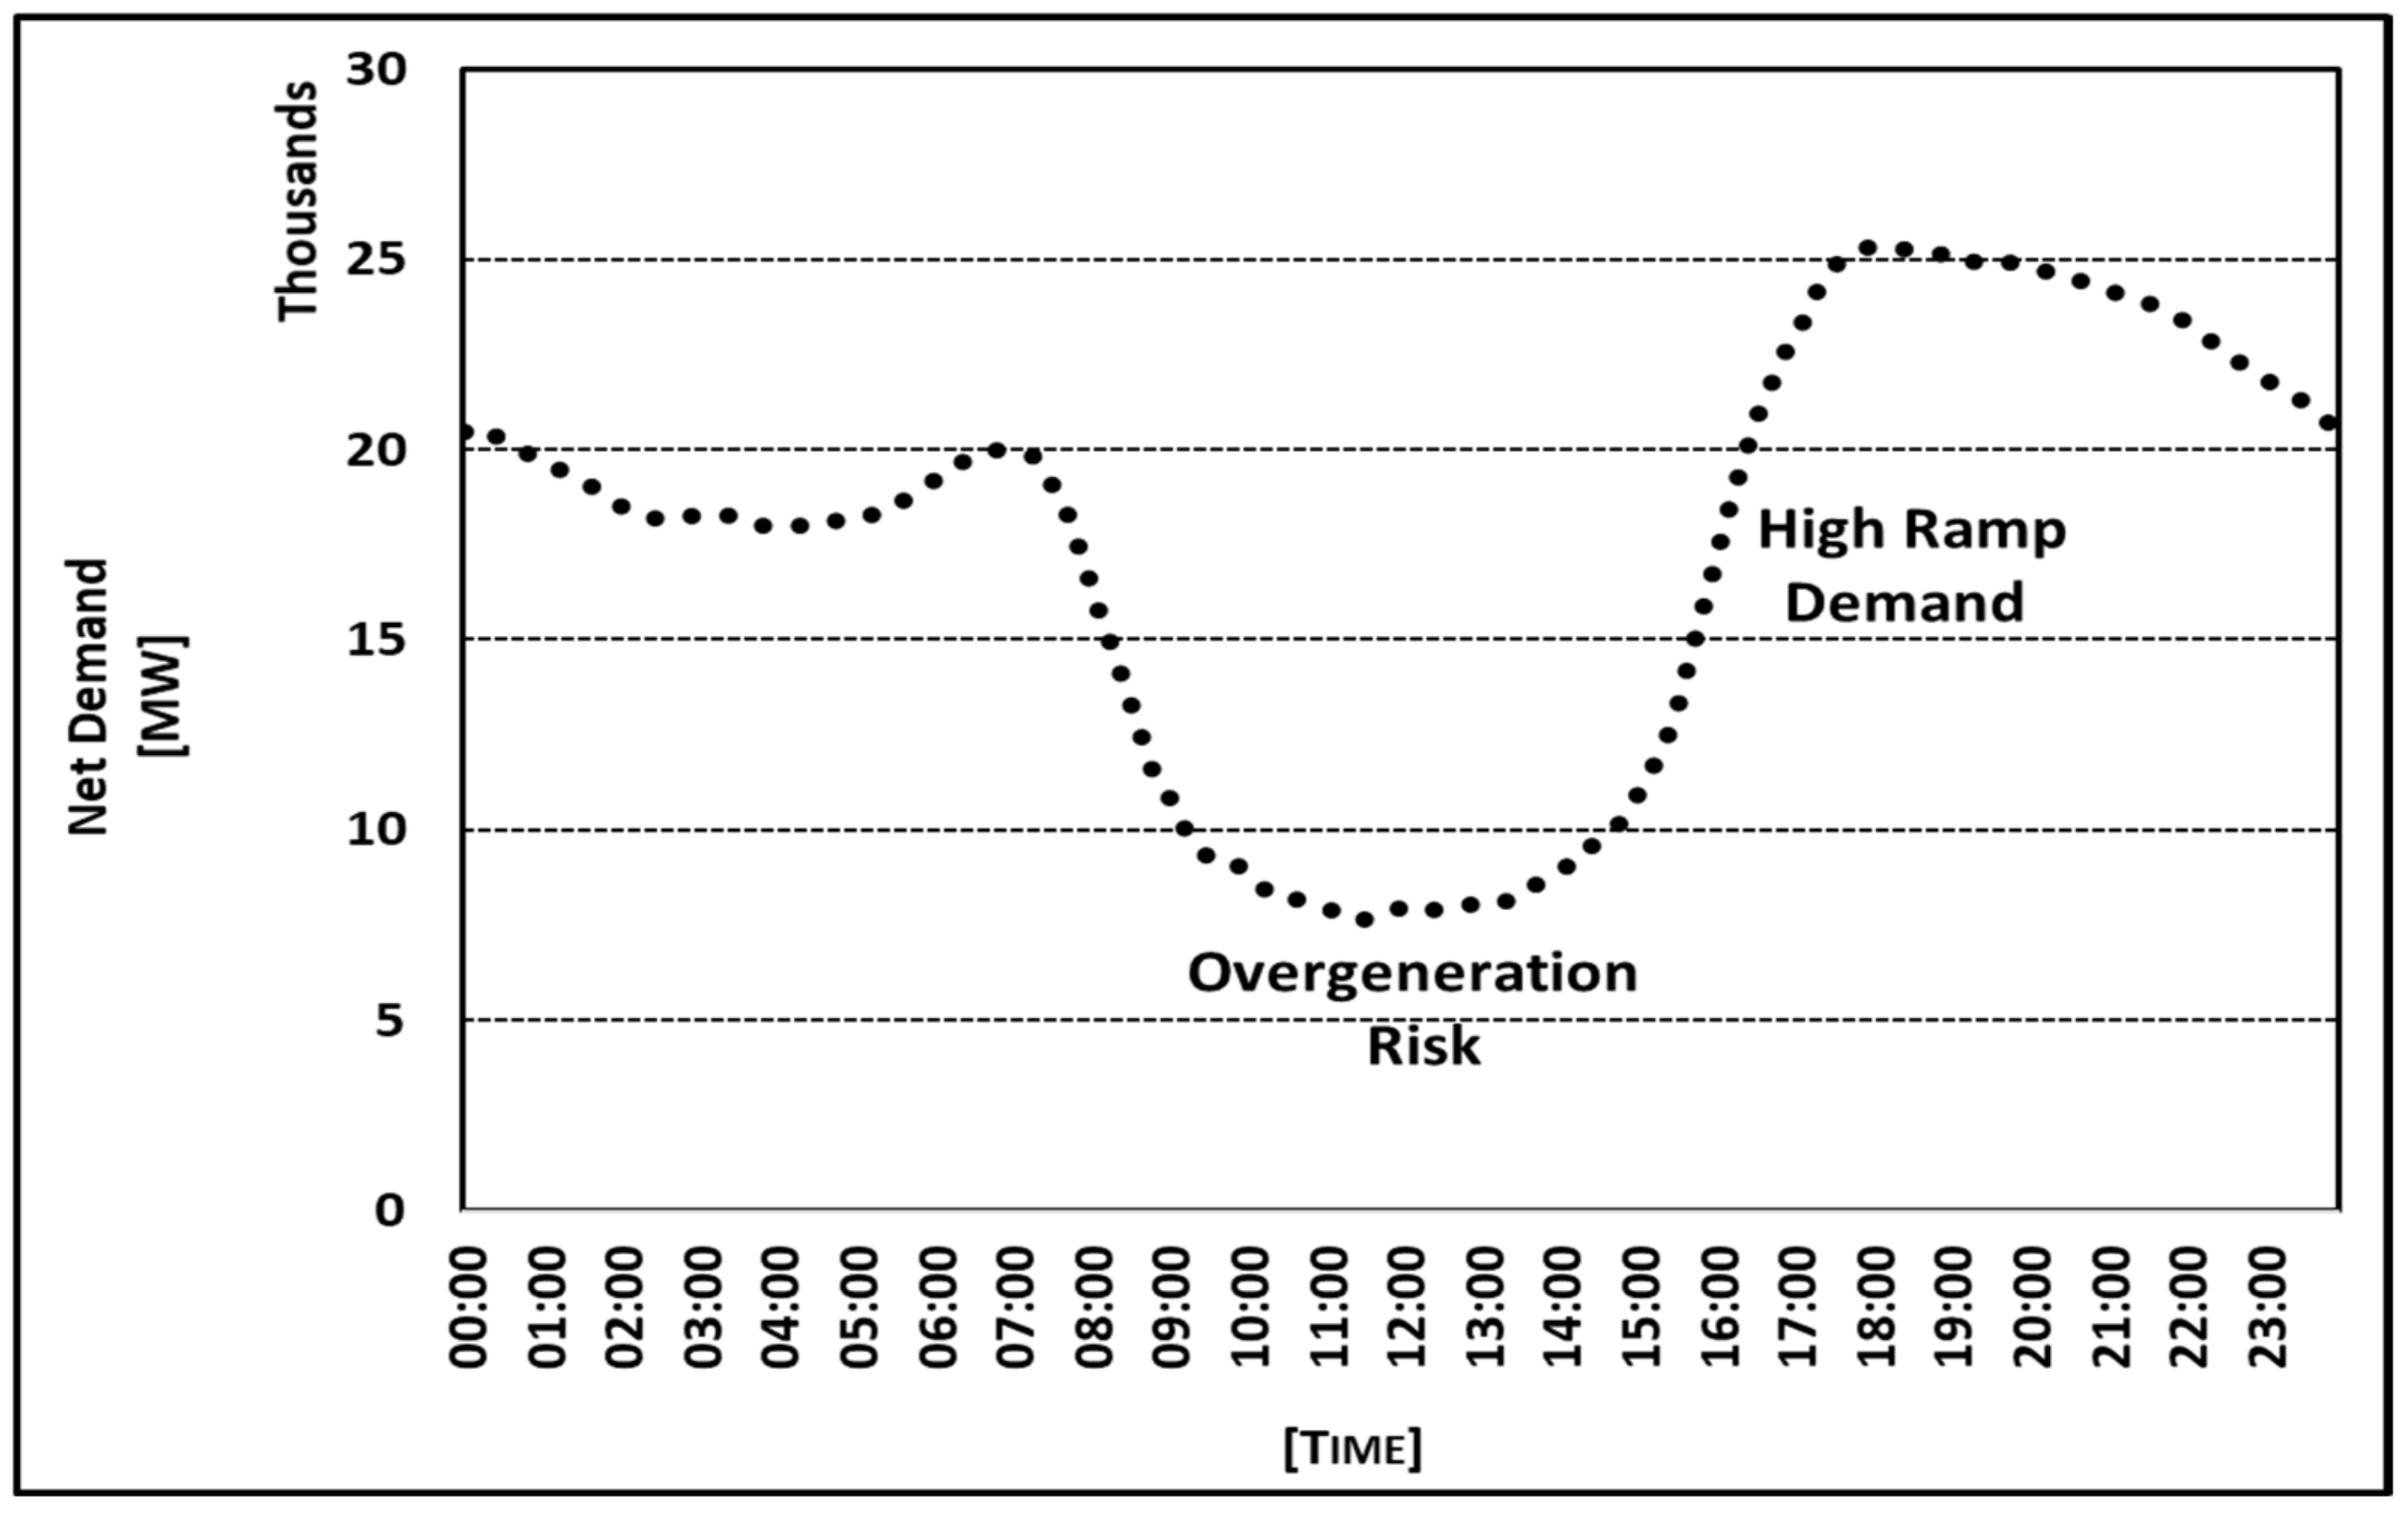
Recent developments in the field of RES have led to greater interest in the usage of RESs in the grid system. Because the clean RE produced is highly valuable, it should not be wasted. However, its use is restricted by the unpredictable power output of RESs, particularly solar and wind energy. It is clear that the Duck Curve, which is shown in Figure 13, is one of the best examples used to explain this phenomenon. The Duck Curve is the pattern of California’s net energy demand curve. The demand data presented in Figure 13 represent 1 January 2021, and were provided by California ISO (CAISO) [119]. The increase in the share of RESs in the California grid, which had a Camel Curve type energy demand curve until 2012, similar to that of the UK, triggered significant ramping problems in the power network. A downward ramp that occurs in energy demand due to high amounts of sunshine at noon leads to the formation of a steep upward ramp that must be covered quickly within three hours and increases the risk of overgeneration at noontime. In this case, a phenomenon known as RE curtailment occurs and the TNOs (Transmission Network Operators), who are responsible for network security, may have to ignore the wastage of produced RE [120]. Today, the problem of RE curtailment may be faced by any country that increases the share of solar PV energy in its grid system and does not limit the usage of RESs.
By comparison, the increasing installation of solar PV capacity will likely accelerate the formation of downward and upward ramps, and therefore increase over-generation and under-generation risks. Storage systems can play an important role in eliminating these risks. However, it is clear that V2G technology has more advantages, not only in the elimination of the risks without storage costs, but also in providing a solution to the load peak problem by sending the excess stored energy back to the system during the peak hours of energy consumption (i.e., the head of the duck).
During the last decade, the use of the link between EVs and RESs to provide a balance between demand and supply has attracted a significant amount of attention [121,122,123,124,125]. Borba et al. [16] examined PHEVs that were fully charged with wind energy in order to eliminate the imbalance between energy production and consumption, taking into account the future wind energy capacity increase in a selected region in Brazil. The researchers asserted that the excess energy produced by wind turbines in the region in 2030 can be completely consumed with the charge of 1.5 million PHEVs. A study by Schuller et al. [126] focused on a similar type of charging strategy and emphasized that charging EVs with RES can increase the RES usage by more than 100% compared to uncontrolled charging. However, in both studies, it was assumed that the battery capacity of the vehicles is constant, and V2G technology was not taken into account.
In the past two decades, there has been a surge of interest in studies that compare different charging strategies, different EV penetration rates, and different levels of RES integrations to maximize the interaction between EVs and RES [113,127,128,129,130]. Schetinger et al. [131], for example, presented an economic analysis of Toyota Prius PHEVs on a university campus in Brazil, and critically examined three scenarios in which there were no RES, EVs charging with RES (solar and wind), and EVs discharging with V2G. The researcher contended that the lowest Net Present Value (NPV) and Levelized Cost of Energy (LCOE) can be achieved with the combination of RES and V2G technology. In another related study, Freire et al. [132], who claimed V2G may be a supportive innovation for RE integration, concentrated on different vehicle charging schemas—uncontrolled, controlled, and V2G—by considering that all vehicles on the roads of Portugal would be EVs. Similarly, under the 100% EV penetration scenario, Colmenar-Santos et al. [19] developed a control strategy regulating the charge and discharge of EVs to increase the percentage of RESs in the grid. Additionally, taking a different approach by using heat pumps (HPs) in addition to EVs to consume the electricity produced by solar PVs, Zhang et al. [133] showed that the excess energy from installed PVs having 30 GWp can be reduced by up to 3 TWh (corresponding to 3% of the total electricity produced) with the use of one million EVs and one million HPs. The method used in the paper was to capture the excess energy from PVs using EVs and HPs, and then utilise EVs with V2G to avoid the need to increase the installed power capacity and the additional upgrading costs. The results of an article published by Claus Ekman [134] cast doubt on the researchers’ method. Ekman compared the uncontrolled, night, smart charge, and V2G charging strategies of EVs, and concluded that, although 500,000 EVs have the ability to reduce the excess energy from an 8 GW wind farm by 800 MW, this EV fleet is also not enough to balance demand and supply in the grid when the RE usage rate is over 50%, and added that V2G is not effective in reducing the required installed power capacity. The difference between the results of the two papers may be caused by dissimilar parameters, such as the size of the selected EV fleets, RE generation capacities, and RES types and locations. A study by Hassan et al. [135] should be mentioned here. The researchers discussed the use of batteries of EVs as storage devices for RE, and demonstrated that wind power generation of 80 TWh in Great Britain under a 70% EV penetration scenario does not cause excess energy generation. Furthermore, when the amount of generated wind energy is increased to 180 TWh, the reference excess energy amount of 59 TWh (under a no EVs scenario) can be decreased to 40.21 TWh (32% reduction) using V2G technology.

7. Conclusions

The EV industry has made substantial progress in recent years. The introduction of new policy frameworks to address climate change and implementation of substantial financial incentives in many developed countries have provided the required confidence for the automotive industry to make sweeping decisions, such as discontinuing production of petrol and diesel engines and reshaping long-term strategies for the development of EV technology for a sustainable mass market. As a result of the current transition to full electrification of transport, some EV types, such as BEVs, PHEVs, HEVs, and FCEVs, are being developed to instil confidence in the technology. At present, significant technical development is required in the engineering of lighter and more powerful batteries, smart management systems, and manufacturing processes to reduce cost.
This paper attempts to highlight some of the technological advancements, areas of required further development, and future prospects of EVs as a means of sustainable transportation and as an interfacial energy carrier. The findings of this work are summarised as follows:
  • The number of EVs sold is consistently increasing in many major economies of the world, thus displacing the process of ICE vehicles. To date, there are over 10 million EVs globally, of which BEVs and PHEVs are the best-selling types.
  • China is the largest market for EVs, accounting for over 50% of global sales. However, Europe is emerging as the fastest-growing market with the most EV sales at the end of 2020.
  • All major automotive companies have committed to discontinuing the production of ICE cars in the next decade or soon after. They have also embarked on large investments, often supported by government grants, for research, development and manufacturing, a sign that the EV market is gaining momentum; for example, the number of available EV models increased by 40% at the end of 2020 compared to a year earlier.
  • However, the speed of market uptake will experience challenges, which could relate to both technology and affordability. For example, the number of plug-in charging installations is consistently increasing (currently at over 11 million chargers), but until this reaches a critical threshold to overcome users concerns about recharging, hesitancy will remain about switching to EVs. In addition, the development of rapid EV chargers will reduce the charging time, enabling EVs to compete with ICE vehicles.
  • Concerns regarding range anxiety among potential users of EVs still needs to be addressed through the development of lighter and high energy density battery technology. However, any future technological advancement should consider the sustainability of sourcing rare earth materials, waste, and recycling issues.
  • The deployment of the EV market will add significant pressure on grid infrastructure to increase both generation capacity and faster response times. However, EVs may also play a major role, in addition to their primary purpose of transportation, as an energy carrier supporting future smart power grids. V2G technology can, for example, be deployed through smart controllers to store electrical power generated from renewable sources at times of low demand, and discharge to the grid at times of peak demand. However, this still requires further research and development to address technical limitations, such as the impact on battery service life and users’ behaviour and acceptability.
  • The mass market uptake of EVs will constitute a major global re-industrialisation, in conjunction with the shift to renewable energy power generation. These technological and social transformations will result in immense benefits, thus improving the quality of life and the environment.

Author Contributions

Conceptualization, A.D.; Supervision, S.O. and R.B. All authors have read and agreed to the published version of the manuscript.

Funding

This research received no external funding.

Institutional Review Board Statement

Not applicable.

Informed Consent Statement

Not applicable.

Conflicts of Interest

The authors declare no conflict of interest.

References

  1. Looney, B. BP Statistical Review of World Energy 2020, 69th ed.; British Petroleum Co.: London, UK, 2020; p. 66. [Google Scholar]
  2. Cozzi, L.; Gould, T.; Bouckaert, S.; Kim, T.Y.; McNamara, K.; Wanner, B.; Mcglade, C.; Olejarnik, P.; Adam, Z.; Sarazola, L.A.; et al. World Energy Outlook 2019; IEA: Paris, France, 2019. [Google Scholar]
  3. Cozzi, L.; Gould, T.; Bouckaert, S.; Crow, D.; Kim, T.Y.; Mcglade, C.; Olejarnik, P.; Wanner, B.; Wetzel, D.; Adam, Z.; et al. World Energy Outlook 2020; IEA: Paris, Frace, 2020. [Google Scholar]
  4. Chen, K.; Winter, R.C.; Bergman, M.K. Carbon dioxide from fossil fuels: Adapting to uncertainty. Energy Policy 1980, 8, 318–330. [Google Scholar] [CrossRef] [Green Version]
  5. BGS. The Greenhouse Effect. Available online: https://www.bgs.ac.uk/discovering-geology/climate-change/how-does-the-greenhouse-effect-work/ (accessed on 25 November 2021).
  6. BBC. Climate Change—Impact of Human Activity. Available online: https://www.bbc.co.uk/bitesize/guides/zt6sfg8/revision/2 (accessed on 25 November 2021).
  7. BBC. Climate Change: Last Decade UK’s ‘Second Hottest in 100 Years’. 2020. Available online: https://www.bbc.co.uk/news/science-environment-50976909 (accessed on 25 November 2021).
  8. Sinsel, S.R.; Riemke, R.L.; Hoffmann, V.H. Challenges and solution technologies for the integration of variable renewable energy sources—A review. Renew. Energy 2020, 145, 2271–2285. [Google Scholar] [CrossRef]
  9. Ritchie, H.; Roser, M. Energy. 2020. Available online: https://ourworldindata.org/energy (accessed on 22 December 2021).
  10. Li, D.; Chiu, W.; Sun, H. Demand Side Management in Microgrid Control Systems. In Microgrid: Advanced Control Methods and Renewable Energy System Integration; Mahmoud, M.S., Ed.; Butterworth-Heinemann: Oxford, UK, 2017; pp. 203–230. [Google Scholar]
  11. Strbac, G. Demand side management: Benefits and challenges. Energy Policy 2008, 36, 4419–4426. [Google Scholar] [CrossRef]
  12. Su, H.-I.; El Gamal, A. Modeling and analysis of the role of energy storage for renewable integration: Power balancing. IEEE Trans. Power Syst. 2013, 28, 4109–4117. [Google Scholar] [CrossRef]
  13. Muruganantham, B.; Gnanadass, R.; Padhy, N. Challenges with renewable energy sources and storage in practical distribution systems. Renew. Sustain. Energy Rev. 2017, 73, 125–134. [Google Scholar] [CrossRef]
  14. Teter, J.; Tattini, J.; Petropoulos, A. Tracking Transport 2020; IEA: Paris, France, 2020. [Google Scholar]
  15. McKerracher, C.; O’Donovan, A.; Albanese, N.; Soulopoulos, N.; Doherty, D.; Boers, M.; Fisher, R.; Cantor, C.; Frith, J.; Mi, S.; et al. Electric Vehicle Outlook (EVO) 2021; BloombergNEF (BNEF): London, UK, 2021. [Google Scholar]
  16. Borba, B.S.M.; Szklo, A.; Schaeffer, R. Plug-in hybrid electric vehicles as a way to maximize the integration of variable renewable energy in power systems: The case of wind generation in northeastern Brazil. Energy 2012, 37, 469–481. [Google Scholar] [CrossRef]
  17. Kempton, W.; Letendre, S.E. Electric vehicles as a new power source for electric utilities. Transp. Res. Part D Transp. Environ. 1997, 2, 157–175. [Google Scholar] [CrossRef]
  18. Kempton, W.; Tomić, J. Vehicle-to-grid power implementation: From stabilizing the grid to supporting large-scale renewable energy. J. Power Sources 2005, 144, 280–294. [Google Scholar] [CrossRef]
  19. Colmenar-Santos, A.; Muñoz-Gómez, A.M.; Rosales-Asensio, E.; López-Rey, Á. Electric vehicle charging strategy to support renewable energy sources in Europe 2050 low-carbon scenario. Energy 2019, 183, 61–74. [Google Scholar] [CrossRef]
  20. DfT. Annual Mileage of Cars by Ownership and Trip Purpose: England; Department for Transport (DfT) Statistics: London, UK, 2020.
  21. Ehsani, M.; Gao, Y.; Longo, S.; Ebrahimi, K.M. Modern Electric, Hybrid Electric, And Fuel Cell Vehicles; CRC Press: Boca Raton, FL, USA, 2018. [Google Scholar]
  22. Standage, T. The Lost History of the Electric Car—And What It Tells Us about the Future of Transport. 2021. Available online: https://www.theguardian.com/technology/2021/aug/03/lost-history-electric-car-future-transport (accessed on 21 December 2021).
  23. NationalGrid. The (Surprisingly Long) History of Electric Vehicles. 2021. Available online: https://www.nationalgrid.com/stories/journey-to-net-zero-stories/surprisingly-long-history-electric-vehicles (accessed on 21 December 2021).
  24. Mui, S.; Shelby, M.; Chartier, D.; Ganss, D. Plug-In Hybrids: A Scenario Analysis; US Environmental Protection Agency: Washington, DC, USA, 2007.
  25. Qin, N.; Raissi, A.; Brooker, P. Analysis of Fuel Cell Vehicle Developments; The Florida Solar Energy Center (FSEC): Cocoa, FL, USA, 2014. [Google Scholar]
  26. Kebriaei, M.; Niasar, A.H.; Asaei, B. Hybrid electric vehicles: An overview. In Proceedings of the 2015 International Conference on Connected Vehicles and Expo (ICCVE), Shenzhen, China, 19–23 October 2015. [Google Scholar]
  27. Agarwal, O.P.; Jhunjhunwala, A.; Kaur, P.; Yadav, N.; Chakrabarty, S.; Kumar, P.; Pai, M.; Bhatt, A. A Guidance Document on Accelerating Electric Mobility in India; WRI India: Mumbai, India, 2019. [Google Scholar]
  28. Skoda. Types of Electric Vehicles—Do You Know THEM All? 2019. Available online: https://www.skoda-storyboard.com/en/skoda-world/innovation-and-technology/types-of-electric-vehicles-do-you-know-them-all/transport (accessed on 28 December 2021).
  29. Un-Noor, F.; Padmanaban, S.; Mihet-Popa, L.; Mollah, M.N.; Hossain, E. A comprehensive study of key electric vehicle (EV) components, technologies, challenges, impacts, and future direction of development. Energies 2017, 10, 1217. [Google Scholar] [CrossRef] [Green Version]
  30. Rao, H.S.; Hettige, H.; Singru, N.; Lumain, R.; Roldan, C. Reducing Carbon Emissions from Transport Projects. Evaluation Knowledge Brief; Dalkmann, H., Ed.; OECD: Paris, France, 2010; Available online: https://www.oecd.org/derec/adb/47170274.pdf (accessed on 10 January 2022).
  31. McKerracher, C.; Izadi-Najafabadi, A.; O’Donovan, A.; Albanese, N.; Soulopolous, N.; Doherty, D.; Boers, M.; Fisher, R.; Cantor, C.; Frith, J.; et al. Electric Vehicle Outlook (EVO) 2020; BloombergNEF (BNEF): London, UK, 2020. [Google Scholar]
  32. Hirst, D.; Winnet, J.; Hinson, S. Electric Vehicles and Infrastructure; House of Commons Library: London, UK, 2021; pp. 5–10. [Google Scholar]
  33. Bigra, E.M.; Connelly, E.; Gorner, M.; Lowans, C.; Paoli, L.; Tattini, J.; Teter, J.; LeCroy, C.; MacDonnell, O.; Welch, D.; et al. Global EV Outlook 2021|Accelerating Ambitions Despite the Pandemic; IEA: Paris, France, 2021. [Google Scholar]
  34. Irle, R. Global EV Sales for 2021 H1. 2021. Available online: https://www.ev-volumes.com/country/total-world-plug-in-vehicle-volumes/ (accessed on 9 December 2021).
  35. Abergel, T.; Bunsen, T.; Gorner, M.; Leduc, P.; Pal, S.; Paoli, L.; Raghavan, S.; Tattini, J.; Teter, J.; Wachche, S.; et al. Global EV Outlook 2020|Entering the Decade of Electric Drive? IEA: Paris, France, 2020. [Google Scholar]
  36. IEA. Global EV Data Explorer. 2021. Available online: https://www.iea.org/articles/global-ev-data-explorer (accessed on 28 December 2021).
  37. DfT. Outcome and Response to Ending the Sale of New Petrol, Diesel and Hybrid Cars and Vans. 2021. Available online: https://www.gov.uk/government/consultations/consulting-on-ending-the-sale-of-new-petrol-diesel-and-hybrid-cars-and-vans/outcome/ending-the-sale-of-new-petrol-diesel-and-hybrid-cars-and-vans-government-response (accessed on 9 December 2021).
  38. Pickett, L.; Winnet, J.; Carver, D.; Bolton, P. Electric Vehicles and Infrastructure; House of Commons Library: London, UK, 2021. [Google Scholar]
  39. Wappelhorst, S. Update on Government Targets for Phasing out New Sales of Internal Combustion Engine Passenger Cars; International Council on Clean Transportation (ICCT): Washington, DC, USA, 2021. [Google Scholar]
  40. Carey, N.; Steitz, C. EU Proposes Effective Ban for New Fossil-Fuel Cars from 2035. 2021. Available online: https://www.reuters.com/business/retail-consumer/eu-proposes-effective-ban-new-fossil-fuel-car-sales-2035-2021-07-14/response (accessed on 7 January 2022).
  41. EV-Volumes. Global Plug-In Electric Vehicle Market Share in the First Half of 2021, by Main Producer. 2021. Available online: https://www.statista.com/statistics/541390/global-sales-of-plug-in-electric-vehicle-manufacturers/ (accessed on 22 December 2021).
  42. TESLA. Investor Relations|Tesla Releases Third Quarter 2021 Financial Results. 2021. Available online: https://ir.tesla.com/#tab-quarterly-disclosure (accessed on 23 December 2021).
  43. Kane, M. Global Plug-In Car Sales September 2021: Doubled To A New Record. 2021. Available online: https://insideevs.com/news/544743/global-plugin-car-sales-september2021/ (accessed on 23 December 2021).
  44. VOLKSWAGEN. E-Mobility. 2021. Available online: https://www.volkswagenag.com/en/group/e-mobility.html (accessed on 23 December 2021).
  45. VOLKSWAGEN. Volkswagen Group Doubles Deliveries of Pure E-Vehicles in Third Quarter. 2021. Available online: https://www.volkswagen-newsroom.com/en/press-releases/volkswagen-group-doubles-deliveries-of-pure-e-vehicles-in-third-quarter-7569 (accessed on 23 December 2021).
  46. Taylor, C. Volkswagen Wants Half of Its Vehicle Sales to Be Electric by 2030. 2021. Available online: https://www.cnbc.com/2021/07/13/volkswagen-wants-half-of-its-vehicle-sales-to-be-electric-by-2030.html (accessed on 23 December 2021).
  47. Riley, C. The Great Electric Car Race is Just Beginning. 2019. Available online: https://edition.cnn.com/interactive/2019/08/business/electric-cars-audi-volkswagen-tesla/ (accessed on 7 March 2021).
  48. GM. GM Commits Full Support to SGMW’s NEV Development. 2020. Available online: https://media.gm.com/media/cn/en/gm/news.detail.html/content/Pages/news/cn/en/2020/Dec/1214-GM.html (accessed on 23 December 2021).
  49. DfT. Licensed Ultra Low Emission Vehicles by Body Type and Propulsion or Fuel Type; Department for Transport (DfT) Statistics: London, UK, 2021.
  50. DfT. Electric Vehicle Charging Device Statistics: October 2021; Department for Transport (DfT) Statistics: London, UK, 2021.
  51. ZAP-MAP. 2021. Available online: https://www.zap-map.com/ (accessed on 23 December 2021).
  52. Lilly, C. EV Connector Types. 2020. Available online: https://www.zap-map.com/charge-points/connectors-speeds/ (accessed on 28 December 2021).
  53. ZAP-MAP. EV Charging Stats 2021. 2021. Available online: https://www.zap-map.com/statistics/ (accessed on 24 December 2021).
  54. Chen, T.; Zhan, X.; Wang, J.; Li, J.; Wu, C.; Hu, M.; Bian, H. A review on electric vehicle charging infrastructure development in the UK. J. Mod. Power Syst. Clean Energy 2020, 8, 193–205. [Google Scholar] [CrossRef]
  55. DfT. Electric Vehicle Charging in Residential and Non-Residential Buildings; Department for Transport (DfT): London, UK, 2019.
  56. BSI. PAS 1878 Energy Smart Appliances—System Functionality and Architecture. 2021. Available online: https://www.bsigroup.com/en-GB/about-bsi/uk-national-standards-body/about-standards/Innovation/energy-smart-appliances-programme/pas-1878/ (accessed on 10 December 2021).
  57. Zhao, H.; Wang, L.; Chen, Z.; He, X. Challenges of fast charging for electric vehicles and the role of red phosphorous as anode material. Energies 2019, 12, 3897. [Google Scholar] [CrossRef] [Green Version]
  58. Zhang, C.; Wei, Y.L.; Cao, P.F.; Lin, M.C. Energy storage system: Current studies on batteries and power condition system. Renew. Sustain. Energy Rev. 2018, 82, 3091–3106. [Google Scholar] [CrossRef]
  59. Mirzaeian, M.; Abbas, Q.; Hunt, M.R.C.; Galeyeva, A.; Raza, R. Na-Ion Batteries. Adv. Funct. Mater. 2021, 23, 947–958. [Google Scholar]
  60. Wang, Y.; Satoh, M.; Arao, M.; Matsumoto, M.; Imai, H.; Nishihara, H. High-energy, Long-cycle-life Secondary Battery with electrochemically pre-doped Silicon Anode. Sci. Rep. 2020, 10, 3208. [Google Scholar] [CrossRef] [Green Version]
  61. Almarzooqi, A.; Mnatsakanyan, A.; Muruaga, E. Management of Used Lithium Ion Batteries of EV in Dubai. In Proceedings of the 2019 IEEE International Smart Cities Conference (ISC2), Casablanca, Morocco, 14–17 October 2019. [Google Scholar]
  62. Sun, P.; Bisschop, R.; Niu, H.; Huang, X. A review of battery fires in electric vehicles. Fire Technol. 2020, 56, 1361–1410. [Google Scholar] [CrossRef]
  63. Pinnangudi, B.; Kuykendal, M.; Bhadra, S. Smart Grid Energy Storage. In The Power Grid; D’Andrade, B.A., Ed.; Academic Press: Boston, MA, USA, 2017; pp. 93–135. [Google Scholar]
  64. Kurzweil, P.; Garche, J. Overview of Batteries for Future Automobiles. In Lead-Acid Batteries for Future Automobiles; Elsevier: Amsterdam, The Netherlands, 2017; pp. 27–96. [Google Scholar]
  65. Fiorello, D.; Zani, L. EU Survey on Issues Related to Transport and Mobility; JRC Science and Policy Report: Sevile, Spain, 2015. [Google Scholar]
  66. Singer, M. Consumer Views on Plug-in Electric Vehicles—National Benchmark Report; National Renewable Energy Lab. (NREL): Golden, CO, USA, 2016.
  67. Electiric Vehicle Database (EV-Database). All Electric Vehicles. Available online: https://ev-database.uk/#sort:path~type~order=.erange_real~number~desc|range-slider-range:prev~next=0~600|range-slider-bijtelling:prev~next=0~600|range-slider-acceleration:prev~next=2~23|range-slider-fastcharge:prev~next=0~1100|range-slider-lease:prev~next=150~2500|range-slider-topspeed:prev~next=60~260|paging:currentPage=0|paging:number=9 (accessed on 10 January 2022).
  68. Fishman, T.; Myers, R.J.; Rios, O.; Graedel, T.E. Implications of emerging vehicle technologies on rare earth supply and demand in the United States. Resources 2018, 7, 9. [Google Scholar] [CrossRef] [Green Version]
  69. Schwarzer, S. Challenges for the Growth of the Electric Vehicle Market; The United Nations Environment Programme: Nairobi, Kenya, 2020. [Google Scholar]
  70. Swiss Resource Capital AG. Battery Metals Report 2019: Everything You Need to Know about the Battery Metals Lithium, Cobalt, Nickel and Vanadium; Swiss Resource Capital AG: Herisau, Switzerland, 2019. [Google Scholar]
  71. EEA. EEA Greenhouse Gases Data Viewer|Greenhouse Gas Emission Intensity of Electricity Generation. 2022. Available online: https://www.eea.europa.eu/data-and-maps/daviz/co2-emission-intensity-6/#tab-googlechartid_googlechartid_chart_111_filters=%7B%22rowFilters%22%3A%7B%7D%3B%22columnFilters%22%3A%7B%22pre_config_date%22%3A%5B2018%3B2019%5D%7D%3B%22sortFilter%22%3A%5B%22index_2018%22%5D%7D (accessed on 10 January 2022).
  72. IEA. IEA Data Browser|Electricity. 2022. Available online: https://www.iea.org/fuels-and-technologies/electricity (accessed on 10 January 2021).
  73. Hoehne, C.G.; Chester, M.V. Optimizing plug-in electric vehicle and vehicle-to-grid charge scheduling to minimize carbon emissions. Energy 2016, 115, 646–657. [Google Scholar] [CrossRef]
  74. Lin, B.; Wu, W. The impact of electric vehicle penetration: A recursive dynamic CGE analysis of China. Energy Econ. 2021, 94, 105086. [Google Scholar] [CrossRef]
  75. Sato, F.E.K.; Nakata, T. Energy consumption analysis for vehicle production through a material flow approach. Energies 2020, 13, 2396. [Google Scholar] [CrossRef]
  76. Knobloch, F.; Hanssen, S.V.; Lam, A.; Pollitt, H.; Salas, P.; Chewpreecha, U.; Huijbregts, M.A.; Mercure, J.F. Net emission reductions from electric cars and heat pumps in 59 world regions over time. Nat. Sustain. 2020, 3, 437–447. [Google Scholar] [CrossRef] [PubMed]
  77. Cox, B.; Mutel, C.L.; Bauer, C.; Mendoza Beltran, A.; Van Vuuren, D.P. Uncertain environmental footprint of current and future battery electric vehicles. Environ. Sci. Technol. 2018, 52, 4989–4995. [Google Scholar] [CrossRef] [PubMed]
  78. Kurland, S.D. Energy use for GWh-scale lithium-ion battery production. Environ. Res. Commun. 2019, 2, 012001. [Google Scholar]
  79. Hall, D.; Lutsey, N. Effects of Battery Manufacturing on Electric Vehicle Life-Cycle Greenhouse Gas Emissions; The Internal Council on Clean Transportation (ICCT): Washington, DC, USA, 2018. [Google Scholar]
  80. Bieker, G. A global comparison of the life-cycle greenhouse gas emissions of combustion engine and electric passenger cars. Communications 2021, 49, 847129-102. [Google Scholar]
  81. IEA. Amount of Spent Lithium-Ion Batteries from Electric Vehicles and Storage in the Sustainable Development Scenario, 2020–2040. 2021. Available online: https://www.iea.org/data-and-statistics/charts/amount-of-spent-lithium-ion-batteries-from-electric-vehicles-and-storage-in-the-sustainable-development-scenario-2020-2040 (accessed on 9 January 2022).
  82. Saiyid, A. Threefold Increase in Recycling Needed to Help Meet 2030 Demand for Lithium-Ion EV Batteries. 2021. Available online: https://cleanenergynews.ihsmarkit.com/research-analysis/threefold-increase-in-recycling-needed-to-help-meet-2030-deman.html (accessed on 9 January 2022).
  83. Gaines, L.; Richa, K.; Spangenberger, J. Key issues for Li-ion battery recycling. MRS Energy Sustain. 2018, 5, E14. [Google Scholar] [CrossRef] [Green Version]
  84. Rohr, S.; Wagner, S.; Baumann, M.; Müller, S.; Lienkamp, M. A techno-economic analysis of end of life value chains for lithium-ion batteries from electric vehicles. In Proceedings of the 2017 Twelfth International Conference on Ecological Vehicles and Renewable Energies (EVER), Monte Carlo, Monaco, 11–13 April 2017. [Google Scholar]
  85. Clement-Nyns, K.; Haesen, E.; Driesen, J. The impact of charging plug-in hybrid electric vehicles on a residential distribution grid. IEEE Trans. Power Syst. 2009, 25, 371–380. [Google Scholar] [CrossRef] [Green Version]
  86. Kapustin, N.O.; Grushevenko, D.A. Long-term electric vehicles outlook and their potential impact on electric grid. Energy Policy 2020, 137, 111103. [Google Scholar] [CrossRef]
  87. Kim, S.; Hur, J. A Probabilistic Modeling Based on Monte Carlo Simulation of Wind Powered EV Charging Stations for Steady-States Security Analysis. Energies 2020, 13, 5260. [Google Scholar] [CrossRef]
  88. Mu, Y.; Wu, J.; Jenkins, N.; Jia, H.; Wang, C. A spatial–temporal model for grid impact analysis of plug-in electric vehicles. Appl. Energy 2014, 114, 456–465. [Google Scholar] [CrossRef] [Green Version]
  89. Qian, K.; Zhou, C.; Allan, M.; Yuan, Y. Modeling of load demand due to EV battery charging in distribution systems. IEEE Trans. Power Syst. 2010, 26, 802–810. [Google Scholar] [CrossRef]
  90. Qian, K.; Zhou, C.; Allan, M.; Yuan, Y. Load model for prediction of electric vehicle charging demand. In Proceedings of the 2010 International Conference on Power System Technology, Hangzhou, China, 24–28 October 2010. [Google Scholar]
  91. Wang, S.; Zhang, N.; Li, Z.; Shahidehpour, M. Modeling and impact analysis of large scale V2G electric vehicles on the power grid. In Proceedings of the IEEE PES Innovative Smart Grid Technologies, Tianjin, China, 21–24 May 2012. [Google Scholar]
  92. Papadopoulos, P.; Akizu, O.; Cipcigan, L.M.; Jenkins, N.; Zabala, E. Electricity demand with electric cars in 2030: Comparing Great Britain and Spain. Proc. Inst. Mech. Eng. Part A J. Power Energy 2011, 225, 551–566. [Google Scholar] [CrossRef]
  93. Ueckerdt, F.; Kempener, R. From Baseload to Peak: Renewables Provide a Reliable Solution; International Renewable Energy Agency (IREA): Abu Dhabi, United Arab Emirates, 2015. [Google Scholar]
  94. National Grid ESO. Future Energy Scenarios (FES) 2021; National Grid ESO: Warwick, UK, 2021. [Google Scholar]
  95. Toniato, E.; Mehta, P.; Marinkovic, S.; Tiefenbeck, V. Peak load minimization of an e-bus depot: Impacts of user-set conditions in optimization algorithms. Energy Inform. 2021, 4, 23. [Google Scholar] [CrossRef]
  96. Fathabadi, H. Novel wind powered electric vehicle charging station with vehicle-to-grid (V2G) connection capability. Energy Convers. Manag. 2017, 136, 229–239. [Google Scholar] [CrossRef]
  97. Kempton, W.; Tomić, J. Vehicle-to-grid power fundamentals: Calculating capacity and net revenue. J. Power Sources 2005, 144, 268–279. [Google Scholar] [CrossRef]
  98. Noori, M.; Zhao, Y.; Onat, N.C.; Gardner, S.; Tatari, O. Light-duty electric vehicles to improve the integrity of the electricity grid through Vehicle-to-Grid technology: Analysis of regional net revenue and emissions savings. Appl. Energy 2016, 168, 146–158. [Google Scholar] [CrossRef]
  99. Ginigeme, K.; Wang, Z. Distributed optimal vehicle-to-grid approaches with consideration of battery degradation cost under real-time pricing. IEEE Access 2020, 8, 5225–5235. [Google Scholar] [CrossRef]
  100. Peterson, S.B.; Whitacre, J.; Apt, J. The economics of using plug-in hybrid electric vehicle battery packs for grid storage. J. Power Sources 2010, 195, 2377–2384. [Google Scholar] [CrossRef]
  101. Kiaee, M.; Cruden, A.; Sharkh, S. Estimation of cost savings from participation of electric vehicles in vehicle to grid (V2G) schemes. J. Mod. Power Syst. Clean Energy 2015, 3, 249–258. [Google Scholar] [CrossRef] [Green Version]
  102. Hidrue, M.K.; Parsons, G.R. Is there a near-term market for vehicle-to-grid electric vehicles? Appl. Energy 2015, 151, 67–76. [Google Scholar] [CrossRef] [Green Version]
  103. Cicconi, P.; Landi, D.; Morbidoni, A.; Germani, M. Feasibility analysis of second life applications for Li-Ion cells used in electric powertrain using environmental indicators. In Proceedings of the 2012 IEEE International Energy Conference and Exhibition (ENERGYCON), Florence, Italy, 9–12 September 2012. [Google Scholar]
  104. Ahmadian, A.; Sedghi, M.; Mohammadi-ivatloo, B.; Elkamel, A.; Golkar, M.A.; Fowler, M. Cost-benefit analysis of V2G implementation in distribution networks considering PEVs battery degradation. IEEE Trans. Sustain. Energy 2017, 9, 961–970. [Google Scholar] [CrossRef]
  105. Xiong, S. A Study of the Factors That Affect Lithium Ion Battery Degradation. Master’s Thesis, University of Missouri, Columbia, MI, USA, May 2019. [Google Scholar]
  106. Peterson, S.B.; Apt, J.; Whitacre, J. Lithium-ion battery cell degradation resulting from realistic vehicle and vehicle-to-grid utilization. J. Power Sources 2010, 195, 2385–2392. [Google Scholar] [CrossRef]
  107. Bishop, J.D.; Axon, C.J.; Bonilla, D.; Tran, M.; Banister, D.; McCulloch, M.D. Evaluating the impact of V2G services on the degradation of batteries in PHEV and EV. Appl. Energy 2013, 111, 206–218. [Google Scholar] [CrossRef]
  108. Guo, J.; Yang, J.; Cao, W.; Serrano, C. Evaluation of EV battery degradation under different charging strategies and V2G schemes. In Proceedings of the 8th Renewable Power Generation Conference (RPG 2019), Shanghai, China, 24–25 October 2019. [Google Scholar]
  109. Uddin, K.; Jackson, T.; Widanage, W.D.; Chouchelamane, G.; Jennings, P.A.; Marco, J. On the possibility of extending the lifetime of lithium-ion batteries through optimal V2G facilitated by an integrated vehicle and smart-grid system. Energy 2017, 133, 710–722. [Google Scholar] [CrossRef]
  110. Zhou, C.; Qian, K.; Allan, M.; Zhou, W. Modeling of the cost of EV battery wear due to V2G application in power systems. IEEE Trans. Energy Convers. 2011, 26, 1041–1050. [Google Scholar] [CrossRef]
  111. BEIS. 2020 UK Greenhouse Gas Emissions, Provisional Figures; Department for Business, Energy and Industrial Strategy (BEIS): London, UK, 2021.
  112. Buekers, J.; Van Holderbeke, M.; Bierkens, J.; Panis, L.I. Health and environmental benefits related to electric vehicle introduction in EU countries. Transp. Res. Part D Transp. Environ. 2014, 33, 26–38. [Google Scholar] [CrossRef]
  113. Turton, H.; Moura, F. Vehicle-to-grid systems for sustainable development: An integrated energy analysis. Technol. Forecast. Soc. Chang. 2008, 75, 1091–1108. [Google Scholar] [CrossRef]
  114. Jiao, Z.; Yin, Y.; Ran, L.; Gao, Z. Integrating Vehicle-to-Grid Contract Design with Power Dispatching Optimization: Managerial Insights, and Carbon Footprints Mitigation. Int. J. Prod. Res. 2021, 1–26. [Google Scholar] [CrossRef]
  115. Ali, H.; Hussain, S.; Khan, H.A.; Arshad, N.; Khan, I.A. Economic and Environmental Impact of Vehicle-to-Grid (V2G) Integration in an Intermittent Utility Grid. In Proceedings of the 2020 2nd International Conference on Smart Power & Internet Energy Systems (SPIES), Bangkok, Thailand, 15–18 September 2020. [Google Scholar]
  116. Bamisile, O.; Obiora, S.; Huang, Q.; Okonkwo, E.C.; Olagoke, O.; Shokanbi, A.; Kumar, R. Towards a sustainable and cleaner environment in China: Dynamic analysis of vehicle-to-grid, batteries and hydro storage for optimal RE integration. Sustain. Energy Technol. Assess. 2020, 42, 100872. [Google Scholar] [CrossRef]
  117. Zhao, Y.; Noori, M.; Tatari, O. Vehicle to Grid regulation services of electric delivery trucks: Economic and environmental benefit analysis. Appl. Energy 2016, 170, 161–175. [Google Scholar] [CrossRef]
  118. Sioshansi, R.; Denholm, P. Emissions impacts and benefits of plug-in hybrid electric vehicles and vehicle-to-grid services. Environ. Sci. Technol. 2009, 43, 1199–1204. [Google Scholar] [CrossRef]
  119. California ISO (CAISO). Today’s Outlook|Net Demand Trend. 2022. Available online: http://www.caiso.com/TodaysOutlook/Pages/default.aspx#section-net-demand-trend (accessed on 6 January 2022).
  120. California ISO (CASIO). What the Duck Curve Tells Us about Managing a Green Grid. Available online: https://www.caiso.com/documents/flexibleresourceshelprenewables_fastfacts.pdf (accessed on 10 January 2022).
  121. Atia, R.; Yamada, N. More accurate sizing of renewable energy sources under high levels of electric vehicle integration. Renew. Energy 2015, 81, 918–925. [Google Scholar] [CrossRef]
  122. McPherson, M.; Ismail, M.; Hoornweg, D.; Metcalfe, M. Planning for variable renewable energy and electric vehicle integration under varying degrees of decentralization: A case study in Lusaka, Zambia. Energy 2018, 151, 332–346. [Google Scholar] [CrossRef]
  123. Shi, R.; Li, S.; Zhang, P.; Lee, K.Y. Integration of renewable energy sources and electric vehicles in V2G network with adjustable robust optimization. Renew. Energy 2020, 153, 1067–1080. [Google Scholar] [CrossRef]
  124. Sharifi, P.; Banerjee, A.; Feizollahi, M.J. Leveraging owners’ flexibility in smart charge/discharge scheduling of electric vehicles to support renewable energy integration. Comput. Ind. Eng. 2020, 149, 106762. [Google Scholar] [CrossRef]
  125. Child, M.; Nordling, A.; Breyer, C. Scenarios for a sustainable energy system in the Åland Islands in 2030. Energy Convers. Manag. 2017, 137, 49–60. [Google Scholar] [CrossRef]
  126. Schuller, A.; Flath, C.M.; Gottwalt, S. Quantifying load flexibility of electric vehicles for renewable energy integration. Appl. Energy 2015, 151, 335–344. [Google Scholar] [CrossRef]
  127. Richardson, D.B. Electric vehicles and the electric grid: A review of modeling approaches, Impacts, and renewable energy integration. Renew. Sustain. Energy Rev. 2013, 19, 247–254. [Google Scholar] [CrossRef]
  128. Nguyen, H.N.; Zhang, C.; Mahmud, M.A. Optimal coordination of G2V and V2G to support power grids with high penetration of renewable energy. IEEE Trans. Transp. Electrif. 2015, 1, 188–195. [Google Scholar] [CrossRef]
  129. Pfeifer, A.; Dobravec, V.; Pavlinek, L.; Krajačić, G.; Duić, N. Integration of renewable energy and demand response technologies in interconnected energy systems. Energy 2018, 161, 447–455. [Google Scholar] [CrossRef]
  130. Šare, A.; Krajačić, G.; Pukšec, T.; Duić, N. The integration of renewable energy sources and electric vehicles into the power system of the Dubrovnik region. Energy Sustain. Soc. 2015, 5, 27. [Google Scholar] [CrossRef] [Green Version]
  131. Schetinger, A.M.; Dias, D.H.N.; Borba, B.S.M.C.; Pimentel da Silva, G.D. Techno-economic feasibility study on electric vehicle and renewable energy integration: A case study. Energy Storage 2020, 2, e197. [Google Scholar] [CrossRef]
  132. Freire, R.; Delgado, J.; Santos, J.M.; De Almeida, A.T. Integration of renewable energy generation with EV charging strategies to optimize grid load balancing. In Proceedings of the 13th International IEEE Conference on Intelligent Transportation Systems, Funchal, Portugal, 19–22 September 2010. [Google Scholar]
  133. Zhang, Q.; Tezuka, T.; Ishihara, K.N.; Mclellan, B.C. Integration of PV power into future low-carbon smart electricity systems with EV and HP in Kansai Area, Japan. Renew. Energy 2012, 44, 99–108. [Google Scholar] [CrossRef]
  134. Ekman, C.K. On the synergy between large electric vehicle fleet and high wind penetration–An analysis of the Danish case. Renew. Energy 2011, 36, 546–553. [Google Scholar] [CrossRef]
  135. Hassan, A.S.; Marmaras, C.E.; Xydas, E.S.; Cipcigan, L.M.; Jenkins, N. Integration of Wind Power Using V2G as a Flexible Storage. In Proceedings of the IET Conference on Power in Unity: A Whole System Approach, London, UK, 16–17 October 2013. [Google Scholar]
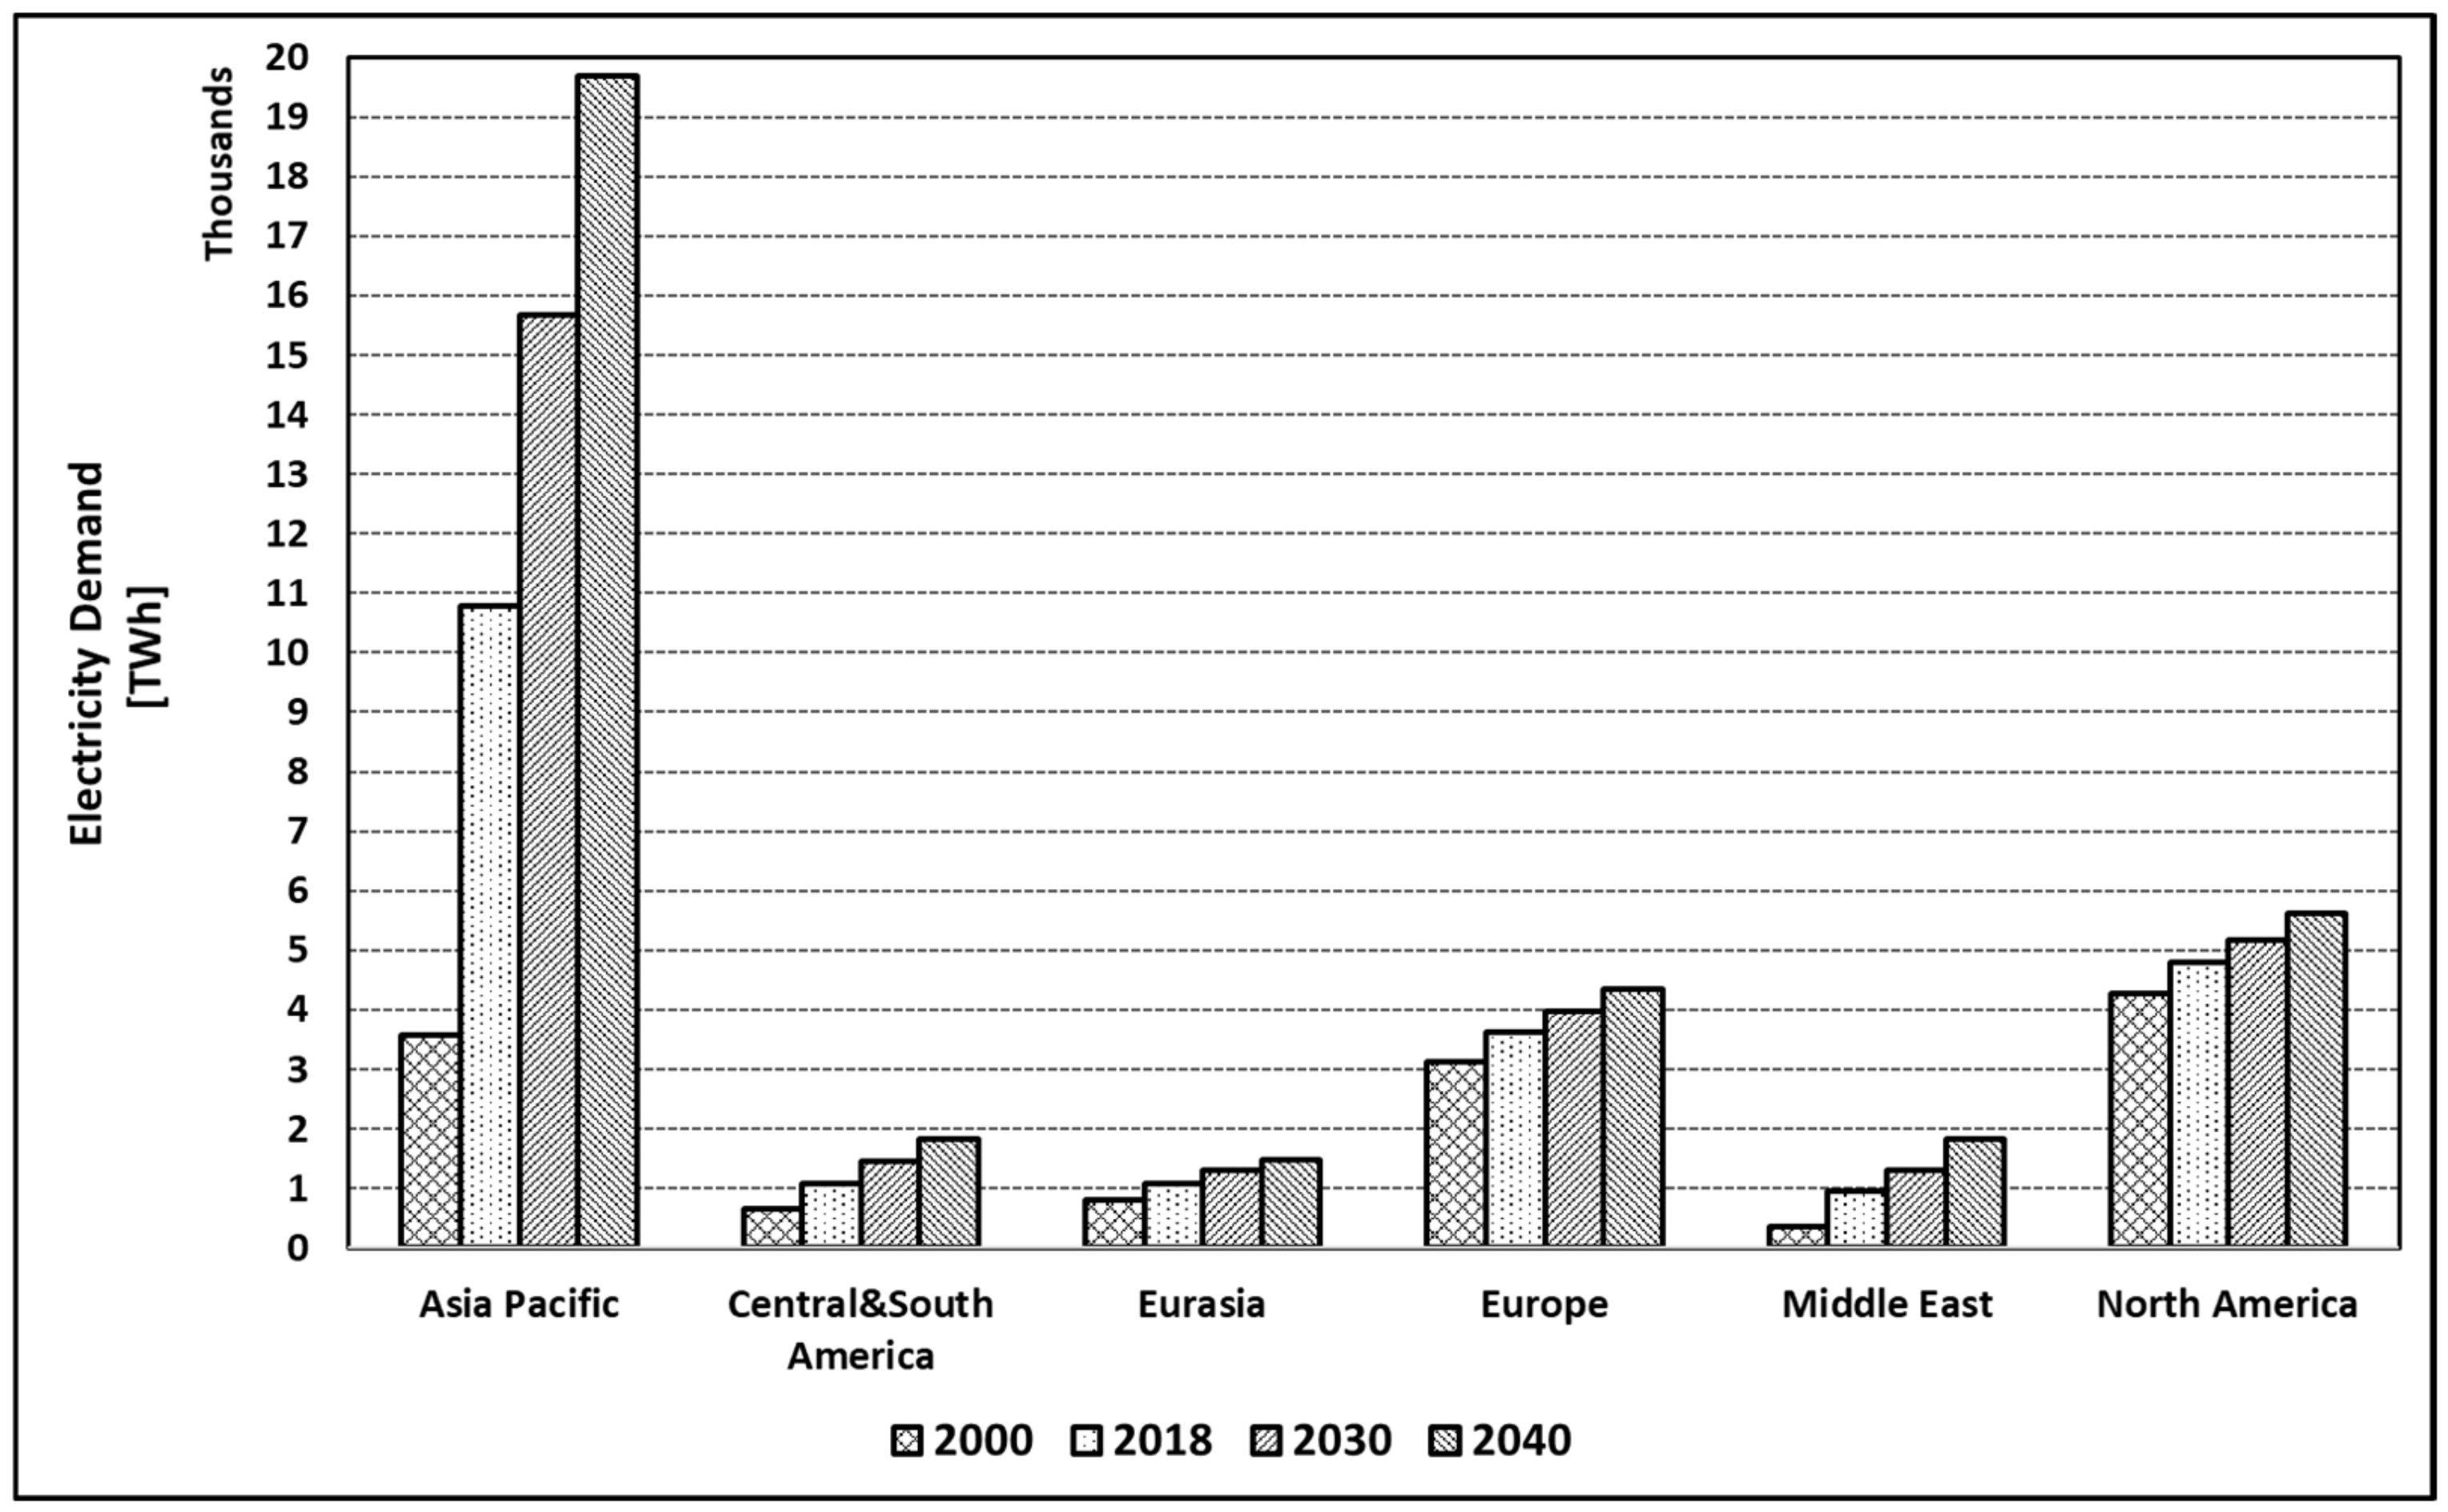
Figure 1. Projected global electricity demand between 2000 and 2040.
Energies 15 00803 g001
Figure 2. Global renewable energy consumption for primary energy.
Energies 15 00803 g002
Figure 3. Types of electric vehicles and configuration of the drivetrain.
Energies 15 00803 g003
Figure 4. Global EV registration.
Energies 15 00803 g004
Figure 5. The number of available EV models by 2020.
Energies 15 00803 g005
Figure 6. The global market share of the main EV brands in Q2 2021.
Energies 15 00803 g006
Figure 7. The numbers of best-selling EVs worldwide by model between January and September 2021.
Energies 15 00803 g007
Figure 8. The most popular EVs in the UK in the second quarter of 2021.
Energies 15 00803 g008
Figure 9. The number of public EV chargers in the UK.
Energies 15 00803 g009
Figure 10. The number of public rapid charging connectors in the UK.
Energies 15 00803 g010
Figure 11. Available global EV models and average range.
Energies 15 00803 g011
Figure 12. Schematic layout of V2G architecture.
Energies 15 00803 g012
Figure 13. California’s Duck Curve.
Energies 15 00803 g013
Table 1. Characteristics of different types of EVs.
EV TypeBEVsPHEVsHEVsFCEVs
StrengthNo emission or very low emissionLower emission than HEVsLower emission than ICE vehiclesNo emission or very low emission
High energy efficiencyHigh fuel efficiencyHigh fuel efficiencyHigh efficiency
Independent from oil/Low engine noiseFuel diversity/No range anxietyNo charging station problemIndependent from electricity
WeaknessHigh purchase and battery costComplex technologyComplex technology/Higher costHigh fuel cell cost
Charging station problemsManagement of the energy sourcesManagement of the energy sourcesTechnical challenge and cost issue
Battery replacement requirementHeavier/Tail-pipe emissionsDependence on fossil fuel/Tail-pipe emissions/HeavierProblems of H2 generation
Table 2. EV market status of some countries.
CanadaChinaFranceGermanyJapanUnited States
EV Fleets
[units]
Total: 209,171
BEVs: 127,487
PHEVs: 81,588
FCEVs: 96
Total: 4,514,114
BEVs: 3,512,477
PHEVs: 996,191
FCEVs: 5446
Total: 416,585
BEVs: 281,603
PHEVs: 134,607
FCEVs: 375
Total: 634,236
BEVs: 330,780
PHEVs: 302,644
FCEVs: 812
Total: 297,181
BEVs: 136,700
PHEVs: 156,381
FCEVs: 4100
Total: 1,787,221
BEVs: 1,138,654
PHEVs: 639,432
FCEVs: 9135
EV Sales Share
[%]
4.2% of the new cars5.7% of the new cars11.3% of the new cars13.5% of the new cars0.6% of the new cars2.0% of the new cars
Table 3. EV incentives and regulations in some countries.
CanadaChinaFranceGermanyJapanUnited States
Targets to Ban ICE Vehicle SalesNot available in all states--Not available in all states
Targets for Low Carbon Transport
Vehicle Purchase Incentives
Charger RegulationsNot available in all regionsNot available in all regionsNo building side regulationNot available in all states
Charger Installation IncentivesNot available in all states
Table 4. Number of chargers in some countries.
CanadaChinaFranceGermanyJapanUnited States
[Unit][Unit][Unit][Unit][Unit][Unit]
Total: 13,194Total: 807,000Total: 46,045Total: 44,669Total: 29,855Total: 103,021
1 F & R: 2258F & R: 309,000F & R: 4045F & R: 7456F & R: 7939F & R: 16,718
Slow: 10,936Slow: 498,000Slow: 42,000Slow: 37,213Slow: 21,916Slow: 82,263
1 In the table, F & R stands for fast and rapid chargers. In addition, the power of the referred F & R and slow chargers are above 22 kW and up to 22 kW, respectively.
Table 5. EV charging parameters in the UK.
Charger Type Charge ModePower RatingConnector TypeCharging Time
Slow Charger-Mode 23–6 kW3-Pin
Type 18–10 h
Type 2
Commando
Fast Charger-Mode 37 kW/11 kW/22 kWType 1
Type 23–4 h
Commando
Rapid ChargerAC RapidMode 343 kWType 230–60 min
DC RapidMode 450 kWCHAdeMO/
CCS
DC ultra-RapidMode 4100–350 kWCHAdeMO
CCS
Tesla Supercharger-Mode 4Up to 250 kWTesla CCS
Type 2
CCS
CHAdeMO
Table 6. Some BEVs having a range of 200+ m.
BEVsBattery
Capacity
Specific Energy
Consumption
Range
[kWh][Wh/mi][mi]
Hyundai Kona Electric640.26245
Tesla Model 3 Long Range700.245285
Polestar 2750.305245
Tesla Model 3 Performance760.265285
Volkswagen ID.3 Pro S770.275280
Volkswagen ID.4770.31245
Mercedes EQC 400800.345230
Porsche Taycan 4S Plus83.70.31270
Porsche Taycan Turbo83.70.34245
Audi e-tron Sportback86.50.375230
Publisher’s Note: MDPI stays neutral with regard to jurisdictional claims in published maps and institutional affiliations.