Article

Modeling of the Off-Grid PV-Wind-Battery System Regarding Value of Loss of Load Probability

1
Public Institution County Development Agency of Osijek-Baranja County, 31000 Osijek, Croatia
2
Vodovod Osijek d.o.o., 31000 Osijek, Croatia
3
Faculty of Electrical Engineering, Computer Science and Information Technology, Josip Juraj Strossmayer University of Osijek, 31000 Osijek, Croatia
*
Author to whom correspondence should be addressed.
Energies 2022, 15(3), 795; https://doi.org/10.3390/en15030795
Submission received: 7 December 2021 / Revised: 16 January 2022 / Accepted: 20 January 2022 / Published: 22 January 2022
(This article belongs to the Special Issue Microgrid Design and Operation for Carbon Emission Reductions)

Abstract

:
The paper presents an optimized off-grid photovoltaic (PV)-wind battery model that considers the value of loss of load probability (LOLP). The optimum combination of all model components: wind turbines, PV panels, batteries and electrical load for the City of Osijek using MATLAB software is defined. The examined data are based on measured load values for the residential home. For values of LOLP in the range from 0.00 to 0.10 in steps of 0.01, optimal size of the presented system has been determined. In order to determine the optimal model, investment costs were taken into account in comparison with various LOLP values.

1. Introduction

The utilization of fossil fuels in generating electricity is not only depleting reserves of fossil fuels, but also causes greenhouse gases emissions and increases global warming. Renewable energy sources (RES) can play an important role in reducing the usage of fossil fuels and provide cleaner air, lower carbon emissions and cost savings. The use of RES in electricity production and their share in energy consumption increases every day. According to [1], total capacity of renewable energy without hydropower capacity, in 2020 was 1694 GW. The 2020 Off-Grid Solar Market Trends Report [2] finds that 420 million people had gained access to basic residential electricity services through the use of renewable technologies, mainly solar PV lighting systems and home PV systems.
Electricity is a crucial for poverty alleviation, economic growth and improved living standards, especially the access to cleaner and affordable energy options which is the key in improving the existence of poor countries and countries in development. According to IEA [3], in 2019 there are 771 million people worldwide who do not have access to electricity, especially in rural areas. Many rural areas worldwide need electrical supply due their remote areas and resulting significant expense of electrical infrastructure. A key in helping deliver affordable electricity in such areas are small-scale off-grid hybrid electric system consisting of small wind system and home PV systems. However, due to unpredictable nature of RES such as wind and solar, the essential in designing an off-grid hybrid system is to find an optimal system size considering reliability and costs, and supply to the load becomes fulfilled at any given time.
Elbaz and Güneşer in [4] presented a new approach to sizing the stand-alone offshore wind-powered hybrid PV using crow algorithm for optimizing. Moghaddam, Bigdeli, Moradlou and Siano [5] used this algorithm, considering the reliability index for improving the load supply.
There is a lot of research related to optimization and modelling of an off-grid hybrid energy systems using some determinant factors. In [6,7], authors designed a hybrid PV-wind system using HOMER (microgrid software by HOMER Energy, Boulder, USA) with focus to achieve low net present cost (NPC) and cost of energy (COE) with reduced carbon emissions, but also in [7], with taking into account operating cost. Another hybrid PV-wind system optimization considering NPC, COE, renewable fraction, local load demand, availability of renewable energy resources, system economics and greenhouse gas emissions is presented in [8]. In [8], in addition to minimizing the system life-cycle costs, the authors also took nominal discount rates into account. Abaye and Paliwal in [9] presented techno-economic simulation and feasible analysis of system standalone hybrid PV-wind system using diesel and storage battery as a back up to get a best feasible optimized system. Authors in [10] used HOMER to design a technical and economical feasible standalone/hybrid (PV/Wind/Diesel/Battery) off-grid system bringing out the advantageous effect of hybrid systems on social and economic life of rural people. In [11] authors compared and analyzed different combinations of energy resources including solar, wind, hydro, and diesel in optimal designing of a hybrid power system while taking into cognizance the constraints of environmental pollutant emission. In [12], authors described modelling and simulation of the switching mechanism of an off-grid hybrid system with storage batteries. In [13], authors presented optimal energy management for off-grid hybrid system using hybrid optimization technique and taking into account load responsiveness. In [14], authors presented a PV-system model that has battery storage in order to help investors in deciding on the optimal combination of system components, taking into account price of components and LOLP.
The paper presents optimized off-grid PV-wind battery model considering value of loss of load probability (LOLP). So, the advantage of this model is existence of one additional RES, i.e., wind turbine, so it enables one to find the best combination of PV panels, batteries and wind turbines in respect to investment cost and LOLP, but also the model takes into account limitation regarding battery charging and discharging power.
This paper is divided into 4 sections. Introduction is presented in the first section. The second section contains description of the presented off-grid PV-wind battery system. The results and discussion related to the presented model are contained in the third section of the paper. The paper’s conclusions are presented in the fourth section.

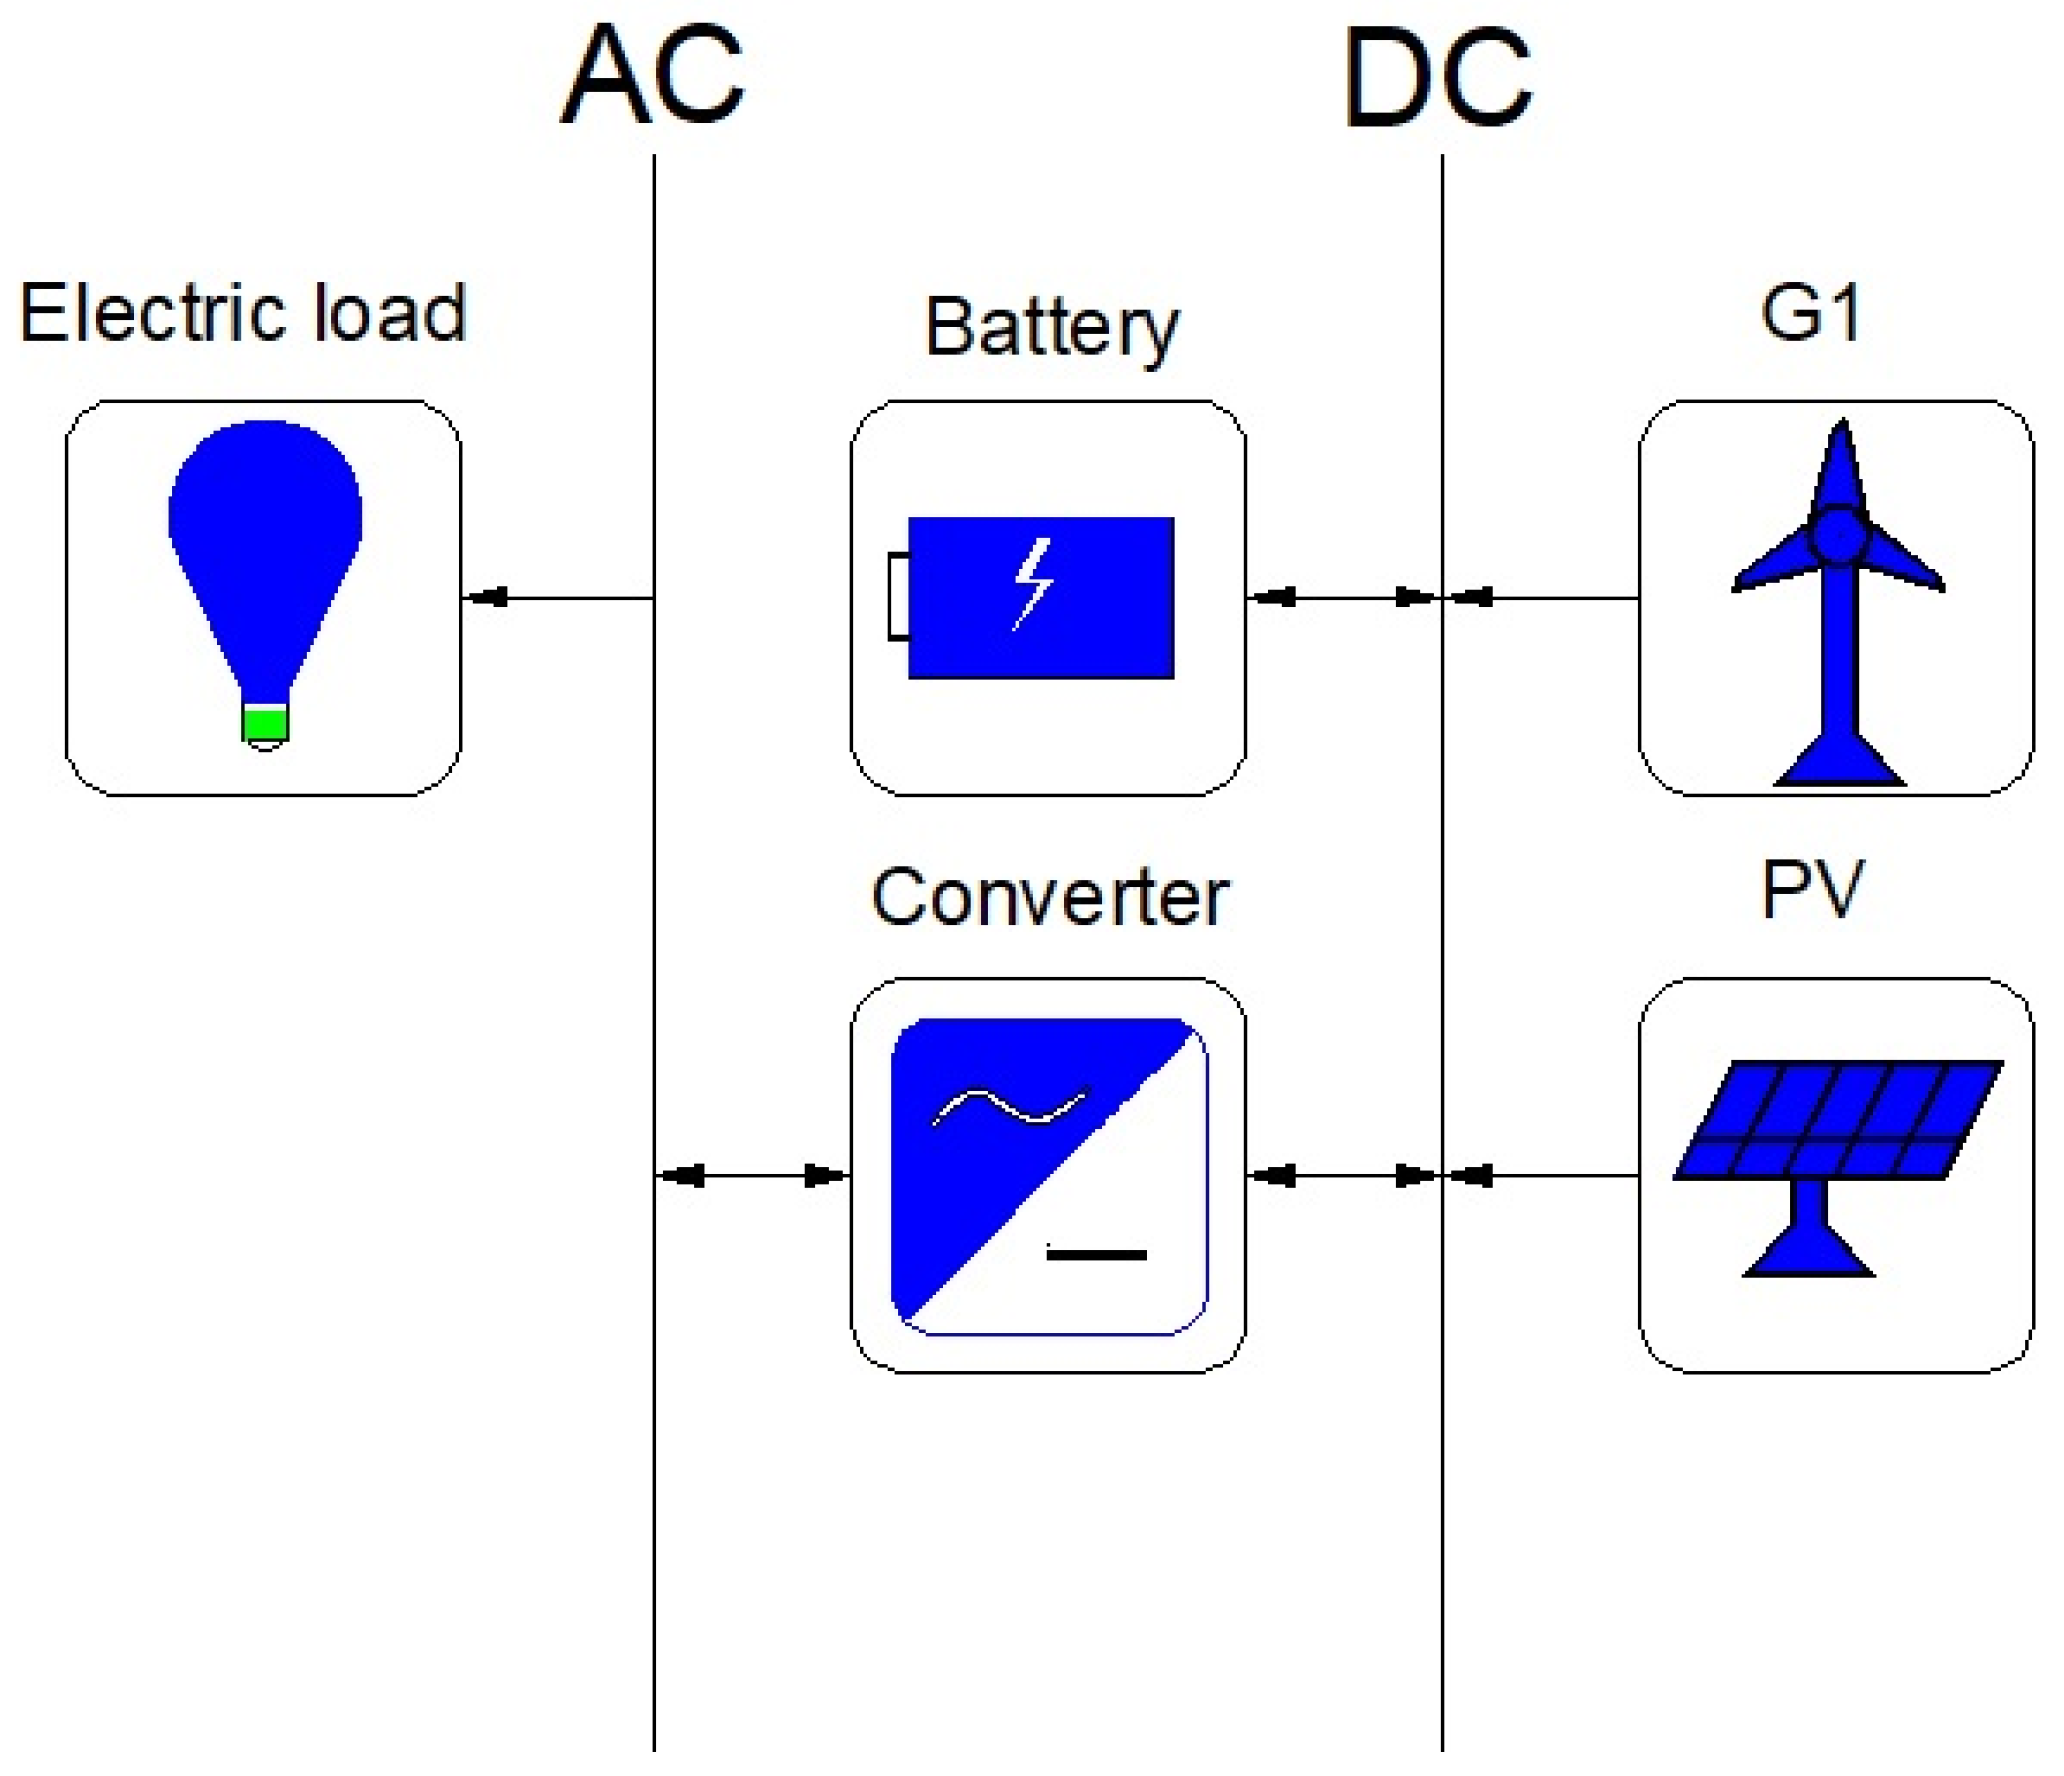
2. Model Description

The model presented in the paper is suitable for the determination of the best combination of the hybrid off-grid system components: small wind turbine, home PV system, batteries and electrical load. The model is designed to determine the best combination of all system components for the particular load profile, taking into account peak load demand of the system, LOLP values and all price components in order to achieve the minimum investment. LOLP can be defined as a measure of the probability of where in the system there will be a shortage of power and is usually expressed in terms of days per year, hours per day or as a percentage of time [15].
The advantage of the model designed in this paper is that it can be used for the determination of the optimal numbers of system components, taking into account any wanted time period. Figure 1 presents a developed structural diagram that shows how models can determine the best combination of all system components, their workflows and processes, taking into account LOLP values.
Respecting the logical behavior and work of the structural diagram of the model presented in the Figure 1, several mathematical expressions were used in order to calculate the best combination of all system components, taking into account various LOLP values and investment costs that could be determined. To calculate total electricity produced from PV panels for time t, which represents one hour, the following equation can be used Equation (1):
P pv ( i , t ) = G ( t ) × A m × i × η
where:
  • PPV (W)—PV system output power;
  • G(t) (W/m2)—solar irradiance;
  • Am (m2)—PV panel area;
  • i—number of PV panels;
  • η—PV panel efficiency.
To calculate total electricity produced from one wind turbine for time t, the following equation can be used Equation (2):
P wone ( t ) = ( A + ( B × v ( t ) ) + ( C × v 2 ( t ) ) ) × P r
where:
  • Pwone (t) (W)—wind turbine output power.
  • A, B, C—coefficients determined according to Equations (3)–(5).
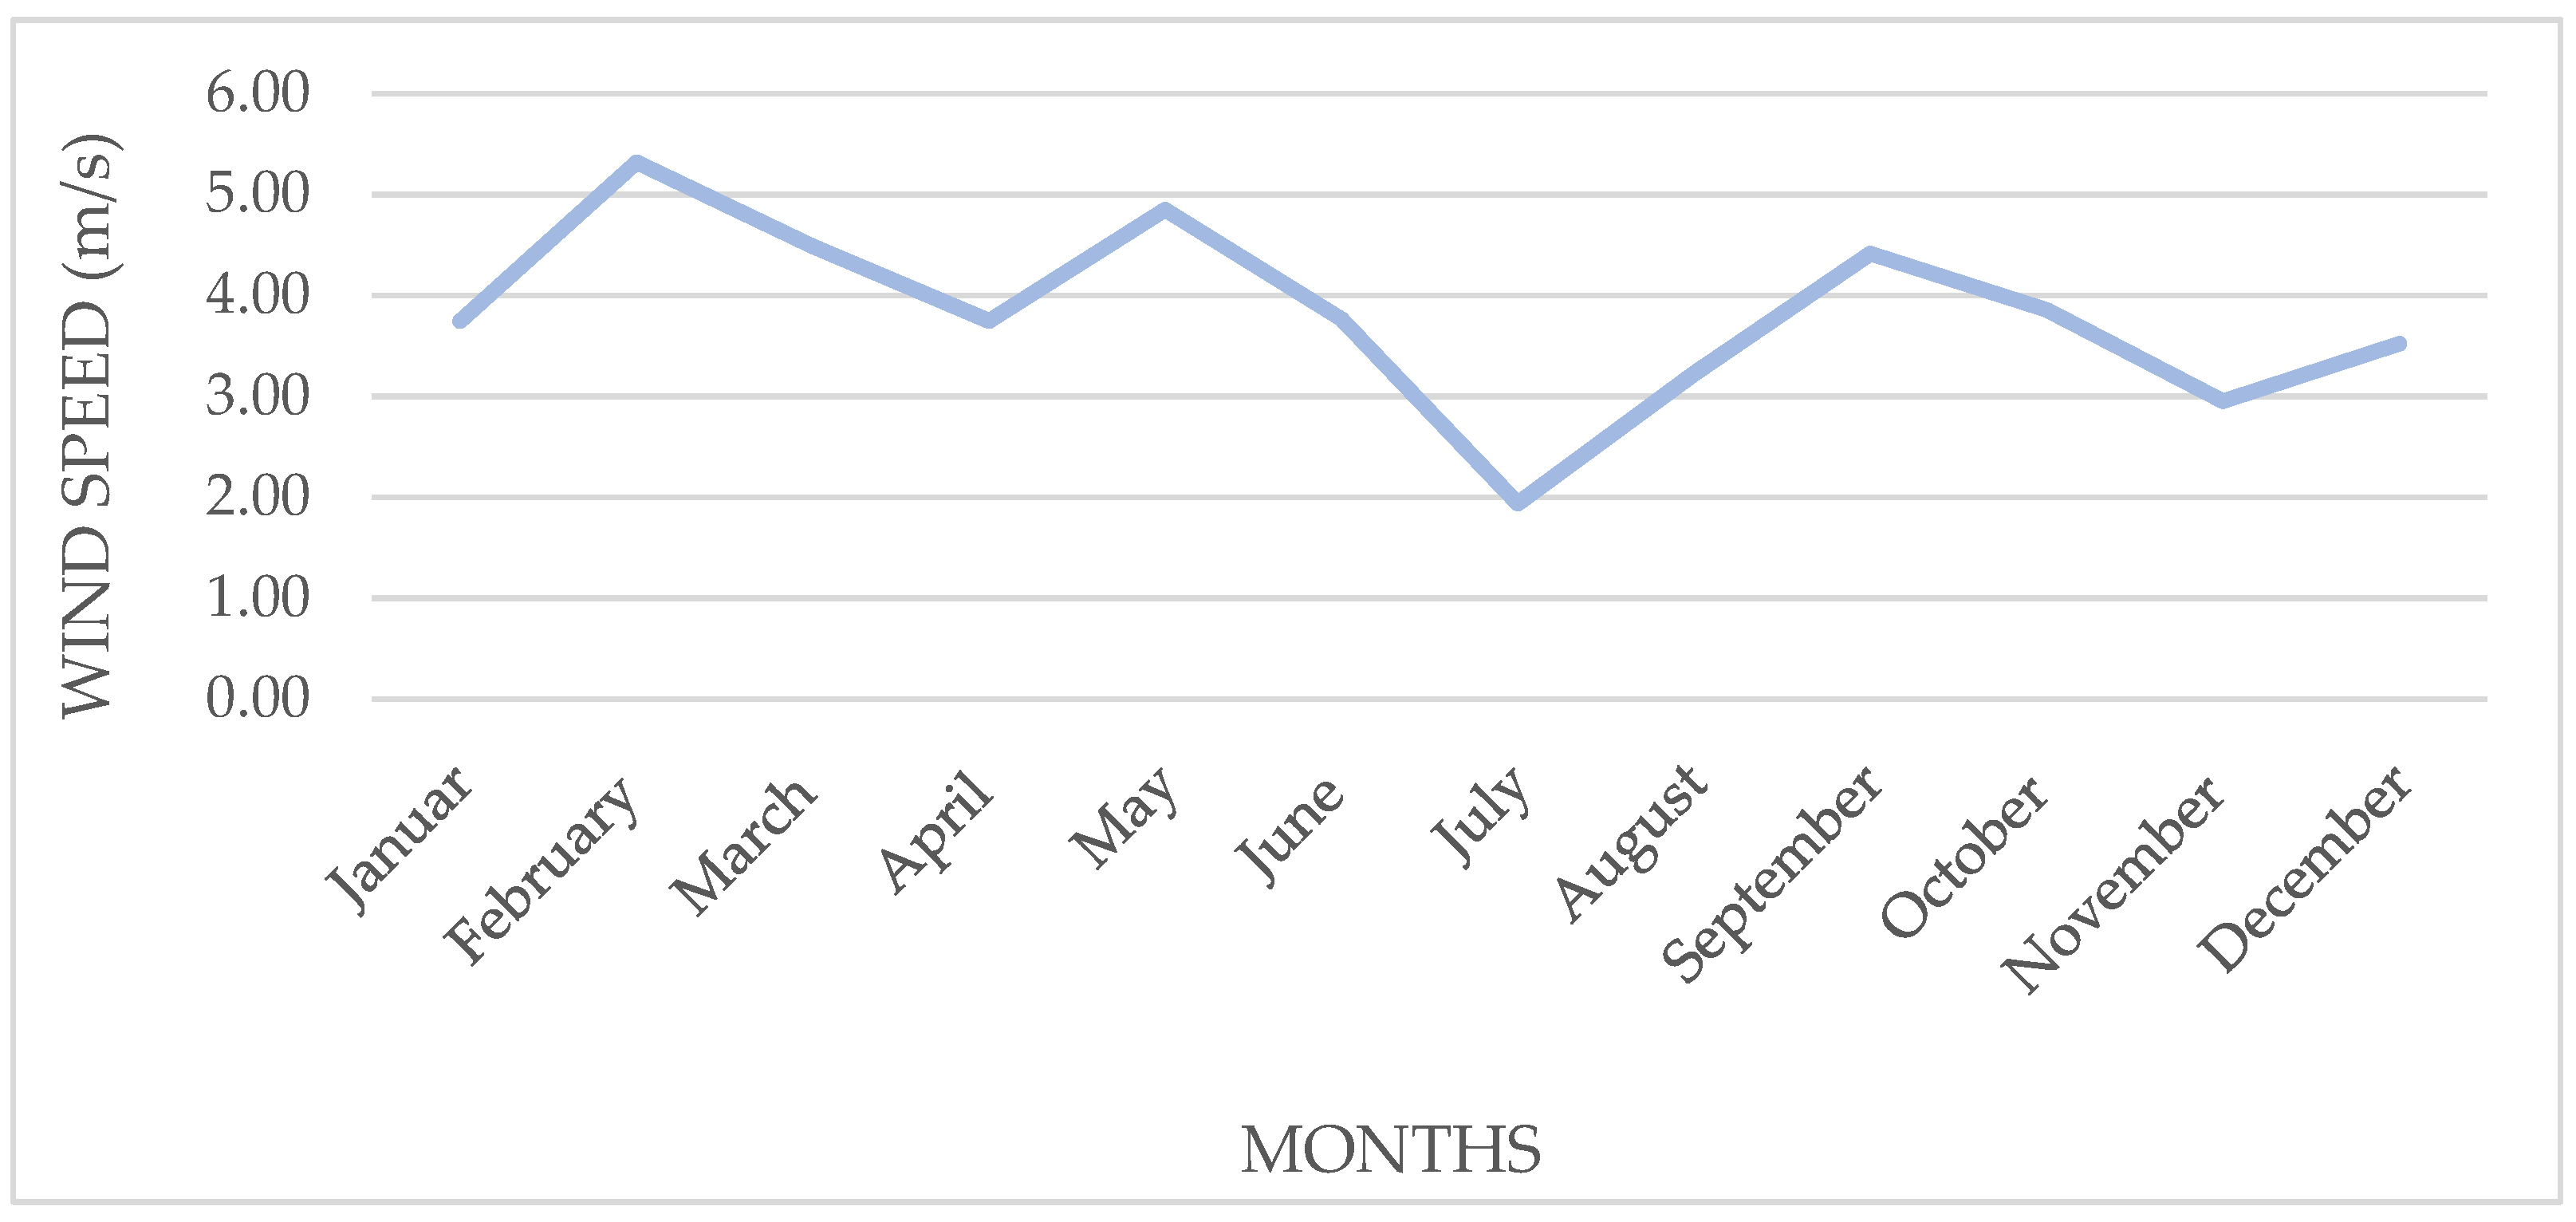
  • v(t) (m/s)—wind speed in hour t.
  • Pr (W)—rated power of wind turbine.
Coefficients A, B, C is defined as Equations (3)–(5):
A = ( 1 ( v c i v r ) 2 ) × ( v ci   × ( v ci + v r     ) 4 × v ci   × v r     × ( v ci + v r     2 × v r     ) 3 )
B = ( 1 ( v c i v r ) 2 ) × ( 4   × ( v ci + v r     ) × ( v ci + v r     2 × v r     ) 3 ( 3 × v ci + v r     ) )
C = ( 1 ( v c i v r ) 2 ) × ( 2 4   × ( v ci + v r     2 × v r     ) 3 )
where:
  • vci (m/s)—minimal wind speed necessary for wind turbine production
  • vr (m/s)—operating wind speed for wind turbine production
Maximum and minimum capacity of batteries, and initial battery capacity is defined as Equations (6)–(9):
            C bmax     ( j ) = C bmax , one   × j
C bmin , one   ( j ) = C bmax , one   ( j ) × δ
C bmin   ( j ) = C bmin , one   ( j ) × j
C start   ( j ) = C startone × j
where:
  • Cbmax,one (Wh)—maximum capacity of one battery,
  • Cbmin,one (Wh)—minimum remaining capacity of one battery,
  • j—number of batteries,
  • δ (Wh)—coefficient setting the minimum remaining battery capacity,
  • Cstartone (Wh)—full charged battery at initial state.
To calculate the difference between load, PV system output power and wind turbine output power in time t, which represents one hour, can be used following Equation (10):
D ( i , w , t ) = L o a d ( t ) P pv ( i , t ) P w ( w , t )
In order to include power limits of charging and discharging of the battery, additional variable Db(i,w,t) is introduced. The value of the Db(i,w,t) is determined according to Equation (11):
D b ( i , w , t ) = D ( i , w , t )
Two conditions are set, if deficit is higher than battery discharging power (Pbat,disch) (12); and if surplus is higher than battery charging power (Pbat,ch)(13):
(a)
if D ( i , w , t ) > P bat , disch   × j
D b   ( i , w , t ) = P bat ,   disch   × j
(b)
if D ( i , w , t ) < P bat , ch   × j
D b   ( i , w , t ) = P bat , ch   × j
For the the first hour of the simulation period, variable Z(i,j,w,t) is determined with Equation (14) and three logical tests are examined with Equations (15)–(19):
Z ( i , j , w , t ) = C start ( j ) D b ( i , w , t )
1. 
if Z ( i , j , t ) < C bmin ( j )
C bat ( j , t ) = C bmin ( j )
D i f f ( i , j , w , t ) = D ( i , w , t ) ( C start ( j ) C bat ( j , t ) )  
where:
  • Cbat(j,t) (Wh)—battery capacity for a number of batteries j at the end of hour t
  • Diff(i,j,w,t) (W)—power deficit in hour t for all system components: PV panels i, batteries j and wind turbines w.
2. 
if Z ( i , j , w , t ) C bmin (j) and Z ( i , j , w , t ) C bmax ( j )
C bat ( j , t ) = Z ( i , j , w , t )
D i f f ( i , j , w , t ) = D ( i , w , t ) ( C start ( j ) C bat ( j , t ) )
3. 
if Z ( i , j , w , t ) C bmax ( j )
C bat ( j , t ) = C bmax ( j )
For each hour after first hour of simulation period, variable Z(i,j,w,t) is determined with Equation (20) and then again three logical tests are examined with Equations (21)–(25):
Z ( i , j , w , t ) = C bat ( j , t 1 ) D b ( i , w , t )
(a)
if Z ( i , j , w , t ) < C bmin ( j )
C bat ( j , t ) = C bmin ( j )
D i f f ( i , j , w , t ) = D ( i , w , t ) ( C bat ( j , t 1 ) C bat ( j , t ) )
(b)
if Z ( i , j , w , t )   C bmin ( j ) and Z ( i , j , w , t )   C bmax ( j )
C bat ( j , t ) = Z ( i , j , w , t )
D i f f ( i , j , w , t ) = D ( i , w , t ) ( C bat ( j , t 1 ) C bat ( j , t ) )
(c)
if Z ( i , j , w , t ) > C bmax ( j )
C bat ( j , t ) = C bmax ( j )
For a particular combination of all system components: PV panels i, batteries j and wind turbines w, LOLP(i,j,w) is determined with the following Equation (26):
L O L P ( i , j , w ) = t = 1 n D i f f ( i , j , w ) t = 1 n Load t
The LOLP(i,j,w) variable acquired for the tested i, j and w is searched for values smaller than specified LOLPSET. LOLPSET arbitrarily determined, in the range of 0.00 to 0.1 (0% to 10%) in steps of 0.01.
If LOLP(i,j,w) ≤ LOLPSET the price of the system can be determined with the following equation:
        C O S T ( i , j , w ) = ( i × P module × P V COST ) + ( j × C bmaxone × B A T COST ) + ( w × P r × W COST )
where:
  • Pmodule (W)—rated power of the PV module.
  • PVCOST (EUR)—investment cost of PV system per W including all costs related to installation of PV system.
  • BATCOST (EUR)—investment cost of battery per Wh including all costs related to installation of the battery.
  • WCOST (EUR)—capital cost of wind turbine per W.
COST (i,j,w), which determined the minimal value, can be considered as a cheapest system that contains various number of PV panels i, number of batteries j and number of wind turbines w due to a wanted LOLP value that an investor is willing to accept.

3. Results and Discussion

In this chapter, results of the presented model are shown. The system is hybrid and it contains: electrical load, batteries, converter and two energy sources: wind turbines and PV system. Figure 2 presents a hybrid off-grid system scheme with wind turbines and PV system as energy sources.
According to Figure 2, the first step in modelling an off-grid PV system is to define an electrical load. To determine the load diagram for the model, optimization of the data provided, pertaining to an electrical load, were measured in a house in Osijek. Figure 3 presents load diagram, which refers to average hourly load measured during one year.
In order to model an off-grid PV-wind system, the second step is to determine the amount of solar irradiance and wind speed for the chosen location. Table 1 shows data regarding amount of solar irradiance that is provided from PV GIS and calculated for daily profile of the irradiance.
Data regarding wind speed for chosen location in Osijek was provided in accordance with [17] and calculated for period of one year. Figure 4 shows average wind speed during one year for Osijek.
In Table 2. all the characteristics of hybrid off-grid system components: PV module, battery and wind turbine are shown.
Optimization of the presented off-grid model is based on period of one year. The decrease in time of the yields of the off-grid system components in accordance with manufacturers is 20% in a period of 20 years. Due to that, every year, the efficiency and the production of the system will decrease by 1%.
Investment costs for various system components: PV system cost, wind turbine cost, and battery cost are presented in Table 3. All investment costs are presented as realistic market costs according to [18,19]. Specific characteristics of all-system components presented in Table 2, as well as the investment costs for those system components presented in Table 3, are used in the process of determination of the optimal size of the presented system. PVCOST implies installation cost and inverter cost.
To determine the best combination of all-system components: PV panels, wind turbines and batteries considering peak load demand, the model is taking into account various LOLP values and investment costs presented in Table 3. The following LOLP values are considered into calculation: 0.00, 0.01, 0.02, 0.03, 0.04, 0.05, 0.06, 0.07, 0.08, 0.09, 0.10. Results from the calculation and relation of investment costs of all-system components in respect to various LOLP values are shown in Figure 5.
From Figure 5, as can be seen when the LOLP is low, investment cost of the system is higher, which is to be expected. For the location of the City of Osijek, where wind is not a significant factor, it is surprising that, in the range from 0 to 0.01 LOLP value, the investment costs of the system consisting of wind turbines are lower than the system consisting of only PV. Moreover, it can be concluded that a significant increase in investment costs for LOLP equals 0 when a system without a wind turbine is chosen, compared to a system with a wind turbine.
The steepest point in the curve is in the range of 0 to 0.03 LOLP value, while the milder slope of the curve is in the range of 0.03 to 0.1 LOLP value. Due to this, there is a question as to whether it pays to sacrifice higher LOLP values for small savings in the investment cost. The decision regarding relation in LOLP values and investment cost is crucial only if the investment cost is the deciding factor. It is certainly profitable to implement a system with a hybrid power supply. In addition to the fact that hybrid systems provide independence from one renewable source, the investment cost in the range of 0.01 to 0.1 LOLP value is much lower in comparison to a system with only PV, while the difference in investment cost after 0.03 LOLP value is insignificant.
Table 4 shows the combination of PV modules and batteries in respect to different values of LOLP in the range of 0.00 to 0.1 and investment cost of the PV-battery system, without wind turbine.
Due to fact that the presented model is designed for the residential home, investment cost and LOLP values are not the only limiting factors in the decision while designing. The orientation and surface of the roof, but also the battery storage space, can limit the number of PV panels and batteries.
Table 5 shows the combination of PV modules, batteries and wind turbines in respect to different values of LOLP in the range of 0.00 to 0.1 and investment cost of the hybrid PV-wind battery system.
Due to designing a model for the residential home, the number of wind turbines in all combinations is reduced to one. Although the number of wind turbines in the simulation was set at 4, it is understandable that one low energy balance facility such as a residential home does not need a high amount of energy. Wind turbines are assumed to have a power of 2 kW and their estimated price of 2000 EUR significantly affected investment cost in combination with several wind turbines. In both Table 4 and Table 5, the most profitable combination of PV modules, batteries and wind turbines in respect of different values of LOLP are presented.
Profitability of investment regarding both scenarios—investment in PV-battery system and investment in PV-wind-battery system—is shown in Figure 6.

4. Conclusions

An optimized off-grid PV-wind battery model that considers the value of loss of load probability (LOLP) and investment costs is described in this paper. This paper presents a developed model, including different RES for optimal size while considering different LOLP values in respect to investment costs. Moreover, the model is applicable regarding different optimization periods. To determinate the optimal size of the presented model, it is necessary to find the optimal combination of all-system components: PV modules, batteries, wind turbines, electrical load in respect to investment costs and LOLP. The model is designed for one residential home in the City of Osijek using MATLAB software. The best combination of all system components regarding profitability i.e., investment cost and range from 0.00 to 0.1 LOLP is presented. The results of the simulation showed that, by the value of 5000 EUR in investment cost in both scenarios (PV system with batteries and PV-wind battery system), it is the most profitable with the LOLP value of 0.03 if the investor decides to accept this LOLP value. With increasing LOLP values to a value greater than 0.03, influence in decreasing investment cost of the system is negligible. Direction of future works related to this topic could be in expanding methodology, considering implementing electric vehicles in cases when the power plant production is greater than the charging power of the batteries, so that the surplus production would not be rejected. In addition, the direction of future work could take into account the battery charge and discharge curve.

Author Contributions

Conceptualization, G.K. and D.T.; methodology, R.R.; software, R.R.; validation, V.G., R.R. and G.K.; supervision, D.T. and G.K. All authors have read and agreed to the published version of the manuscript.

Funding

This work was funded by the European Union through the European Regional Development Fund’s Operational Programme Competitiveness and Cohesion under project KK.01.1.1.04.0034 Connected Stationary Battery Energy Storage.

Institutional Review Board Statement

Not applicable.

Informed Consent Statement

Not applicable.

Data Availability Statement

Not applicable.

Conflicts of Interest

The authors declare no conflict of interest.

References

  1. Ren 21. Renewables 2020—Global Status Report. Available online: https://www.ren21.net/reports/global-status-report/?gclid=CjwKCAiAsaOBBhA4EiwAo0_AnKtyXj4lEvvXj3mjyjuIMxEsCjBMzpViq2iyLKBdkcyqMbre45VavxoC51IQAvD_BwE (accessed on 15 September 2021).
  2. Off-grid Solar Market Trends Report 2020 Report Summary. Available online: https://www.lightingglobal.org/wp-content/uploads/2020/02/14005VIV_OFF-GRID-SOLAR-REPORT-V13-Exec-Sum-AW4vis.pdf (accessed on 17 September 2021).
  3. IEA, Data and Projections. Available online: https://www.iea.org/reports/sdg7-data-and-projections/access-to-electricity (accessed on 21 September 2021).
  4. Elbaz, A.; Guneser, M.T. Using Crow Algorithm for Optimizing Size of Wind Power Plant/Hybrid PV in Libya. In Proceedings of the 2019 3rd International Symposium on Multidisciplinary Studies and Innovative Technologies (ISMSIT), Ankara, Turkey, 11–13 October 2019. [Google Scholar]
  5. Moghaddam, S.; Bigdeli, M.; Moradlou, M.; Siano, P. Designing of stand-alone hybrid PV/wind/battery system using improved crow search algorithm considering reliability index. Int. J. Energy Environ. Eng. 2019, 10, 429–449. [Google Scholar] [CrossRef] [Green Version]
  6. Azad, F.S.; Ahmed, I.; Hossain, S.R.; Tuhin, R.A. HOMER Optimized Off-grid Hybrid Energy System: A Case Study on Rohingya Relocation Center in Bangladesh. In Proceedings of the 2019 1st International Conference on Advances in Science, Engineering and Robotics Technology (ICASERT), Dhaka, Bangladesh, 3–5 May 2019. [Google Scholar]
  7. Raveena, B.; Rao, B.V.; Gouthamkumar, N. Optimization of Hybrid off Grid Power System Using HOMER software. In Proceedings of the 2018 3rd IEEE International Conference on Recent Trends in Electronics, Information & Communication Technology (RTEICT), Bangalore, India, 18–19 May 2018. [Google Scholar]
  8. Nurunnabi, M.; Roy, N.K.; Hossain, E.; Pota, H.R. Size Optimization and Sensitivity Analysis of Hybrid Wind/PV Micro-Grids- A Case Study for Bangladesh. IEEE Access 2019, 7, 150120–150140. [Google Scholar] [CrossRef]
  9. Abaye, A.E.; Paliwal, R.K. Simulation and Feasible Analysis of System Standalone PV-Wind Hybrid System for Rural Electrification. In Proceedings of the 2018 3rd IEEE International Conference on Recent Trends in Electronics, Information & Communication Technology (RTEICT), Bangalore, India, 18–19 May 2018. [Google Scholar]
  10. Nawaz, M.H.; Khan, M.U.; Zahra, A.; Ali, M.; Wazir, R.; Ullah, K. Optimal Economic Analysis of Hybrid Off Grid (Standalone) Energy System for Provincial Capitals of Pakistan: A comparative Study Based On Simulated Results Using Real-Time Data. In Proceedings of the 2018 International Conference on Power Generation Systems and Renewable Energy Technologies (PGSRET), Islamabad, Pakistan, 10–12 September 2018. [Google Scholar]
  11. Oladigbolu, J.O.; Ramli, M.A.M.; Al-Turki, Y.A. Feasibility Study and Comparative Analysis of Hybrid Renewable Power System for off-Grid Rural Electrification in a Typical Remote Village Located in Nigeria. IEEE Access 2020, 8, 171643–171663. [Google Scholar] [CrossRef]
  12. Khozondar, H.J.E.; Zainuddin, S.Z.B.; Koch, A.W. Switching mechanism for Off-Grid Hybrid Power System (Photovoltaic-Wind) with storage battery. In Proceedings of the 2019 IEEE 7th Palestinian International Conference on Electrical and Computer Engineering (PICECE), Gaza, Palestine, 26–27 March 2019. [Google Scholar]
  13. Asefi, S.; Ali, M.; Gryazina, E. Optimal Energy Management for Off-Grid Hybrid System using Hybrid Optimization Technique. In Proceedings of the 2019 IEEE PES Innovative Smart Grid Technologies Europe (ISGT-Europe), Bucharest, Romania, 29 September–2 October 2019. [Google Scholar]
  14. Topić, D.; Knežević, G.; Kosić, D.; Perko, J. Simplified Model for Optimal Sizing of the Off-Grid PV System Regarding Value of Loss of Load Probability. Teh. Vjesn. Tech. Gaz. 2018, 25 (Suppl. S2), 420–426. [Google Scholar]
  15. Pillai, N.V. Loss of Load Probability of a Power System. J. Fundam. Renew. Energy Appl. 2014, 5. [Google Scholar] [CrossRef] [Green Version]
  16. Raff, R.; Golub, V.; Perko, J. Comparative Analysis of an Off-grid PV System for Different Types of Batteries. Int. J. Electr. Comput. Eng. Syst. 2018, 9, 11–19. [Google Scholar] [CrossRef] [Green Version]
  17. Weather Underground. Available online: https://www.wunderground.com/history/daily/hr/osijek/LDOS/date/2020-1-31 (accessed on 28 November 2021).
  18. Šimić, Z.; Topić, D.; Crnogorac, I.; Knežević, G. Method for Sizing of a PV System for Family Home Using Economic Indicators. Energies 2021, 14, 4529. [Google Scholar] [CrossRef]
  19. Wind Technologies Market Report. Available online: https://publications.jrc.ec.europa.eu/repository/handle/JRC123138 (accessed on 27 November 2021).
Figure 1. Structural diagram of simplified model.
Energies 15 00795 g001
Figure 2. Hybrid off-grid system scheme.
Energies 15 00795 g002
Figure 3. Load diagram.
Energies 15 00795 g003
Figure 4. Average wind speed for Osijek.
Energies 15 00795 g004
Figure 5. Investment cost in respect to LOLP.
Energies 15 00795 g005
Figure 6. Profitability of investment regarding both scenarios.
Energies 15 00795 g006
Table 1. Solar irradiance for Osijek [16].
MonthsGHI (kWh/m2/day)
January1.09
February1.89
March2.70
April3.67
May5.02
June5.31
July5.56
August4.92
September3.59
October2.22
November1.24
December0.91
Table 2. Characteristics of hybrid off-grid system components.
PV ModuleBatteryWind Turbine
mono crystallinevoltage 12VPwone = 2000 W
Pmodule = 250 Wcapacity 160 Ahvmax = 20 m/s
η = 15.3%δ = 20%
Table 3. Costs of off-grid PV-wind battery system elements.
ComponentsCost
PVCOST770 EUR/kW
WCOST1000 EUR/kW
BATCOST140 EUR/kWh
Table 4. System with PV modules and batteries regarding LOLP and investment cost.
LOLPNumber of PV PanelsNumber of BatteriesInvestment Cost (EUR)
0.00535017,203
0.01333010,553
0.0219277437
0.0313215442
0.0412174690
0.0512144270
0.0611133937
0.0711113657
0.081283430
0.091183237
0.11173097
Table 5. Hybrid PV-wind battery system regarding LOLP and investment cost.
LOLPNumber of PV PanelsNumber of BatteriesNumber of Wind TurbinesInvestment Cost (EUR)
0.001243110,330
0.01121516410
0.02101215605
0.0391015132
0.048914800
0.059614572
0.068614380
0.077614188
0.087514048
0.0966 3995
0.165 3855
Publisher’s Note: MDPI stays neutral with regard to jurisdictional claims in published maps and institutional affiliations.

