1. Introduction
The West Siberian oil and gas-bearing basin contains about two-thirds of Russian oil reserves. The early Cretaceous Neocomian oil and gas complex (OGC) is the most important, both in reserves and oil production in the region, which includes more than 37% of Western Siberian oil reserves. Oil deposits, here, are characterized by a large size and relatively simple structure, however, their levels of depletion on average exceed 60%, and water cut is also very high—94% on average. Therefore, deposits of hard-to-recover oil (HTR reserves) are becoming increasingly important. HTR reserves are characterized by high-viscosity oil reserves, low-permeability reservoirs, undergas cap zones and oil rims, depleted deposits, non-conventional sources of hydrocarbons (shale reservoirs), and remoteness from infrastructure fields.
For each group, there are both their development challenges, i.e., the reasons for such reserves being hard to recover, and the scarcity of special technological solutions may also become the basis for classifying reserves as to HTR. Production of high-viscosity oil is complicated by low mobility in the formation, the difficulty of lifting it to the surface, and further transportation. These problems are solved using expensive technologies, such as injecting hot water or steam into the formation, using special heaters and progressive-cavity-pumps (PCPs).
The high-viscosity oil of Western Siberia is concentrated in the Pokur (PK) suite. The Pokur suite unites deposits of the Aptian, Albian, and Cenomanian strata and is represented by the interbedding of sandstone with siltstone and clay. The formation is characterized by the high lateral and vertical variation of the deposits, resulting in facies diversity [
1]. The Pokur suites are typical for detrital terrigenous rocks, which are the pore types of the reservoir. Sand reservoirs of the Cenomanian part of the formation are represented by almost unconsolidated rocks; Aptian/Albian rocks are more consolidated varieties. The reservoir properties of these rocks are rather high. The open porosity of sandstones may reach the value of 40, with permeabilities varying from 5 to 5000 mD. Therefore, oil production from these deposits is complicated by early water breakthroughs and advancing water cut of oil wells. In addition, oil reserves with high water cut are also regarded as hard-to-recover. Further development of depleted deposits requires addressing the high cost of the process, associated with a large amount of water recovered together with oil. Reduction of water cut by 1% allows reducing the operational expenses for oil production by 15% [
2].
Various chemicals are commonly used in enhanced heavy oil recovery or its inflow stimulation processes [
3,
4,
5,
6]. However, polymers, surfactants, and alkali are the most popular chemicals for these processes, which is the main laboratory-based studies’ [
7,
8] and industrial implementation. The technology of increasing oil recovery by polymer injection has been applied since the late 1960s, and currently, there are more than 300 watering projects in the world [
9,
10,
11,
12], of which only a few are from Russia [
13,
14]. At the same time, it should be noted, that polymer flooding is more often used as a tertiary method of production (i.e., after the traditional flooding), its application in new fields shows the best results, confirmed by pilot tests in the Pelikan Lake field [
15]. Efficiency is achieved not only from the economic and technological viewpoints but also enables the implementation of environmentally safe management methods at the early stages of development, reducing adverse environmental impact [
16]. It should be noted that there are also other high-viscosity oil production polymer-flooding-based methods [
17,
18,
19,
20] have also proven successful in various geological and physical conditions. However, their use at the studied facilities requires additional research in terms of laboratory studies both for compatibility with formation fluids and rocks and for evaluation of the efficiency of displacement on cores of the test platform.
Therefore, we propose to consider polymer-flooding technology with the purpose of prevention of early water cut in wells and increased final oil recovery in beds containing high-viscosity oil.
To achieve this objective, the important tasks are as follows.
Analysis of the geological features of formation occurrence, formation fluid properties, and composition, as well as history and dynamics of field development. These measures allow for proper analysis of the causes of early water breakthrough [
3].
Evaluation of acceptable water content for the specific phase of its operation.
One-dimensional mathematical modeling to confirm preliminary process efficiency.
Preliminary economic assessment of technology implementation.
Conducting laboratory works on dynamic adsorption of polymers and relative permeability gain.
Hydrodynamic modeling based on the results of the laboratory polymer studies for the PK formation conditions.
In this research, we focused on tasks 2–6 because, based on the results of industrial experiments, it was concluded that the Pokur suite is suitable for the application of this technology. For example, at the East Messoyakha field, polymer flooding was performed during the development of PK
1-3 formation [
21]. This reservoir is characterized by oil viscosity of 110 cP and high heterogeneity for permeability from 5 to 5000 mD. For the first time in a cold climate the technology was successfully implemented with the following results.
More than 10% of pore volume was injected;
The production gain during the entire pilot period was 17,200 tons or 43 tons of oil per polymer ton
Cost efficiency of the project was proven.
After taking into account the bed features at the first pilot project, the following results were obtained on another object of PK formation at East-Messoyakha field [
22]:
production gain over the entire pilot period was 13,176 tons or 59 tons per injected polymer ton;
reduction of growth of water cut increase due to displacement front alignment;
NPV from the implementation of the pilot project amounted to 70.4 million RUR and PI = 2.09;
sensitivity analysis showed that the minimum production gain per ton of polymer injected was 29 tons.
During the presented pilot project, all the objectives were achieved [
23] and, therefore, the replication of this technology in the PK
1-3 formation is possible.
One of the most important characteristics to be taken into account in justifying polymer flooding technology is the retention of polymer solutions. The phenomenon of polymer holding may be caused by the three main mechanisms: mechanical capture, hydrodynamic holding, or adsorption [
24,
25].
At a low velocity (which is typical for high-viscosity compositions) and when permeable channels are present, the main mechanism of polymer retention is the process of adsorption by rock [
26]. Polymer adsorption by rock pores results in the loss and reduction of active concentration, thereby reducing the viscosity of the operating agent, which leads to additional polymer expenses and, as a result, reduces the economic feasibility of enhanced oil recovery methods.
Polymer adsorption depends on several of factors, such as thermobaric conditions in the formation, rock mineralogical composition, reservoir properties, type and properties of formation and injected fluids, etc. At the same time, the polymer adsorption will also influence its characteristics (chemical composition, molecular composition, degree of hydrolysis), e.g., with increased molecular weight its adsorption increases [
26].
Studying the adsorption process and calculating the numerical value of dynamic adsorption is an integral part when justifying polymer flooding technology. There are three main methods of dynamic adsorption determination worldwide [
27], each having its disadvantages and advantages:
- (1)
Large slug retention method;
- (2)
Multiple slug retention method;
- (3)
Recycle method.
In practice, the first and second methods are the most applicable ones, which differ in terms of inaccessible pore volume (IPV). Opinions of the scientific community on the need to evaluate this factor differ, which is discussed in more detail in the study [
28].
This article proposes an integrated approach to increasing the production efficiency of high-viscosity oil from heterogeneous beds and to increasing the water-free operation of wells. The integrated approach consists of developing polymer flooding, taking into account several criteria:
Process efficiency—evaluation of increase of oil recovery factor, evaluation of water-free time of operation, evaluation of additional recoverable oil.
Economic efficiency in using current exchange rates, oil prices and taking into account specified prices of the proposed region by items of operational expenditures (electricity, personnel expenses, etc.);
Ecological efficiency—a record of water cut impact on emissions, which is especially relevant taking into account the carbon tax introduction.
The development of optimal polymer compositions for the Pokur suite conditions and their implementation in Western Siberian reservoirs should result in:
Additionally, polymer flooding has proven to be a high-technology and environmentally safe method of formation stimulation, confirmed by a long history of its commercial application and proven effectiveness. The most frequently used polymer for injection is partially hydrolyzed polyacrylamide (HPAM), used mainly in powders and emulsions [
30]. These substances have no hazard class, are easily separated from produced hydrocarbons, and are subject to complete degradation over time.
As environmentally safe chemistry, polyacrylamide is applied not only in the oil production industry but also for water treatment, including potable water, mineral fertilizers, in medicine and cosmetology.
In addition, there is a certain increase of interest in polymer flooding recently due to its environmental effect of reducing CO
2 emissions during energy development. The point, here, is that on the fields with high water cut the energy spent on water circulation is accompanied by massive CO
2 emissions, and when the polymer flooding is implemented, the volume of injected and produced water is significantly reduced, thus reducing CO
2 [
31] emissions.
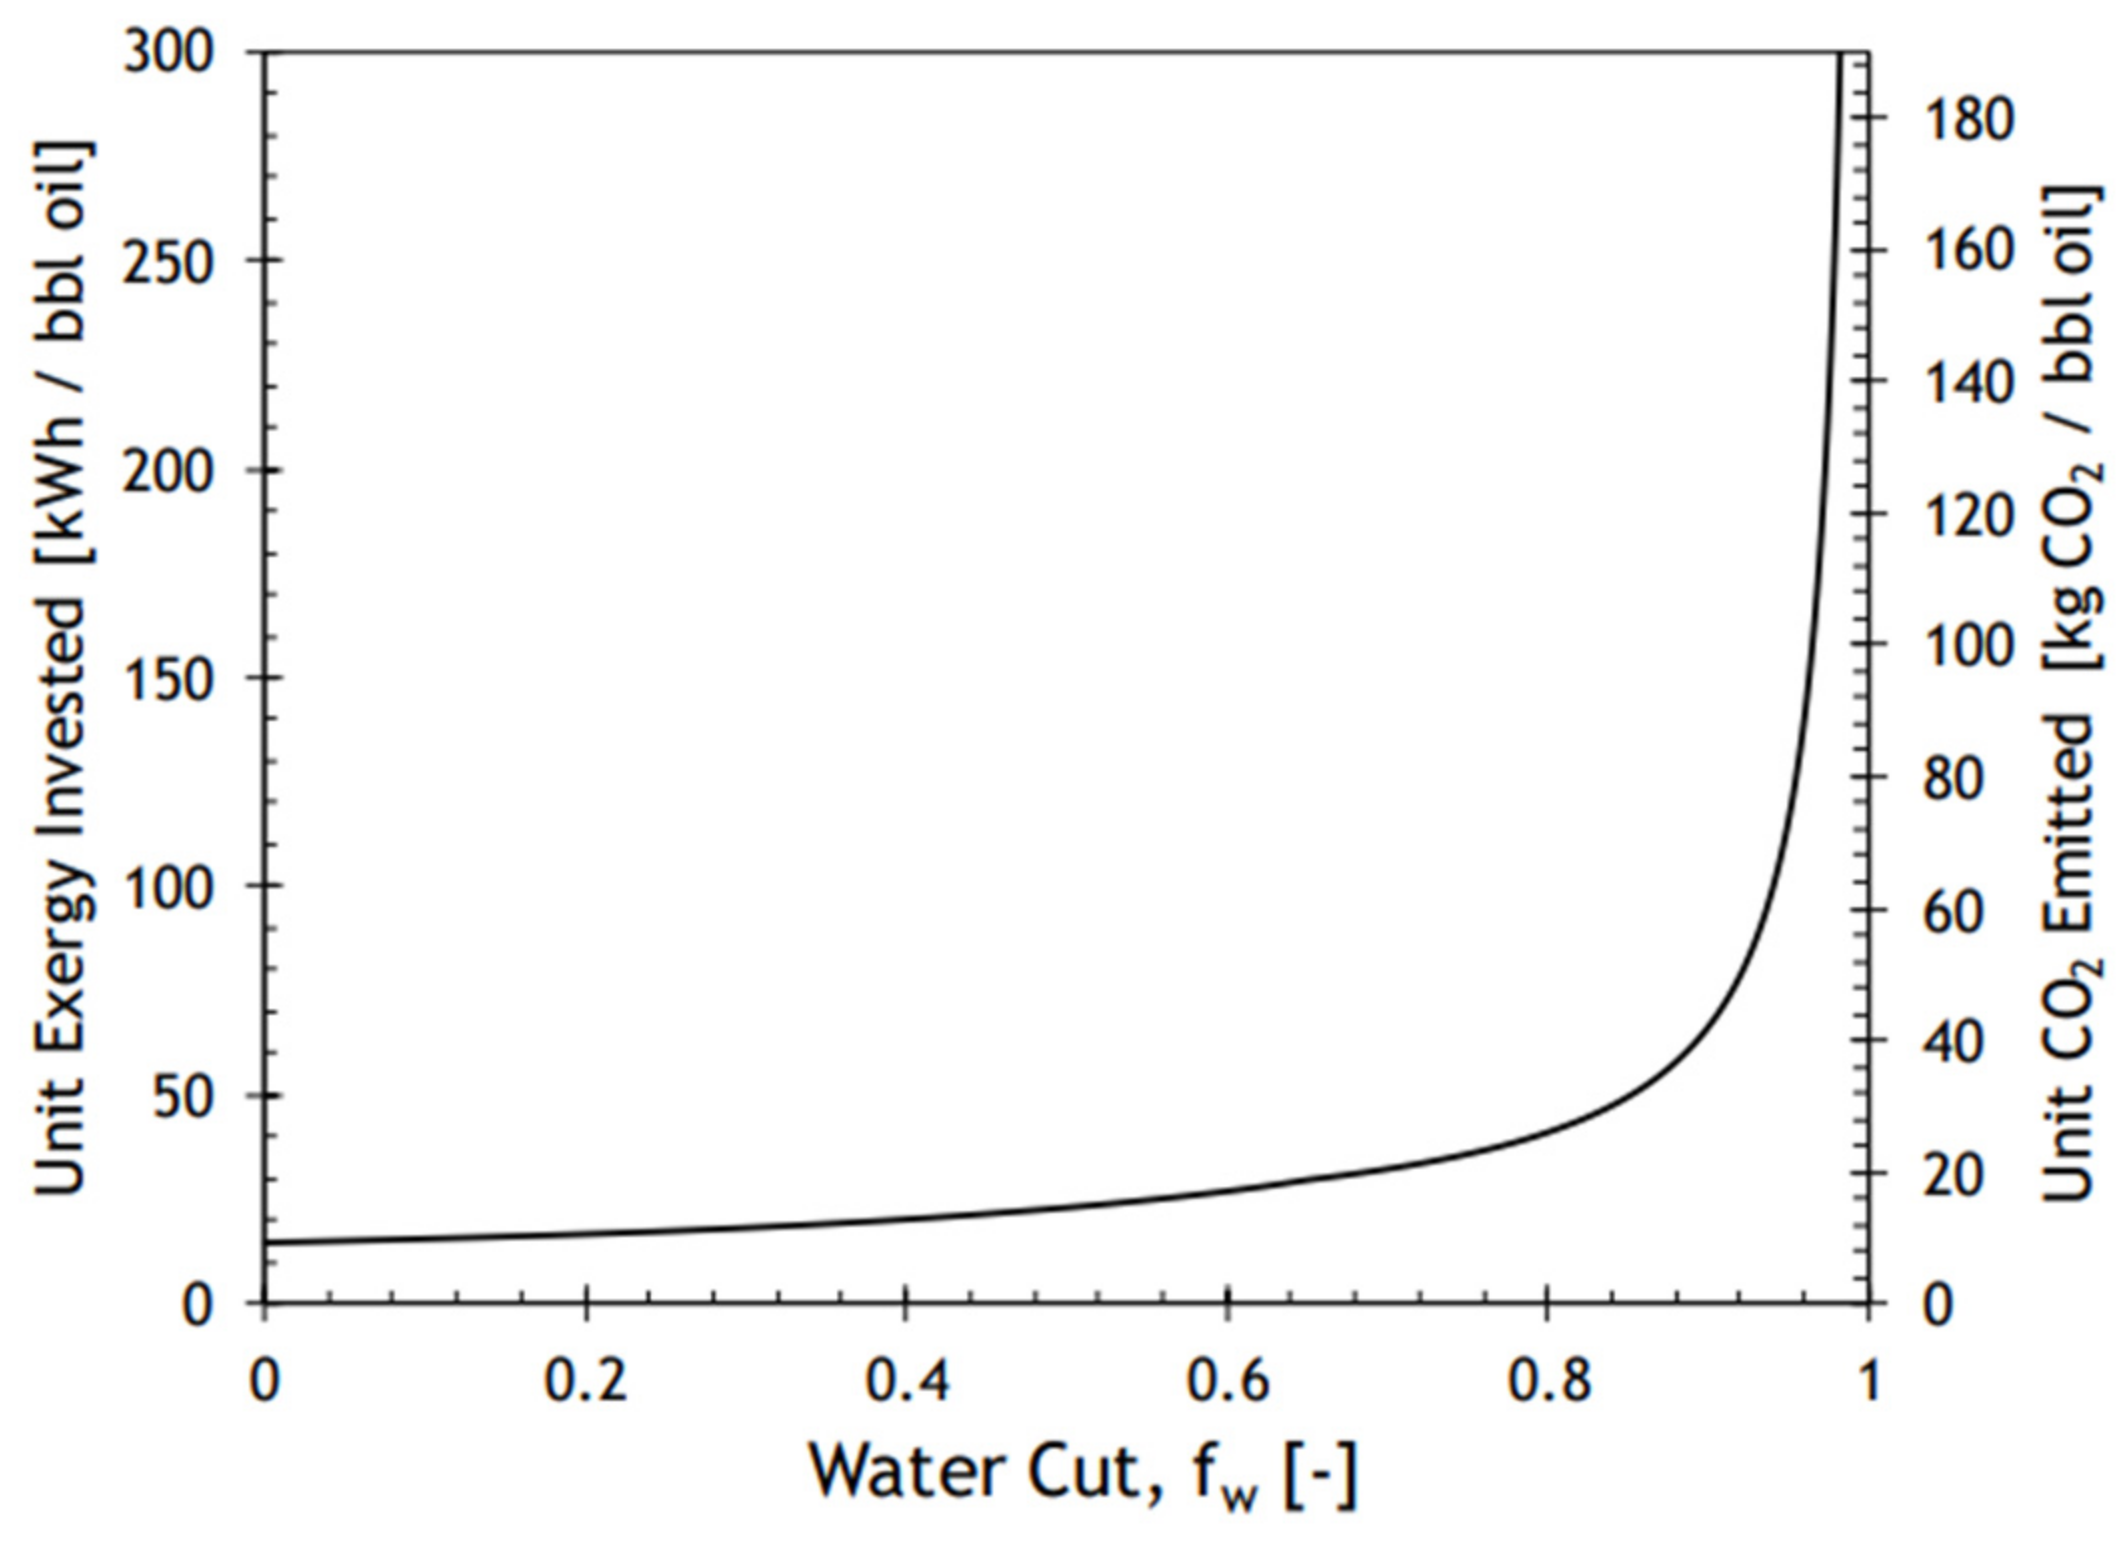
For example, Farajzadeh et al. [
32] observed a significant increase in CO
2 emissions when the water cut reached or exceeded 90%.
Figure 1 shows CO
2 emissions vs. well water cut.
Great attention is also related to the imposition of carbon tax, which is charged to companies burning fuel for power generation [
33]. Therefore, the world’s environmental situation is increasingly leading to green technologies, one of which is polymer flooding [
34].
Furthermore, in case of accidental spills, the existing water treatment processes are highly effective in the chemically induced removal and degradation of polyacrylamide. A recent review [
35] highlighted that traditional techniques based on ozone, chlorine, and membrane processes are suitable. Other approaches include coagulation/flocculation treatment with aluminum and iron salts; oxidation by peroxide, per-sulfate, hypochlorite, and permanganate; the Fenton reaction with hydroxyl radicals generated by ferrous iron and hydrogen peroxide; and biological treatment by membrane bioreactors, biologically active filtration, or conventional activated sludge. Thus, by applying environment-friendly polymers [
36], the industry contributes to the UN Goal 6 on clean water and sanitation. We believe this is a way towards more sustainable environmental and natural resource management—through the best practices of enhanced oil recovery.
2. Materials and Methods
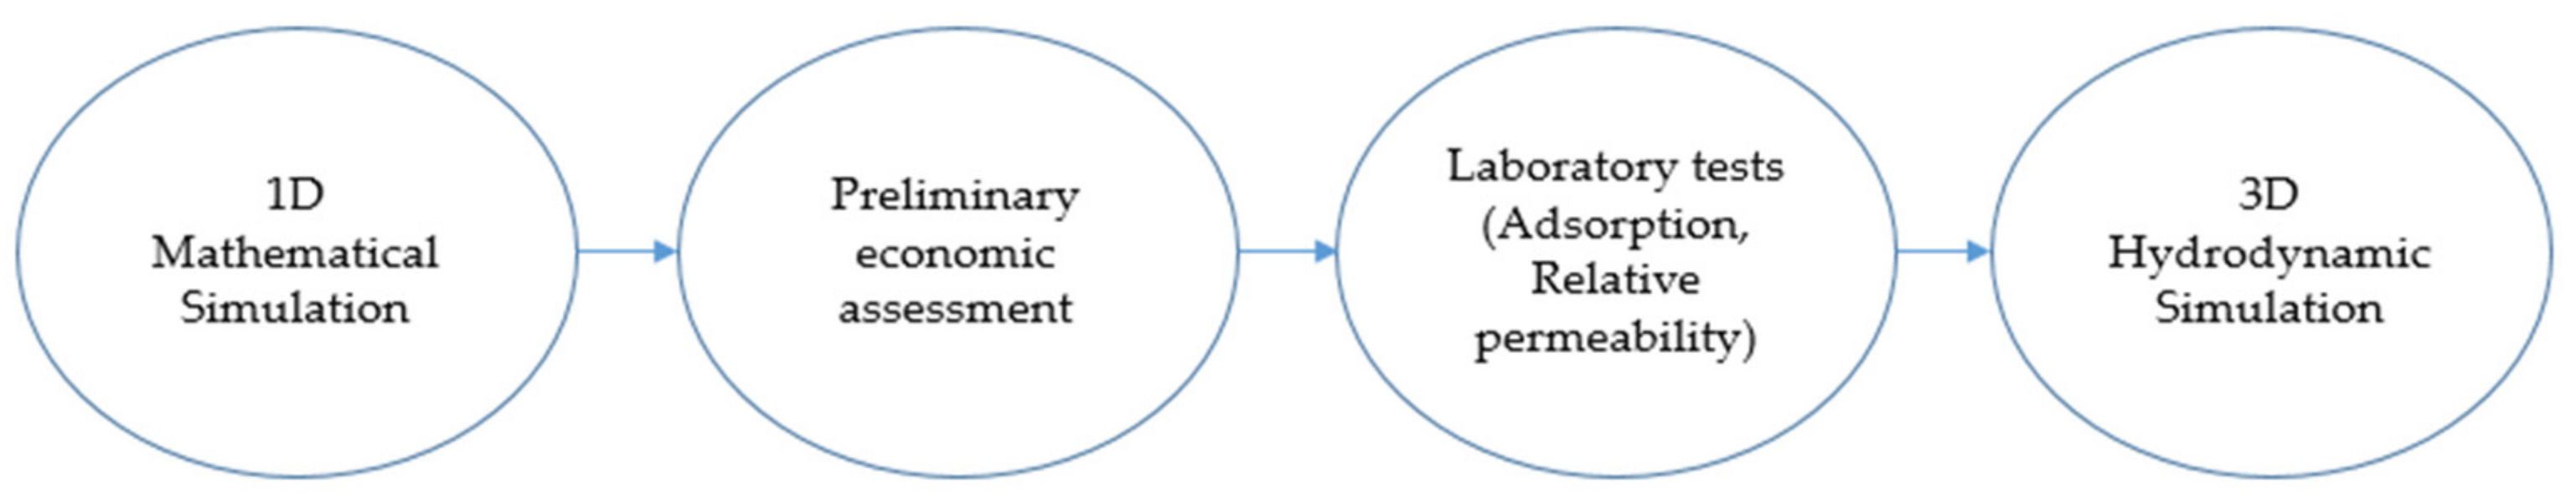
Figure 2 is a flow chart that briefly describes the methodology used in this article.
Multistage calculations were made to confirm the process efficiency of polymer flooding for the Pokur suite conditions.
At the first stage, efficiency was determined using a 1-D mathematical model that calculated oil displacement with water and polymer solutions of different viscosities. The most technically effective and economically viable viscosity and polymer concentration for further computations are selected based on the calculated model.
The calculation was based on the equation of permeability and the Buckley–Leverette model of two-phase filtration for PK bed conditions. Two-phase flow in the formation (oil–water or oil–polymer solution) was considered for the calculation of the main parameters of the displacement efficiency. The model was calculated using various fluids, namely: water with a polymer viscosity of 10 mPa∗s, 30 mPa∗s, and 50 mPa∗s. In the calculation of ORF, recovery time is carried out until the maximum profitable value of 98% watering is achieved.
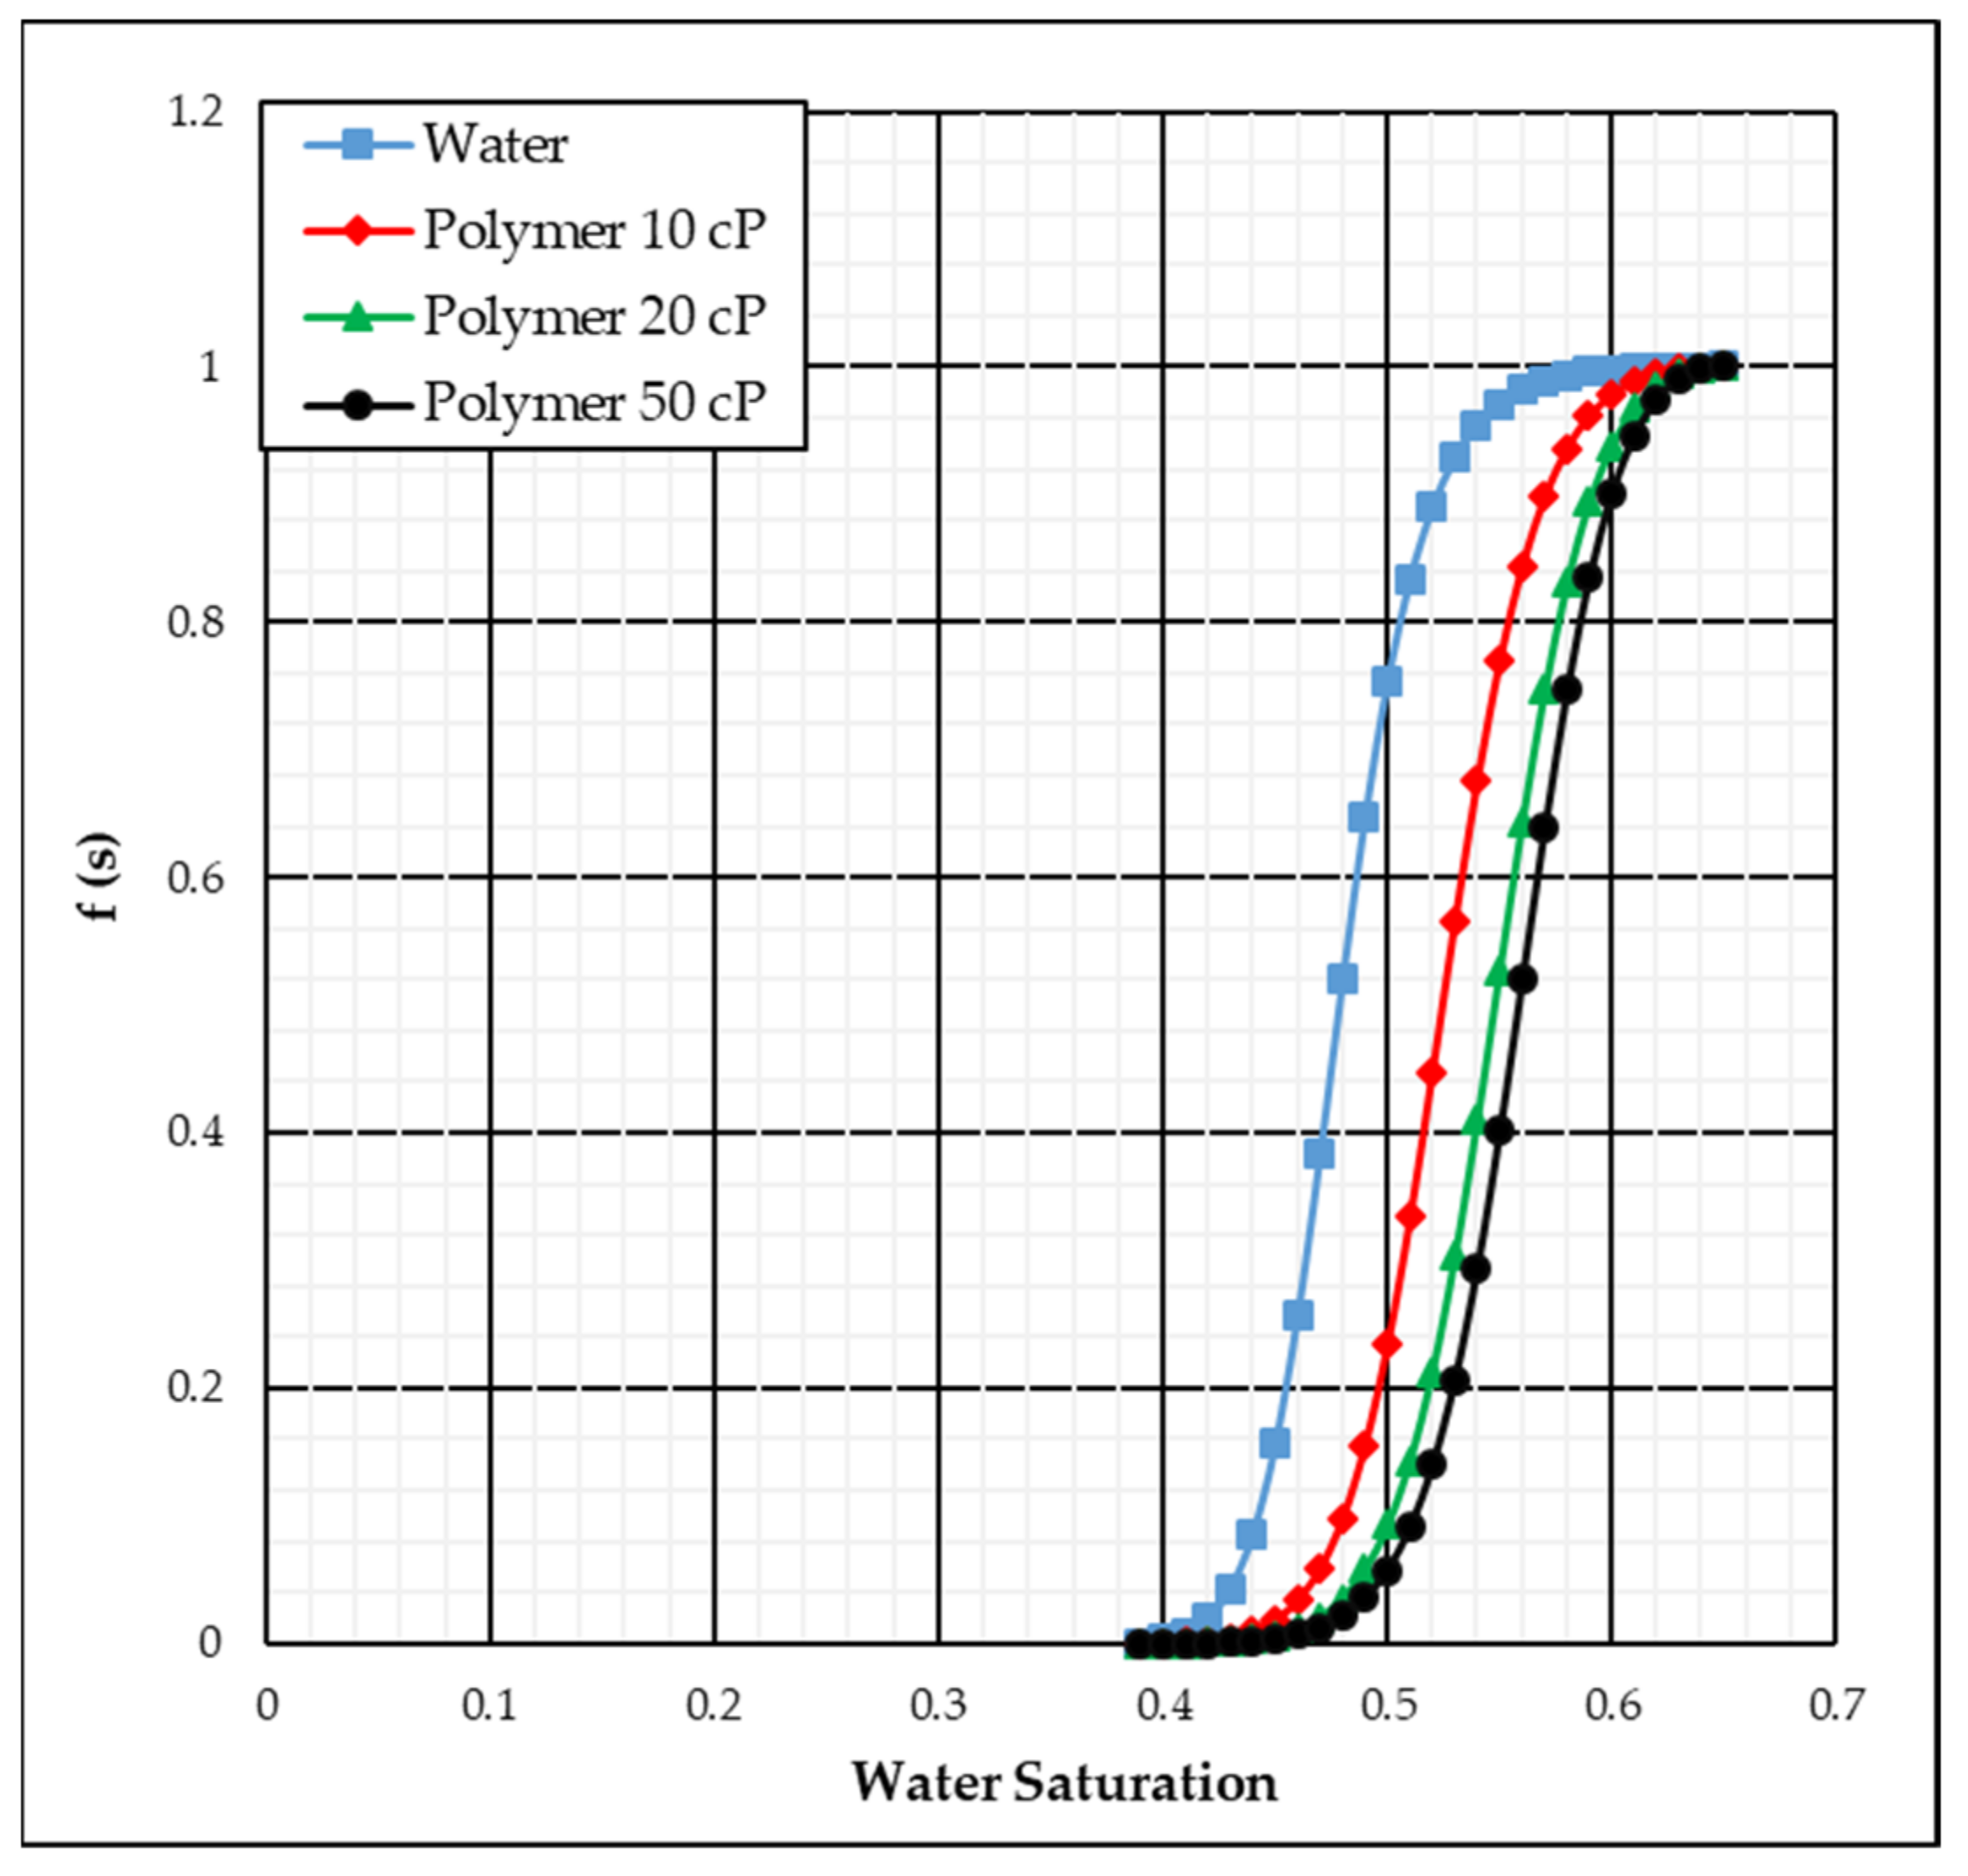
The Buckley–Leverett function is built on the following basis:
where f(s) is the Buckley–Leverett function, which, essentially, represents the watering of well products;
S—current water saturation of formation;
kw(s)—current water relative permeability, depending on water saturation;
ko(s)—current oil relative permeability, depending on water saturation;
μw—water viscosity in situ;
μo—oil viscosity in situ.
For the preliminary calculation, the straight–parallel formation was considered, with the average properties of the PK bed and the known size of the bed. Fluid filtration was considered to occur in a thin bed, the properties of which change poorly along any axis. The bed was penetrated by one vertical injection well and one producing vertical well, which operated at a constant flow/production rate. The thickness of the bed, rock density, residual resistance ratio, and the viscosities of clean water and oil were known and constant. The bed boundaries were considered impervious. We then calculated the end ORF, LV from technology implementation, period of profitable production, and duration of water-free period.
The main assumptions for the model were as follows.
PVT properties are equal at each point of the bed;
capillary effects are negligible (due to high permeability of the bed);
the polymer solution is high-viscosity water;
the water or polymer solutions are not mixed;
polymer adsorption in the porous medium is negligible (due to the absence of laboratory studies on core samples of this site);
the polymer does not affect residual oil saturation; and
the volume of the polymer departing to other zones is neglected.
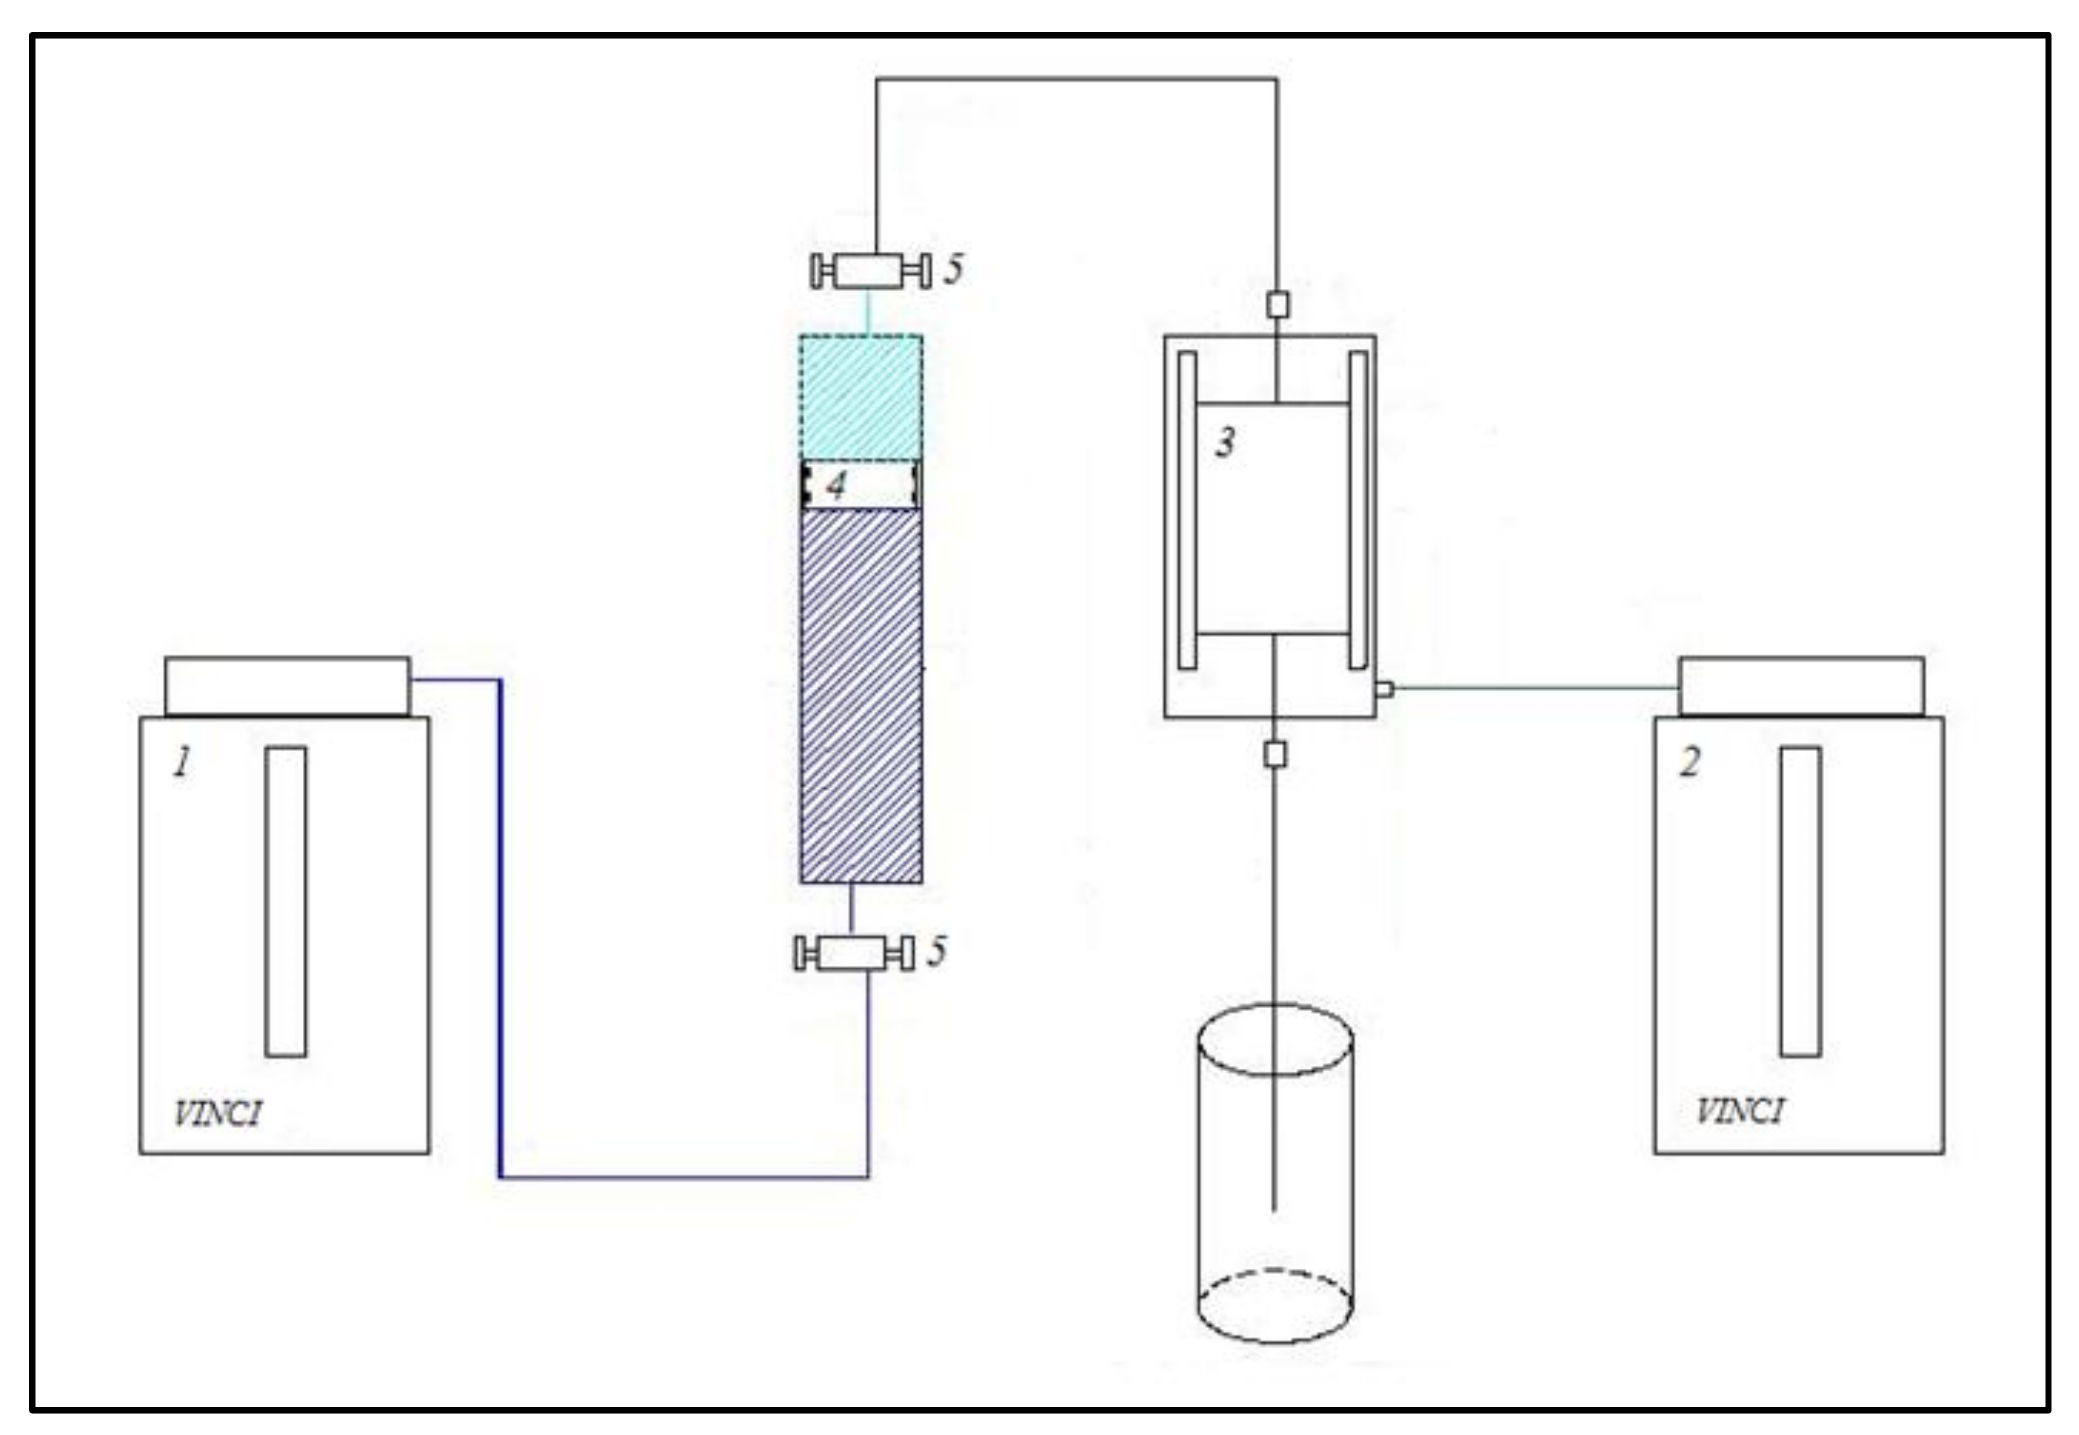
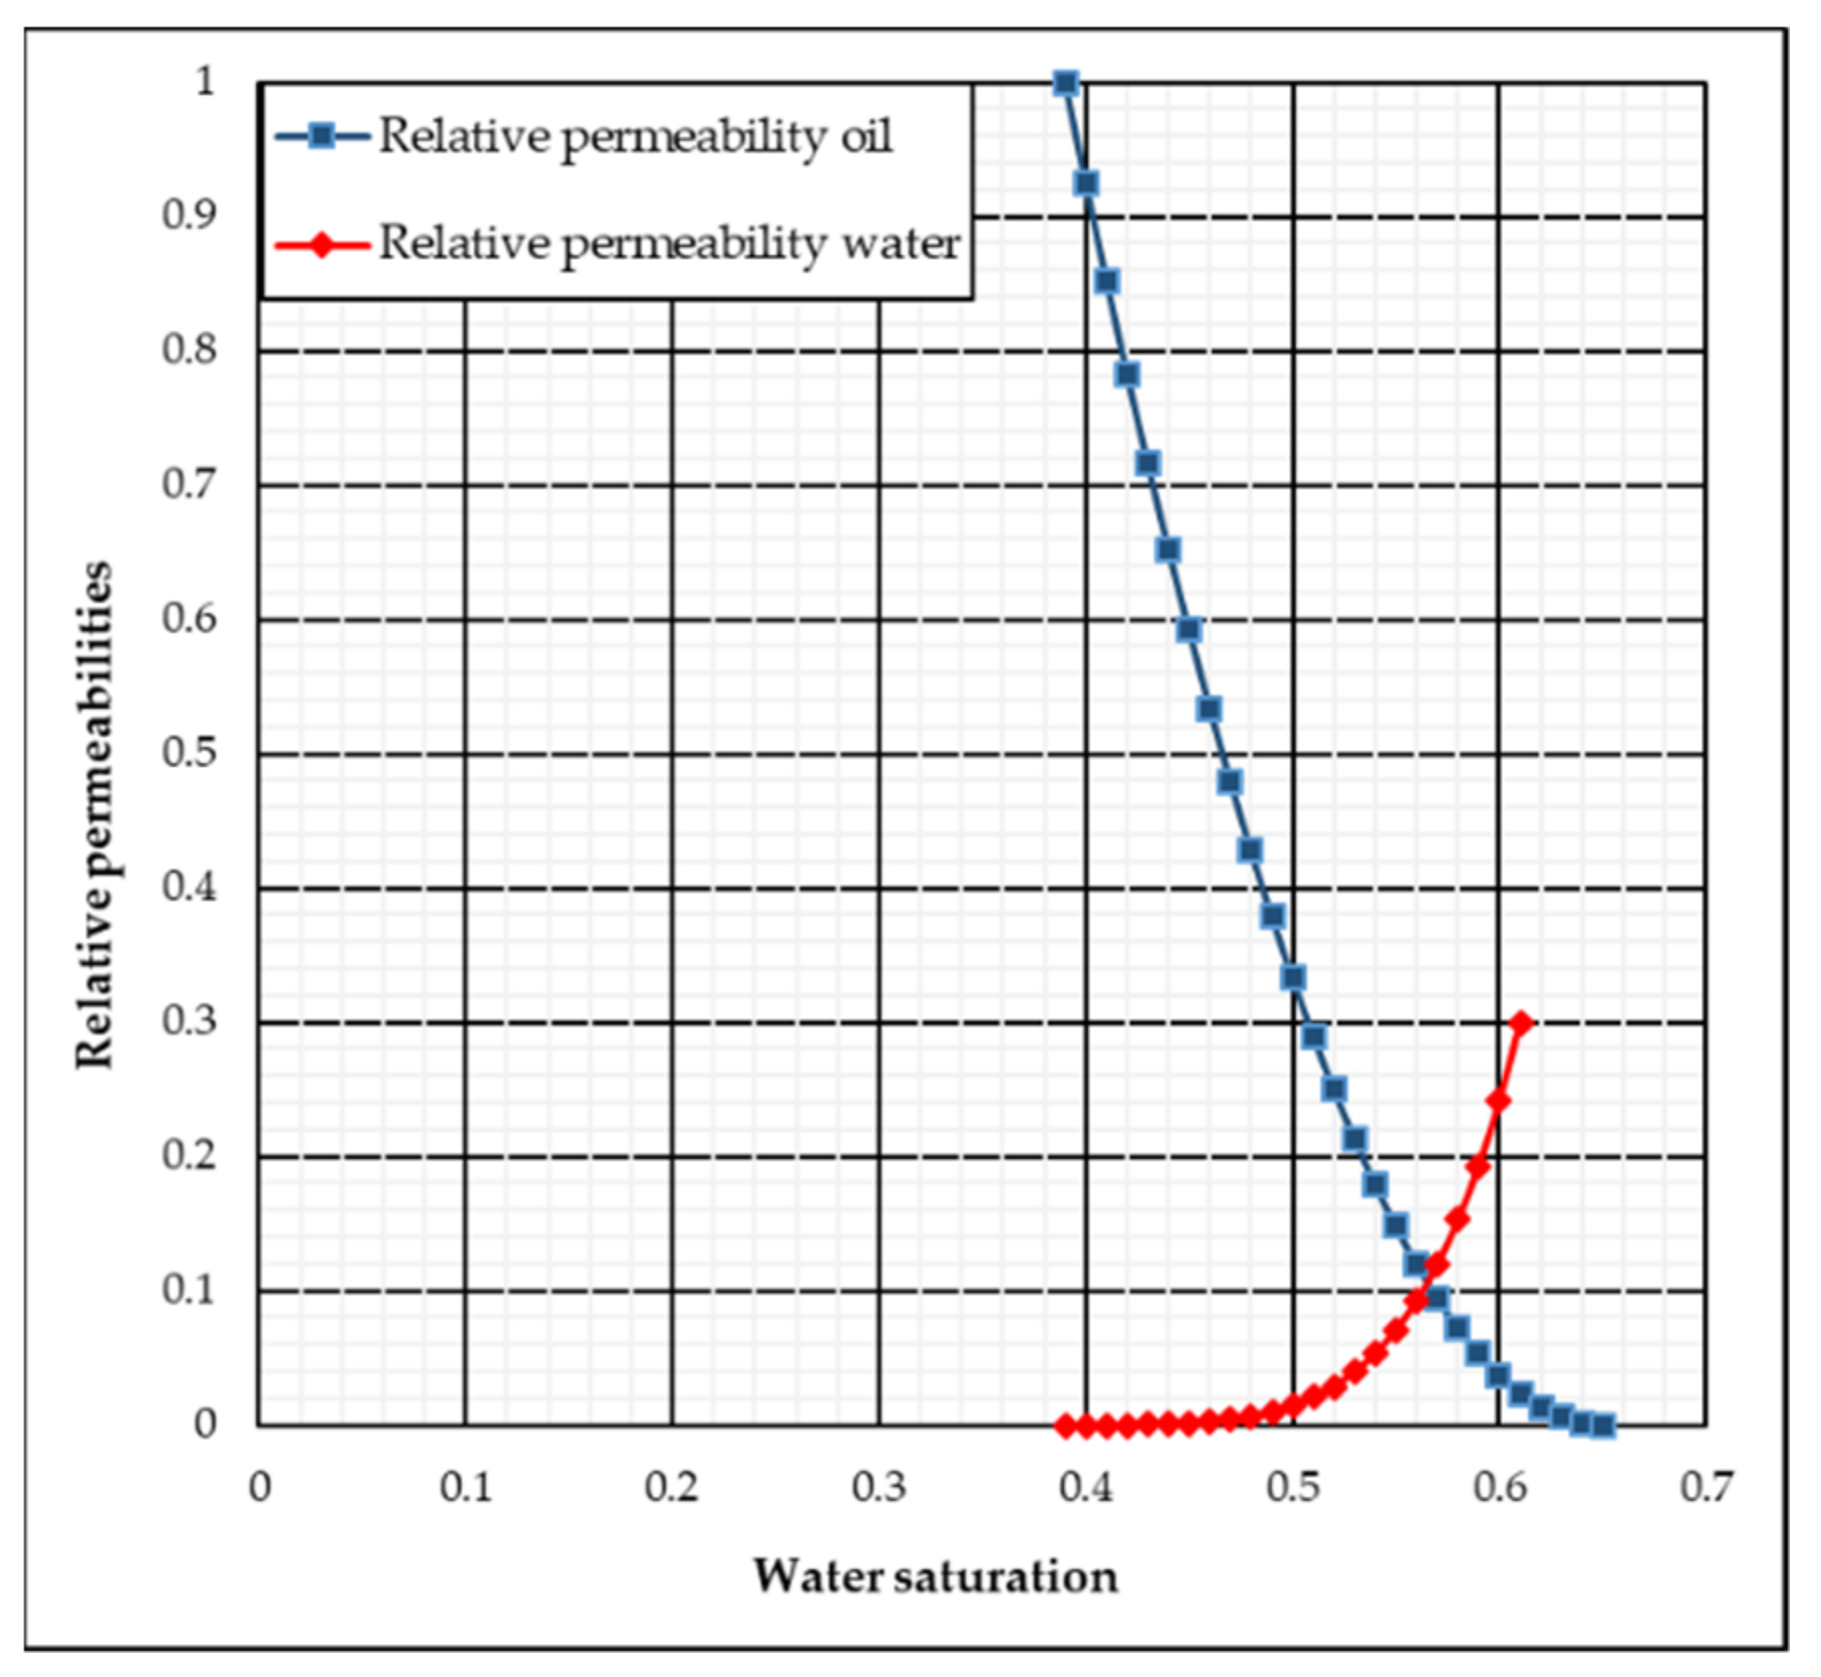
For building the Buckley–Leverette model, the results of laboratory studies on relative permeability (rel-perm) on the core of the pilot section were required as input data. The phase permeability was determined using RPS-81we system by Coretest Systems, followed by plotting rel-perm curves. A sampling of the whole core of the Pokur suite was very complex because core samples are represented by non-consolidated sandstone. For all experiments, sand pack tube models with absolute permeability to air 7, 70, 500, 1500 mD were used, which corresponded to the range of permeability variation of the Pokur suite. The lengths of the obtained samples were 8 cm and their diameters were 3 cm. The core and fluids for this and subsequent experiments were prepared for study and their reservoir properties were determined: open porosity and permeability were determined in full accordance with industry standards [
37,
38]. The studies were carried out at the facility with the schematic diagram shown in
Figure 3. The pump system accuracy was high and makes 0.1% of full scale. Relative rel-perm results for the model with the permeability of 500 mD can be found in
Figure 4.
After the process evaluation of polymer injection using a mathematical model, it was necessary to evaluate its economic efficiency. The main indicators of the investment project are as follows.
where CFt is the expected cash flow at period t, k is the project’s cost of capital.
- 2.
Internal rate of return (IRR). This is the discount rate that forces a project’s NPV to equal zero:
- 3.
Profitability index (PI):
- 4.
Project payback period (DPP):
To obtain these indicators, it is necessary to properly calculate the revenue, capital, and operational expenditures for the technology implementation. In this situation, it was proposed to consider not absolute revenues, but rather relative income. Water displacement with water was considered as the basic option. The next indicator was operational expenditures, which, in this situation, wascomposed of expenses for the operation of the unit and the cost of dry polymer. Operating costs of the unit can be evaluated based on the stated power of equipment (250 kW·h) as well as the average power cost in the work area (2.9 Rub/kW·h).
Based on the results of the technical and economic calculation, the second stage was selected using the optimum concentration (viscosity) of polymer for which retention was measured. This was done by using the multiple-slug retention method [
27]. Works were performed on pre-prepared bulk models of different permeability, for establishing the limits of dynamic adsorption, taking into account heterogeneity in the hydrodynamic model. Next, after the formation model assembly, the required pilot test conditions were created (thermal conditions, residual water, and oil saturation). The installation diagram is given in
Figure 2.
After preparation of the reservoir model, a polymer solution with a concentration of 1600 ppm was prepared, which was 50 mPa∗s. The selection of this concentration and viscosity was also determined by upper boundaries (adsorption value increases simultaneously with the growth of concentration, therefore, the upper bar, considered in this work, was selected). After all preparation works were performed, the process of polymer injection was started with a velocity less than that in the bed, to reduce the impact of the polymer hydrodynamic retention mechanism. At the same time, fluid was sampled at the outlet from the core holders to determine the concentration in them using a pre-prepared calibration chart (photographic method). When applying the initial concentration, injection of the polymer solution stopped and started water injection until the polymer concentration at the outlet from the core holder was equal to 0%. Then the values of dynamic adsorption were calculated, using the formula:
qi—sample volume, ml;
Ci—polymer concentration in the sample, mg/mL;
Vpor—pore volume of core (calculated before the pilot tests), ml;
Сinj—injected concentration (known value), mg/mL;
М—rock mass (calculated before pilot tests), g.
At the third stage, the efficiency of polymer composition and calculated concentration were determined for the Pokur suite conditions. For this purpose, a hydrodynamic simulation of the oil displacement process was performed.
The software package created lithological and facies models of the element of the rectangular flooding system (one injection well, in the center) with the changing permeabilities of 7, 70, 500 and 1500 mD (similar to the bulk samples). The component size was taken as 400 × 400 × 10 m. According to the particle size distribution analysis, sand fraction prevailed in the PK beds. Then, the model was upscaled.
Upscaled reservoir properties were distributed when creating the hydrodynamic model in the Tempest software, which contains a module for polymer handling. This model allows for considering all main polymer properties, including its mutual effect on the rock. The following well-operating parameters were specified. The minimum bottom-hole pressure of the producer well was 10 MPa.
When a water cut of 98% was achieved, the well stopped. The modeling process ended when all producer wells stop. To build a hydrodynamic model, similar to the calculation model, the data from
Table 1 were used.
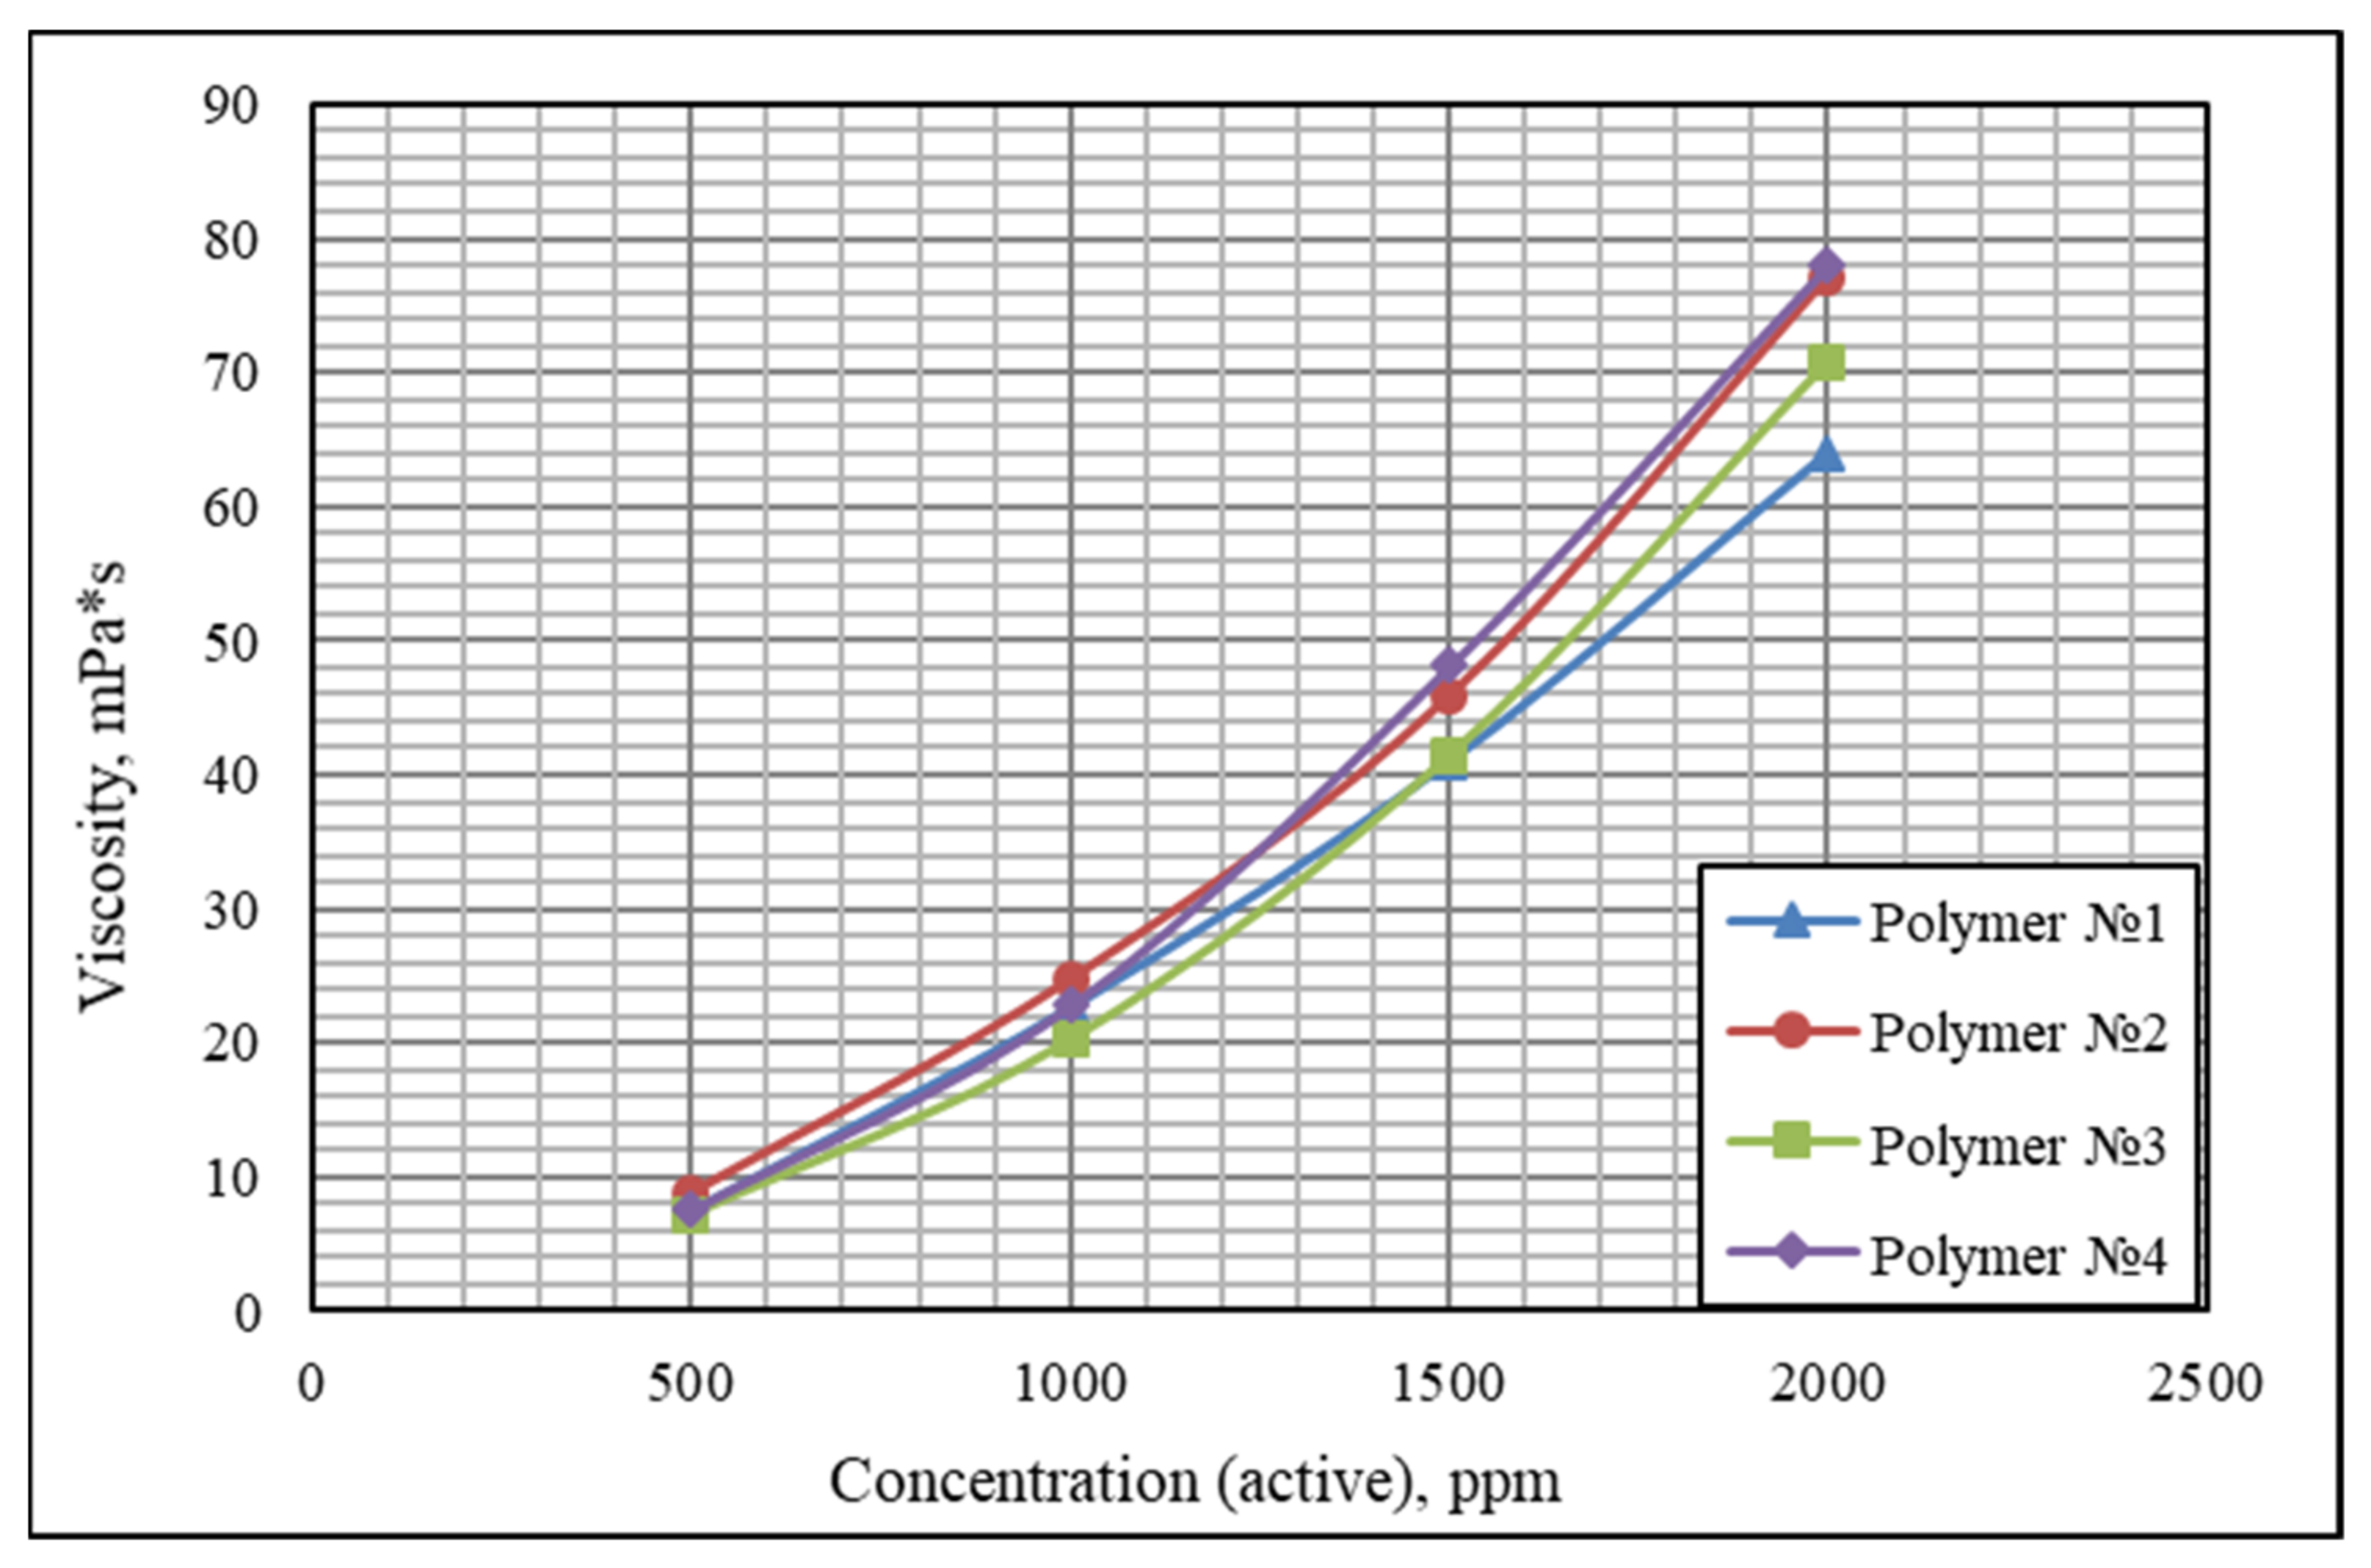
The amount and grade of polymer to achieve the required viscosity was evaluated based on results of laboratory studies, similar to the geological and physical characteristics of the formation [
39], presented in
Figure 5.
A comparison of the two most suitable polymers is presented in
Table 2 [
39].
As can be seen from the table, Polymer 1 had better qualities, namely, at a lower concentration it reached the required viscosity values faster and had a reduced value of static adsorption.
3. Results and Discussion
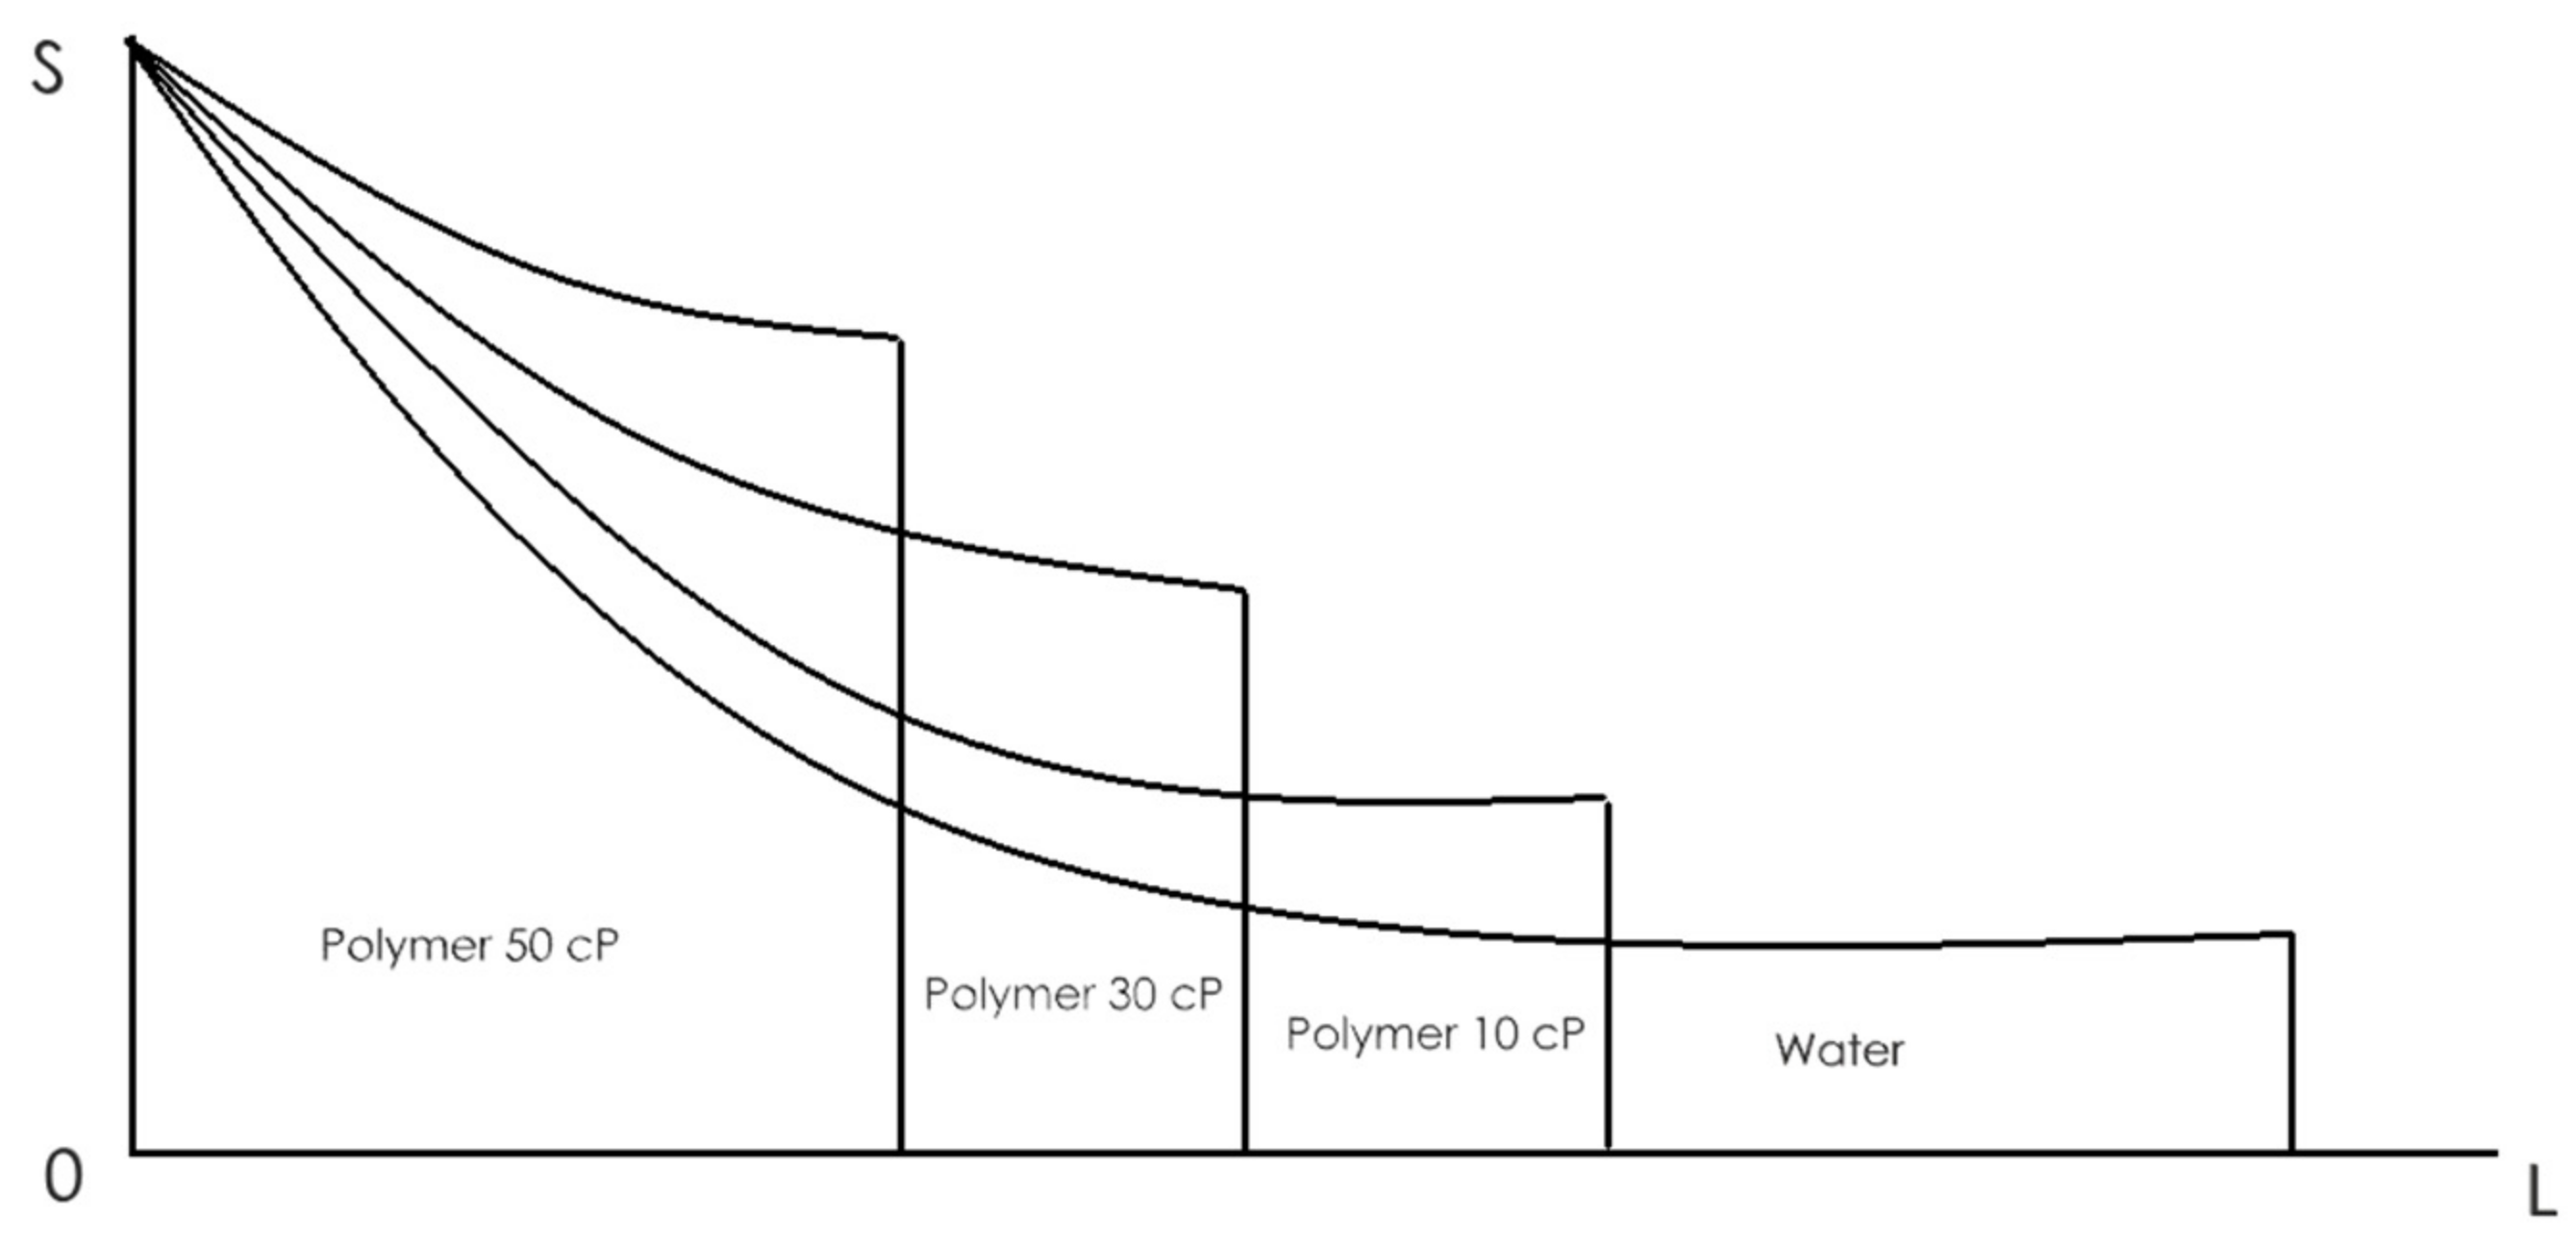
The results of the mathematical calculations of the first stage confirmed (
Figure 5) that the introduction of polymeric boiling promotes a more even distribution of the displacement front. The water burst later and at a higher rate, which reduced the time for water extraction of oil.
A general view of the Buckley–Leverett function graph for various fluids is presented in
Figure 6.
An example of a displacement front with increased viscosity of the displacement fluid is shown in
Figure 7.
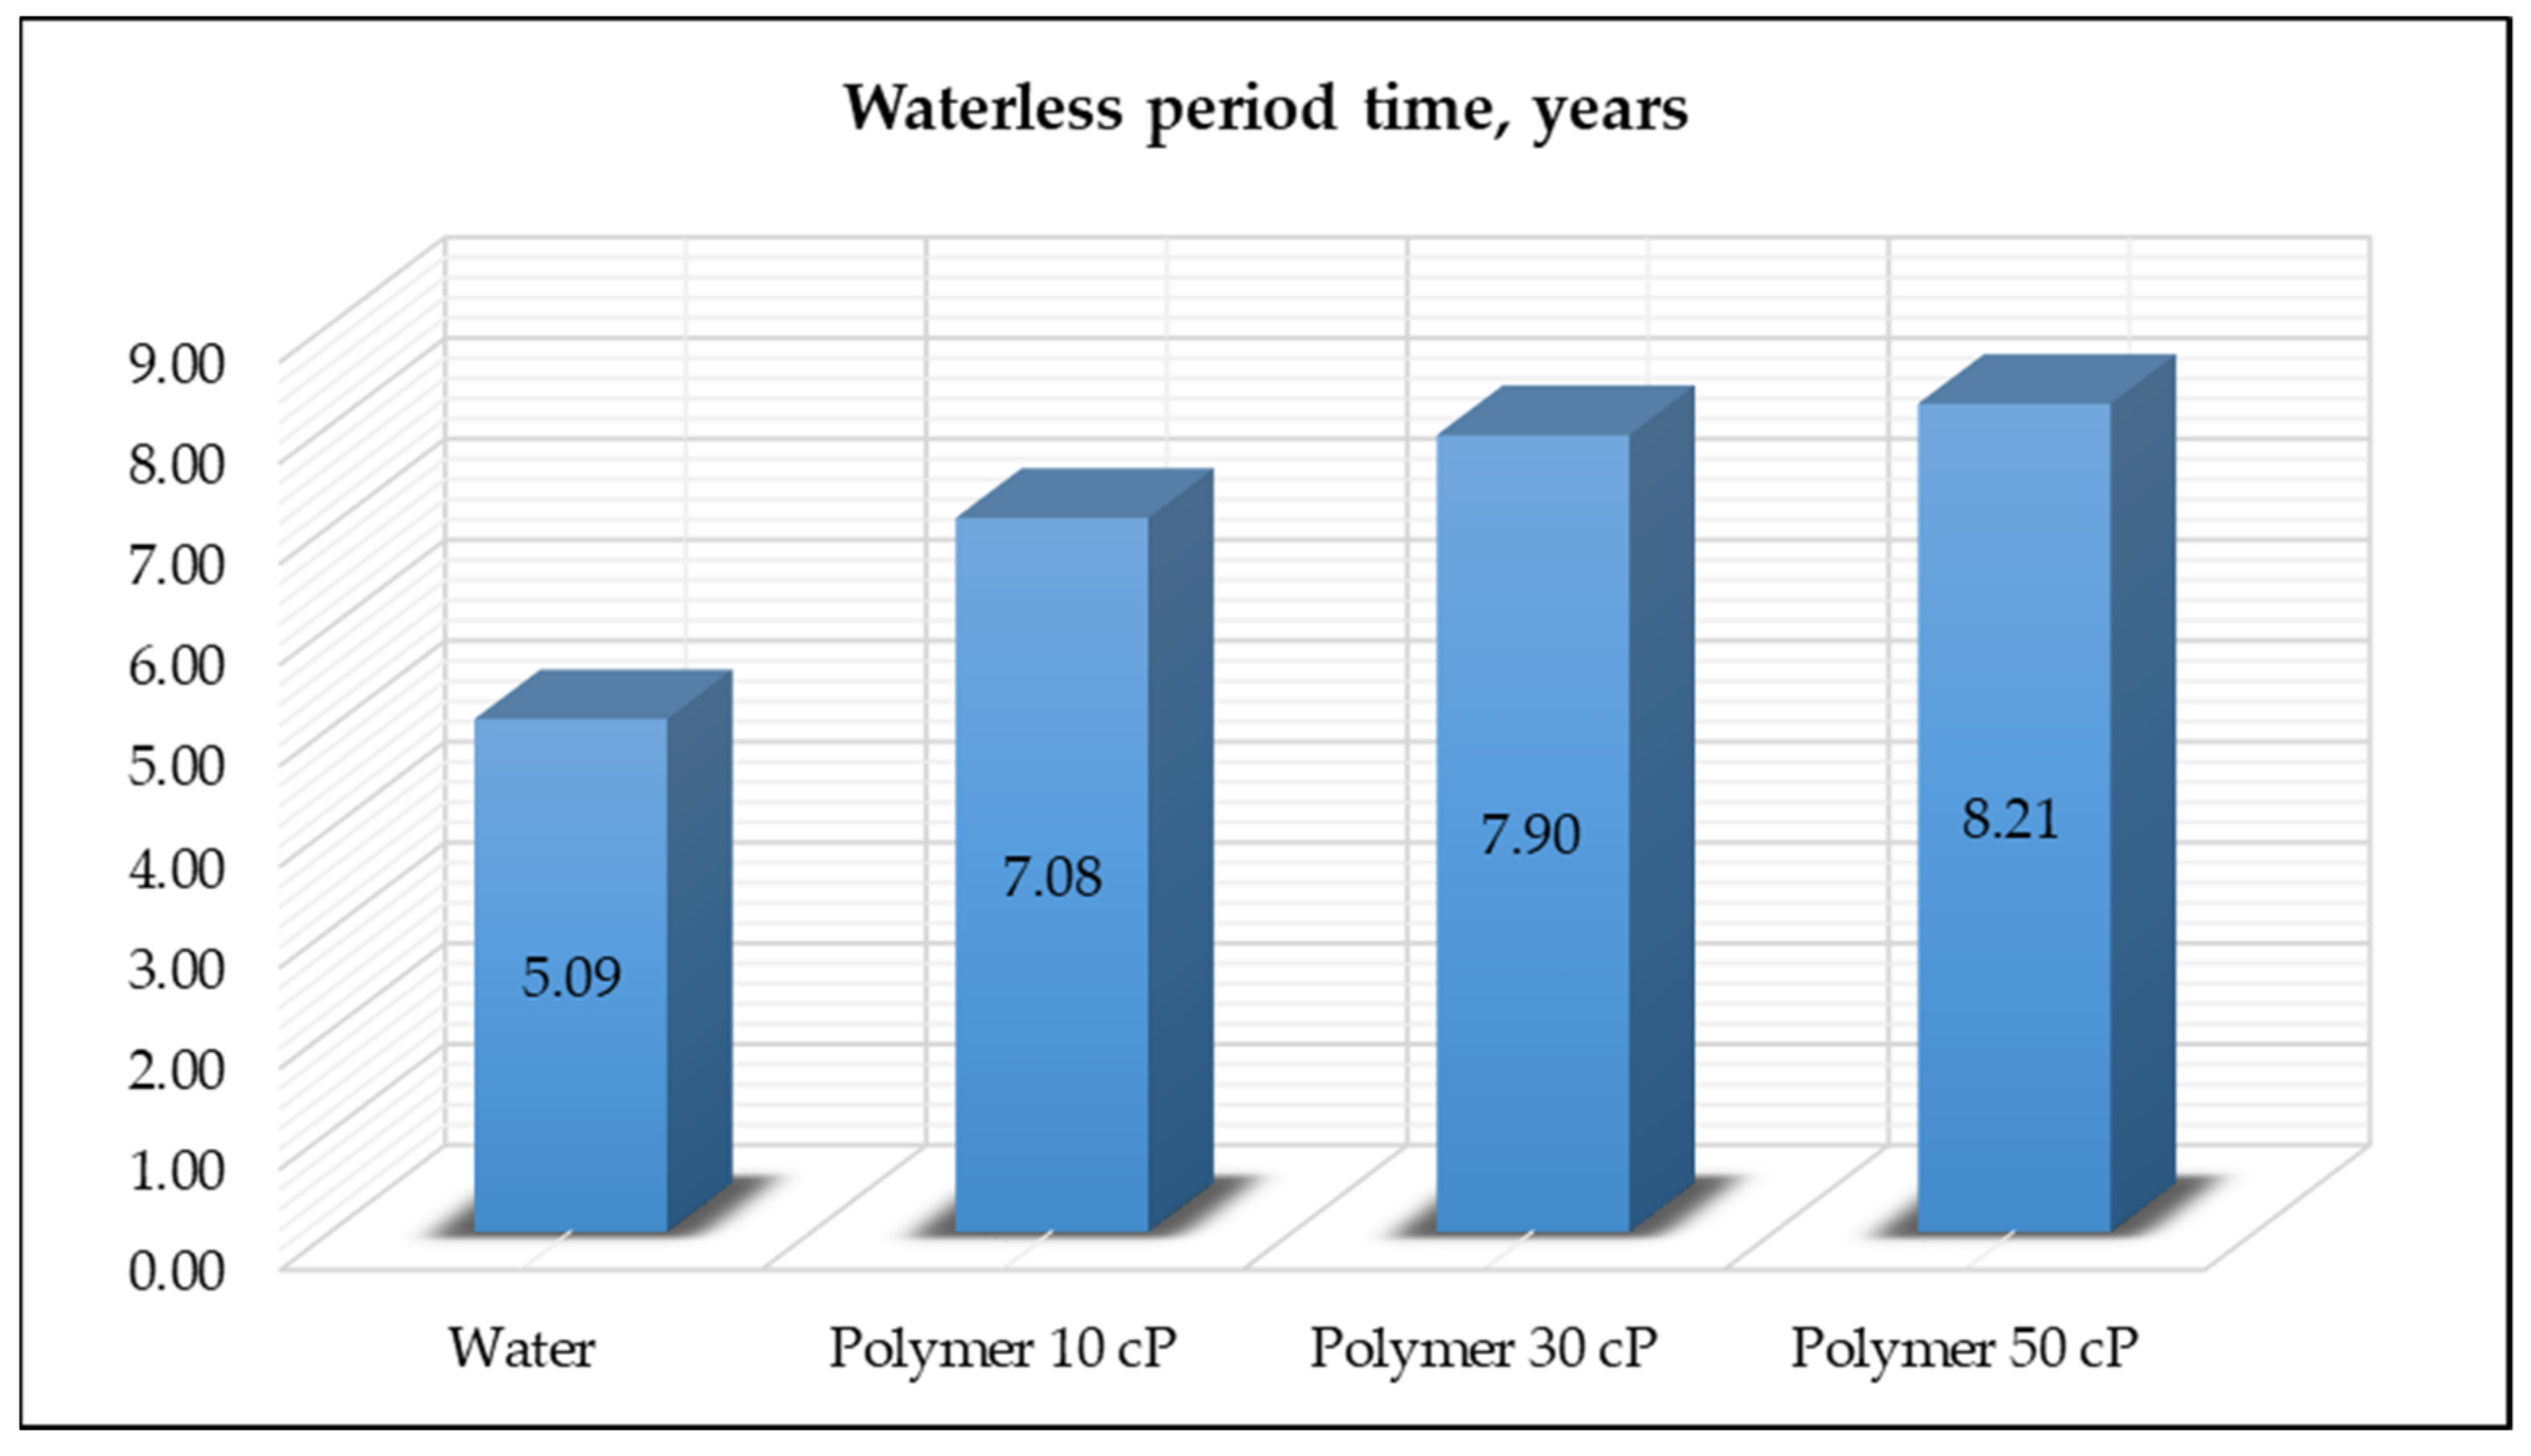
Additionally, an important indicator was an increase in the water-free operation of the well compared with normal water, as shown in
Figure 8.
As can be seen from
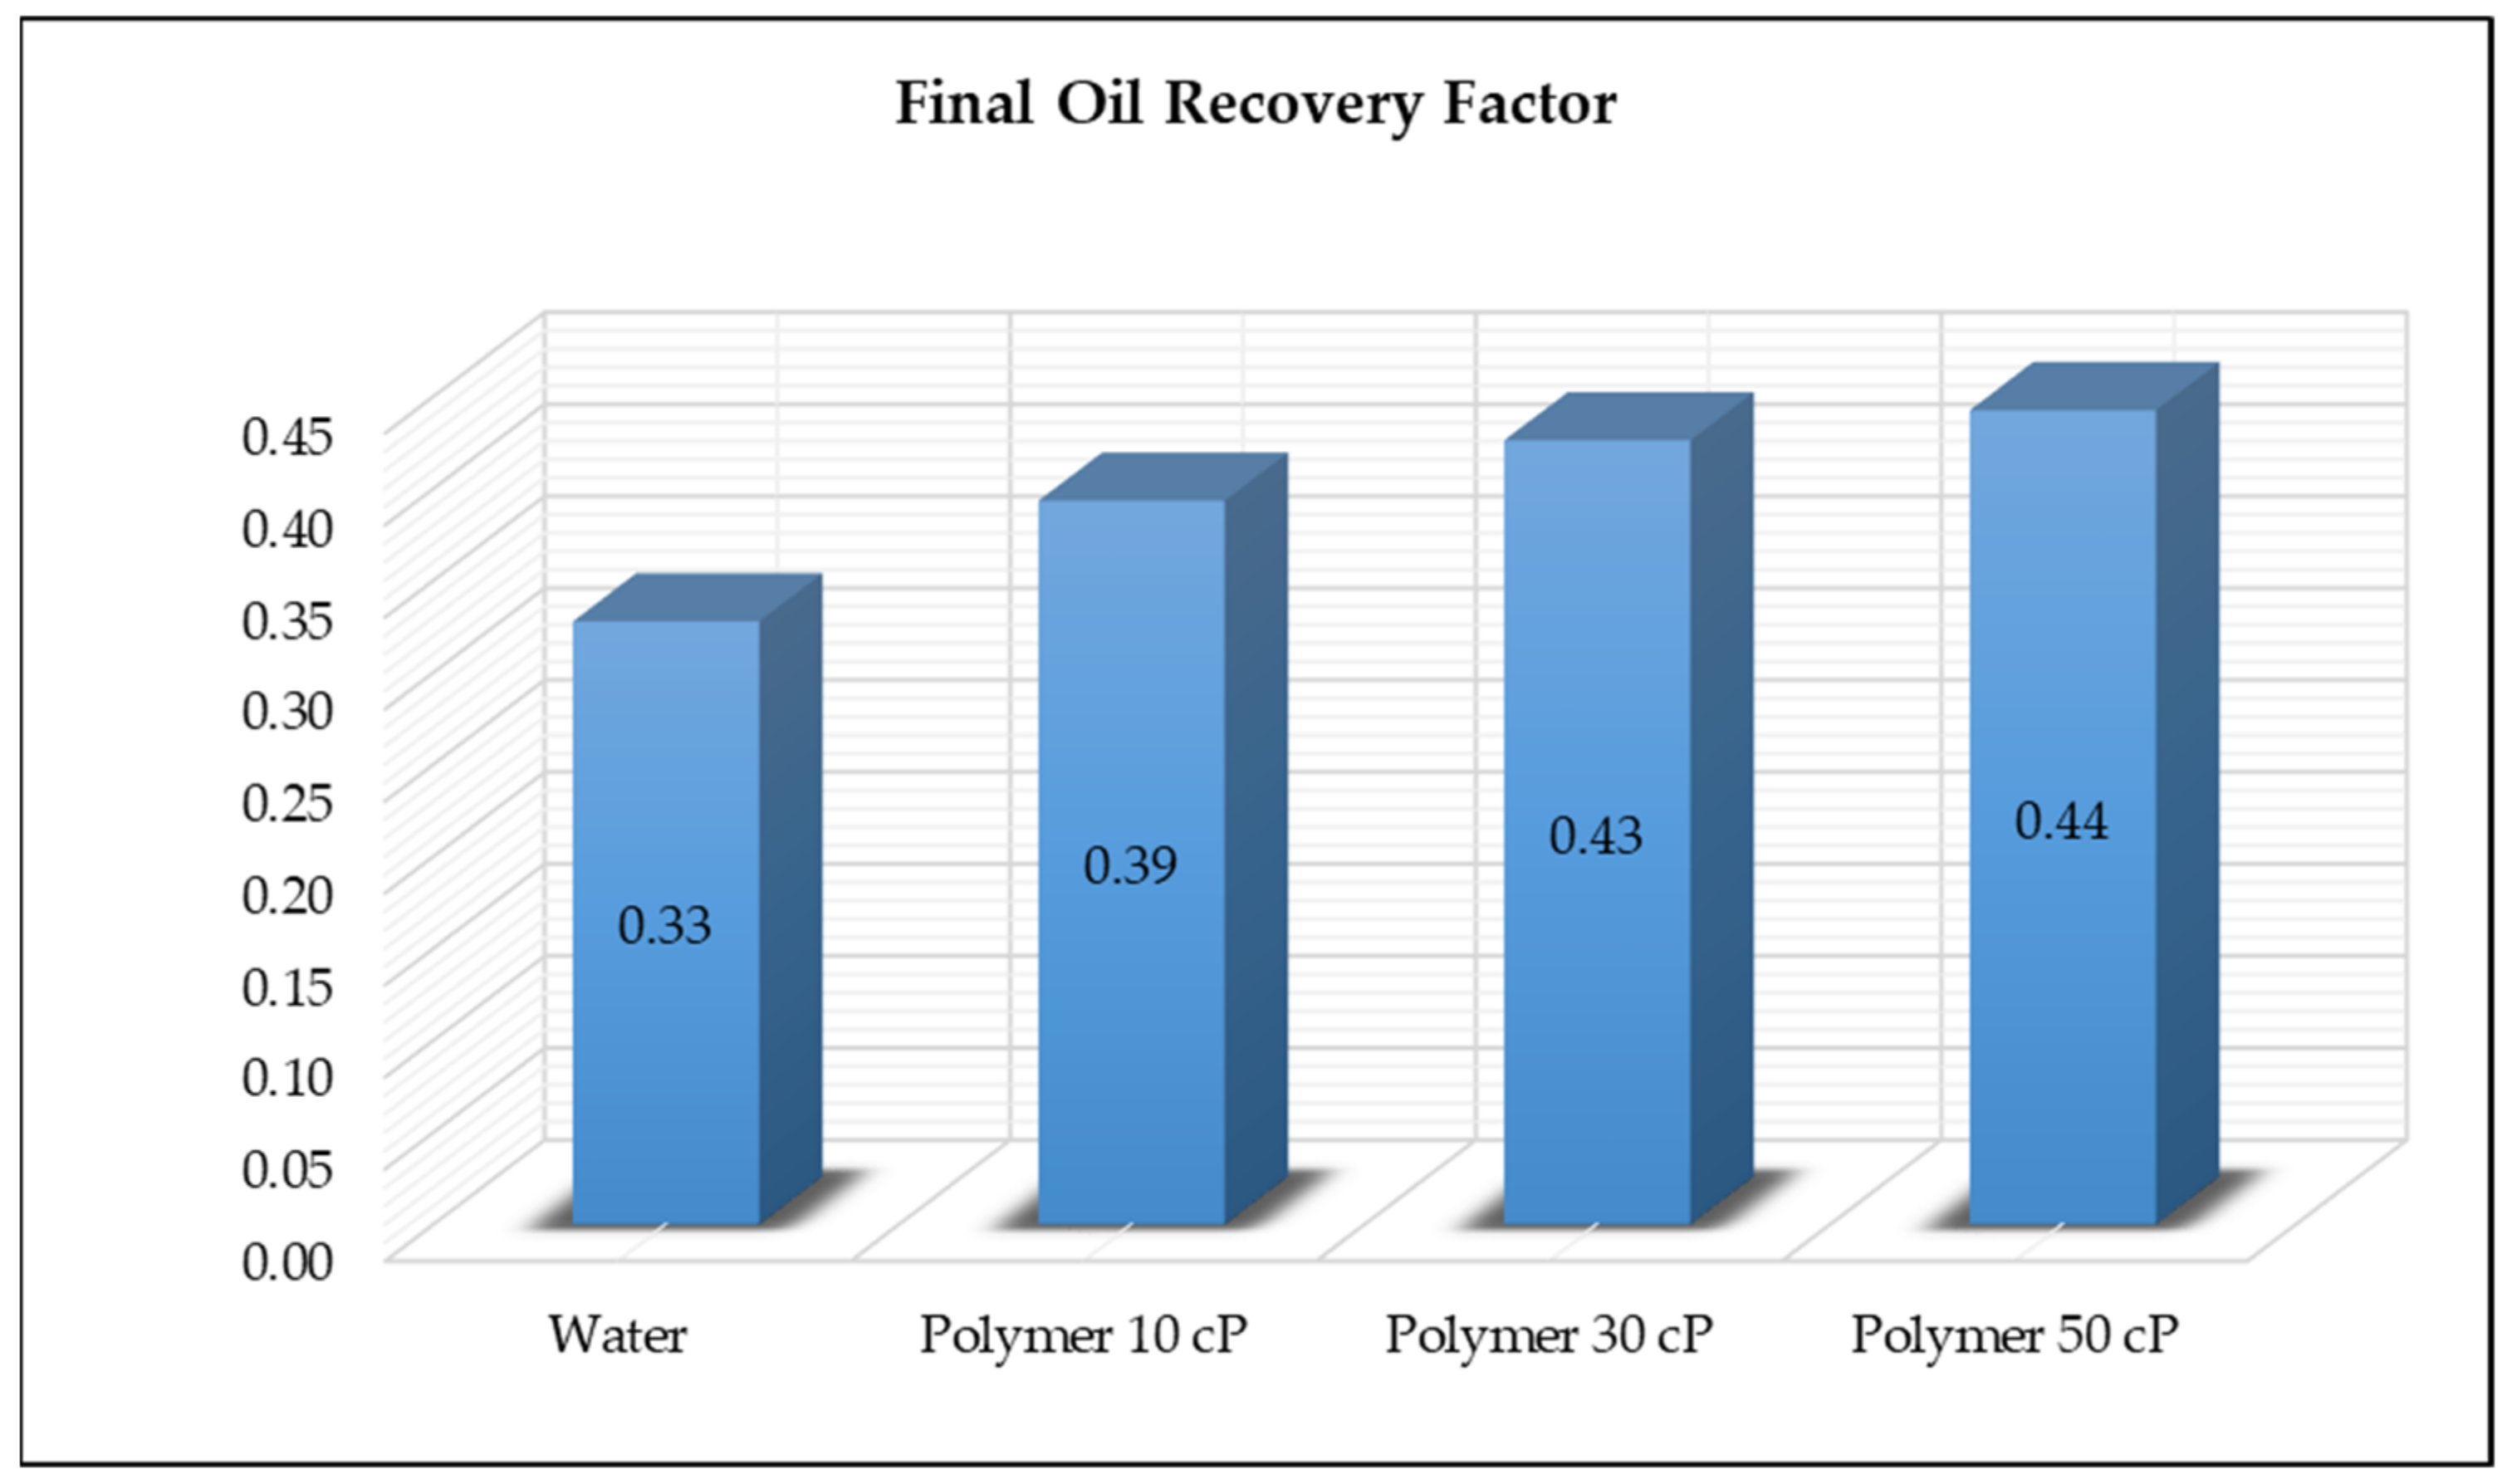
Figure 8, as the viscosity of the polymer increased, the time of the water-free period increased. This is due to a more even advance of the displacement front in the formation (an approximation to the frontal drive displacement model). Additionally, the higher final ORF value (
Figure 9), which was calculated to be as maximum possible before reaching a water cut of 98%, i.e., the boundary between profitable and unprofitable oil production.
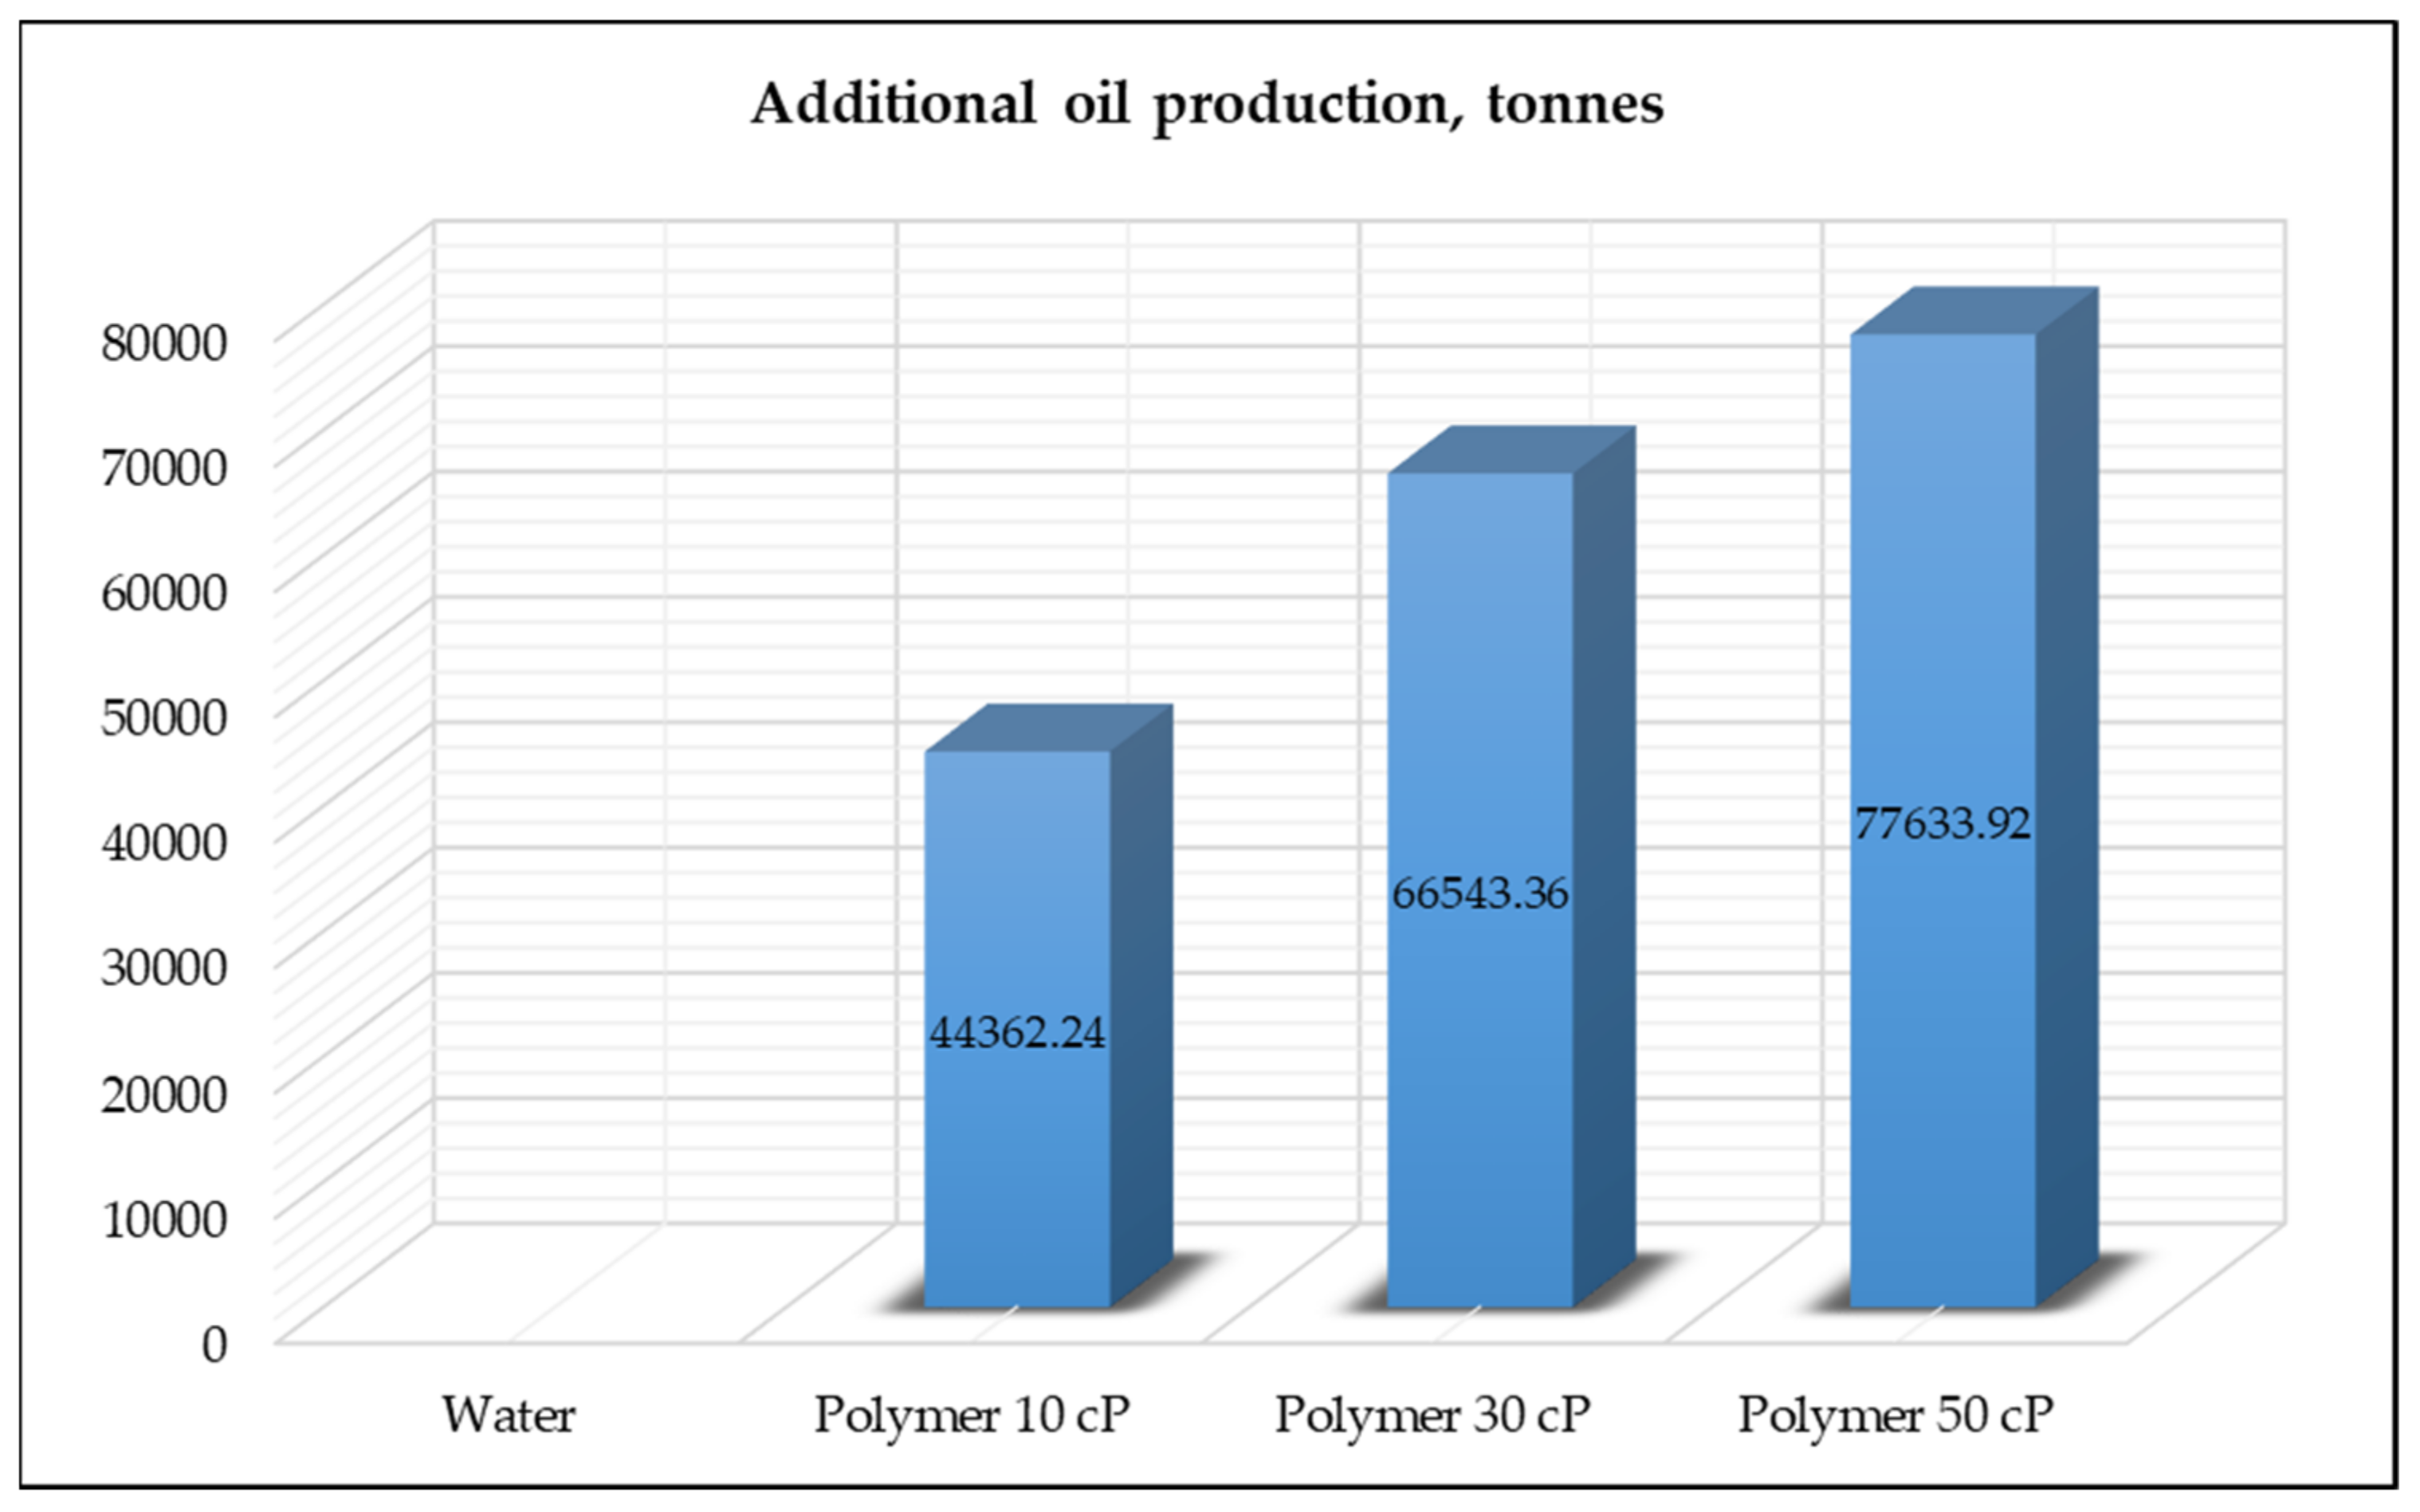
Figure 10 shows the value of additional oil recovered during the injection of the polymer solution.
A summary of the values for the water-free well operation, the final oil recovery factor, and the additional oil production is presented in
Table 3.
Based on the modeling outcomes, the efficiency of the implementation of polymer water flooding technology on the above-mentioned formations was preliminarily proved. The viscosities and durations of the water-free period for the displacement of oil by a polymeric solutions were 10 cP, 30 cP, and 50 cP and 7.08, 7.9, and 8.21 years, respectively, when the time for displacement by water was 5.09 years. There was also an increase in the final ORF and, consequently, an increase in additional oil production.
From the data presented, the time difference between the water-free production period and the final oil recovery factor for the viscous of 50 and 30 cP was not critical. Therefore, it was necessary to justify economically the correct viscosity for further calculations.
Knowing the volume the polymers, which was 1 m
3 of injected water, their types, and the injection time, we estimated the amount of polymer needed to inject into the reservoir and therefore counted the amount of additional oil produced per ton of injected polymer. The figures are shown in
Table 4.
Table 5 presents the key indicators of the investment project for the various viscosity options of the polymer solution.
From the table, it can be seen that the most economically advantageous is the injection of polymer solution with a viscosity of 50 cP, which is primarily because the main costs for the implementation of polymer water flooding technology relate to the initial capital investment in the injection well for continuous injection. Therefore, we continued our calculations with these values of viscosity and concentration.
The next important characteristic was the adsorption value of the polymer in the rock. Four core samples with absolute permeability ranging from 7 to 1500 mD were tested for this indicator, considering data from laboratory tests on the 7 mD permeability reservoir model.
The main parameters of the experiment are presented in
Table 6.
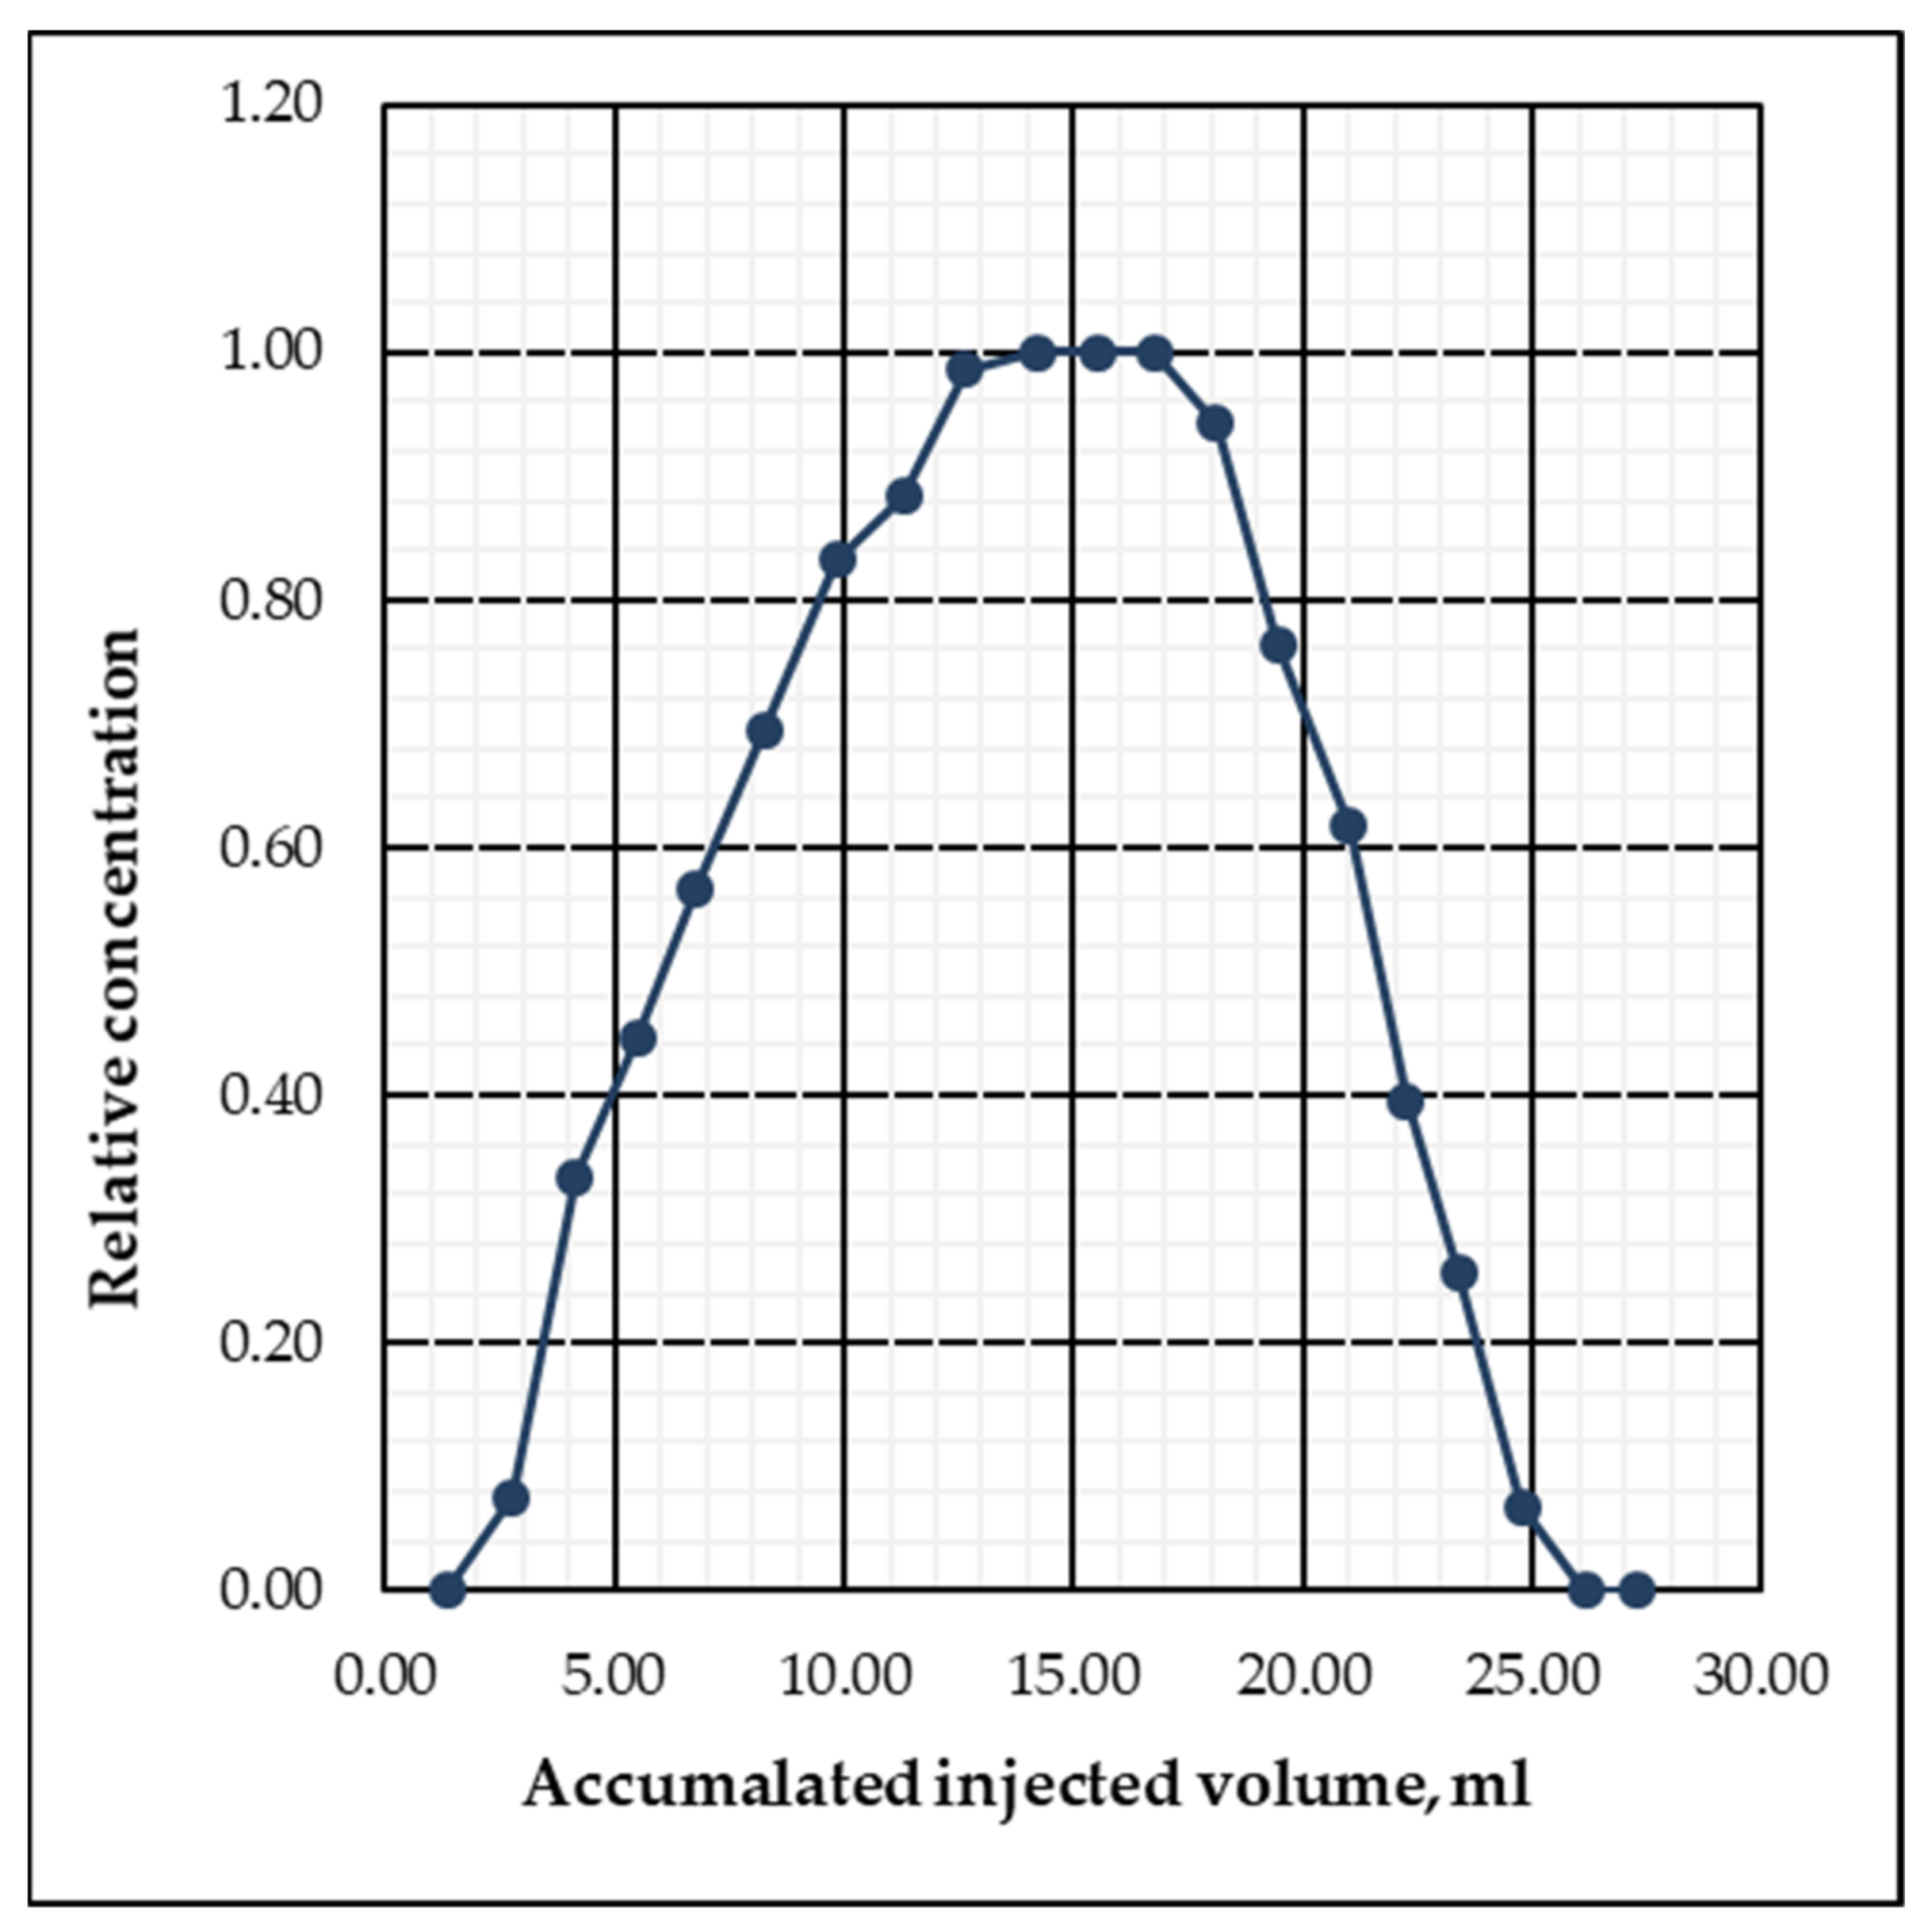
Figure 11 presents a graph showing the ratio of the out-of-sample polymer solution concentration to the input solution concentration from the accumulated injected volume.
In the graph, the parallel line (the upper part of the graph) means that the rock has reached the maximum value of adsorption with a polymeric solution (full saturation), when water washing and consequently desorption process begins.
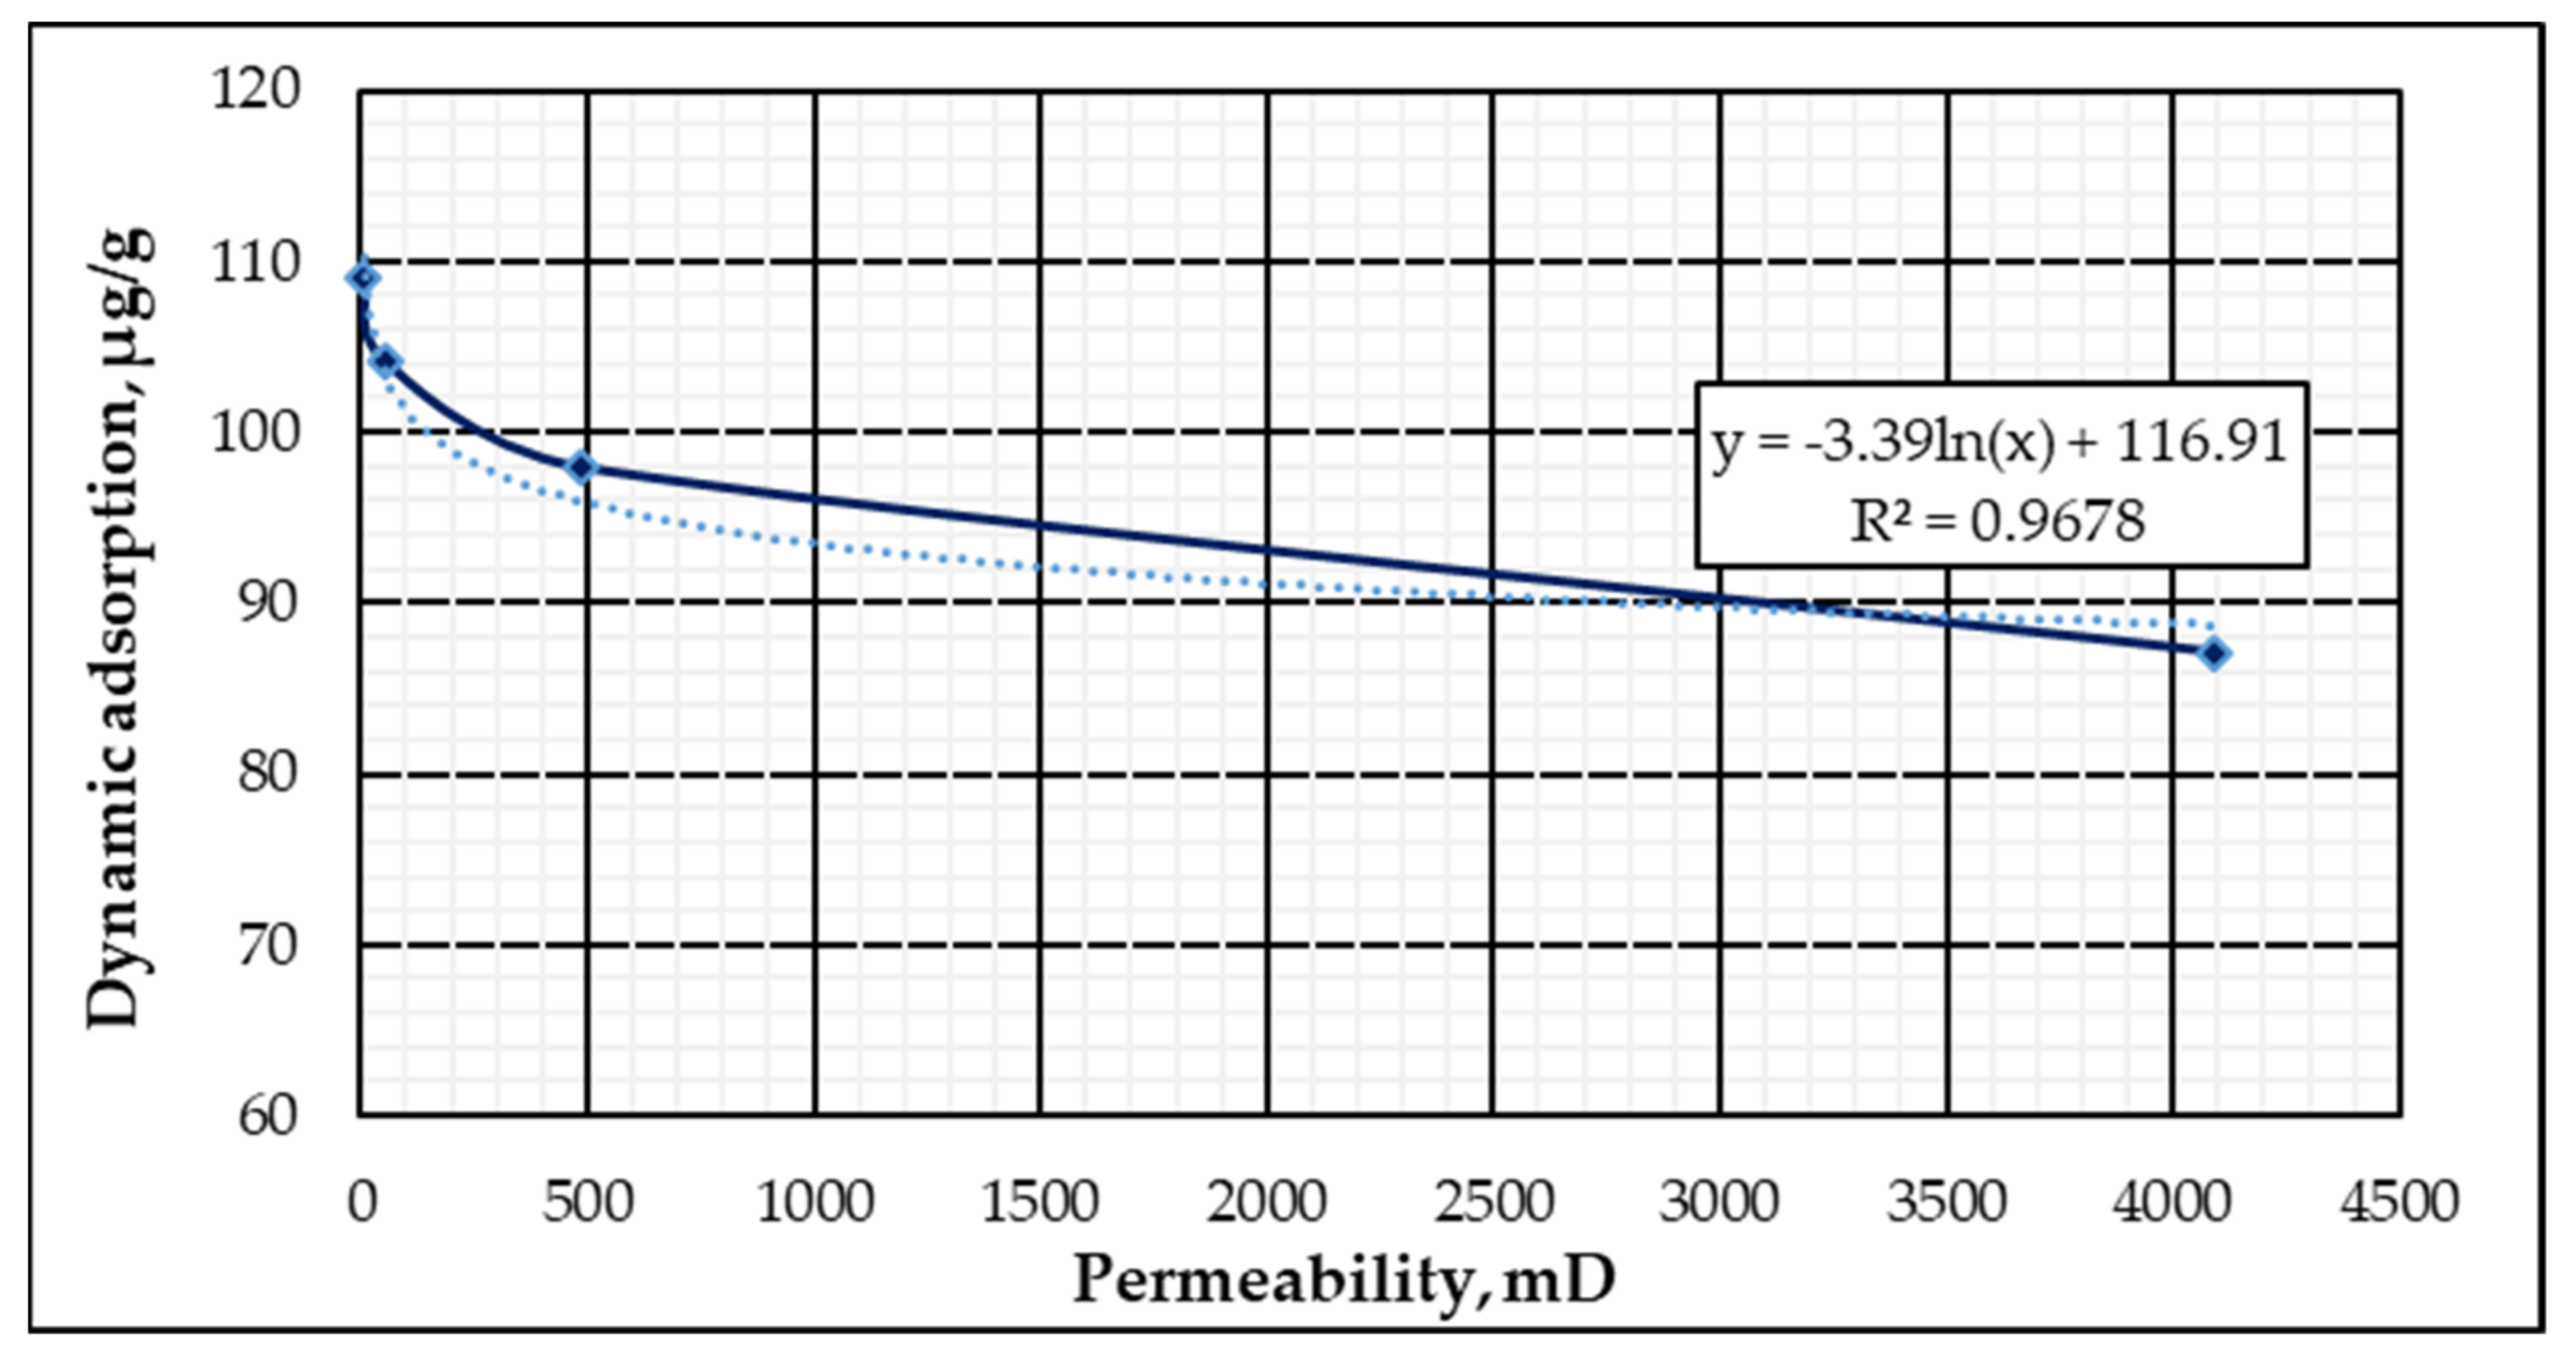
The adsorption value was calculated using formula (6) and experimental data. Similarly, the adsorption values for models with different permeabilities (70, 500, and 1500 mD) were calculated. For ease of reference, all the results obtained by dynamic adsorption are summarized in
Table 7.
The values presented are overestimated relative to the average dynamic adsorption values of other published studies. For example, Satken et al. [
40], studied adsorption on cemented sand core samples with similar characteristics to our object, and revealed that the maximum values for dynamic adsorption did not exceed the value of 80 μg/g. This is partly due to the use of the bulk model for research. Due to the strong slope and large specific surface area of the core model, the number of active elements capable of adsorbing inversely charged polymer particles was significantly higher than, for example, for consolidated core samples.
The next characteristic affecting the adsorption rate was the permeability of the model.
Figure 12 shows a diagram of polymer adsorption dependence on the permeability of the core model.
As can be seen from the graph, the adsorption rate is slightly higher for the core models with reduced permeability, while the adsorption rate decreases slightly with increased permeability and starts to stabilize. Presumably, in the area of reduced permeability, adsorption may be influenced by the mechanical pinching of polymer particles in the rock [
26]. To assess the impact of this mechanism, a significant number of laboratory studies on rock samples and using different types of polymers were required. Since the study of adsorption was not central to this future work, we used the experimental values for the hydrodynamic model.
For hydrodynamic modeling of oil displacement from the Pokur suite model, it was decided to use horizontal wells, as in the actual conditions of oil fields working with such formations, because of their low thickness. Two production wells and one horizontal well were in operation until the arrival of water. The polymer was injected as at the start of field exploitation. An important assumption in the model was that only injection wells are a source of water. As the permeability of the Pokur suite varies in a very wide range, studies were carried out on models of different permeability.
Figure 12 shows the evolution of the accumulated production resulting from the application of the technology. It can be seen from the figure that the polymer was not applicable for low permeability (up to 10 mD), which could be due to the increased value of adsorption, formation clogging, or a sharp decrease of reservoir properties. A possible solution for displacement oil from low permeability PK formation may be the use of a low-molecular-mass polymer with lower adsorption values and better filtration properties [
41,
42]. Further calculations did not consider the results obtained from the displacement of oil from the 7-mD-permeable reservoirs because of the total loss of intake formation capacity in the calculation. However, for permeability, where no significant reduction filtration performance was achieved, the efficiency was compared with the basic option (water displacement). A comparison of accumulated oil production for models with different permeabilities is presented in
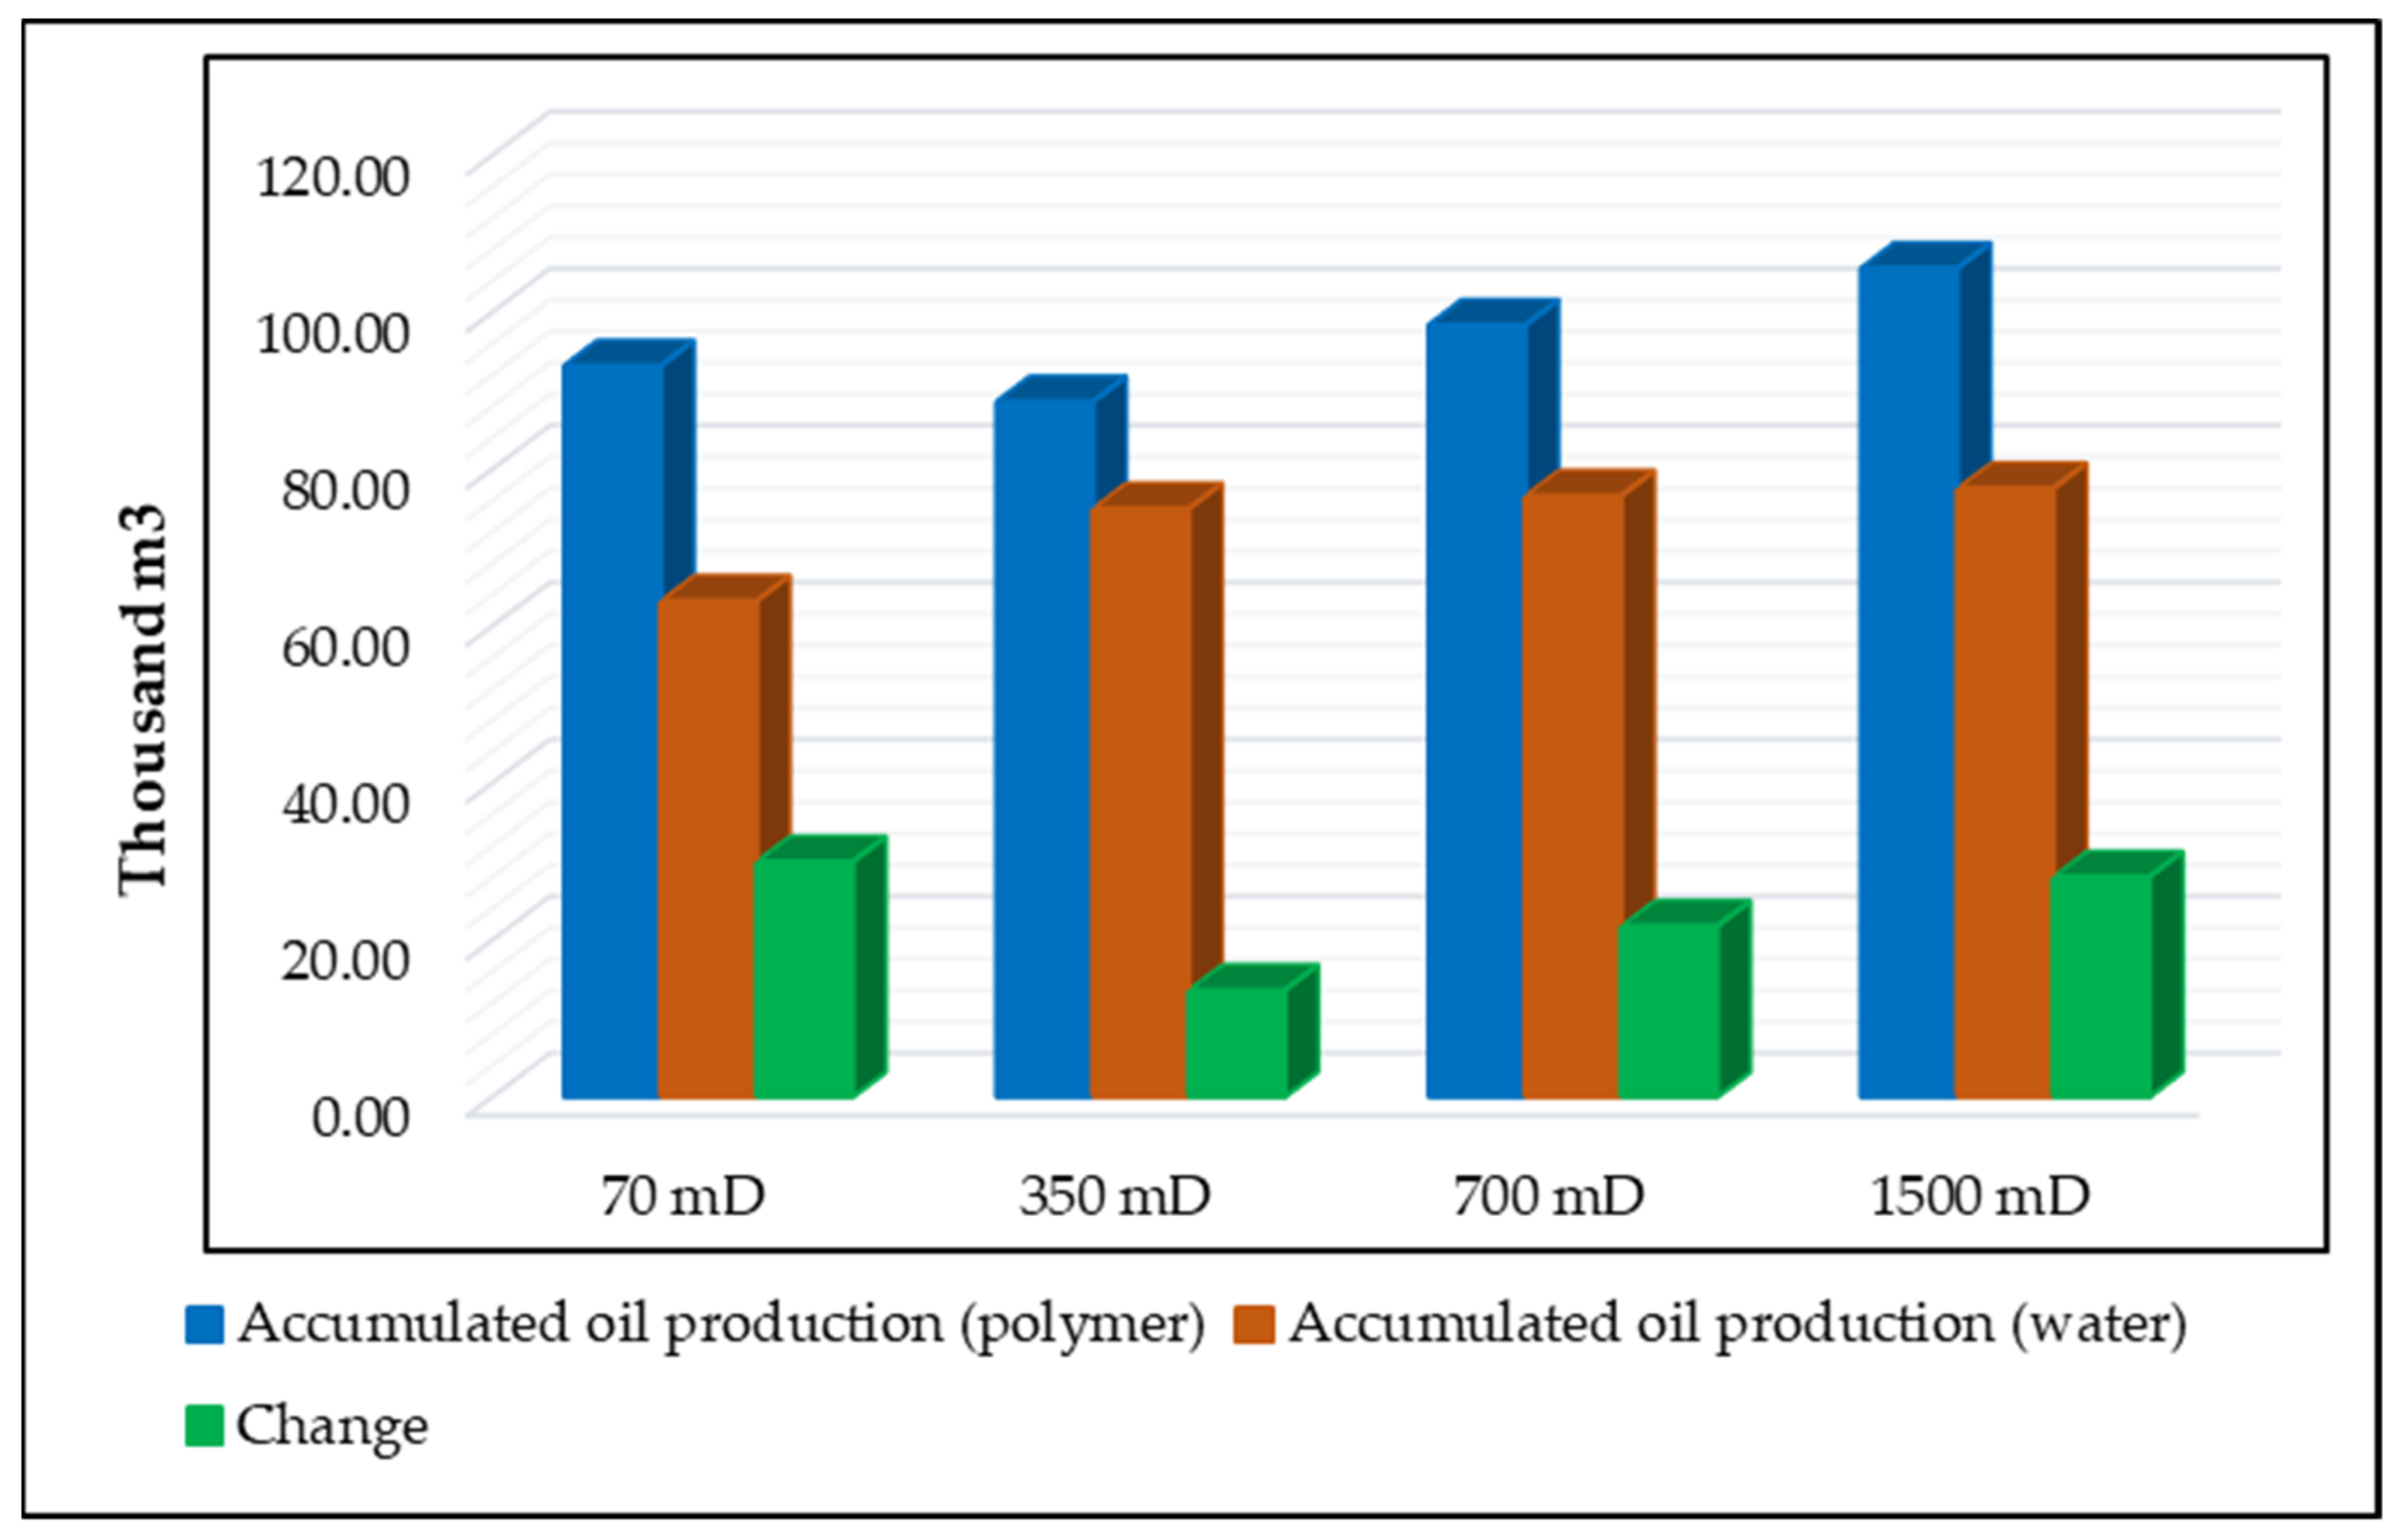
Figure 13.
As can be seen from the figure, the introduction of polymer water flooding in all cases represents a significant increase in the final value of accumulated oil production. The maximum increase was observed in the reservoir model with an average permeability of 70 mD, which may be primarily due to the maximum residual resistance.
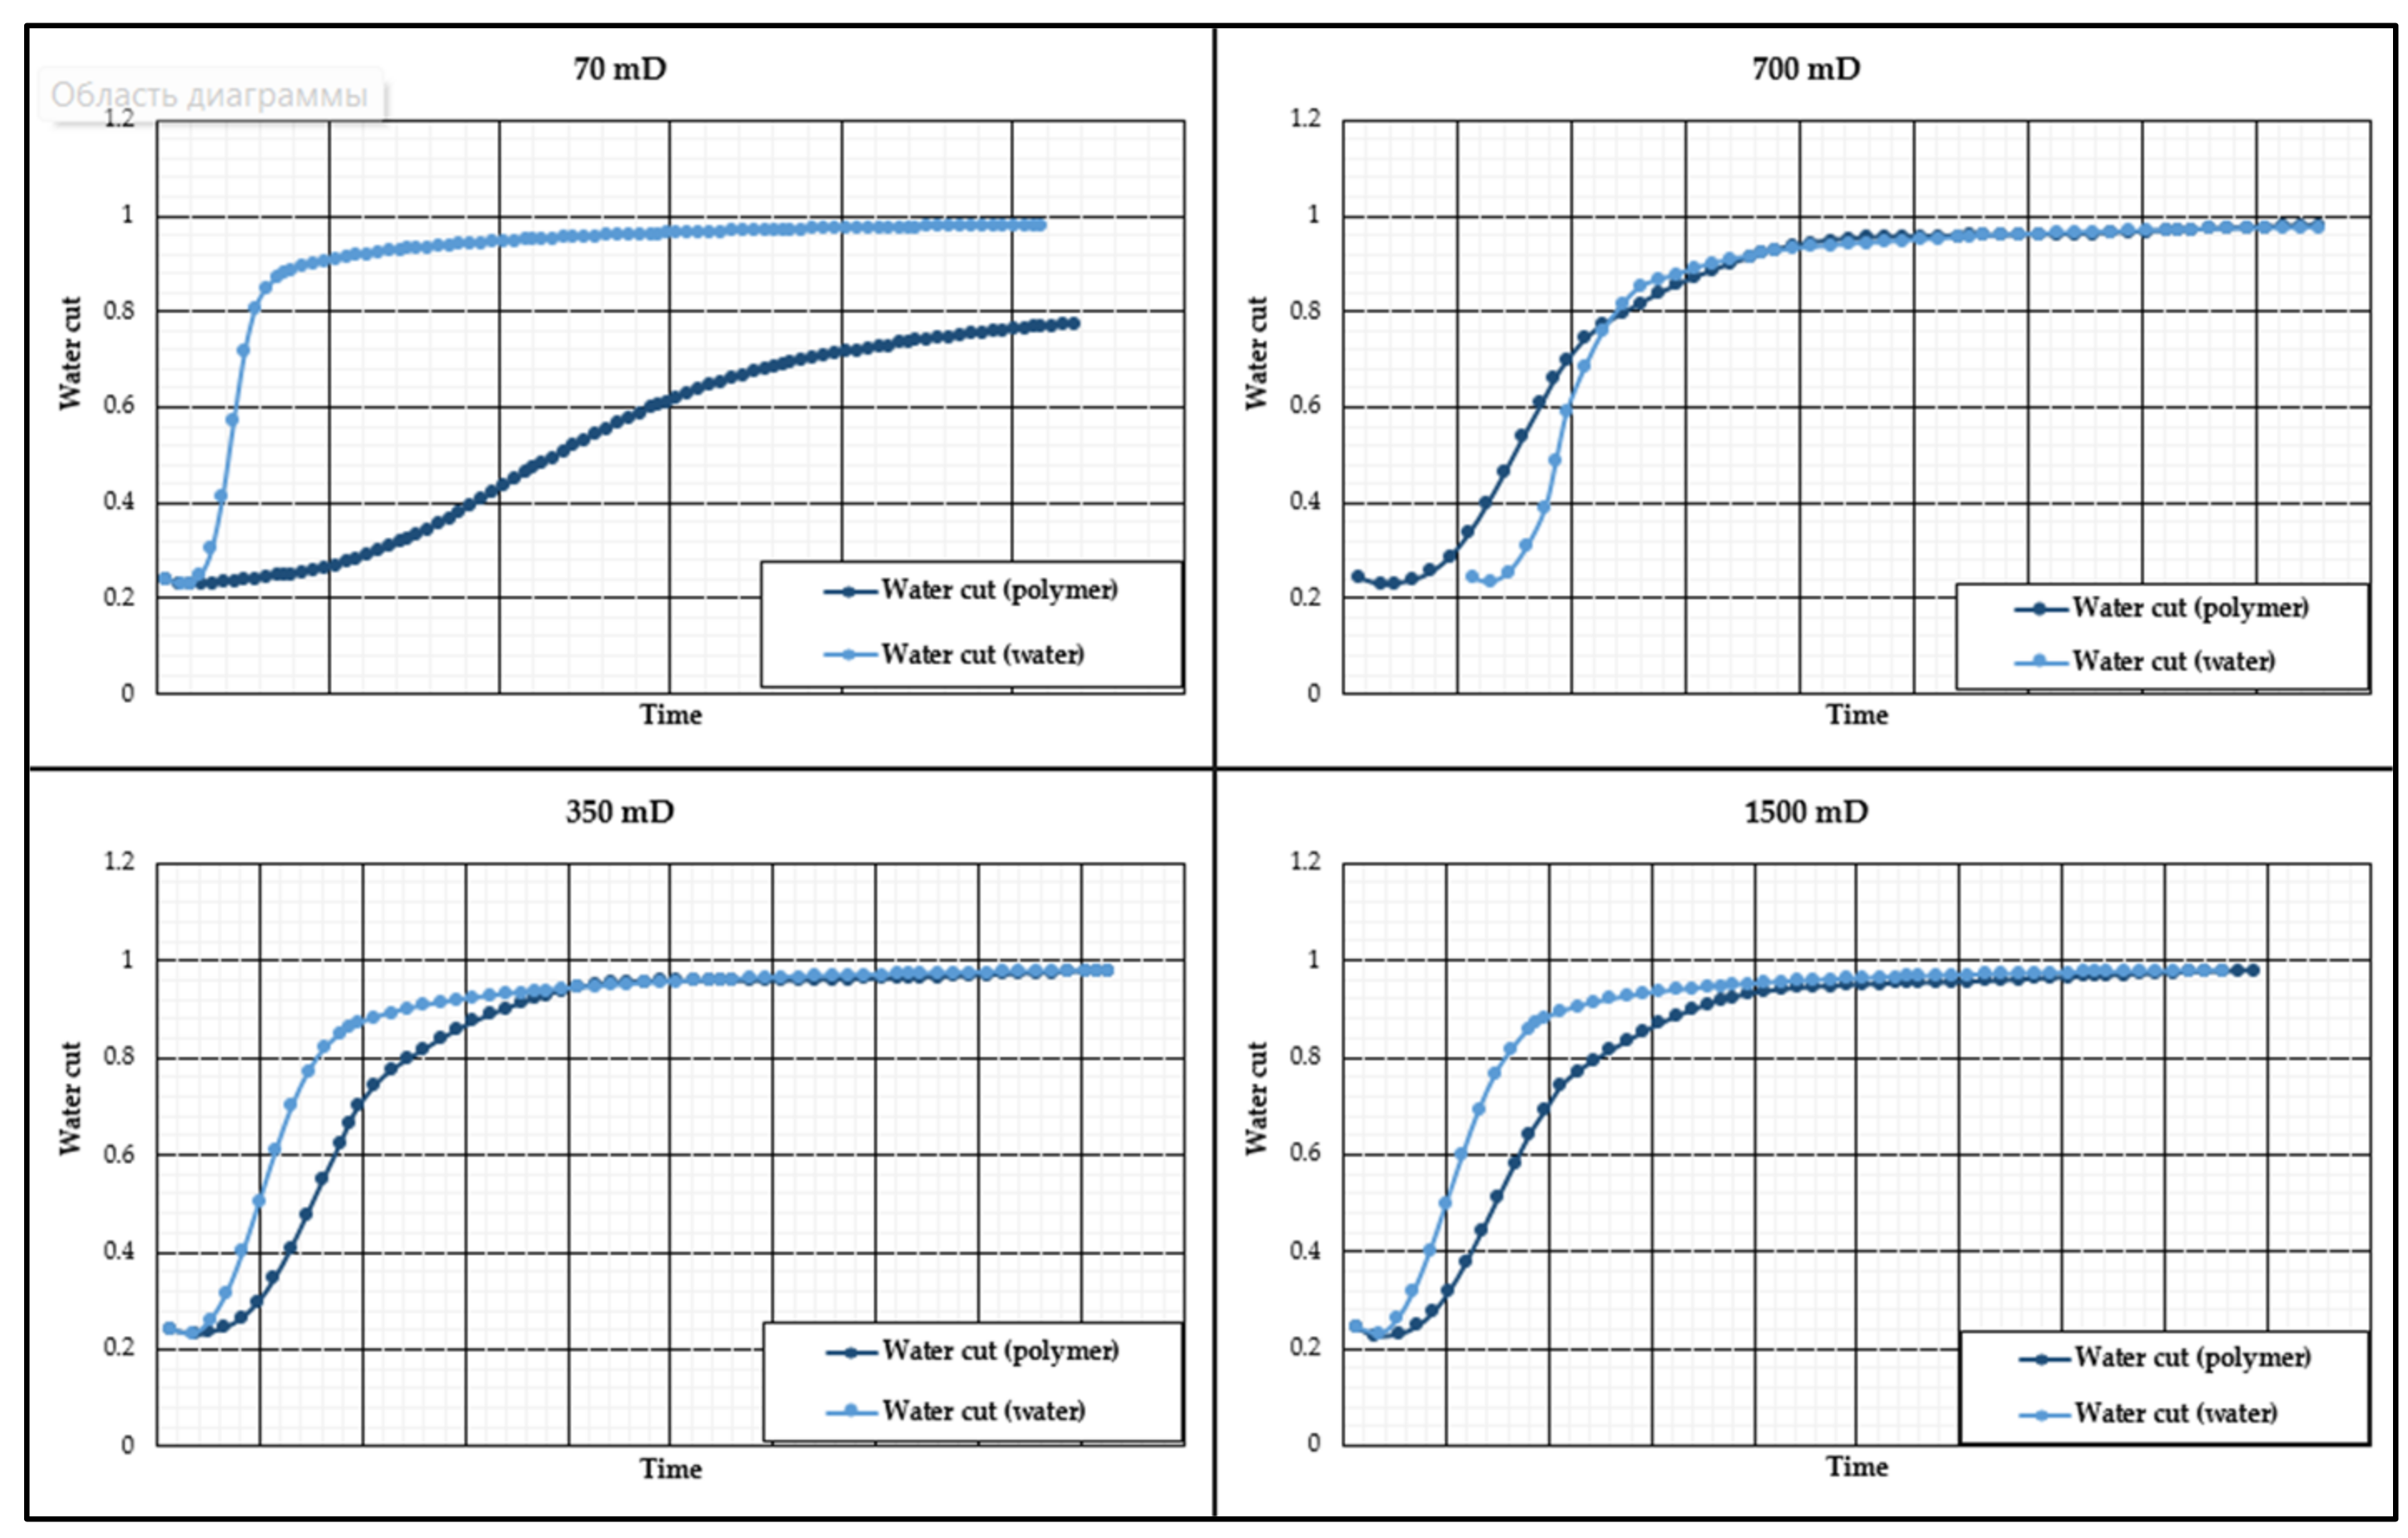
Additionally, the next important factor influenced by polymer water flooding technology was the dynamics of water cut. The dynamics of the water cut for the different calculation reservoir models are shown in
Figure 14.
As can be seen from most graphs, displacement by using polymers occurred later than traditional displacement by water, most likely due to the that the water, due to its high mobility, breaks through the oil front, and that the wells are faster to reach the most cost-effective value based on water cut. However, some graphs show no significant influence of the polymer on the water cut dynamics. From this, it can be concluded that the introduction of polymeric water flooding had, in most cases, a positive influence on the water cut dynamics of the wells, but this was not the main objective.
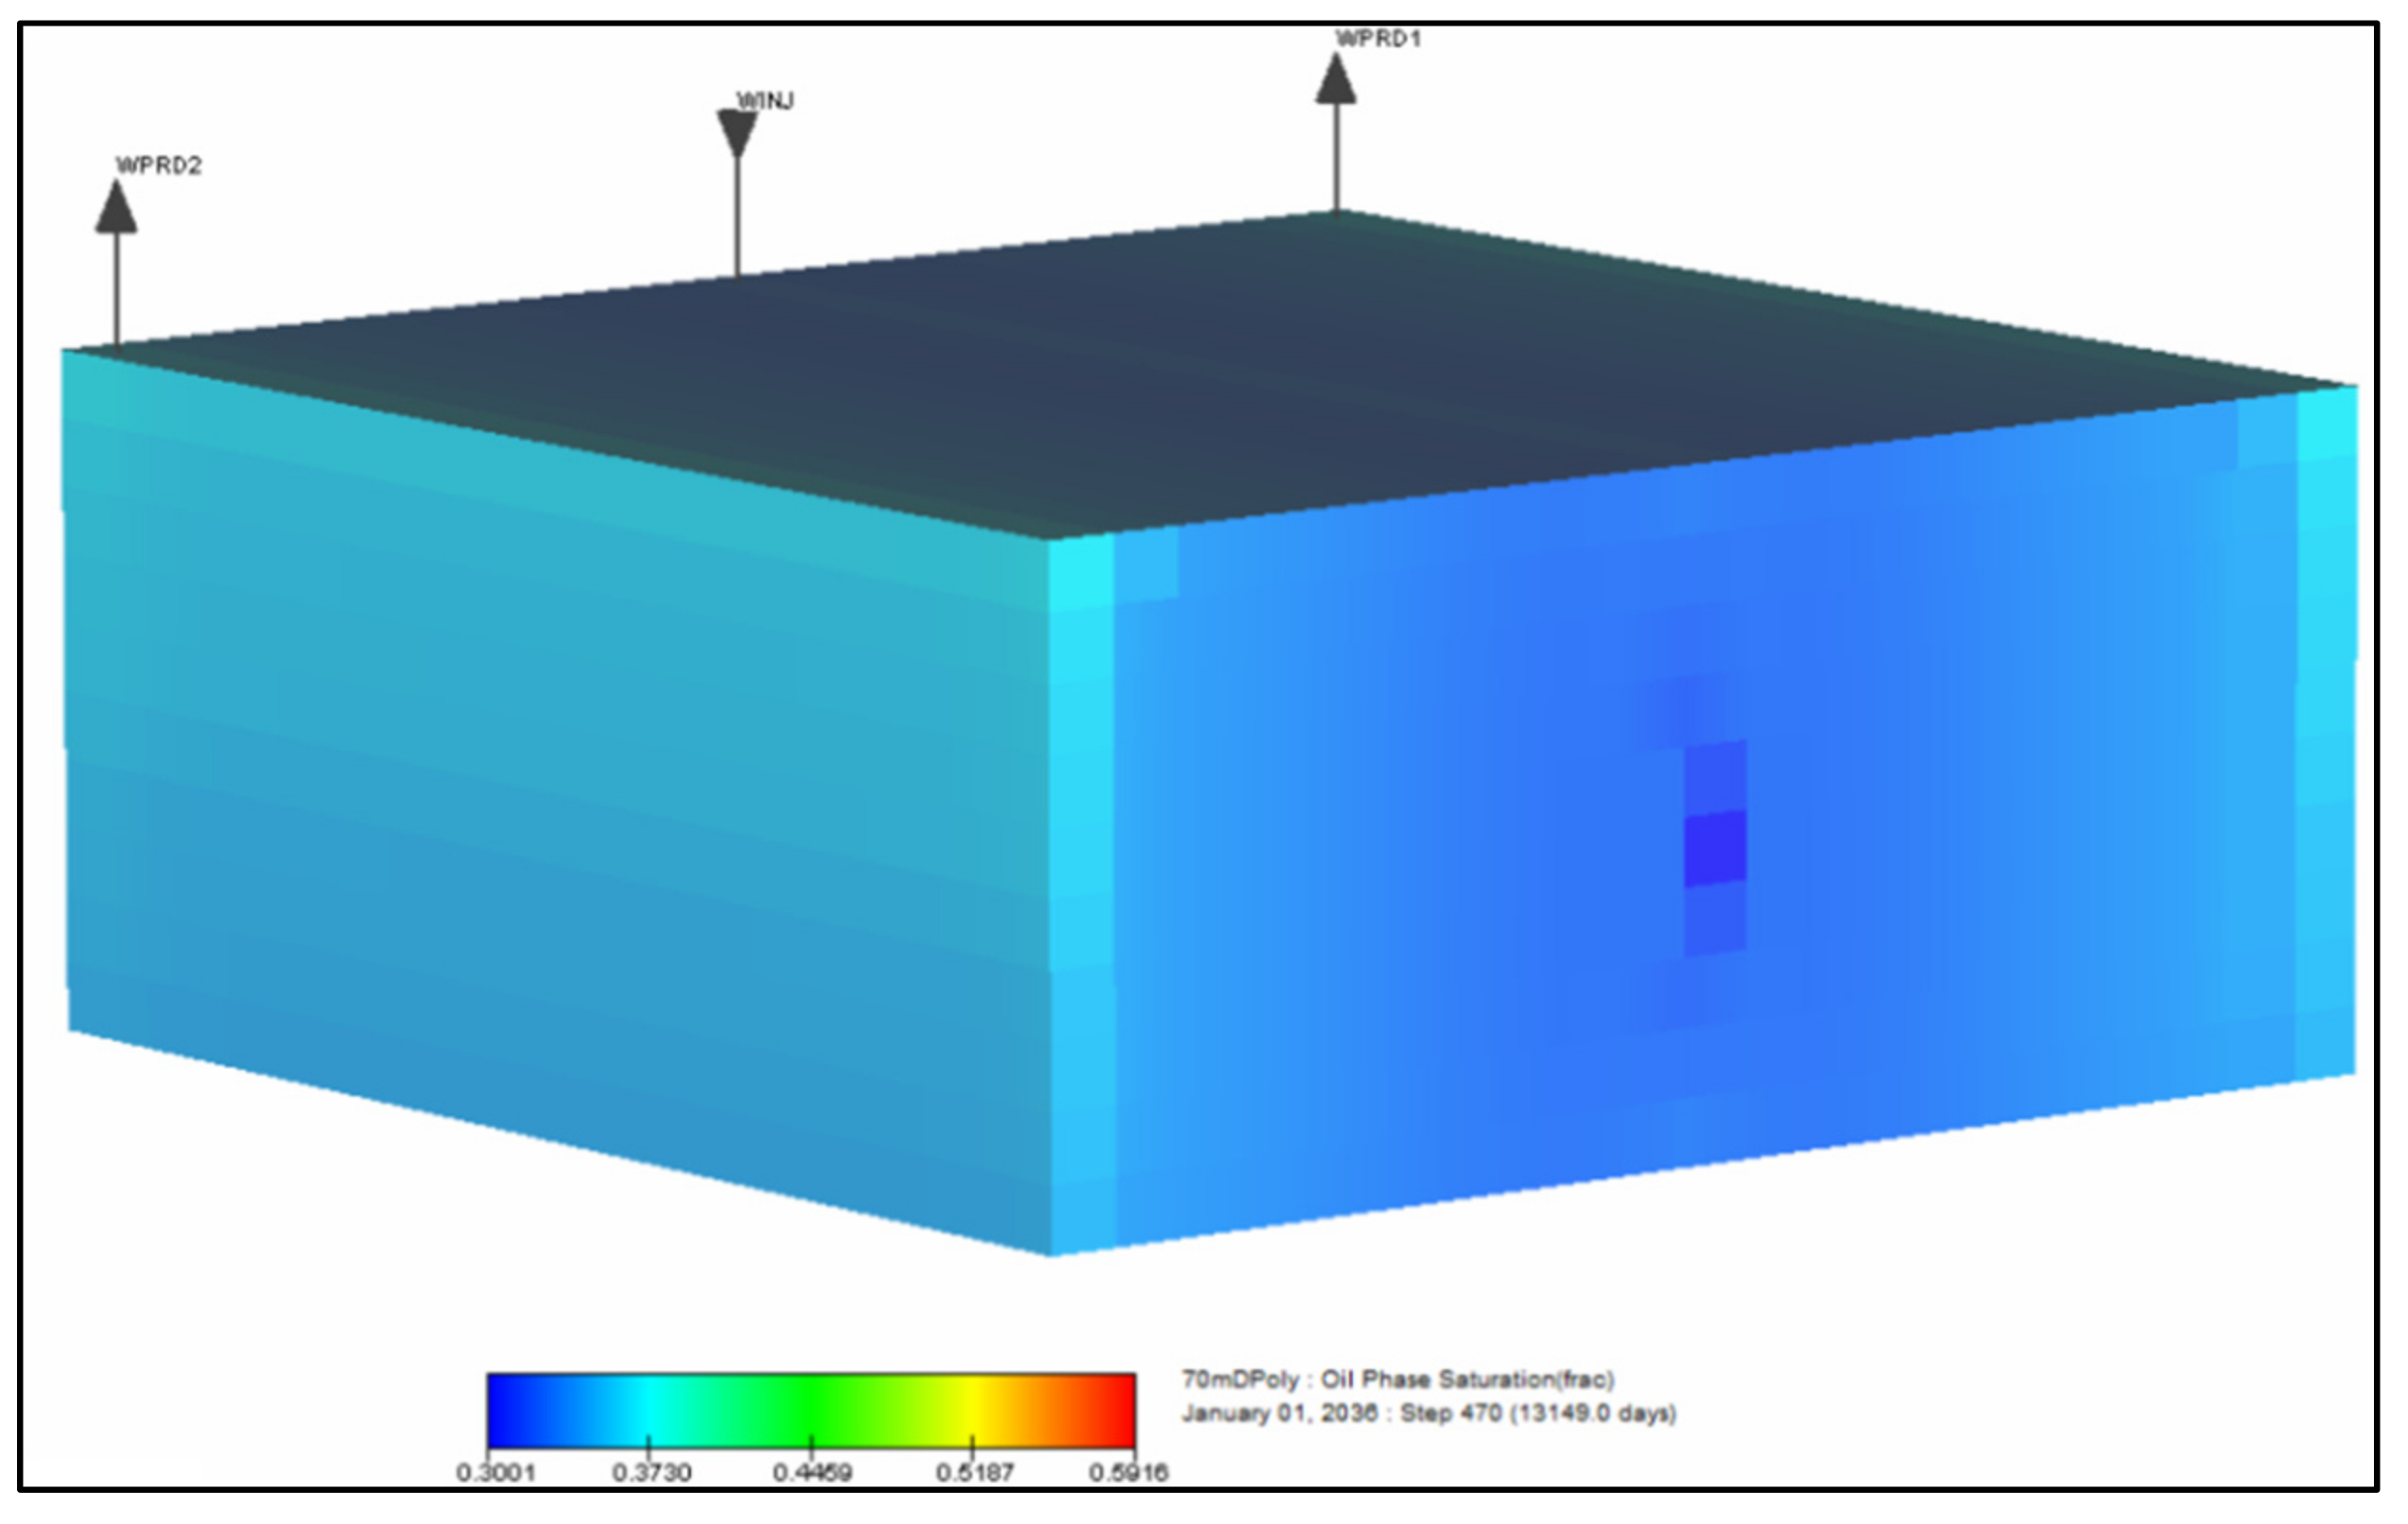
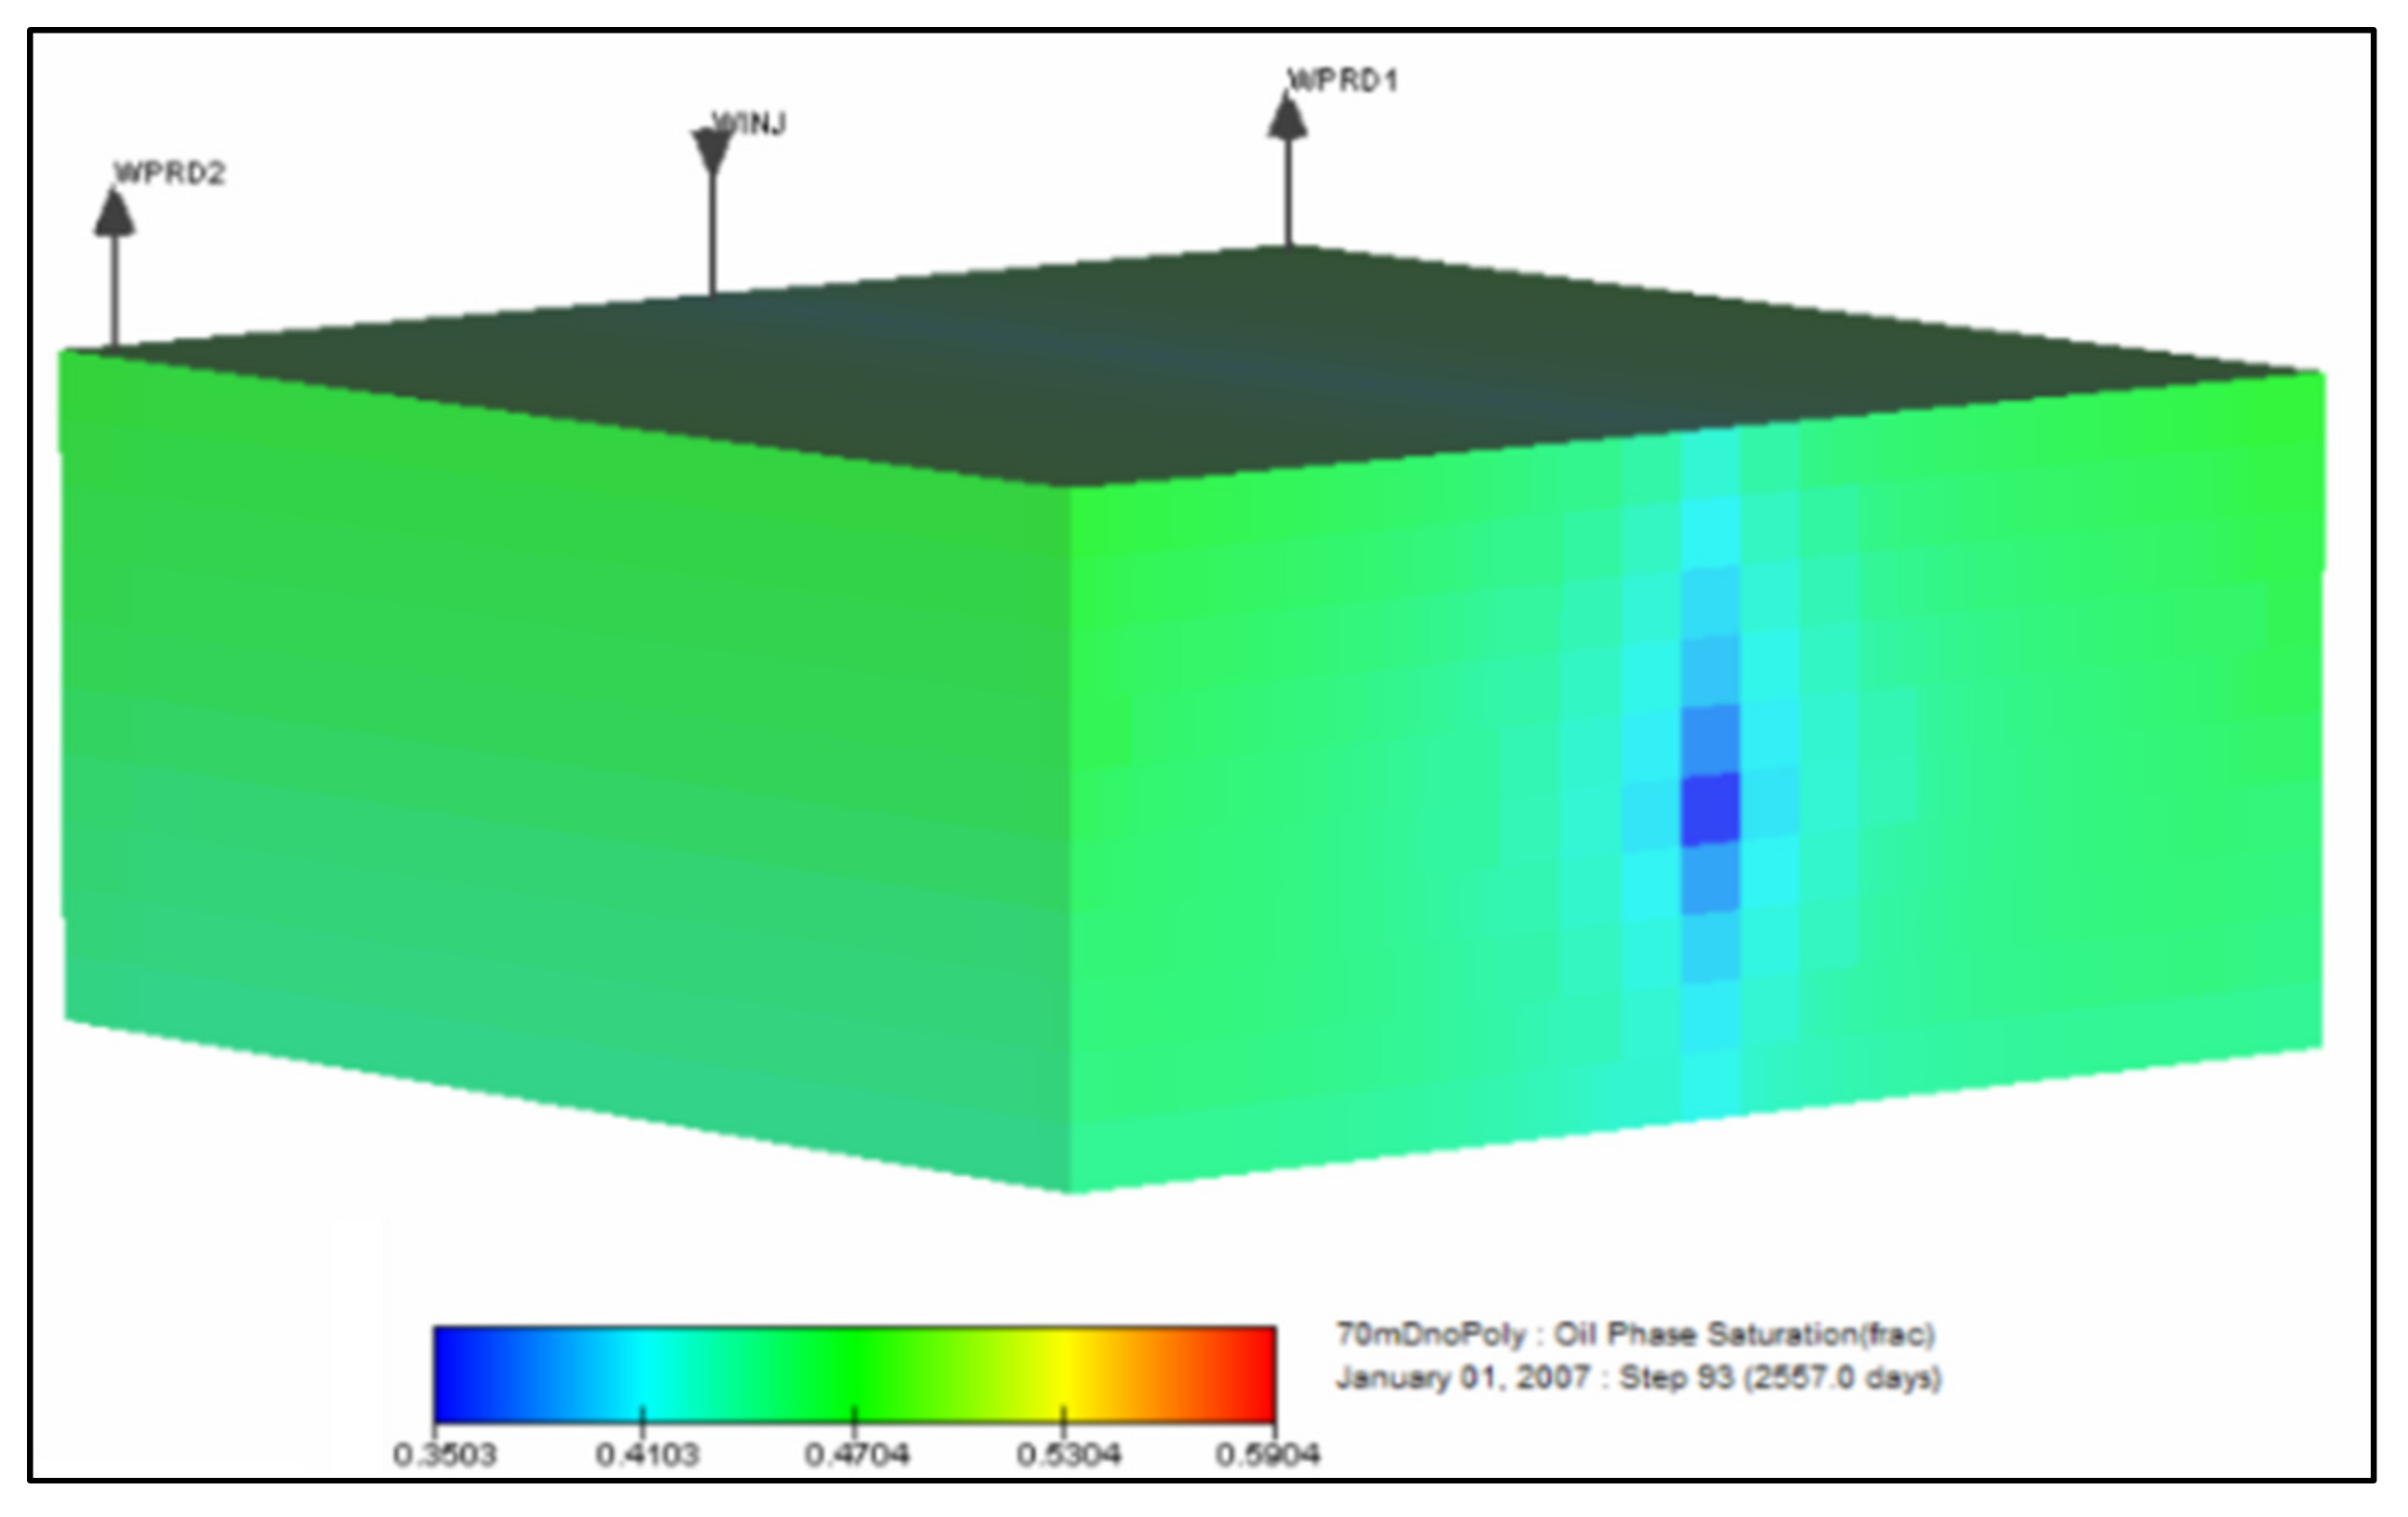
Below is the distribution of residual oil saturation at the end of the calculation period for water displacement (
Figure 15) and polymer solution displacement (
Figure 16) on a 70-mD reservoir model, which were assessed as well.
By comparing the distribution of oil saturation, it can be concluded that the introduction of polymer water flooding technology allowed covering the deposits more fully with the process of displacement. The values for residual oil saturation were close to those for scaled connate water saturation.
Additional oil production per ton of polymer-injected polymer is also an important indicator of the efficiency of polymer water flooding technology.
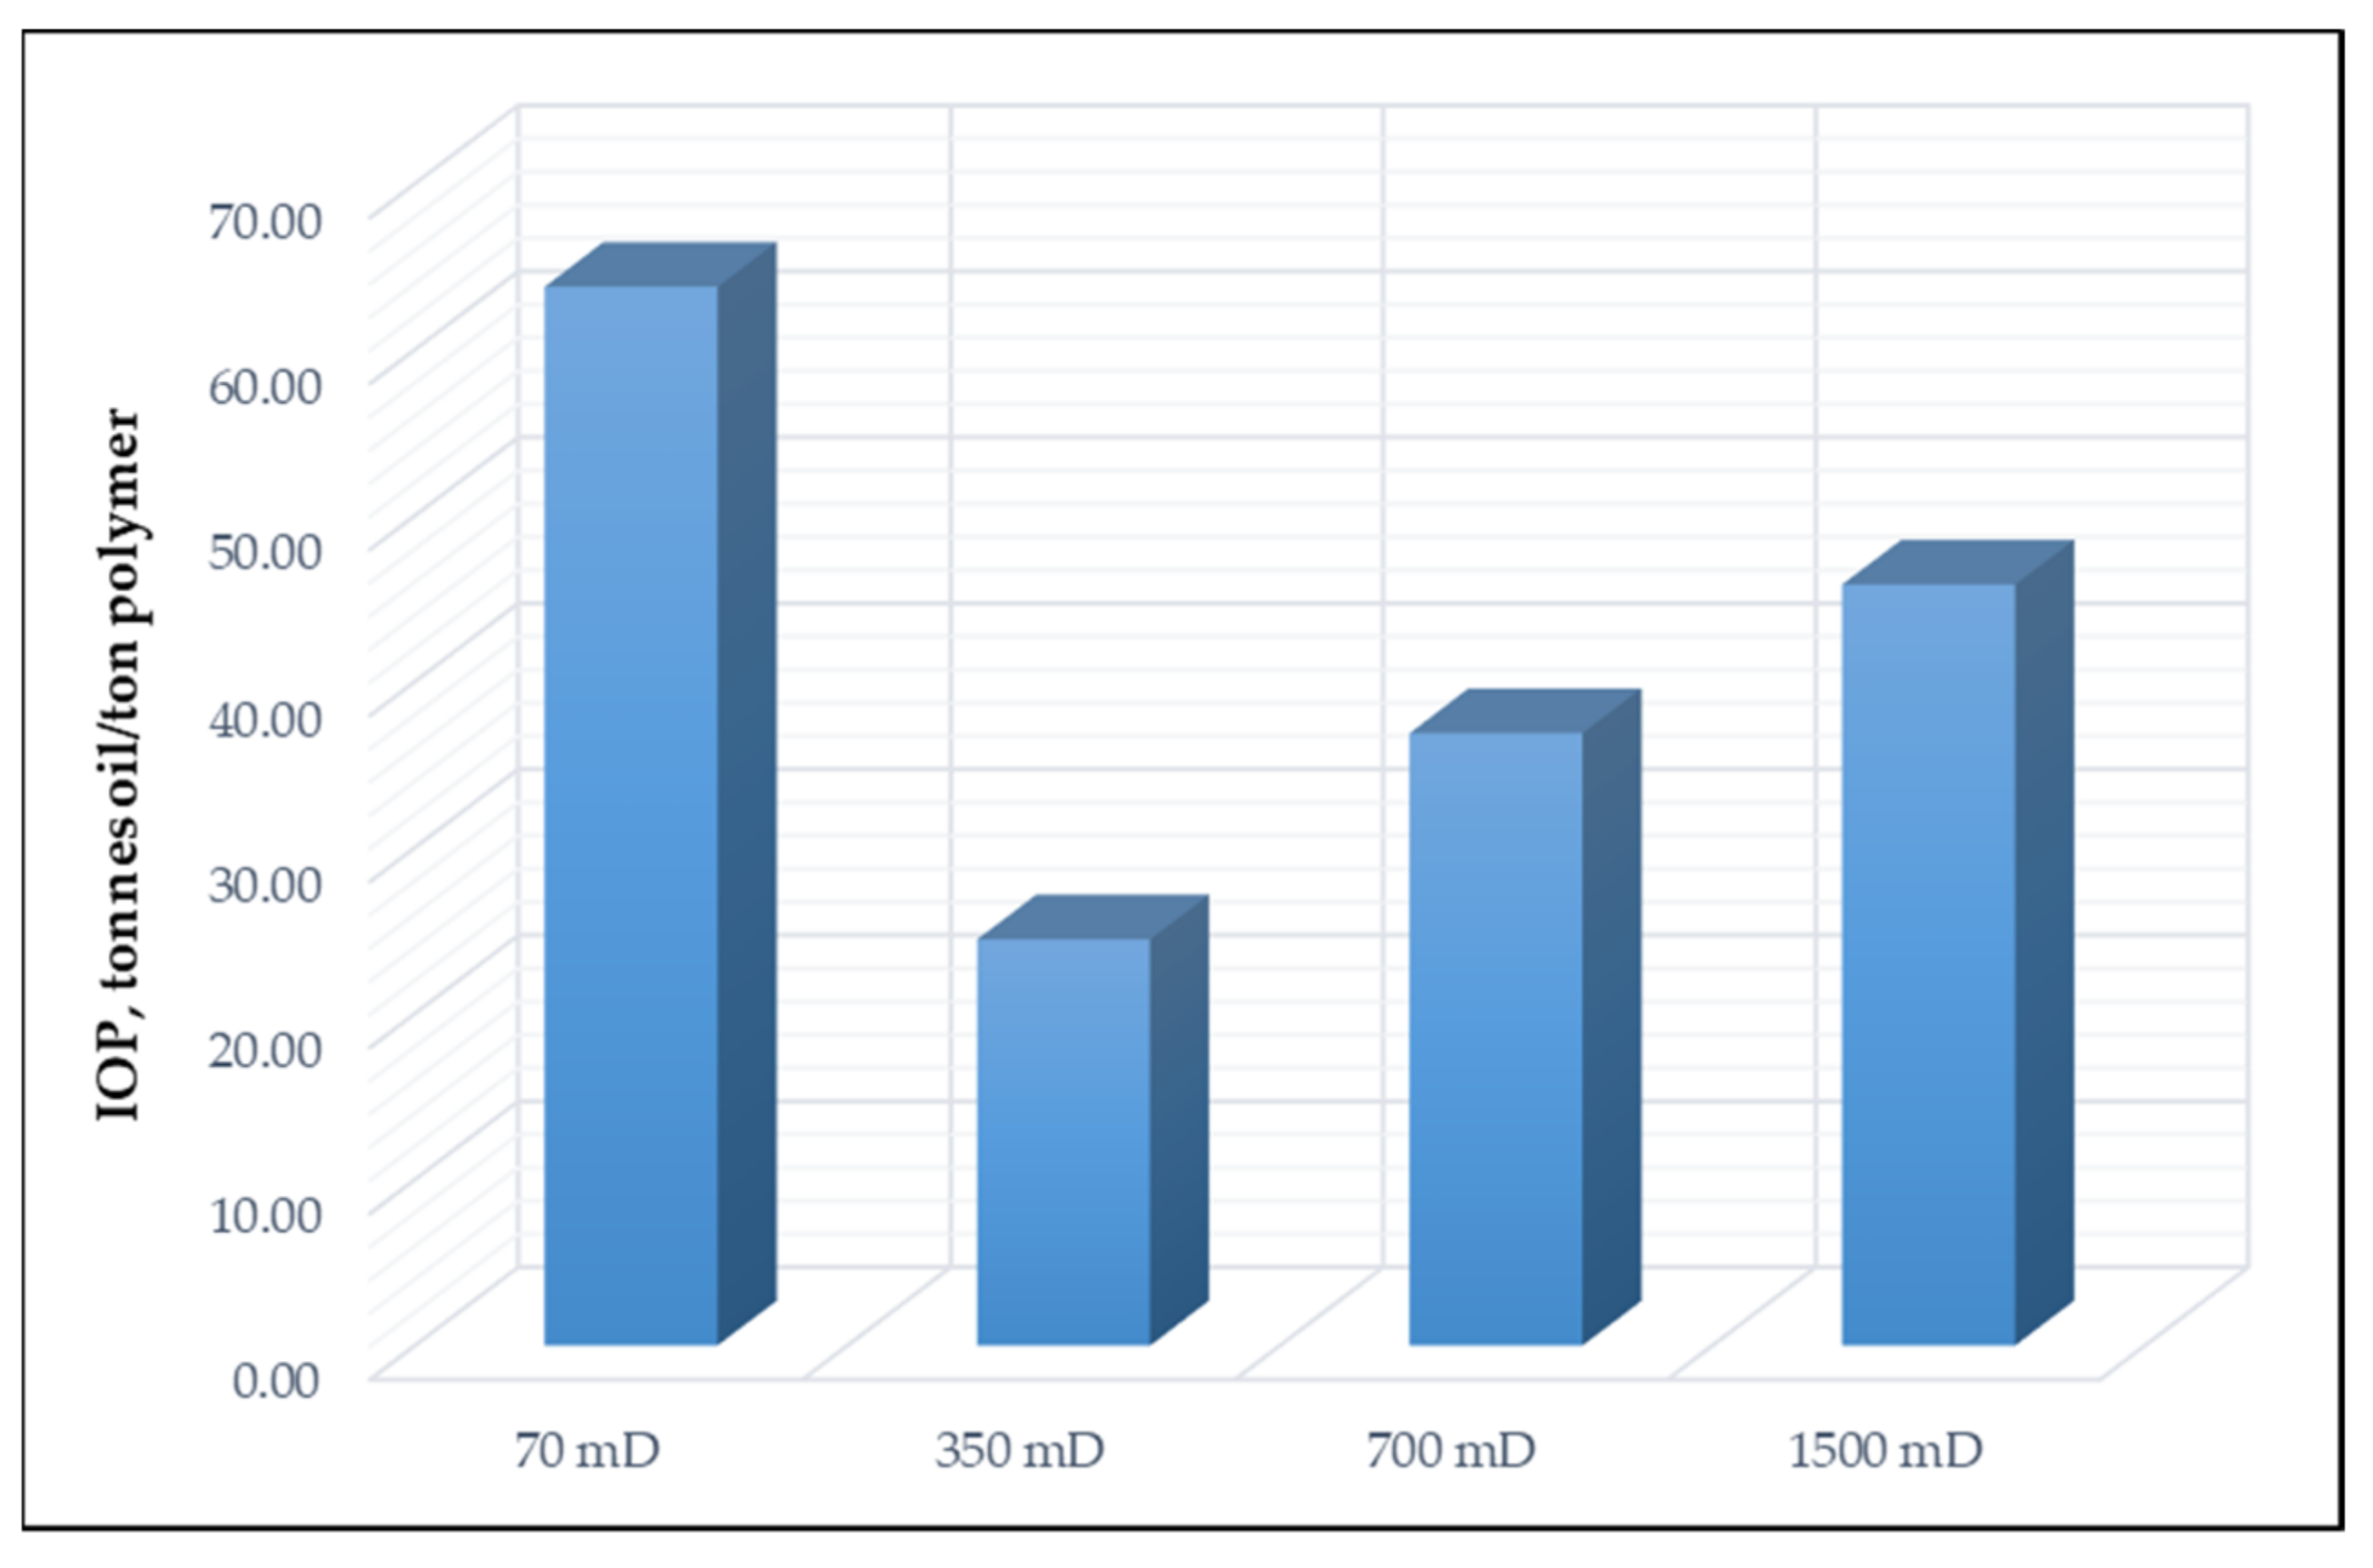
Figure 17 presents the specific effects based on the calculation models.
As can be seen from the figure, the impact was always greater than 20 tons, which, in the long run, would have a high economic impact if the technology were implemented in large fields.
To summarize, in all the cases, there was a technological effect resulting from a positive increase in the value of accumulated oil production at the end of the calculation period (until the limit of profitable exploitation is reached). Moreover, the permeability of 70 mD had the largest impact, of more than 60 tons of additional oil produced per ton of polymer. Polymeric water flooding also had the most positive influence on the water cut dynamics in the medium permeability reservoir of 70 mD.


 ,
, 


