Article

Modelling of the Electric Energy Storage Process in a PCM Battery

1
Faculty of Production and Power Engineering, University of Agriculture in Krakow, 30-149 Krakow, Poland
2
Faculty of Environmental Engineering and Land Surveying, University of Agriculture in Krakow, 30-059 Krakow, Poland
*
Author to whom correspondence should be addressed.
Energies 2022, 15(3), 735; https://doi.org/10.3390/en15030735
Submission received: 10 December 2021 / Revised: 3 January 2022 / Accepted: 11 January 2022 / Published: 20 January 2022

Abstract

:
The essence of the research was the modeling of a real electric energy storage system in a phase change battery operating in a foil tunnel. The scope of the work covered the construction of two partial models, i.e., energy storage in the PCM accumulator and heat losses in the PCM accumulator. Their construction was based on modeling methods selected on the basis of a literature review and previous analyses, i.e., artificial neural networks, random forest, enhanced regression trees, MARS plines, standard multiple regression, standard regression trees, exhaustive for regression trees. Based on the analysis of the error values, the models of the best quality were selected. The final result of this study was the construction of such a model of the process of storing electricity in a PCM battery, characterized by the mean absolute percentage error forecast error of 1–2%. The achievement of this goal was possible thanks to the use of the artificial neural networks model for which the input variables were the amount of energy supplied to the accumulator and the temperature of the heat storage medium.

1. Introduction

In recent years, we have observed a growing interest in photovoltaic conversion, which consists in the direct conversion of solar radiation energy into electricity, with the use of photovoltaic cells. This requires the efficient use of the energy obtained, because the availability of solar radiation energy is very variable in the daily and annual period. Therefore, it is necessary to take actions both in the area of forecasting energy yield in advance of time as well as in the field of effective energy storage [1].
A typical information source for forecasting energy yield is a map of predicted annual electricity production, which may be available free of charge as well as commercially. Well-known sources of such data in Europe are services such as SoDa using the HelioClim [2], PVGIS [3,4] or METEONORM [5] databases. Commonly used solar bases are based mainly on satellite measurements from various observation systems (the most popular are METEOSAT in Europe, GOES in the USA and GMS in Japan), sometimes the databases are supplemented with information from ground measurements. The result of the forecast can be defined as an estimate of the annual electricity production from a PV installation in relation to 1 kWp of installed power for a given geographic location for a typical meteorological year.
For the current control of the operation of the photovoltaic installation, forecasts are not required with an annual resolution, but with a daily or hourly resolution. Most often they are built on the basis of forecasts of meteorological conditions at the location of the gym. Among the commonly used methods for forecasting electricity yield from a PV power plant, we can distinguish statistical and time series methods, physical methods and team methods.
The review of forecasting methods with the specification of the forecast horizon and resolution is included in publications [6,7]. The most common method of forecasting energy yield from photovoltaic power plants, as well as in all types of short-term forecasts in the power industry, are models of artificial neural networks [8,9,10,11]. The NARX (nonlinear autoregressive exogenous model) statistical nonlinear model is very often implemented in the neural network [12,13]. These models use both endogenous delayed variables (time series of power production) and additional exogenous delayed variables and their values from the analyzed period [14]. Most studies on short-term power generation forecasting in photovoltaic systems use the MLP (multilayer perceptron) neural network [15,16,17,18,19]. Moreover, neural networks of the SVM type (support vector machine) [20,21], recursive neural networks RNNs (recurrent neural networks), e.g., the Elman network [19], and neural networks of the RBF type (radial base function) are also used [19,22,23].
After choosing the method, the second problem is the selection of independent variables. The short-term forecast of the power of the photovoltaic system should take into account such data as: power of the installation, insolation, operating temperature of cells, air humidity, calendar data (e.g., hour of the day or name of the month) [24]. The selection of a specific set of variables should be made on the basis of statistical analysis and their substantive usefulness. Accurately forecasting electricity consumption (demand and supply) is key to making informed decisions about energy infrastructure for generating and distributing energy. The accuracy of forecasts is determined using various standardized performance evaluation methods:
  • Mean squared error—MSE [25],
  • Root mean square error—RMSE [26],
  • Normalized root mean square error—nRMSE [27],
  • Mean absolute error—MAE [28],
  • Mean absolute percentage error—MAPE [29],
  • Mean relative error—MRE [30],
  • Mean bias error—MBE [31].
All types of photovoltaic cells only convert the energy of solar radiation into electricity without the possibility of direct permanent storage. Photovoltaic systems, due to the large dispersion of generation sources with relatively low power, force development in the field of local storage of the generated energy. The use of these systems by individual users helps to increase self-consumption [32] and integrates PV energy production and the electricity market [33]. The easiest way to store the electricity produced by small photovoltaic installations is to use electric batteries.
Currently, the storage of energy from PV systems mainly uses lithium-ion batteries, which show great potential due to fewer limitations than in lead-acid batteries [34,35,36,37], but their disadvantage is environmental pollution during their disposal [38].
Electricity obtained from a photovoltaic power plant can also be further converted and stored in the form of heat. For this purpose, materials with high specific or latent heat values are used, among others. Very good results are also obtained for materials that use both of these indicators in the process of energy storage [39]. The research on the efficiency of energy storage in batteries using phase change materials (PCM) has already been investigated by scientists from many centers [40,41,42]. These studies show that the main advantage of this form of energy storage is due to the fact that large amounts of energy are absorbed or given off during the melting and solidification process. Thanks to this, it is possible to reduce the demand for an energy storage medium and thus minimize the dimensions of the accumulator compared to other systems of the same capacity.
Modeling the process of accumulating energy in a PCM battery is very difficult due to its course. Scientists have been dealing with this issue for many years. The result of their work is the development of many methods used for this purpose. One of the newest is a simplified resistive-capacitive (RC) simulation model [43]. It allows the simulation of free convection in the liquid phase during the charging of the PCM battery. The developed model allowed to obtain comparable results with the model built using the finite element method. The temperature difference of the heat storage medium between the two models was only 0.62 K. However, the publication [44] presents a semi-analytical model to describe the transient heat transfer in a material in which the phase change process takes place. The obtained results were comparable to the commercial package based on the FEMMMASSE finite element theory. Models were based on the apparent heat capacity method [45,46,47,48,49], and methods using the temperature transformation originally proposed by Cao and Faghri [50] as well as the heat source method developed by Eyres et al. [51].
However, it is the enthalpy method and the effective heat capacity method that are the two most commonly used modeling methods in simulations of phase transitions [52,53,54,55,56,57,58].
To model the operation of PCM batteries, numerical methods are also used, taking into account changes in thermal properties related to the melting and solidification processes. Therefore, these methods mathematically combine the heat storage capacity described by specific heat (Cp), enthalpy (H) and temperature (T). These variables are determined using several techniques such as calorimetry, differential scanning calorimetry (DSC), and differential thermal analysis (DTA). Thanks to these techniques, it is possible to gain a deeper understanding of the various compounds and obtain information on which of them are more appropriate for the intended use [24]. Numerical modeling of the PCM battery provides a detailed understanding of the PCM phase change process when exposed to air. In article [59], two immiscible PCM fluids and air were modeled using the continuous surface force (CSF) model in the open source computational fluid dynamics (CFD) software, OpenFOAM. The results obtained from the full numerical model showed good agreement compared to the experiments. Despite some slight variations in the results, numerical modeling is a potential tool for optimizing the performance of thermal storage devices. Numerical calculations for models of thermodynamic phenomena require large computational outlays (even in the case of modeling relatively simple devices), they show considerable sensitivity to the model (e.g., grid structure). In analytical models, the solution is obtained in a significantly shorter time, because it usually uses simplifications. The obtained results can always be verified by numerical calculations, and in some cases this method can be used interchangeably with the numerical model (e.g., in optimization, in inverse tasks). The combination of experimental and numerical research is a reasonable compromise between the duration of the research and the financial outlays for its implementation. Time-consuming and costly experiments should therefore only be carried out in a narrower range of PCM battery operating conditions. The practical use of verified numerical models is much faster and more flexible.
In the literature, computer methods are also often used to model the heat transfer problems with phase change. The enthalpy method also dominates among them [60,61] and the effective heat capacity method [62].
Both of these methods are relatively simple to implement and write into a computer program. The ANSYS Fluent software is the most frequently used software among computer programs [63,64] and MATLAB [65,66].
Simulations of complete cycles of phase changes are already well known and described in the literature. However, not all of the available PCM material will melt or solidify. Partial phase transitions are common during battery operation in real applications. This issue is currently not well understood and requires further research.
At present, energy storage seems to be purposeful and justified not only in the professional energy sector, but also in agricultural production, e.g., for drying processes [67,68,69], preparation of technological water [70], or for heating, for example, greenhouse facilities [71,72,73]. The method of storing energy in crops under cover, however, is associated with a number of limitations that are placed on the storage medium. These limitations are the same as the limitations for PCM materials used in thermal heat storage. Hence, it can be concluded that energy storage in thermal stores is justified in horticultural production [74,75].
Despite the research carried out in this area for many years, there is still a need to expand knowledge, especially in the field of modeling battery operation in real conditions. There are many factors that influence the process of storing energy in a phase change battery. The most important of them are the physicochemical and design parameters of the storage bed as well as the amount of energy supplied to it. Effective models of the battery operation process allow for a significant reduction in the optimization time of individual system elements, and thus reduce the financial outlays for its construction. They can also be used during battery life to control its operation in order to maximize the use of available energy. This aspect is particularly important if the source of energy supplying the battery is characterized by high dynamics.

2. Purpose and Scope of Work

The aim of the work was to build a model of the process of storing electricity in a phase change battery. The aim of the work was achieved by building the model of energy storage in the PCM battery and the model of energy loss in the PCM battery.
In the first part of the work, the usefulness of seven selected methods was analyzed, i.e., artificial neural networks (ANN), standard regression trees (BRT), enhanced (CHAID) and comprehensive (CRT) and standard multiple regression (SMR), random forest (RF), and multivariate adaptive regression splines (MARS) to describe the process of accumulating energy in a PCM battery during periods when the PV power plant generated enough electricity for its operation.
In the second part of the study, a model was built to determine energy losses in the phase change battery during unfavorable weather conditions and the charging process was interrupted for some time. The same methods were used to build the heat loss model as in the first part of battery operation modeling. Based on the adopted criteria, the quality of all tested methods was assessed, and then models were selected that would allow for forecasts with the smallest errors.

3. Materials and Methods

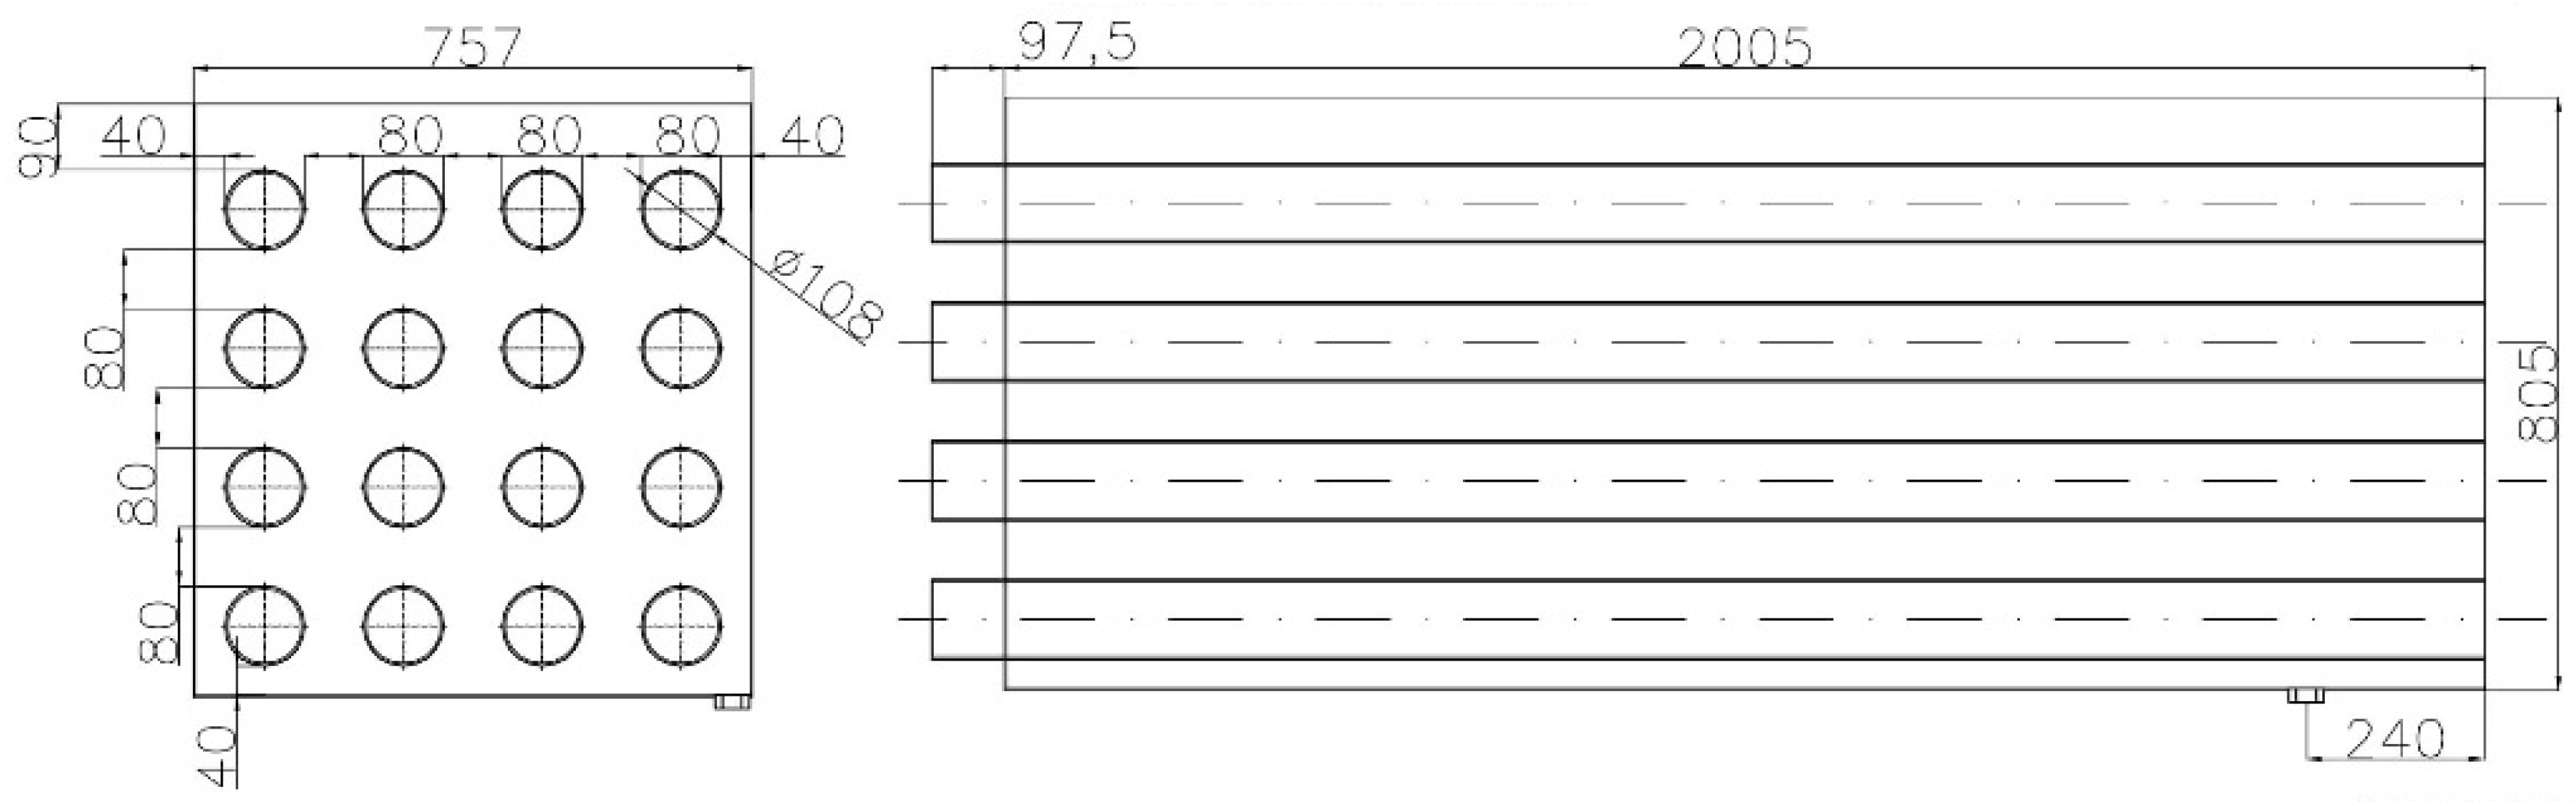
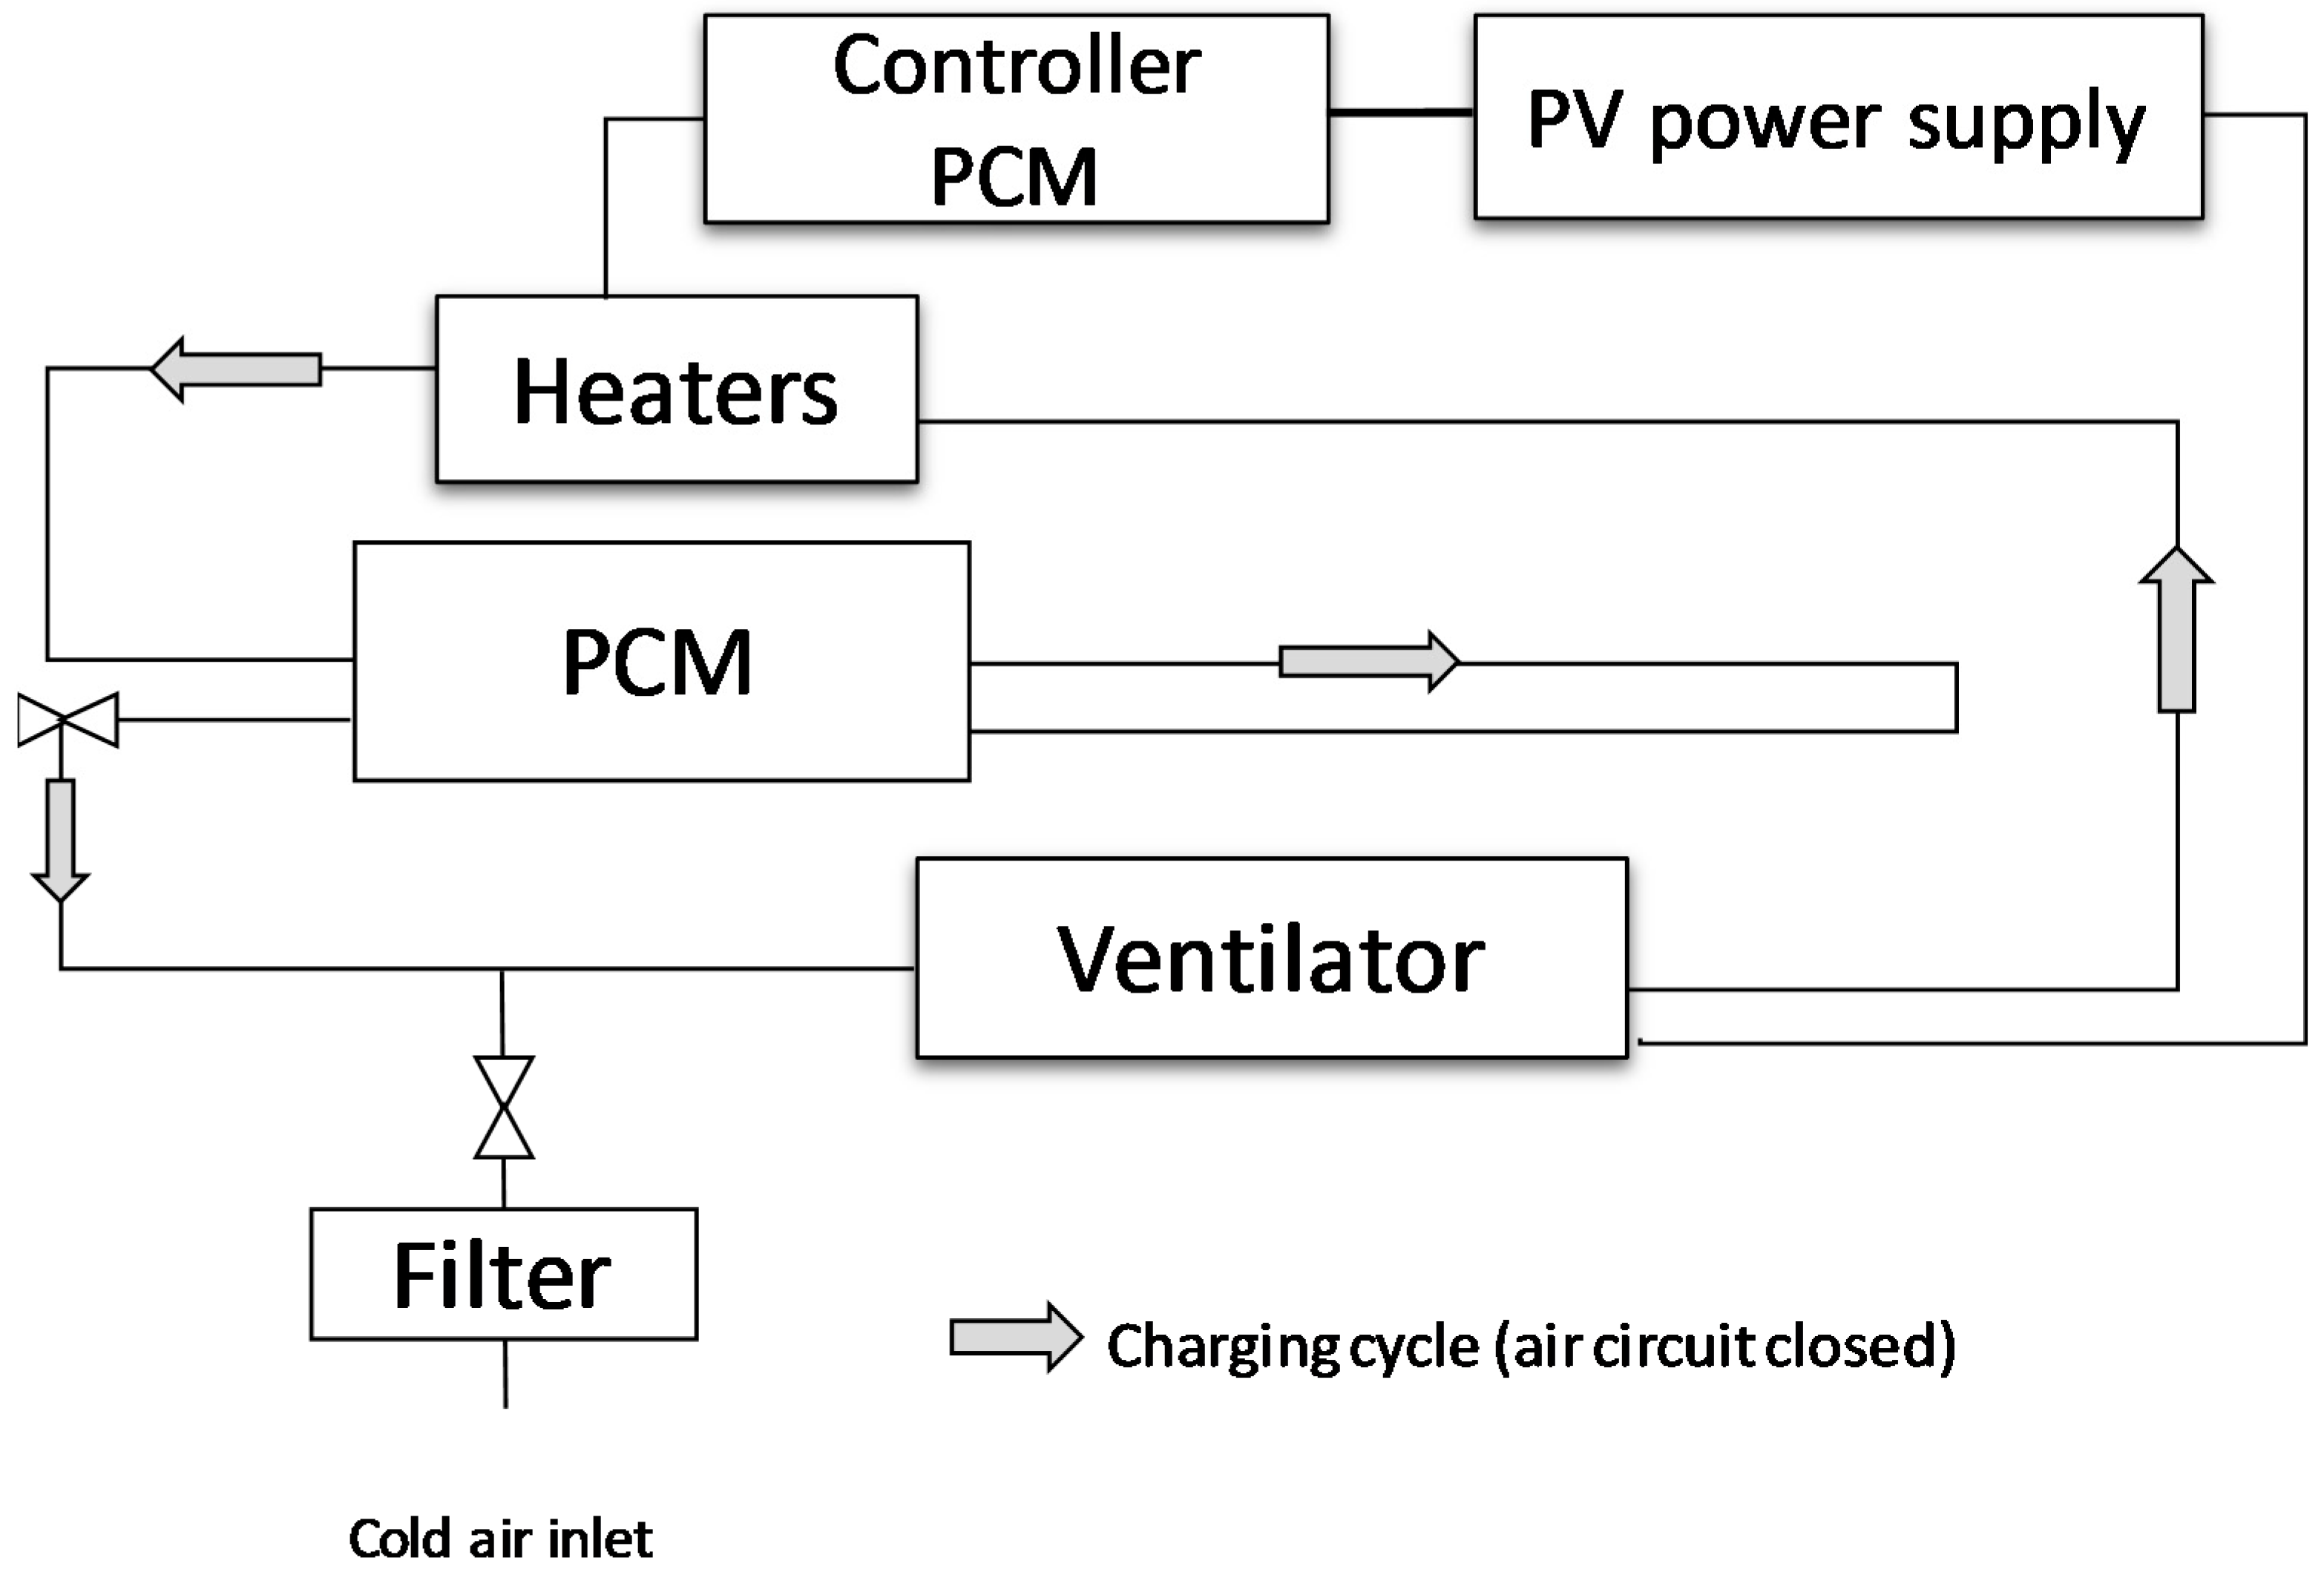
3.1. PCM Phase Conversion Battery

The subject of the research was the prototype of the phase change battery, storing the energy generated from the photovoltaic power plant, the technical data and the cross-section of which are shown in Table 1 and in Figure 1. The diagram of charging the PCM battery located in the experimental foil tunnel, located at the Faculty of Production and Power Engineering in Krakow is presented in Figure 2.
In addition, the battery had thermal insulation of mineral wool with a thickness of 10 cm. The applied insulation retains dimensional stability and does not deform during operation, even under variable temperature and humidity conditions. Furthermore, it is resistant to biological corrosion and chemicals, which is crucial to improving the efficiency of the battery.
To heat the air flowing through the PCM battery (sixteen symmetrical distributed pipes—4 rows of 4 pipes—with a diameter of 108 mm), a set of three heaters was used—each having a power of 3 kW with an axial fan whose power was 0.4 kW.

3.2. Storage Medium

The medium storing the heat in the phase change battery was the R58 paraffin. The filling weight was 750 kg of paraffin. To estimate the amount of energy stored in the PCM battery, the thermophysical properties of the R58 paraffin were determined:
  • Phase change temperature,
  • Latent heat,
  • Specific heat.
Measurement of the phase change temperature and latent heat (phase change heat) was determined by the differential scanning calorimetry (DSC) method using a Shimadzu DSC-60 apparatus [76]. The specific heat of the R58 paraffin was determined by the calorimetric method with the DSC 7 Perkin Elmer scanning calorimeter [77].

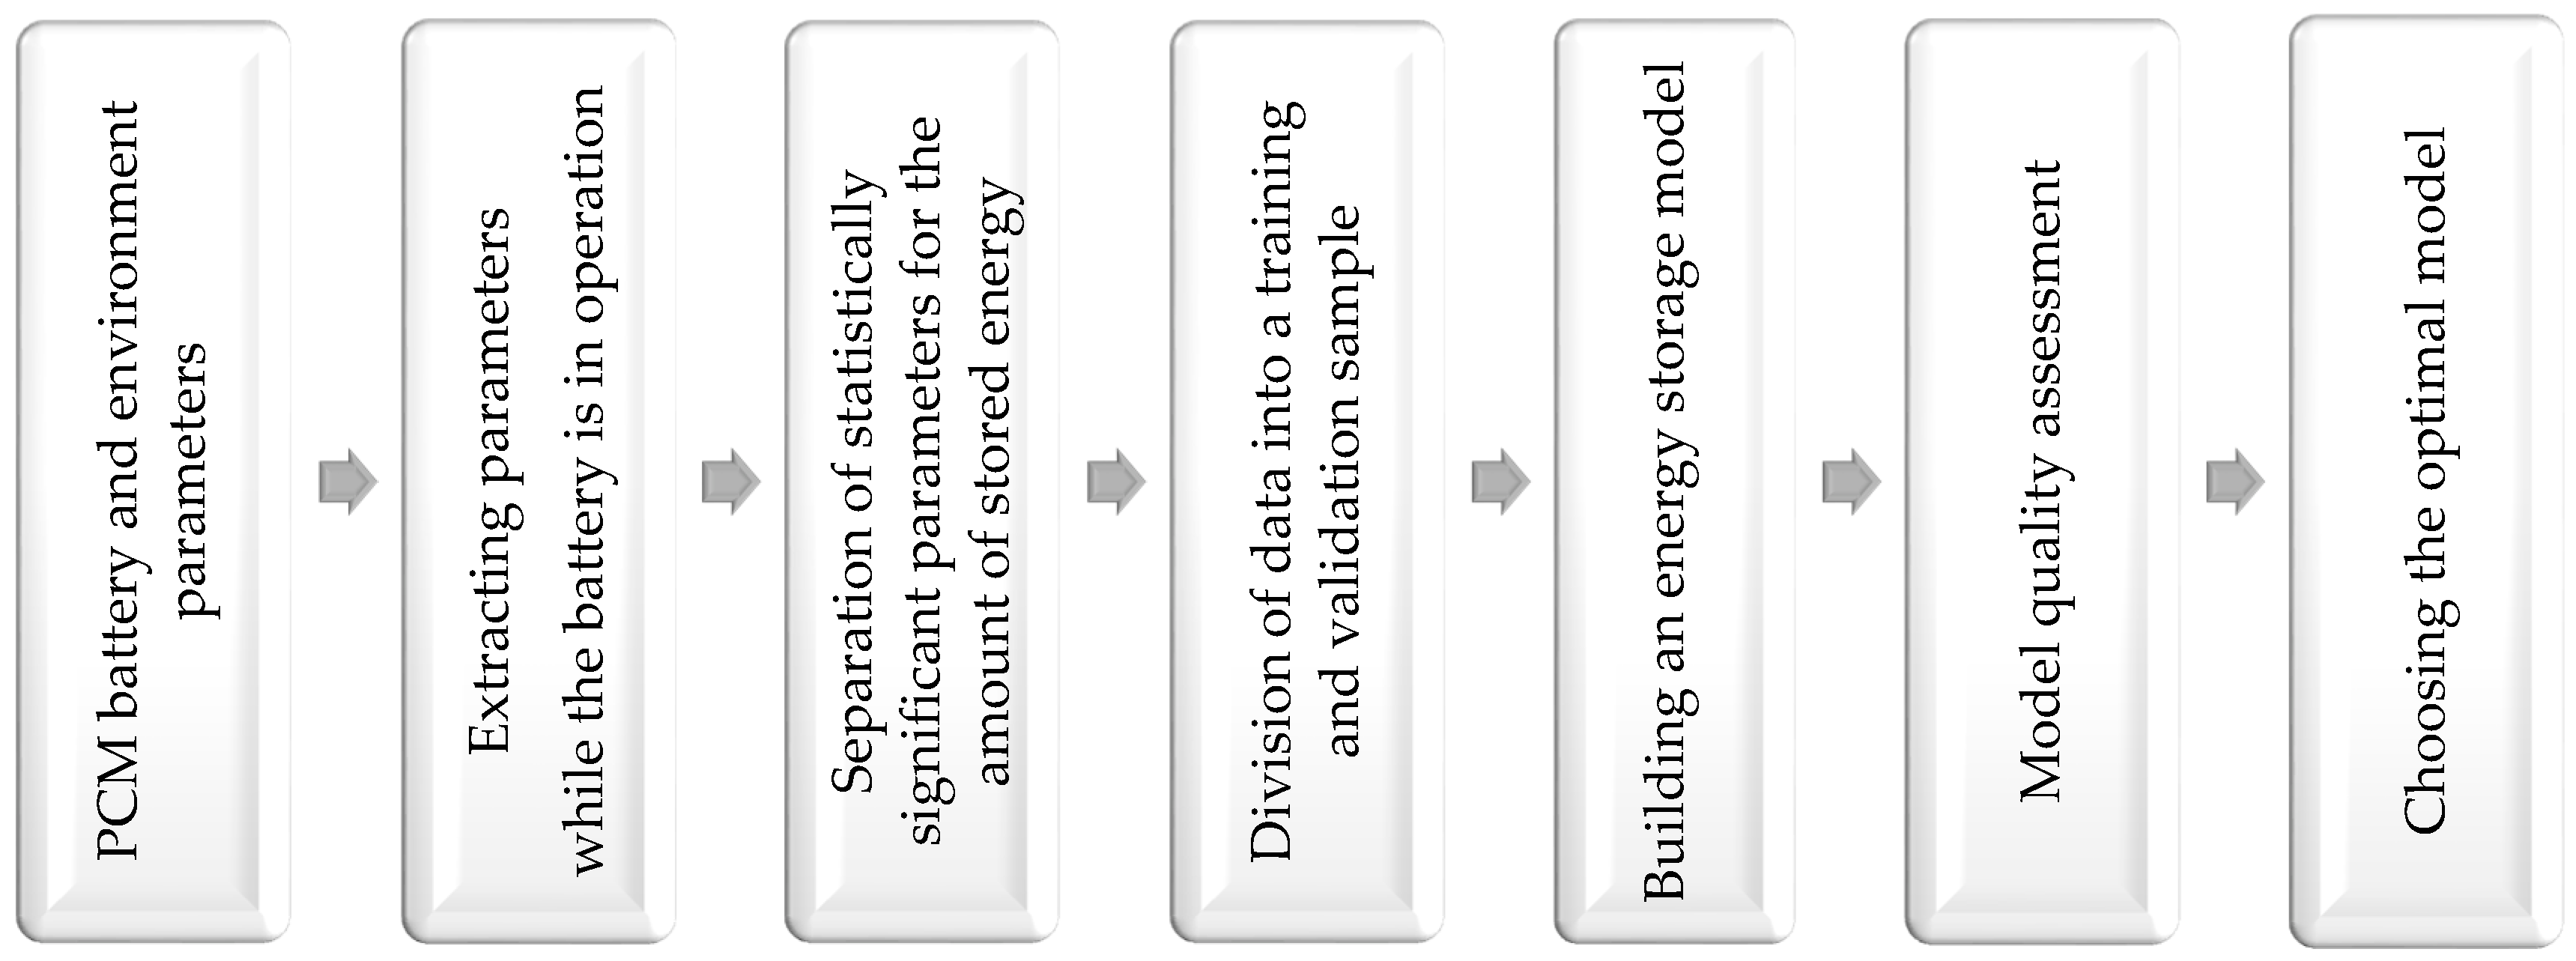
4. Methodology of Conducted Research

To achieve the above-mentioned goal, it was necessary to distinguish individual stages of modeling, which included:
  • Model of the energy storage process in the battery.
  • Model of energy losses in the PCM battery.

4.1. Modeling of the Energy Storage Process in a PCM Battery

During the construction of models allowing to determine the amount of energy stored in the PCM battery, the developed algorithm was followed, the block diagram of which is shown in Figure 3.
The efficiency of energy storage in a phase change accumulator depends primarily on the parameters of the energy storage medium (its specific heat, heat and phase change temperature) and the amount of electricity supplied. However, these are not the only factors affecting battery performance. The amount of stored energy losses also has a significant impact on the analyzed heat exchange surfaces. Its level depends primarily on the insulation of the battery and the temperature difference between its interior and the ambient temperature. The following were selected as independent variables for modeling the amount of energy stored in the phase change accumulator: the amount of electricity supplied, paraffin temperature and air temperature outside the accumulator.
In the first step, after obtaining the raw measurement results, a marking was made that allowed for the identification of individual charging cycles. Then, from the time series, records with incomplete information or measurement errors occurring, resulting, for example, from communication disturbances between the measuring sensor and the device for archiving measurement results, were removed. In the next step, the collected information was divided into individual sets used during the construction of the models. Three loading cycles were assigned to the training set, and the last one was used as validation data. During model validation, independent variables (the amount of electricity supplied to the PCM battery and the temperature of the PCM bed) were input into the models input and the resulting output variable (the amount of energy stored in the PCM battery) was compared with the actual quantity obtained during the experiment. For the purpose of building forecasting models, data from one series were extracted from the training set, which formed the test set. During the research, no modifications were made to the data constituting the individual sets.
The amount of accumulated heat in individual phases of the accumulation process was determined in accordance with the following relationships:
(1) . Q = T p T p m 1 m C p s d T (2) . Q = T p m 1 T p m 2 m c p s d T + m L p (3) . Q = T m 2 T e 1 m c p l d T + m L (4) . Q = T e 1 T e 2 m c p l d T (5) . Q = T e 2 T k m C p l d T
where Q is the amount of heat accumulated kJ, m is the mass of paraffin, Cps is the specific heat of the solid, kJ∙(kg∙K) −1, Cpl is the specific heat of the liquid, kJ∙(kg∙K) −1, L is the latent heat solid-solid kJ∙kg−1, Lp is the latent heat solid-liquid kJ∙kg−1, dT is the temperature difference, and T(p, pm1, pm2, pe1, m, e2, k) is the paraffin temperature at characteristic K points.
After determining the amount of stored energy on the basis of the above-mentioned relationships, the development of predictive models was started, allowing the determination of the amount of stored energy in the phase change accumulator based on a deliberately selected set of methods.
For this purpose, a project was created in the Statistica 12 Data Miner graphical environment. It includes, among others, nodes enabling the division of data into individual sets (training and validation), and then forecasts were developed based on models that were selected on the basis of the literature on the subject: artificial neural networks (ANN), standard regression trees (BRT), enhanced (CHAID) and comprehensive (CRT) and standard multiple regression (SMR), random forest (RF), and multivariate adaptive regression splines (MARS). Details concerning the algorithms of operation of the methods used in the study have been omitted as they are already commonly known. One of the oldest tree methods is the algorithm (CHAID) proposed by Kass in 1980 [78]. In turn, the algorithm of the CRT method was developed and presented by Breiman in 1984 [79,80]. The youngest are method multivariant adaptive regression splines (MARS). They were propagated and put into common use by Friedman [81,82].
The following assumptions/limitations were used in the tested methods:
  • ANN—the construction of a neural model required, first of all, the determination of the optimal network architecture (number of neurons in the hidden layer, number of layers, network type). It was also necessary to select the method of signal propagation in the network, the learning algorithm and the activation function of individual layers.
An automatic network designer was used in the study of the selection of the optimal network structure for each set of input variables. They analyzed the quality of the network, in which the number of neurons in the hidden layer could vary from 3 to 11. Before starting the research, the variables were divided into three sets. The allocation of days to individual sets was unchanged for all the analyses performed related to the modeling of electricity yield from the photovoltaic power plant (both for all methods and sets of input variables). Using the ANN automatic teacher in the Staistica 12 program, 200 network structures were analyzed, of which 5 with the best parameters were retained. In the study, it was possible to choose one of the three network training algorithms, i.e., the steepest descent method, the Broyden-Fletcher-Goldfarb-Shanno (BFGS) algorithm and the coupled gradient algorithm.
  • BRT—the minimum number of nodes was 5 observations, the maximum number of nodes was 1000, tree pruning stops were made on the basis of variance analysis.
  • CHAID—learning coefficient—0.1, number of trees—200, proportion for subsets—0.5, retention parameters: minimum number, 5%; minimum n child, 1; maximum number of descendants, 10; maximum number of nodes, 3.
  • CRT—minimum number of objects in a node, 5; maximum number of nodes, 1000; p level for division, 0.05.
  • RF—number of trees, 100; the stopping parameters were: minimum frequency, 5%; minimum n child, 5; maximum number of descendants, 10; maximum number of nodes, 100; number of cycles to determine error, 10; error reduction percentage, 5%.
  • MARS—maximum number of base functions, 21; order of interaction, 1 or 2; penalty for adding another base function 2.
In order to avoid overtraining the models (BRT, RF, SMR, CRT CHAID, MARS), a V-fold cross-test was used, which consists in determining a certain number of random samples separated from the training sample. Then, the analyses were performed, whereby one of the samples was omitted in the calculation and used as the test sample in the cross-validation. Each test was therefore used V—1 time in the training sample and once as a test sample.

4.2. Modelling of Energy Losses in a PCM Battery

During battery charging, there were interruptions in the supply of energy from the PV plant due to a too low level of solar radiation. At that time, only stored heat was lost. Therefore, it was necessary to develop additional heat loss models as a function of paraffin temperature and temperature inside the foil tunnel for these breaks. For this purpose, a set of methods was used (ANN, RF, BRT, SMR, CHAID, CRT, MARS). The loss model with the best quality was used later in the work only in periods when there was a break in charging the battery. This is because energy losses occurring in the charging process were taken into account when modeling the amount of energy stored in the battery.

4.3. Evaluation of the Quality of Predictive Models

The quality of the built models estimating the amount of stored energy and energy losses in the PCM battery was assessed on the basis of:
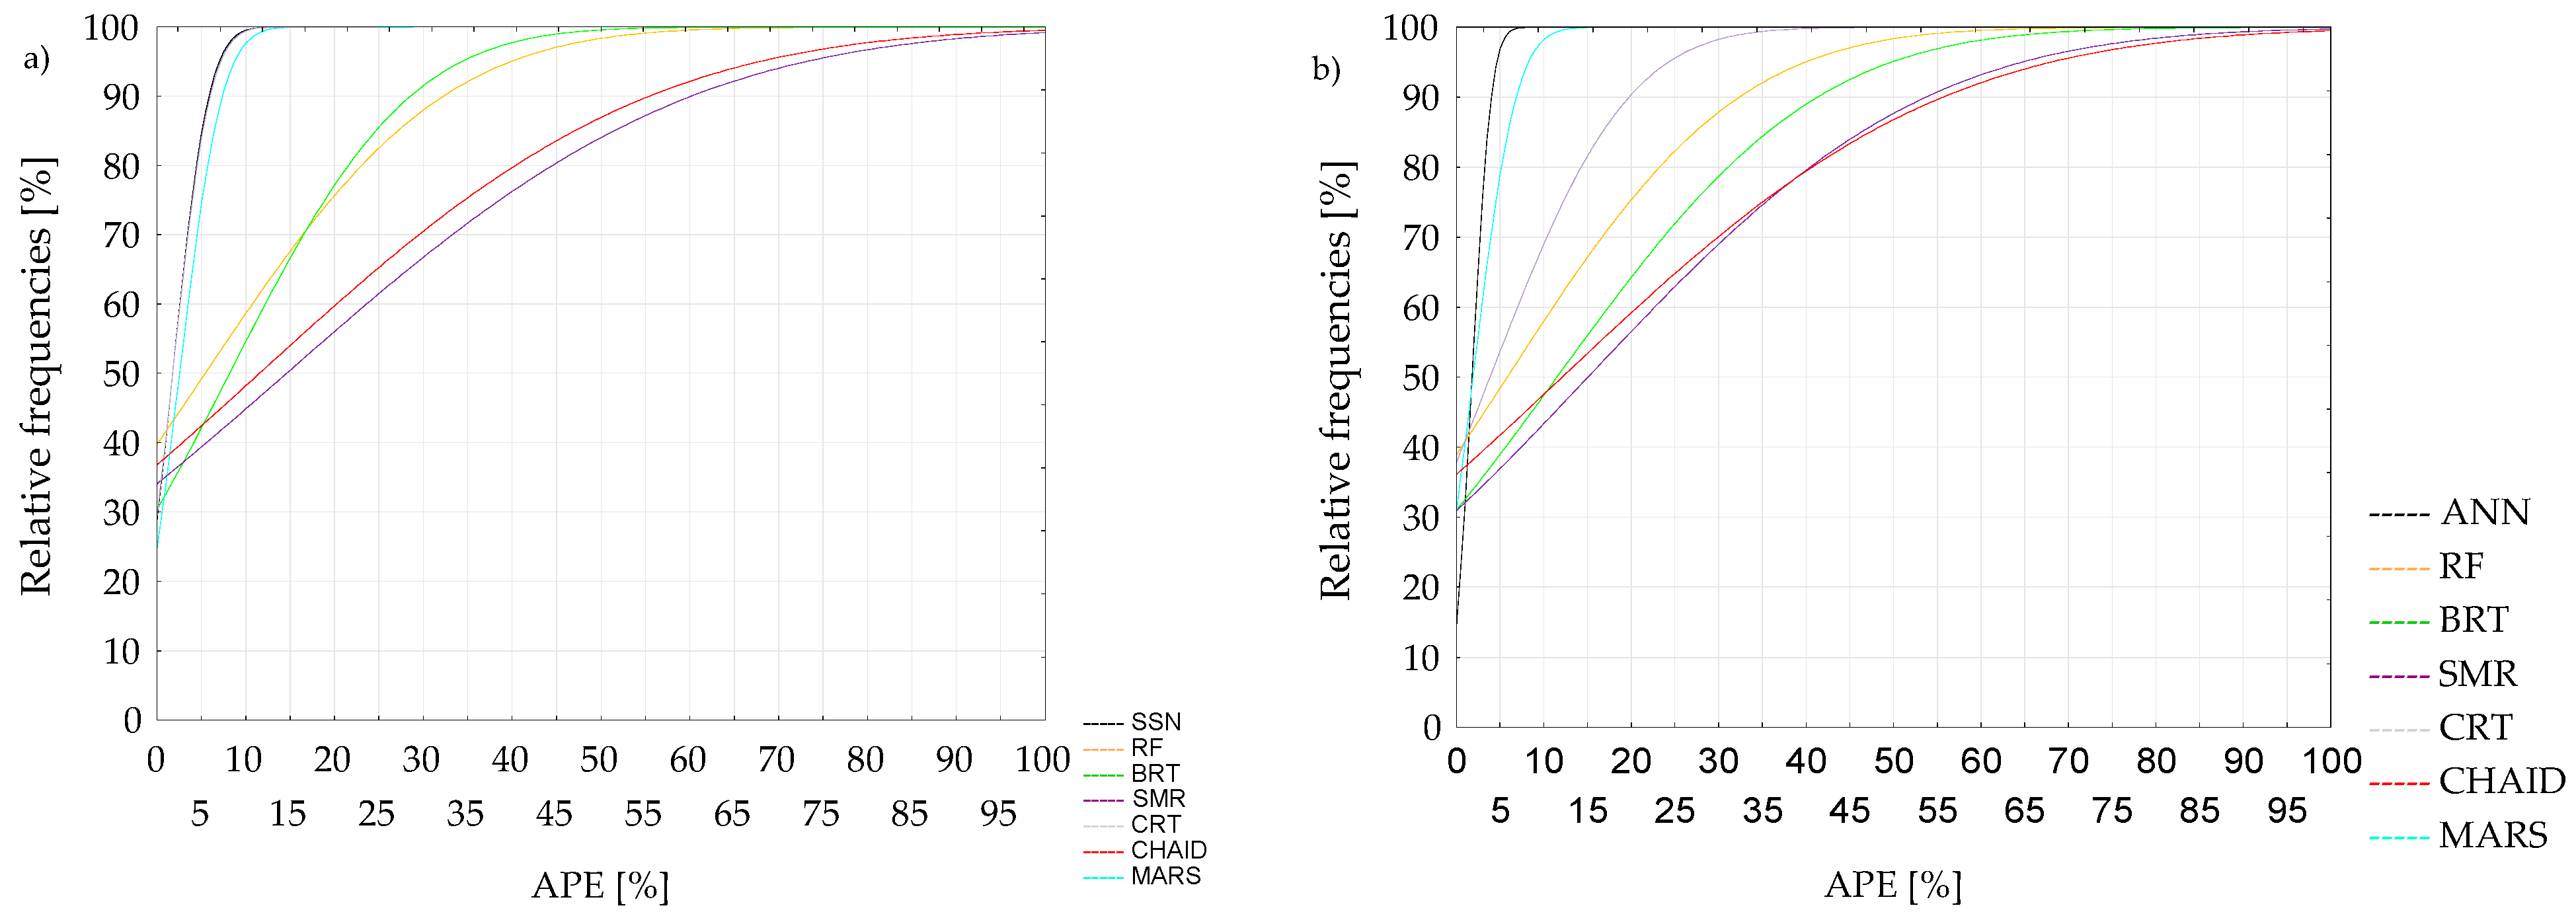
  • The absolute percentage error (APE)
A P E = W r z W p W r z %
2.
The mean absolute percentage error (MAPE)
M A P E = 1 n t = 1 n W r z W p W r z %
3.
The share of balance differences in relation to the sum of the actual values (ΔESRt):
  Δ E S R t = t = 1 n W r z W p t = 1 n W r z %
where: Wrz is the actual value, Wp is the forecast value, n is the number of the last observations of the forecasted variable.
The value of the abovementioned indicators was determined separately for the training set and the validation set. Moreover, to better illustrate the error changes for individual models, the empirical distribution of APE errors was developed.

5. Research Results

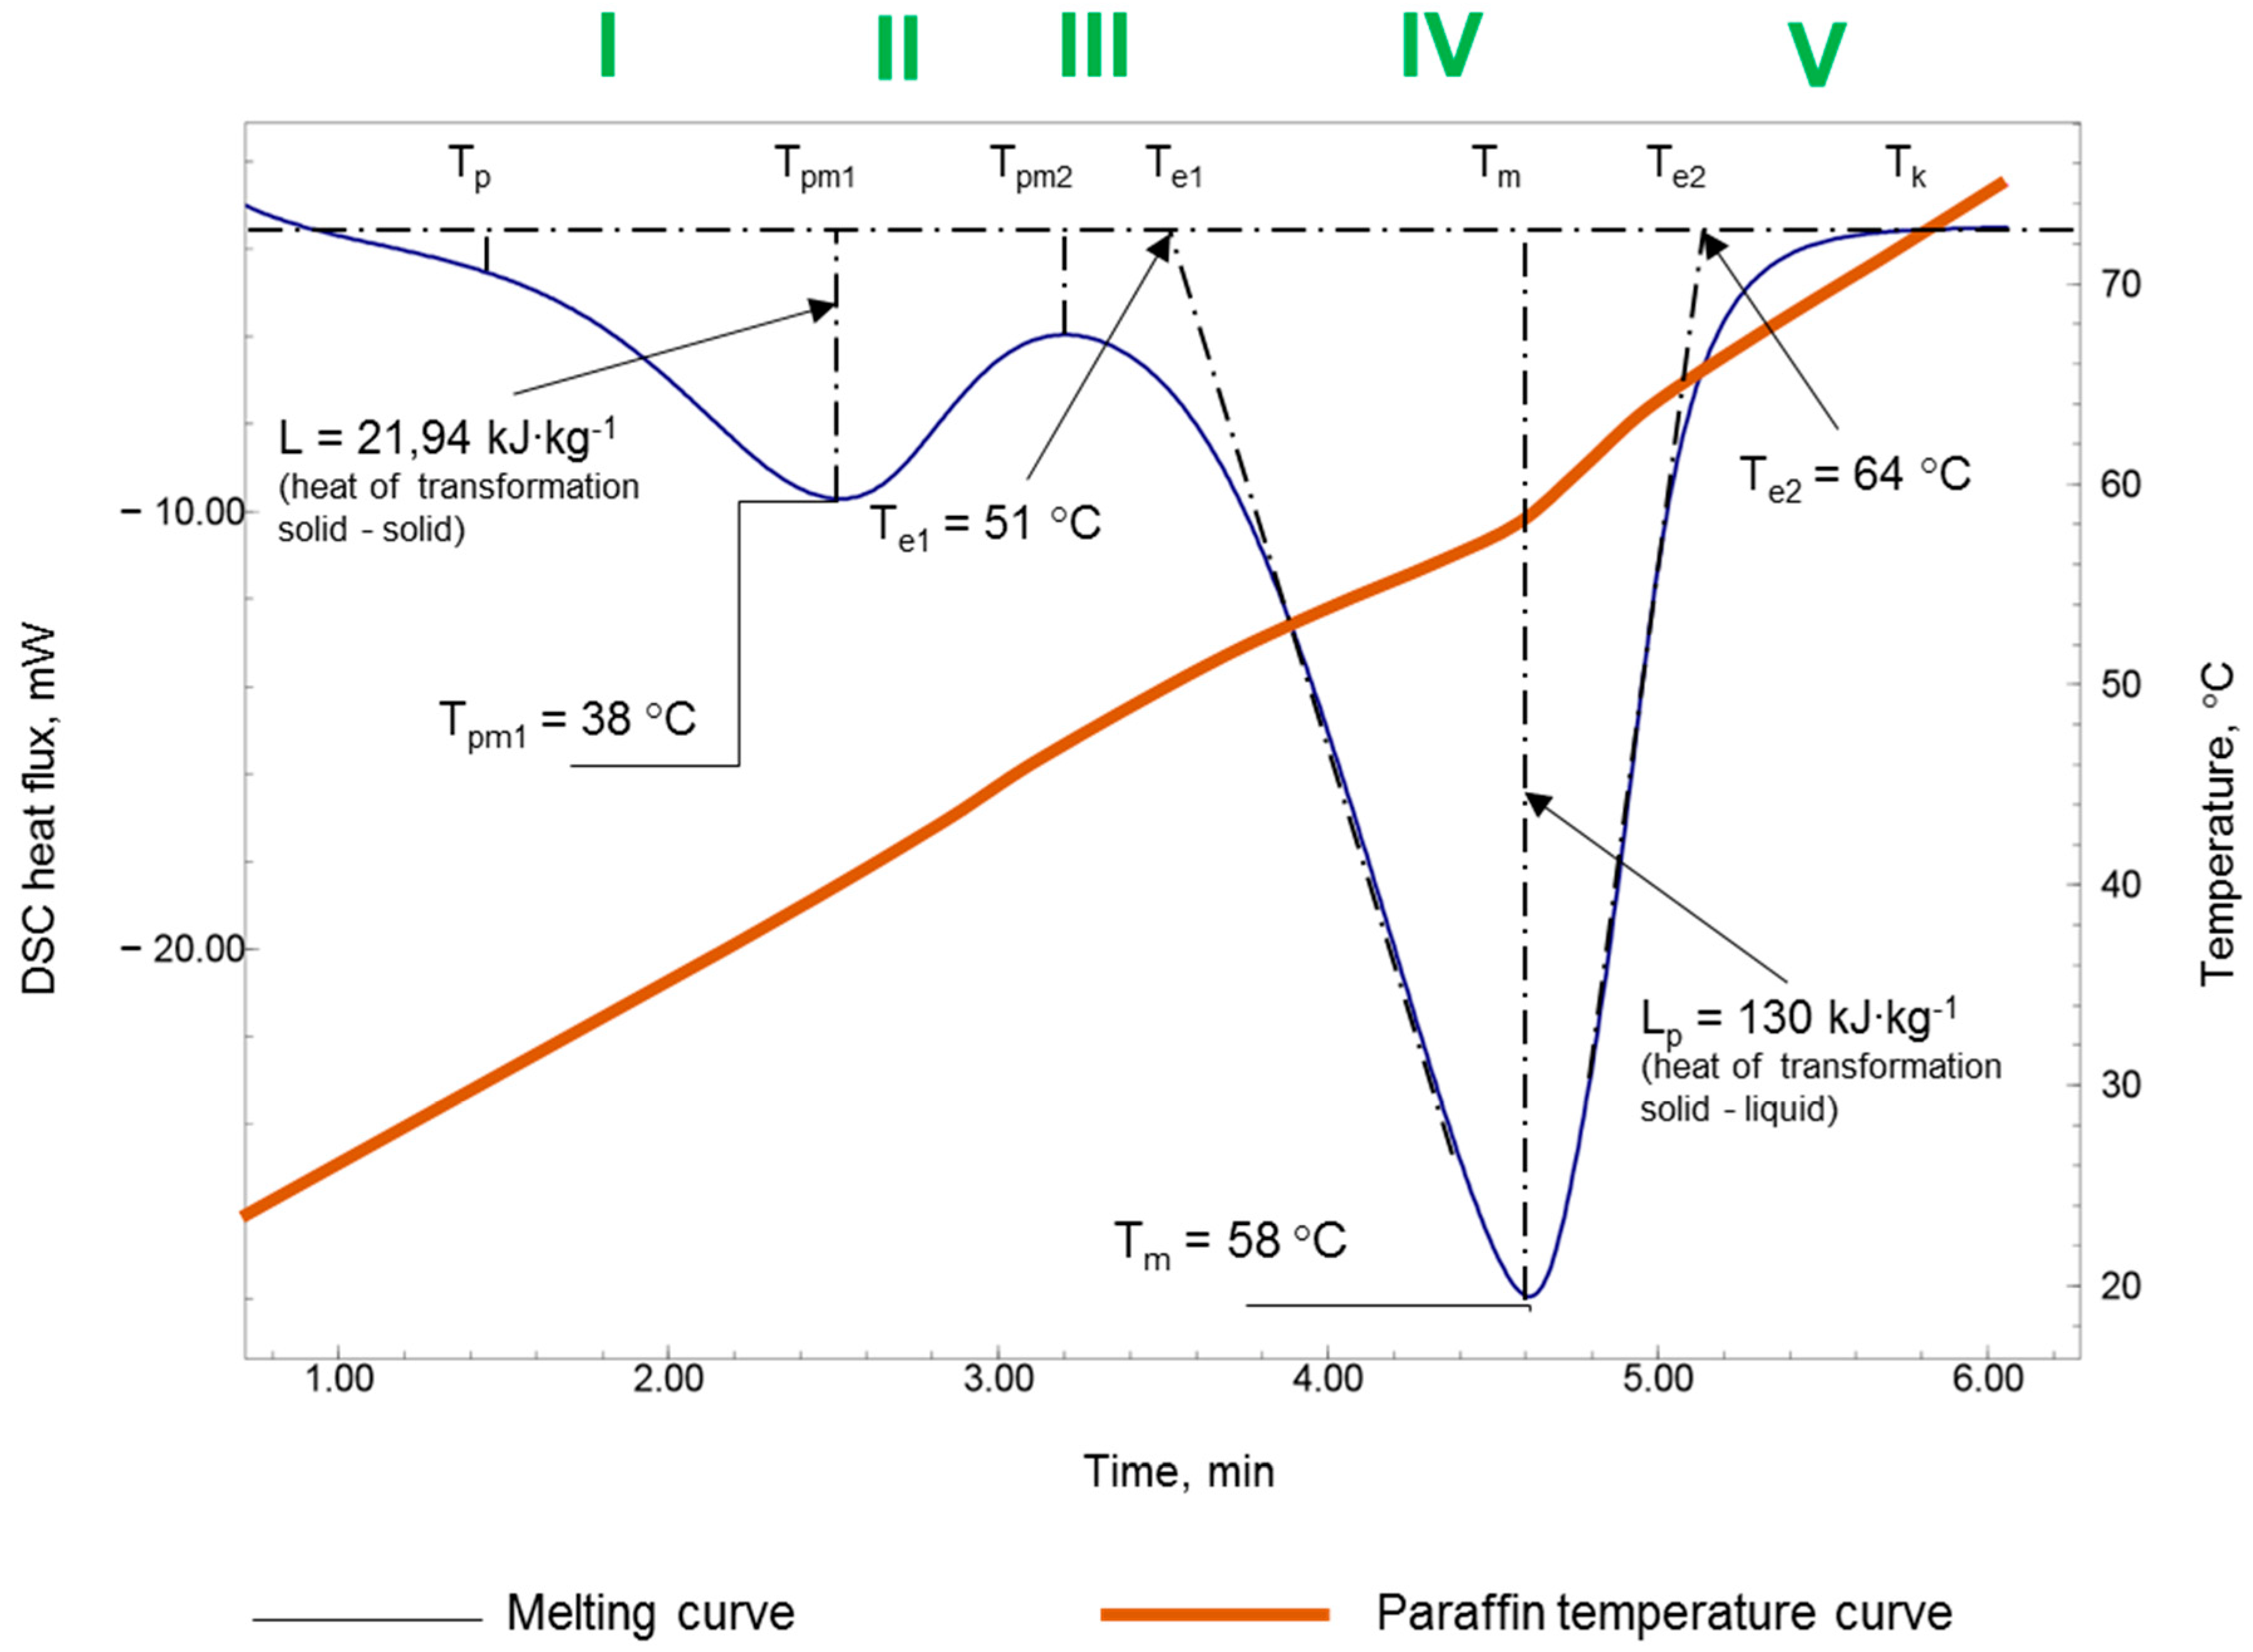
5.1. Determination of the Physical Properties of R58 Paraffin

The phase change material used in the study is R58 paraffin, with a melting point of 56–58 °C. To determine the behavior of the storage bed in the PCM battery during the melting process, the measurements were carried out using a differential scanning calorimeter. The measurement of the phase transformation temperature and the heat of the phase transformation was determined by differential scanning calorimetry (DSC) with a Shimadzu DSC-60 apparatus. The specific heat of the R58 paraffin was determined by the calorimetric method on a Perc Elmer DSC 7 scanning calorimeter, and the thermal conductivity coefficient was determined on the LFA 447 NanoFlash analyzer. The DSC curve for melting R58 paraffin used in the study was obtained based on the performed tests (Figure 4).
During the analysis of the paraffin DSC curve, two peaks were observed, in which the phase change took place, and the heat specific for these points was changing very dynamically.
The larger of the peaks is due to a solid-liquid phase change and the smaller one is due to a solid-solid transition, approximately 20 °C below the main melting range. The paraffin wax phase change process can be divided into five sub-processes, i.e., solid phase, solid-solid conversion, then a phase above the solid phase temperature range but below the melting point range, followed by solid to liquid and liquid phase change.
The conducted research allowed to determine the parameters necessary to estimate the amount of accumulated energy in the medium, and their values are listed below in Table 2. In addition, the study analyzed the effect of the number of phase change cycles of the storage medium on the physiothermal parameters. For this purpose, the calorimetric tests were repeated for the PCM material collected successively after 100, 200, 300 and 400 cycles. During the analyses, no significant influence of the number of phase change cycles on material parameters was observed.

5.2. Modeling the Battery Charging Process PCM

The second stage of the research involved modeling the charging process of the PCM battery and it consisted of two parts. The first one analyzed the usefulness of seven selected methods, both classic and alternative (the same set of methods as in the modeling of PV energy yield), to describe the process of accumulating energy in a PCM battery in periods when the PV power plant generated enough electricity for its operation.
In the second part of the study, models were built to determine energy losses in a phase change battery, when there were unfavorable weather conditions and the charging process was interrupted for some time. The same methods were used to build the heat loss model as in the first part of battery operation modeling. Based on the adopted criteria, the quality of all tested methods was assessed, and then models were selected that would allow for forecasts with the smallest errors.

5.3. Modeling the Process of Accumulating Electricity in a PCM Battery

In order to model the amount of energy stored in the paraffinic bed, the correlation coefficient between the dependent variable and the assumed independent variables was determined. The analysis of the correlation between the amount of energy stored in the PCM battery and the energy supplied to the battery, the temperature inside the object, and the paraffin temperature (Table 3) shows that the lowest correlation strength was characteristic for the variable describing the temperature inside the object (R2 = 0.43). This fact is largely due to the use of mineral wool insulation in the battery, which largely limited the impact of external conditions on the facility’s operation.
For the construction of energy storage models in the phase change battery in the initial stage of the study, the electric energy supplied to the battery, the paraffin temperature and the temperature inside the greenhouse were selected as independent variables. The study was performed only for one method, i.e., ANN, as commonly used, and an automatic designer was used to build the network. Out of 200 tested network combinations, only 5 of the best quality were archived (Table 4), in which the BFGS learning algorithm was used, and the activation functions of both the hidden and the output layer were of a linear, logistic or tangensoidal nature.
Based on the estimated errors for both the learning, test and validation sets, the network with 10 hidden neurons and a tangent function for activation of the hidden layer and a logistic function for activation of the output layer was considered to be the best, i.e., with the lowest errors. ANN models built on the basis of these three independent variables were characterized by MAPE errors of between 1 and 3% for the learning set and of more than 5% for the validation set. The selected neural network will be compared in the following work with other methods used to model the energy storage process from photovoltaic conversion in a PCM battery.
The assessment of the influence of independent variables on the quality of the developed model was carried out after its construction, on the basis of a global model sensitivity analysis. The indices of network sensitivity to particular independent variables are presented in Table 5. They were determined as a quotient of the error obtained when running the network for a set of data without a given variable and the error obtained with a set of variables. The larger the error after the rejection of a variable, in relation to the original error, the more sensitive the network is to the lack of this variable.
The analysis shows that all the variables used improved its quality. However, the greatest influence was exerted by the paraffin temperature and the amount of electricity supplied to the battery. The influence of temperature inside the object was much lower and in subsequent studies this variable was eliminated from the set of independent variables.
In the further part of the study, the usefulness of the selected methods, i.e., ANN, RF, BRT, SMR, CHAID, CRT, MARS, for the construction of effective models of energy storage in a phase change accumulator operating in a real greenhouse facility was analyzed. Table 6 summarizes the errors in the modeling methods of the stored energy in the PCM battery.
For the tested methods (Table 6), the lowest error values were observed for ANN both for the training and validation sets. For both sets, the BRT, SMR and CHAID methods had the highest MAPE errors, from 8 to 15%, while the ∆ESRt error for these methods was at the level of 4–6%.
The course of empirical distributors for both the training and validation set is comparable (Figure 5). For both sets, the ANN model has the highest share of APE errors below 10%. The analysis showed that the share of errors of up to 10% for ANNs constitute as much as 100%, and for the MARS method 98% of the observations, while for other methods they are in the range from 42% to 70%. The maximum error values for the neural network do not exceed 10%, and for the other methods they reach the level of 100%.
Based on the results obtained for individual studies of the energy storage process in the battery it was decided that, later in the work, the built ANN model will be used, for which the input variables are the energy supplied to the battery and the paraffin temperature.
The same set of methods was used again to model energy losses during unfavorable weather conditions as for modeling the process of accumulating energy in the battery. The temperature of paraffin and the temperature inside the tunnel where the battery was located were used as independent variables. Such a set of variables made it possible to make forecasts with a very low error not exceeding 3%.
The ANN method had the lowest forecast errors among all the methods used (Table 7). The artificial MLP neural network with three hidden neurons achieved the lowest ANN (learning and validation) errors as well as MAPE and ∆ESRt errors. Detailed analysis of the quality of individual methods has shown that the best quality of the forecast can be obtained using the adopted input variables and the method of artificial neural networks. This model will be used in the further part of the work, for modeling the process of storing energy obtained from photovoltaic conversion in the phase change battery.
It is very difficult to compare the obtained results with other studies. Researchers use very different phase change materials, different battery designs and different modeling techniques. In the work [48], the PCM medium with melting points of 17, 21 and 29 °C was used. On the other hand, the quality of modeling a greenhouse facility with a PCM battery was assessed by graphically comparing the results of own research with selected experiments presented in the literature. The work from [50] provides an overview of the research for the three most commonly used groups of PCM materials, i.e., salt hydrates, paraffins and polyethylene glycol. The comparison of the results presented in it is very difficult due to the lack of uniform assumptions and conditions for the implementation of the study. The issue of using the PCM battery in greenhouse production is also discussed in [49]. However, its authors use a medium with a low phase change temperature due to the use of a battery for direct heating of the root zone of plants in greenhouses. Additionally, in most of the works, the aspect of changing the parameters of the heat-storing medium during its many cycles of operation is neglected. The research presented in the paper allows for the assessment of the suitability of selected methods for modeling the actual process of storing electricity in a PCM battery in a greenhouse facility. Due to the provision of a similar set of data for model building, it was possible to study the impact of the choice of method on the quality of the model of the energy storage process.

6. Conclusions

The conducted research allowed for the collection of information on the process of heat accumulation in the phase change accumulator, not on a laboratory scale, as is the case in most previous studies, but allowing its direct use in practical applications.
The conducted study made it possible to develop a DSC curve for the R58 paraffin used in the study and to learn about its basic parameters. During the test, it was established that the melting point for the solid-solid transformation is 38 °C, and for the solid-liquid transformation it is 58 °C. On the other hand, the heat of the phase transition of melting is 22 and 130 kJ∙kg−1, respectively. During the test, no changes in the physical and thermal properties of R58 paraffin with the number of phase-change cycles were observed.
The research shows that the use of a very limited set of independent variables in the form of the amount of electric energy supplied to the battery and the temperature of the heat storage medium allows the modeling of the energy storage process while charging the PCM battery. Based on the quality analysis of the assessed models, it was found that the best quality is ensured by SNN. This model was characterized by mean absolute percentage error forecast (MAPE) at a level not exceeding 2% for both the training and validation set, and the share of balance differences was even lower.
The issues presented in the paper do not fully cover the issue of energy storage in batteries using the phase change. Therefore, the research was continued in the field of the process of recovering energy stored in the PCM battery and the impact of the depth of its discharge on the efficiency of the process.
The main limitation during the accumulation of energy from photovoltaic conversion in the phase change battery was the thermal parameters of the air as the medium transferring heat between the electric heaters and paraffin, which is the battery bed. In subsequent tests, it is planned to change air into liquid, while reducing the cross-section of the conductors transferring heat to the battery. Due to the requirements for the battery, which will be ultimately used in the cultivation of plants under covers, the air will still remain the medium used during its discharge.

Author Contributions

Conceptualization, A.K., H.L. and K.N.; methodology, A.K., H.L. and K.N.; software, A.K. and K.N.; validation, A.K., H.L. and K.N.; formal analysis, H.L. and K.N.; investigation, A.K. and H.L.; resources, H.L. and S.K.; data curation, H.L. and S.K.; writing—original draft preparation, A.K., H.L. and K.N.; writing—review and editing, S.K. and T.B.; visualization, H.L. and K.N.; supervision, S.K. and T.B.; project administration, H.L.; funding acquisition, S.K. and T.B. All authors have read and agreed to the published version of the manuscript.

Funding

This research was financed by the Ministry of Science and Higher Education of the Republic of Poland.

Institutional Review Board Statement

Not applicable.

Informed Consent Statement

Not applicable.

Data Availability Statement

Not applicable.

Conflicts of Interest

The authors declare no conflict of interest.

Nomenclature, Parameters and Abbreviations

ANNArtificial neural network
APEAbsolute percentage error[%]
BRTBoosting regression trees
CRTClassification and regression trees
CHAIDChi-square automatic interaction detector
CplSpecific heat of the liquid[kJ∙(kg∙K)−1]
CpsSpecific heat of the solid[kJ∙(kg∙K)−1]
DSCDifferential scanning calorimetry
dTTemperature difference
EPCMEnergy accumulated in the phase change battery[kWh]
LLatent heat solid-solid[kJ∙kg−1]
LpLatent heat solid-liquid[kJ∙kg−1]
mParaffin mass[kg]
MAPEMean absolute percentage error[%]
MARSMultivariate adaptive regression splines
PCMPhase change battery
PESIntensity of solar radiation[W∙m−2]
PPVPower of photovoltaic plant[Wp]
PVPhotovoltaic plant
QAmount of accumulated heat[kJ]
RFRandom forest
SMRStandard multiple regression
T(p, pm1, pm2, pe1, m, e2, k)Paraffin temperature at characteristic points[K]
WES_PCMEnergy storage index of solar radiation in PCM[%]
WPV_PCMIndex of electricity storage from PV in PCM
ΔESRtShare of balance differences in relation to the sum of the actual values[%]

References

  1. Piwowar, A.; Dzikuć, M. Proekologiczna gospodarka energetyczna w rolnictwie i na obszarach wiejskich w Polsce—Stan aktualny i perspektywy rozwoju. Wieś Rol. 2015, 3, 107–115. [Google Scholar]
  2. Blanc, P.; Gschwind, B.; Lefevre, M.; Wald, L. The HelioClim project: Surface solar irradiance data for climate applications. Remote Sens. 2011, 3, 343–361. [Google Scholar] [CrossRef] [Green Version]
  3. Huld, T.; Muller, R.; Gambardella, A. A new solar radiation database for estimating PV performance in Europe and Africa. Sol. Energy 2012, 86, 1803–1815. [Google Scholar] [CrossRef]
  4. Suri, M.; Huld, T.; Dunlop, E.; Ossenbrink, H. Potential of solar electricity generation in the European Union member states and candidate countries. Sol. Energy 2007, 81, 1295–1305. [Google Scholar] [CrossRef]
  5. Remund, J.; Kunz, S. METEONORM: Global Meteorological Database for Solar Energy and Applied Climatology; Meteotest: Bern, Switzerland, 1997. [Google Scholar]
  6. Antonanzas, J.; Osorio, N.; Escobar, R.; Urraca, R.; Martinez-de-Pison, F.J.; Antonanzas-Torres, F. Review of photovoltaic power forecasting. Sol. Energy 2016, 136, 78–111. [Google Scholar] [CrossRef]
  7. Debnath, K.B.; Mourshed, M. Forecasting methods in energy planning models. Renew. Sustain. Energy Rev. 2018, 88, 297–325. [Google Scholar] [CrossRef] [Green Version]
  8. Almonacid, F.; Pérez-Higueras, P.; Fernández, E.F.; Hontoria, L. A methodology based on dynamic artificial neural network for short-term forecasting of the power output of a PV generator. Energy Convers. Manag. 2014, 85, 389–398. [Google Scholar] [CrossRef]
  9. Anagnostos, D.; Schmidt, T.; Cavadias, S.; Soudris, D.; Poortmans, J.; Catthoor, F. A method for detailed, short-term energy yield forecasting of photovoltaic installations. Renew. Energy 2018, 130, 122–129. [Google Scholar] [CrossRef]
  10. Bugała, A.; Zaborowicz, M.; Boniecki, P.; Janczak, D.; Koszela, K.; Czekała, W.; Lewicki, A. Short-term forecast of generation of electric energy in photovoltaic systems. Renew. Sustain. Energy Rev. 2018, 81, 306–312. [Google Scholar] [CrossRef]
  11. Sobri, S.; Koohi-Kamalia, S.; Rahima, N.A. Solar photovoltaic generation forecasting methods: A review. Energy Convers. Manag. 2018, 156, 459–497. [Google Scholar] [CrossRef]
  12. Cococcioni, M.; Ducange, P.; Lazzerini, B.; Marcelloni, F. A Pareto-based multi-objective evolutionary approach to the identification of Mamdani fuzzy systems. Soft Comput. 2007, 11, 1013–1031. [Google Scholar] [CrossRef]
  13. Tao, C.; Shanxu, D.; Changsong, C. Forecasting power output for gridconnected photovoltaic power system without using solar radiation measurement. In Proceedings of the 2nd IEEE International Symposium on Power Electronics for Distributed Generation Systems, Hefei, China, 16–18 June 2010. [Google Scholar] [CrossRef]
  14. Piotrowski, P. Analiza zastosowań sztucznych sieci neuronowych do krótkoterminowego prognozowania mocy oraz produkcji energii elektrycznej w systemach fotowoltaicznych. Przegląd Elektrotechniczny 2015, 91, 162–165. [Google Scholar] [CrossRef]
  15. Baczyński, D.; Wasilewski, J. Krótkoterminowe prognozowanie produkcji energii elektrycznej w systemach fotowoltaicznych. Rynek Energii 2011, 96, 47–51. [Google Scholar]
  16. Huang, Y.; Lu, J.; Liu, C. Comparative study of power forecasting methods for PV stations. In Proceedings of the International Conference on Power System Technology (POWERCON), Hangzhou, China, 24–28 October 2010. [Google Scholar] [CrossRef]
  17. Mellit, A.; Pavan, A.M. A 24-h forecast of solar irradiance using artificial neural network: Application for performance prediction of a grid-connected PV plant at Trieste, Italy. Sol. Energy 2010, 84, 807–821. [Google Scholar] [CrossRef]
  18. Monteiro, C.; Fernandez-Jimenez, L.A.; Ramirez-Rosado, I.; Muñoz-Jimenez, A.; Santillan, L.P. Short-term forecasting models for photovoltaic plants: Analytical versus soft-computing techniques. Math. Probl. Eng. 2013, 2013, 767284. [Google Scholar] [CrossRef] [Green Version]
  19. Yona, A.; Senjyu, T.; Saber, A.Y.; Funabashi, T.; Sekine, H.; Kim, C.H. Application of neural network to 24-h head generating power forecasting for PV system. In Proceedings of the Power and Energy Society General Meeting—Conversion and Delivery of Electrical Energy in the 21st Century, Pittsburgh, PA, USA, 20–24 July 2008. [Google Scholar] [CrossRef]
  20. Wu, Y.K.; Chen, C.R.; Rahman, H.A. A novel hybrid model for short-term forecasting in PV power generation. Int. J. Photoenergy 2014, 2014, 569249. [Google Scholar] [CrossRef] [Green Version]
  21. Zeng, J.; Qiao, W. Short-term solar power prediction using a support vector machine. Renew. Energy 2013, 52, 118–127. [Google Scholar] [CrossRef]
  22. Cecati, C.; Kolbusz, J.; Różycki, P.; Siano, P.; Wilamowski, B.M. A novel RBF training algorithm for short-term electric load forecasting and comparative studies. IEEE Trans. Ind. Electron. 2015, 62, 6519–6529. [Google Scholar] [CrossRef]
  23. Yu, S.; Wang, K.; Wei, Y.M. A hybrid self-adaptive particle swarm optimization–genetic algorithm–radial basis function model for annual electricity demand prediction. Energy Convers. Manag. 2015, 91, 176–185. [Google Scholar] [CrossRef]
  24. Piotrowski, P. Analiza Implementacji Sztucznych Sieci Neuronowych w Zadaniu Prognozowania Ultrakrótkoterminowego Oraz Sformułowanie Wytycznych Dotyczących Prognozowania, Praca na Zlecenie; Globema Sp. z o.o.: Warsaw, Poland, 2012. [Google Scholar]
  25. Xu, R.; Chen, H.; Sun, X. Short-term photovoltaic power forecasting with weighted support vector machine. In Proceedings of the IEEE International Conference on Automation and Logistics (ICAL), Zhengzhou, China, 15–17 August 2012; pp. 248–253. [Google Scholar] [CrossRef]
  26. Yang, C.; Thatte, A.A.; Xie, L. Multitime-scale data-driven spatio-temporal forecast of photovoltaic generation. IEEE Trans. Sustain. Energy 2015, 6, 104–112. [Google Scholar] [CrossRef]
  27. Leva, S.; Dolara, A.; Grimaccia, F.; Mussetta, M.; Ogliari, E. Analysis and validation of 24 h ahead neural network forecasting of photovoltaic output power. Math. Comput. Simul. 2017, 131, 88–100. [Google Scholar] [CrossRef] [Green Version]
  28. Pedro, H.T.; Coimbra, C.F. Assessment of forecasting techniques for solar power production with no exogenous inputs. Sol. Energy 2012, 86, 2017–2028. [Google Scholar] [CrossRef]
  29. Liu, J.; Fang, W.; Zhang, X.; Yang, C. An improved photovoltaic power forecasting model with the assistance of aerosol index data. IEEE Trans. Sustain. Energy 2015, 6, 434–442. [Google Scholar] [CrossRef]
  30. Rana, M.; Koprinska, I.; Agelidis, V.G. Forecasting solar power generated by grid connected PV systems using ensembles of neural networks. In Proceedings of the International Joint Conference on Neural Networks (IJCNN), Killarney, Ireland, 12–17 July 2015; pp. 1–8. [Google Scholar]
  31. Almeida, M.P.; Perpiñán, O.; Narvarte, L. PV power forecast using a nonparametric PV model. Sol. Energy 2015, 115, 354–368. [Google Scholar] [CrossRef] [Green Version]
  32. Camilo, F.M.; Castro, R.; Almeida, M.E.; Pires, V.F. Economic assessment of residential PV systems with self-consumption and storage in Portugal. Sol. Energy 2017, 150, 353–362. [Google Scholar] [CrossRef]
  33. Núñez-Reyes, A.; Marcos Rodríguez, D.; Bordons Alba, C.; Ridao Carlini, M.A. Optimal scheduling of grid-connected PV plants with energy storage for integration in the electricity market. Sol. Energy 2017, 144, 502–516. [Google Scholar] [CrossRef]
  34. Diouf, B.; Pode, R. Potential of lithium-ion batteries in renewable energy. Renew. Energy 2015, 76, 375–380. [Google Scholar] [CrossRef]
  35. Gańko, M. Technologie Magazynowania Energii Elektrycznej Nowoczesna Energetyka Europy Środkowo-Wschodniej 2015—Materiały Konferencyjne.
  36. Malko, J.; Wojciechowski, H. Magazynowanie energii—Nowe technologie. Nowa Energ. 2015, 2, 1–9. [Google Scholar]
  37. Siwek, A.J. Metody Magazynowania Energii Elektrycznej i jej Możliwości Zastosowań w Procesach Konwersji Odnawialnych Źródeł Energii; Wydawnictwa AGH: Kraków, Poland, 2000. [Google Scholar]
  38. Blumberga, A.; Timma, L.; Romagnoli, F.; Blumberga, D. Dynamic modeling of a collection scheme of waste portable batteries for ecological and economic sustainability. J. Clean. Prod. 2015, 88, 224–233. [Google Scholar] [CrossRef]
  39. Abhat, A. Low temperature latent heat thermal energy storage: Heat storage materials. Sol. Energy 1983, 30, 313–332. [Google Scholar] [CrossRef]
  40. Agyenim, F.; Hewitt, N.; Eames, P.; Smyth, M. A review of materials, heat transfer and phase change problem formulation for latent heat thermal energy storage systems (LHTESS). Renew. Sustain. Energy Rev. 2010, 14, 615–628. [Google Scholar] [CrossRef]
  41. Al-Maghalseh, M.; Mahkamov, K. Methods of heat transfer intensification in PCM thermal storage systems: Review paper. Renew. Sustain. Energy Rev. 2018, 92, 62–94. [Google Scholar] [CrossRef]
  42. Khan, M.M.A.; Saidur, R.; Al-Sulaiman, F.A. A review for phase change materials (PCMs) in solar absorption refrigeration systems. Renew. Sustain. Energy Rev. 2017, 76, 105–137. [Google Scholar] [CrossRef]
  43. Neumann, H.; Gamisch, S.; Gschwander, S. Comparison of RC-model and FEM-model for a PCM-plate storage including free convection. Appl. Therm. Eng. 2021, 196, 117232. [Google Scholar] [CrossRef]
  44. Dobri, A.; Tsiantis, A.; Papathanasiou, T.D.; Wang, Y. Investigation of transient heat transfer in multi-scale PCM composites using a semi-analytical model. Int. J. Heat Mass Transf. 2021, 175, 121389. [Google Scholar] [CrossRef]
  45. Roccamena, L.; El Mankibi, M.; Stathopoulos, N. Development and validation of the numerical model of an innovative PCM based thermal storage system. J. Storage Mater. 2019, 24, 100740. [Google Scholar] [CrossRef]
  46. Morovat, N.; Athienitis, A.K.; Candanedo, J.A.; Dermardiros, V. Simulation and performance analysis of an active PCM-heat exchanger intended for building operationoptimization. Energy Build. 2019, 199, 47–61. [Google Scholar] [CrossRef]
  47. Zhang, Y. Modified computational methods using effective heat capacity model for the thermal evaluation of PCM outfitted walls. Int. Commun. Heat Mass Transf. 2019, 108, 104278. [Google Scholar] [CrossRef]
  48. Fateh, A.; Borelli, D.; Weinlader, H.; Devia, F. Cardinal orientation and melting temperaturę effects for PCM-enhanced light-walls in different climates. Sustain. Cities Soc. 2019, 51, 101766. [Google Scholar] [CrossRef]
  49. Markarian, E.; Fazelpour, F. Multi-objective optimization of energy performance of a building considering different configurations and types of PCM. Sol. Energy 2019, 191, 481–496. [Google Scholar] [CrossRef]
  50. Cao, Y.; Faghri, A. A numerical analysis of phase-change problems including natural convection. J. Heat Transf. 1990, 112, 812–816. [Google Scholar] [CrossRef]
  51. Eyres, N.R.; Hartree, D.R.; Ingham, J.; Jackson, R.; Sarjant, R.J.; Wagstaff, J.B. The calculation of variable heat flow in solids. Philos. Trans. R. Soc. A Athem. Phys. Eng. Sci. 1946, 1, 1–57. [Google Scholar] [CrossRef]
  52. AL-Saadi, N.S.; Zhai, Z. Modeling phase change materials embedded in building enclosure: A review. Renew. Sustain. Energy Rev. 2013, 21, 659–673. [Google Scholar] [CrossRef]
  53. Sun, W.; Zhang, Z.; Wu, Z.; Xu, Y. Numerical modeling and optimization of annual thermal characteristics of an office room with PCM active–passive coupling system. Energy Build. 2022, 254, 111629. [Google Scholar] [CrossRef]
  54. Kravchenko, E.; Liu, J.; Li, X. Numerical modelling of the thermal performance of soil containing microencapsulated PCM. Construct. Build. Mater. 2021, 298, 123865. [Google Scholar] [CrossRef]
  55. Thonon, M.; Fraisse, G.; Zalewski, L.; Pailha, M. Analytical modelling of PCM supercooling including recalescence for complete and partial heating/cooling cycles. Appl. Therm. Eng. 2021, 190, 116751. [Google Scholar] [CrossRef]
  56. Bennon, W.D.; Incropera, F.P. A continuum model for momentum, heat and species transport in binary solid-liquid phase change systems—I. model formulation. Int. J. Heat Mass Transf. 1987, 30, 2161–2170. [Google Scholar] [CrossRef]
  57. Bennon, W.D.; Incropera, F.P. A continuum model for momentum, heat and species transport in binary solid-liquid phase change systems. II: Application to solidification in a rectangular cavity. Int. J. Heat Mass Transf. 1987, 30, 2171–2187. [Google Scholar] [CrossRef]
  58. Zhang, Y.; Du, K.; He, J.P.; Yang, L.; Li, Y.J. Impact factors analysis of the enthalpy method and the effective heat capacity method on the transient nonlinear heat transfer in phase change materials (PCMs)—Numerical heat transfer, part A: Applications. Int. J. Comput. Methodol. 2014, 65, 66–83. [Google Scholar] [CrossRef]
  59. Kasibhatla, R.R.; König-Haagen, A.; Brüggemann, D. Numerical modelling of wetting phenomena during melting of PCM. Procedia Eng. 2016, 157, 139–147. [Google Scholar] [CrossRef] [Green Version]
  60. Voller, V.R.; Prakash, C. A fixed grid numerical modelling methodology for convection-diffusion mushy region phase-change problems. Int. J. Heat Mass Transf. 1987, 30, 1709–1719. [Google Scholar] [CrossRef]
  61. Voller, V.; Cross, M. An explicit numerical method to. Int. J. Heat Mass Transf. 1983, 26, 147–150. [Google Scholar] [CrossRef]
  62. Hashemi, T.H.; Sliepcevich, C.M. A numerical method for solving two-dimensional problems of heat conduction with change of phase. Chem. Eng. Prog. Symp. Ser. 1968, 63, 34–41. [Google Scholar]
  63. Mahdi, M.S.; Mahood, H.B.; Mahdi, J.M.; Khadom, A.A.; Campbell, A.N. Improved PCM melting in a thermal energy storage system of double-pipe helical-coil tube. Energy Convers. Manag. 2020, 203, 112238. [Google Scholar] [CrossRef]
  64. Mahdi, J.M.; Mohammed, H.I.; Hashim, E.T.; Talebizadehsardari, P.; Nsofor, E.C. Solidification enhancement with multiple PCMs, cascaded metal foam and nanoparticles in the shell-and-tube energy storage system. Appl. Energy 2020, 257, 113993. [Google Scholar] [CrossRef]
  65. Gholamibozanjani, G.; Farid, M. Experimental and mathematical modeling of an air PCM heat exchanger operating under static and dynamic loads. Energy Build. 2019, 202, 109354. [Google Scholar] [CrossRef]
  66. Jaworski, M. Mathematical model of heat transfer in PCM incorporated fabrics subjected to different thermal loads. Appl. Therm. Eng. 2019, 150, 506–511. [Google Scholar] [CrossRef]
  67. El Khadraoui, A.; Bouadila, S.; Kooli, S.; Farhat, A.; Guizani, A. Thermal behavior of indirect solar dryer: Nocturnal usage of solar air collector with PCM. J. Clean. Prod. 2017, 148, 37–48. [Google Scholar] [CrossRef]
  68. Babar, O.A.; Arora, V.K.; Nema, P.K.; Kasara, A.; Tarafdar, A. Effect of PCM assisted flat plate collector solar drying of green chili on retention of bioactive compounds and control of aflatoxins development. Sol. Energy 2021, 229, 102–111. [Google Scholar] [CrossRef]
  69. Vigneshkumar, N. Investigation on indirect solar dryer for drying sliced potatoes using phase change materials (PCM). Mater. Today Proc. 2021, 47, 5233–5238. [Google Scholar] [CrossRef]
  70. Vengadesan, E.; Senthil, R. A review on recent development of thermal performance enhancement methods of flat plate solar water heater. Sol. Energy 2020, 206, 935–961. [Google Scholar] [CrossRef]
  71. Najjar, A.; Hasan, A. Modeling of greenhouse with PCM energy storage. Energy Convers. Manag. 2008, 49, 3338–3342. [Google Scholar] [CrossRef]
  72. Llorach-Massana, P.; Peña, J.; Rieradevall, J.; Montero, I. Analysis of the technical, environmental and economic potential of phase change materials (PCM) for root zone heating in Mediterranean greenhouses. Renew. Energy 2017, 103, 570–581. [Google Scholar] [CrossRef] [Green Version]
  73. Kürklü, A. Energy storage applications in greenhouses by means of phase change materials (PCMs): A review. Renew. Energy 1998, 13, 89–103. [Google Scholar] [CrossRef]
  74. Beveren, P.J.M.; Bontsema, J.; Stratenc, G.; Hentena, J. Optimal control of greenhouse climate using minimal energy and grower defined bounds. Appl. Energy 2015, 159, 509–519. [Google Scholar] [CrossRef]
  75. Kenisarin, M.; Mahkamov, K. Solar energy storage using phase change materials. Renew. Sustain. Energy Rev. 2007, 11, 1913–1965. [Google Scholar] [CrossRef]
  76. DSC-60 Plus Addresses the Various DSC Applications. Available online: https://www.shimadzu.com/an/products/thermal-analysis/differential-scanning-calorimeters/dsc-60-plus-series/index.html (accessed on 20 October 2021).
  77. PerkinElmer DSC 7. Available online: https://www.labx.com/product/perkin-elmer-dsc-7 (accessed on 20 October 2021).
  78. Kass, G.V. An exploratory technique for investigating large quantities of categorical data. Appl. Stat. 1980, 29, 119–127. [Google Scholar] [CrossRef]
  79. Breiman, L.; Friedman, J.H.; Olshen, R.A.; Stone, C.J. Classification and Regression Trees; Wadsworth & Brooks/Cole Advanced Books & Software: Monterey, CA, USA, 1984. [Google Scholar] [CrossRef]
  80. Ripley, B.D. Pattern Recognition and Neural Networks; Cambridge University Press: Cambridge, UK, 1996; ISBN 0-521-46086-7. [Google Scholar]
  81. Friedman, J. Multivariate adaptive regression splines (with discussion). Ann. Stat. 1991, 19, 79–141. [Google Scholar]
  82. Hastie, T.; Tibshirani, R.; Friedman, J.H. The Elements of Statistical Learning: Data Mining, Inference, and Prediction; Springer: New York, NY, USA, 2001. [Google Scholar]
Figure 1. Cross-section of the PCM battery.
Energies 15 00735 g001
Figure 2. PCM battery charging diagram in a closed circuit.
Energies 15 00735 g002
Figure 3. Block diagram of the model for estimating the amount of energy stored in the battery.
Energies 15 00735 g003
Figure 4. The DSC phase change curve for the tested material—R58 paraffin.
Energies 15 00735 g004
Figure 5. Empirical distributors of APE errors of the stored energy models in the PCM battery determined on the basis of the energy supplied to the fan, paraffin temperature for the data; (a) teaching, (b) testing.
Energies 15 00735 g005
Table 1. Technical specification of the PCM battery (the design of the PCM battery was developed by the authors of this publication).
DescriptionDimensions
Total length *)3 m
Width1.1 m
Height1.6 m
Diameter of the connection piece on the inlet and outlet0.315 m
The diameter of the heat exchanger tubesDN100 mm
Thermal insulation thickness **)100 mm
Circulation pipe diameter0.315 m
Heat transfer surface area13.5 m2
The mass of the battery structure1000 kg
*)—With diffuser/confusor and reversing chamber, **)—Mineral wool, λ= 0.035 W/mK.
Table 2. Physical parameters of paraffin R58.
Measured ParameterUnitCondition of the Material Tested
I Transformation
Solid–Solid
I Transformation
Solid–Liquid
Melting temperature°C3858
Heat of a phase transition of meltingkJ∙kg−121.94130
Specific heatkJ∙(kg∙K)−16.3723
Table 3. The correlation coefficient between the amount of stored electricity in PCM and the independent variables.
Dependent VariableCorrelation Coefficient
Energy Supplied to the BatteryParaffin
Temperature
Temperature
Inside the Object
Energy stored
in the battery
0.990.980.43
Table 4. The results of ANN modeling for the energy stored in the PCM battery determined on the basis of the electric energy supplied to the battery, temperature inside the object, paraffin temperature.
The Name of
the Network
Learning
Algorithm
Error
Function
Activation (Hidden)Activation (Starting)Error
(Learning)
Error (Testing)Error
(Validation)
MLP 3-11-1BFGS 278SOSLogisticTanh0.0420.1680.602
MLP 3-4-1BFGS 84SOSTanhLogistic0.1250.2020.319
MLP 3-10-1BFGS 238SOSTanhLogistic0.0430.1600.219
MLP 3-5-1BFGS 105SOSLogisticTanh0.0960.1390.403
MLP 3-4-1BFGS 93SOSLogisticLinear0.1320.2780.346
Table 5. Independent variable sensitivity analysis for the PCM battery energy storage model.
ANNModel Sensitivity Index for the Independent Variable [-]:
Paraffin TemperatureEnergy Supplied to the BatteryTemperature Inside the Object
MLP 3-11-1542.75330.498.23
MLP 3-4-1854.54611.9016.32
MLP 3-10-1716.79732.6311.01
MLP 3-5-11339.36227.6018.32
MLP 3-4-1948.34627.678.11
Table 6. List of errors for the used methods of modeling the energy stored in the PCM battery, determined on the basis of the energy supplied to the fan, paraffin temperature.
Error
[%]
Methods
ANNRFBRTMARSSMRCRTCHAID
Teaching
MAPE [%]1.795.458.182.5714.591.7911.55
∆ESRt [%]0.971.654.261.356.480.884.31
Validation
MAPE [%]1.825.8111.511.9315.053.8612.09
∆ESRt [%]1.311.975.440.906.931.404.83
Table 7. Summary of errors for the used energy loss modeling methods in the PCM battery.
ErrorMethods
ANNRFBRTMARSSMRCRTCHAID
Teaching
MAPE [%]0.0971.7651.8070.1180.1271.9112.327
∆ESRt [%]0.0911.8121.7120.1130.1252.2032.368
Validation
MAPE [%]0.0571.7152.1470.0820.0881.8512.496
∆ESRt [%]0.0561.6742.0460.0800.0922.0162.285
Publisher’s Note: MDPI stays neutral with regard to jurisdictional claims in published maps and institutional affiliations.

