Article

Day-Ahead Optimal Scheduling of an Integrated Energy System Based on a Piecewise Self-Adaptive Particle Swarm Optimization Algorithm

1
College of New Energy, China University of Petroleum (East China), Qingdao 266580, China
2
Electric Power Branch Company of Shengli Oilfield, SINOPEC, Dongying 257001, China
3
Public Service Center of Shengli Oilfield, SINOPEC, Dongying 257001, China
4
Qingdao Ruinengda Electrical Technology Limited Company, Qingdao 266580, China
*
Author to whom correspondence should be addressed.
Energies 2022, 15(3), 690; https://doi.org/10.3390/en15030690
Submission received: 24 December 2021 / Revised: 13 January 2022 / Accepted: 15 January 2022 / Published: 18 January 2022
(This article belongs to the Topic Multi-Energy Systems)

Abstract

:
The interdependency of electric and natural gas systems is becoming stronger. The challenge of how to meet various energy demands in an integrated energy system (IES) with minimal cost has drawn considerable attention. The optimal scheduling of IESs is an ideal method to solve this problem. In this study, a day-ahead optimal scheduling model for IES that included an electrical system, a natural gas system, and an energy hub (EH), was established. The proposed EH contained detailed models of the fuel cell (FC) and power to gas (P2G) system. Considering that the optimal scheduling of an IES is a non-convex complex optimal problem, a piecewise self-adaptive particle swarm optimization (PCAPSO) algorithm based on multistage chaotic mapping was proposed to solve it. The objective was to minimize the operating cost of the IES. Three operation scenarios were designed to analyze the operation characteristics of the system under different coupling conditions. The simulation results showed that the PCAPSO algorithm improved the convergence rate and stability compared to the original PSO. An analysis of the results demonstrated the economics of an IES with the proposed EHs and the advantage of cooperation between the FC and P2G system.

1. Introduction

An integrated energy system (IES) can couple various forms of energy, such as electricity and natural gas, to meet the demands of users for multiple energy sources. Additionally, IESs are capable of realizing the complementary utilization of energy, reducing the operation cost of the system, promoting the absorption of solar/wind power [1,2], improving energy efficiency, and mitigating pollution emissions, which makes them a viable option to solve the energy and environmental problems [3]. Optimal energy flow (OEF) calculation provides a basis for the economic operation of IESs. Furthermore, the daily fluctuation of wind power and load should be taken into consideration [4], which requires day-ahead planning of the optimal energy flow of the IES.
The modeling of the energy hub (EH) and its internal components is one of the key points in current research on day-ahead optimal energy flow. In [5], taking the industrial production process (IPP) as a control variable of optimal scheduling, a universal extension EH model was proposed. The results demonstrate that such a method reduces the operation cost. Analogously, a digester can be added to the EH to interconnect the EH with a biogas–electric multi-energy system to form a biogas–solar–wind complementary model, which improves the absorption rate of renewable energy and reduces the operation cost of the IES [6]. A concentrating solar power plant model that couples the power grid and the heating network, making the internal components of the EH more diversified, was established in [7]. The results showed that the EH can lower the operation cost and promote the wind power penetration of the IES. Considering nitrogen and ammonia cycles, Xu et al. used a power to ammonia system to replace the P2G system in a general EH, which improved the operating efficiency and economics of the EH [8]. This topology strengthened the interconnection between electrical and thermal systems but weakened the interconnection between electrical and gas systems. An energy router was added into the EH in [9] to form a new EH model structure, and an optimal energy management strategy was proposed. The case studies demonstrated that the interconnection of two EHs could effectively reduce the operation cost of the IES. Ju et al. designed a novel structure of a P2G-based virtual power plant. The P2G model was divided into two parts: electrolysis for hydrogen production and the synthesis of methane [10]. In [11], an energy hub that incorporates emerging distributed energy resources as well as energy storage devices was proposed. The results showed that the operation cost was reduced with multiple energy hubs. A literature review shows that the research on EHs mainly focuses on the elaboration and enrichment of the model, which can improve the energy utilization rate of the IES and reduce its operation cost.
On the other hand, exploring the optimal algorithms suitable for the OEF problem is also important research in the field of IESs. Numerical algorithms, such as mixed-integer linear programming [7,12,13], Benders decomposition [14], and second-order cone programming [15], are fast in convergence. However, the implementation of the numerical algorithm is complicated, and they may not converge when the objective function is discontinuous or contains multiple extreme points. Many intelligent optimization algorithms are used to solve the OEF problem of the IES, such as the genetic algorithm [16,17,18], teaching–learning-based optimization algorithm [19,20], whale optimization algorithm [21,22], particle swarm optimization (PSO) algorithm, etc. PSO, proposed by Eberhart and Kennedy [23], does not require the continuity and convexity of the objective functions and has a strong adaptability to the uncertainty of computational data. Nevertheless, premature convergence and falling into local optima are disadvantages of PSO [24,25]. In [26], a modified crisscross PSO and improved binary PSO technique was proposed, in which the crisscross search has horizontal and vertical crossover operators to explore the search space in every dimension and mitigate the stagnancy problem. The results showed that the modified crisscross PSO reduced the local optimal problem of PSO and the computational effort of the algorithm. Mellouk et al. proposed a new parallel hybrid genetic algorithm–particle swarm optimization algorithm to solve the optimization problem, which had a convergence time and solution quality that were better than those of ordinary PSO [27]. Combining PSO with other algorithms can also overcome the weaknesses of the original PSO. Bao et al. integrated a heuristic PSO into the decomposition-based sequential multi-energy flow calculation to effectively solve a scheduling model with highly nonlinear multi-energy flow constraints [28]. In [29], the PSO algorithm and niche technology were combined to form a nonlinear decreasing inertia weighting strategy to prevent the algorithm from falling into local optima. The authors in [30] proposed a distributed algorithm that combined PSO and the interior point method. The above work indicates that the modification of the PSO algorithm or its combination with other algorithms can feasibly solve the OEF problem of IESs.
Little of the above literature jointly considered detailed models of the FC and P2G system, and none of it mentioned the effect of their operation on the energy flow distribution, renewable energy consumption, and economics of IESs. In the literature, the deeply modified PSO algorithm and the mathematical optimization algorithm are improved in efficiency; however, their complexity or computation effort is also increased accordingly.
Based on the above discussion, we developed a piecewise self-adaptive particle swarm optimization (PCAPSO) algorithm based on chaotic mapping, which updates the inertia weight factor utilizing the random numbers generated by different types of chaotic mappings during the iteration, to prevent the algorithm from falling into local optima and to enhance its ability to jump out of local optima. In addition, a novel model of energy hubs (EH) was established, which includes detailed models of the fuel cell (FC) and P2G system, and the joint operation of the P2G system, FC, and hydrogen storage tank (HST) was studied. To investigate the influence of multiple EHs on the IES, three EHs were added to the electricity–gas energy system. The operation costs of the systems with different numbers of EHs were compared.
The rest of this paper is organized as follows. In Section 2, the novel EH model is proposed, and the mathematical models of the coupling components are presented. The models of the electrical system and natural gas system are presented in this section as well. In Section 3, the constraints of each system are introduced. The PCAPSO algorithm based on chaotic mapping is constructed and the objective function is presented. Case studies for the day-ahead scheduling of OEF for IESs are provided in Section 4. Finally, the conclusions are drawn in Section 5.

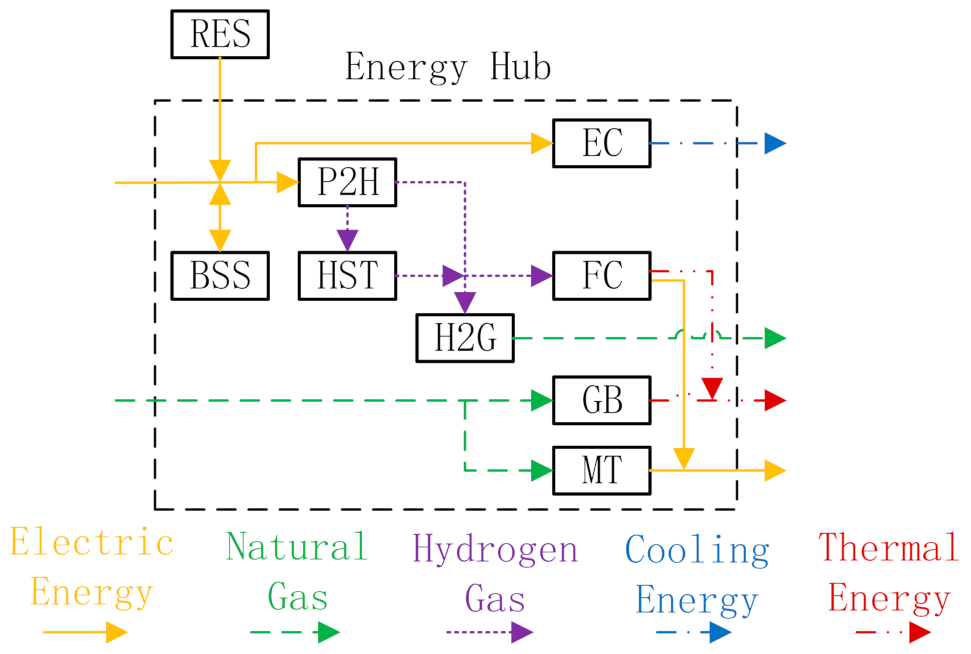
2. Electric–Natural Gas IES Considering New Structural EH

In this section, the structure and formula of EHs are explained first. Then the detailed mathematical models of each coupling component, specifically the two-stage model of the P2G system and co-generation model of the FC, are presented. Thirdly, the steady-state energy flow model of the electric and natural gas system is introduced.

2.1. EH Model

In an IES, the EH is an important structure that couples different energies to provide input and output interfaces for each energy sub-system. The schematic diagram of the proposed EH is shown in Figure 1. The EH mainly includes a battery storage system (BSS), power to hydrogen (P2H) system, hydrogen to gas (H2G) system, hydrogen storage tank (HST), fuel cell (FC), electrical chillers (EC), gas boiler (GB), micro-turbine (MT), and an external renewable energy source (RES). The P2G model consists of an electrolytic cell and a synthetic cell. The electrolytic cell can cooperate with the HST and FC to integrate hydrogen energy flow into the EH, thus enhancing the flexibility of the energy supply. The input energy mainly includes electric energy and natural gas, while the output energy includes electric, thermal, cooling energy, and natural gas.
The relationship between the input and output ports of the EH can be expressed by a coupling matrix [20]:
L = C P
L α L β L ζ = c α α c β α c ζ α c α β c β β c ζ β c α ζ c β ζ c ζ ζ P α P β P ζ
where L is the output matrix; P is the input matrix; and C is the coupling matrix; α , β , , ζ represent the forms of energy, such as electricity, natural gas, thermal energy, cold energy, etc. Each element in C can be a constant or an input-output formulation of a coupling component.

2.2. Modeling of Coupling Components

2.2.1. Power to Gas (P2G) System

The P2G system is an energy coupling device capable of converting electrical energy into natural gas using two main processes: electrolysis and synthesis. In the electrolysis process, water is used as a feedstock to produce hydrogen. The hydrogen is then synthesized with carbon dioxide to produce synthetic natural gas. The chemical reaction equations corresponding to the above processes are [31]:
2 H 2 O 2 H 2 + O 2 CO 2 + 4 H 2 CH 4 + 2 H 2 O
The mathematical model of the P2G system is refined into two processes, P2H and H2G. In this case, the hydrogen produced by the electrolytic cell can be used not only as the reactant of synthetic natural gas, but also as the fuel material for the FC; in addition, it can be fed into the HST for storage, thus enhancing the coupling between the P2G system, HST, and FC. The conversion equations are:
F P 2 H = η P 2 H P P 2 H
F H 2 G = η H 2 G F P 2 H
where F P 2 H is the hydrogen flow generated by electrolysis; η P 2 H is the operation efficiency of the electrolytic cell; P P 2 H is the electric power input into the electrolytic cell; F H 2 G is the flow of synthesized natural gas; and η H 2 G is the synthesis efficiency.

2.2.2. Co-Generation Model of the Fuel Cell (FC)

The FC is a device that can convert the chemical energy in hydrogen into electricity and thermal energy. The FC output voltage is affected by various internal overvoltages [32]:
V FC = E Nernst ς act ς ohm ς diff
where E Nernst is the Nernst voltage; η act is the activation polarization overvoltage; η ohm is the ohmic overvoltage; and η diff is the concentration overvoltage. The expressions for the above overvoltages are [32,33]:
E Nernst = 1.299 0.85 × 10 3 T FC 298.15 + 4.3085 × 10 5 T FC ln p H + 0.5 ln p O
where T FC is the operation temperature of the FC; p H is the pressure of hydrogen fed into the FC; and p O is the pressure of oxygen fed into the FC.
ς act = ξ 1 + ξ 2 T FC + ξ 4 T FC ln I + ξ 3 T FC ln p O 5.08 × 10 6 exp 498 / T FC
In Equation (8), I is the current density of FC; ξ 1 = 0.9514 ; ξ 2 = 0.00286 + 0.0002 ln A FC + 4.3 × 10 5 ln p H / 1.09 × 10 6 exp 77 / T FC ; A FC is the effective area of the FC; ξ 3 = 7.4 × 10 5 ; and ξ 4 = 1.87 × 10 4 .
ς ohm = I R int
In Equation (9), R int is the internal resistance of the FC.
ς diff = m exp n I
In Equation (10), n is the porosity function of the gas diffusion layer, which is a constant in this paper, and m is the conductivity function of the electrolyte, which is a temperature-related function as follows [34]:
1.1 × 10 4 1.2 × 10 6 T FC 273.15 , T FC 312.15 K 3.3 × 10 3 8.2 × 10 5 T FC 273.15 , T FC < 312.15 K
If N 1 FCs are in parallel and N 2 FCs are in series, then the output voltage and current of the FC stack are:
V out = N 2 V FC
I = 2 F W H N 1 M H
where F is the Faraday constant, 96,485 C/mol; W H is the rate of hydrogen fed into the FC stack; and M H is the molar mass of hydrogen. The active power and thermal energy output of the FC can be obtained as:
P FC = V out I = 2 F W H M H E Nernst ς act ς ohm ς diff
Q FC = I N 1 E Nernst V out = 2 F W H M H ς act + ς ohm + ς diff

2.2.3. Hydrogen Storage Tank (HST)

The HST is mainly used to store hydrogen converted from surplus renewable energy through the P2H process. On the one hand, the stored hydrogen can be used in the P2G process to synthesize natural gas; on the other hand, it can be used as fuel for the FC. The storage state of the HST at time t can be expressed as [10]:
S HST , t = S HST , T + t = 1 T η HST F HST , t P 2 H F HST , t FC F HST , t H 2 G
where S HST , T is the hydrogen storage capacity of the HST at initial time; η HST is the operation efficiency of the HST; F HST , t P 2 H is the hydrogen fed into the HST from the P2H system at time t; F HST , t FC is the hydrogen fed into the FC from the HST at time t; and F HST , t H 2 G is the hydrogen fed into the H2G system from the HST at time t.

2.3. Modeling of Power System

2.3.1. Electric Network

The steady-state power flow model is assumed [35].

2.3.2. Battery Storage System (BSS)

The energy storage state of the BSS is generally represented by its state of charge (SOC). According to the different operating characteristics, the SOC can be divided into two states: the charging process and the discharging process [10]. For charging:
S O C t = 1 δ S O C t 1 + P c Δ t η c E c
where S O C t is the SOC of the BSS at time t; δ is the self-discharge rate; S O C t 1 is the SOC of the BSS at time t−1; P c is the charging power of the BSS; Δ t is the time interval; η c is the charging efficiency of the BSS; and E c is the rated capacity of the BSS.
For discharging:
S O C t = 1 δ S O C t 1 P d Δ t E c η d
where P d is the discharge power of the BSS and η d is the discharge efficiency of the BSS.

2.4. Modeling of Natural Gas System

The model of the natural gas system is described in [35].

2.5. Energy Conversion Relationship of the Proposed EH

Combining Equation (2) with the mathematical models of the coupling devices, the energy conversion relationship between input and output can be expressed as:
L e L ngs L h L c = 0 v g 1 η MT + 2 F η P 2 H M H E Nernst ς act ς ohm ς diff v e 1 η P 2 H η P 2 G 0 0 v g 2 η GB + 2 F η P 2 H M H ς act + ς ohm + ς diff v e 2 η EC 0 P e P ngs
where η MT , η GB , and η EC are the conversion efficiency of MT, GB, and EC, respectively; v g 1 and v g 2 are dispatch factors of natural gas; v e 1 and v e 2 are dispatch factors of electric power; P e is electric power input into the EH; P ngs is natural gas input into the EH; L e is electric power output from the EH; L ngs is natural gas output from the EH; L h is thermal energy output from the EH; and L c is cold energy output from the EH.

3. PCAPSO Algorithm for the Optimal Scheduling of IES

In this section, the constraints of the subsystems and components are explained. The objective function of the day-ahead scheduling of optimal energy flow for an IES is presented to evaluate the operation cost of IESs. After that, the piecewise self-adaptive particle swarm optimization based on chaotic mapping is proposed to solve the optimization problem.

3.1. System Constraints

3.1.1. Power System Constraints

Considering that coal-fired generators are the main power sources of a power system [36], the power system constraints mainly include active power constraints, reactive power constraints, node voltage constraints, and other constraints.

3.1.2. Natural Gas System Constraints

The constraints in a natural gas system mainly include node pressure constraint, pipeline flow constraint, and compressor inlet and outlet pressure constraints.

3.1.3. Battery Storage System (BSS) Constraints

The main constraints of the BSS are the electric quantity constraint and power constraint [9,37].
The electric quantity constraint is given by:
S O C min < S O C t < S O C max
where S O C min and S O C max are the lower and upper limit of SOC, respectively.
The power constraints are given by:
P c , max t = min P max , C , E c S O C max 1 δ S O C t 1 Δ t η c P d , max t = min P max , D , E c η d 1 δ S O C t 1 S O C min Δ t
where P c , max t is the maximum charging power of the battery at time t; P max , C is the maximum permissible continuous charging power of the battery; P d , max t is the maximum discharge power of the battery at time t; and P max , D is the maximum permissible continuous discharge power of the battery. If the rated power of the battery is P n , then:
P max , C = N c , max P n P max , D = N d , max P n
where N c , max and N d , max are the maximum charge and discharge multiples, respectively.

3.1.4. Hydrogen Storage Tank (HST) Constraints

The constraints of the HST are given by:
S HST , min S HST , t S HST , max
F HST , min F HST , t F HST , max
where S HST , min and S HST , max are the minimum and maximum values of the hydrogen reserves in the HST, respectively; F HST , t is the amount of hydrogen input/output into the HST at time t; and F HST , min and F HST , max are the minimum and maximum values of hydrogen input/output in the HST, respectively.

3.2. PCASO Optimization Model and Algorithm

3.2.1. Objective Function

The objective function includes the electric cost, natural gas cost of compressor, operation cost of the FC and BSS, and the profit from selling heat, as:
min t = 1 24 C electric t + C natural   gas t + C FC t + C BSS t C sell t
where C electric t is the operation cost of the electrical system at time t; C natural   gas t is the operation cost of the natural gas system at time t; C FC t is the operation cost of the FC at time t; C BSS t is the operation cost of the BSS at time t; and C sell t is the profit from selling heat and cold energy at time t. Each of these variables can be expressed as follows:
C electric t = i = 1 N G a i t P G , i 2 t + b i t P G , i t + c i t
C natural   gas t = i = 1 N com c com , i t τ com , i t
C FC t = i = 1 N FC c FC , i t P FC , i t s FC , i t Q FC , i t
C BSS t = i = 1 N BSS c BSS , i t P BSS , i t
C sell t = s EC , i t i = 1 N EC Q EC , i t + s AC , i t i = 1 N GB Q GB , i t
where N G , N com , N FC , N BSS , N EC , and N GB are the number of generators, compressors, FCs, BSSs, ECs, and GBs, respectively; a i t , b i t , and c i t are the cost coefficients of the ith generator at time t; P G , i t is the active power generated by the ith generator at time t; c com , i t is the cost coefficient of the ith compressor at time t; τ com , i t is the natural gas flow fed into the ith compressor at time t; c FC , i t and s FC , i t are the cost and profit coefficients, respectively, of the ith FC at time t; P FC , i t and Q FC , i t are the electricity and thermal energy, respectively, produced by the ith FC at time t; c BSS , i t is the cost coefficient of the ith BSS at time t; P BSS , i t is the charge or discharge power of the ith BSS at time t; s EC , i t is the profit coefficient of the ith EC at time t; s GB , i t is the profit coefficient of the ith GB at time t;  Q EC , i t is the cold energy produced by the ith EC at time t; and Q GB , i t is the thermal energy produced by the ith GB at time t.

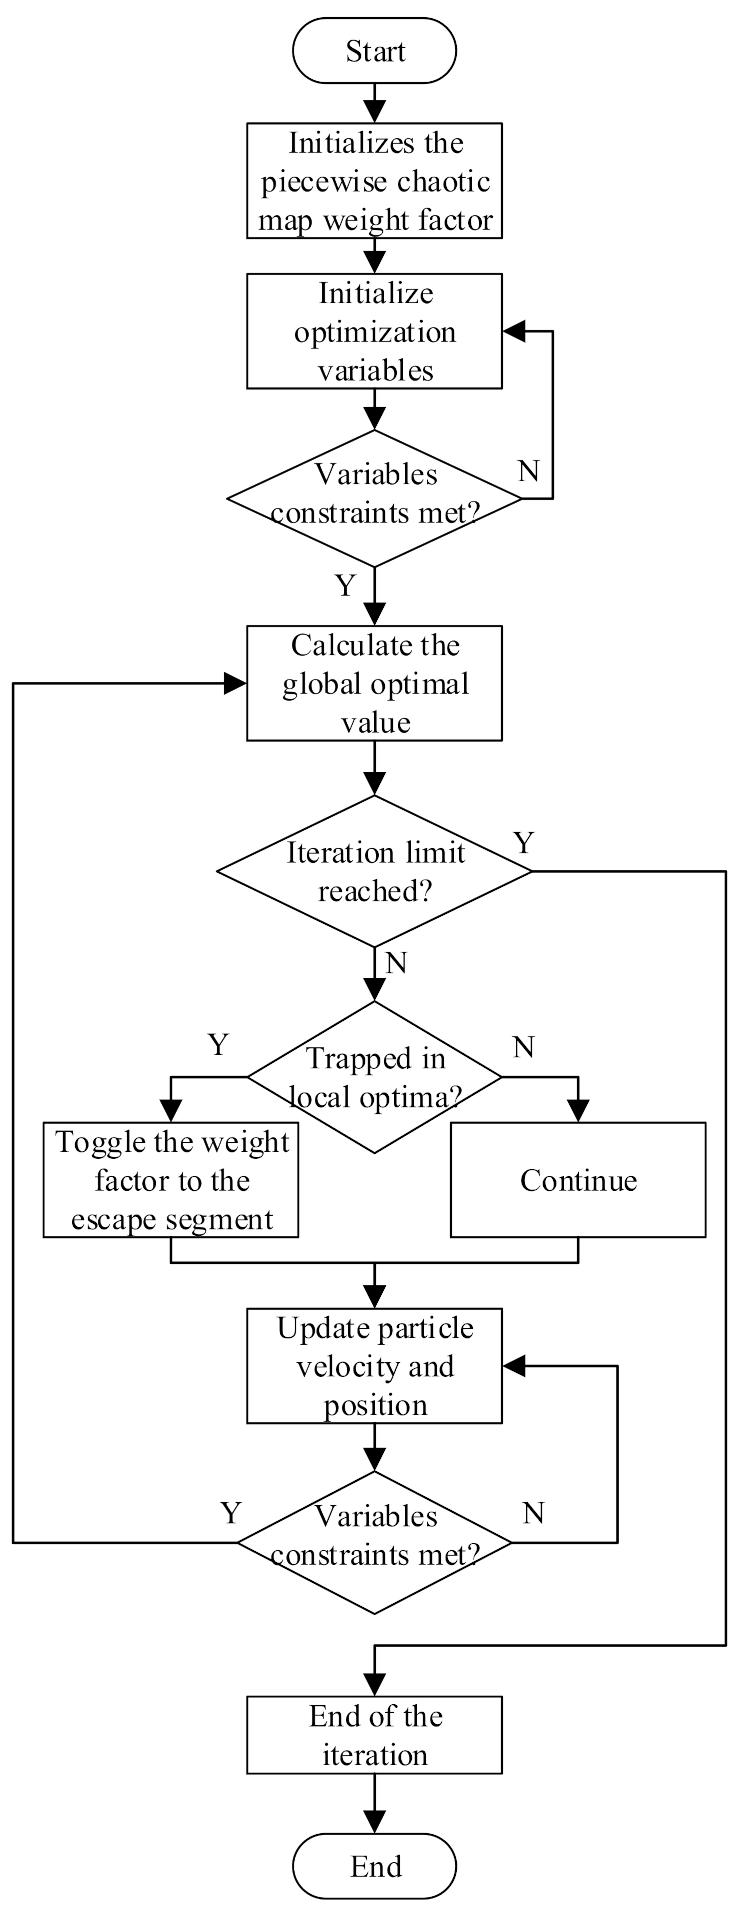
3.2.2. Optimization Algorithm

In this paper, by simplifying and modifying the algorithm in reference [25], a piecewise self-adaptive particle swarm optimization (PCAPSO) based on chaotic mapping is proposed.
Chaotic mapping is a typical collection of nonlinear mappings. Random sequences generated by chaotic mappings are often used in intelligent optimization algorithms. In PCAPSO, the nonlinear inertial weight factor is divided into two sections: search and escape. This piecewise inertial weight factor based on the use of different mappings can accelerate the iterative convergence and evade local optima. The basic working principle is that the search section of the inertial weight factor is used in a regular iterative process, while the escape section is used when particles are trapped in local optima. Based on this mechanism, Gaussian mapping and logistic mapping are used in the search and escape sections, respectively. The definition of Gaussian mapping is as follows:
z 1 = rand z k + 1 = 0 , z k = 0 mod 1 / z k , 1 , z k 0
where z ( 1 ) is the first number generated by Gaussian mapping; z ( k ) and z ( k + 1 ) is the kth and (k+1)th number generated by Gaussian mapping; rand represents random number, and mod (a, b) represents obtaining the remainder after a is divided by b. Thus, the search section of the nonlinear inertia weight factor can be expressed as:
ω search k = z k ω min + ω max ω min k max k
where ω max and ω min are the maximum and minimum of the inertia weight factor, respectively; k max is the maximum of iteration; and z k is a random number generated by the Gaussian mapping.
The definition of logistic mapping is as follows:
r 0 = r a n d ,   k = 0 r k + 1 = μ r k 1 r k , 0 < k
where r 0 0 , 0.25 , 0.5 , 0.75 , 1 and μ 0 , 4 . Correspondingly, the escape section of the nonlinear inertia weight factor can be expressed as:
ω esc k = r k c mag + c offset
where c mag and c offset are the magnitude and offset coefficient, respectively, and r k is a random number generated by the logistic mapping.
The algorithm flowchart of PCAPSO is shown in Figure 2.

4. Case Study

In this section, the testing system and the coupling mode between subsystems under different operation conditions are introduced. Based on the simulation results, the improvement of the proposed algorithm is demonstrated, and the operation characteristics and economics of the optimized IESs with different numbers of EHs are analyzed.

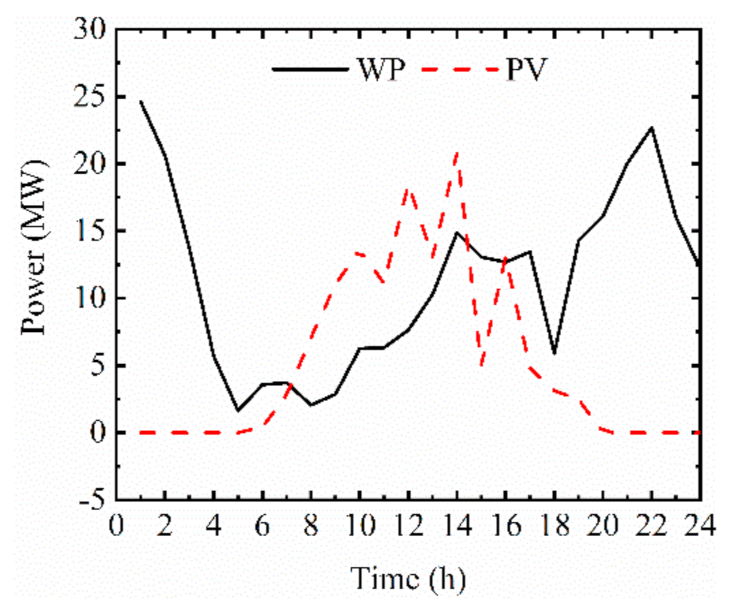
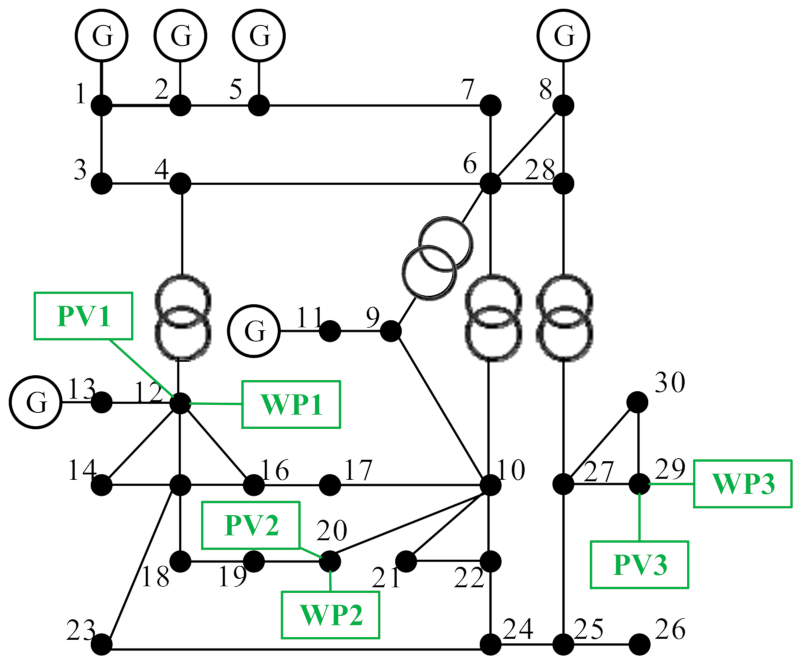
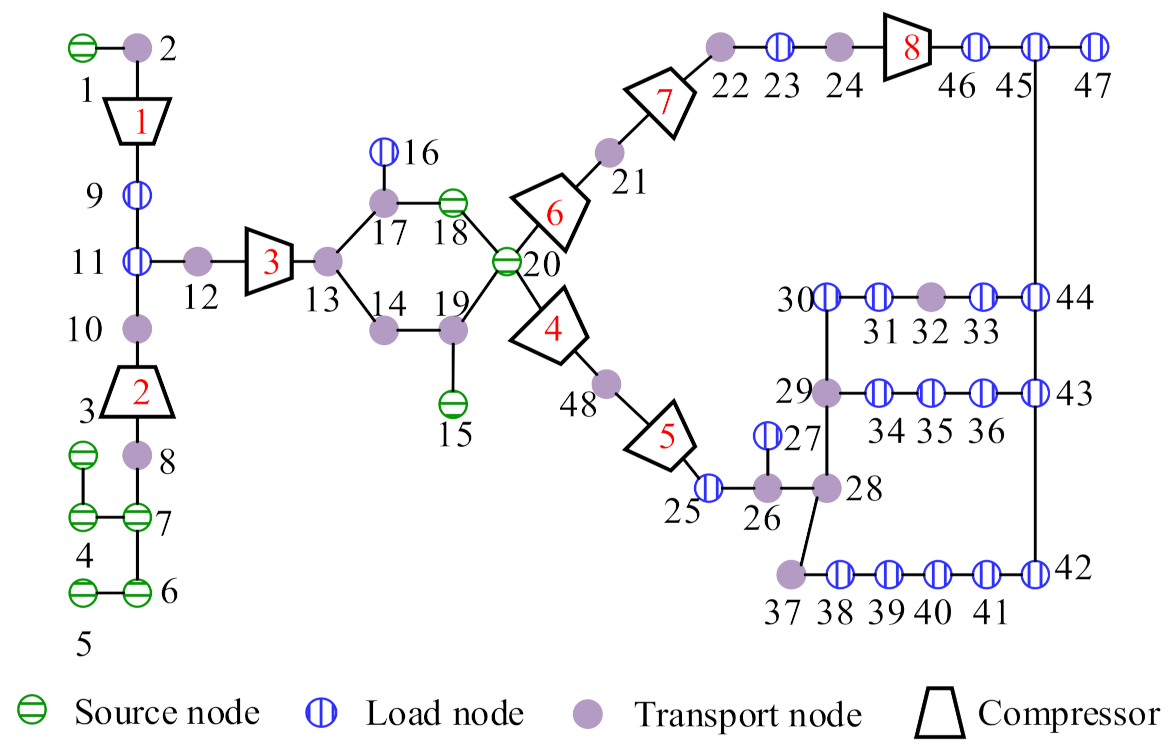
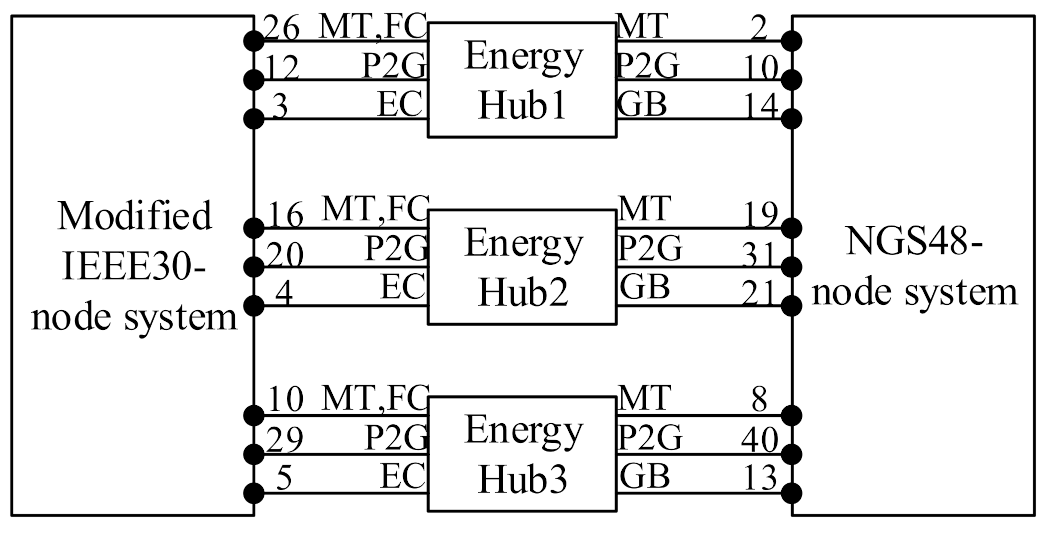
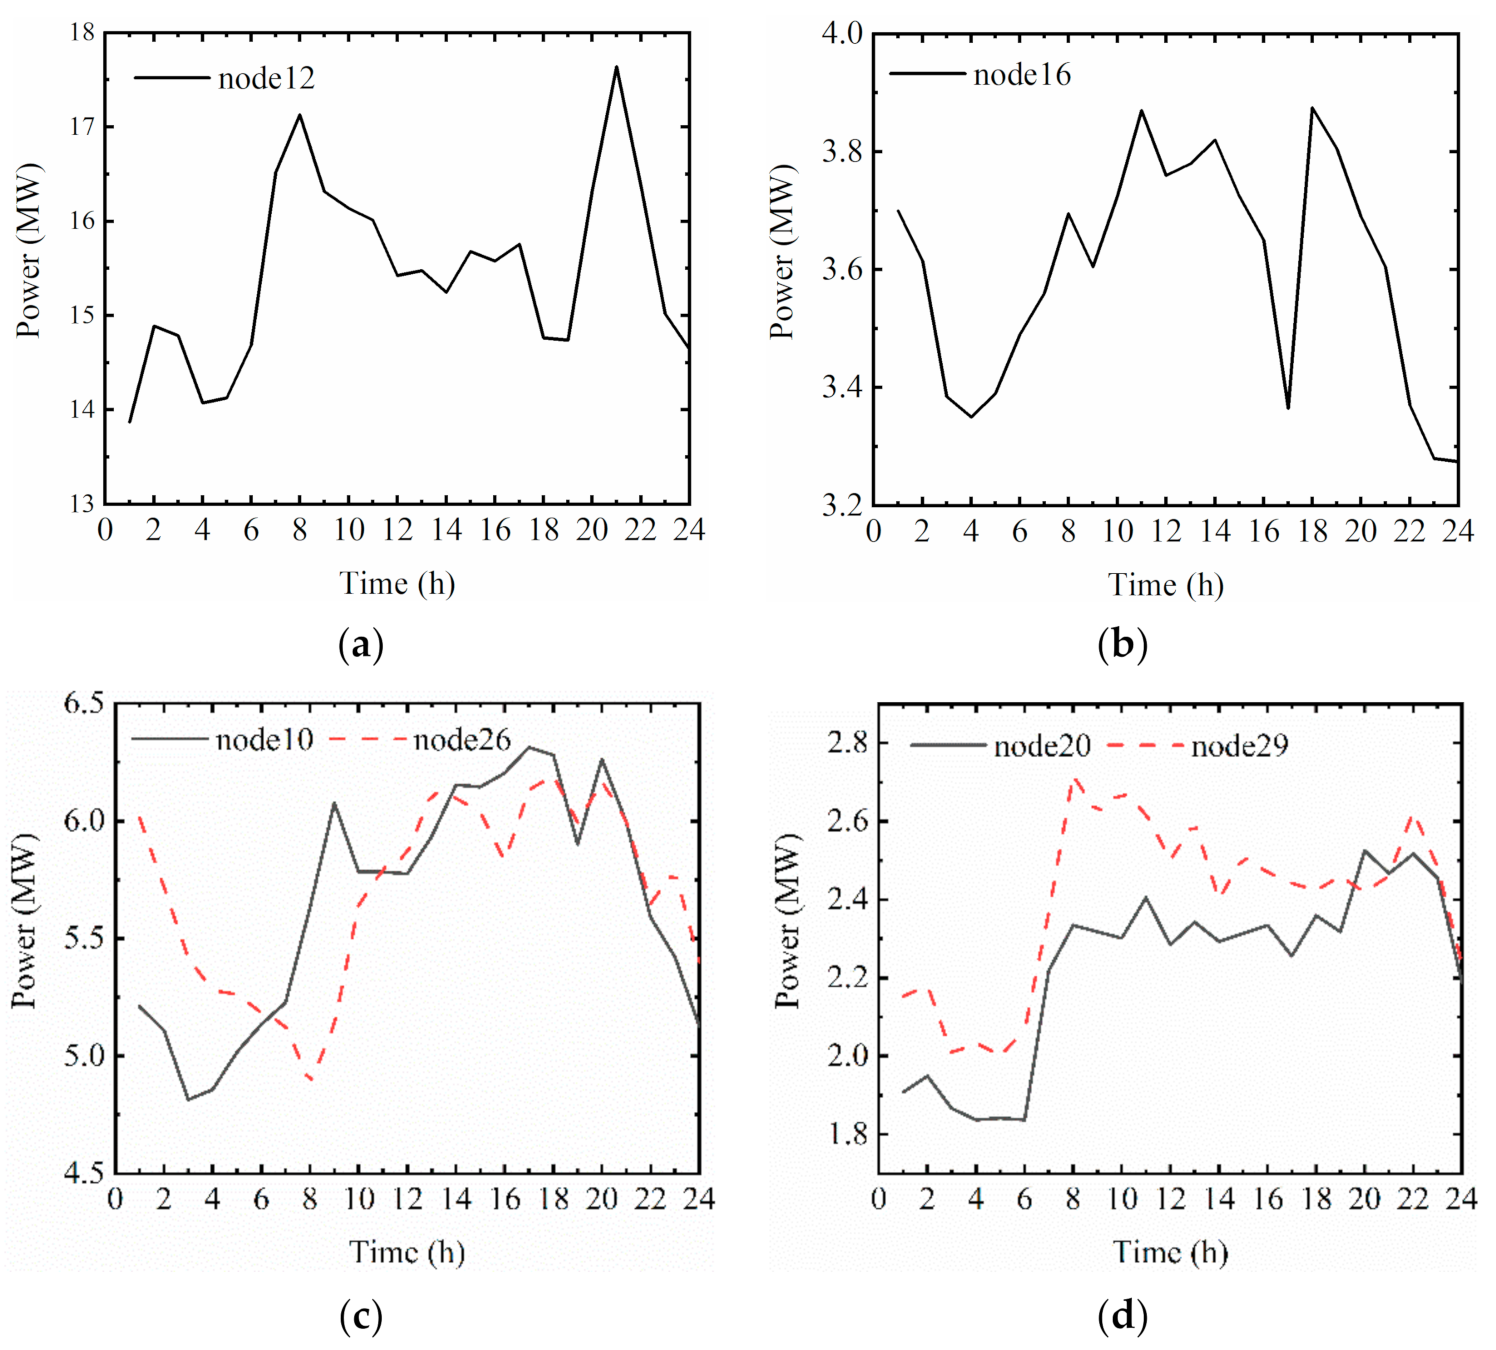
4.1. System Description

The simulation system was composed of a modified IEEE 30-bus system, the 48-bus natural gas system referred from [35], and EHs. The topologies of the two subsystems are depicted in Figure 3 and Figure 4. Three EHs were connected to electric buses 3, 4, 5, 10, 12, 16, 20, 26, and 29 in the electrical system and the natural gas nodes 2, 8, 10, 13, 14, 19, 21, 31, and 40 in the natural gas system. The coupling relationship inside the IES is shown in Figure 5. The detailed internal structure of the EH is shown in Figure 1 in Section 2.
In the modified IEEE 30-bus system, three groups of photovoltaic power (PV) and wind power (WP) were included, and load fluctuation [38,39,40] was considered. It was assumed that the output of WP and PV in every group was the same. The curves are shown in Figure 6. The load curves of nodes 10, 12, 16, 20, 26, and 29 are shown in Figure 7. In this simulation, the time-of-use (TOU) price was taken into account in both the electrical and natural gas systems. The price was set to the valley price from 00:00 to 7:00 h. At 8:00 h and from 12:00 to 18:00 h, it was set to the normal price. From 9:00 to 11:00 h and from 19:00 to 23:00 h, the price was set to the peak price. The TOU for the IES is displayed in Table 1.

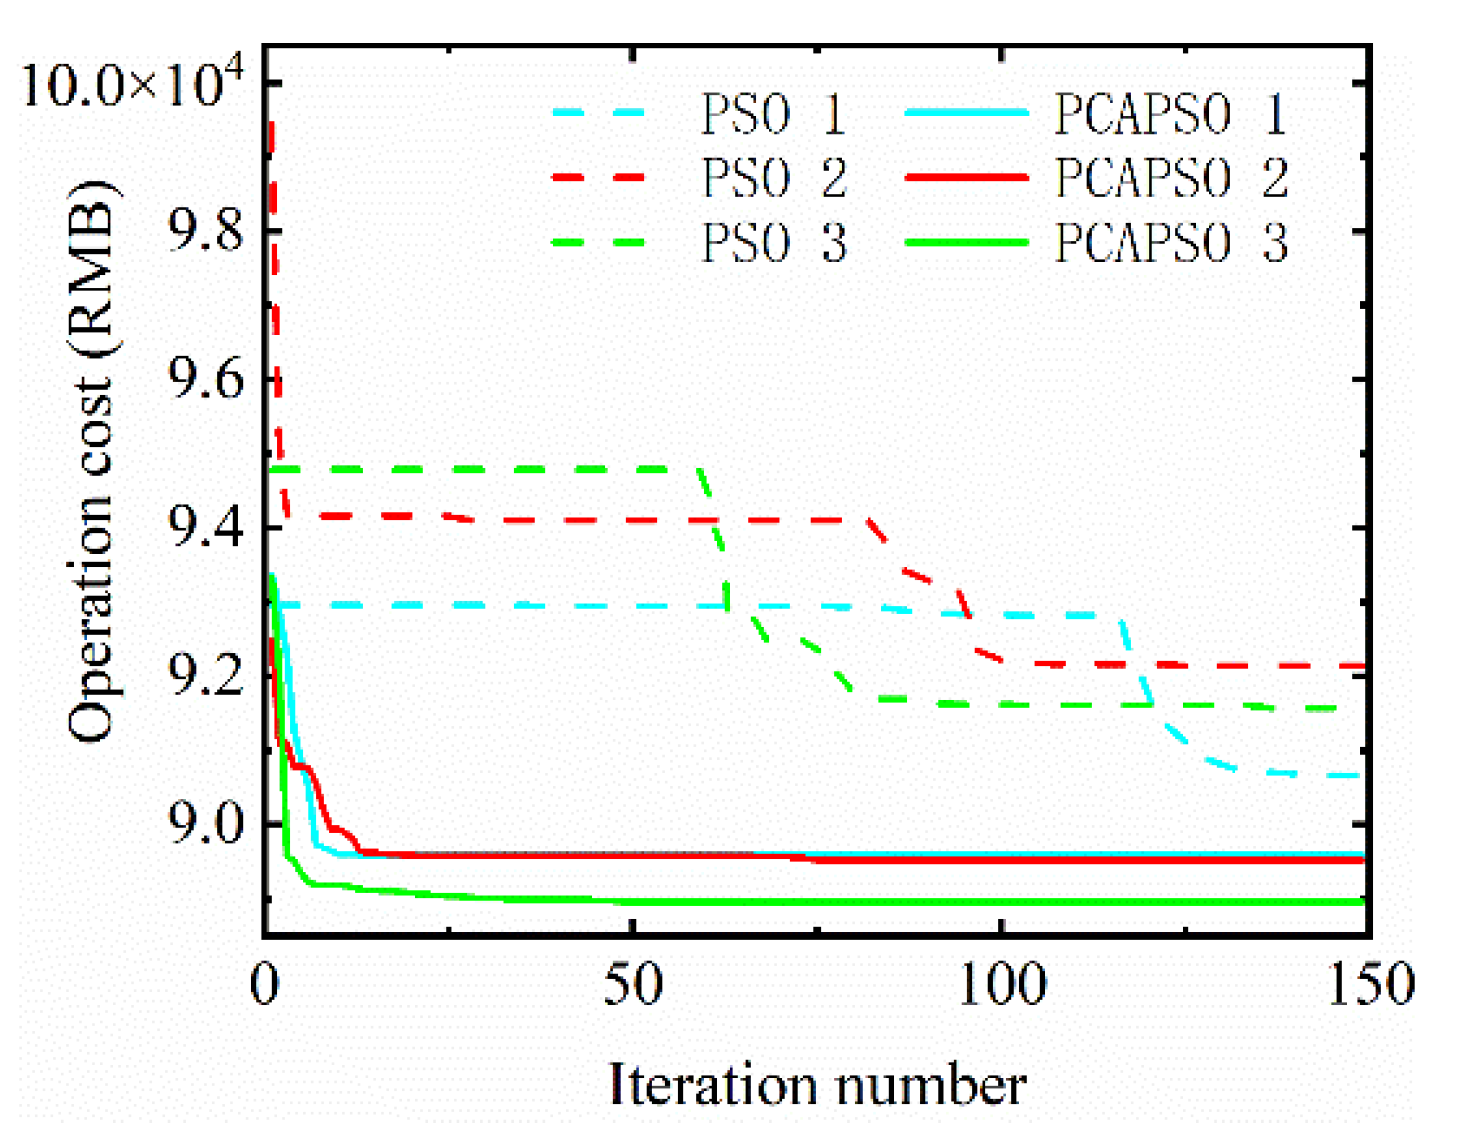
4.2. Effectiveness of OEF Using PCAPSO Based on Chaotic Mapping

A new optimal algorithm called PCAPSO was proposed and used to solve the OEF problem of IES. To validate the effectiveness of the proposed optimization methodology, the original PSO and PCAPSO were used to optimize the above simulation system three times, the results of which are shown in Table 2. The iteration curves are depicted in Figure 8.
As shown in Table 2, the optimal cost of PCAPSO was lower than that of PSO. Therefore, PCAPSO based on piecewise-chaotic mapping was less likely to fall into local optima than PSO. The average value of the three optimization results obtained by using PCAPSO was also lower than that of PSO. Since the standard deviation of PCAPSO was much lower than that of PSO, it can be concluded that the stability of PCAPSO is better than that of PSO. Comparing the three iteration curves of PSO and PCAPSO in Figure 8, it can be observed that each optimization with PSO fell into a local optimum at least once in the first half of the iteration, and the optimization results did not converge to the optimal value when reaching the maximum number of iterations. However, the optimization with PCAPSO barely fell into local optima during entire iteration. This is because in the search section, the randomness of the Gaussian mapping ensures the global searching ability of the inertia weight factor, and its weakening fluctuation characteristic causes the volatility of the inertia weight factor to weaken regularly, which ensures the transition of the inertia weight factor from the global search to the local search. However, once PCAPSO detects that the optimization has fallen into local optima, the escape section is activated; in the escape section, the stationary and stronger volatility of the logistic mapping allows the inertia weight factor to keep its ability of global search, which can help the algorithm to jump out of the local optima. On the other hand, these results also demonstrate that the convergence rate of PCAPSO was faster than that of PSO. The results in Table 2 and Figure 8 show that PCAPSO outperformed PSO in computational efficiency, stability, and convergence accuracy.

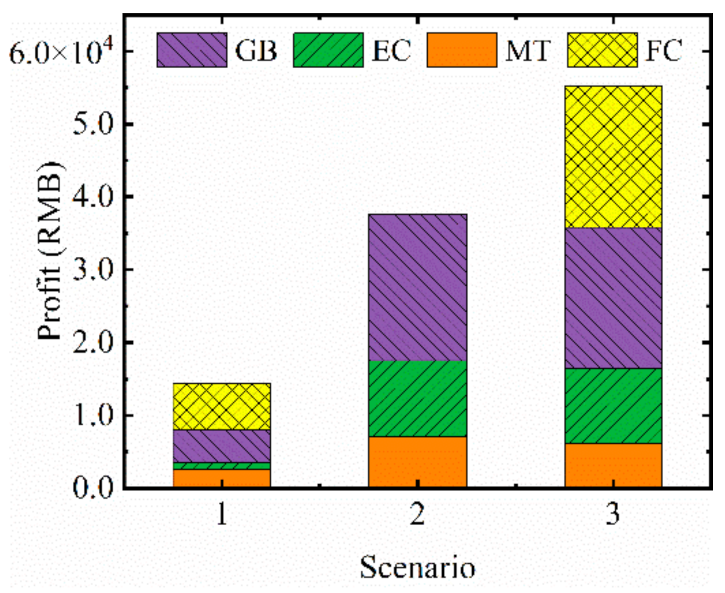
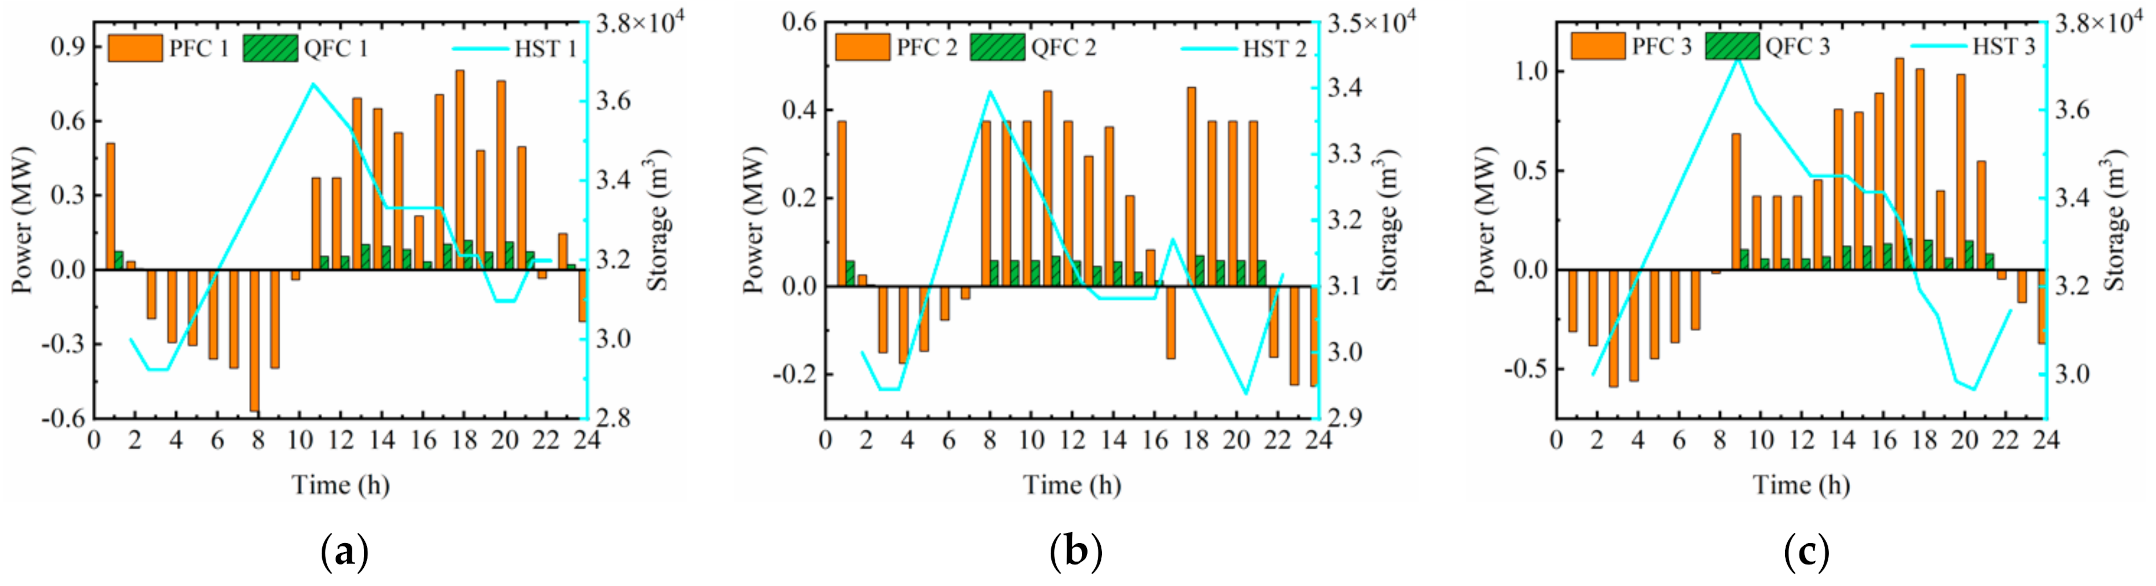
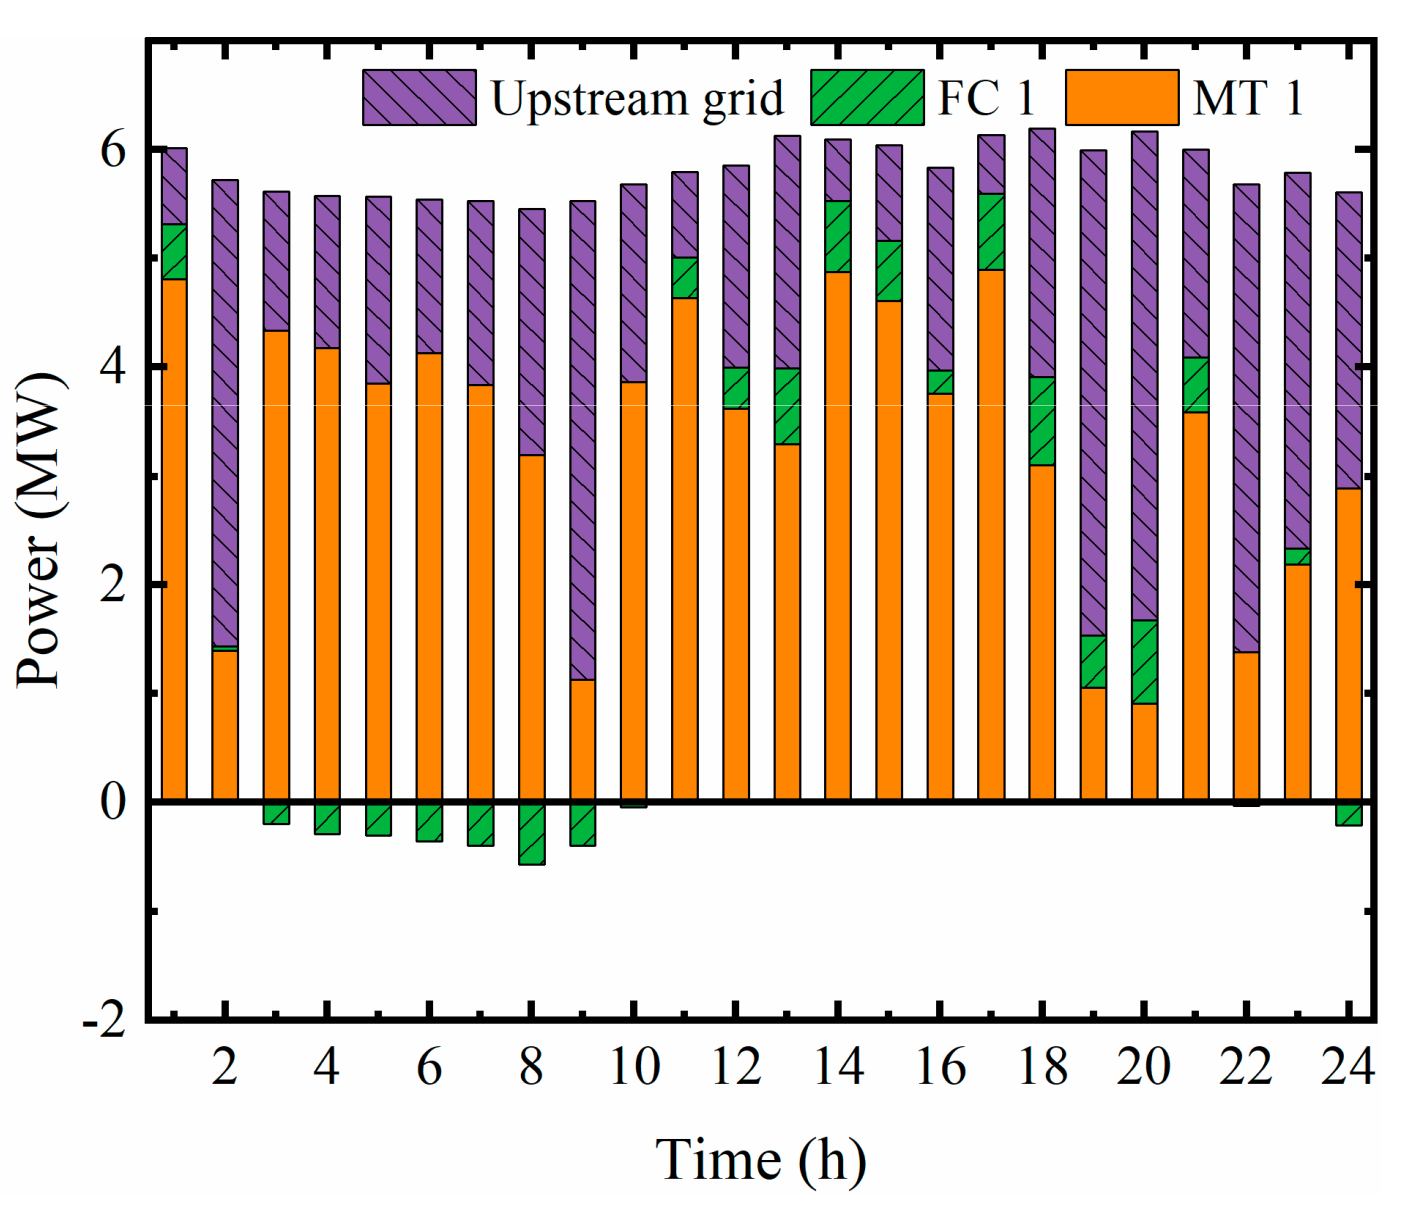
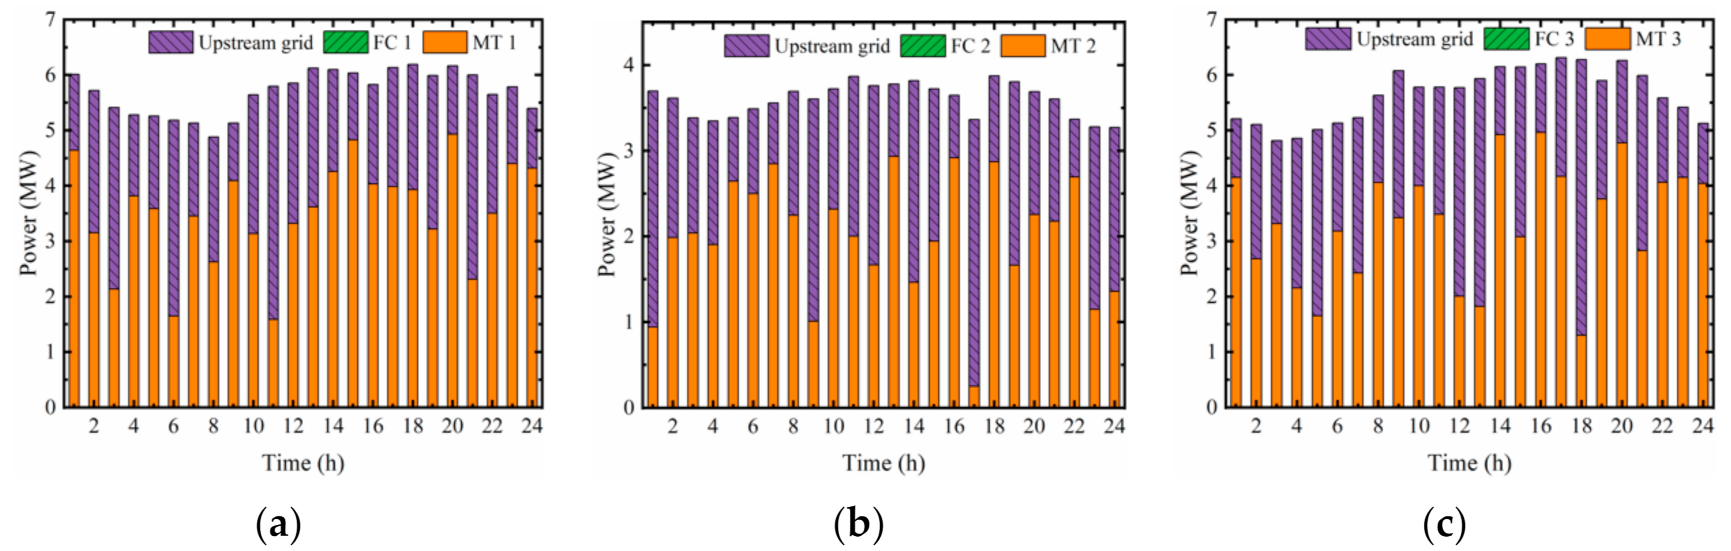
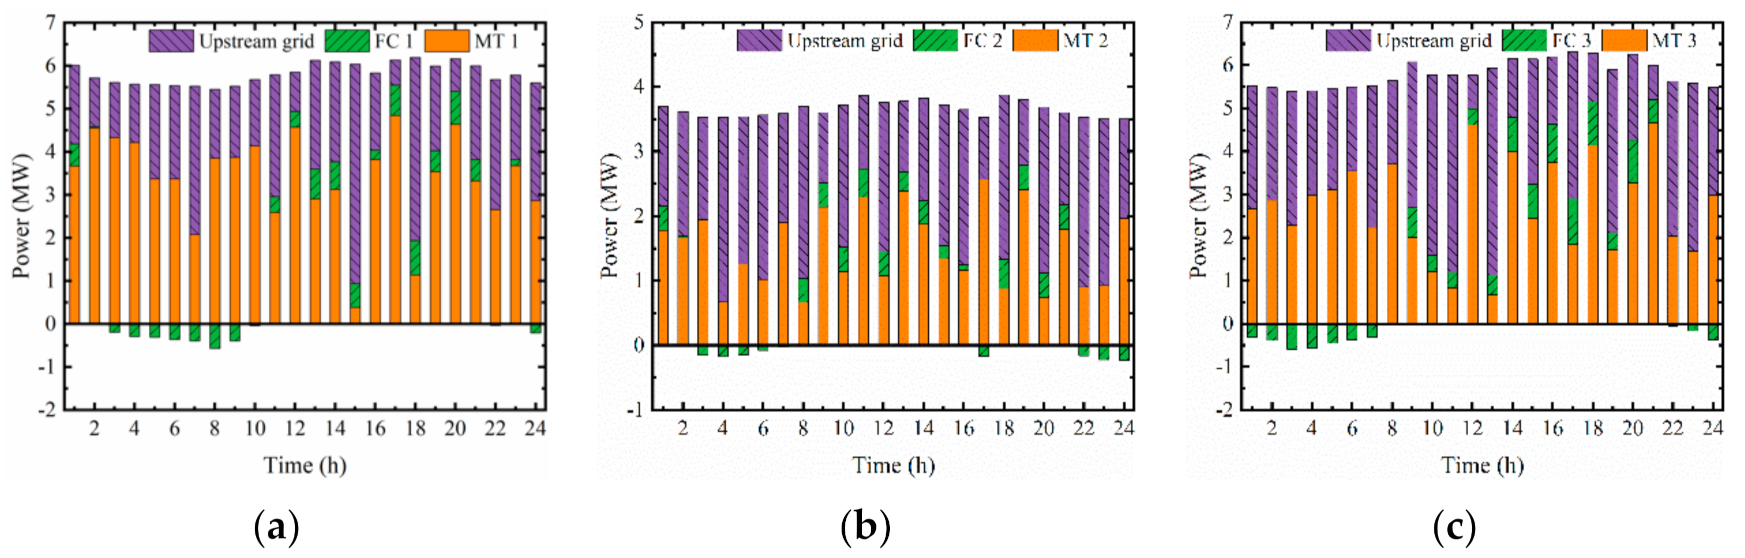
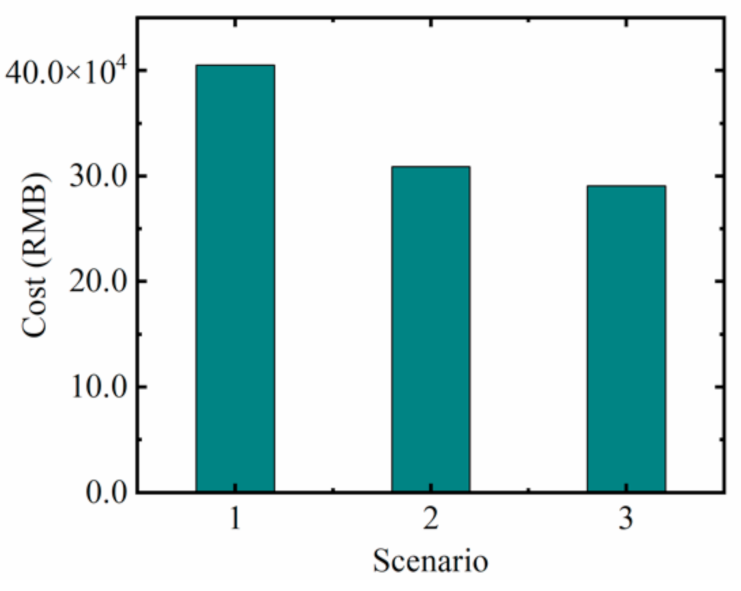
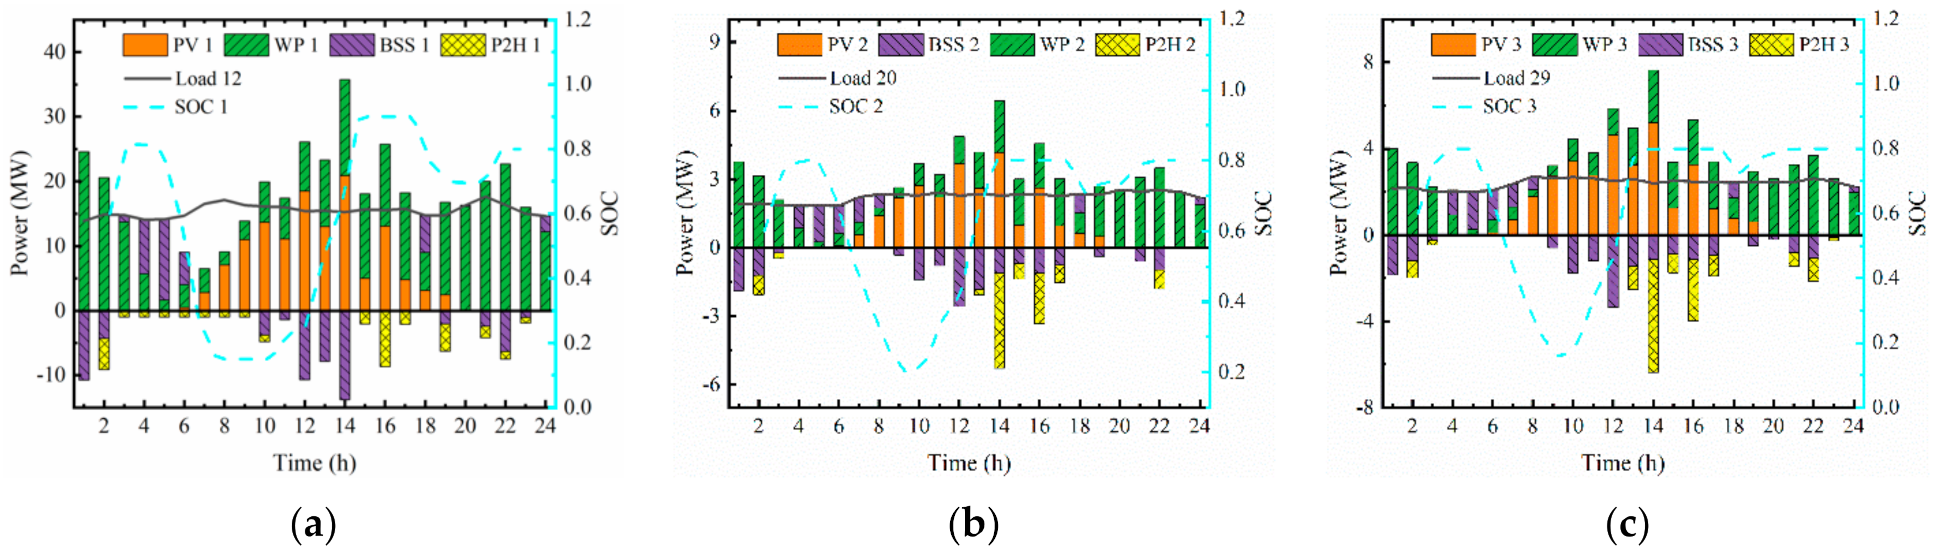
4.3. Operation Characteristics and Economic Analysis of IES in Different Scenarios

To illustrate the effectiveness and economics of the proposed EH model and IES framework, three operation scenarios of an IES according to the different operation states of the EHs were designed and analyzed:
Scenario 1: Only EH1 is operational, and the fuel cell in EH1 is operational.
Scenario 2: All three Ehs are operational, but the fuel cells in each EH are deactivated.
Scenario 3: All three Ehs are operational, and the fuel cells in each EH are also operational.
The remaining IES operation parameters were the same in the three scenarios.
Figure 9 shows the daily operation cost of the aforementioned scenarios. The daily operation cost of the IES in Scenario 1 was more than that of Scenario 3, which indicates that with more operational Ehs, the operation cost of the Ehs increased; however, this can be compensated for by selling the cooling and heat power produced by the Ecs, GBs, MTs, and FCs. The profits obtained from selling heat or cooling power are presented in Figure 10, which also shows the components of the sold energy. The daily operation cost of the IES in Scenario 2 was slightly larger than that of Scenario 3. This shows that due to the co-generation function of the FC, the profit of sold heat is further increased when the FC in each EH is operational.
Table 3 describes the load fluctuations of node 10, 16, and 26 in the three different scenarios. Comparing the data from Scenarios 2 and 3, it can be seen that the peak loads were reduced up to 10%, the load valleys were filled up by P2H, and the standard deviations of the loads were reduced up to 77% when the FC was operational. These changes reflect the effect of FC–HST cooperation in peak load shifting.
Figure 11 displays the electrical (PFC) and heat power (QFC) produced by the FC in each EH and the change of the hydrogen storage capacity of the corresponding HST in Scenario 3. As can be seen from Figure 11a, from 3:00 to 10:00 h, due to the light load and cheap electricity price, the IES purchases electricity from the upstream grid to supplement the hydrogen in the HST1 by electrolysis, which explains why PFC1 is negative during this period. At 11:00, both the load and the price of electricity increase. FC1 then uses the hydrogen supplied by the HST1 to generate heat and power, and the electric energy produced is used to smooth the load fluctuations and reduce the pressure on the power grid. The heat produced is then sold to the heat market to offset the operation cost of the system. At the end of the day, the hydrogen reserves in HST1 are slightly larger than those at the beginning of the day, which ensures the continuous supply of hydrogen. The situation in Figure 11b,c is similar to that in 11a.
Figure 12, Figure 13 and Figure 14 present the optimal schedules of the coupling nodes. Comparing the optimal schedule of identical coupling nodes in Scenarios 2 and 3, again the load fluctuations are reduced with operational FCs. Hence, the results show that the FC is capable of peak load shifting if it cooperates with the HST, and its operation cost can be offset by selling heat. Adding more Ehs into an IES not only strengthens the coupling between subsystems, but also improves the economics of IES operation. In addition, PCAPSO has good applicability in solving IES optimization scheduling problems in different scenarios.
The optimal energy structures of the nodes connected with sustainable energy in scenario 3 are displayed in Figure 15. As shown in Figure 15a, when the output of WP1 and PV1 exceeds the load demand, surplus electric energy is used to charge the BSS1 (e.g., 10:00–14:00 h). If the charging power or SOC reaches the upper limit during the charging process, the excess electric energy is transferred to the electrolytic cell of the FC for hydrogen production (e.g., 15:00–17:00 h). When the output of WP1 and PV1 is not enough to meet the load demand, the BSS compensates the power deficiency by discharging (e.g., 5:00–7:00 h). If the SOC of BSS is less than the minimum limit at this time, the additional load must be borne by the upstream grid (e.g., 8:00–10:00 h). At the end of the day, the SOC1 is slightly higher than that at the beginning of the day, which ensures the continuous supply of electric power from the BSS1. Given the above discussion, with the integration of the BSS and FC into the IES, the consumption rate of renewable energy increases and the amount of electricity drawn by the load from the upstream grid decreases, which reduces the operating cost of the IES.

5. Conclusions

Considering the detailed models of the FC and P2G system, this study developed a new framework of EH for the optimal day-ahead operation of IES. The IES model consisted of electrical and natural gas systems, presented in Section 4, and an EH, presented in Section 2. The day-ahead scheduling of the IES was carried out considering the nodal pressures, voltage constraints, and energy flow constraints of each sub-network. The objective function of the IES day-ahead scheduling was to minimize the daily operating cost of the IES. To solve the optimization problem, PCAPSO based on multistage chaotic mapping was proposed in this paper. The major contributions of this work are:
(1)
Developing a new efficient PCAPSO algorithm based on multistage chaotic mapping.
(2)
Integrating detailed models of FC and P2G into the EH to form a novel framework of the EH, in which the joint operation of the FC, P2G system, and HST is considered and hydrogen is introduced.
(3)
Establishing a new scheduling strategy to reduce the operation cost of IES. In this strategy, when the electric load is light, P2H and HST cooperate to absorb excess wind/solar energy and transform it into hydrogen, which can then be used as the starting material for the H2G process to synthesize natural gas. When the electric load is heavy, hydrogen transformed from the P2H process or stored in the HST can be used as the fuel in the FC to generate electricity.
Numerical tests were performed on an IES including the modified IEEE 30-bus and natural gas 48-bus systems. The key findings are as follows:
(1)
The PCAPSO based on piecewise-chaotic mapping is less likely to fall into local optima than PSO. In addition, the stability and convergence rate of PCAPSO are better than those of PSO.
(2)
The FC cooperating with the HST and P2H system is capable of peak load shifting when operated as a co-generation device, and its operation cost can be compensated by selling heat.
(3)
The integration of the BSS and FC into the IES can increase the consumption rate of renewable energy and decrease the amount of electricity drawn from the upstream grid.
(4)
The proposed EH, which contains the detailed model of the FC and P2G, is more in line with actual operations than the EH described in [3,12,20]. With the insertion of multiple EHs, the system coupling is enhanced, and the stability and economics of IES operation are improved.
Future work should include detailed modeling of the natural gas system considering the hydrodynamic properties of natural gas. In addition, the thermal network could be coupled with electrical and natural gas systems to improve the flexibility and diversity of IES operation. On the other hand, the introduction of a new optimization algorithm with a high computational efficiency and convergence rate may also be an important area of research in day-ahead optimal scheduling of IESs.

Author Contributions

All authors have cooperated in the preparation of this work. Conceptualization, J.C. and K.N.; methodology, J.C. and K.N.; software, K.N.; validation, K.N. and C.L.; formal analysis, K.N. and X.X.; writing—original draft preparation, K.N.; writing—review and editing, K.N., F.S. and Q.Z.; visualization, Q.Z. and C.L.; project administration, J.C. All authors have read and agreed to the published version of the manuscript.

Funding

This research did not receive any specific grant from funding agencies in the public, commercial, or not-for-profit sectors.

Data Availability Statement

Not applicable.

Conflicts of Interest

The authors declare no conflict of interest.

References

  1. Hoseinzadeh, S.; Ghasemi, M.H.; Heyns, S. Application of Hybrid Systems in Solution of Low Power Generation at Hot Seasons for Micro Hydro Systems. Renew. Energy 2020, 160, 323–332. [Google Scholar] [CrossRef]
  2. Tomin, N.; Shakirov, V.; Kozlov, A.; Sidorov, D.; Kurbatsky, V.; Rehtanz, C.; Lora, E.E.S. Design and Optimal Energy Management of Community Microgrids with Flexible Renewable Energy Sources. Renew. Energy 2022, 183, 903–921. [Google Scholar] [CrossRef]
  3. Sun, Y.; Zhang, B.; Ge, L.; Sidorov, D.; Wang, J.; Xu, Z. Day-Ahead Optimization Schedule for Gas-Electric Integrated Energy System Based on Second-Order Cone Programming. CSEE J. Power Energy Syst. 2020, 6, 142–151. [Google Scholar] [CrossRef]
  4. Ghasemi, A.; Banejad, M.; Rahimiyan, M. Integrated Energy Scheduling under Uncertainty in a Micro Energy Grid. Transm. Distrib. IET Gener. 2018, 12, 2887–2896. [Google Scholar] [CrossRef]
  5. Zhang, Y.; Wang, X.; He, J.; Xu, Y.; Pei, W. Optimization of Distributed Integrated Multi-Energy System Considering Industrial Process Based on Energy Hub. J. Mod. Power Syst. Clean Energy 2020, 8, 863–873. [Google Scholar] [CrossRef]
  6. Zhou, B.; Xu, D.; Li, C.; Chung, C.Y.; Cao, Y.; Chan, K.W.; Wu, Q. Optimal Scheduling of Biogas–Solar–Wind Renewable Portfolio for Multicarrier Energy Supplies. IEEE Trans. Power Syst. 2018, 33, 6229–6239. [Google Scholar] [CrossRef] [Green Version]
  7. Chen, C.; Liu, S.; Lin, Z.; Yang, L.; Wu, X.; Qiu, W.; Gao, Q.; Zhu, T.; Xing, F.; Zhang, J. Optimal Coordinative Operation Strategy of the Electric–Thermal–Gas Integrated Energy System Considering CSP Plant. IET Energy Syst. Integr. 2020, 2, 187–195. [Google Scholar] [CrossRef]
  8. Xu, D.; Zhou, B.; Wu, Q.; Chung, C.Y.; Li, C.; Huang, S.; Chen, S. Integrated Modelling and Enhanced Utilization of Power-to-Ammonia for High Renewable Penetrated Multi-Energy Systems. IEEE Trans. Power Syst. 2020, 35, 4769–4780. [Google Scholar] [CrossRef]
  9. Li, P.; Sheng, W.; Duan, Q.; Li, Z.; Zhu, C.; Zhang, X. A Lyapunov Optimization-Based Energy Management Strategy for Energy Hub With Energy Router. IEEE Trans. Smart Grid 2020, 11, 4860–4870. [Google Scholar] [CrossRef]
  10. Ju, L.; Zhao, R.; Tan, Q.; Lu, Y.; Tan, Q.; Wang, W. A Multi-Objective Robust Scheduling Model and Solution Algorithm for a Novel Virtual Power Plant Connected with Power-to-Gas and Gas Storage Tank Considering Uncertainty and Demand Response. Appl. Energy 2019, 250, 1336–1355. [Google Scholar] [CrossRef]
  11. Geng, S.; Vrakopoulou, M.; Hiskens, I.A. Optimal Capacity Design and Operation of Energy Hub Systems. Proc. IEEE 2020, 108, 1475–1495. [Google Scholar] [CrossRef]
  12. Shao, C.; Wang, X.; Shahidehpour, M.; Wang, X.; Wang, B. An MILP-Based Optimal Power Flow in Multicarrier Energy Systems. IEEE Trans. Sustain. Energy 2017, 8, 239–248. [Google Scholar] [CrossRef]
  13. Li, C.; Yang, H.; Shahidehpour, M.; Xu, Z.; Zhou, B.; Cao, Y.; Zeng, L. Optimal Planning of Islanded Integrated Energy System With Solar-Biogas Energy Supply. IEEE Trans. Sustain. Energy 2020, 11, 2437–2448. [Google Scholar] [CrossRef]
  14. Yang, W.; Liu, W.; Chung, C.Y.; Wen, F. Coordinated Planning Strategy for Integrated Energy Systems in a District Energy Sector. IEEE Trans. Sustain. Energy 2020, 11, 1807–1819. [Google Scholar] [CrossRef]
  15. Wang, C.; Wei, W.; Wang, J.; Bai, L.; Liang, Y.; Bi, T. Convex Optimization Based Distributed Optimal Gas-Power Flow Calculation. IEEE Trans. Sustain. Energy 2018, 9, 1145–1156. [Google Scholar] [CrossRef]
  16. Wang, Y.; Wang, Y.; Huang, Y.; Yu, H.; Du, R.; Zhang, F.; Zhang, F.; Zhu, J. Optimal Scheduling of the Regional Integrated Energy System Considering Economy and Environment. IEEE Trans. Sustain. Energy 2019, 10, 1939–1949. [Google Scholar] [CrossRef]
  17. Eladl, A.A.; El-Afifi, M.I.; Saeed, M.A.; El-Saadawi, M.M. Optimal Operation of Energy Hubs Integrated with Renewable Energy Sources and Storage Devices Considering CO2 Emissions. Int. J. Electr. Power Energy Syst. 2020, 117, 105719. [Google Scholar] [CrossRef]
  18. Chen, Y.; Wang, Y.; Ma, J. Multi-Objective Optimal Energy Management for the Integrated Electrical and Natural Gas Network with Combined Cooling, Heat and Power Plants. Energies 2018, 11, 734. [Google Scholar] [CrossRef] [Green Version]
  19. Keihan Asl, D.; Seifi, A.R.; Rastegar, M.; Mohammadi, M. Optimal Energy Flow in Integrated Energy Distribution Systems Considering Unbalanced Operation of Power Distribution Systems. Int. J. Electr. Power Energy Syst. 2020, 121, 106132. [Google Scholar] [CrossRef]
  20. Shabanpour-Haghighi, A.; Seifi, A.R. Energy Flow Optimization in Multicarrier Systems. IEEE Trans. Ind. Inf. 2015, 11, 1067–1077. [Google Scholar] [CrossRef]
  21. Massrur, H.R.; Niknam, T.; Fotuhi-Firuzabad, M. Day-Ahead Energy Management Framework for a Networked Gas–Heat–Electricity Microgrid. Transm. Distrib. IET Gener. 2019, 13, 4617–4629. [Google Scholar] [CrossRef]
  22. Tan, Y.; Wang, X.; Zheng, Y. A New Modeling and Solution Method for Optimal Energy Flow in Electricity-gas Integrated Energy System. Int. J. Energy Res. 2019, 43, 4322–4343. [Google Scholar] [CrossRef]
  23. Eberhart, R.; Kennedy, J. A New Optimizer Using Particle Swarm Theory. In Proceedings of the Sixth International Symposium on Micro Machine and Human Science, Nagoya, Japan, 4–6 October 1995; pp. 39–43. [Google Scholar]
  24. Wang, D.; Tan, D.; Liu, L. Particle Swarm Optimization Algorithm: An Overview. Soft Comput. 2018, 22, 387–408. [Google Scholar] [CrossRef]
  25. Liu, H.; Zhang, X.-W.; Tu, L.-P. A Modified Particle Swarm Optimization Using Adaptive Strategy. Expert Syst. Appl. 2020, 152, 113353. [Google Scholar] [CrossRef]
  26. Patwal, R.S.; Narang, N. Multi-Objective Generation Scheduling of Integrated Energy System Using Fuzzy Based Surrogate Worth Trade-off Approach. Renew. Energy 2020, 156, 864–882. [Google Scholar] [CrossRef]
  27. Mellouk, L.; Ghazi, M.; Aaroud, A.; Boulmalf, M.; Benhaddou, D.; Zine-Dine, K. Design and Energy Management Optimization for Hybrid Renewable Energy System- Case Study: Laayoune Region. Renew. Energy 2019, 139, 621–634. [Google Scholar] [CrossRef]
  28. Bao, Z.; Chen, D.; Wu, L.; Guo, X. Optimal Inter- and Intra-Hour Scheduling of Islanded Integrated-Energy System Considering Linepack of Gas Pipelines. Energy 2019, 171, 326–340. [Google Scholar] [CrossRef]
  29. Zou, Y.; Yang, G.; Zheng, H.; Yi, J.; Hu, R. Dispatching for Integrated Energy System Based on Improved Niche PSO Algorithm. Proc. CSU-EPSA 2020, 32, 47–52,60. [Google Scholar]
  30. Liu, X.; Wang, Q.; Wu, C. A Stackelberg Game Approach for Heterogeneous Energy Market in Integrated Energy System. Int. J. Energy Res. 2021, 45, 1038–1054. [Google Scholar] [CrossRef]
  31. Mirzaei, M.A.; Oskouei, M.Z.; Mohammadi-Ivatloo, B.; Loni, A.; Zare, K.; Marzband, M.; Shafiee, M. Integrated Energy Hub System Based on Power-to-Gas and Compressed Air Energy Storage Technologies in the Presence of Multiple Shiftable Loads. Transm. Distrib. IET Gener. 2020, 14, 2510–2519. [Google Scholar] [CrossRef]
  32. Chang, H.; Xu, X.; Shen, J.; Shu, S.; Tu, Z. Performance Analysis of a Micro-Combined Heating and Power System with PEM Fuel Cell as a Prime Mover for a Typical Household in North China. Int. J. Hydrogen Energy 2019, 44, 24965–24976. [Google Scholar] [CrossRef]
  33. Sui, Q.; Ma, X.; Wei, F.; Lin, X.; Guo, X.; Sun, J.; Li, Z. Day-ahead Dispatching Optimization Strategy for Energy Network Considering Fuel Cell Thermal-electric Comprehensive Utilization. Proc. Chin. Soc. Electr. Eng. 2019, 39, 1603–1613. [Google Scholar]
  34. Al-Baghdadi, M. Modelling of Proton Exchange Membrane Fuel Cell Performance Based on Semi-Empirical Equations. Renew. Energy 2005, 30, 1587–1599. [Google Scholar] [CrossRef]
  35. Chen, J.; Yu, Q.; Li, Q.; Lin, Z.; Li, C. Probabilistic Energy Flow Analysis of MCE System Considering Various Coupling Units and the Uncertainty of Distribution Generators. IEEE Access 2019, 7, 100394–100405. [Google Scholar] [CrossRef]
  36. Hoseinzadeh, S.; Stephan Heyns, P. Advanced Energy, Exergy, and Environmental (3E) Analyses and Optimization of a Coal-Fired 400 MW Thermal Power Plant. J. Energy Resour. Technol. 2021, 143, 082106. [Google Scholar] [CrossRef]
  37. Dou, C.; Mi, X.; Ma, K.; Xu, S. Coordinated Operation of Multi-Energy Microgrid with Flexible Load. J. Renew. Sustain. Energy 2019, 11, 054101. [Google Scholar] [CrossRef]
  38. Hussain, S.; Ahmed, M.A.; Kim, Y.-C. Efficient Power Management Algorithm Based on Fuzzy Logic Inference for Electric Vehicles Parking Lot. IEEE Access 2019, 7, 65467–65485. [Google Scholar] [CrossRef]
  39. Hussain, S.; Ahmed, M.A.; Lee, K.-B.; Kim, Y.-C. Fuzzy Logic Weight Based Charging Scheme for Optimal Distribution of Charging Power among Electric Vehicles in a Parking Lot. Energies 2020, 13, 3119. [Google Scholar] [CrossRef]
  40. Hussain, S.; Lee, K.-B.; Ahmed, M.A.; Hayes, B.; Kim, Y.-C. Two-Stage Fuzzy Logic Inference Algorithm for Maximizing the Quality of Performance under the Operational Constraints of Power Grid in Electric Vehicle Parking Lots. Energies 2020, 13, 4634. [Google Scholar] [CrossRef]
Figure 1. Structure of proposed EH.
Energies 15 00690 g001
Figure 2. Flowchart of PCAPSO.
Energies 15 00690 g002
Figure 3. Topology of the electrical system.
Energies 15 00690 g003
Figure 4. Topology of the natural gas system.
Energies 15 00690 g004
Figure 5. Coupling relationship of IES.
Energies 15 00690 g005
Figure 6. Daily output curves of WP and PV.
Energies 15 00690 g006
Figure 7. Daily fluctuation curves of loads: (a) node 12, (b) node 16, (c) node 10 and node 26, and (d) node 20 and node 29.
Energies 15 00690 g007
Figure 8. Iteration curves with different optimization algorithms.
Energies 15 00690 g008
Figure 9. Operation cost of the IES in different scenarios.
Energies 15 00690 g009
Figure 10. Profit from selling heat/cooling power in the different scenarios.
Energies 15 00690 g010
Figure 11. Output power of FCs and states of HSTs in Scenario 3: (a) FC1 and state of HST1, (b) FC2 and state of HST2, and (c) FC3 and state of HST3.
Energies 15 00690 g011
Figure 12. Optimal schedule of the coupling node (node 26) in scenario 1.
Energies 15 00690 g012
Figure 13. Optimal schedules of the coupling nodes in scenario 2: (a) node 26, (b) node 16, and (c) node 10.
Energies 15 00690 g013
Figure 14. Optimal schedules of the coupling nodes in scenario 3: (a) node 26, (b) node 16, and (c) node 10.
Energies 15 00690 g014
Figure 15. Optimal energy structures of nodes connected with sustainable energy in scenario 3: (a) node 12, (b) node 20, and (c) node 29.
Energies 15 00690 g015
Table 1. Time-of-use prices for the IES.
Price TypePeak Price/¥Normal Price/¥Valley Price/¥
Coefficient
Electrical systema(t)0.0450.03750.03
b(t)2.11.751.4
Natural gas systemCcom(t)0.240.20.16
Table 2. Comparison of optimal results with different optimization algorithms.
Calculation LabelNo.1/×103No.2/×103No.3/×103Average/×103Standard Deviation/×103
Algorithm
PCAPSO89.5989.5288.9689.360.24
PSO90.6792.1491.5691.460.52
Table 3. Load fluctuation of the IES in different scenarios.
Node 10Node 16Node 26
Peak Load/MWValley Load/MWStandard Deviation/MWPeak Load/MWValley Load/MWStandard Deviation/MWPeak Load/MWValley Load/MWStandard Deviation/MW
Scenario 16.314.810.483.883.280.195.685.390.09
Scenario 26.314.810.483.883.280.196.194.880.38
Scenario 35.655.240.113.593.230.115.685.390.09
Publisher’s Note: MDPI stays neutral with regard to jurisdictional claims in published maps and institutional affiliations.

