Article

Multimodal Carbonates: Distribution of Oil Saturation in the Microporous Regions of Arab Formations

The Ali I. Al-Naimi Petroleum Engineering Research Center, King Abdullah University of Science and Technology, Thuwal 23955-6900, Saudi Arabia
*
Author to whom correspondence should be addressed.
Energies 2022, 15(3), 1243; https://doi.org/10.3390/en15031243
Submission received: 3 January 2022 / Revised: 23 January 2022 / Accepted: 25 January 2022 / Published: 8 February 2022
(This article belongs to the Topic Enhanced Oil Recovery Technologies)

Abstract

:
Perhaps as much as 50% of the oil-in-place in carbonate formations around the world is locked away in the easy to bypass microporosity. If some of this oil is unlocked by the improved recovery processes focused on tight carbonate formations, the world may gain a major source of lower-rate power over several decades. Here, we overview the Arab D formation in the largest oil field on earth, the Ghawar. We investigate the occurrence of microporosity of different origins and sizes using scanning electron microscopy (SEM) and pore casting techniques. Then, we present a robust calculation of the probability of invasion and oil saturation distribution in the nested micropores using mercury injection capillary pressure data available in the literature. We show that large portions of the micropores in Arab D formation would have been bypassed during primary drainage unless the invading crude oil ganglia were sufficiently long. We also show that, under prevailing conditions of primary drainage of the strongly water-wet Arab formations in the Ghawar, the microporosity there was invaded and the porosity-weighted initial oil saturations of 60–85% are expected. Considering the asphaltenic nature of crude oil in the Ghawar, we expect the invaded portions of the pores to turn mixed-wet, thus becoming inaccessible to waterflooding until further measures are taken to modify the system’s surface chemistry and/or create substantial local pore pressure gradients.

1. Introduction

Viable improved oil recovery (IOR) from a microporous carbonate formation can be successful only with the thorough understanding of pore architecture (geometry, topology, and other petrophysical characteristics), oil distribution after primary drainage, and wettability changes. For example, if oil did not displace a majority of brine in the small pores, a microporous carbonate formation may not be an IOR target. Applications of our approach to fractured carbonate and sandstone formations, shales, coal seams, and to determination of remaining oil saturation abound, see e.g., [1,2,3,4,5,6,7].
There are no isotropic, homogeneous carbonate reservoirs made of one rock type. Gravity and countercurrent water imbibition drive oil production from the large blocks of fractured, permeable macroporous carbonates. However, the occluded microporous micritic carbonates [8] (solidified and diagenetically altered muds) remain largely inaccessible to waterflooding, especially when the crude oil is asphaltenic and rock mixed-wet. Worldwide, about 60% of remaining oil is locked in carbonates, and 7 of the 10 largest oil fields have carbonate reservoirs [9,10]. Most of the world’s largest carbonate oilfields are located in the Middle East, Russia, Kazakhstan, and the Americas. In particular, the carbonate mudrocks and limestones in the Permian Basin [11,12,13], Bakken [14,15], and Eagle Ford [16] in the U.S. hold giant amounts of oil. Most carbonate fields are mature and in need of improved/enhanced oil recovery by fluid injection [17,18,19,20,21].
Here, we focus on the Ghawar Field [22] in the Jubaila Arab D limestone formations, simply because it has been investigated in great detail over the last 60–70 years and many measurements of rock and fluid properties are publicly available. The oil in place in the Ghawar is likely to exceed 250 billion barrels ([22] supported by our calculations), making it 10× the Prudhoe Bay, the largest oil field in North America. Microporosity occurs throughout Arab Formation carbonate reservoirs of Saudi Arabia and elsewhere, and it affects the fluid flow properties and ultimate recovery of hydrocarbons. Examination of Arab D samples indicates that microporosity occurs as four major types: (1) microporous grains, (2) microporous matrix, (3) microporous fibrous to bladed cement, and (4) microporous equant cements [23]. Even in the best reservoir quality rocks, 25% to 50% of the total pore volume of the sample occurs as microporosity. Cantrell and Hagerty, and Clerke et al. [24] established that there are three unique sets of micropores in the Arab D carbonates, termed “porositons” These pore sets are nested:
P 3 P 2 P 1 M
Equation (1) reads: The lowest permeability micropore regions, termed P 3 , reside inside the more permeable ones, termed P 2 , which in turn are occluded in the most permeable micropore regions, termed P 1 . Since the porositons are nested from the most to the least permeable one (and are in a series), the shapes of the rescaled mercury injection capillary pressures should not be too far from the actual water drainage capillary pressures. Examples of the typical oil/water capillary pressures in P 1 P 3 are shown in Figure 1. The microporous porositon P 1 is in turn occluded in the high-permeability, well-connected and fractured macroporosity, termed P M . Not all reservoir rock layers have all three micropore porositons: some have none, just P M , some have only P 1 in P M , and others P 2 in P 1 in P M , or P 3 in P 2 in P 1 in P M .

1.1. Petrophysical Properties of Multimodal Carbonates in the Ghawar

The most thorough summary of the pore systems, facies, and reservoir properties in the Ghawar core samples can be found in [24], and for background, we refer the readers to this paper and the references therein. The petrophysical carbonate database in Appendix A3 of Clerke et al.’s paper consists of 480 samples from two different data sets.
The first set includes 125 samples with mercury injection capillary pressures (MICP) compiled by Hagerty and Cantrell (1990, unpublished report). The MICP results in this set reveal one, two, or three nested pore systems, each characterized by a unique Thomeer hyperbola, see [25,26]. In addition, 35% of the samples require a single hyperbola, 62% two hyperbolas, and 3% three hyperbolas.
The second Rosetta Stone data set comes from 10 cored wells in an NS-transect along the spine of the Ghawar. All of the 3500 core plugs from these wells were cataloged with the facies of [27]. Later, seven to nine samples from each of up to six facies per well were selected at random to give a uniform density of 90 samples per facies. MICP experiments and [25,26] hyperbola fits were performed on these samples, and the resulting data were combined with the 125 samples in the first data set yielding 480 unique samples published in Appendix A3 of [24]. The Thomeer hyperbola fits of three random samples described by one, two, or three micropore systems inside macroporosity are shown in Figure 1.

1.2. The Depositional Environment

A bird’s eye view of the Ghawar and its oil and brine was given in the 1959 AAPG Bulletin paper by the Arabian Oil Company Staff [28]. Ghawar oil was found in the shallow-water carbonate deposits of the upper Jubaila and lower Arab formations in the Upper Jurassic. It is confined above by an anhydrite layer. Most production comes from calcarenites, where a lot of the original pore space is preserved. Fine-grained limestone, dolomitic limestone, calcarenitic limestone, and dolomite are among the other rock types that make up the reservoir. The accumulated oil has a maximum vertical column of around 1300 feet and is conservatively estimated to cover 875 square miles in area. The oil is undersaturated, with saturation pressures decreasing and oil–water contact rising to the south.
The depositional structure was augmented by the inevitable near-vertical fractures created after burial. Therefore, there were multiple high-permeability pathways (fractures, macroporosity layers, and vertical burrow channels) that delivered tall oil ganglia to the inter-dispersed micropore occlusions. If the buoyancy force was sufficient for the oil ganglia to overcome the capillary entry pressure to the microporous grains, the initial pore-filling brine was drained, and these grains were saturated with oil to the extent that it is quantified later using the petrophysical description published in Appendix A3 in Clerke et al. [24]. Figure 2 shows SEM images of the etched epoxy pore cast of an Arab-D sample, illustrating the shape of each microporosity type [29,30].

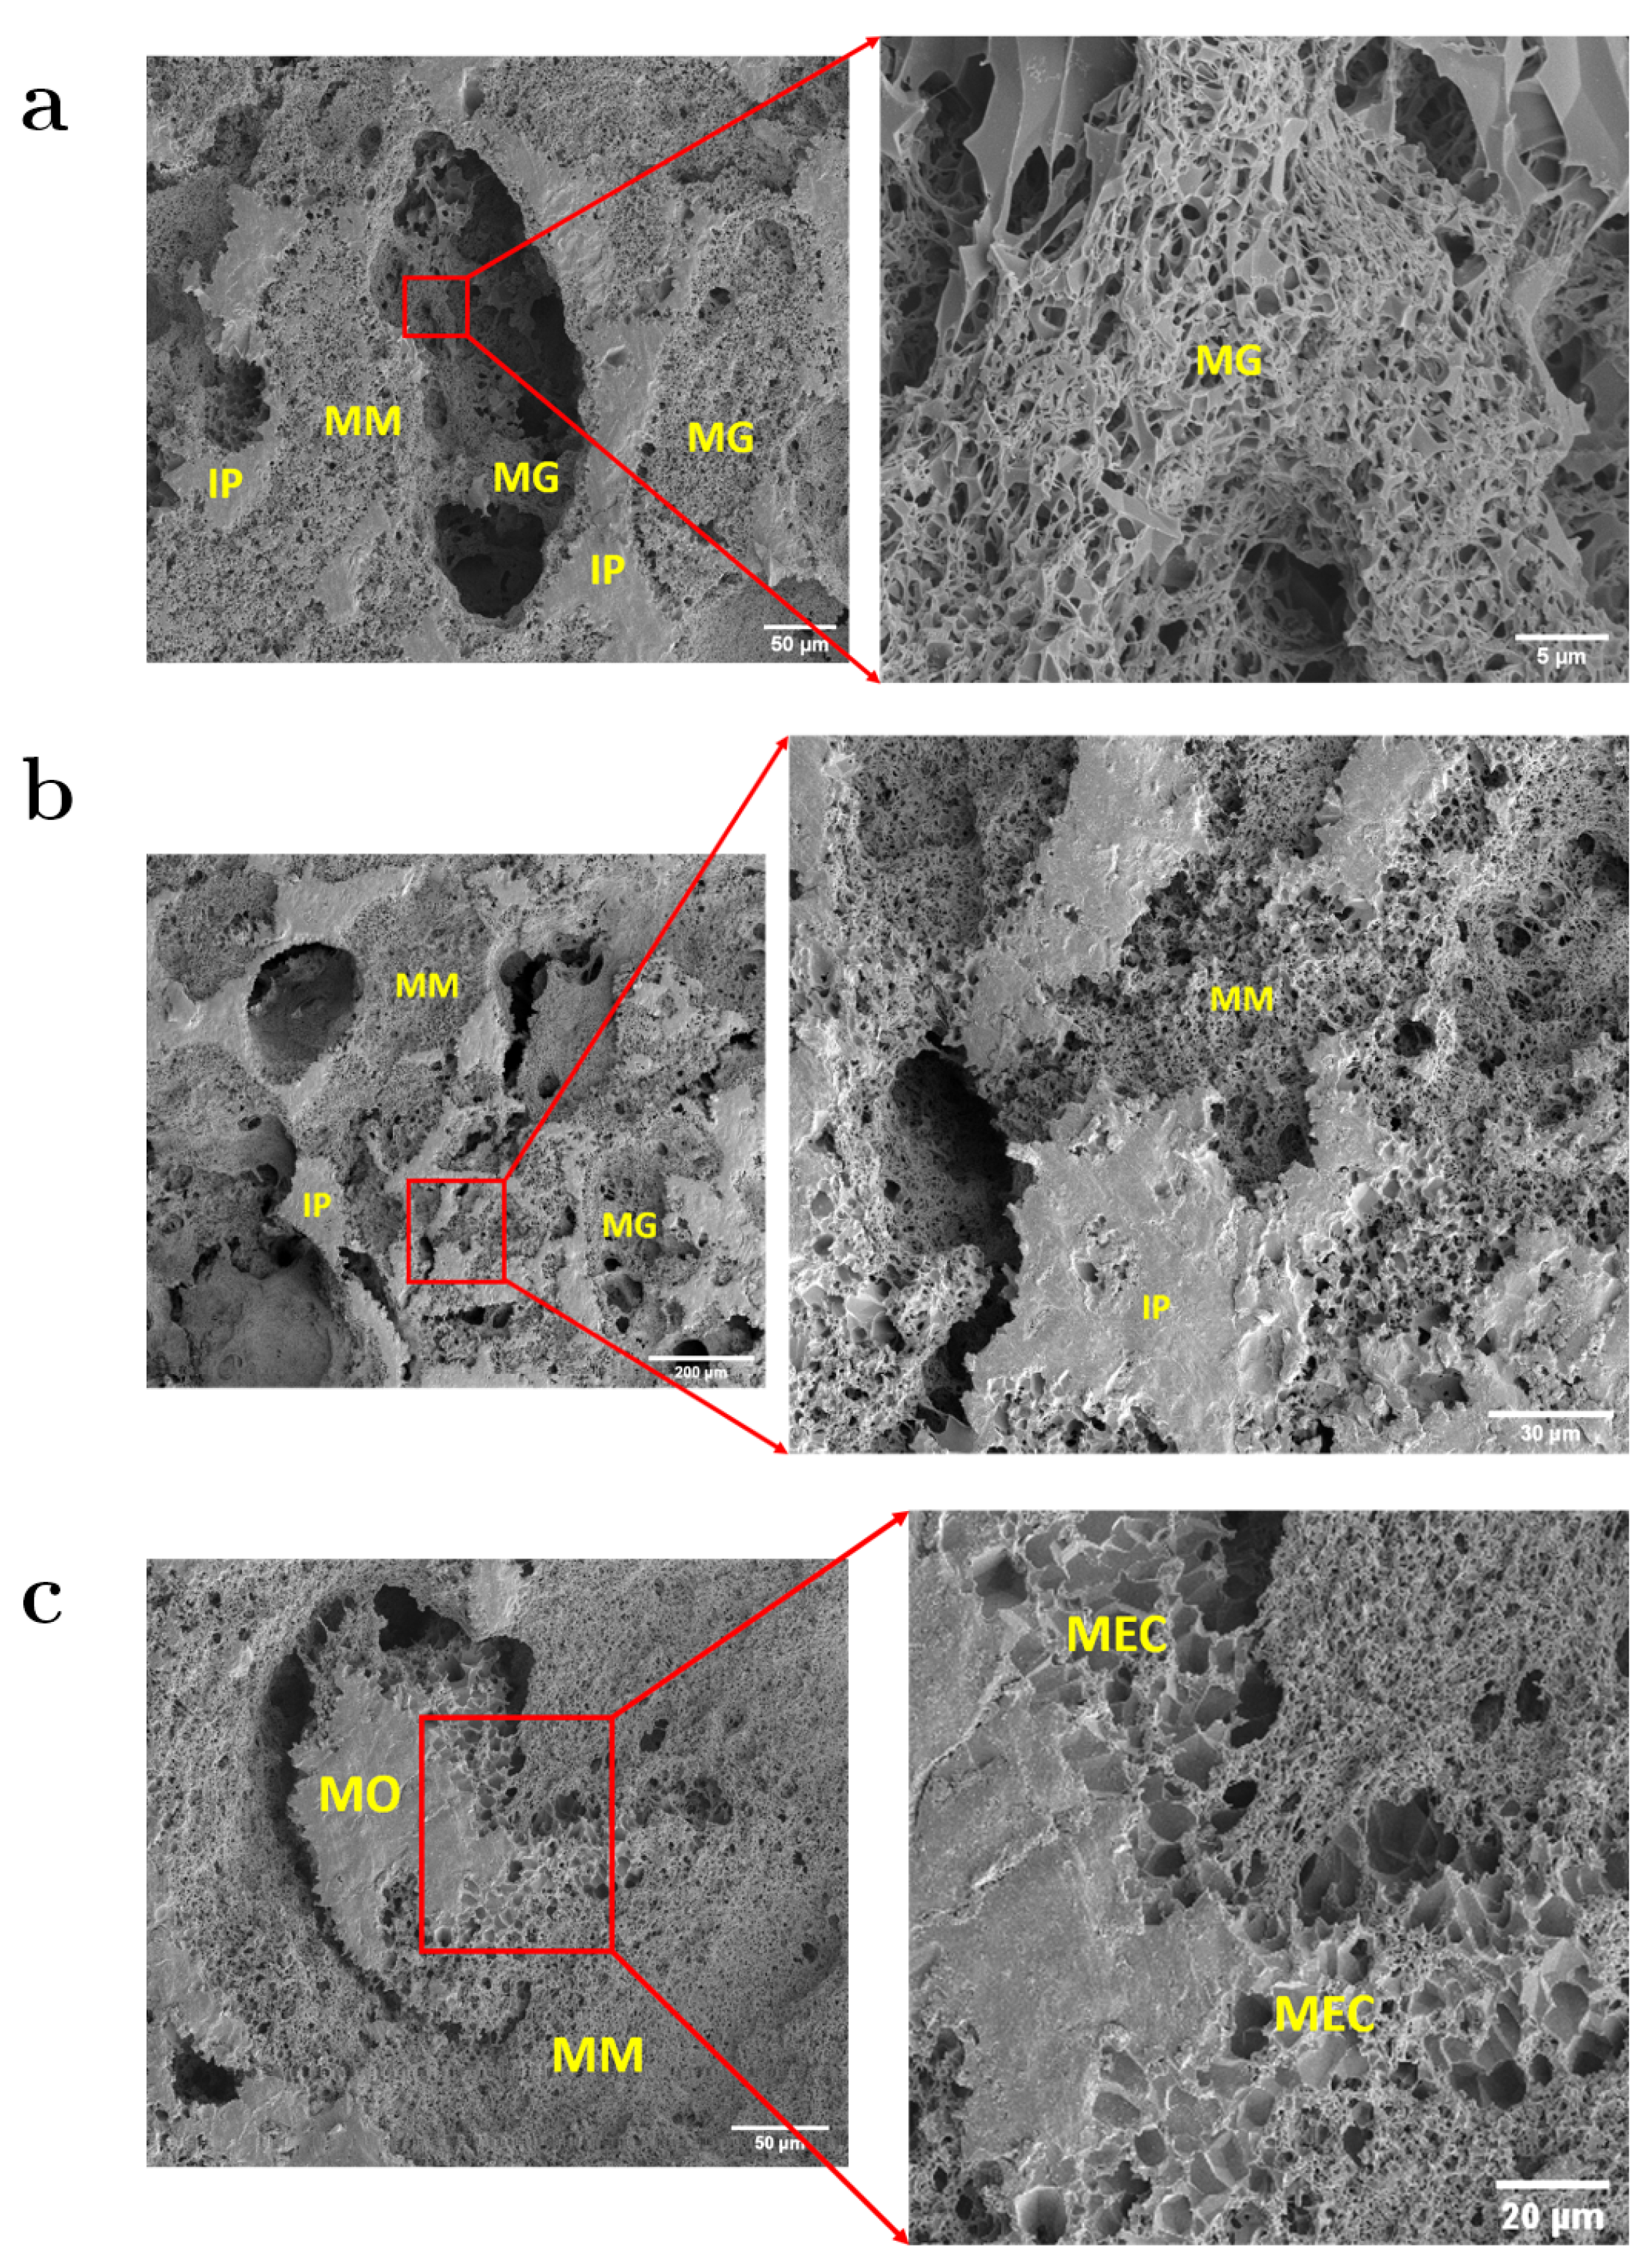
1.3. Classification of Macro- and Microporosity in the Carbonate Samples

Clerke et al. [24] adopted the microporosity definition by Cantrell and Hagerty [23], in which the carbonate microporosity consists of all pores that are approximately 10 microns in diameter or smaller. This purely empirical definition states that microporosity is the difference between total measured porosity and the porosity observed in the microscopic examination of thin sections. The optical resolution limit of most petrographic microscopes is ∼10 microns. Thus, microporosity includes all pores less than 10 microns in diameter. MICP analysis of the Arab D carbonates reveals micropores that are as small as 0.01 microns in diameter. None of these micropores can be resolved with a standard petrographic microscope. We have to keep this engineering definition in mind when we compare contributions from different authors around the world.
There are several key observations in favor of the multimodal porosity and permeability carbonates in the Ghawar saturating with oil to a high degree:
(1)
The “connate” water saturation measured in a Hessler cell subjected to high-speed centrifugation to mimic the 700–1300 ft tall oil columns in the Arab D reservoirs ranges from 2.8% to 35%, with a majority of the saturations in the teens and twenties of porosity units, [31]. In the present day Ghawar, the oil column is 200–240 ft thick in the Upper Jubaila-Arab-D carbonates below the C-D anhydrite, [28].
(2)
The initial oil fill-up of the Arab D carbonates created oil columns in the macroporous rock. These columns could be several hundred feet in thickness ( z o ) and could generate the buoyancy force (capillary pressure), ( ρ w ρ o ) g z o that with time would drain the initially bypassed, water-filled microporous regions nested inside the oil-filled macroporosity.
(3)
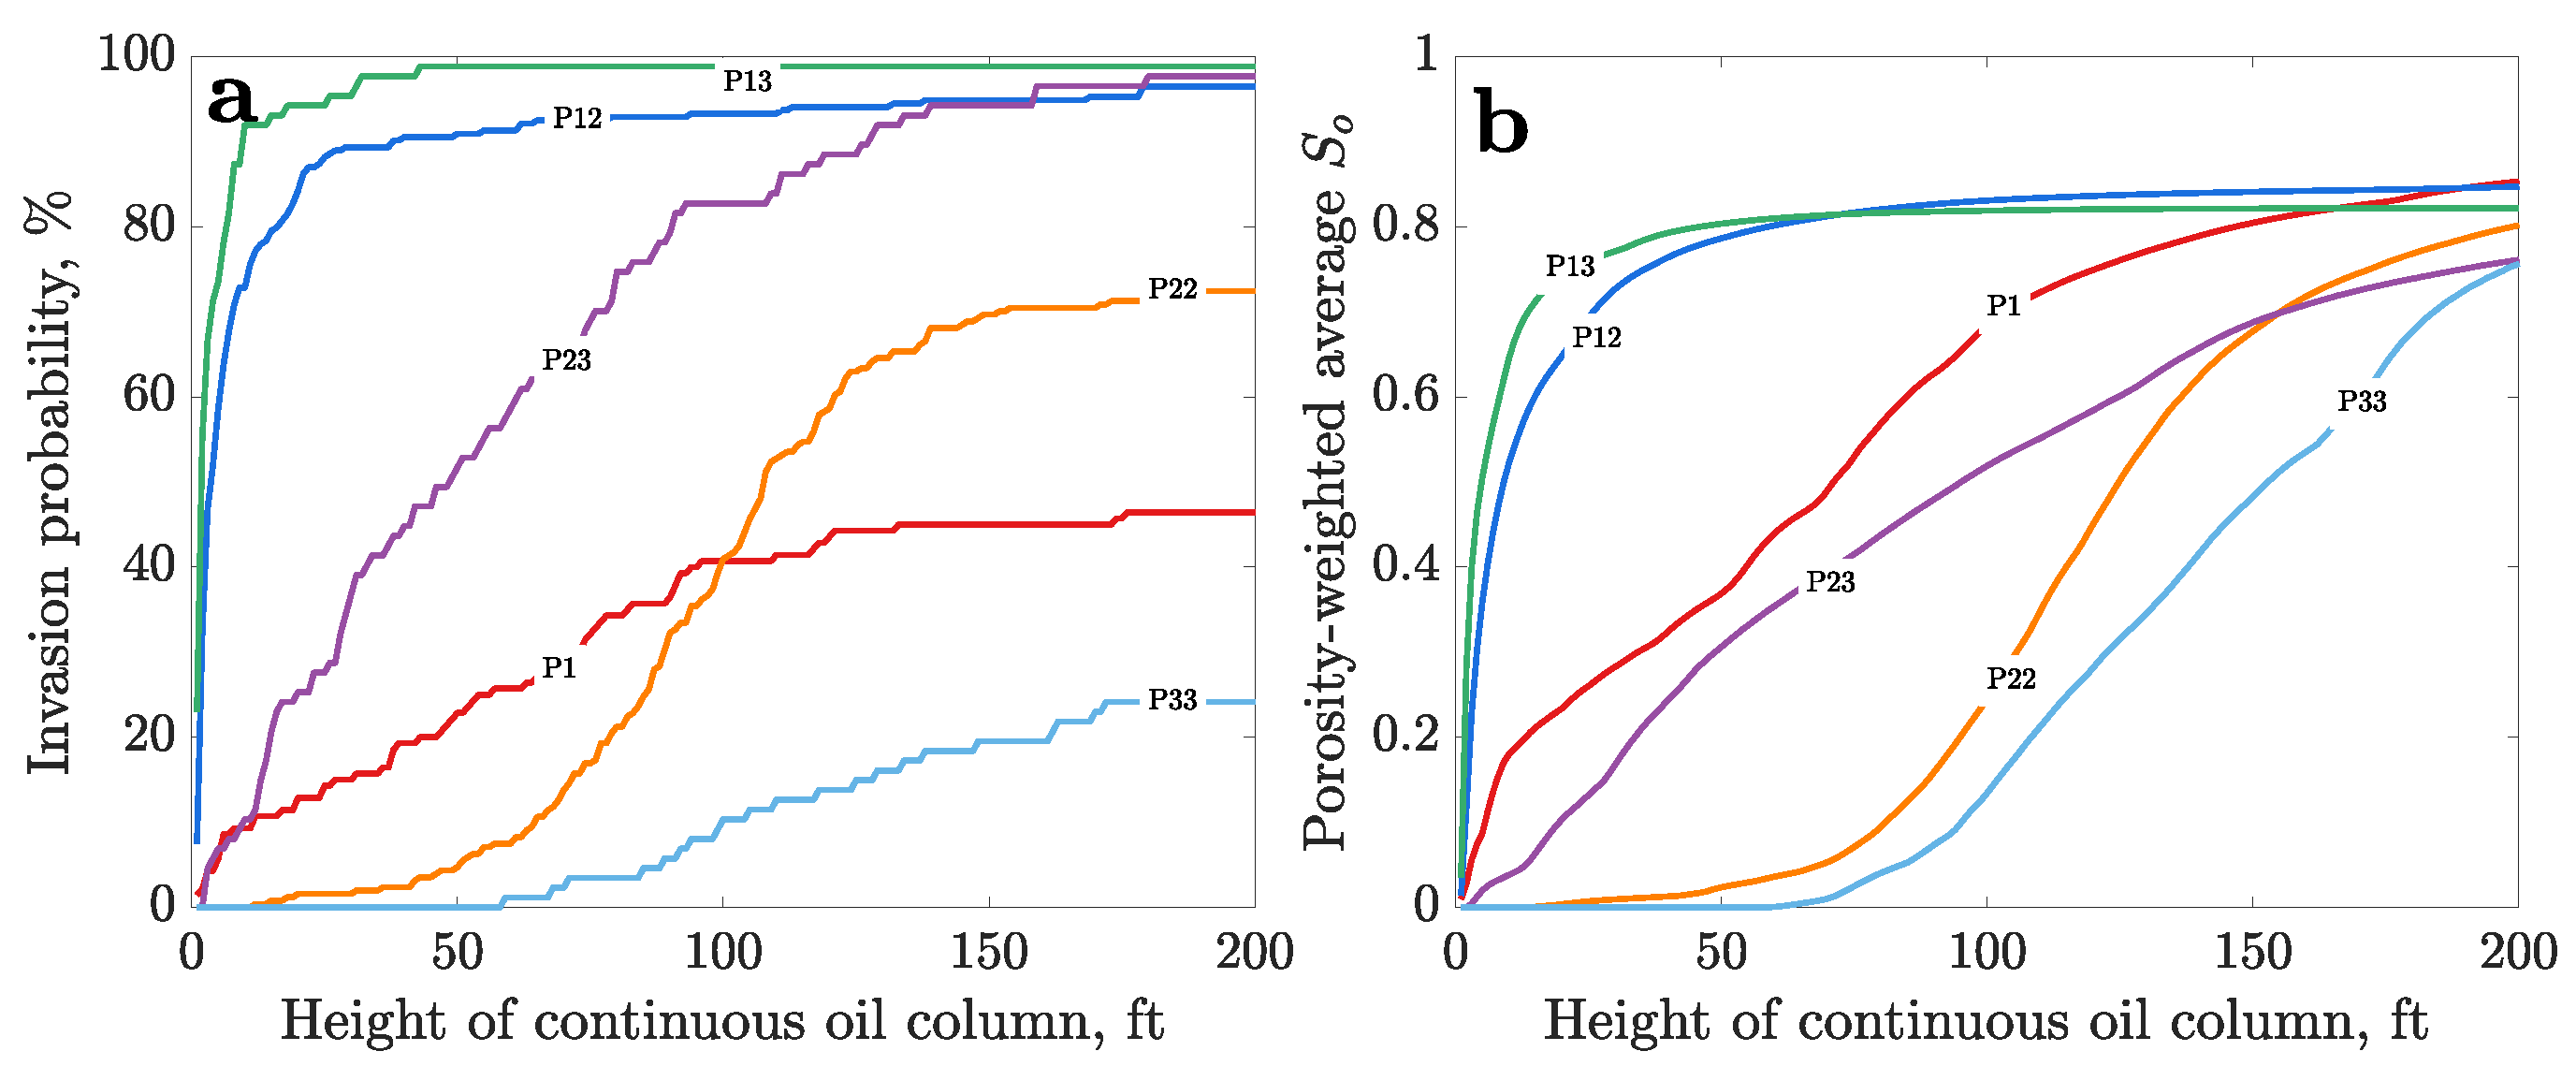
As we show here, the oil ganglia 10–100 ft tall, flowing up by buoyancy, would create enough of the capillary pressure to invade some of the occluded microporous regions they were slowly passing by.
(4)
The oil–water capillary pressure would be highest at the top of the oil column, and the multimodal carbonates there be most fully drained of water. This is good news for the continuing or new oil recovery schemes in the Ghawar, which must be custom-designed to produce most of the oil in the microporous rock regions [17,18,19,20,21,32,33].
In this paper, we start by assuming a couple of plausible scenarios of filling up the microporous parts of the Ghawar with oil. We then investigate how the different ways of filling up the reservoir result in more or less efficient drainage of water-filled micropores by the invading oil.

2. Methods

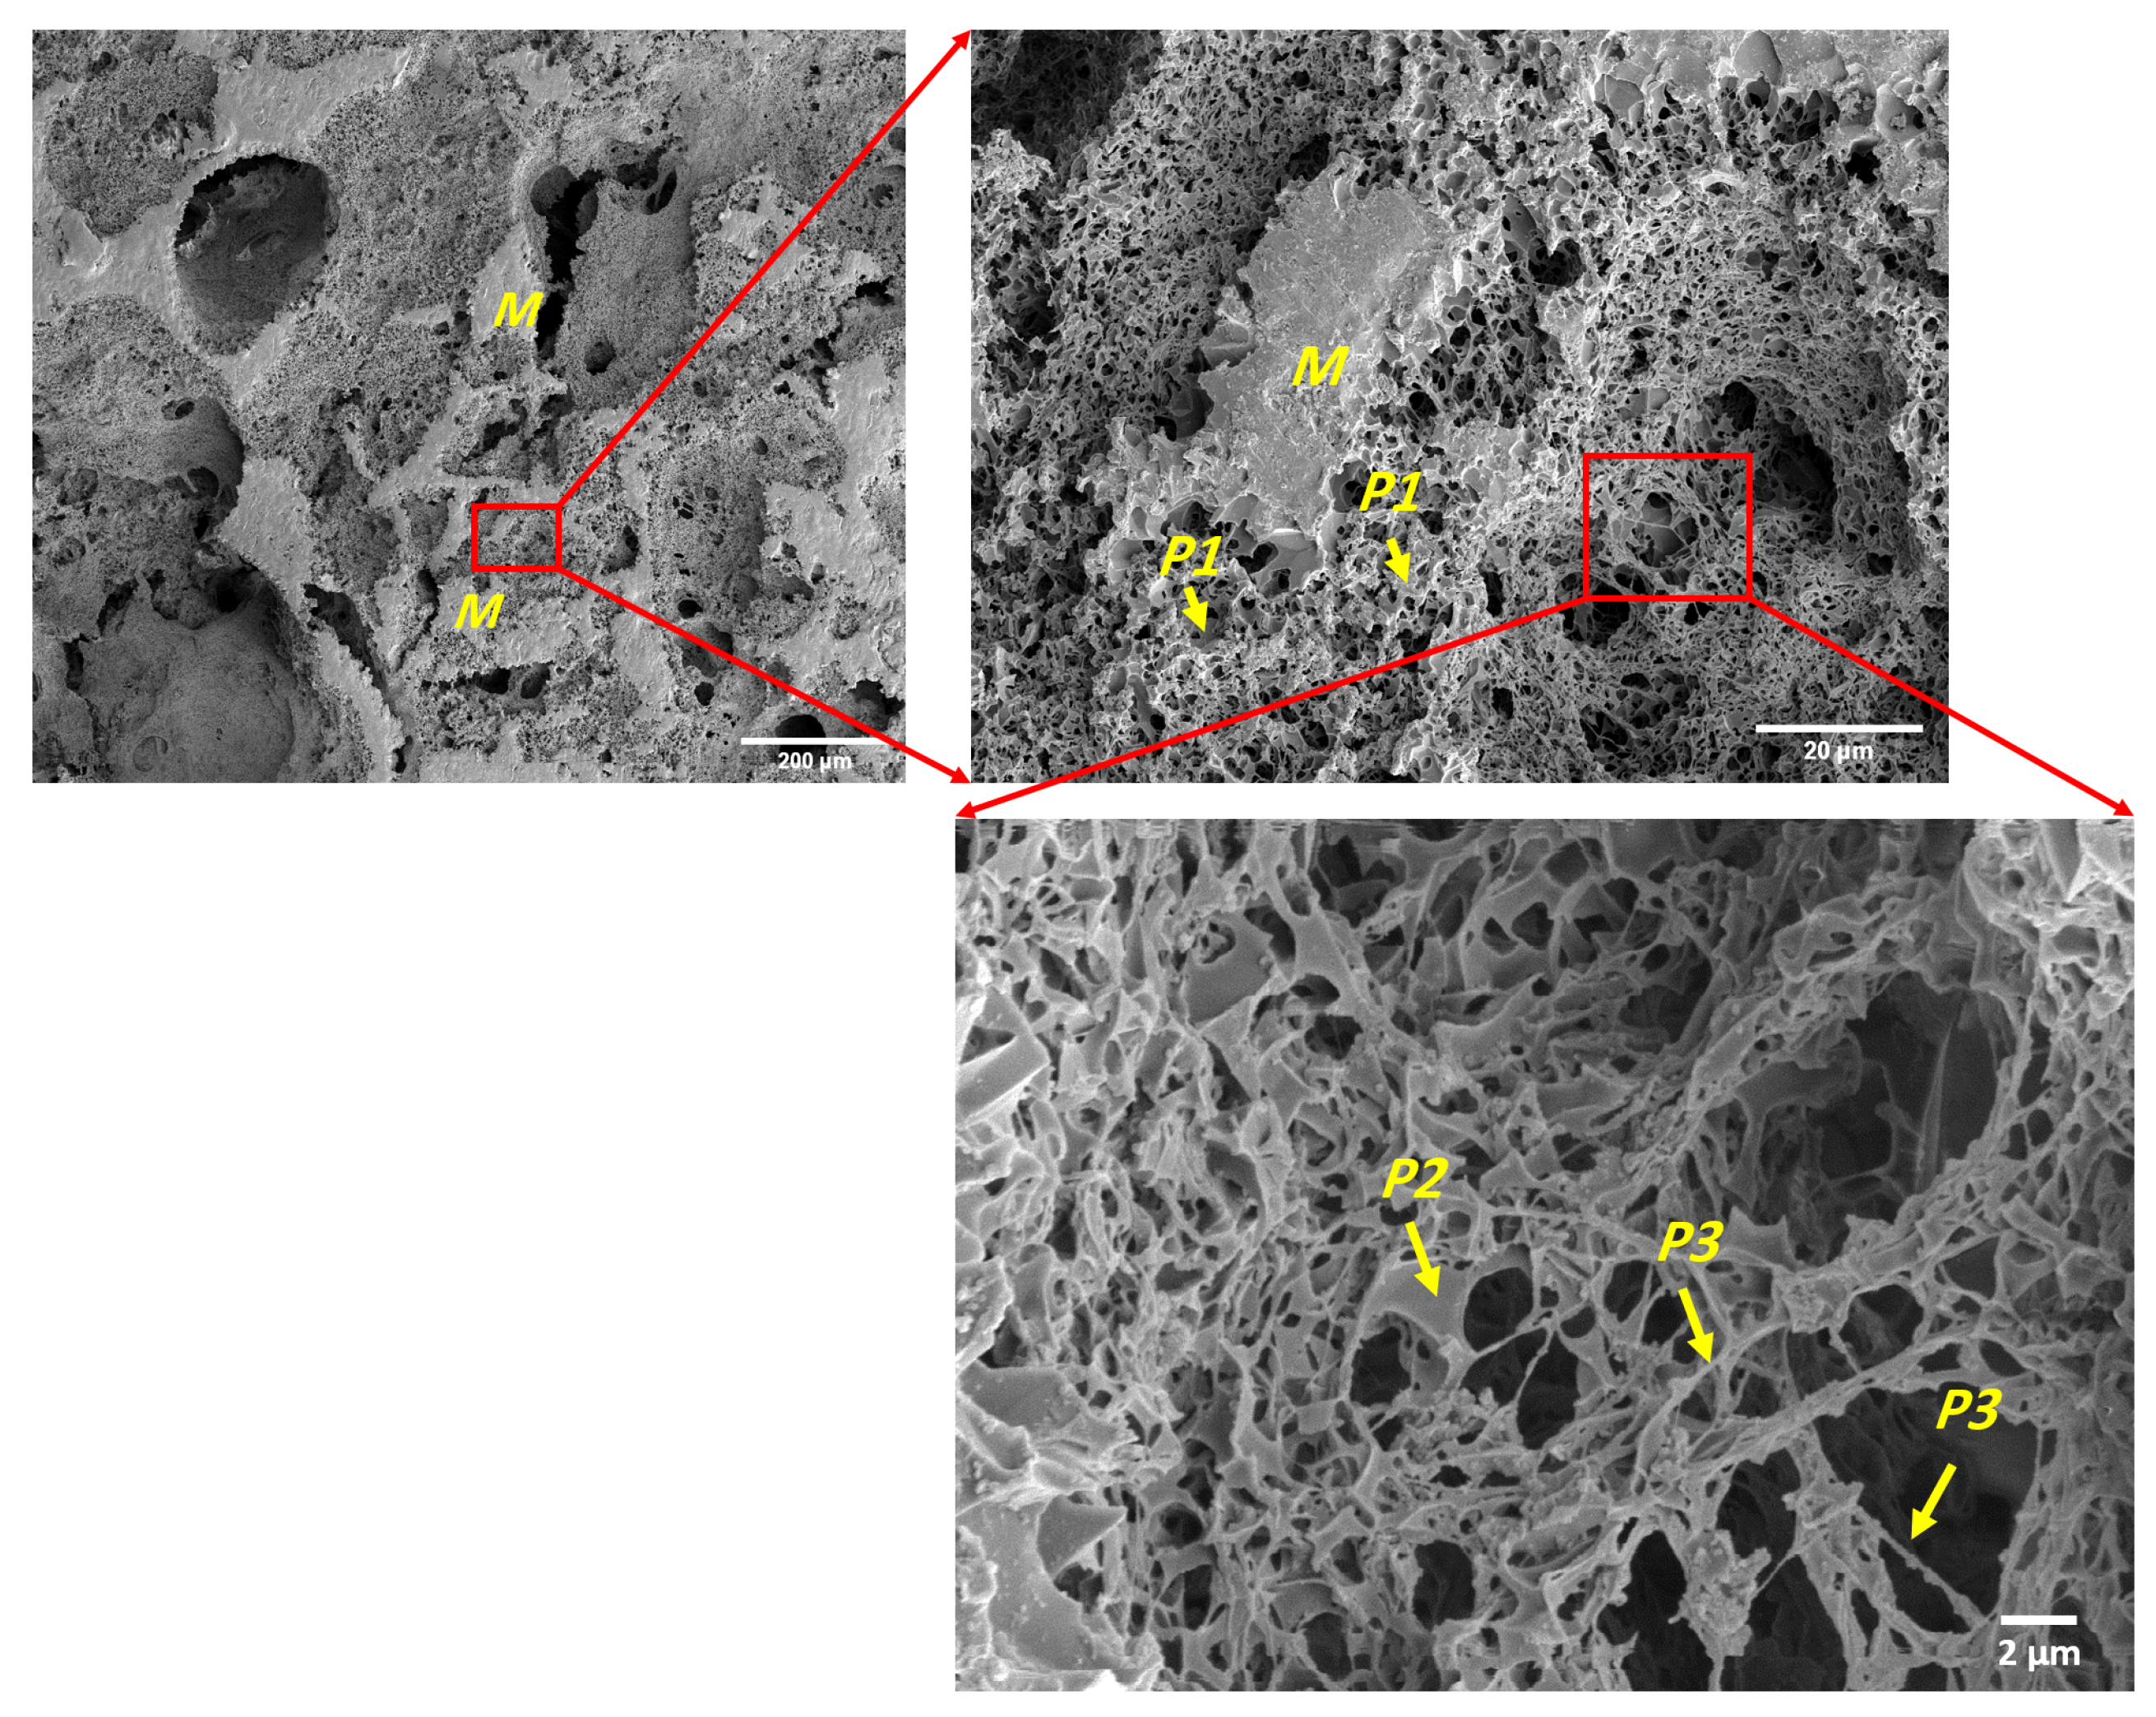
2.1. SEM Imaging of Pore Casts

We used high-resolution SEM images of carbonates pore casts of Arab-D samples to identify microporosity types summarized in Table 1 [29,30]. The rock samples were impregnated by epoxy in two stages: vacuum impregnation in a desiccator, followed by high-pressure (up to 1000 psi) impregnation. After the epoxy cures, the epoxy pore casts were acid etched with 0.25 M HCl at room temperature for 2 h. Afterwards, the acid was gently discarded from the samples and replaced with DI water. In order to remove traces of HCl, the water was replaced several times over the course of 6 h. After rinsing with water, the samples were rinsed with ethyl alcohol and dried in air at room temperature. The high-resolution 2D images of the etched pore casts were captured using an FEI Nova Nano Scanning Electron Microscope. The samples were sputter-coated with a ∼5 nm-thick platinum/palladium layer to reduce charge effects. For all images acquired in this study, the SEM was operated in secondary electron mode at 3–4 kV and with spot size of 2.5.

2.2. The Lognormal and Generalized Extreme Value (GEV) Distributions

A lognormal probability distribution generates a random variable whose logarithm is normally distributed. Here, we will use normal distributions to fit the logarithms of pore throat sizes of the three major classes of microporosity in carbonates.
In a log-normal distribution of a random variable X > 0 that has outcomes { x } , μ is the mean or location parameter, and σ is the standard deviation or scale parameter, respectively, of ln x :
pdf ( x ; μ , σ ) = f ( x ; μ , σ ) = 1 x 1 2 π σ 2 exp ln x μ 2 2 σ 2
where pdf = f is the probability density function.
The Generalized Extreme Value (GEV) distribution models the distributions of minima or maxima of blocks of data. In this work, we apply GEV statistics to model the distribution of pore throats in carbonate macroporosity, simply because the lognormal distribution fails to capture the logarithm’s right fat tail.
In a generalized extreme value distribution of a random variable X that has outcomes { x } , μ R is the location parameter, σ > 0 the scale parameter, and ξ R (often denoted by k) is the shape parameter. Always,
1 + ξ ( x μ ) / σ > 0
The probability density function is
f ( x ; μ , σ , ξ ) = 1 σ 1 + ξ x μ σ ( 1 / ξ ) 1 × exp 1 + ξ x μ σ 1 / ξ

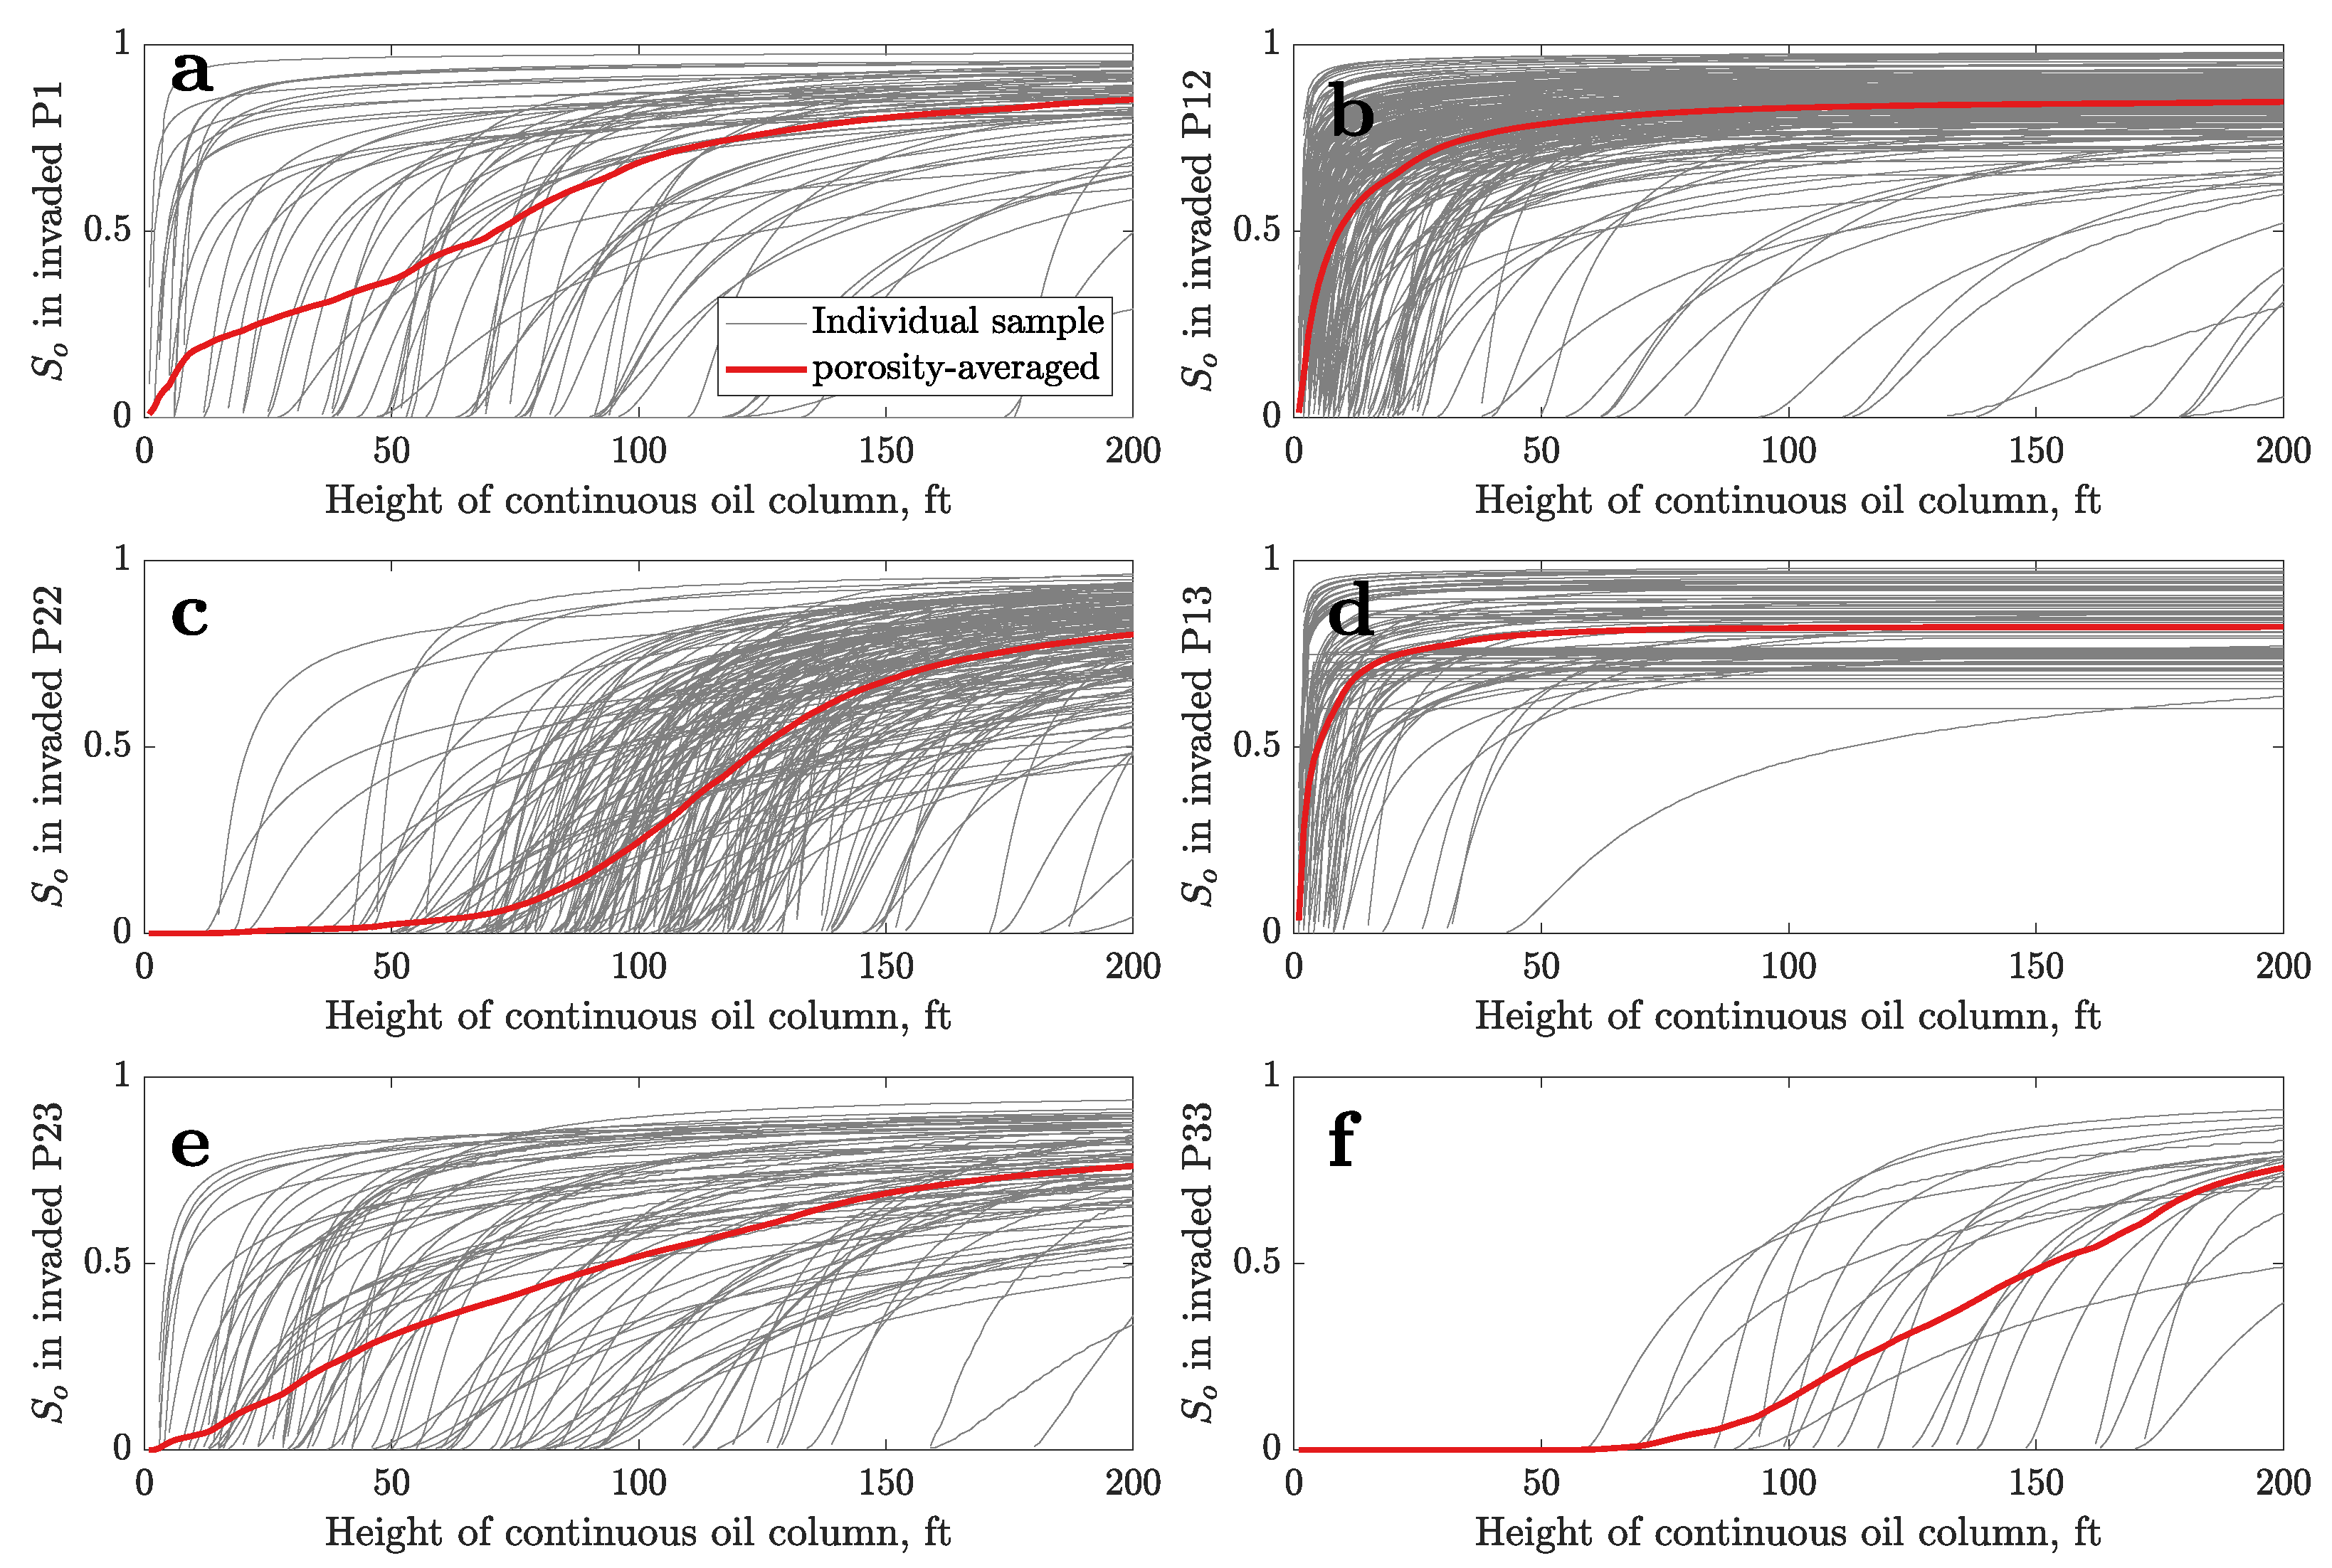
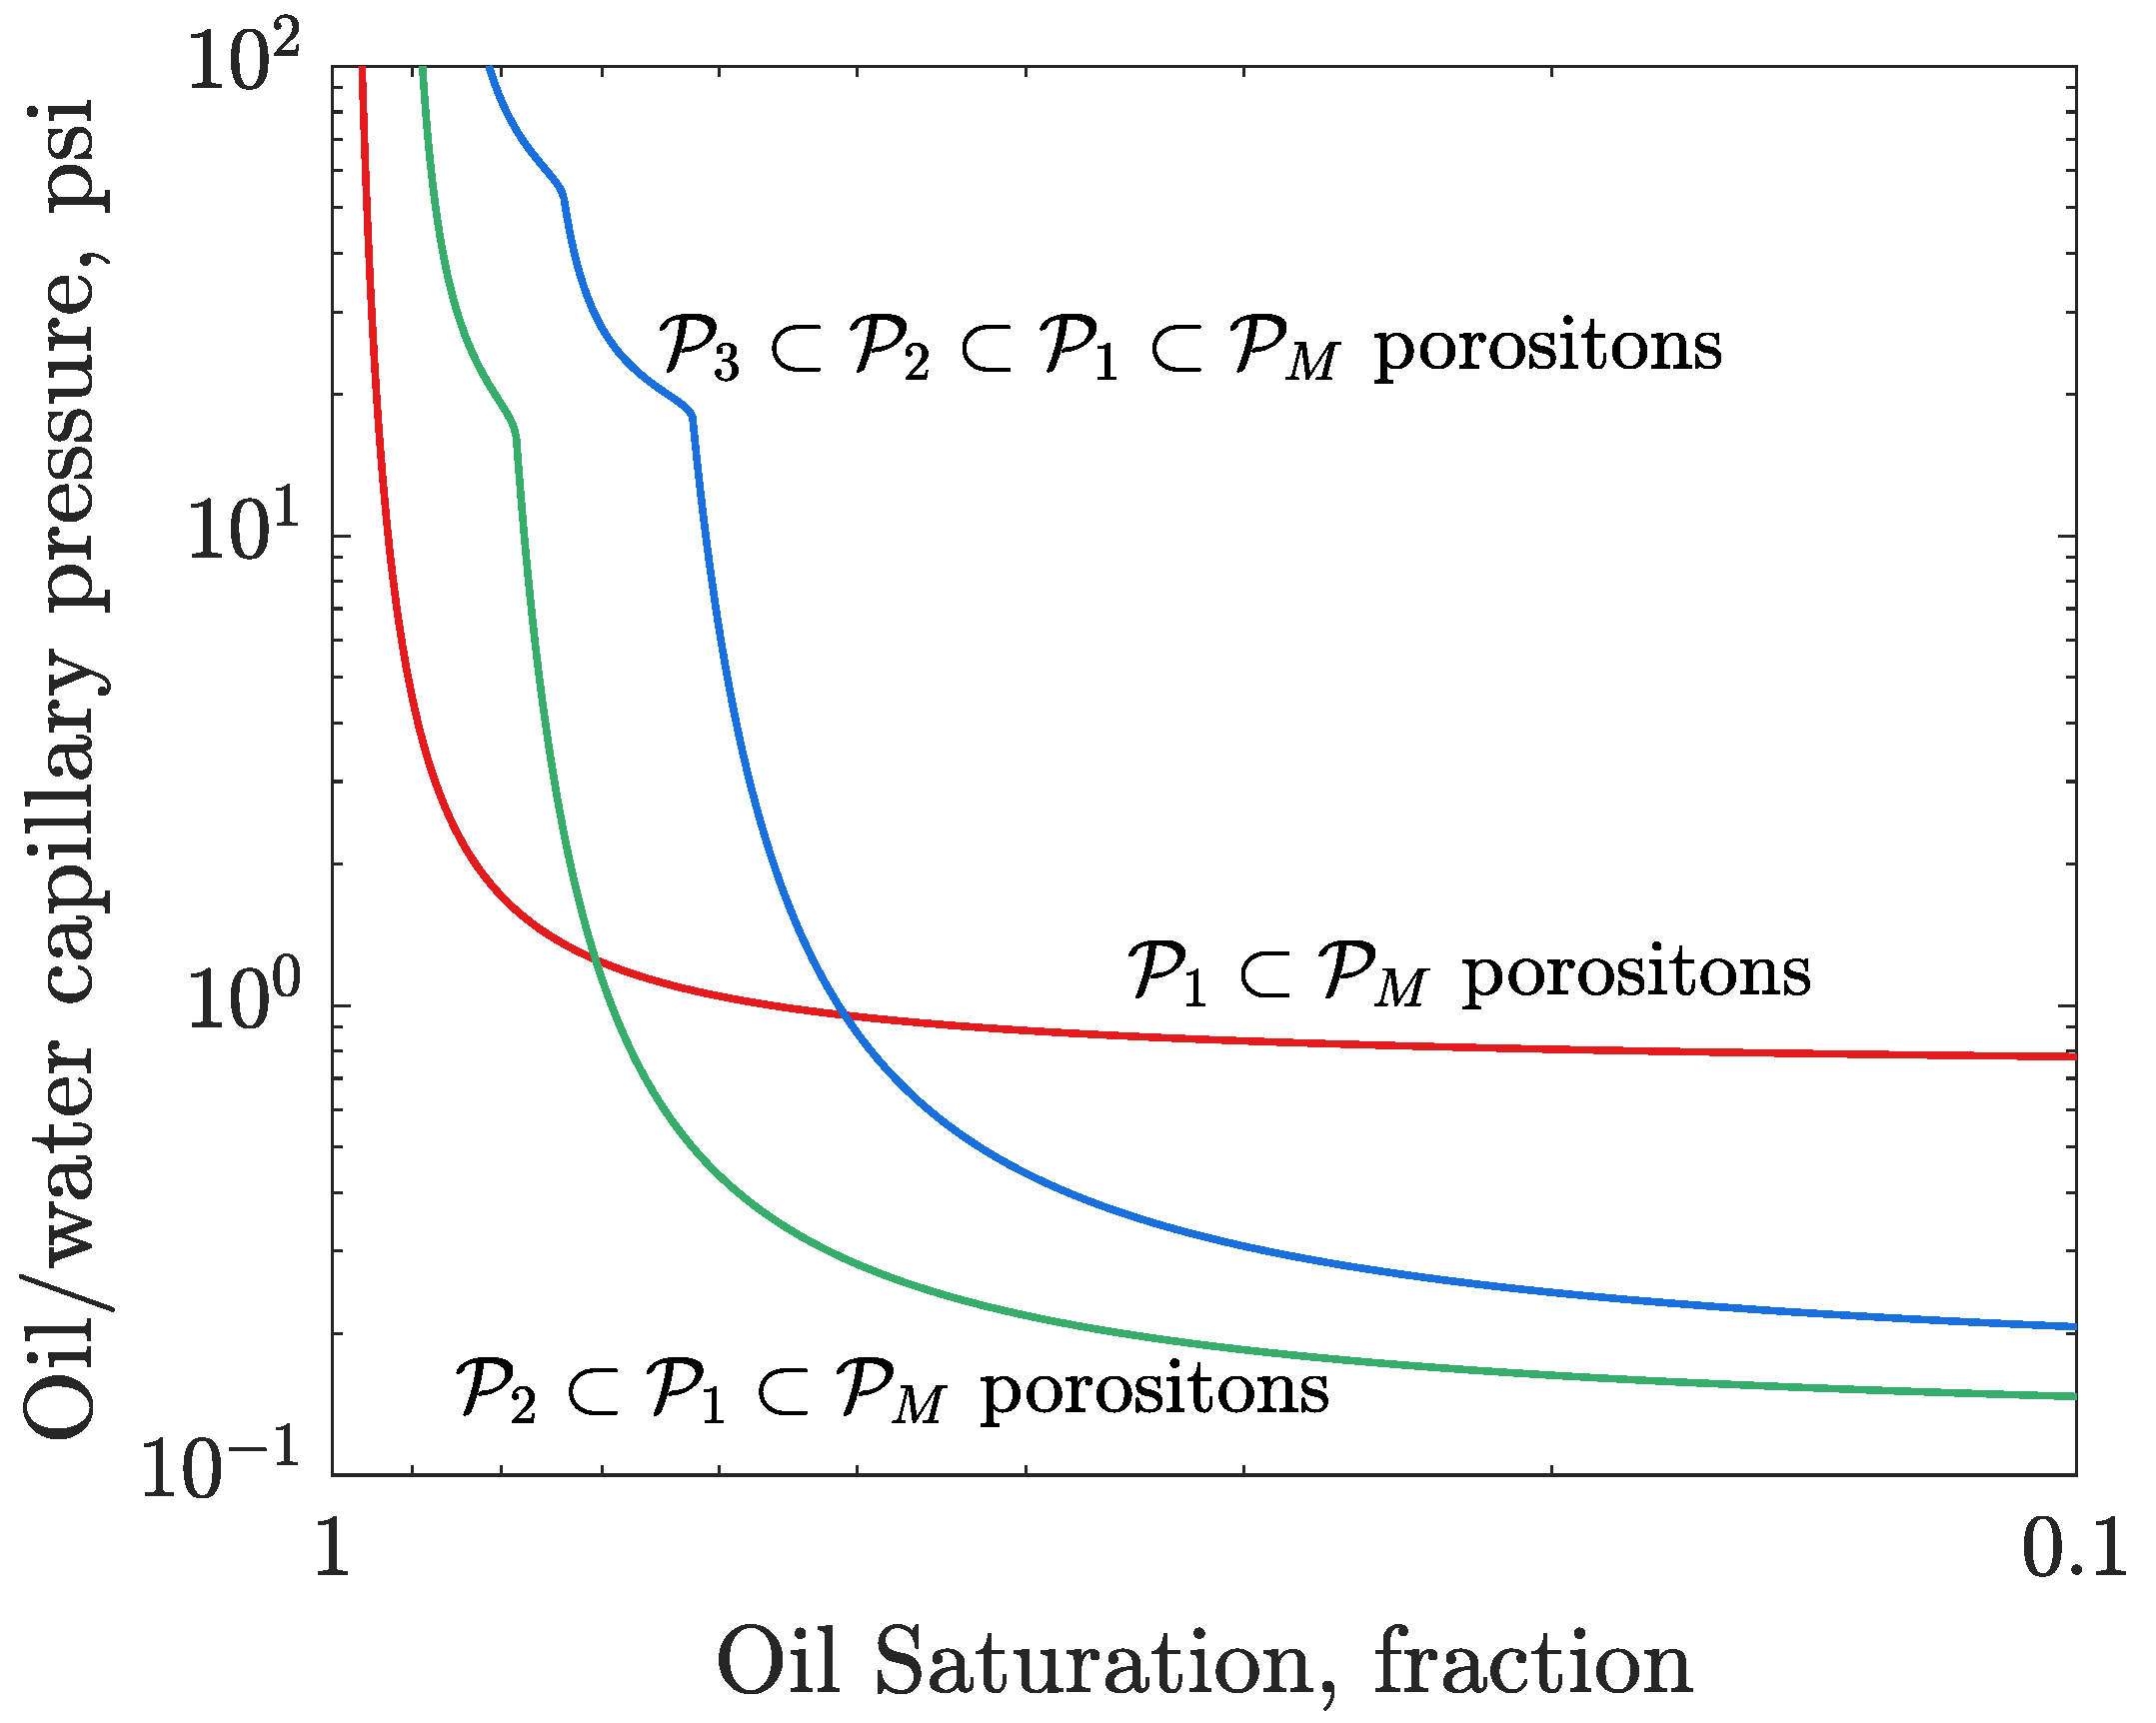
2.3. The Heights of Oil Columns Necessary to Drain the Ghawar Carbonates with Nested Microporous Porositons

The drainage mercury/air capillary pressures in Appendix A3 in Clerke et al. [24] were approximated with the Thomeer [25] hyperbolas, one each for up to the three porositons measured in the core samples. These pressures are plotted in Figure A1, from which one can see the broad and complex distribution of pore throat diameters in the samples.
The MICP data have been converted to the oil/water drainage capillary pressures as follows:
P c , Hg / air = 2 σ Hg / air cos ( θ Hg / air ) r P c , oil / water = P c , ow = 2 σ oil / water cos ( θ oil / water ) r P c , oil / water = σ oil / water cos ( θ oil / water ) σ Hg / air | cos ( θ Hg / air ) | P c , Hg / air
The contact angle for mercury invasion is assumed to be θ Hg / air = 140 ° . Since the Ghawar carbonates are weakly water wet to neutrally water wet, see, e.g., Verma et al. [31], we assume that the oil/water contact angle is θ oil / water = 40 ° , which may be conservative, i.e., the receding contact angles [34] may actually be higher. There is no way of discerning a single value of receding contact angle in a real rock. However, there is ample evidence (including our own extensive work) that an average value of a receding contact angle distribution in a strongly water wet rock might be 40–60 degrees. One could complicate these calculations by assuming contact angle distributions, see [34], and running Monte Carlo simulations to provide bands around our primary drainage results. This could be done but would further obfuscate the key message of this paper that most of the microporosity in Arab formations had to be invaded by oil regardless of the exact reasonable single value of a receding contact angle.
The interfacial tensions are assumed to be σ Hg / air = 485.5 mN/m, and σ oil / water = 30 mN/m. The latter number takes into the account the correction for high reservoir temperature in the Ghawar.
The MICP pressures are translated into the oil–water capillary pressures using Equation (5) 3 and then converted into the equivalent vertical extents of the oil ganglia displacing water:
P c , oil / water = ( ρ w ρ o ) g h Buoyancy pressure
At the reservoir temperature and pressure, the live oil density is assumed to be ρ 0 = 710 kg/m 3 , and the brine density, ρ w = 1070 kg/m 3 . The resulting Δ ρ g = 3530 Pa/m = 0.156 psi/ft. All of these numbers can be adjusted in the future. Thus, calculated heights of vertical oil columns necessary to drain the nested porositons in the database rock samples are shown in Figure A2.
The probability of invasion, P r , and the corresponding porosity weighted oil saturation, S o are obtained as follows:
P r ( H o ) = j n I S o , j ( H o ) > 0 n , S o ( H o ) = j n ϕ j S o , j ( H o ) j n ϕ j
where the summation is over the admissible samples j in the database, n is the total number of samples, and H o is the height of the hydrostatic oil column. I is an indicator function returning 1 when the condition is met and 0 otherwise. ϕ j are the sample porosities, and S o , j are the oil saturations calculated for each admissible sample given an oil column height.

3. Results and Discussion

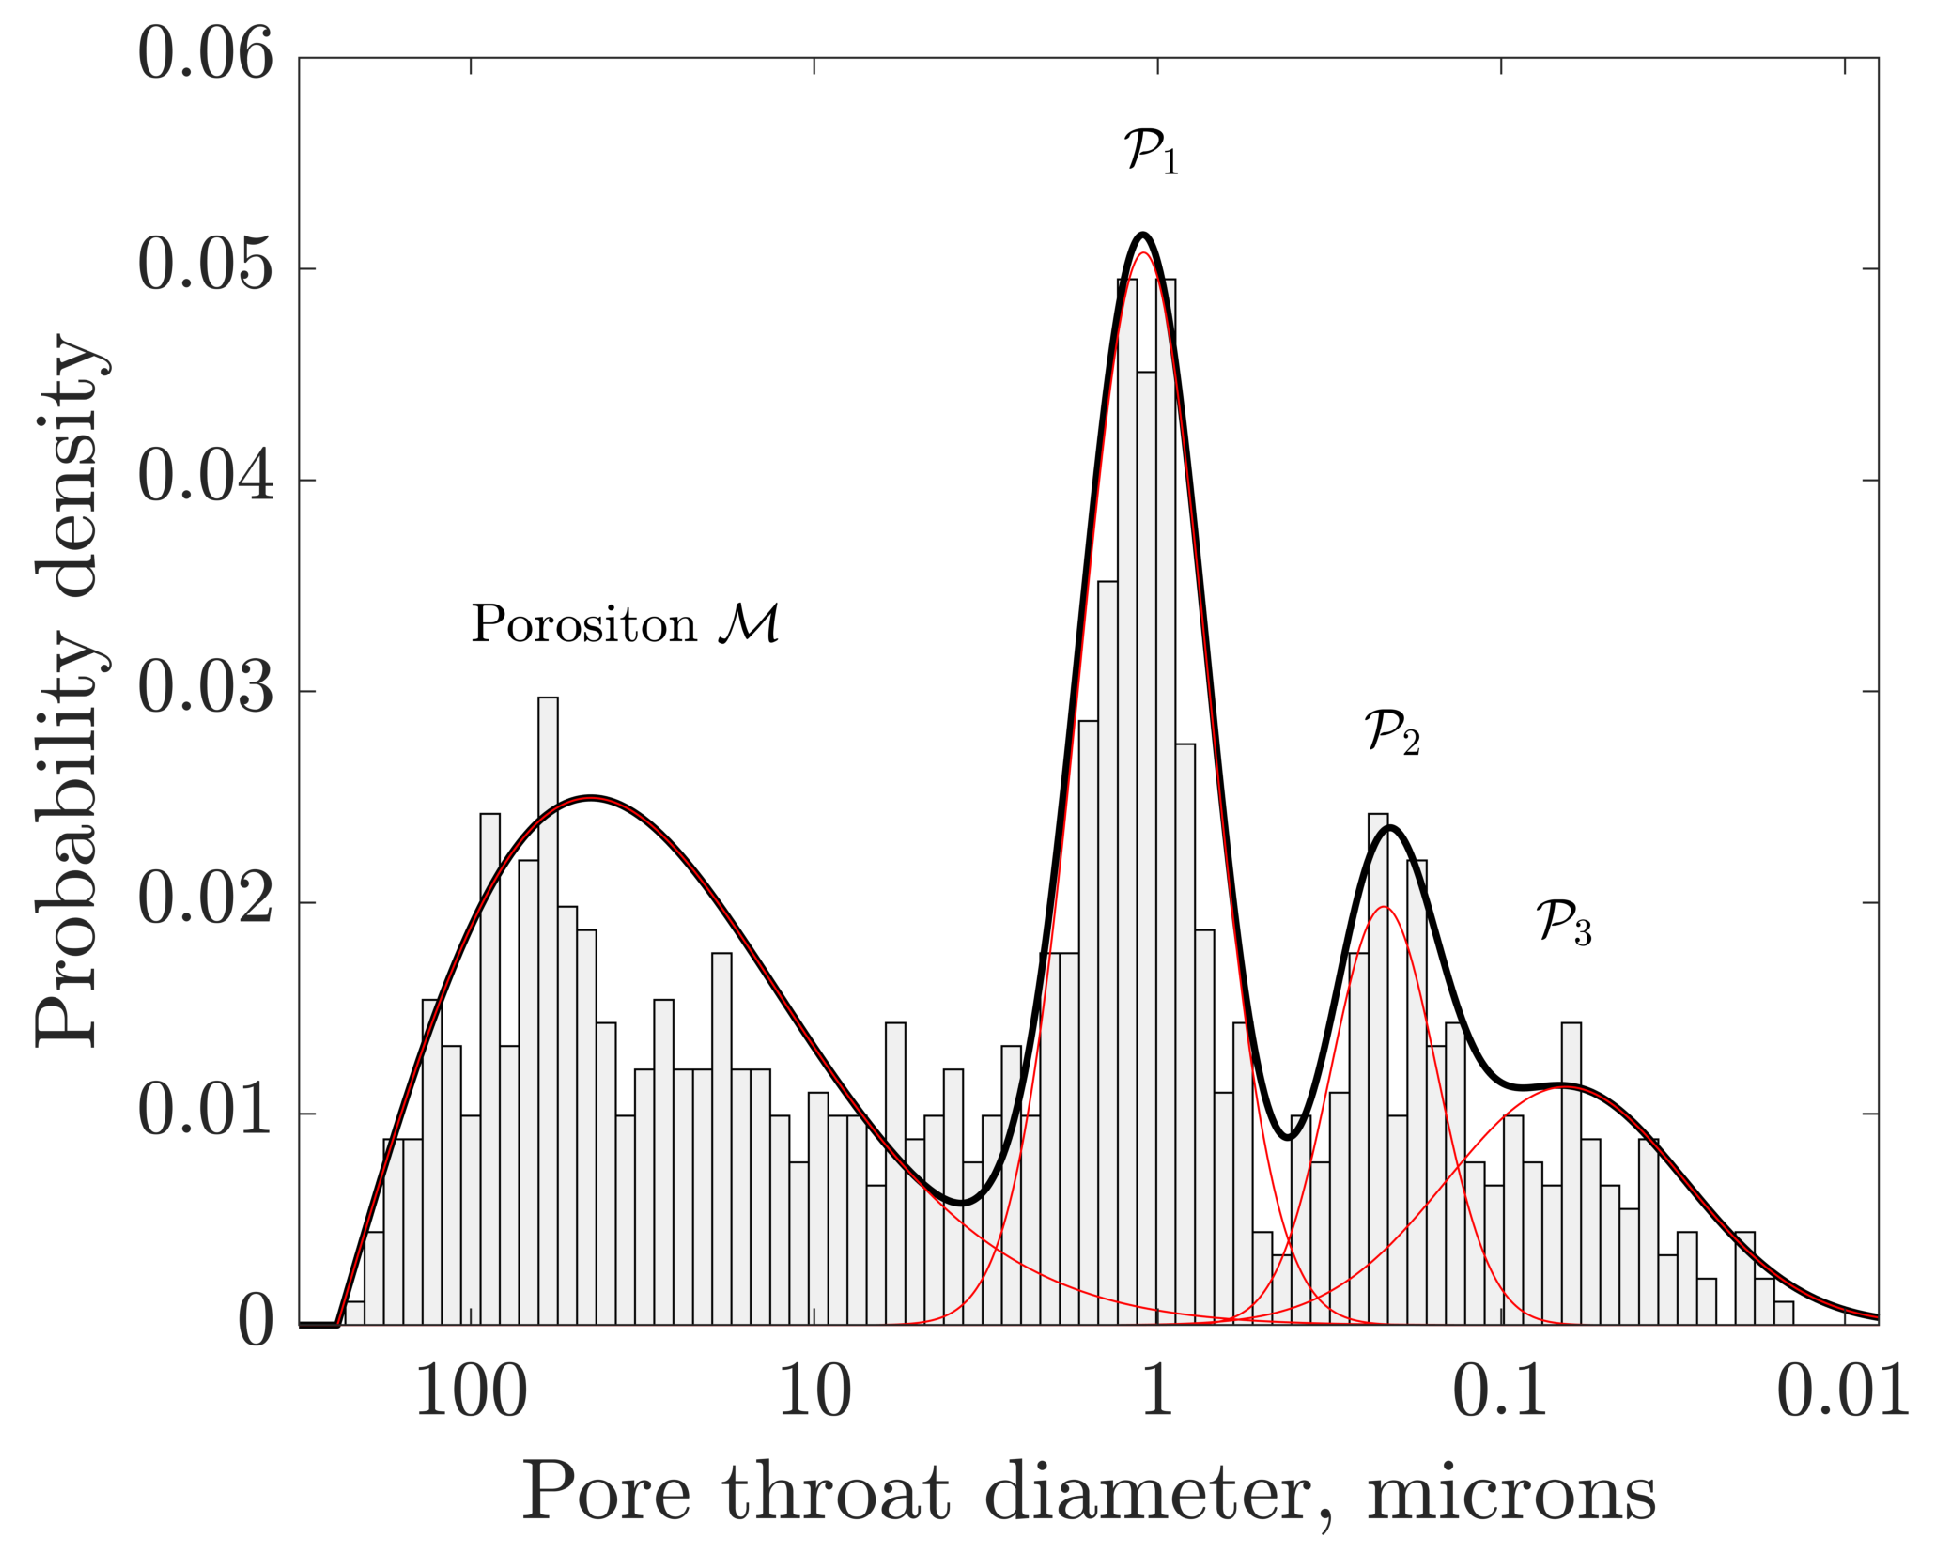
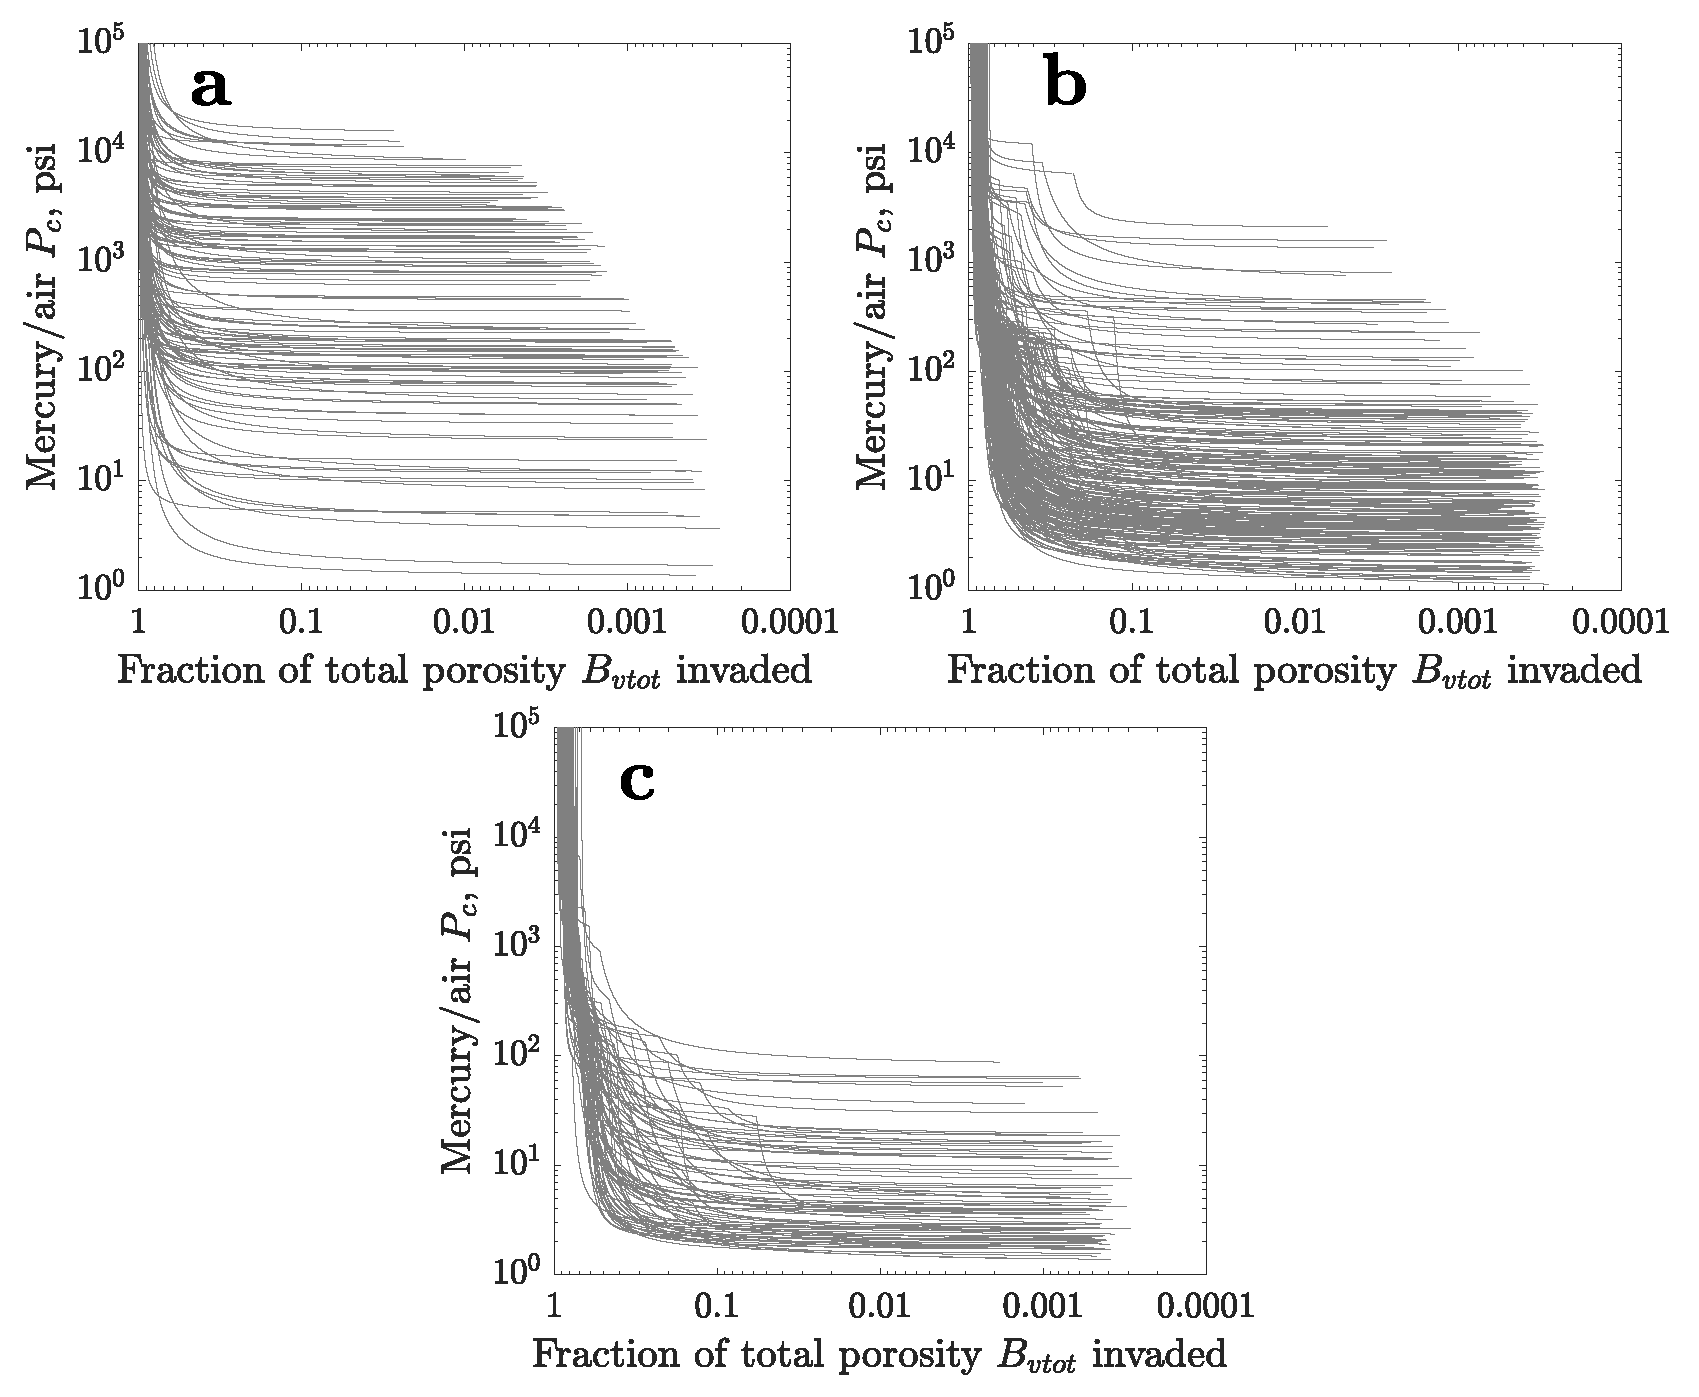
3.1. The Distribution of Pore Throat Diameters from the Capillary Entry Pressures

All of the mercury–air capillary pressures in the database were converted to pore throat diameters as follows:
d pore throat = 4 σ Hg / air | cos ( θ ) | ) P d i = 4 × 485.5 × 10 3 | cos ( 140 ° ) | N / m P d i × 1.01325 × 10 5 / 14.69595 N / m 2 × 10 6 micron d pore throat = 216 P d i i = Porositon M , Porositon P 1 , Porositon P 2 , Porositon P 3
All P d i s in the database are in psi.
We use the description of the pore systems in Arab D carbonate by Clerke et al. [24] that is built upon the intrinsic, fundamental and separate maximum pore–throat diameter modal elements named porositons. Porositons are stable, recurring, and intrinsic modes in the maximum pore–throat diameter of the nested carbonate pore systems. These universal nested pore systems are shown in Figure 3.
The discrete and unique porositons emerge from the following procedure. The logarithms of the pore throat diameters are binned into 75 equal classes and fit with the Generalized Extreme Value (GEV) distribution function for the macroporous porositon, M, and with the normal distributions for the three microporous porositons, P 1 , P 2 , and P 3 . The respective distributions are described in Appendix A. The results are shown in Figure 4 as a multimodal probability distribution and summarized in Table A1. The macroporosity pore throats are not fit well with a lognormal distribution. Note the clear valleys at about 6 and 0.4 microns.

3.2. The Probability of Draining the Nested Porositons

The somewhat counterintuitive summary of the probabilities of invasion of the nested porositons is plotted in Figure 5a, using Equation (7). For example, there is only a 41% probability of draining Porositon P 1 occluded in macroporosity M (abbreviated from now on as “1inM” with the probability of invasion “ P 1 ”), with no other discernible porositons nested in 1. On the other hand, the probabilities P12 or P13 of invading Porositon 1inM are 80–90% with a 20–30 ft oil column when this porositon contains at least one more porositon (2in1 or 3in2in1). Amazingly, the probability of draining Porositon 2in1inM (P22) is 40% when the oil column is 100 ft thick, and 80% when there is also Porositon 3 (P23). As expected, Porositon 3in2in1inM (P33), which has the smallest controlling pore throat size, has only a 10% probability of being drained by 100 ft of oil. The details of draining Porositons 1inM, 2in1inM, and 3in2in1inM in the multimodal carbonate rock samples are discussed and shown in Appendix B.
The corresponding oil saturations that are porosity weighted are plotted in Figure 5b. The porosity-weighted saturations and invasion probabilities show that it is increasingly more difficult to invade all porositons from 2in1inM, through 1inM, to 3in2in1inM.
Our assumption is that some or most of the nested porositons were bypassed to some degree when oil was filling up the reservoir (flowing up), unless the oil ganglia were very long. However, the bypassed pockets of water in the higher-order porositons were slowly drained when the macroscopic oil–water interface passed them on the way down. The always-connected water in these pockets sank, making room for oil in the counter-current drainage. Crude oil in the Ghawar contains about 5% of asphaltenes and the formation brine up to 22% of dissolved solids [35,36]. Therefore, the parts of the pores in contact with oil will become more oil-wet through asphaltenic deposition, while the corners and asperities, masked by water, will remain water-wet. A sequence of drainage events in the nested (in series) porositons in Equation (1) would then make the pores in each porositon mixed-wet [37,38,39]. With such a wettability configuration, spontaneous imbibition is unlikely to occur during water flooding due to the very high advancing contact angles [40]. Since the 1960s, most of the Ghawar reservoirs have been put on peripheral waterfloods [22], where seawater injected downdip along the flanks has been pushing oil up towards horizontal producers in a gravity-stable mode. Injected water can easily flow through the highly permeable macroporosity, bypassing the occluded microporosity.
We are working on providing experimental and theoretical evidence for the possibility of spontaneously imbibing mixed-wet pores with high advancing contact angles (> 90 ° ) through piston-type imbibition, given that the contact angle is lowered below a specific threshold value we establish from the Mayer–Stowe–Princen (MSP) theory. Such reduction of the contact angle will require injection of chemically-tuned brines. Therefore, we are investigating the effects of brine chemistry on the physicochemical properties of the crude oil/brine interfacial films [41], which are responsible for the development of mixed wettability. A better understanding of the underlying mechanisms would help maximize oil extraction through the recovery of bypassed oil [20,21,32].

4. Conclusions

In this paper, we have shown that the porosity-weighted oil saturations after primary drainage of microporous Arab formations had to be around 60–85%, regardless of the several assumptions we have made. Very few carbonate formations in the world are known as thoroughly as the Arab D limestone in Saudi Arabia. However, the micritic, mixed-wet carbonates or carbonate muds abound almost everywhere. These formations represent a potential huge target for IOR and must be understood better. One of the key unknowns is the average oil saturation in the tight parts of formations. This paper provided a simple tool to calculate this saturation from a geological understanding of pore structures and simple MICP measurements. We encourage others to pursue similar paths and learn which formations should be studied further for IOR, and which are not targets. What’s at stake is the low-rate, but long-lasting supply of oil for humanity that will need to use crude oil wisely for decades to come.

Author Contributions

Conceptualization, T.W.P.; methodology, T.W.P., A.M.S. and A.H.; formal analysis, T.W.P. and A.M.S.; investigation, T.W.P., A.M.S. and A.H.; resources, T.W.P.; data curation, T.W.P., A.M.S. and A.H.; writing—original draft preparation, T.W.P.; writing—review and editing, T.W.P., A.M.S.; visualization, T.W.P., A.M.S.; supervision, T.W.P.; project administration, T.W.P.; funding acquisition, T.W.P. All authors have read and agreed to the published version of the manuscript.

Funding

Ahmed M. Saad and Ahmed Hassan (Ph.D. students) are supported by baseline research funding from KAUST to Tadeusz Patzek.

Institutional Review Board Statement

Not applicable.

Informed Consent Statement

Not applicable.

Data Availability Statement

Not applicable.

Acknowledgments

KAUST has funded this project through the Ali I. Al-Naimi Petroleum Engineering Research Center (ANPERC). We thank all three reviewers for their insightful and constructive remarks.

Conflicts of Interest

The authors declare no conflict of interest.

Appendix A. The Lognormal and Generalized Extreme Value (GEV) Distributions

The probability density function of a log-normal distribution is expressed as
pdf ( x ; μ , σ ) = f ( x ; μ , σ ) = 1 x 1 2 π σ 2 exp ln x μ 2 2 σ 2
where pdf = f is the probability density function
The distribution mode (pdf’s peak value) is
Mode = exp ( μ σ 2 )
Median is defined as
Median ( μ , σ ) = 0 m * f ( x ; μ , σ ) d x = m * f ( x ; μ , σ ) d x = 1 2
The lognormal distribution’s median is equal to
Median ( μ ) = exp ( μ )
The most important mean or expected value of the lognormal distribution is
E ( X ) = m = 0 x f ( x ; μ , σ ) d x = exp μ + σ 2 2
The variance of a lognormal distribution is
V ( X ) = E [ ( X μ ) 2 ] = e σ 2 1 E 2 ( X )
and its standard deviation is
s = V ( X )
In a generalized extreme value distribution of a random variable X that has outcomes { x } , μ R is the location parameter, σ > 0 the scale parameter, and ξ R (often denoted by k) is the shape parameter. Always,
1 + ξ ( x μ ) / σ > 0
The probability density function is
f ( x ; μ , σ , ξ ) = 1 σ 1 + ξ x μ σ ( 1 / ξ ) 1 × exp 1 + ξ x μ σ 1 / ξ
The distribution’s mode (pdf’s peak value) is
Mode ( μ , σ , ξ ) = μ + σ ξ ( 1 + ξ ) ξ 1
The median is
Median ( μ , σ , ξ ) = μ + σ ( ln 2 ) ξ 1 ξ , ξ 0
The most important mean or expected value of the GEV distribution is
E ( X ) = m = μ σ ξ + σ ξ Γ ( 1 ξ )
The variance of the GEV distribution is
V ( X ) = σ 2 ξ 2 Γ ( 1 2 ξ ) Γ 2 ( 1 ξ ) , ξ 0 , ξ < 1 2
if ξ = 0
V ( X ) = σ 2 π 2 6
and V does not exist otherwise. The standard deviation is
s = V
Table A1. A summary of the mean, mode, and median pore diameters for the four individual distributions in Figure 4.
Macroporosity
GEV ξ M = 0.50 μ M = 1.35 σ M = 0.52
Macroporosity E M = 29 Mode M = 45Median M = 33STD M = 3.04 μ m
Gauss P 1 μ 1 = log ( 1.10 μ m ) σ 1 = log ( 0.65 μ m )
P 1 E 1 = 1.06Mode 1 = 1.01Median 1 = 1.04STD 1 = 0.20 μ m
Gauss P 2 μ 2 = log ( 0.22 μ m ) σ 2 = log ( 0.70 μ m )
P 2 E 2 = 0.52Mode 2 = 0.51Median 2 = 0.52STD 2 = 0.08 μ m
Gauss P 3 μ 3 = log ( 0.07 μ m ) σ 3 = log ( 0.45 μ m )
P 3 E 3 = 0.32Mode 3 = 0.27Median 3 = 0.31STD 3 = 0.12 μ m

Appendix B. The Heights of Oil Columns Necessary to Drain the Ghawar Carbonates with Nested Microporous Porositons

The drainage mercury/air capillary pressures in Appendix A3 in Clerke et al. [24], characterized by the Thomeer [25] hyperbolas, are plotted in Figure A1.
Figure A1. (a) The MICP curves for the rock samples the are described by a single Thomeer hyperbola (Porositon 1 in Porositon M ). (b) The MICP curves for the rock samples the are described by two Thomeer hyperbolas (Porositon 2 in Porositon 1 in Porositon M). (c) The MICP curves for the rock samples are described by three Thomeer hyperbolas (Porositon 3 in Porositon 2 in Porositon 1 in Porositon M). B v is the infinite pressure extrapolation of the sample porosity occupied by mercury that results from a single Thomeer hyperbola. B V = v t o t is the sum of all B v s of multiple Thomeer hyperbolas.
Energies 15 01243 g0a1
Figure A2. The heights of vertical oil columns necessary to drain the carbonate rock samples with different sets of porositons. From a to f clockwise: oil saturations in samples that contain only Porositon 1 in M, Porositons 1 and 2 in M, Porositon 2 in M, Porositon 3 in 1 in M, Porositons 2 and 3 in M, and Porositon 3 in M.
Energies 15 01243 g0a2

References

  1. Liang, Y.; Tan, Y.; Wang, F.; Luo, Y.; Zhao, Z. Improving permeability of coal seams by freeze-fracturing method: The characterization of pore structure changes under low-field NMR. Energy Rep. 2020, 6, 550–561. [Google Scholar] [CrossRef]
  2. Chichinina, T.; Martyushev, D. Specific Anisotropy Properties of Fractured Reservoirs: Research on Thomsen’s Anisotropy Parameter Delta. Geomodel 2021, 2021, 1–5. [Google Scholar] [CrossRef]
  3. Zeng, Y.; Du, S.; Zhang, X.; Zhang, B.; Liu, H. The crucial geometric distinctions of microfractures as the indispensable transportation channels in hydrocarbon-rich shale reservoir. Energy Rep. 2020, 6, 2056–2065. [Google Scholar] [CrossRef]
  4. Gou, B.; Zhan, L.; Guo, J.; Zhang, R.; Zhou, C.; Wu, L.; Ye, J.; Zeng, J. Effect of different types of stimulation fluids on fracture propagation behavior in naturally fractured carbonate rock through CT scan. J. Pet. Sci. Eng. 2021, 201, 108529. [Google Scholar] [CrossRef]
  5. Martyushev, D.A.; Yurikov, A. Evaluation of opening of fractures in the Logovskoye carbonate reservoir, Perm Krai, Russia. Pet. Res. 2021, 6, 137–143. [Google Scholar] [CrossRef]
  6. Ponomarev, A.; Zavatsky, M.; Nurullina, T.; Kadyrov, M.; Galinsky, K.; Tugushev, O. Application of core X-ray microtomography in oilfield geology. Georesources 2021, 23, 34–43. [Google Scholar] [CrossRef]
  7. Khirevich, S.; Patzek, T.W. Three-dimensional simulation of tracer transport dynamics in formations with high-permeability channels or fractures: Estimation of oil saturation. Phys. Fluids 2019, 31, 113604. [Google Scholar] [CrossRef]
  8. Lucia, F.J.; Kerans, C.; Jennings, J.W. Carbonate reservoir characterization. J. Pet. Technol. 2003, 55, 70–72. [Google Scholar] [CrossRef]
  9. Nehring, R. Giant Oil Fields and World Oil Resources. 1978. Available online: https://www.rand.org/content/dam/rand/pubs/reports/2006/R2284.pdf (accessed on 2 January 2022).
  10. Ivanhoe, L.; Leckie, G. Global oil, gas fields, sizes tallied, analyzed. Oil Gas J. 1993, 91. Available online: www.ogj.com/home/article/17223313/global-oil-gas-fieldssizes-tallied-analyzed (accessed on 2 January 2022).
  11. Gaswirth, S.B.; French, K.L.; Pitman, J.K.; Marra, K.R.; Mercier, T.J.; Leathers-Miller, H.M.; Schenk, C.J.; Tennyson, M.E.; Woodall, C.A.; Brownfield, M.E.; et al. Assessment of Undiscovered Continuous Oil and Gas Resources in the Wolfcamp Shale and Bone Spring Formation of the Delaware Basin, Permian Basin Province, New Mexico and Texas, 2018; U.S. Geological Survey: Denver, CO, USA, 2018. [CrossRef]
  12. Saputra, W.; Kirati, W.; Patzek, T. Forecast of Economic Tight Oil and Gas Production in Permian Basin. Energies 2022, 15, 43. [Google Scholar] [CrossRef]
  13. Saputra, W.; Kirati, W.; Patzek, T. Generalized Extreme Value Statistics, Physical Scaling and Forecasts of Oil Production from All Vertical Wells in the Permian Basin. Energies 2022, 1, 904. [Google Scholar] [CrossRef]
  14. Saputra, W.; Kirati, W.; Patzek, T. Generalized Extreme Value Statistics, Physical Scaling and Forecasts of Oil Production in the Bakken Shale. Energies 2019, 12, 3641. [Google Scholar] [CrossRef] [Green Version]
  15. Saputra, W.; Kirati, W.; Patzek, T. Physical Scaling of Oil Production Rates and Ultimate Recovery from All Horizontal Wells in the Bakken Shale. Energies 2020, 13, 2052. [Google Scholar] [CrossRef] [Green Version]
  16. Patzek, T.W.; Saputra, W.; Kirati, W. A Simple Physics-Based Model Predicts Oil Production from Thousands of Horizontal Wells in Shales. In Proceedings of the SPE Annual Technical Conference and Exhibition, San Antonio, TX, USA, 9–11 October 2017. [Google Scholar]
  17. Yousef, A.A.; Al-Saleh, S.; Al-Jawfi, M.S. Improved/Enhanced Oil Recovery from Carbonate Reservoirs by Tuning Injection Water Salinity and Ionic Content. In Proceedings of the SPE Improved Oil Recovery Symposium, Tulsa, OK, USA, 14–18 April 2012. [Google Scholar] [CrossRef]
  18. Hu, X.; Yutkin, M.P.; Hassan, S.; Wu, J.; Prausnitz, J.M.; Radke, C.J. Calcium Ion Bridging of Aqueous Carboxylates Onto Silica: Implications for Low-Salinity Waterflooding. Energy Fuels 2018, 33, 127–134. [Google Scholar] [CrossRef]
  19. Hassan, S.; Kamireddy, S.; Yutkin, M.; Radke, C.; Patzek, T. Adsorption of Charged Surfactants onto Calcium Carbonate. In Proceedings of the IOR 2019-20th European Symposium on Improved Oil Recovery, Pau, France, 8–10 April 2019. [Google Scholar] [CrossRef]
  20. Yutkin, M.; Radke, C.; Patzek, T. Chemical Compositions in Salinity Waterflooding of Carbonate Reservoirs: Theory. Transp. Porous Med. 2021, 136, 411–429. [Google Scholar] [CrossRef]
  21. Yutkin, M.; Radke, C.; Patzek, T. Chemical Compositions in Salinity Waterflooding of Carbonate Reservoirs: Experiment. Transp. Porous Med. 2022, 141. [Google Scholar] [CrossRef]
  22. Sorkhabi, R. Ghawar, Saudi Arabia: The King of Giant Fields. 2010. Available online: www.geoexpro.com/articles/2010/04/-the-king-of-giant-fields (accessed on 2 January 2022).
  23. Cantrell, D.L.; Hagerty, R.M. Microporosity in arab formation carbonates, Saudi Arabia. GeoArabia 1999, 4, 129–154. [Google Scholar] [CrossRef]
  24. Clerke, E.A.; Mueller, H.W., III; Phillips, E.C.; Eyvazzadeh, R.Y.; Jones, D.H.; Ramamoorthy, R.; Srivastava, A. Application of Thomeer Hyperbolas to decode the pore systems, facies and reservoir properties of the Upper Jurassic Arab D Limestone, Ghawar field, Saudi Arabia: A “Rosetta Stone” approach. GeoArabia 2008, 13, 113–160. [Google Scholar]
  25. Thomeer, J. Introduction of a pore geometrical factor defined by the capillary pressure curve. J. Pet. Technol. 1960, 12, 73–77. [Google Scholar] [CrossRef]
  26. Thomeer, J. Air permeability as a function of three pore-network parameters. J. Pet. Technol. 1983, 35, 809–814. [Google Scholar] [CrossRef]
  27. Mitchell, J.; Lehmann, P.; Cantrell, D.; Al-Jallal, I.; Al-Thagafy, M. Lithofacies, Diagenesis and Depositional Sequence; Arab-D Member, Ghawar Field, Saudi Arabia; SEPM Society for Sedimentary Geology: Tulsa, OK, USA, 1988. [Google Scholar]
  28. AAOC Staff. Ghawar oil field, Saudi Arabia. AAPG Bull. 1959, 43, 434–454. [Google Scholar]
  29. Hassan, A.; Chandra, V.; Yutkin, M.P.; Patzek, T.W.; Espinoza, D. Imaging and characterization of microporous carbonates using confocal and electron microscopy of epoxy pore casts. SPE J. 2019, 24, 1220–1233. [Google Scholar] [CrossRef]
  30. Hassan, A.; Yutkin, M.; Chandra, V.; Patzek, T. Quality Evaluation of Epoxy Pore Casts Using Silicon Micromodels: Application to Confocal Imaging of Carbonate Samples. Appl. Sci. 2021, 11, 5557. [Google Scholar] [CrossRef]
  31. Verma, M.K.; Boucherit, M.; Bouvier, L. Evaluation of residual oil saturation after waterflood in a carbonate reservoir. SPE Reserv. Eng. 1994, 9, 247–253. [Google Scholar] [CrossRef]
  32. Yutkin, M.P.; Mishra, H.; Patzek, T.W.; Lee, J.; Radke, C.J. Bulk and Surface Aqueous Speciation of Calcite: Implications for Low-Salinity Waterflooding of Carbonate Reservoirs. SPE J. 2018, 23, 084–101. [Google Scholar] [CrossRef] [Green Version]
  33. Hu, X.; Yutkin, M.P.; Hassan, S.; Wu, J.; Prausnitz, J.M.; Radke, C.J. Asphaltene Adsorption From Toluene Onto Silica Through Thin Water Layers. Langmuir 2018, 35, 428–434. [Google Scholar] [CrossRef]
  34. Patzek, T.W. Verification of a complete pore network simulator of drainage and imbibition. Spe J. 2001, 6, 144–156. [Google Scholar] [CrossRef] [Green Version]
  35. Yousef, A.A.; Al-Saleh, S.; Al-Kaabi, A.; Al-Jawfi, M. Laboratory investigation of the impact of injection-water salinity and ionic content on oil recovery from carbonate reservoirs. SPE Reserv. Eval. Eng. 2011, 14, 578–593. [Google Scholar] [CrossRef]
  36. Alotaibi, M.; Yousef, A. The impact of dissolved species on the reservoir fluids and rock interactions in carbonates. In Proceedings of the SPE Saudi Arabia Section Annual Technical Symposium and Exhibition, Al-Khobar, Saudi Arabia, 21–23 April 2015. [Google Scholar]
  37. Salathiel, R. Oil recovery by surface film drainage in mixed-wettability rocks. J. Pet. Technol. 1973, 25, 1216–1224. [Google Scholar] [CrossRef]
  38. Kovscek, A.; Wong, H.; Radke, C. A pore-level scenario for the development of mixed wettability in oil reservoirs. AIChE J. 1993, 39, 1072–1085. [Google Scholar] [CrossRef] [Green Version]
  39. Blunt, M.J. Pore level modeling of the effects of wettability. SPE J. 1997, 2, 494–510. [Google Scholar] [CrossRef]
  40. Freer, E.; Svitova, T.; Radke, C. The role of interfacial rheology in reservoir mixed wettability. J. Pet. Sci. Eng. 2003, 39, 137–158. [Google Scholar] [CrossRef]
  41. Saad, A.M.; Aime, S.; Mahavadi, S.C.; Song, Y.Q.; Patzek, T.W.; Weitz, D. Interfacial Viscoelasticity in Crude Oil-Water Systems to Understand Incremental Oil Recovery. In Proceedings of the SPE Annual Technical Conference and Exhibition, Virtual, 5–7 October 2020. [Google Scholar]
Figure 1. The 480 carbonate core samples in the database in Appendix A3 of [24] can be described by one, two or three nested macro- and micro-pore systems, each characterized by a unique Thomeer [25,26] hyperbola. The capillary entry pressures into the macroporosity that surrounds the microporous regions are significantly lower than the capillary pressure plateaus that span 30 to 60 plus percent of the total porosity.
Energies 15 01243 g001
Figure 2. SEM images of the etched Arab-D pore casts showing the three carbonate microporosity types identified by Cantrell and Hagerty [23]; the solid represents the pore space and the etched away grains are black voids. (a) Interparticle (IP) macropores appear as solid epoxy, while type I microporosity in microporous grains (MG) appears as a fine network of sponge-like micropores. (b) The heavily micritized matrix type II microporosity is abundant throughout the sample. MM and MG seem to have very similar pore morphologies. (c) Intraparticle moldic pore (MO) appears as solid epoxy within a micritized grain. Type III microporosity in intercrystalline micropores (MEC) seems to interconnect the MO to the rest of the matrix pore network. Images by Ahmed Hassan [29].
Energies 15 01243 g002
Figure 3. SEM images of the Arab-D pore casts showing the four nested porositons identified by Cantrell and Hagerty [23], namely, M , P 1 , P 2 , and P 3 . The grey solid represents the pore space. Images by Ahmed Hassan [29].
Energies 15 01243 g003
Figure 4. The semilogarithmic plot of the multimodal probability distribution for all pore throat diameters in the carbonate database in Clerke et al. [24]. Each red curve is a fit of a part of the distribution of the logarithm of pore sizes with a Generalized Extreme Value or GEV pdf for the macroporosity and three normal distributions for the microporosity. The black curve is the sum of the four distributions.
Energies 15 01243 g004
Figure 5. (a) The probabilities of invading different nested porositons in the carbonate database from Clerke et al. [24]; (b) the corresponding porosity-weighted oil saturations in the nested porositons. P1 denotes primary drainage of cores with only P1inM. P12 is drainage of only porositon 1inM in the cores with two porositons 1 and 2. P22 is drainage of porositon 2 in the cores with 2in1inM. P13 is drainage of porositon 1inM in the cores with three porositons. P23 is drainage of porositon 2in1inM and P33 is drainage of porositon 3in2in1inM in the cores with three porositons.
Energies 15 01243 g005
Table 1. Major types of microporosity in Arab-D.
Microporosity TypeDescription
Type IMicroporous grain (MG)
Type IIMicroporous matrix (MM)
Type IIIMicroporous equant intercrystalline between cement crystals (MEC)
Publisher’s Note: MDPI stays neutral with regard to jurisdictional claims in published maps and institutional affiliations.

