Article

Multi-Objective Optimization of Parameters of Channels with Staggered Frustum of a Cone Based on Response Surface Methodology

State Key Laboratory for Manufacturing Systems Engineering, Mechanics Institute, Xi’an Jiaotong University, Xi’an 710049, China
*
Author to whom correspondence should be addressed.
Energies 2022, 15(3), 1240; https://doi.org/10.3390/en15031240
Submission received: 11 January 2022 / Revised: 1 February 2022 / Accepted: 3 February 2022 / Published: 8 February 2022
(This article belongs to the Special Issue Heat Transfer and Heat Recovery Systems)

Abstract

:
In this study, Response Surface Methodology (RSM) and multi-objective genetic algorithm were used to obtain optimum parameters of the channels with frustum of a cone with better flow and heat transfer performance. Central composite face-centered design (CCF) was applied to the experimental design of the channel parameters, and on this basis, the response surface models were constructed. The sensitivity of the channel parameters was analyzed by Sobol’s method. The multi-objective optimization of the channel parameters was carried out with the goal of achieving maximum Nusselt number ratio (Nu/Nu0) and minimum friction coefficient ratio (f/f0). The results show that the root mean square errors (RSME) of the fitted response surface models are less than 0.25 and the determination coefficients (R2) are greater than 0.93; the models have high accuracy. Sobol’s method can quantitatively analyze the influence of the channel parameters on flow and heat transfer performance of the channels. When the response is Nu/Nu0, from high to low, the total sensitivity indexes of the channel parameters are frustum of a cone angle (α), Reynolds number (Re), spanwise spacing ratio (Z2/D), and streamwise spacing ratio (Z1/D). When the response is f/f0, the total sensitivity indexes of the channel parameters from high to low are Re, Z1/D, α and Z2/D. Four optimization channels are selected from the Pareto solution set obtained by multi-objective optimization. Compared with the reference channel, the Nu/Nu0 of the optimized channels is increased by 21.36% on average, and the f/f0 is reduced by 9.16% on average.

1. Introduction

To cope with severe global climate change and reflect the responsibility assumed by a major country, “carbon peak and carbon neutrality” is an important national strategic goal. Therefore, it is urgent to develop more efficient thermal energy equipment to reduce carbon emissions and improve energy efficiency. Plate air heat exchangers are a compact and efficient piece of heat exchange equipment that is widely used in the chemical industry, electric power, metallurgy, and other industrial sectors.
Selecting appropriate channel parameters can effectively improve the flow and heat transfer performance of heat exchanger channels. Response Surface Methodology (RSM) can be used to obtain the combination of design variables under the optimal target response through the explicit functional relationship between design variables and response. Refs. [1,2] used the CCF method combined with response surface method to optimize the rib structure of a steam-cooled rectangular channel, and reported that the multi-objective optimization for lower pressure drop and higher heat transfer could be achieved at Re of 90,000, α of 41.515, e/D of 0.116 and P/D of 0.975. Izadi et al. [3] numerically analyzed the natural convection of a porous enclosure under a nonuniform magnetic field using the Local Thermal Non-Equilibrium (LTNE)model. The results indicated that the Nusselt numbers of the two phases of porous material converged when increasing the power ratio of the two magnetic sources, and these two thermal indices varied when reducing the power ratio of the two magnetic sources. Jeong et al. [4] numerically analyzed the cooling performance of a cooling channel with a V-shaped rib structure, and then optimized the structural parameters of the V-shaped rib using RSM. Seo et al. [5] used the genetic algorithm and RSM to optimize a cooling channel with a boot-shaped rib. Mamuria et al. [6] used RSM to analyze the sensitivity of four variable parameters of a solar heat exchanger. Bu et al. [7] studied the structural parameters of typical matrix channels by RSM, and fitted the polynomial expressions of channel friction coefficient ratio and Nusselt number ratio with respect to rib angle and rib density. Shi et al. [8] used RSM to optimize the geometric parameters of microchannels with secondary flow, and selected five optimized structures from the optimized Pareto solution set. Wen Jian et al. [9] combined RSM and the multi-objective genetic algorithm to optimize the structure of a serrated fin, studying the effects of fin-height, fin-distance and fin-thickness on flow and heat transfer in the fin channel, finally obtaining three optimized structures. Zheng et al. [10] conducted numerical research on a channel with discrete inclined ribs, studying the effects of Reynolds number, rib-spacing and rib-height ratio on the flow and heat transfer performance of the channel, and analyzed the sensitivity of parameters based on RSM.
However, the research on turbulent channels in the above references focuses on the flow and heat transfer performance of the channels, and rarely considers the strength of the turbulent structure. With improvements in the performance of turbulent channels, the problem of fluid excitation can no longer be ignored [11]. High-strength plates can be obtained by the hot stamping forming process [12], and parallel high-strength plates can form a turbulent channel for flow and heat transfer. Considering the fluid excitation in the turbulent channels and the advantages of the hot stamping forming process, our research group proposed a new frustum of a cone structure that can be formed by hot stamping formation [13]. Nevertheless, Ref. [13] only studied a channel with frustum of a cone under a certain structure, and the results showed that the flow and heat transfer performance of the channel was poor. Hence, based on this research, in order to obtain the parameters for a channel with frustum of a cone with better flow and heat transfer performance, RSM and the multi-objective genetic algorithm were used to optimize the channel parameters. The experimental design of the channel parameters, including Reynolds number (Re), frustum of a cone angle (α), streamwise spacing ratio (Z1/D), and spanwise spacing ratio (Z2/D), was carried out by using central composite face-centered design (CCF). In addition, on this basis, the second-order polynomial was selected to construct the response surface model. With respect to global sensitivity analysis, Sobol’s method was used to analyze the sensitivity of the channel parameters, with the responses being the Nusselt number ratio (Nu/Nu0) and the friction coefficient ratio (f/f0) of the channels. To maximize the Nu/Nu0 and minimize the f/f0 of the channels, the non-dominated sorting genetic algorithm with elite strategy (NSGA-II) was used. These research results can serve as a reference for the parametric multi-objective optimized design of channels with frustum of a cone.

2. Physical Model and Numerical Methods
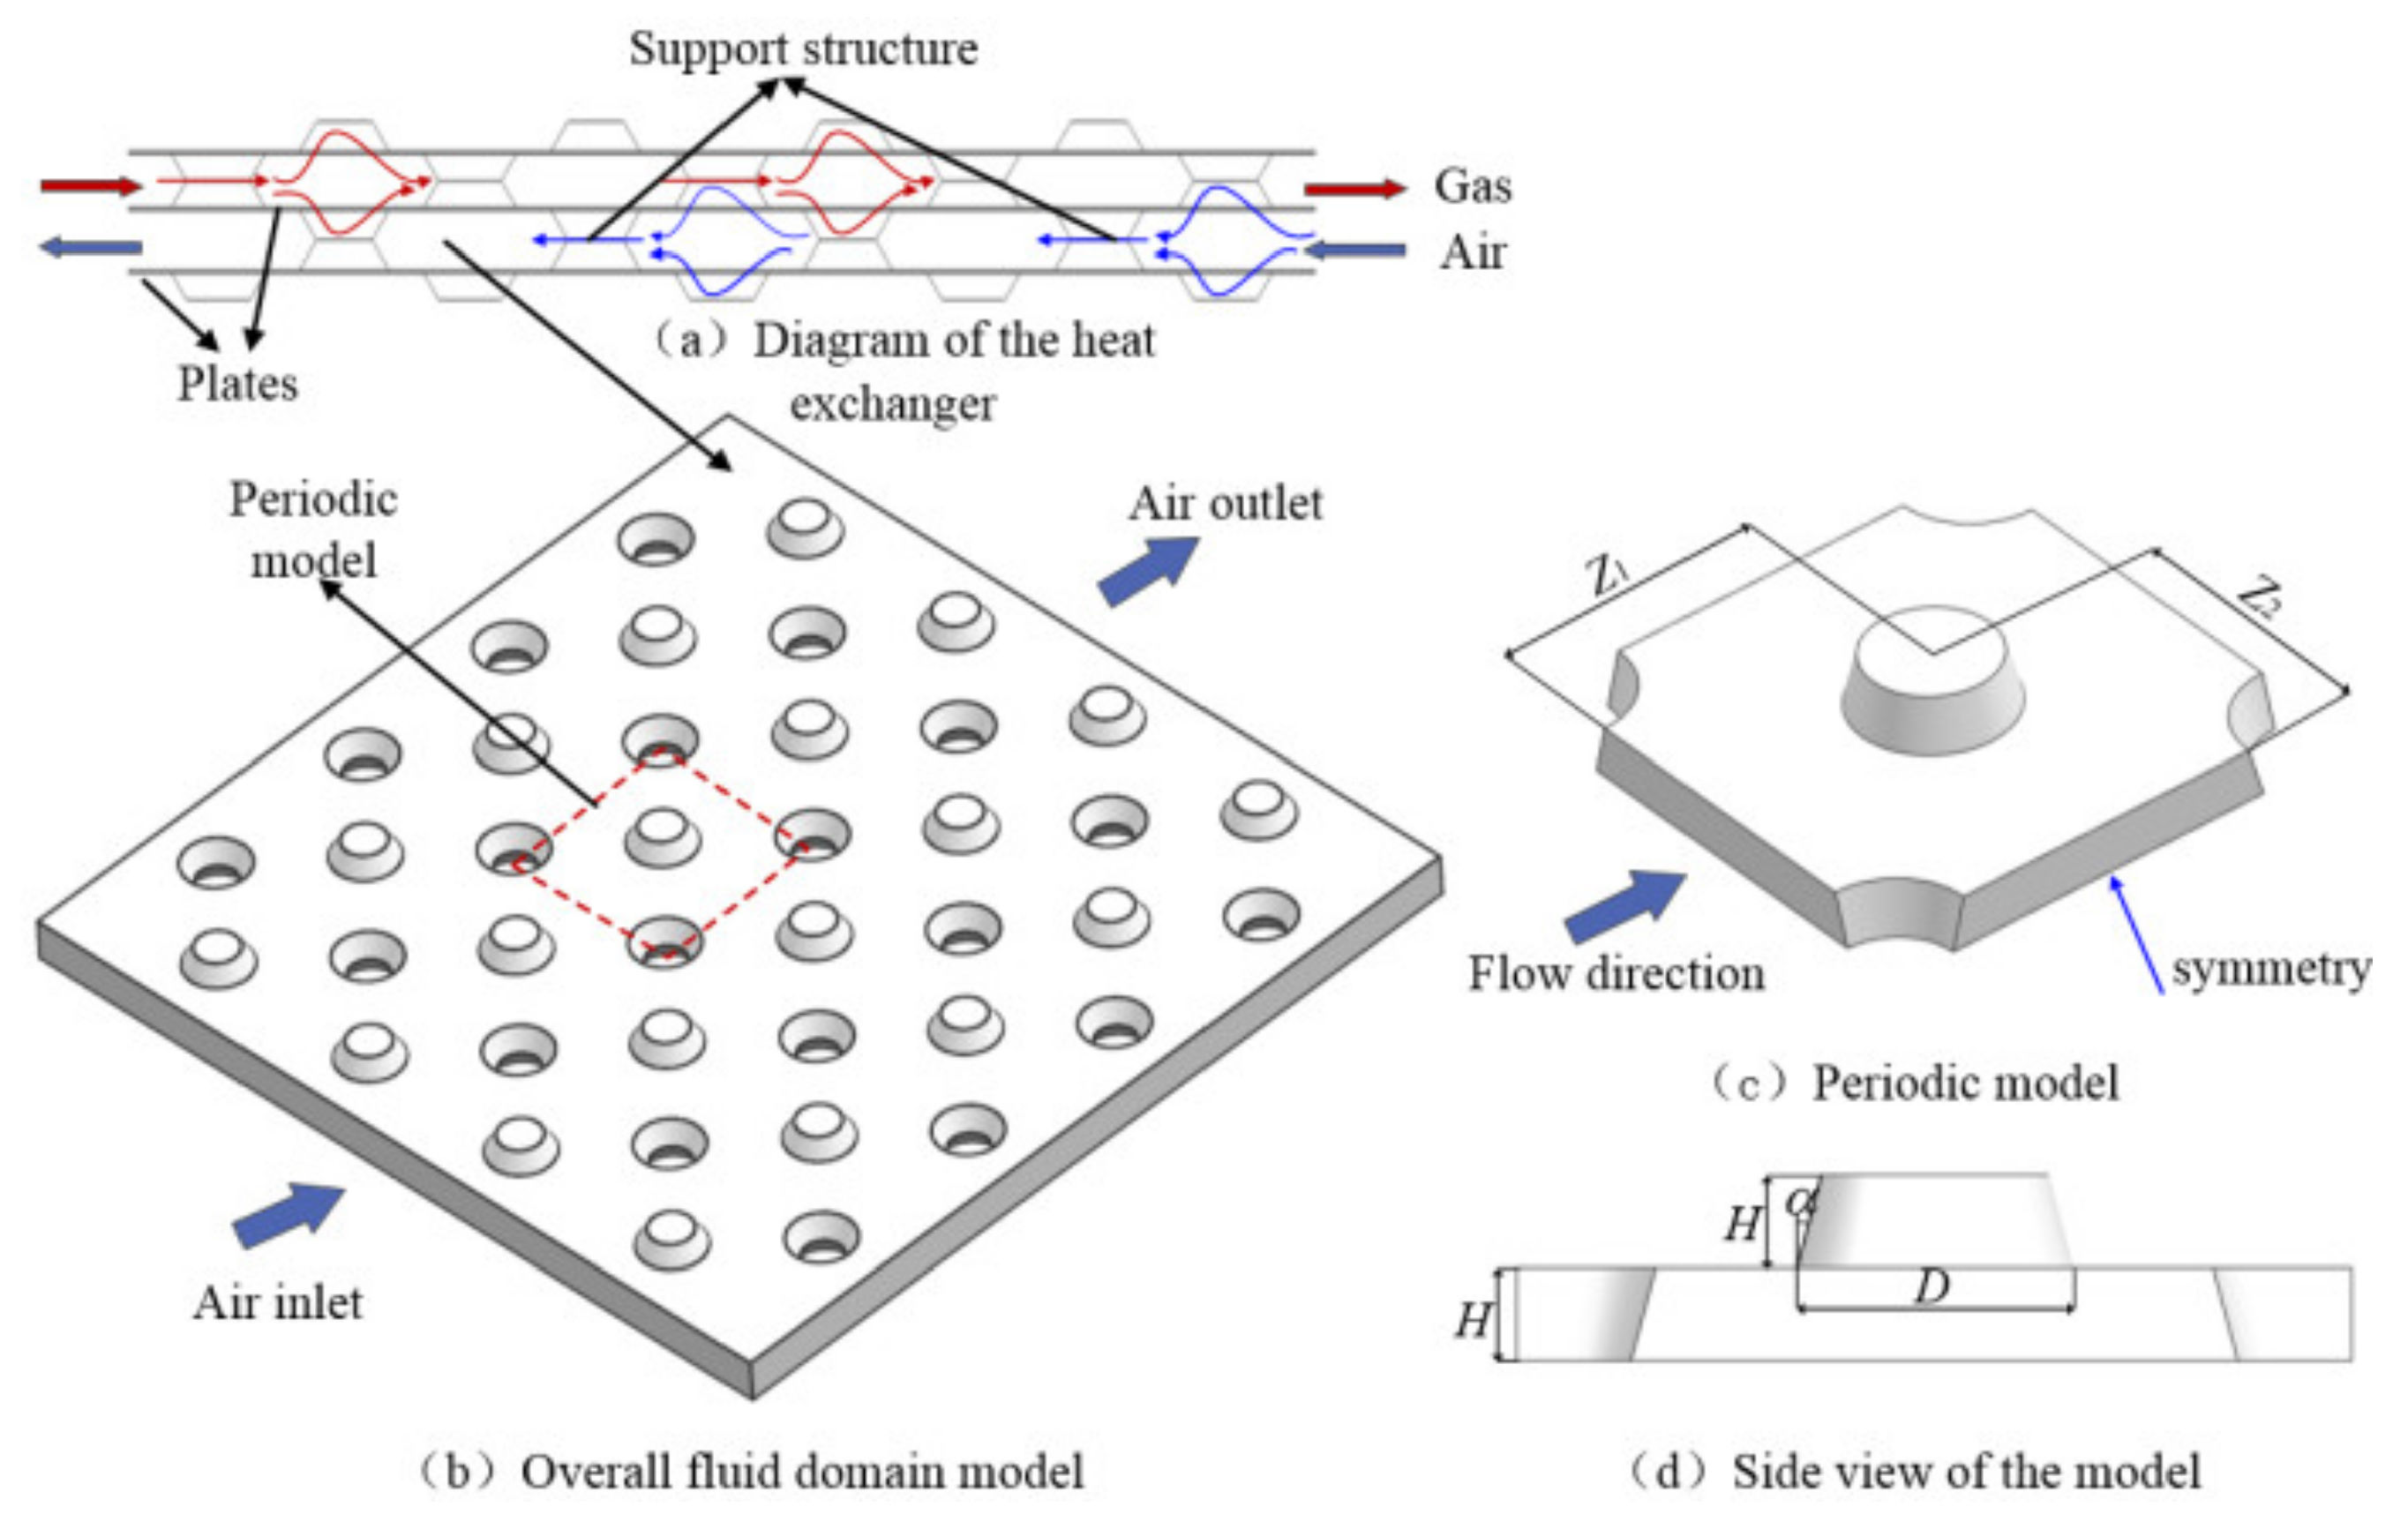
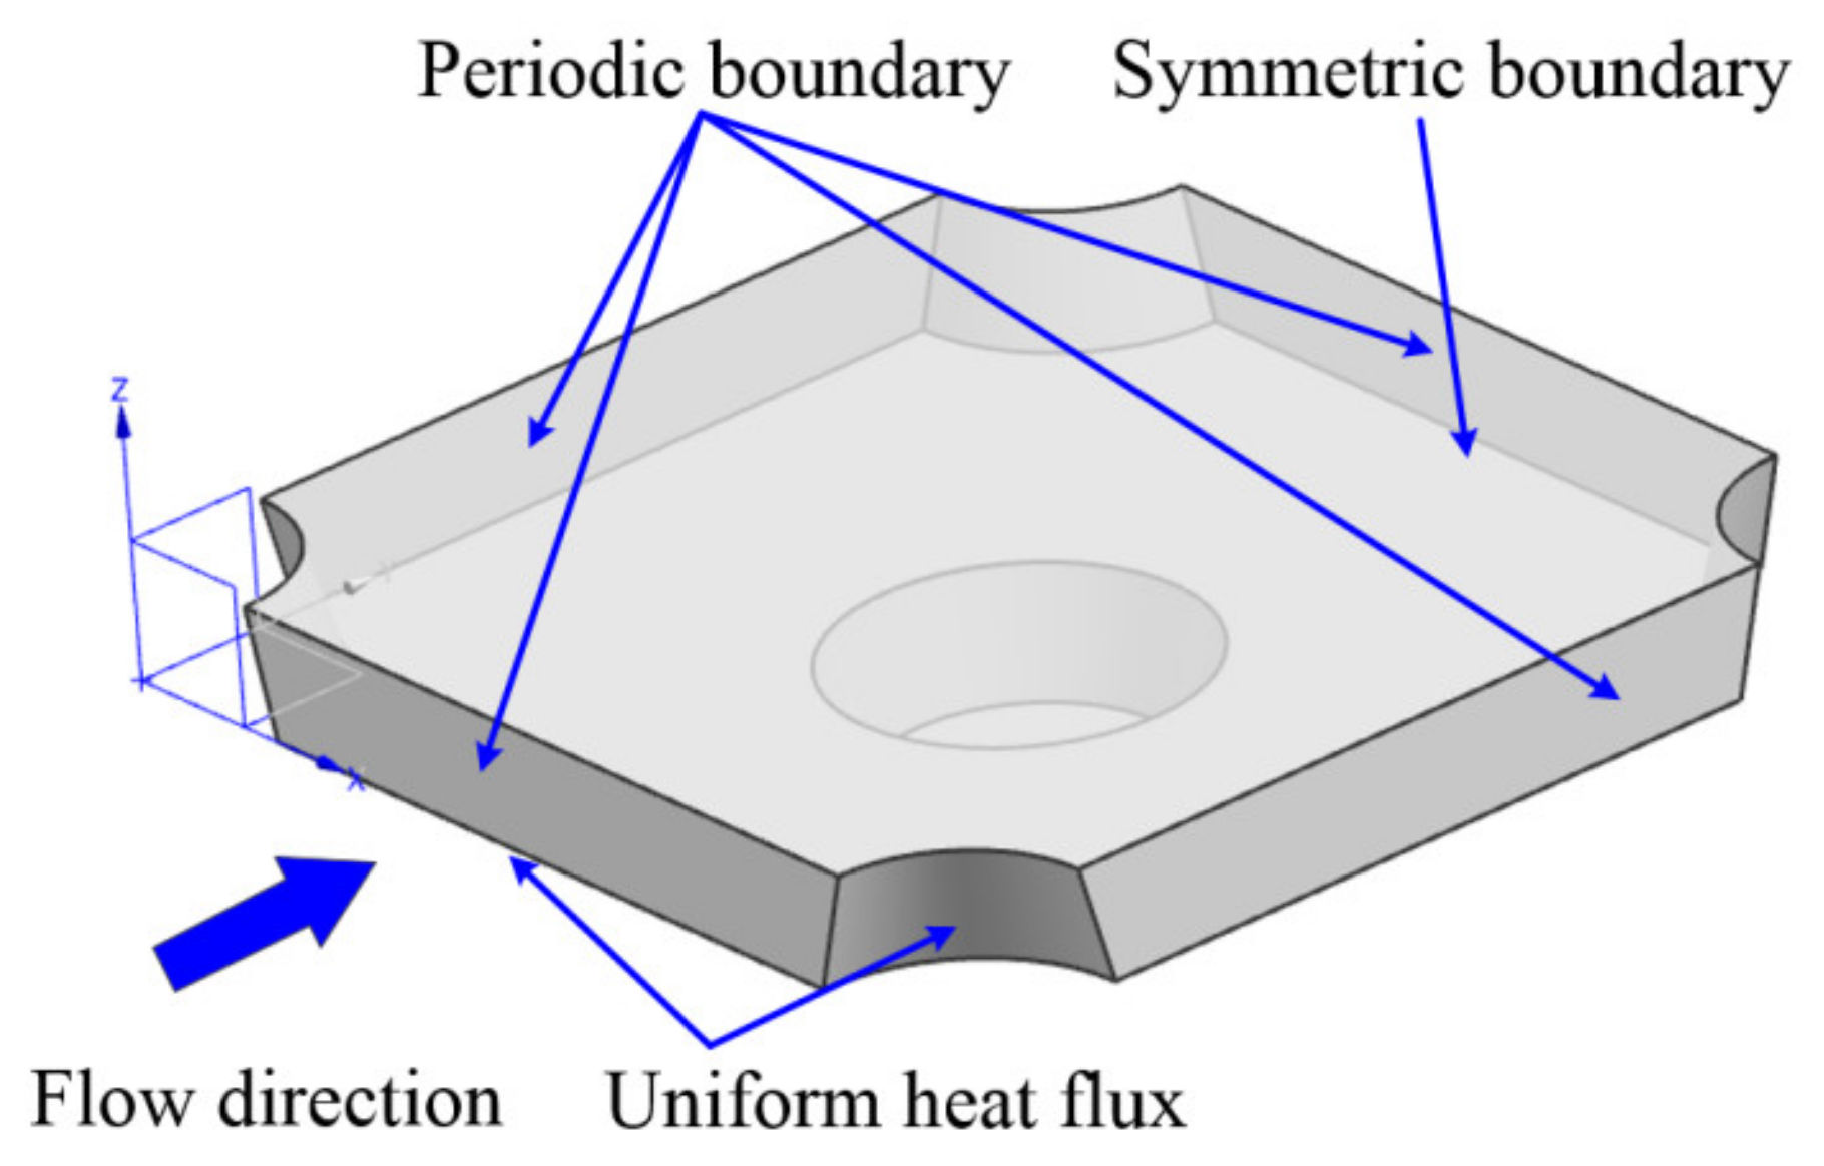
2.1. Physical Model

The research object of the present study is the channel with staggered frustums of a cone proposed by our research group [13], and the purpose is to carry out multi-objective optimization of the channel parameters. Since the thickness of the channel metal plates is only 1 mm, ignoring the thermal conductivity of the plates, the fluid domain is taken out separately for research. After a certain number of frustum of a cone structures, the fluid will develop into a typical periodic convective heat transfer. For convenience, the minimum periodic model of the channel with frustum of a cone was taken out separately for research. Figure 1 shows the physical model of the periodic channel with staggered frustums of a cone, in which Figure 1a is the diagram of the heat exchanger, Figure 1b is the overall fluid domain model, Figure 1c is the periodic model with central symmetry, and Figure 1d is the side view of the periodic model. As can be seen from Figure 1a, the frustums of a cone have the function of supporting the channel. It can also be seen from Figure 1 that the bottom diameter of each frustum of a cone is D, the height is H, the angle is α, the streamwise spacing and spanwise spacing are Z1 and Z2 respectively, and the channel height is 2H.

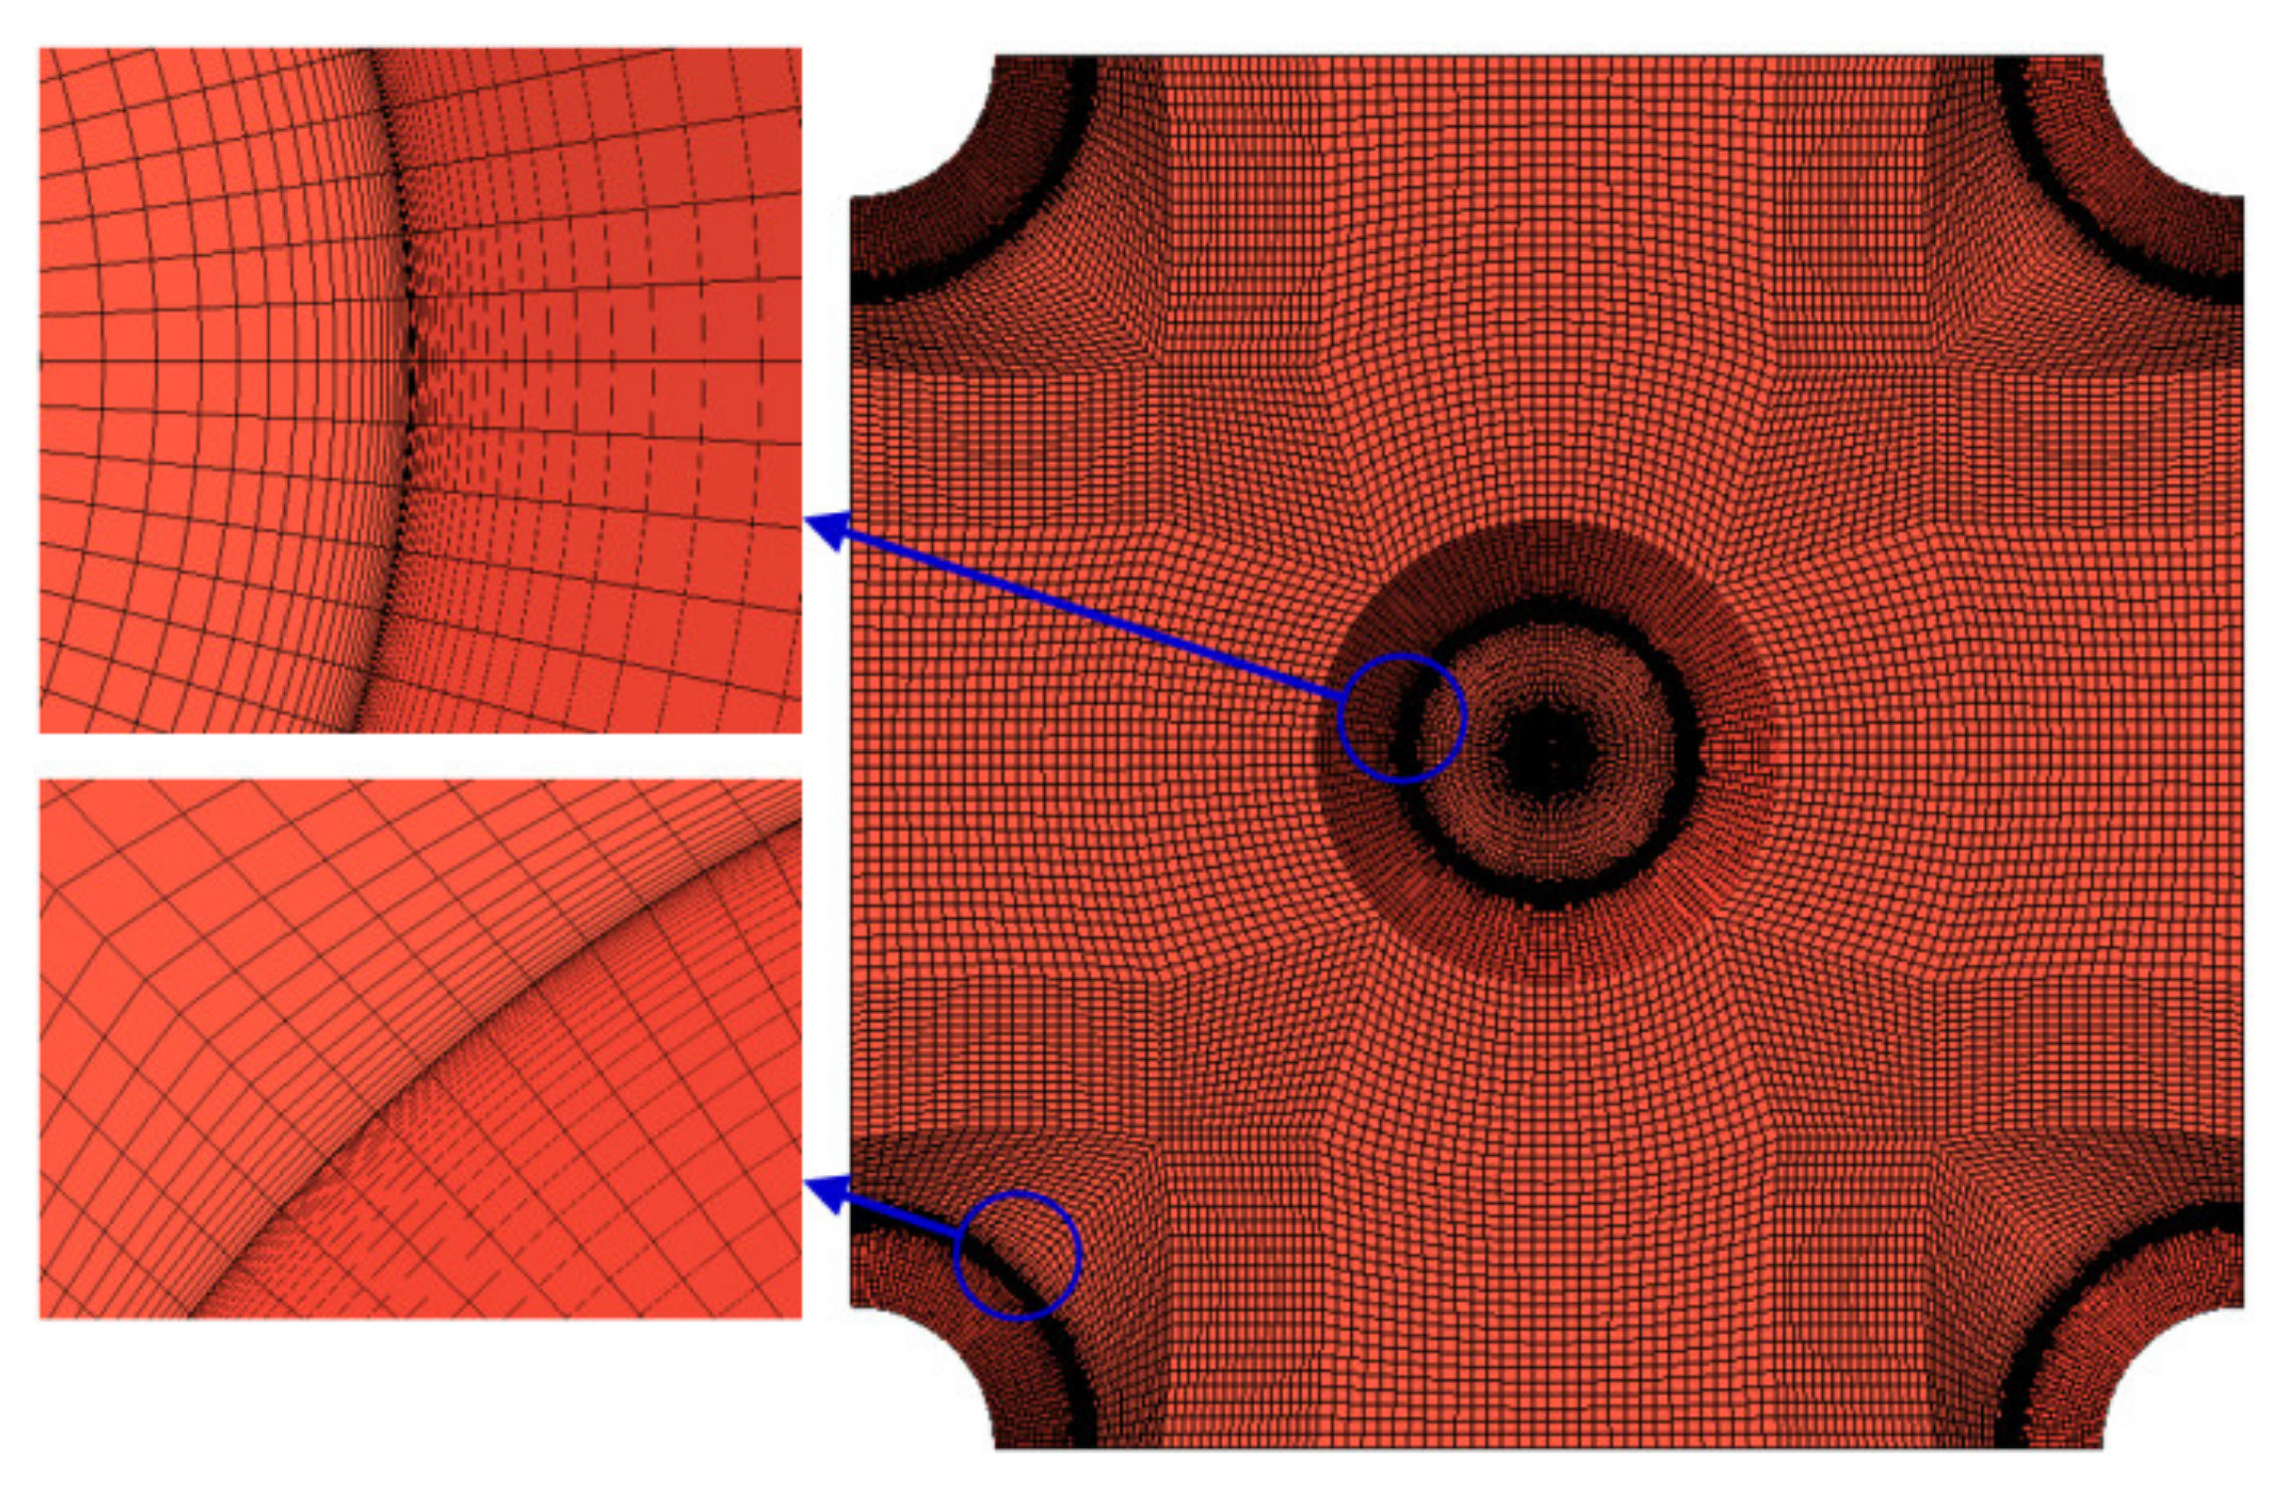
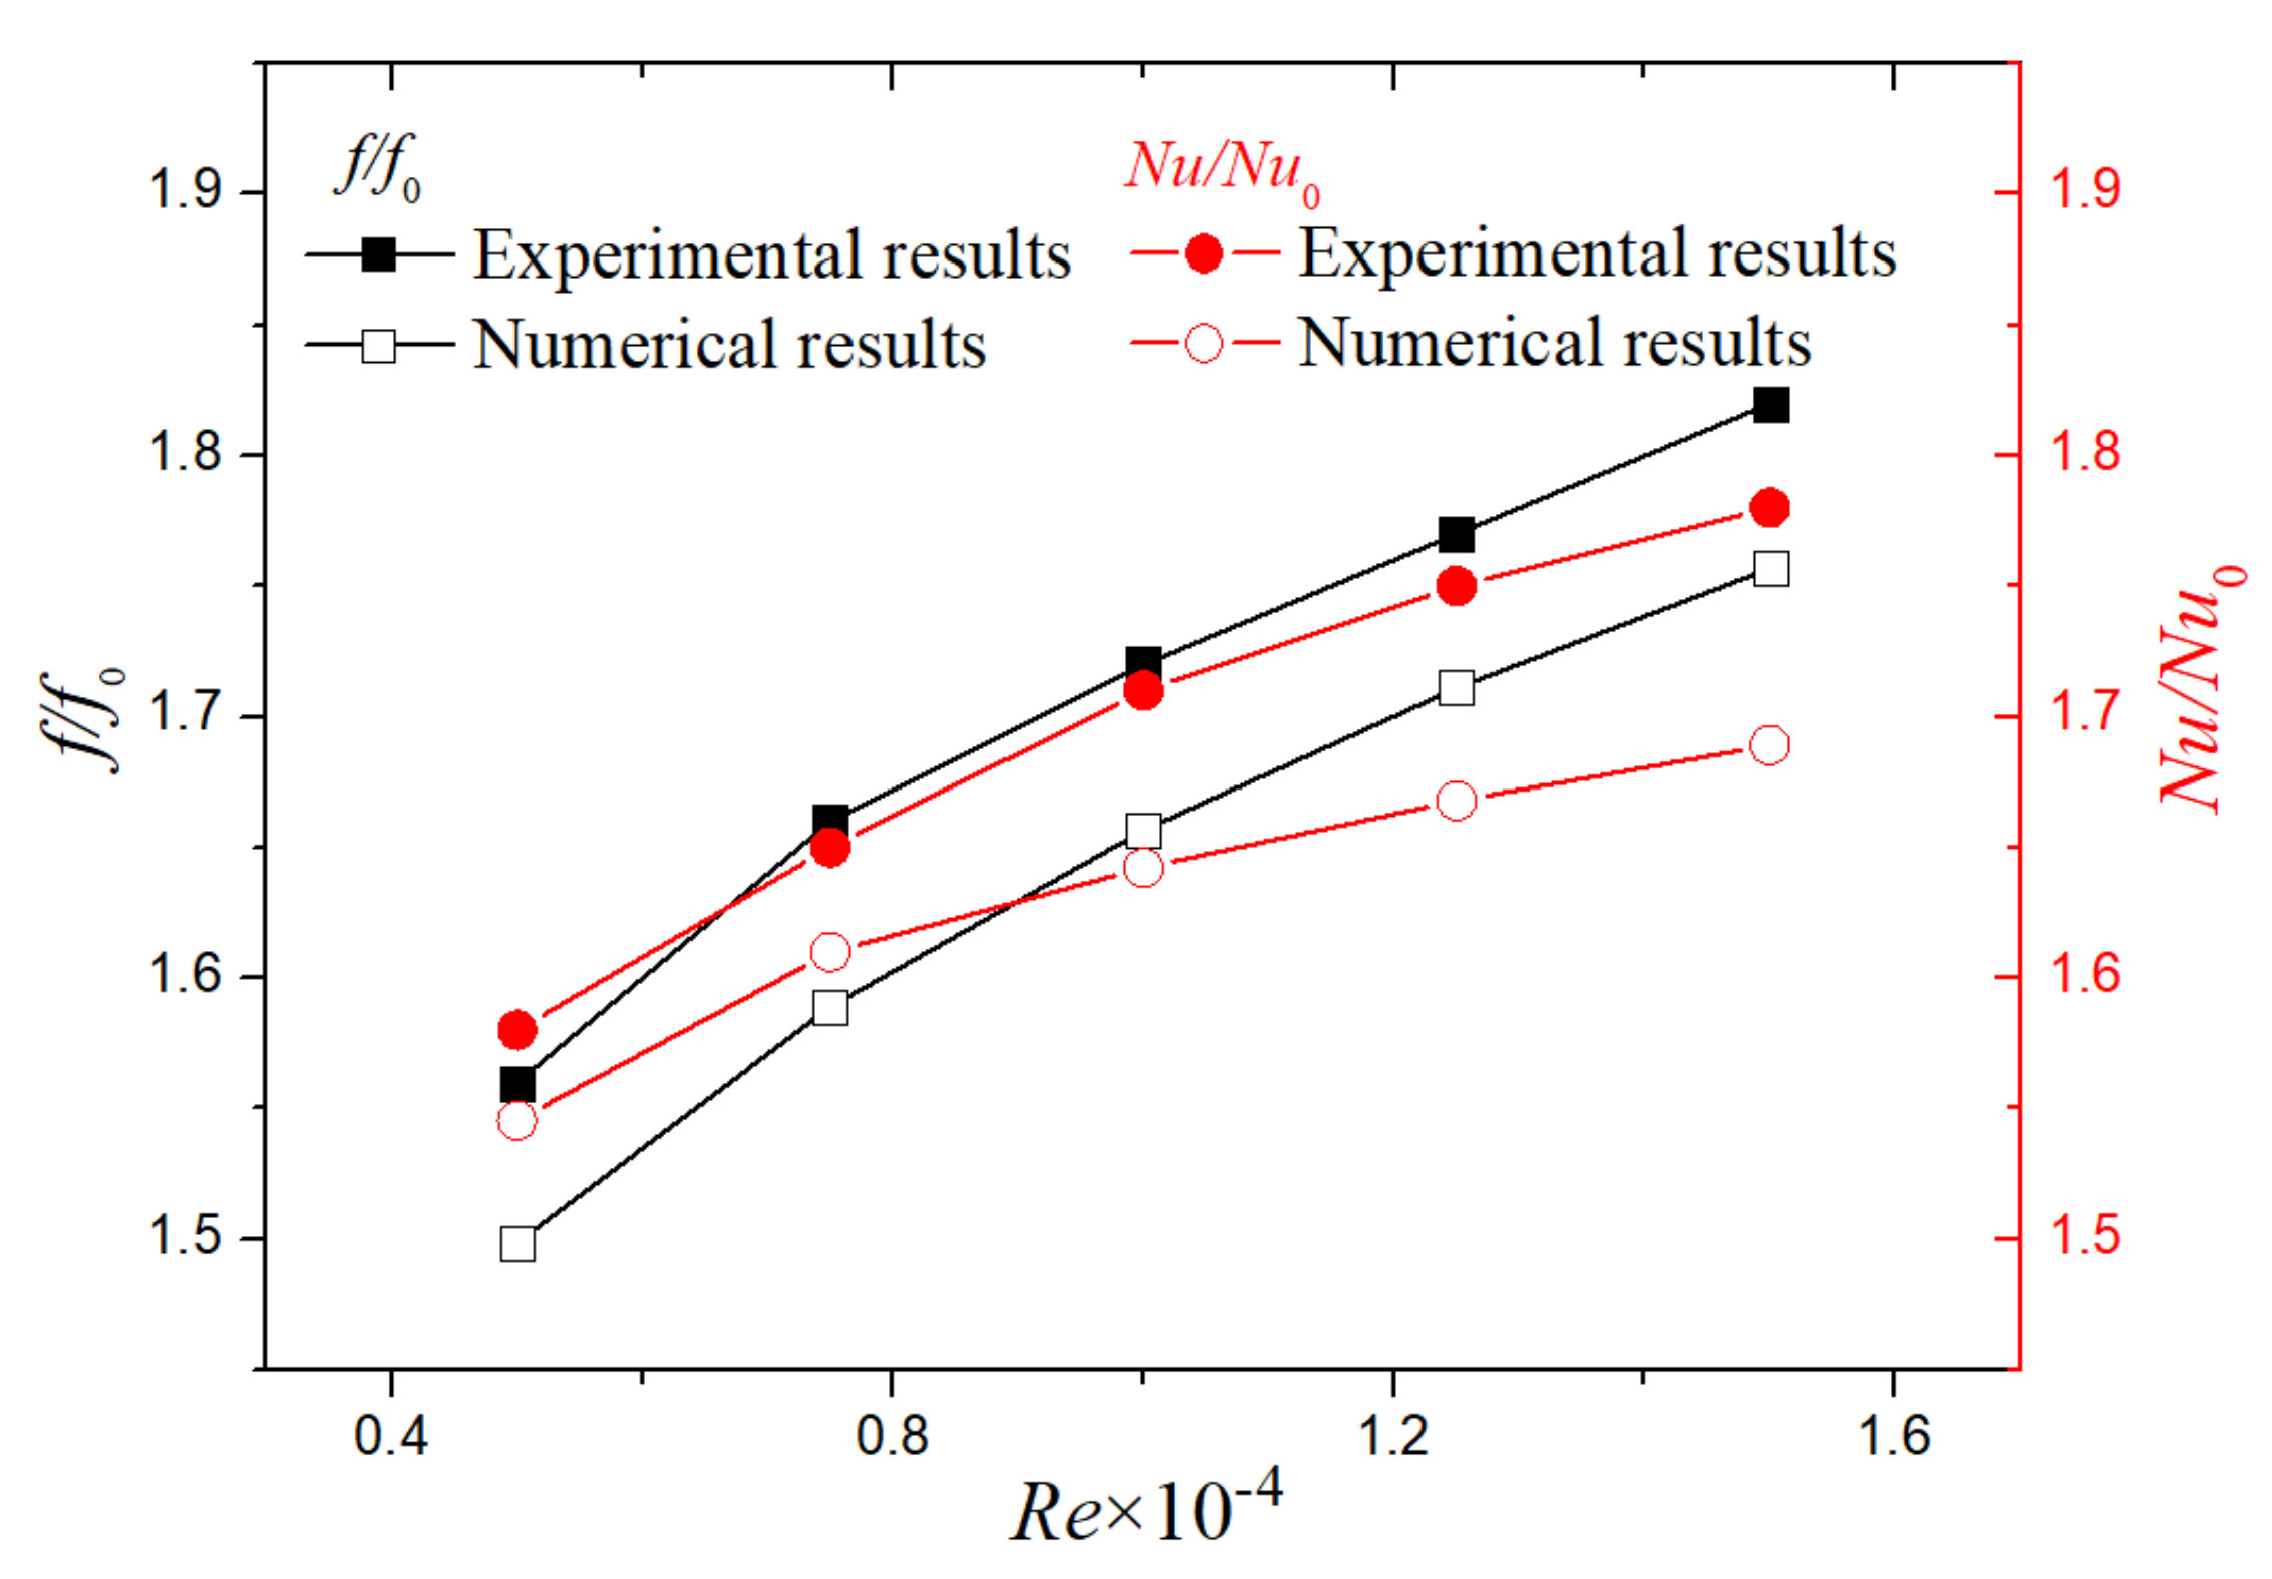
2.2. Numerical Methods

The three-dimensional incompressible Reynolds time-averaged Navier Stokes (N–S) equation is solved by FLUENT software. The expressions of continuity, momentum, and energy equations were introduced in detail in Ref. [14]. References [15,16] reported that the Renormalization Group RNG k-ε turbulence model can better simulate the flow and heat transfer performance of the turbulent channels. Therefore, the RNG k-ε turbulence model was selected to study the performance of the channels with frustum of a cone in this study. In the calculation, the Semi-Implicit Method for Pressure Linked Equation SIMPLEC algorithm was used to solve the velocity and pressure coupling equation, and the discrete format of momentum and energy equation was set as the second-order upwind format. It is required that the energy residual converges to 10−8, and the velocity, continuity, k parameter and ε parameter residuals converge to 10−6. The continuity, momentum and energy Equations are as follows:
x i ( ρ u i ) = 0
x i ( ρ u i u k ) = x i ( η u k x i ) p x k
x i ( ρ u i T ) = x i ( λ c p T x i )
where ρ is the fluid density; u i is the vector velocity; η is the viscosity, p is the pressure; T is the temperature; λ is the thermal conductivity of the fluid; c p is the specific heat capacity at constant pressure; k is the turbulent kinetic energy equation; is the diffusion equation.
The RNG k-ε turbulence model is as follows:
t ρ k + x i ρ k u i = x j α k μ e f f k x j + G k ρ ε
t ρ ε + x i ρ ε u i = x j α ε μ e f f ε x j + C 1 ε ε k G k + C 3 ε G b C 2 ε ρ ε 2 k R ε
where α k and α ε are the inverse effective Prandtl numbers for k and ε , respectively, G k is the generation of turbulence kinetic energy, and μ e f f is the effective viscosity coefficient.
Figure 2 shows the specific calculation model of the channel with frustums of a cone. Referring to the setting of periodic convective heat transfer boundary conditions in reference [17], the inlet and outlet of the channel were set as periodic boundary conditions, and the mass flow was given. The left and right sides of the channel were also set as periodic boundary conditions. Different from Ref. [17], for convenience, the center of the calculation model was set as a symmetric boundary condition in the present study. The lower wall surface of the channel, including the surface of the frustum of a cone, was the heat transfer wall, which was set to a uniform heat flux of 1000 W × m−2. In addition, the average inlet temperature of the air was set to 300 K.
Figure 3 shows the grid diagram of the calculation model. The model was divided into hexahedral structured meshes using ICEM software. The mesh near the wall was encrypted. The grid size of the first layer was 0.02 mm, the grid expansion ratio was 1.2, and the maximum grid size was 1 mm. The value of y+(symbol indicating the sparsity of near wall mesh division) near the wall was less than or equal to 1, and the enhanced wall function was used. Such an arrangement can better obtain the flow and heat transfer information near the wall.
The numerical method in the present study was verified using the experimental data for the channel with frustum of a cone presented in Ref. [13]. Figure 4 shows the comparison of the experimental and numerical results of the Nusselt number ratio and friction coefficient ratio of the channel under different Reynolds numbers. It can be seen from Figure 4 that the distribution trends of the experimental and numerical results are basically consistent. Through calculation, the maximum deviation of the Nusselt number ratio is 5.1%, and the maximum deviation of the friction coefficient ratio is 4.3%. These demonstrate the accuracy and feasibility of the numerical method in the present study. Therefore, this numerical method was used in the subsequent numerical studies of the channels with different frustum of a cone structures. In addition, the grid independence of the calculation model was verified. Five sets of grids were divided for the calculation model; when meshing, set the grid size of the first layer to 0.02 mm, and change the number of grids by changing the grid growth ratio (1.5–1.1) and the maximum grid size (0.8 mm–0.4 mm). The total numbers of grids were 75,000, 150,000, 300,000, 600,000 and 1,200,000, respectively. When the number of the grid was 600,000, the deviations of the Nusselt number ratio and friction coefficient ratio of the channel were less than 2%, indicating that the grid met the requirement of independence. The mesh generation strategy mentioned above was adopted in the subsequent calculation models.

2.3. Data Reduction

Reynolds number Re is defined as
R e = V P / ν
where V is the average inlet velocity of airflow; P is the characteristic length, and the height of the channel is selected in the present study; ν is the kinematic viscosity of air.
The local Nusselt number N u x is defined as
N u x = q x P / [ λ T w T f ]
where q x is the local heat flux; λ is the thermal conductivity of air flow; T w is the local temperature of the wall; T f is the reference temperature, and its value is the average temperature of inlet and outlet airflow.
The average Nusselt number N u is defined as
N u = N u x d A / A
where A is the area of the heat transfer wall.
The friction coefficient f is defined as
f = Δ p P / ( 2 ρ L V 2 )
where L is the channel length, Δ p is the pressure drop at the inlet and outlet of the channel; ρ is the air density.
N u 0 and f 0 are the average Nusselt number and friction coefficient of smooth parallel plate channel, respectively [18], and the calculation formulas are as follows:
N u 0 = ( f 0 / 2 ) ( R e 500 ) P r 1 + 12.7 ( f 0 / 2 ) 1 / 2 ( P r 2 / 3 1 )
f 0 = ( 1.58 ln R e 2.185 ) 2

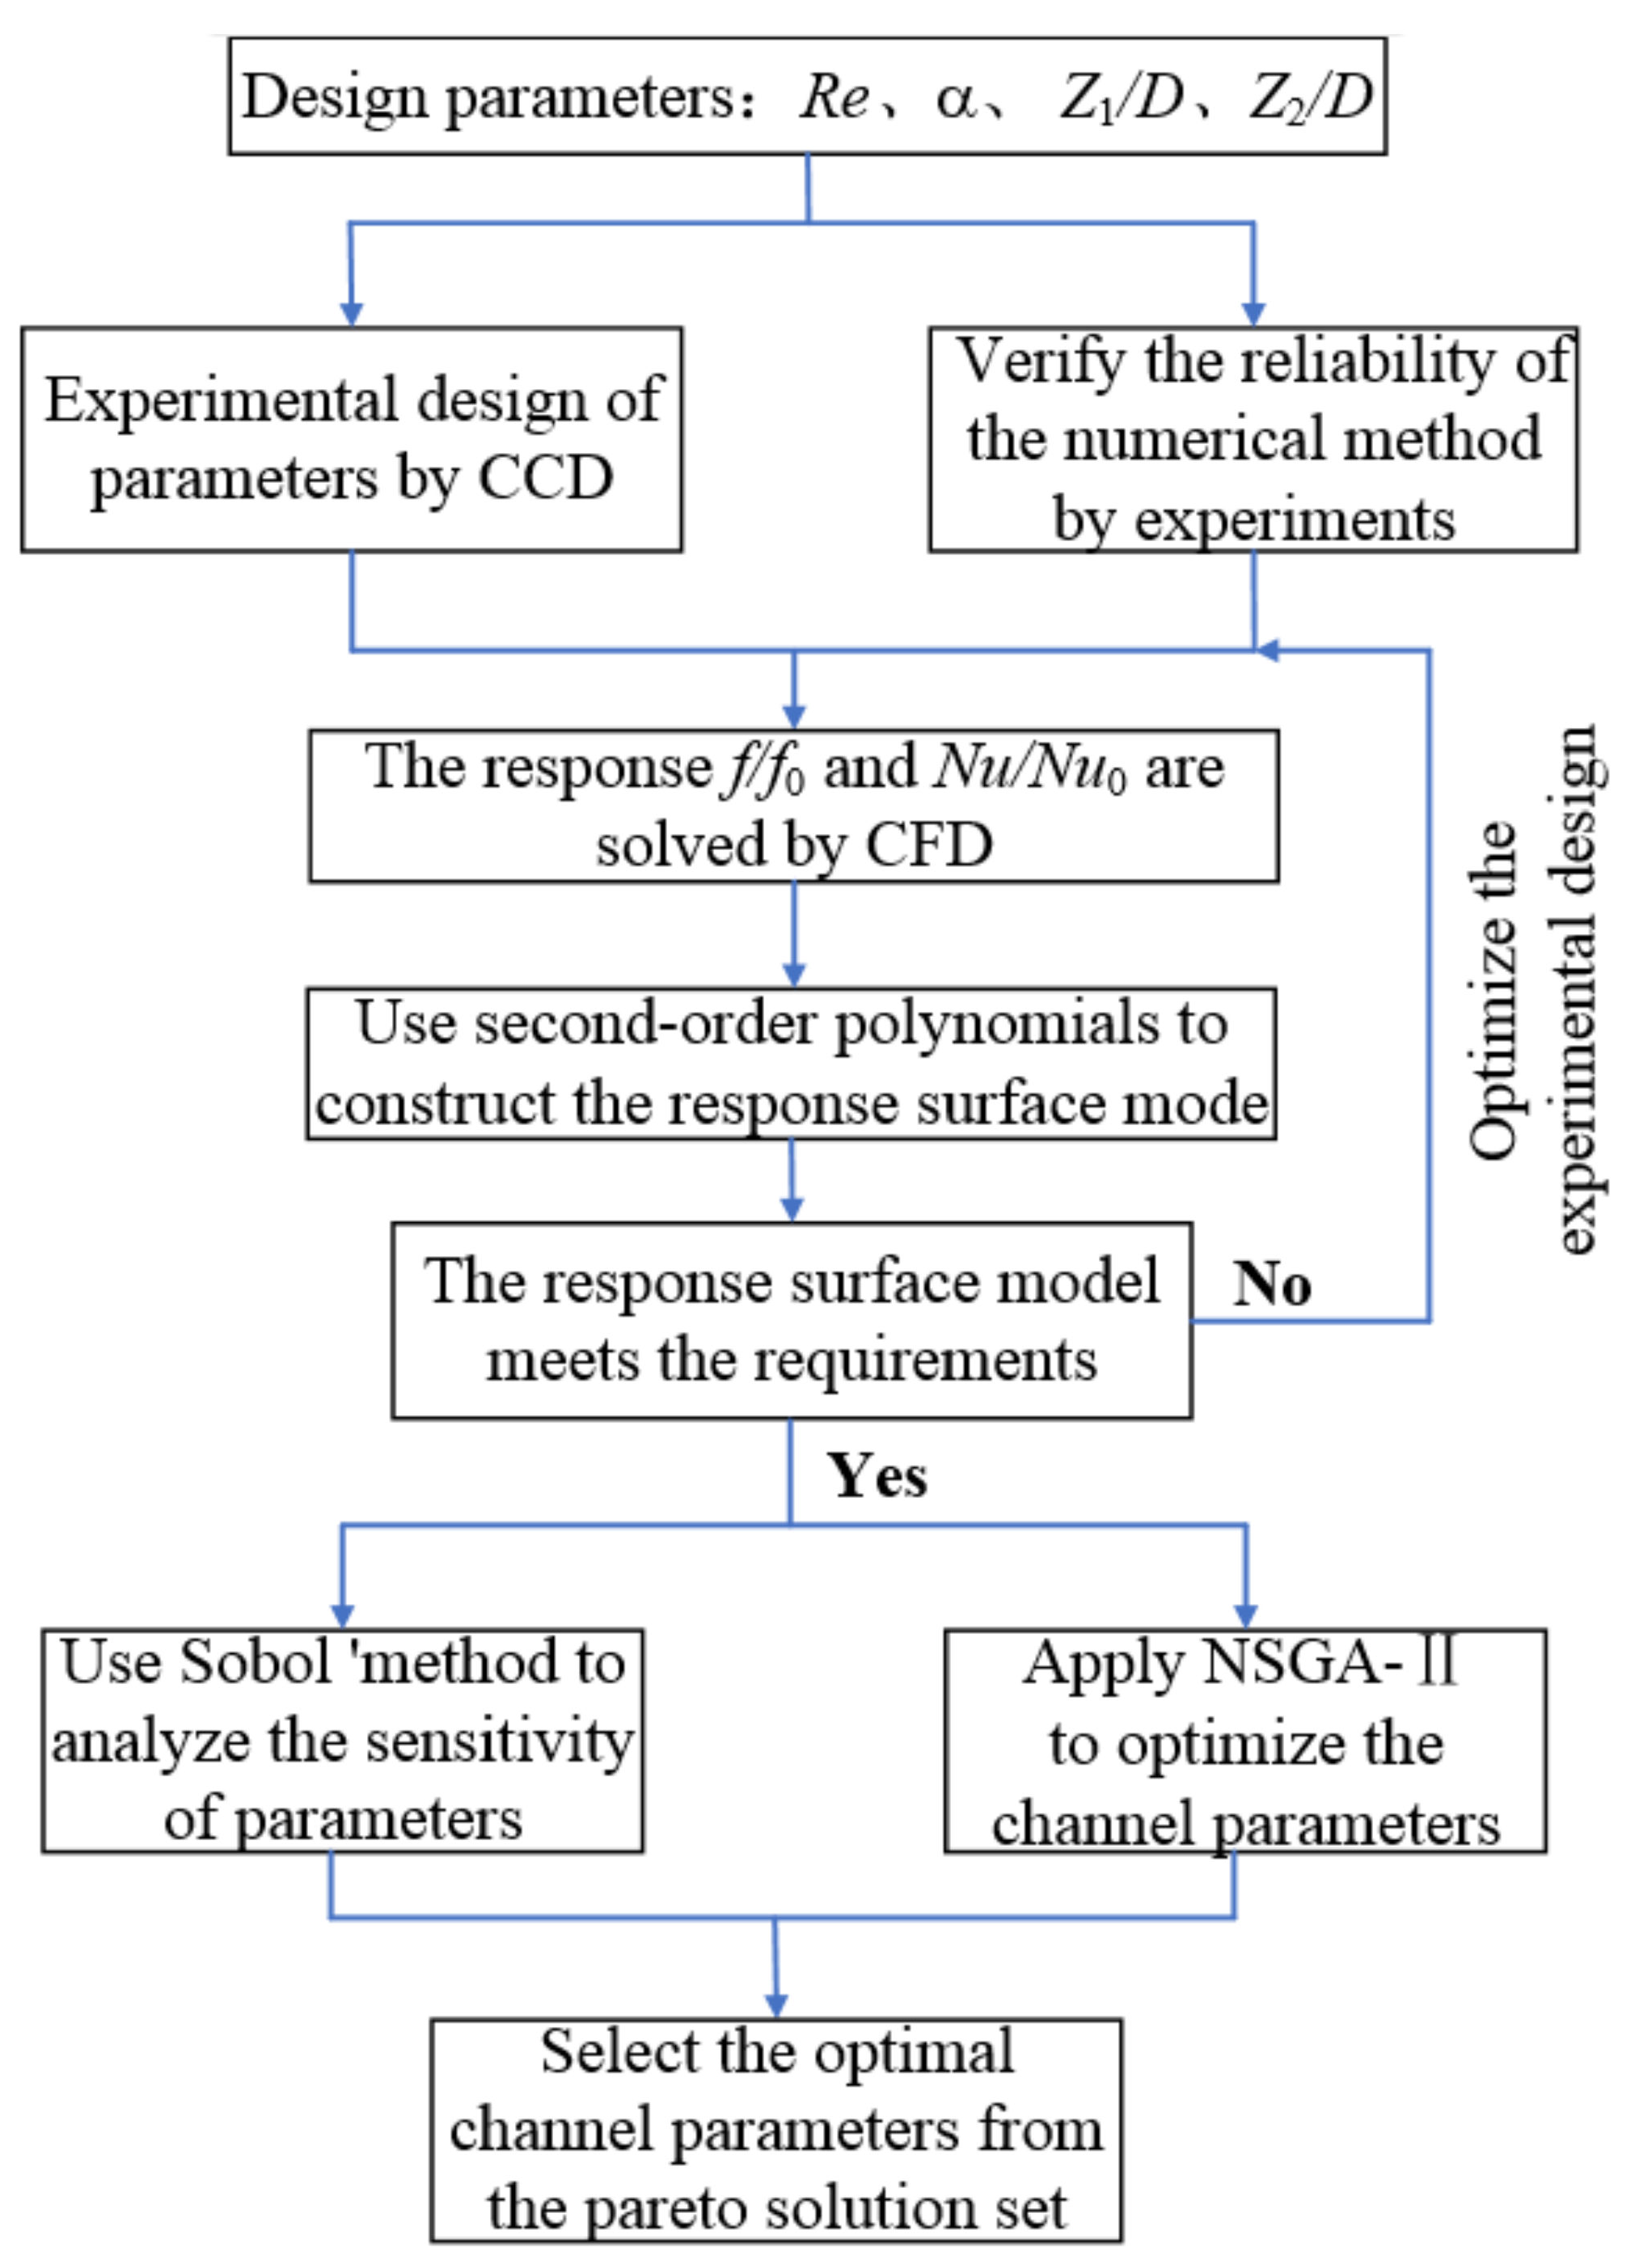
3. Optimization Methods

3.1. Response Surface Methodology and Experimental Design

Response Surface Methodology (RSM) can be used to obtain explicit functional relationships between design variables and responses in the global scope by testing local design points. The optimal combination of design variables can be obtained through RSM to achieve the optimal target response. The relationship between system response and design variable is as follows:
Y = f ( X ) + ε = X β + ε
where Y is the response, X is the design variable, f ( X ) is the approximate function of the target, β is the fitting coefficient, and ε is the prediction error.
The formula for the sum of squares of system residuals is as follows:
S S E ( β ) = ( X β Y ) T ( X β Y )
Through the principle of the least square method, calculate the derivative of function S S E ( β ) with respect to vector β and set it to zero. We can draw:
β S S E ( β ) = 2 X T ( X β Y ) = 0
After finishing Equation (9), the coefficient β of the response surface with minimum sum of squares of residuals can be obtained:
β = ( X T X ) 1 X T Y
The commonly used second-order polynomial response surface model with high accuracy was selected as the approximate function f ( x ) , and the formula is as follows:
f ( x ) = β 0 + i = 1 k β i x i + i = 1 k β i i x i 2 + i = 1 k 1 i < j k β i j x i x j
where coefficient β = [ β 0 ,…, β k , β 11,…, β k k , β 12,…, β × ( k 1 ) k ] T ; x i and x j are the design variables; k is the number of design variables.
To evaluate the fitting accuracy of the obtained response surface model to the test data, the root mean square error ( R M S E ) and determination coefficient ( R 2 ) were selected to evaluate the response surface model. The specific expression of the evaluation index is shown in Ref. [19]. If R M S E is closer to 0, the error of the response surface model is smaller. If R2 is closer to 1, the accuracy of the response surface model is higher. R M S E and R 2 are calculated as follows:
R M S E = 1 k y ¯ i = 1 k y i y i ˜ 2
R 2 = 1 i = 1 k y i y i ˜ 2 i = 1 k y i y ¯ 2
where k is the number of sample points, y i is the test result of the ith sample, y ¯ is the average of the test results of all samples, and y i is the calculated value of the response surface model of the ith sample.
The fitting accuracy of the response surface model also depends on the selection of design sample points, so it is necessary to carry out experimental design for design variables. The design variables in the present study are the channel parameters. For convenience of research, frustum of a cone structures with a constant height and bottom diameter were selected, in which the height H was 10 mm and the bottom diameter D was 30 mm. The optimal channel parameter configurations were obtained by changing Reynolds number Re, frustum of a cone angle α, streamwise spacing Z1 and spanwise spacing Z2. During the study, the streamwise spacing Z1 and spanwise spacing Z2 were dimensionless variables treated as Z1/D, and Z2/D. The variation ranges of the design parameters are shown in Table 1.
Central composite face-centered design (CCF) is one kind of central composite design (CCD) that can fit the complete quadratic model and obtain the response surface model with high precision through fewer test points. Therefore, CCF was selected for experimental design in the present study. Table 2 shows the central composite face-centered design table, mainly including order, design variables, and responses. Since there are four design variables, 24(16)cubic points, 2 × 4(8)axial points and one center point can be obtained using CCF design, so there are 25 sample points in total.

3.2. Parameter Sensitivity Analysis Based on Sobol’s method

Many factors affect the flow and heat transfer performance of channels with frustums of a cone, including Reynolds number, frustum of a cone angle, streamwise spacing, and spanwise spacing. Therefore, exploring the impact of the changes of these parameters on the channel performance is of great help to the subsequent parameter optimization. Compared with the local sensitivity analysis method for linear models, the global sensitivity analysis method is suitable for nonlinear complex models. Sobol’s method based on variance is a global sensitivity analysis method proposed by the mathematician Sobol [20]. Compared with other global sensitivity analysis methods, Sobol’s method can quantitatively analyze the impact of input variables on system output. Its outstanding advantage is that it has no special requirements for analysis function and has a wide range of applications [21].
The core idea of Sobol’s method is to decompose the model into a single parameter and functions composed of parameters. The basic principle of Sobol’s method can be seen in Ref. [22]. Assuming that x = [ x 1 , , x m ] is an independent input variable defined on I m , then I m can be expressed as:
I m = ( x 0 x i t 1 ; i t = 1 , 2 , , m )
Assuming that the model F ( x ) is a square-integrable function, it can be decomposed into the sum of 2 m sub-functions:
F ( x ) = F 0 + t = 1 m i 1 < < i t m F i 1 i t ( x i 1 , , x i t )
where 1 = i 1 <…< i t …< i m = m , m is the number of variables and F 0 is a constant.
If the conditions are met, it can be obtained:
0 1 F i 1 i t ( x i 1 , , x i t ) d x i n = 0 , 1     n   t
The total variance M and partial square deviation M i 1 i t of the F ( x ) can be obtained by integrating the squares of Equation (20):
M = t = 1 m i 1 < < i t m M i 1 i t
M i 1 i t = F i 1 i t 2 d x i 1 d x i t
According to the definition, the sensitivity index of the variable S i 1 i t is defined as:
S i 1 i t = D i 1 i t D
Then, the sum of sensitivity indexes of all variables is 1. It can be expressed as follows:
t = 1 m i 1 < < i t m S i 1 i t = 1
Equation (25) can be rewritten as follows:
t = 1 m S i t + 1 q < t m S i q i t + + S i 1 i m = 1
According to the definition, the total sensitivity index of an input variable S T i t is:
S T i t = S i t + q t m S i q i t + + S i 1 i m
where S i t is the first-order sensitivity index, which represents the impact of input variable x i t on system output; the second-order sensitivity index S i q i t represents the influence of the interaction between input variable S i q and variable S i t on the system output. The total sensitivity index S T i t indicates the common influence of input variable S i t and its interaction with other input variables on system output. When the first-order sensitivity index of the input variable S i t is quite different from the total sensitivity index, it indicates that the interaction between the variable S i t and other input variables has a great influence on the system output.

3.3. Optimization Process of the Channel with Frustums of a Cone

Figure 5 shows the flow chart for the parameter optimization of the channel with frustums of a cone. As can be seen from Figure 5, the present study optimizes the four design parameters of the channel with frustums of a cone, including Reynolds number Re, frustum of a cone angle α, streamwise spacing ratio Z1/D, and spanwise spacing ratio Z2/D. CCF was used for the experimental design of design parameters, and 25 sample points were obtained. The reliability of the numerical method in the present study was verified by the experimental data. Then, 25 sample points were numerically simulated by CFD to obtain the responses (the Nu/Nu0 and f/f0 of the channels). On this basis, the response surface models were constructed by the second-order polynomial. Root mean square error (RMSE) and determination coefficient (R2) were selected to evaluate the response surface models. If the models did not meet the requirements, the experimental design of the parameters was optimized, and the simulation was run again according to the above procedure. Then, based on the response surface model, Sobol’s method was used to analyze the sensitivity of the parameters. Aiming at achieving minimum f/f0 and maximum Nu/Nu0 in the channels, NSGA-II was used to carry out the multi-objective optimization of the parameters. Finally, the optimized channels were selected from the Pareto solution set.
Genetic algorithm (GA) is a family of global optimization algorithms that simulate natural selection and the genetic mechanism based on biological evolution. Among them, the non-dominated sorting genetic algorithm with elite strategy (NSGA-II) was proposed by Deb based on the non-dominated sorting genetic algorithm (NSGA). It has the advantages of low computational complexity, fast running speed, and good convergence of solution set [23]. It is worth noting that the multi-objective optimization algorithm does not have a unique global optimal solution, but a set of optimal solutions, namely the Pareto solution set. In practical application, one or more solutions can be selected from the Pareto solution set as the final result.

4. Results Analysis and Discussion

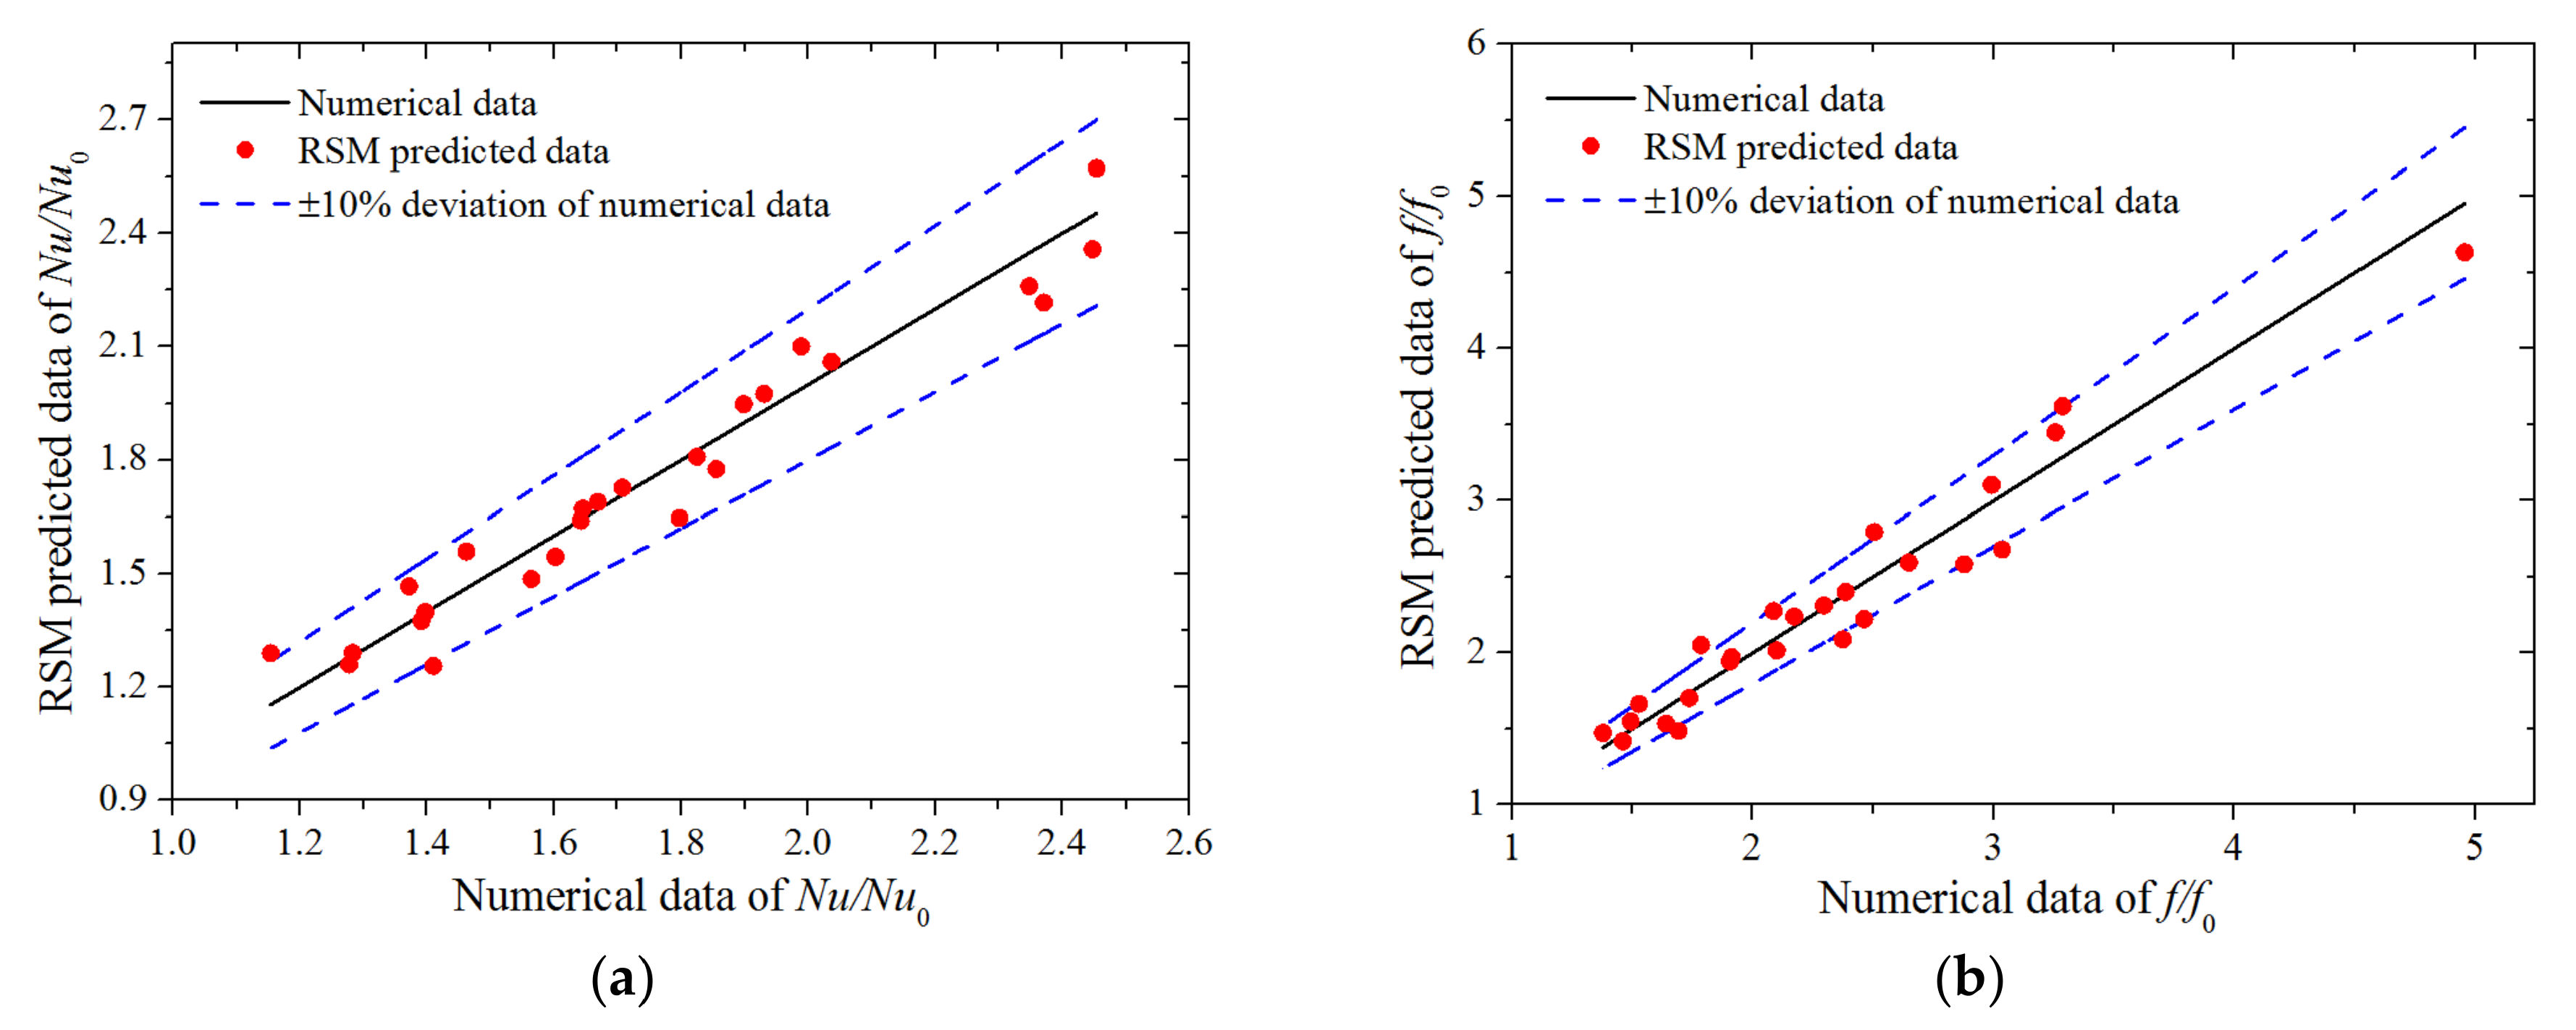
4.1. Construction of Response Surface Model

The second-order polynomial response surface model was obtained based on CCF fitting. The specific test design table is shown in Table 2. The design parameters were Re, α, Z1/D and Z2/D, and the responses were Nu/Nu0 and f/f0. The coefficients of the response surface model are given in Table 3.
Figure 6 shows the comparison between the numerically calculated values of the sample points of the experimental design and the corresponding RSM predicted values. In the figure, the dotted line represents a deviation of ± 10% from the numerical calculation values, the straight line represents the numerical calculation values, and the scattered points represent the RSM prediction values. Figure 6a,b presents a comparison of the values when the responses are Nu/Nu0 and f/f0, respectively. It can be seen from Figure 6 that the RSM predicted values are distributed near the numerically calculated values, and the errors are basically less than 10%. After calculation, the root mean square error RMSE and determination coefficient R2 of the response surface model can be obtained. The calculation results are shown in Table 4. When the responses are Nu/Nu0 and f/f0, the RMSE of the models is less than 0.25 and R2 is greater than 0.93, showing that the fitted response surface model has small error and high accuracy.

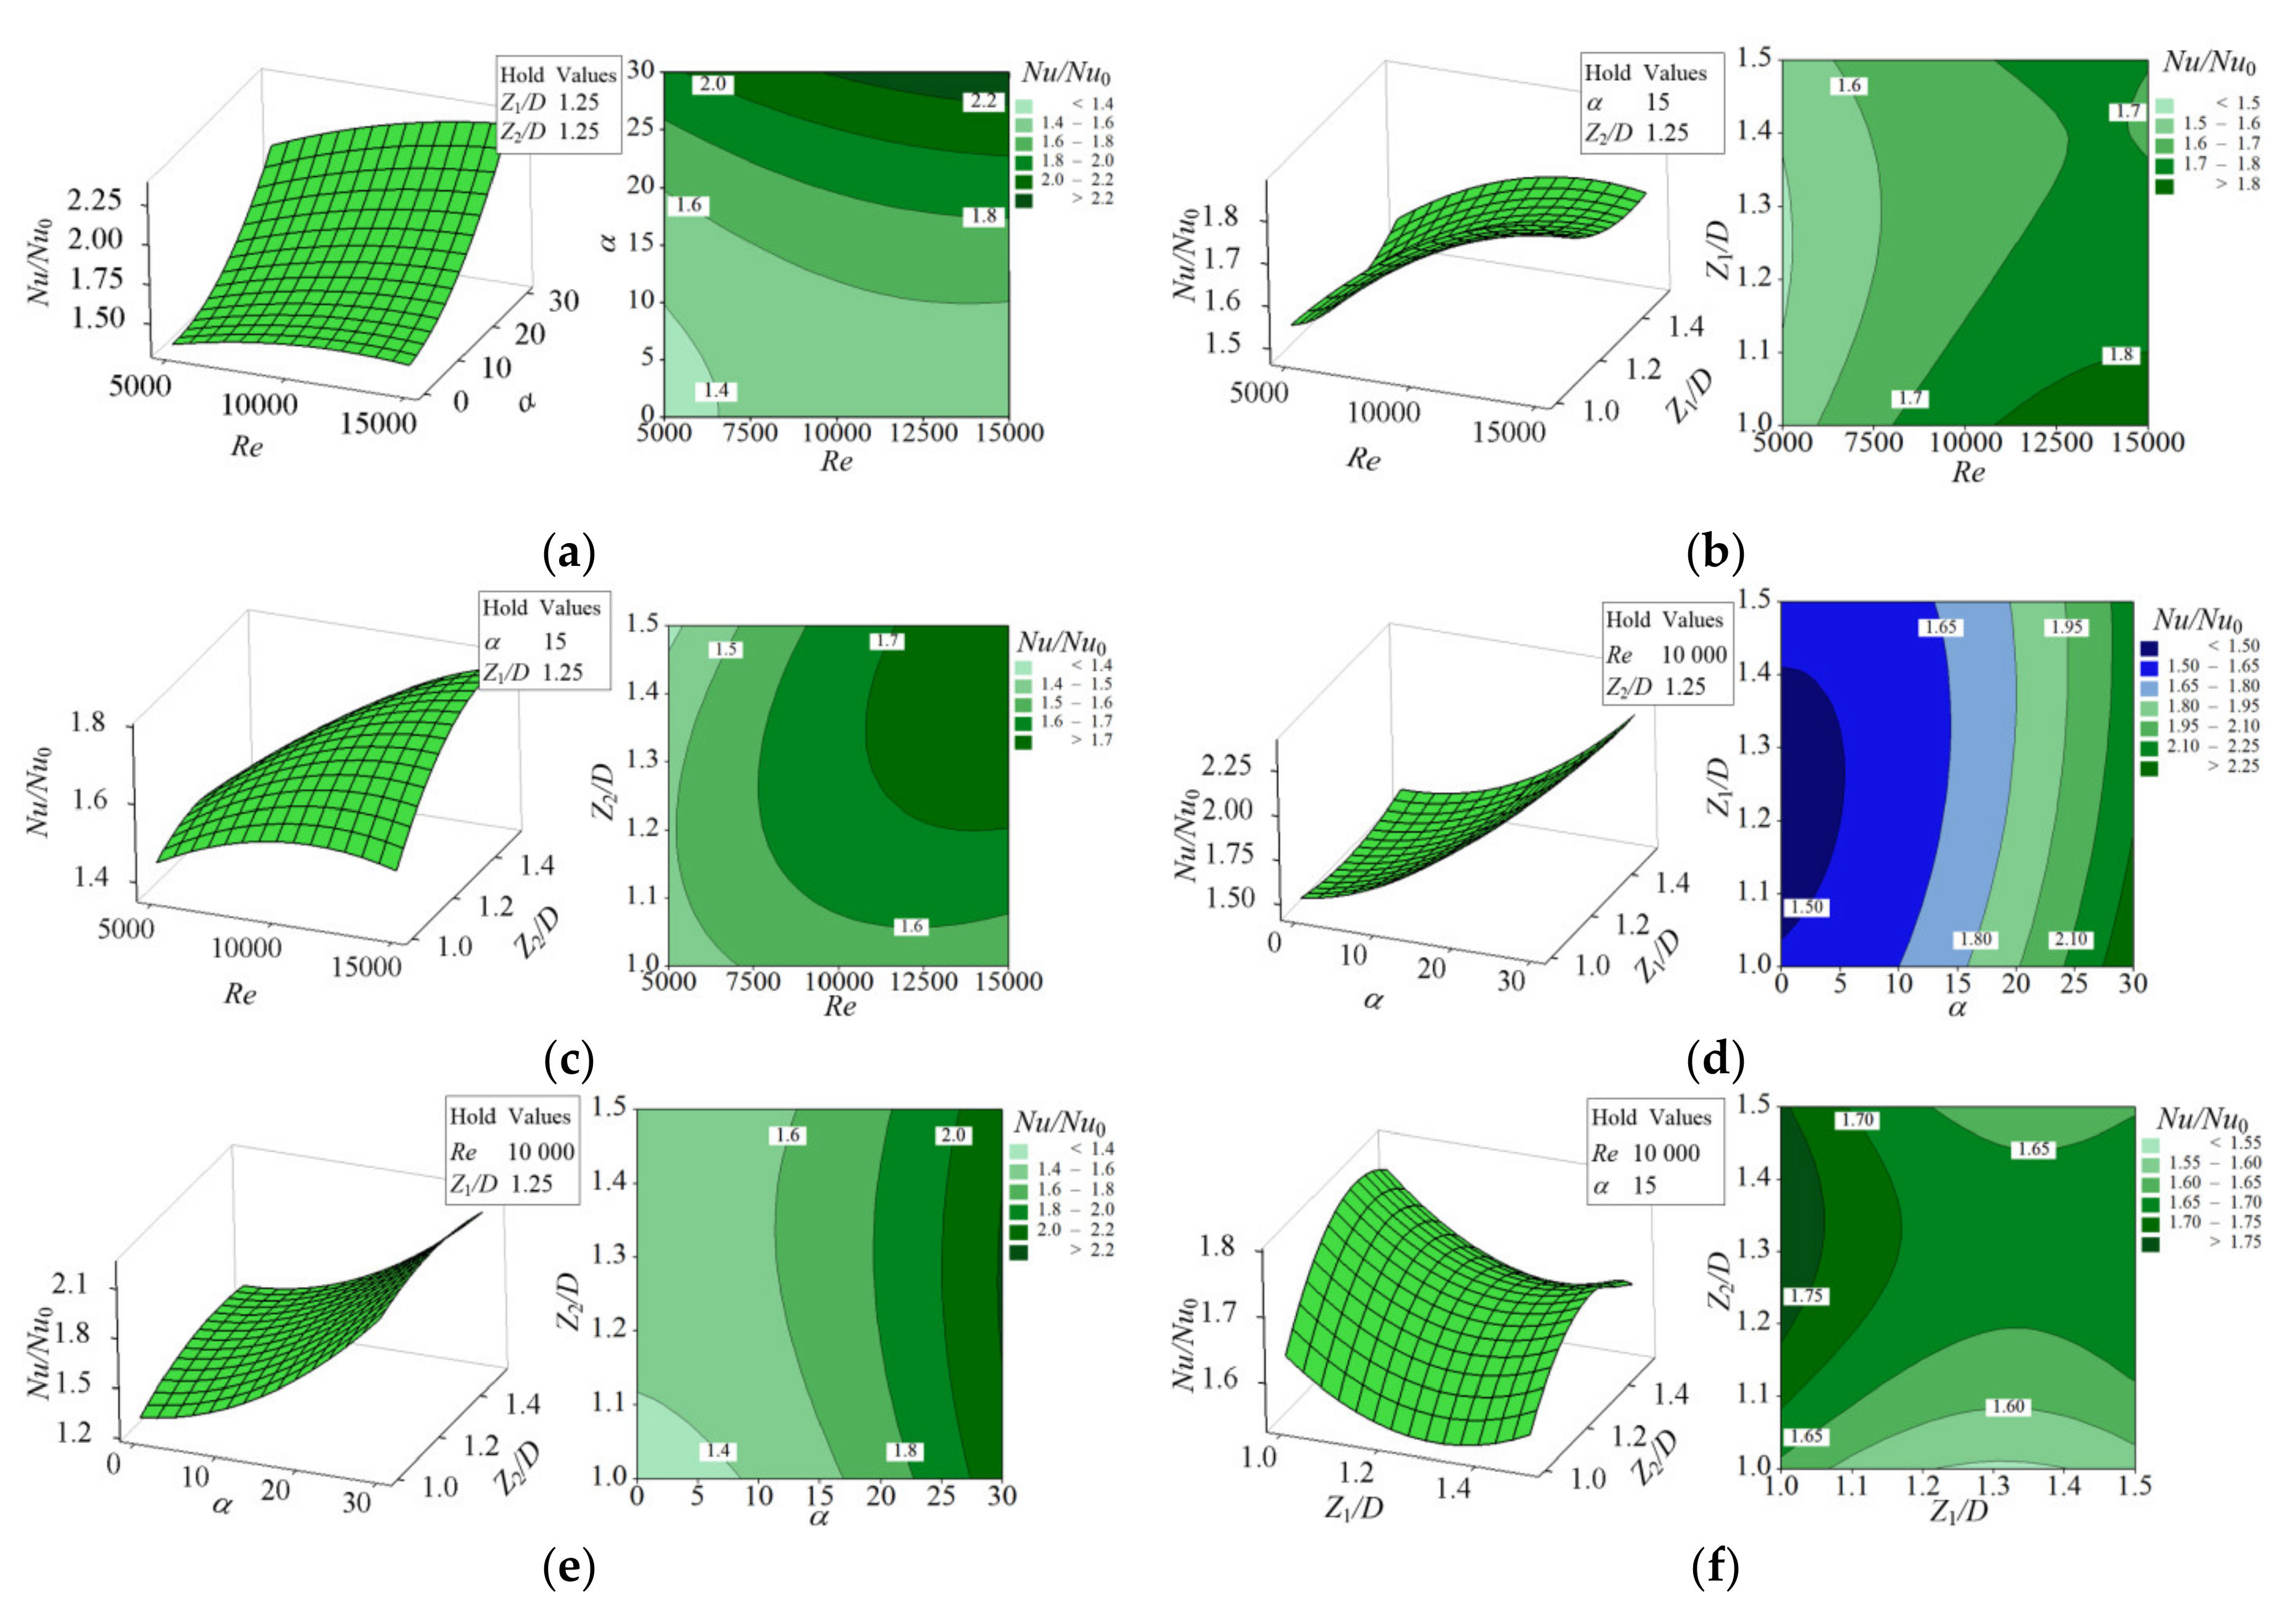
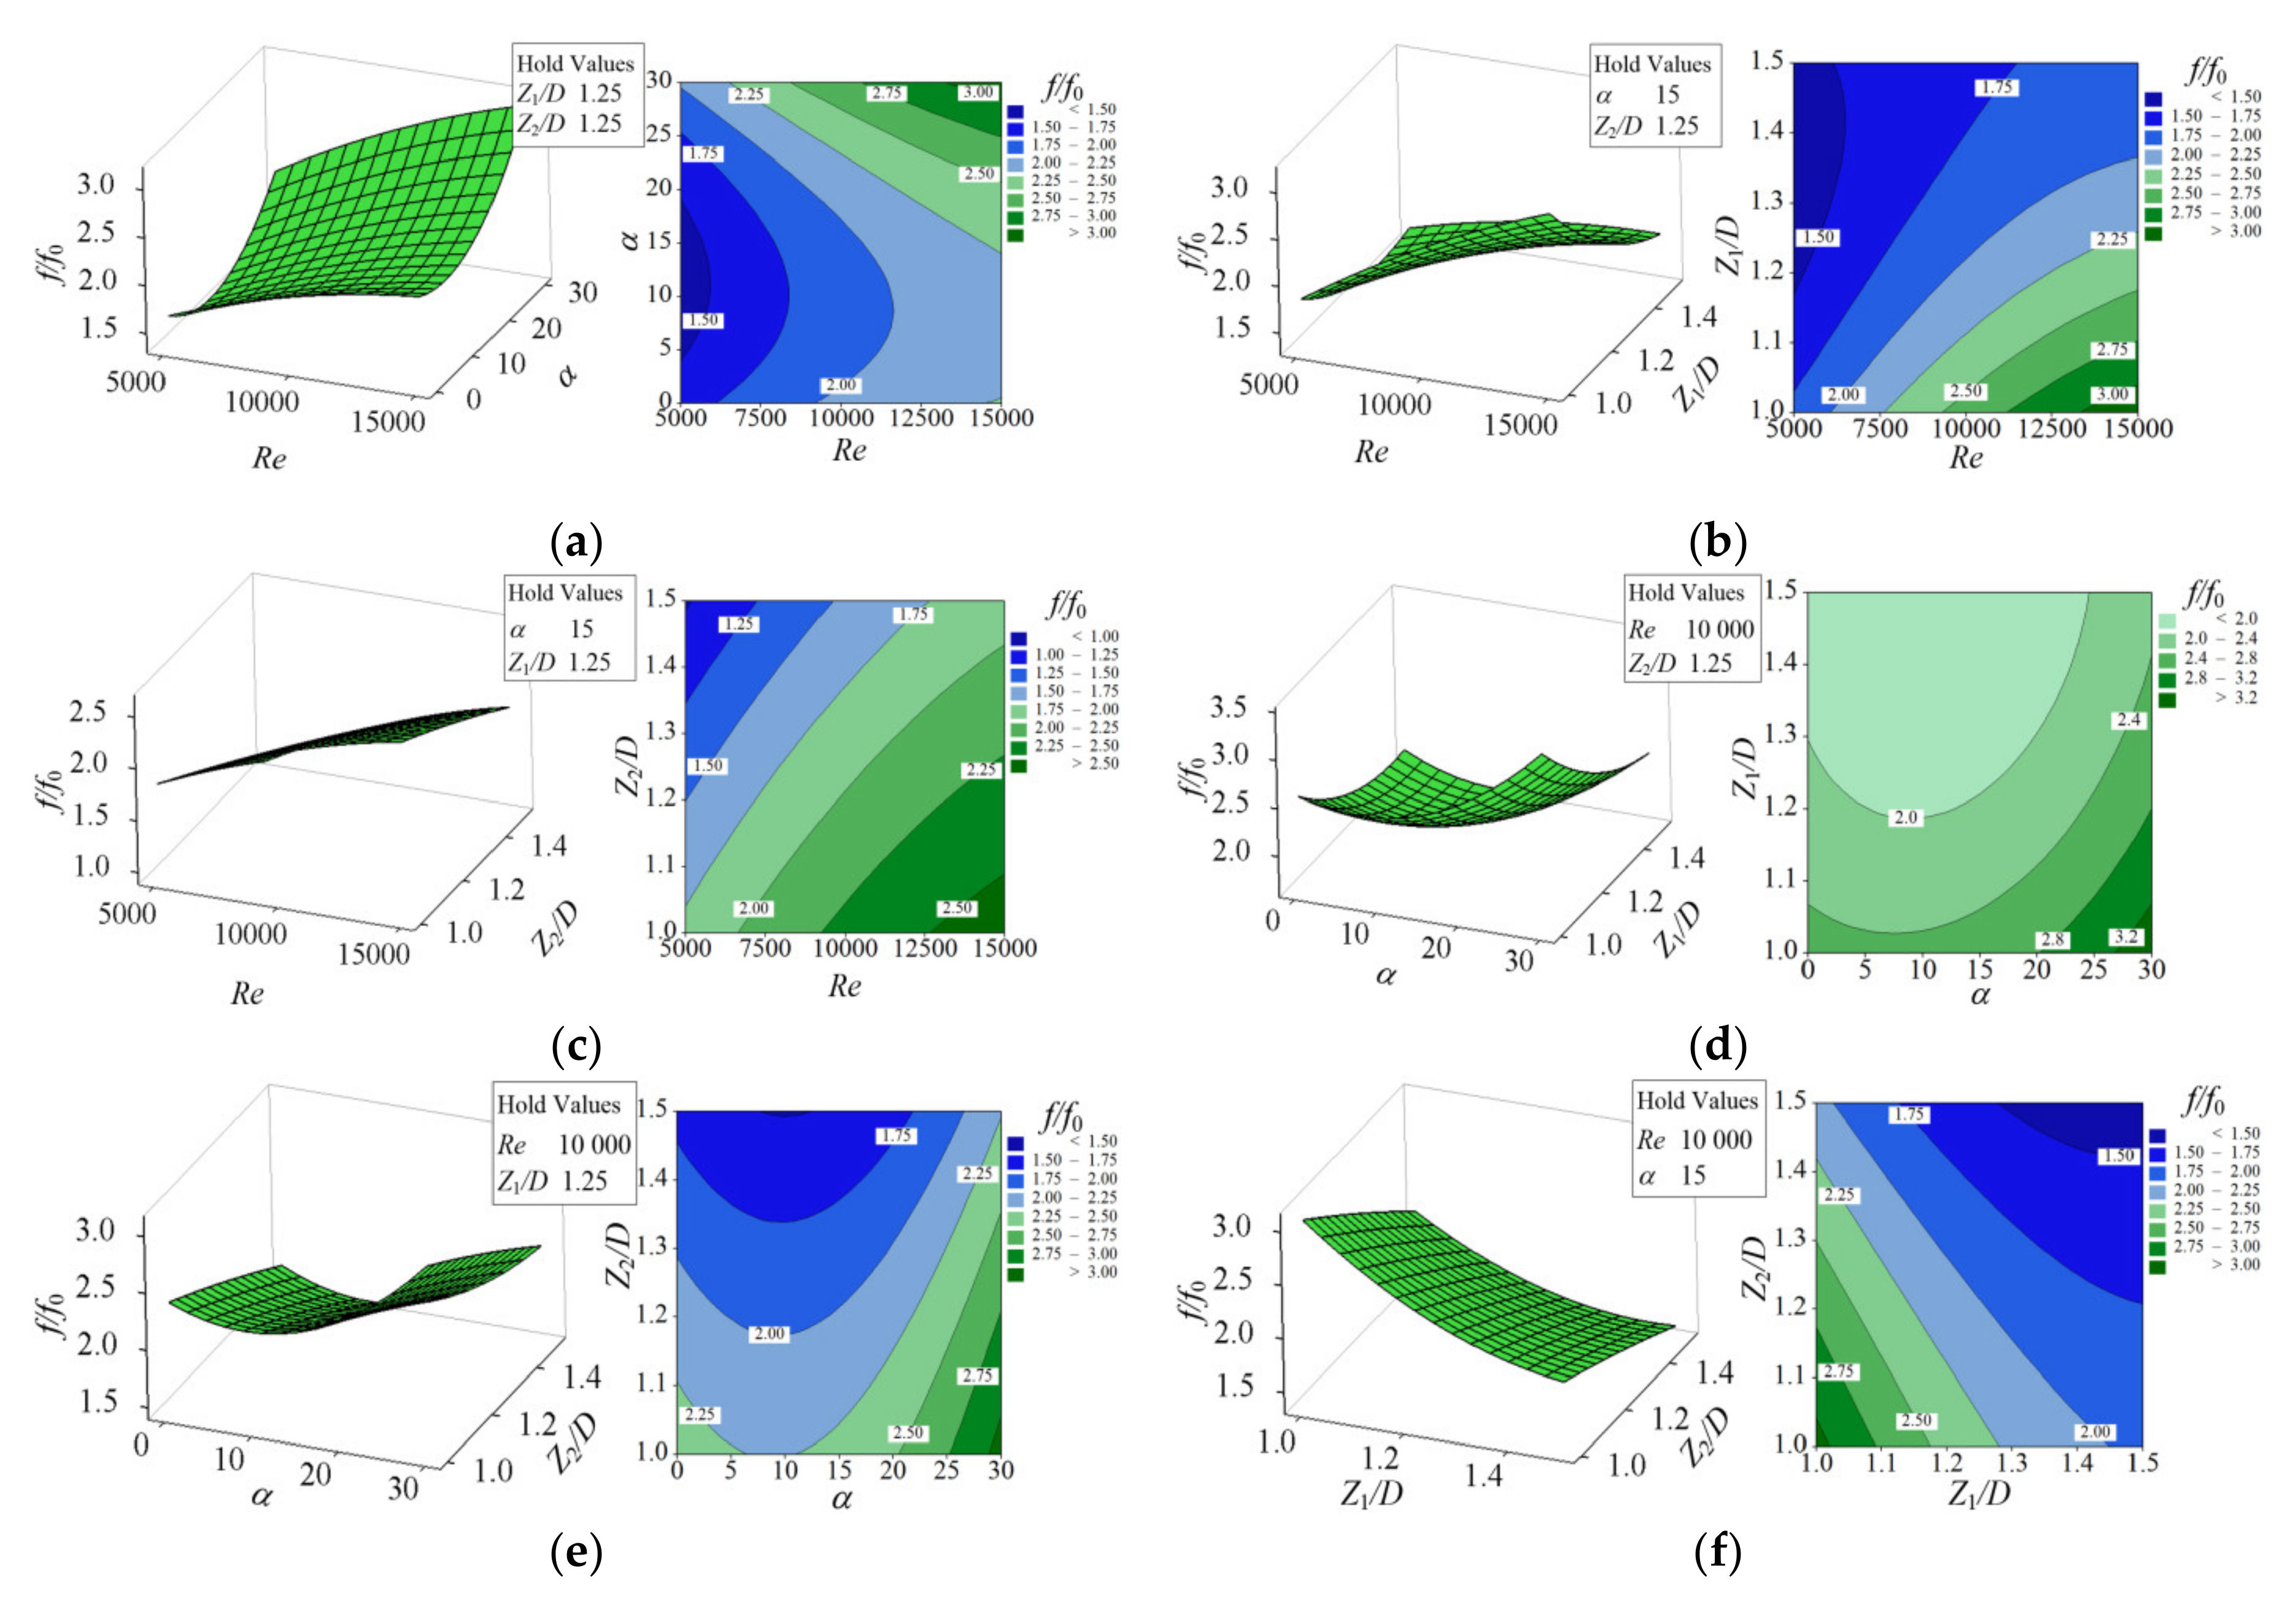
4.2. Effect of Channel Parameters on Flow and Heat Transfer

The three-dimensional surface and contour map of the Nu/Nu0 and f/f0 of the channels are shown in Figure 7 and Figure 8, respectively, to reveal the influence of channel parameters on the heat transfer performance and flow performance of the channels with frustums of a cone. Figure 7a–f show the influence of the combined action of Reα, ReZ1/D, ReZ2/D, αZ1/D, αZ2/D and Z1/DZ2/D on the response in turn.
As can be seen from Figure 7a, when Re is constant, increasing α increases the Nu/Nu0 of the channel, while when α is constant, the increase of the Nu/Nu0 of the channel along with the increase of Re is not very significant. When Re is 5000 and α is 0°, the Nu/Nu0 of the channel reaches its minimum value, while when Re is 15,000 and α is 30°, the Nu/Nu0 of the channel reaches its maximum value. As can be seen from Figure 7b, when Re is constant, increasing Z1/D makes the Nu/Nu0 of the channel first increase and then decrease. It can be seen from Figure 7c that the increase in Z2/D under different values of Re and the increase in Re under different values of Z2/D can improve the Nu/Nu0 of the channel. As can be seen from Figure 7d,e, when α is constant, the Nu/Nu0 of the channel remains basically unchanged with increasing Z1/D and Z2/D. When Z1/D and Z2/D remain unchanged, increasing α can significantly increase the Nu/Nu0 of the channel. As can be seen from Figure 7f, when Z1/D is constant and Z2/D is increased, Nu/Nu0 of the channel first decreases and then increases. When Z2/D is constant, increasing Z1/D causes the Nu/Nu0 of the channel to first increase and then decrease.
As can be seen from Figure 8a, at low Re, the f/f0 of the channel first decreases and then increases with increasing α, while at high Re, increasing α leads to an increase in the f/f0 of the channel. When α is constant, the f/f0 of the channel increases with increasing Re. It can be seen from Figure 8b,c that increasing Re and decreasing Z1/D and Z1/D result in an increase in the f/f0 of the channel. As can be seen from Figure 8d, when α is constant and Z1/D is increased, and when Z1/D is constant and α is increased, the f/f0 of the channel first decreases and then increases. According to Figure 8e, when α is constant, the f/f0 of the channel decreases with increasing Z2/D. When Z2/D remains unchanged, the f/f0 of the channel first decreases and then increases with increasing α. As can be seen from Figure 8f, increasing Z2/D and Z1/D reduces the f/f0 of the channel.
The above research shows that when analyzing the flow and heat transfer performance of channels with frustums of a cone, the information obtained limited to a fixed channel parameter is not sufficient to describe the performance of the channels. Building the function of channel performance related to channel parameters based on response surface method is of great significance to studying the influence of channel parameters on channel performance and guiding the parameter optimization and structural design of channels with frustums of a cone.

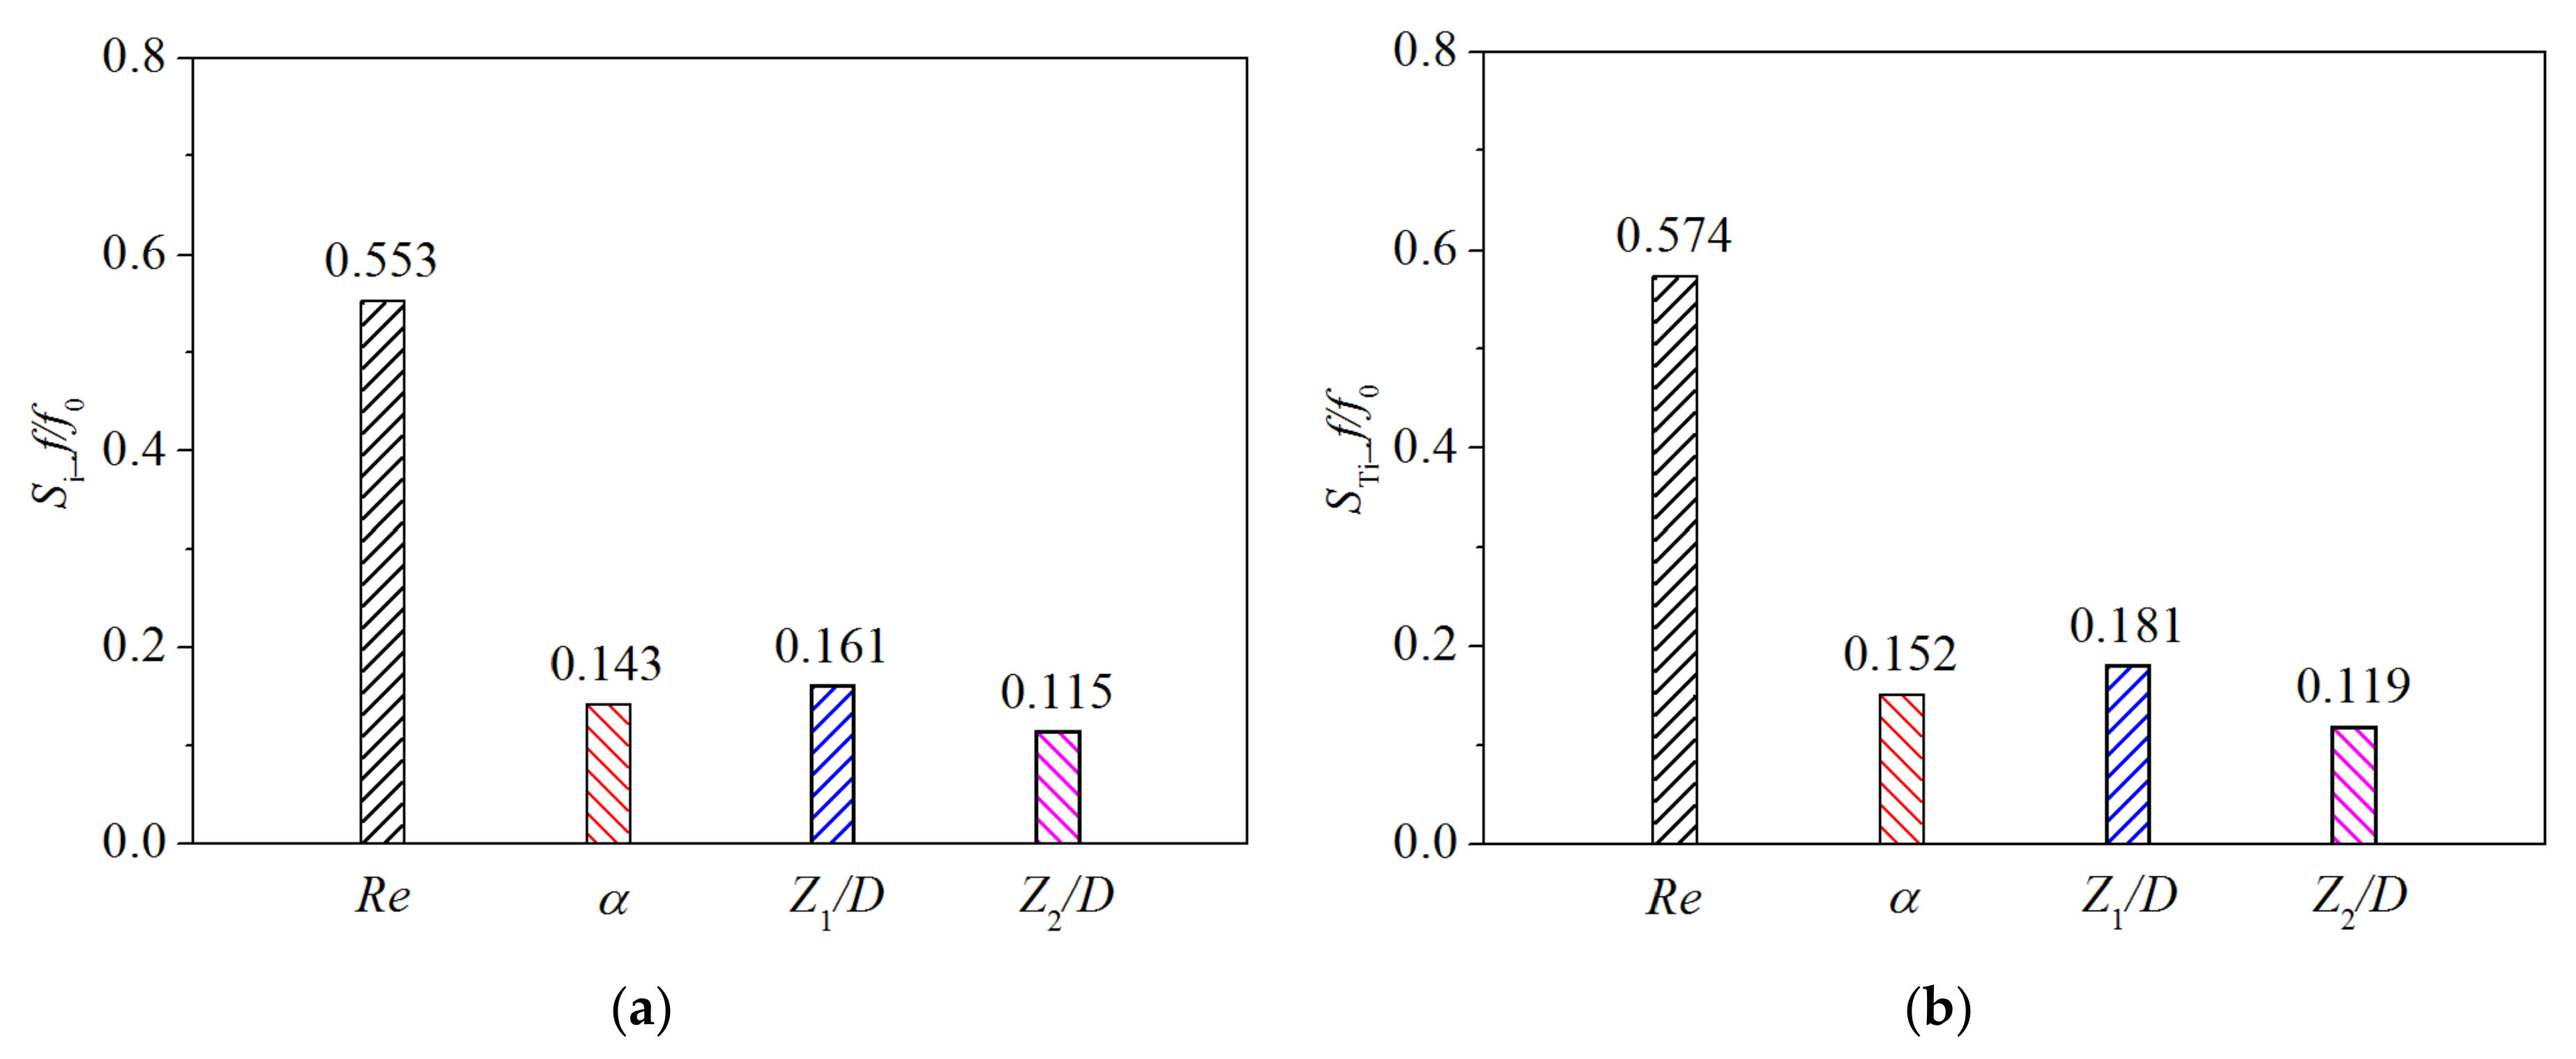
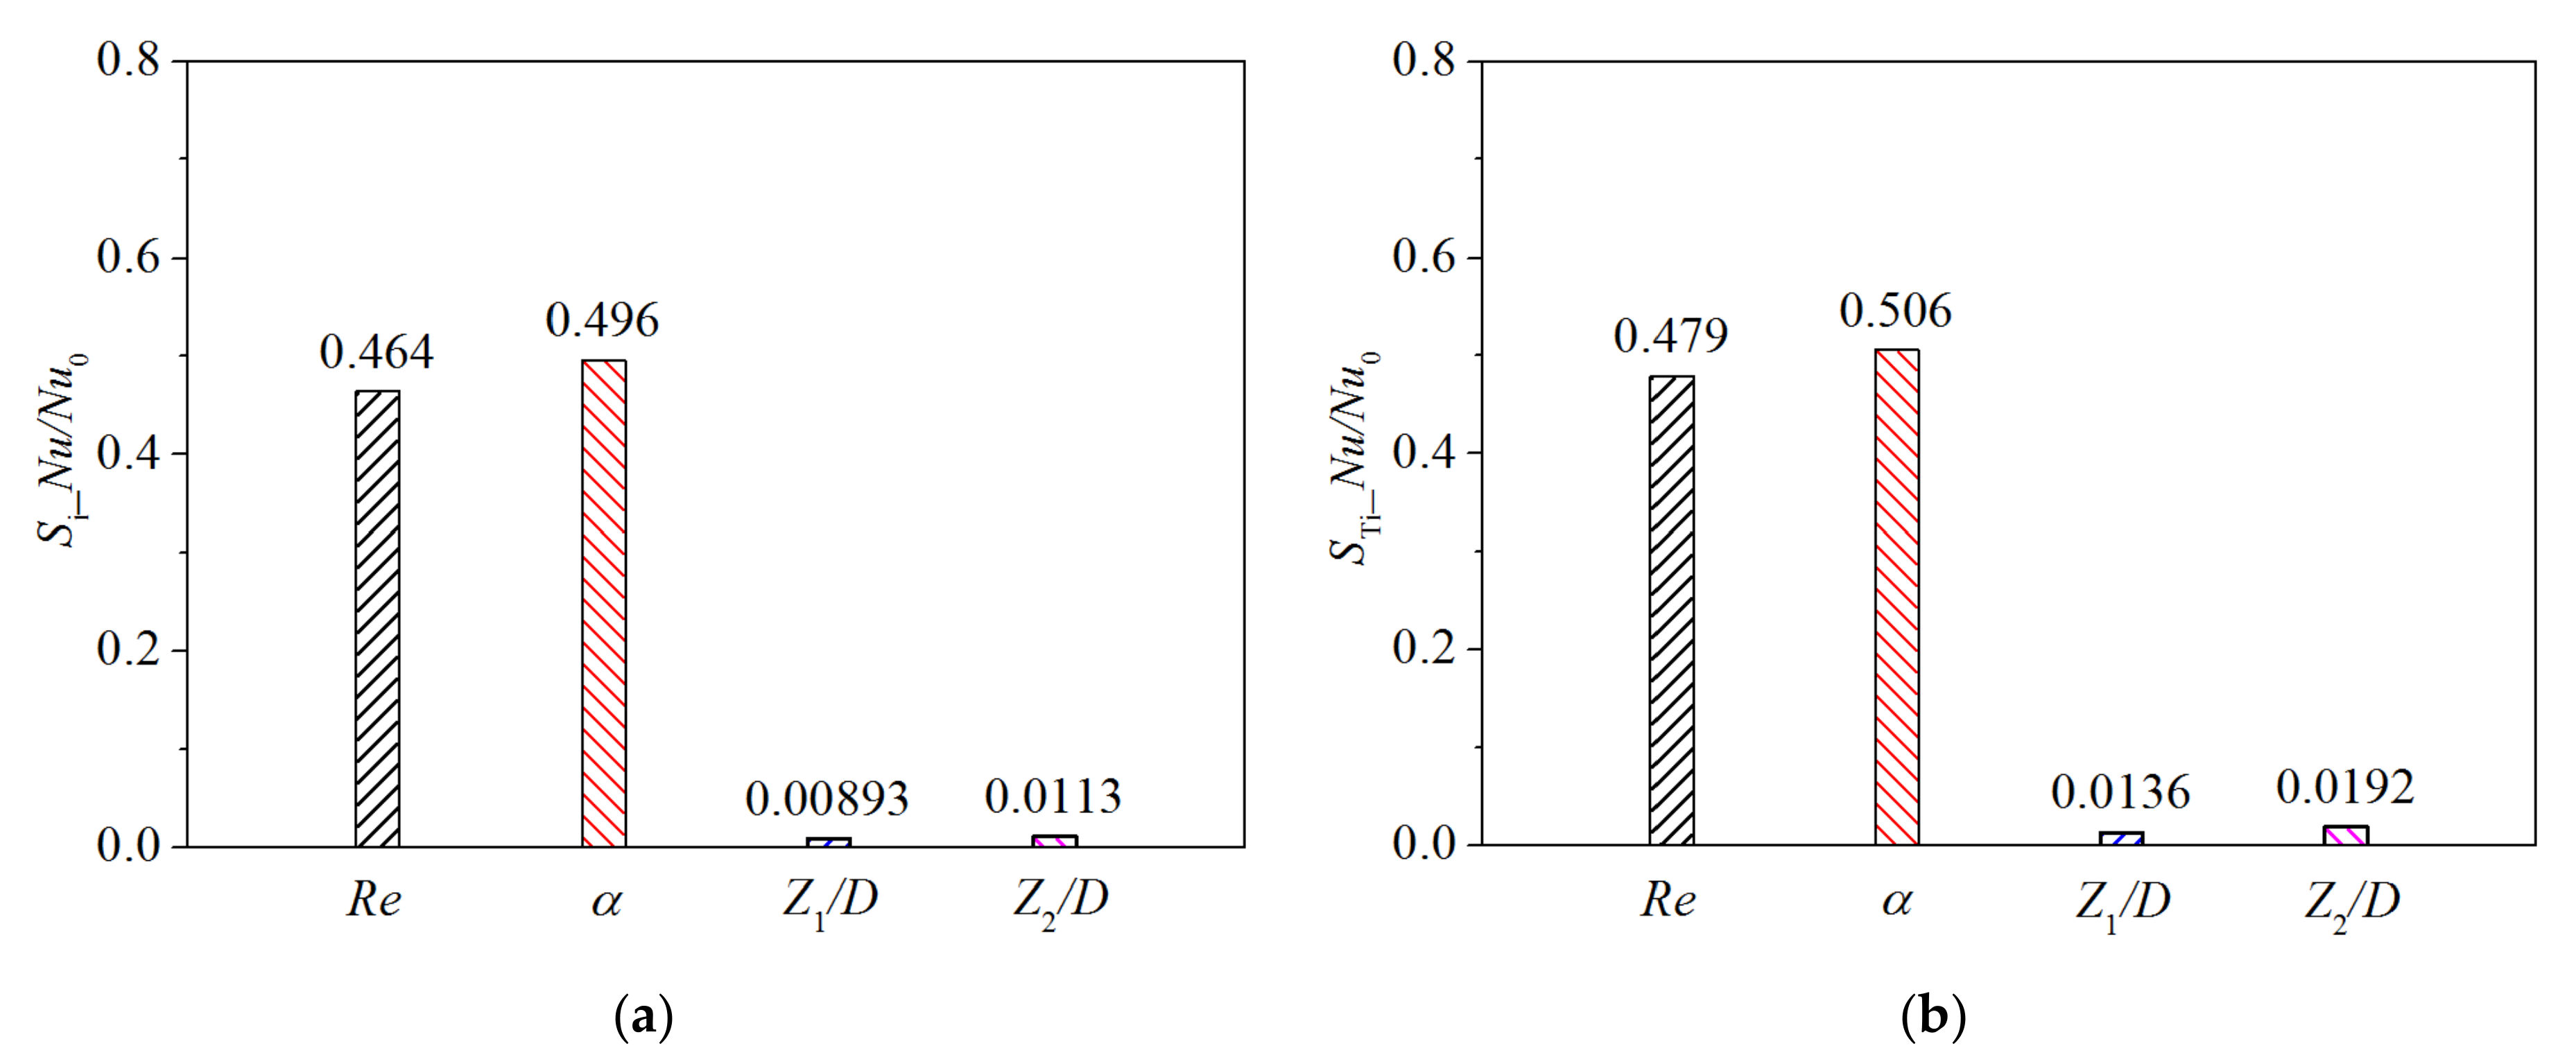
4.3. Sensitivity Analysis of the Channel Parameters

Figure 9 shows the first-order sensitivity index and total sensitivity index of channel parameters when the response is Nu/Nu0. The first-order parameter sensitivity index represents the influence of a single parameter on the Nu/Nu0 of the channels. The total sensitivity index represents the combined influence of a single parameter and its interaction with other parameters on the Nu/Nu0 of the channels. As can be seen from Figure 9a, when the response is Nu/Nu0, the first-order sensitivity indexes of the channel parameters from high to low are α, Re, Z2/D and Z1/D. Among them, the changes of α and Re have an important influence on the Nu/Nu0 of the channel. According to Figure 9b, the total parameter sensitivity indexes are α, Re, Z2/D and Z1/D from high to low, which is the same as the ranking of the first-order sensitivity indexes of the channel parameters. Through calculation, the difference between them is less than 0.02, indicating that the interaction between a single parameter and other parameters of the channels has no significant impact on the Nu/Nu0 of the channels. In addition, the proportions of α and Re in the total sensitivity index are 50.6% and 47.9%, indicating that α and Re have a greater impact on the Nu/Nu0 of the channels compared with Z1/D and Z2/D.
Figure 10 shows the sensitivity index of the channel parameters when the response is f/f0, where Figure 10a and Figure 10b are the first-order sensitivity index and total sensitivity index, respectively. It can be seen from Figure 10a that when the response is f/f0, the first-order sensitivity indexes of the channel parameters are Re, Z1/D, α and Z2/D from high to low. Among them, the first-order sensitivity index of Re is significantly higher than other channel parameters, and the first-order sensitivity indexes of α, Z1/D and Z2/D are basically the same, all distributed around 0.15. According to Figure 10b, the total sensitivity indexes of the parameters are Re, Z1/D, α and Z2/D from high to low, which is the same as the first-order sensitivity indexes. Through calculation, it can be seen that the difference between the two is less than 0.021, indicating that the interaction between a single parameter and other parameters of the channels has no significant impact on the f/f0 of the channels. In addition, the proportion of Re in the total sensitivity index is 57.4%, while the proportions of the total sensitivity coefficient of the other three channel parameters are all about 15%, which indicates that Re has the greatest impact on the f/f0 of the channels, while α, Z1/D and Z2/D have a fairly small impact.

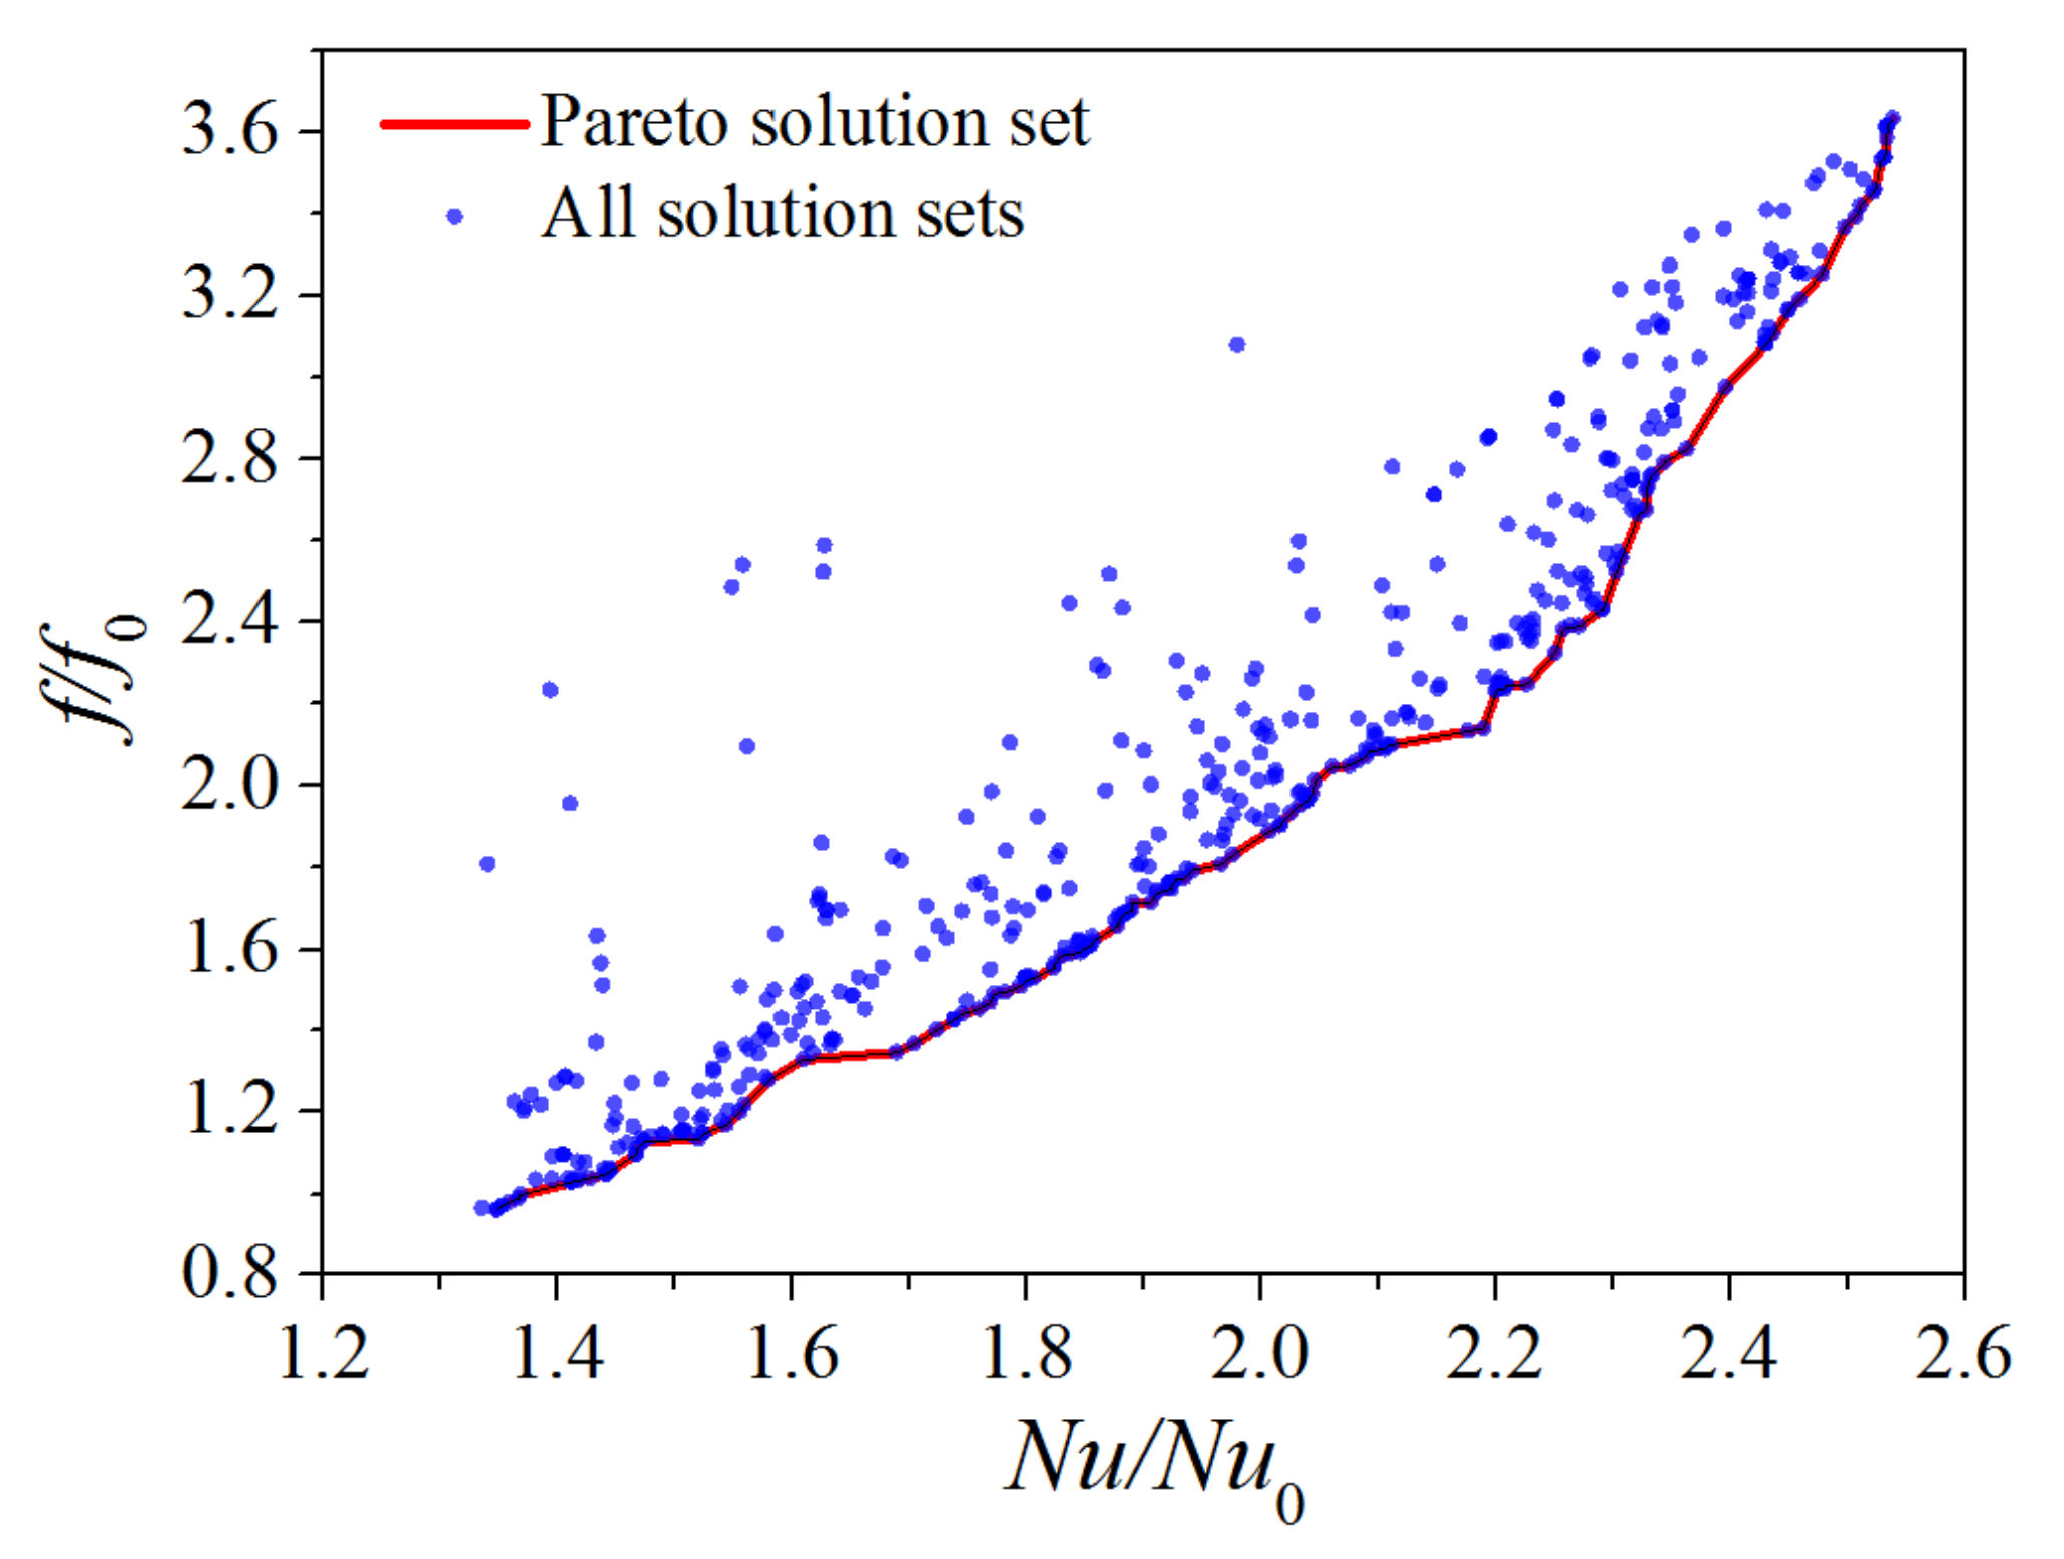
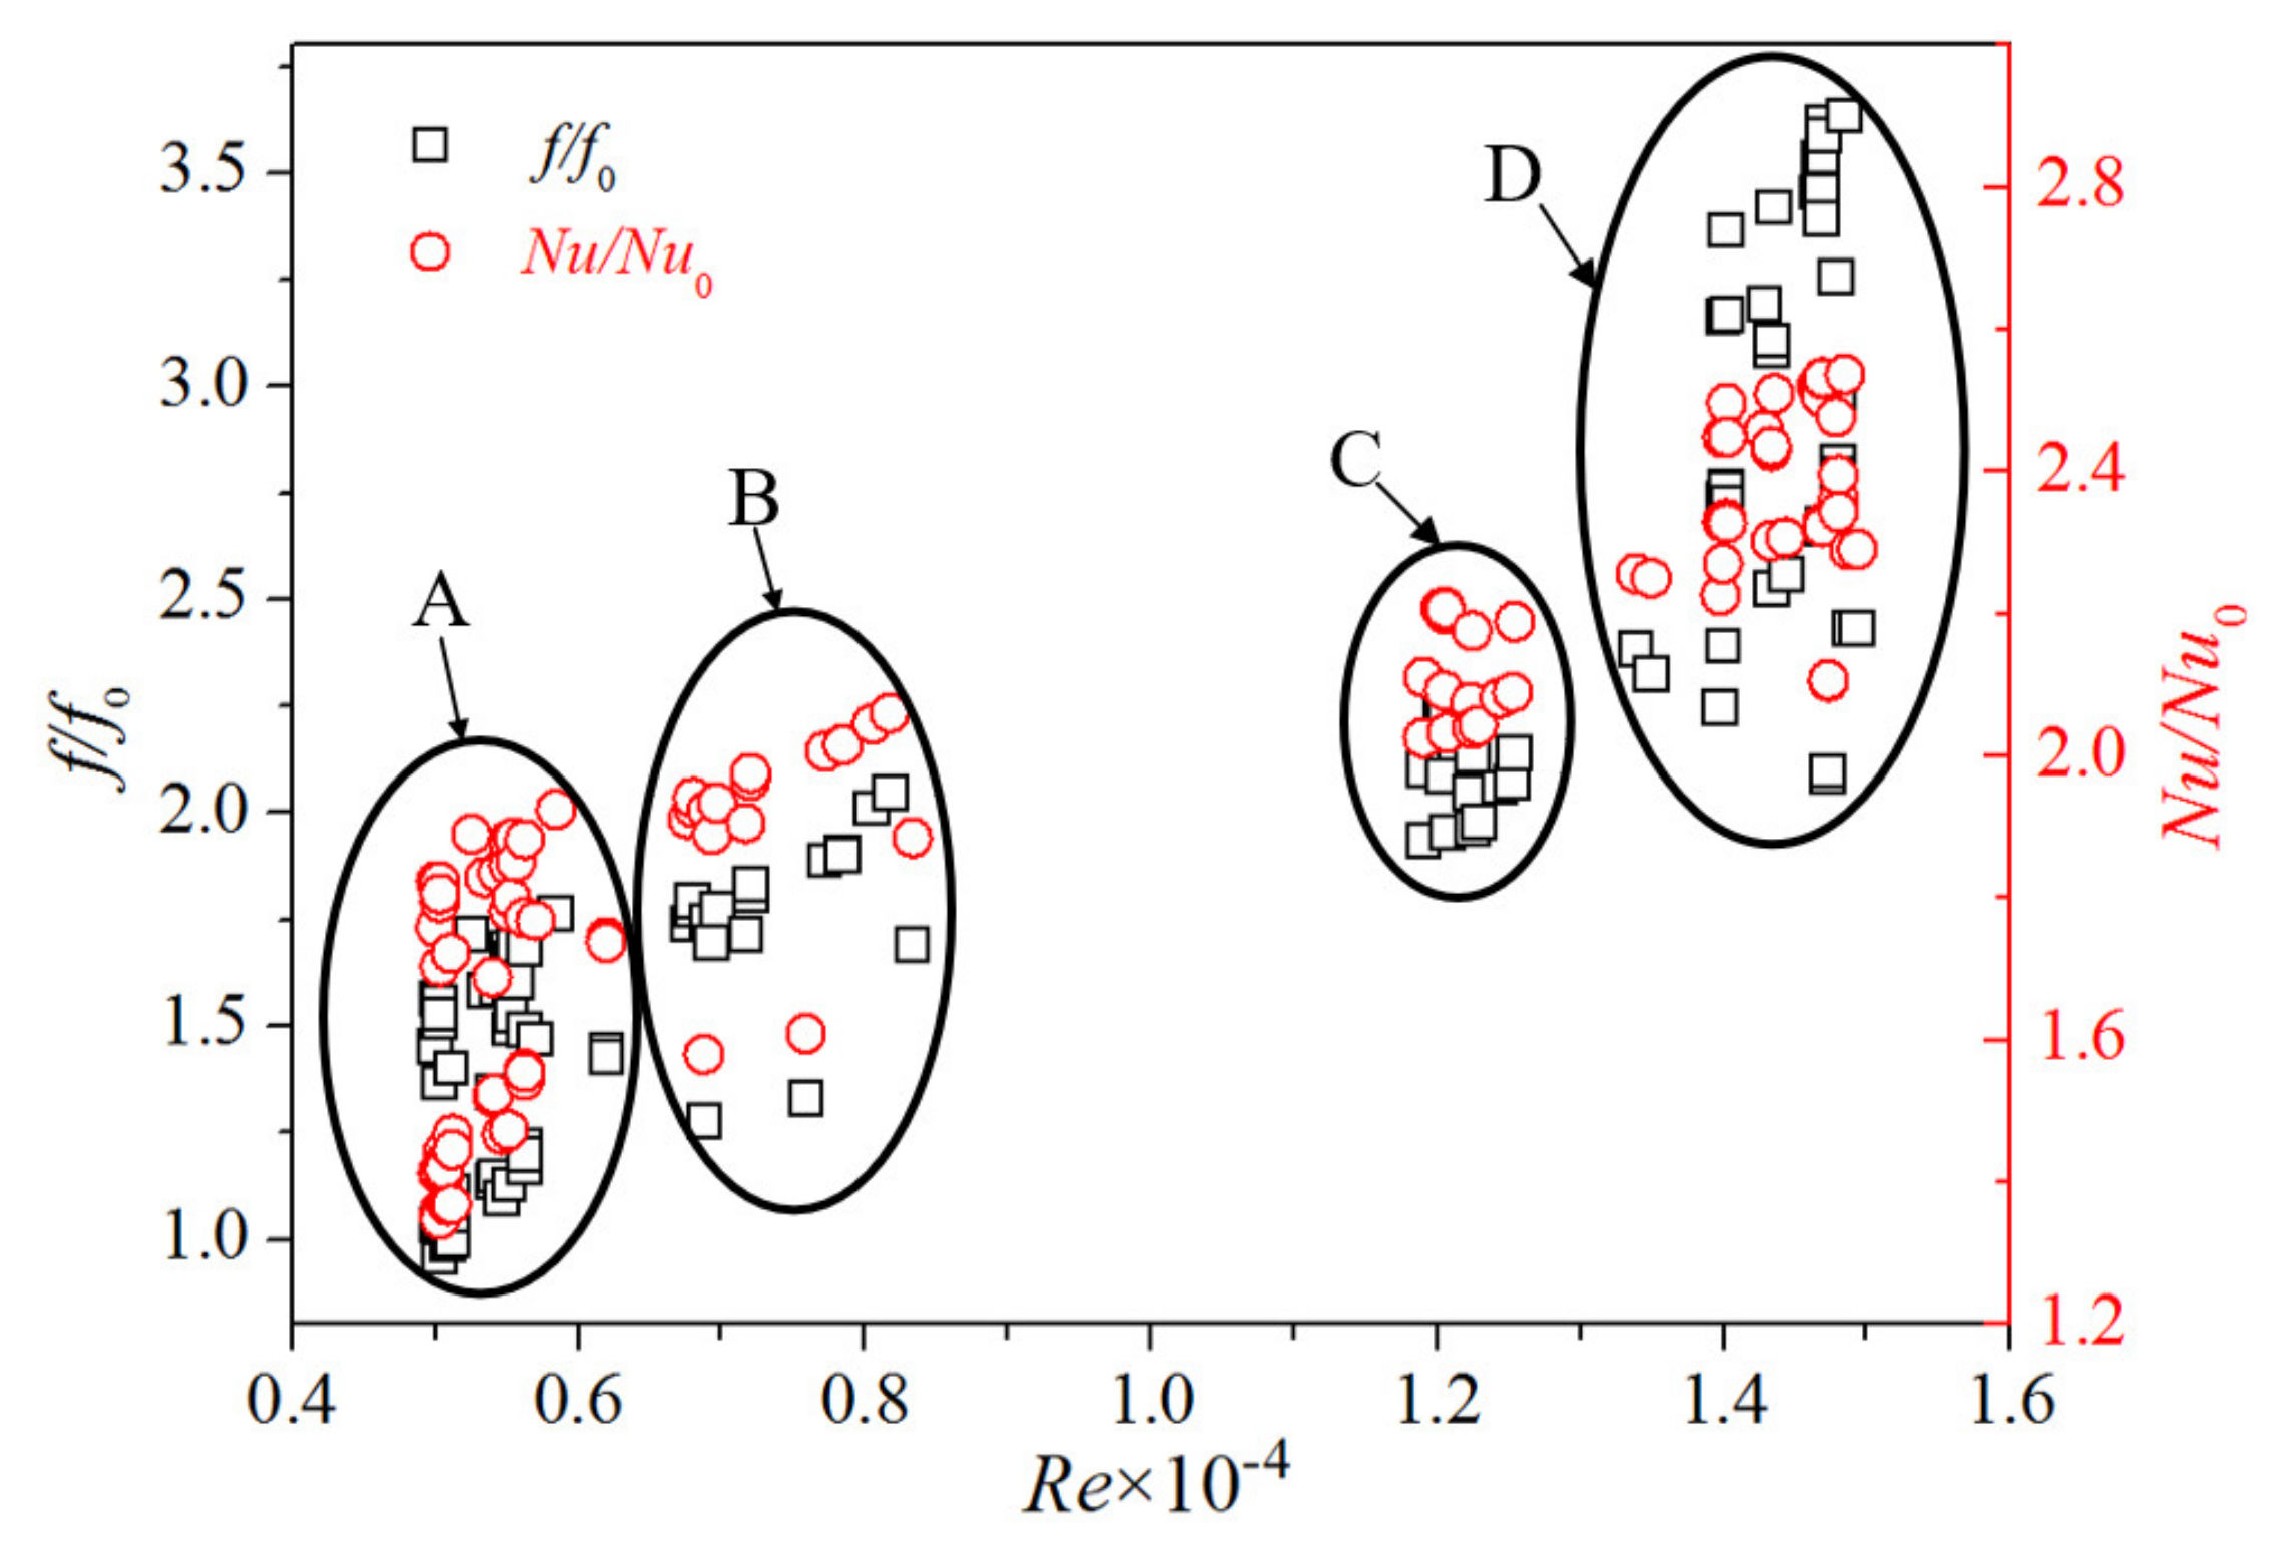
4.4. Multi-Objective Optimization Results of the Parameters

With the aim of obtaining the maximum values of Nu/Nu0 and the minimum values of f/f0 for the channel, the NSGA-II was used to find the optimal combination of channel parameters in the global range. The population number of the genetic algorithm was 12, the genetic algebra was 40, the crossover probability was 0.9, the mutation probability was 0.1, the crossover distribution index was 10, and the mutation distribution index was 20. The specific settings can be found in Ref. [24]. After the operation, a total of 481 solutions were generated, of which the Pareto solution set, the set of optimal solutions, had a total of 130 solutions. Figure 11 shows the solution set of multi-objective optimization. In Figure 11, the blue dots represent all of the solution sets, and the red curve represents the Pareto front connected by the Pareto solution sets. According to Figure 11, when the f/f0 of the channel is constant, the Nu/Nu0 of the channel of the point on Pareto front must be at its maximum. Similarly, when the Nu/Nu0 of the channel is constant, the f/f0 of the channel of the point on the Pareto front must be at its minimum.
On the basis of the sensitivity analysis of the parameters, the parameter Re has the greatest impact in the performance of the channel in terms of the flow and heat transfer performance of the channel. Consequently, the K-means clustering algorithm was used to cluster the Pareto solution sets under different values of Re. Figure 12 illustrates the results of K-means clustering of the Pareto solution set. As can be seen from Figure 12, the Pareto solution sets can be divided into four categories—A, B, C and D—under different values of Re. Without considering the influence of α, Z1/D and Z2/D, when Re increases, the Nu/Nu0 and f/f0 of the channel under the Pareto solution set increase slightly.
An optimal solution was selected from each of the four categories A, B, C and D in Figure 12 for comparative analysis. The specific optimal parameter combinations are provided in Table 5. According to Table 5, the Nu/Nu0 of optimization points A, B, C and D increased by 9.70%, 21.82%, 26.06% and 27.88%, respectively, compared with the reference channel. In addition, the f/f0 of the optimization points decreased by 19.89%, 1.05%, –7.85% and –9.42%, respectively, compared with the reference channel. Among them, the Nu/Nu0 and f/f0 of optimization points A and B were optimized, while the Nu/Nu0 of optimization points C and D was considerably improved, but the f/f0 had increased moderately. This is because the values of Re for optimization points C and D are large. When the Nu/Nu0 increases, f/f0 will also increase. Overall, compared with the reference channel, the Nu/Nu0 of the optimized channels increased by 21.36% on average, and the f/f0 decreased by 9.16% on average. This shows that the optimization results of the channel parameters in the present study are good, and can serve as a reference for the multi-objective optimization of channels with turbulent structures.
To further explore the influence of channel parameters on the flow and heat transfer performance of the channels, Figure 13 shows the comparison of surface streamline, temperature distribution, and Nu distribution of the heat transfer walls of the reference channel and optimization point C. Figure 13a,c shows the reference channel, and Figure 13b,d gives the optimization points C. It can be seen from Figure 13a,b that the high-temperature area of the heat transfer wall is mainly distributed upstream and downstream of the convex and upstream of the bottom of the concave. In comparison, the temperature of the high-temperature region of the optimized channel is lower and the area with high temperature is smaller. There are large vortexes upstream of the bottom of the concave and upstream and downstream of the convex in the reference channel, while the vortexes in the optimized channel are improved. The improvement of the vortexes will reduce the frictional resistance of the channel and the accumulation of airflow, thus reducing the local temperature of the heat transfer wall and reducing the area with high temperature. According to Figure 13c,d, contrary to the temperature distribution of the heat transfer wall, the high-temperature area had a lower Nu and the low-temperature area had a higher Nu. In comparison, the Nu value of the high-Nu region of the optimized channel was higher and the area with high Nu was larger. The results show that the optimized channel improves the vortexes at the bottom of the concave and upstream and downstream of the convex, so that the heat transfer wall of the channel has a lower temperature distribution and a higher Nu distribution.

5. Conclusions

The multi-objective parameter optimization of channels with frustums of a cone was carried out. The design variables were Re, α, Z1/D and Z2/D. The optimization objective was to maximize the Nu/Nu0 and minimize the f/f0. Firstly, the experimental design of the channel parameters was carried out, and the second-order response surface model was constructed. Then, the accuracy of the response surface model was tested. Once the response surface met the requirements, the sensitivity of the channel parameters was analyzed, and the Pareto solution set was obtained. The Pareto solution set was analyzed by K-means clustering, and finally, four optimization channels were selected. The main conclusions can be drawn as follows:
(1)
The second-order response surface models obtained by CCF have small errors and high accuracy. When the response is Nu/Nu0, the RMSE of the model is 0.1048 and R2 is 0.9491. When the response is f/f0, the RMSE of the model is 0.2445 and R2 is 0.9399.
(2)
Compared with Z1/D and Z2/D, α and Re have the greatest impact on the Nu/Nu0 of the channels. Parameter Re has the greatest influence on the f/f0 of the channels, while α, Z1/D and Z2/D have the same, small influence on the f/f0 of the channels.
(3)
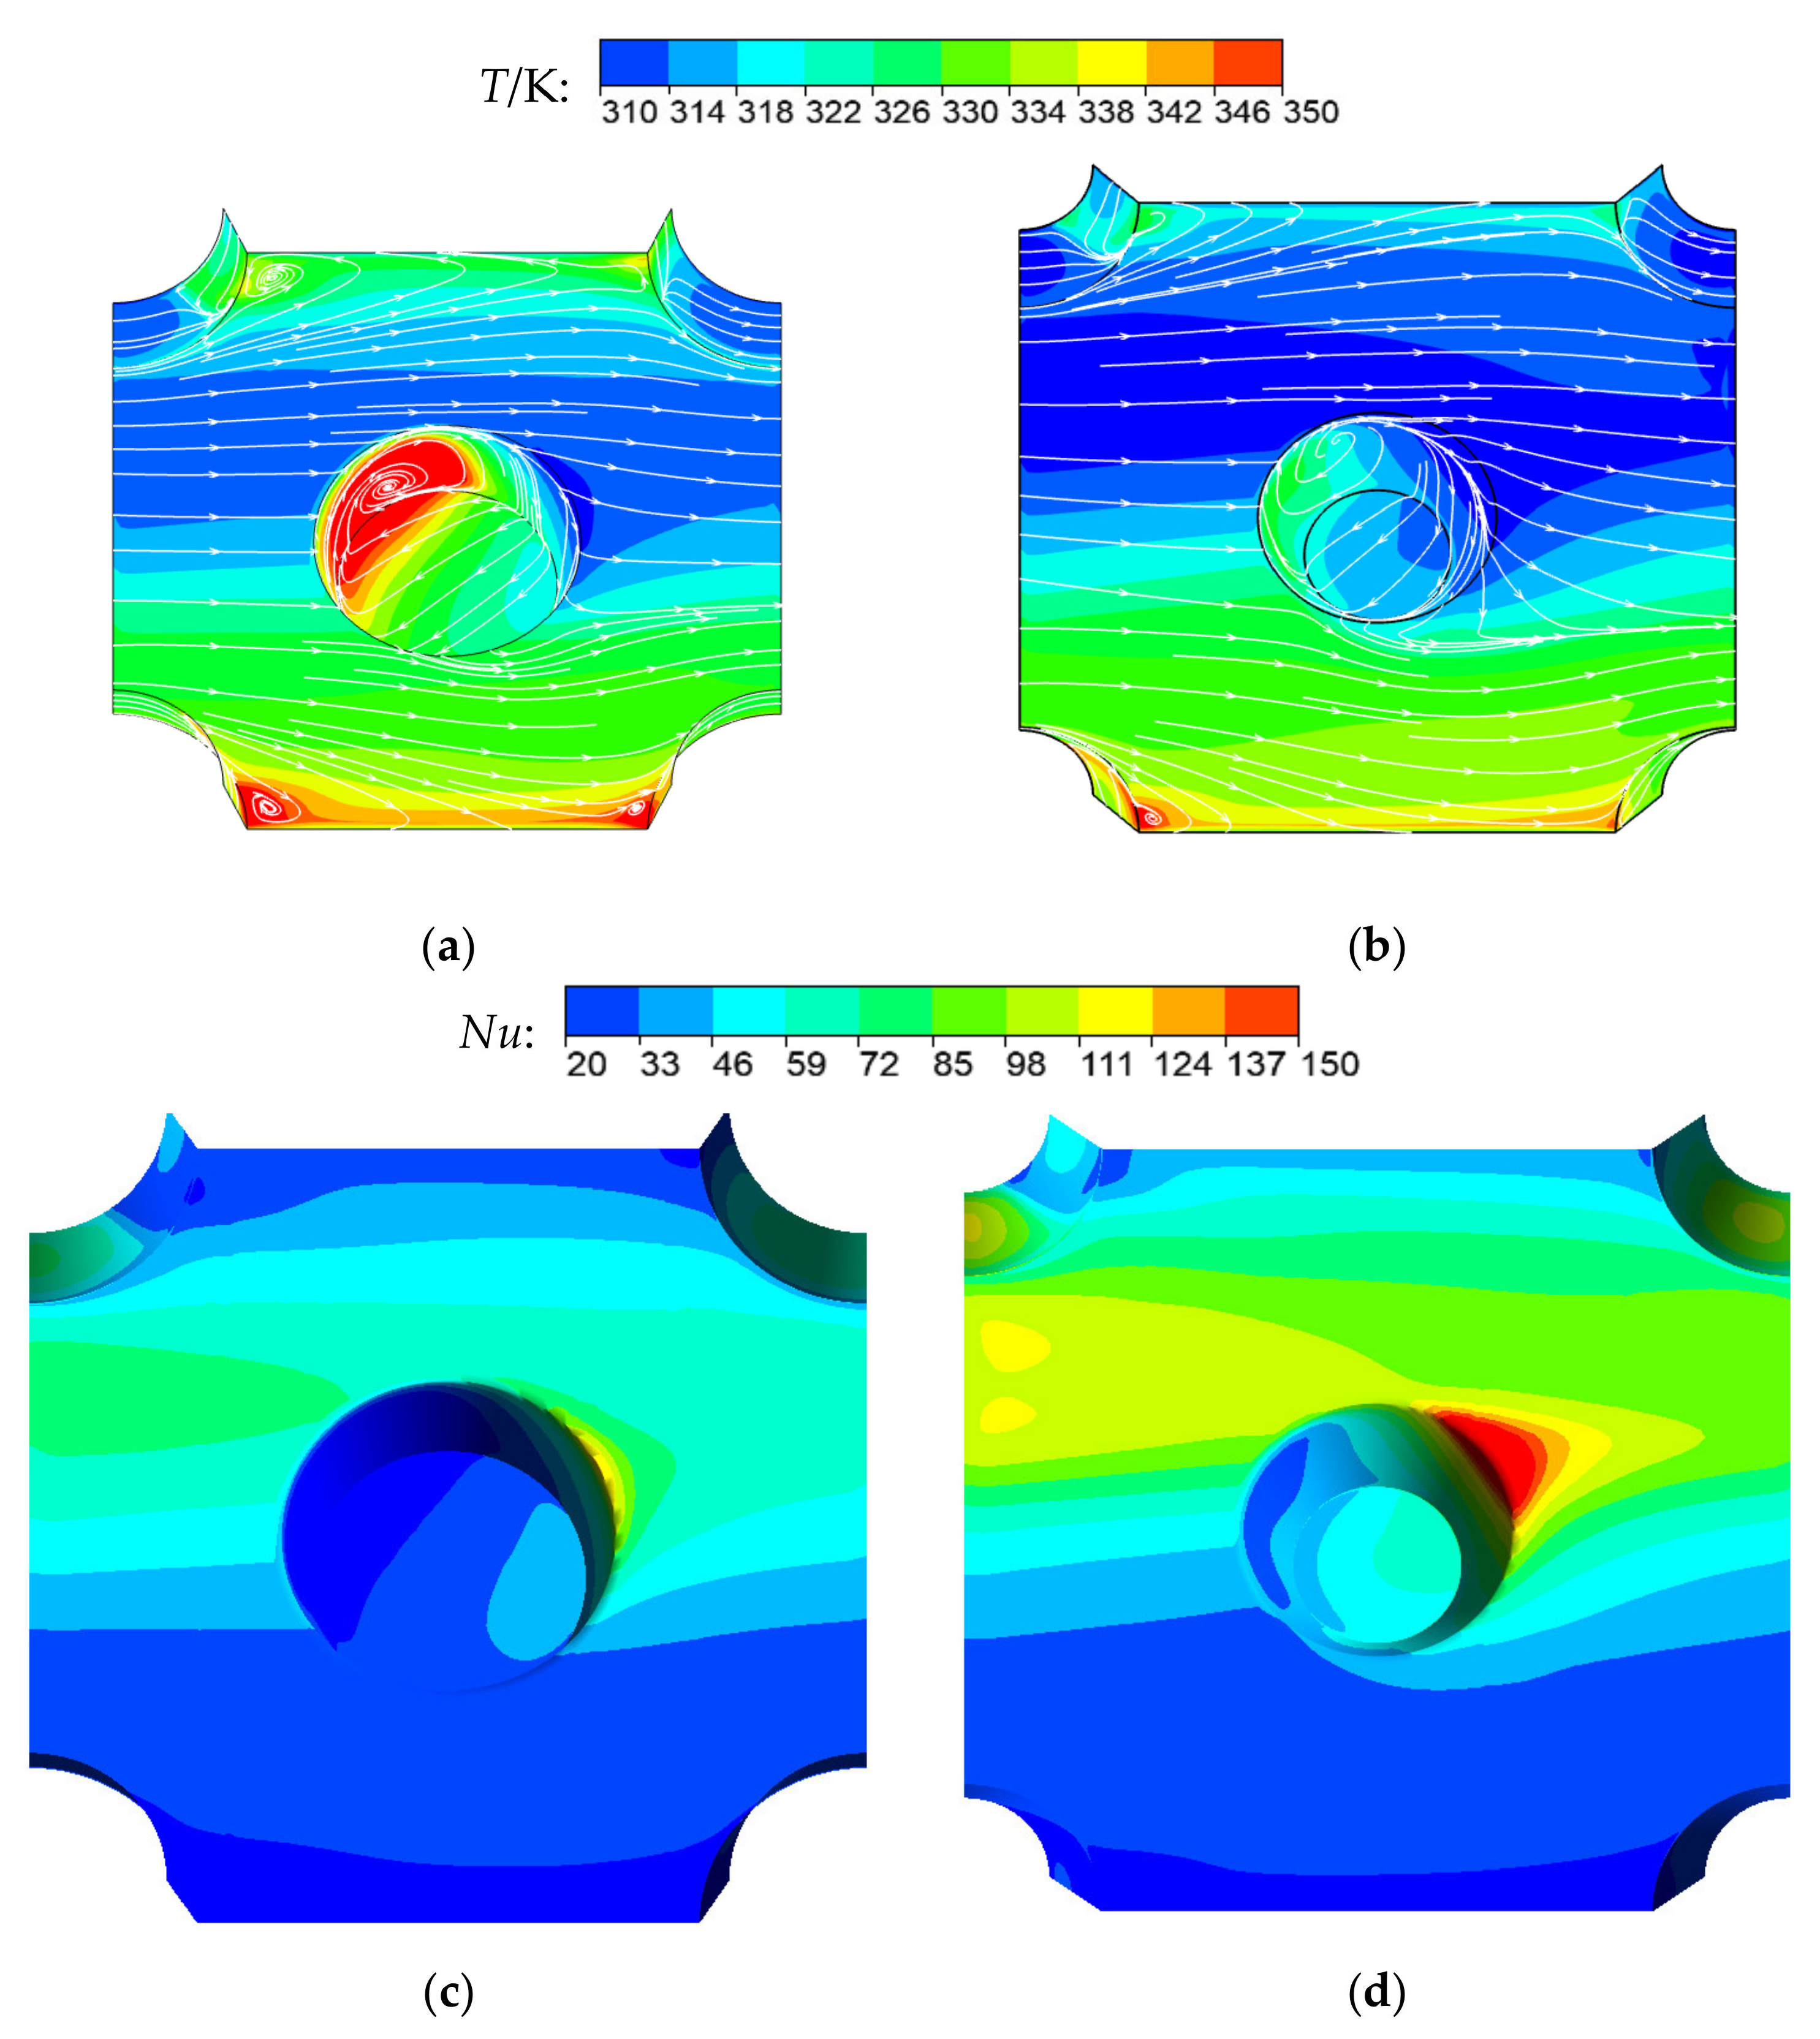
By comparing the reference channel with the optimized channel, the results show that the optimized channel improves the vortexes at the bottom of the concave and upstream and downstream of the convex, so that the heat transfer wall of the channel has lower temperature distribution and higher Nu distribution.
(4)
Compared with the reference channel, the Nu/Nu0 of the four optimized channels are increased by 9.70%, 21.82%, 26.06% and 27.88%, respectively; the f/f0 decreased by 19.89%, 1.05%, –7.85% and –9.42%, respectively. The Nu/Nu0 of the channels increased by 21.36% on average and the f/f0 declined by 9.16% on average, which demonstrates that the optimization method of the channel parameters in the present study has a good effect.

Author Contributions

Conceptualization, Z.Z. and L.X. (Lei Xi); methodology, Z.Z. and L.X. (Liang Xu); software, Z.Z.; validation, Z.Z., L.X. (Liang Xu) and Q.R.; formal analysis, Z.Z. and J.G.; investigation, Z.Z., Q.R. and Y.L.; resources, Z.Z., L.X. (Lei Xi) and J.G.; data curation, Z.Z. and Y.L.; writing—original draft preparation, Z.Z. and L.X. (Liang Xu); writing—review and editing, L.X. (Liang Xu), Z.Z. and L.X. (Lei Xi); visualization, L.X. (Lei Xi) and Z.Z.; supervision, L.X. (Liang Xu) and J.G.; project administration, J.G.; funding acquisition, L.X. (Liang Xu). All authors have read and agreed to the published version of the manuscript.

Funding

The authors would like to express their sincere gratitude to the National Key R&D Program of China (2018YFB1106400), the National Natural Science Foundation of China (Grant No.51876157), and Natural Science Foundation of Shanxi Province in China (2019JM-096) for providing financial support for this work.

Institutional Review Board Statement

Not applicable.

Informed Consent Statement

Informed consent was obtained from all subjects involved in the study.

Data Availability Statement

Not applicable.

Conflicts of Interest

The authors declare no conflict of interest.

Nomenclature

RSMResponse Surface Methodology
Nu/Nu0Nusselt number ratio
f/f0Friction coefficient ratio
RSMERoot mean square errors
R2Determination coefficients
αFrustum of a cone angle (°)
ReReynolds number
Z2/DSpanwise spacing ratio
Z1/DStreamwise spacing ratio
NSGA-IINon-dominated sorting genetic algorithm with elite strategy
CCFCentral composite face-centered design
DBottom diameter of the frustum of a cone (mm)
N–SNavier Stokes
GAGenetic Algorithm
kTurbulent kinetic energy equation
εDiffusion equation
CCDcentral composite design
RNGRenormalization Group
SIMPLECSemi-Implicit Method for Pressure Linked Equation
Z2Spanwise spacing (mm)
HHeight of the frustum of a cone (mm)
Z1Streamwise spacing (mm)
VAverage inlet velocity of air flow (m/s)
PCharacteristic length (mm)
νKinematic viscosity of air (m2/s)
NuxLocal Nusselt number
qxLocal heat flux (W/m2)
TwLocal temperature of the wall (K)
TfReference temperature (K)
NuAverage Nusselt number
AArea of heat transfer wall (m2)
fFriction coefficient
Lchannel length (mm)
ΔpPressure drop (Pa)
ρAir density (kg/m3)
λThermal conductivity of air (W/m K)
Nu0Average Nusselt number of smooth parallel plate channel
f0Friction coefficient of smooth parallel plate channel
YResponse
XDesign variable
f(X)Approximate function of the target
βFitting coefficient
εPrediction error
F(x)A square integrable function
MTotal variance of the F(x)
M i 1 i t Partial square deviation of the F(x)
S i 1 i i Sensitivity index of the variable
S i t First order sensitivity index
S i q i t Second-order sensitivity index
S T i t Total sensitivity index

References

  1. Zheng, N.; Liu, P.; Shan, F.; Liu, Z.; Liu, W. Sensitivity analysis and multi-objective optimization of a heat exchanger tube with conical strip vortex generators. Appl. Therm. Eng. 2017, 122, 642–652. [Google Scholar] [CrossRef]
  2. Xi, L.; Xu, L.; Gao, J.; Zhao, Z.; Li, Y. Numerical analysis and optimization on flow and heat transfer performance of a steam-cooled ribbed channel. Case Stud. Therm. Eng. 2021, 28, 101442. [Google Scholar] [CrossRef]
  3. Izadi, M.; Mohebbi, R.; Sajjadi, H.; Delouei, A.A. LTNE modeling of Magneto-Ferro natural convection inside a porous enclosure exposed to nonuniform magnetic field. Phys. A Stat. Mech. Appl. 2019, 535, 122394. [Google Scholar] [CrossRef]
  4. Jeong, H.-S.; Seo, J.-W.; Kim, K.-Y. Multi objective optimization of a slit rib in a rectangular cooling channel. Heat Transf. Res. 2018, 49, 395–412. [Google Scholar] [CrossRef]
  5. Seo, J.-W.; Afzal, A.; Kim, K.-Y. Efficient multi-objective optimization of a boot-shaped rib in a cooling channel. Int. J. Therm. Sci. 2016, 106, 122–133. [Google Scholar] [CrossRef]
  6. Mamourian, M.; Milani Shirvan, K.; Mirzakhanlari, S. Two phase simulation and sensitivity analysis of effective parameters on turbulent combined heat transfer and pressure drop in a solar heat exchanger filled with nanofluid by Response Surface Methodology. Energy 2016, 109, 49–61. [Google Scholar] [CrossRef]
  7. Bu, S.; Yang, Z.; Zhang, W.; Liu, H.; Sun, H. Research on the thermal performance of matrix cooling channel with response surface methodology. Appl. Therm. Eng. 2016, 109, 75–86. [Google Scholar] [CrossRef]
  8. Shi, X.; Li, S.; Mu, Y.; Yin, B. Geometry parameters optimization for a microchannel heat sink with secondary flow channel. ICHMT 2019, 104, 89–100. [Google Scholar] [CrossRef]
  9. Wen, J.; Li, K.; Liu, Y.; Wu, M.; Wang, S. Multi-objective optimization of serrated fin in plate-fin heat exchanger by fluid structure interaction. J. Xi’an Jiaotong Univ. 2018, 52, 130–135. (In Chinese) [Google Scholar]
  10. Zheng, N.; Liu, P.; Liu, Z.; Liu, W. Numerical simulation and sensitivity analysis of heat transfer enhancement in a flat heat exchanger tube with discrete inclined ribs. Int. J. Heat Mass Transf. 2017, 112, 509–520. [Google Scholar] [CrossRef]
  11. Feng, G. Research progress in the flow induced vibration mechanism of tube bundles in heat exchangers and precautionary measures. Chem. Ind. Eng. Prog. 2012, 31, 508–512. (In Chinese) [Google Scholar]
  12. Abdulhay, B.; Bourouga, B.; Dessain, C. Experimental and theoretical study of thermal aspects of the hot stamping process. Appl. Therm. Eng. 2011, 31, 674–685. (In Chinese) [Google Scholar] [CrossRef]
  13. Zhao, Z.; Xu, L.; Gao, J.; Xi, L.; Li, Y. Study on the Flow and Heat Transfer Characteristics of the Heat Exchanger with Cone-Type Vortex Generaters. J. Xi’an Jiaotong Univ. 2021, 10, 131–143. (In Chinese) [Google Scholar]
  14. Luo, L.; Du, W.; Wang, S.; Wang, L.; Sundén, B.; Zhang, X. Multi-objective optimization of a solar receiver considering both the dimple/protrusion depth and delta-winglet vortex generators. Energy 2017, 137, 1–19. [Google Scholar] [CrossRef]
  15. Zeng, M.; Zhang, G.; Li, Y.; Niu, Y.; Ma, Y.; Wang, Q. Geometrical Parametric Analysis of Flow and Heat Transfer in the Shell Side of a Spiral-Wound Heat Exchanger. HTrEn 2015, 36, 790–805. [Google Scholar] [CrossRef]
  16. Liu, J.; Song, Y.; Xie, G.; Sunden, B. Numerical modeling flow and heat transfer in dimpled cooling channels with secondary hemispherical protrusions. Energy 2015, 79, 1–19. [Google Scholar] [CrossRef]
  17. Kim, H.-M.; Moon, M.-A.; Kim, K.-Y. Multi-objective optimization of a cooling channel with staggered elliptic dimples. Energy 2011, 36, 3419–3428. [Google Scholar] [CrossRef]
  18. Elyyan, M.A.; Rozati, A.; Tafti, D.K. Investigation of dimpled fins for heat transfer enhancement in compact heat exchangers. Int. J. Heat Mass Transf. 2008, 51, 2950–2966. [Google Scholar] [CrossRef]
  19. Courand, A.; Metz, M.; Héran, D.; Feilhes, C.; Prezman, F.; Serrano, E.; Bendoula, R.; Ryckewaert, M. Evaluation of a robust regression method (RoBoost-PLSR) to predict biochemical variables for agronomic applications: Case study of grape berry maturity monitoring. Chemom. Intell. Lab. Syst. 2022, 221, 104485. [Google Scholar] [CrossRef]
  20. Sobol′, I.M. Global sensitivity indices for nonlinear mathematical models and their Monte Carlo estimates. Math. Comput. Simul. 2001, 55, 271–280. [Google Scholar] [CrossRef]
  21. Song, Y.; Wang, Y.; Yang, S.; Wang, S.; Yang, M. Sensitivity analysis and parameter optimization of energy consumption for underwater gliders. Energy 2020, 191, 116506. [Google Scholar] [CrossRef]
  22. Saltelli, A.; Annoni, P.; Azzini, I.; Campolongo, F.; Ratto, M.; Tarantola, S. Variance based sensitivity analysis of model output. Design and estimator for the total sensitivity index. Comput. Phys. Commun. 2010, 181, 259–270. [Google Scholar] [CrossRef]
  23. Deb, K.; Pratap, A.; Agarwal, S.; Meyarivan, T. A fast and elitist multiobjective genetic algorithm: NSGA-II. IEEE Trans. Evol. Comput. 2002, 6, 182–197. [Google Scholar] [CrossRef] [Green Version]
  24. Xu, L.; Ruan, Q.; Shen, Q.; Xi, L.; Gao, J.; Li, Y. Optimization Design of Lattice Structures in Internal Cooling Channel with Variable Aspect Ratio of Gas Turbine Blade. Energies 2021, 14, 3954. [Google Scholar] [CrossRef]
Figure 1. Physical model of the periodic channel with staggered frustums of a cone.
Energies 15 01240 g001
Figure 2. The calculation model of the channel.
Energies 15 01240 g002
Figure 3. The grid diagram of the calculation model.
Energies 15 01240 g003
Figure 4. Verification of the numerical method.
Energies 15 01240 g004
Figure 5. Flow chart of the optimization of the channel parameters.
Energies 15 01240 g005
Figure 6. Comparison between numerical calculation and RSM prediction: (a) Nu/Nu0; (b) f/f0.
Energies 15 01240 g006
Figure 7. 3D surface and contour map of Nu/Nu0: (a) Re–α; (b) Re–Z1/D; (c) Re–Z2/D; (d) α–Z1/D; (e) α–Z2/D; (f) Z1/D–Z2/D.
Energies 15 01240 g007
Figure 8. 3D surface and contour map of f/f0: (a) Re–α; (b) Re–Z1/D; (c) Re–Z2/D; (d) α–Z1/D; (e) α–Z2/D; (f) Z1/D–Z2/D.
Energies 15 01240 g008
Figure 9. Sensitivity of the parameters when the response is Nu/Nu0: (a) first-order sensitivity index; (b) total sensitivity index.
Energies 15 01240 g009
Figure 10. Sensitivity of the parameters when the response is f/f0: (a) first-order sensitivity index; (b) total sensitivity index.
Energies 15 01240 g010
Figure 11. Solution set of multi-objective optimization.
Energies 15 01240 g011
Figure 12. Result of K-means clustering of the Pareto solution set.
Energies 15 01240 g012
Figure 13. The Comparison of Reference Channel and Optimization Point C: (a) Surface Streamline and Temperature Distribution of the Reference Channel; (b) Surface Streamline and Temperature Distribution of the Optimized Channel; (c) Nu Distribution of the Reference Channel; (d) Nu Distribution of the Optimized Channel.
Energies 15 01240 g013
Table 1. Variation range of channel parameters.
Channel ParametersVariation Ranges
Reynolds number Re5000 to 15,000
Frustum of a cone angle α0 to 30
Streamwise spacing ratio Z1/D1 to 1.5
Spanwise spacing ratio Z2/D1 to 1.5
Table 2. Central composite face-centered design table.
OrderDesign VariablesResponses
ReαZ1/DZ2/Df/f0Nu/Nu0
1500001.501.501.381.39
210,000151.251.251.911.65
3500001.001.501.461.28
415,00001.501.501.531.46
510,000151.251.002.301.60
610,00001.251.251.791.37
7500001.501.002.101.40
815,000151.251.252.091.71
915,000301.001.004.962.45
1010,000151.001.252.651.85
1110,000151.251.501.641.64
1215,00001.001.003.261.15
1315,00001.501.002.381.41
145000301.001.002.992.04
1515,000301.501.502.462.35
165000301.001.501.911.90
1715,000301.501.002.511.99
1815,00001.001.502.881.80
195000151.251.251.691.56
2015,000301.001.503.292.45
2110,000151.501.251.741.67
225000301.501.002.171.93
2310,000301.251.253.042.37
24500001.001.002.391.28
255000301.501.501.491.82
Table 3. Coefficients of response surface model.
CoefficientsNu/Nu0f/f0
β00.2309.66
β10.240 × 10−40.355 × 10−3
β20.239 × 10−10.800 × 10−3
β3–1.78–9.75
β43.09–3.04
β110.0000.000
β220.758 × 10−30.188 × 10−2
β330.9803.28
β44–1.26–0.320
β120.100 × 10−50.200 × 10−5
β13–0.340 × 10⁻⁴–0.195 × 10⁻³
β140.650 × 10−40.230 × 10−4
β23–0.149 × 10⁻¹–0.319 × 10⁻¹
β24–0.955 × 10⁻²–0.990 × 10⁻²
β34−0.2181.76
Table 4. Fitting accuracy of response surface model.
Evaluation IndexNu/Nu0f/f0
RMSE0.10480.2445
R20.94910.9399
Table 5. Optimal channel parameters.
TypeReαZ1/DZ2/DNu/Nu0f/f0
Reference channel10,000151.251.251.651.91
Optimization point A503029.941.291.491.811.53
Optimization point B772329.881.391.462.011.89
Optimization point C12,43326.621.421.442.082.06
Optimization point D14,73026.101.401.492.112.09
Publisher’s Note: MDPI stays neutral with regard to jurisdictional claims in published maps and institutional affiliations.

