Article

Porewater Geochemical Assessment of Seismic Indications for Gas Hydrate Presence and Absence: Mahia Slope, East of New Zealand’s North Island

1
Department of Physical and Environmental Science, Texas A&M University—Corpus Christi, Corpus Christi, TX 78412, USA
2
GEOMAR Helmholtz Centre for Ocean Research Kiel, 24103 Kiel, Germany
3
School of Environment, University of Auckland, Private Bag 92019, Auckland 1142, New Zealand
4
Hawai’i Natural Energy Institute, University of Hawai‘i at Mānoa, Honolulu, HI 96822, USA
5
US Naval Research Laboratory, Code 6181, 4555 Overlook Ave., SW, Washington, DC 20001, USA
6
National Institute of Water and Atmosphere, Wellington 5012, New Zealand
*
Author to whom correspondence should be addressed.
Energies 2022, 15(3), 1233; https://doi.org/10.3390/en15031233
Submission received: 30 December 2021 / Revised: 30 January 2022 / Accepted: 2 February 2022 / Published: 8 February 2022

Abstract

:
We compare sediment vertical methane flux off the Mahia Peninsula, on the Hikurangi Margin, east of New Zealand’s North Island, with a combination of geochemical, multichannel seismic and sub-bottom profiler data. Stable carbon isotope data provided an overview of methane contributions to shallow sediment carbon pools. Methane varied considerably in concentration and vertical flux across stations in close proximities. At two Mahia transects, methane profiles correlated well with integrated seismic and TOPAS data for predicting vertical methane migration rates from deep to shallow sediment. However, at our “control site”, where no seismic blanking or indications of vertical gas migration were observed, geochemical data were similar to the two Mahia transect lines. This apparent mismatch between seismic and geochemistry data suggests a potential to underestimate gas hydrate volumes based on standard seismic data interpretations. To accurately assess global gas hydrate deposits, multiple approaches for initial assessment, e.g., seismic data interpretation, heatflow profiling and controlled-source electromagnetics, should be compared to geochemical sediment and porewater profiles. A more thorough data matrix will provide better accuracy in gas hydrate volume for modeling climate change and potential available energy content.

1. Introduction

Gas hydrates distributed through marine sediment and polar permafrost are known to contain extensive methane (CH4) and higher-molecular-weight gas volumes [1]. Compared to other fossil fuel reservoirs (e.g., coal, oil and conventional natural gas), global gas hydrate deposits potentially contain twice the energy [2,3]. However, estimates of global marine gas hydrate deposits are highly variable, thus highlighting the need to continually improve the global inventory [1,3,4,5,6]. A critical region of marine gas hydrate systems is the upper limit of gas hydrate stability in sediments, sometimes referred to as the feather edge of hydrate stability, e.g., [7,8,9,10]. It is this shallow part of the gas hydrate system that is most susceptible to ocean warming associated with climate change, which would lead to gas hydrate dissociation and methane release into the water column [11]. There are a range of factors that mitigate the potential influence of hydrate dissociation on atmospheric greenhouse gas concentrations, such as the depth of hydrates beneath the seafloor, and the fact that methane is predominantly dissolved within the water column during ascent toward the sea surface [11]. However, there are complex interactions between warming waters, hydrate dissociation and methane release into the oceans that can exacerbate effects of climate change, such as changes to ocean biogeochemistry, e.g., [12]. It is therefore important to study the shallowest parts of gas hydrate systems and gain a better understanding of hydrate concentrations and methane flux through the seafloor.
Sediment seismic profiling provides an initial understanding of marine gas hydrate distribution [13,14,15]. Further evaluation of deep sediment gas hydrate volumes and locations have been developed with a combination of geophysical and geochemical data interpretation [16,17,18,19,20]. Initial observations of seismic and geochemistry data off the mid-Chilean margin suggested gas hydrate volume could be greater at a location where seismic data showed less intense, narrow seismic blanking rather than strong vertical seismic blanking, which is indicative of high vertical fluid and gas migration [16]. A combination of geochemical and seismic data evaluation has been applied at Atwater Valley in the Gulf of Mexico during the ChevronTexaco JIP gas hydrate evaluation [17]. At this study site, geochemical data across a region with pronounced upwarping in the seismic bottom simulating reflection (BSR) were shown to be a site where gas hydrates are likely not present in high concentrations, resulting from salt diapir intrusions creating gas hydrate instability and higher vertical CH4 advection [17]. With further integration of seismic and geochemical data, on the Porangahau Ridge in the Hikurangi Margin, geochemical profiles indicate moderate vertical gas migration in a region where seismic reflectivity, shoaling of the BSR indicative of a heat flow anomaly and controlled-source electromagnetic data anomalies suggest gas hydrate distribution and active fluid and gas advection [19,20]. A carbon isotope mass balance showed the highest CH4 flux, where these diverse geophysical data indicated strong advection. It is interesting that these data from New Zealand suggested moderate vertical CH4 migration relative to work done in the Gulf of Mexico and off the mid-Chilean margin.
There is a continuing effort in the world’s oceans to provide a thorough assessment of gas hydrate abundance [21]. While we recognize the capability to assess deep sediment gas hydrate deposits is enhanced with the combination of seismic and geochemical data, there are also clear indications that hydrate characterization and quantification are improved through the inclusion of additional, diverse data. Heatflow measurements help integrate geochemical and seismic data in regions of shallow sulfate–methane transition (SMTZ) zones and anomalous BSRs that correlate with raised heat advection, e.g., [15,20,22]. Further development in the gas hydrate prediction capability has been observed with the inclusion of controlled-source electromagnetic data [20,23,24].
This study focuses on seismic and geochemical data off the Mahia Peninsula along the eastern coast of New Zealand. The aim of our study is to investigate methane flux through shallow seafloor sediments in regions where there are clear seismic indications for active gas migration. Our approach is to quantify the methane flux through the seafloor that is related to these seismic indicators of fluid flow. We used a “control site” with no conspicuous seismic indications for strong vertical gas flux to put our other results into a regional context. Intriguingly, high methane flux through this control site brings into question the reliability of broad seismic interpretations of focused fluid flow for evaluating gas hydrate distribution and shallow subseafloor methane flux. The implication is that global estimates of hydrate abundance and methane flux could be underestimated if there are widespread hydrate deposits in regions with no BSRs and no other clear seismic indications for focused fluid flow.

2. Methods

Site Description—This study site is located off the North Island of New Zealand within the East Coast Basin (Figure 1). Through this region, the Pacific Plate is subducting beneath the Australian Plate. Selection of core locations with a focus on vertical fluid and gas advection and diffusion was derived through review of 2D seismic reflection datasets. Seismic reflection data show a wide range of direct hydrocarbon gas indicators, including locally enhanced reflections (bright spots) and other indications of focused fluid flow. Core site selection was based on coinciding with anomalies in the seismic profiles, as well as seafloor depressions and anomalous backscatter in bathymetry data (where present) that are suspected to identify the presence of active CH4 gas seepage through the seafloor.
The East Coast Basin is filled with mid-Cretaceous to Cenozoic strata, which reach total thicknesses of over 6000 m in the deepest parts of the basin [25]. Seismic data and basin modeling indicate that total strata thicknesses are great enough to allow source rocks to reach maturity for petroleum expulsion in parts of the basin (particularly in the west). There are four stratigraphic units of mid-Cretaceous–Late Paleocene age that crop out onshore and have thermogenic source potential [25]. Potential reservoir rocks include both deep-water and shelf sandstones and carbonates [25]. With regard to oil and gas, outcrop studies generally indicate that the younger the formation, the better the reservoir properties [25]. The most prospective reservoir rocks are likely to be mass-flow sandstone facies that have been deposited within channel and basin-floor fan systems at bathyal depths.
The distribution of BSRs in seismic data within the study region, coupled with previous studies [15,19,20,26,27,28,29,30,31], indicates that gas hydrates are widespread in the Hikurangi Margin. However, several play concepts have been developed through this study region and are likely to include biogenic and thermogenic gas source(s) [19,32]. Structural traps are likely to be the dominant style, although stratigraphic traps are also possible, and play types include Cretaceous slope and basin-floor fans, Neogene shelf sandstones, Neogene slope and basin-floor fans, pinchout and onlap structures associated with sandstone rich facies, and Neogene limestones overlying structural highs [33]. Top-seals are potentially provided by the mudstone-dominated Paleogene Wanstead and Weber formations, as well as by Neogene mudstones. The base of gas hydrate stability may act as a seal to gas accumulations beneath the hydrate layer, particularly in regions of pronounced seafloor topography at ridges [31,34]. Gas hydrates in sandy sediments represent an unconventional play type in the northern East Coast Basin.
Seismic Data—We collected seismic reflection data during Voyage TAN1808 with a 600 m long GeoEel digital seismic streamer with 48 hydrophone groups and a group spacing of 12.5 m. The near offset channel (channel 1) was 162 m behind the source. The seismic source for the survey was a single GI gun used in true GI mode with a 45 cubic inch generator volume and a 105 cubic inch injector volume (i.e., a 45/105 setup). The gun was towed at 3.5 m depth. Air pressure into the GI gun was nominally set at 2100 PSI. Data were collected with a nominal ship speed of 4.5 knots and a shot interval of six seconds. Data were recorded to a record length of five seconds at a sampling rate of 0.5 ms.
Seismic data were processed on board using a combination of Seismic Unix and Globe Claritas. Receiver geometry was defined based on the measured offset between the shot position and the first receiver. We used a crooked line geometry and binning with a 6.25 m common midpoint (CMP) spacing, which resulted in a nominal fold of 24 traces per CMP gather. Travel times were checked from the seafloor to the first multiple to determine the recording delay (16 ms), which was then corrected. This was cross-checked with the hydroacoustic data to ensure that the recording delay was correct. A bandpass filter with corner frequencies of 15, 35, 150 and 200 Hz was applied to the data and corrected for spherical divergence by applying a velocity-squared correction using a water velocity of 1500 m/s. This constant velocity was then used to apply a normal-moveout correction to the CMP gathers prior to stacking. Then there was application of a finite-difference 2D time-migration routine using the constant 1500 m/s velocity. Finally, we applied a bandpass filter with corner frequencies of 2, 5, 200 and 300 Hz to the migrated data before resampling them to a 1 ms sample rate and writing to SEG-Y format [15].
Seismic line 05CM-01 across our study area was acquired in 2005 as part of a regional grid of 2D seismic lines data commissioned by New Zealand’s Ministry of Economic Development. An air-gun array with a total volume of 68 L (4140 in3) operated at 138 bars (2000 psi). The shot interval was 37.5 m and the channel interval 12.5 m in a 12 km long streamer. For the purpose of gas hydrate studies, data were processed in the same manner as for a study along 05CM-04 further north [16] with the aim of achieving maximum resolution and preserving amplitudes. Processing included binning at 6.25 m CMP spacing, selection of near traces with the closest shot-receiver spacing, Butterworth bandpass filtering at 2/8–80/120 Hz, normal-moveout (NMO) correction at 1500 m/s, amplitude correction for spherical divergence (two-way travel time squared) and post-stack finite-difference migration using a velocity of 1500 m/s. Refer to Navalpakam et al. [26] for further details on acquisition and processing of the data.
TOPAS Data—We used a TOPAS PS 18 Parametric Sub-Bottom Profiler (SBP) which is permanently mounted on the hull of RV Tangaroa. The system was set to transmit with a linear chirp, with chirp frequencies of 2.0 to 6.0 Hz, with a chirp length of 25 ms in water depths greater than 200 m and 15 ms in water depths shallower than 200 m. The TOPAS PS 18 system is stabilized for heave, roll and pitch movements to increase signal quality. The TOPAS data represent the envelope of the received waveform. We wrote the TOPAS data out in SEG-Y format so that they could be loaded into interpretation software and interpreted together with the seismic data [25].
Geochemical Data—Piston coring was led by NIWA using a basic 708 kg weight with 1034 kg possible by loading extra weights to the top of the core column. The piston consisted of a single unit and was operated without O-ring seals. The trigger arm was set to drop 2 to 5 m. Core barrels, 2–7/8 inches in diameter and composed of a Schedule 40 polyethylene plastic line pipe, were generally sectioned to an 8 m length. In situations where recoveries were not acceptable, barrel lengths were decreased, or a gravity triggered core was deployed and drop depths were tested.
Piston core processing was initiated on the deck by observing core characteristics and deciding upon sections to cut for porewater and sediment sampling. In consistent patterned cores, sections were taken at 10–40 cm intervals to provide 20–25 subsamples through the core. Subsamples were distributed for onboard laboratory analysis of sediment CH4 and porewater sulfate (SO42−). Subsamples were also taken and preserved for DIC concentrations and carbon stable isotope and concentration analyses (sediment and porewater) back at the Texas A&M University—Corpus Christi (TAMU-CC) and Naval Research Laboratory (NRL) [19].
In the ship’s laboratory, rhizon syringe extractions were used to obtain porewater samples [35,36,37]. In this process, cores were cut in 20–40 cm subsections and capped. Small holes were drilled in the middle of each core subsection to fit the rhizon syringe and limit atmospheric exposure. Depending on the porewater content this sampling took 2–4 h. Subsequently porewater was dispensed for onboard and shore-based analyses.
Porewater sulfate concentrations (SO42−) were measured on board with a Dionex DX-120 ion chromatograph equipped with an AS-9HC column. Samples were diluted 1:50 (vol/vol) prior to analysis and measured against certified anion standards and a 1:50 diluted IAPSO seawater (28.9 mM SO4−2) check standard. SO42− were converted to millimolar units (mM). Limit of detection for SO42− was <0.1 mM [19].
Sediment porosity is pertinent to calculations of vertical SO42− diffusion and was determined by mass difference between wet and dry sediments [19]. Sediment samples were stored frozen in preweighed snap-tight Petri dishes and analyzed back in the home laboratory.
Sediment organic carbon (SOC) and total carbon (TC) concentrations and stable carbon isotope ratios were surveyed to determine spatial variation in the vertical migration of CH4. For SOC, sediments were weighed into silver capsules, acidified with excess 10% HCl to remove inorganic carbon and dried at 60 °C. For TC, sediments were weighed into tin capsules and analyzed with no further treatment. Percent calcium carbonate (%CaCO3) is determined by subtracting %SOC from the %TC. δ13C analysis was conducted with a Thermo Delta V IRMS (Thermo Scientific, Waltham, MA, USA) [19]. Sediment δ13CTIC was calculated using a mass and isotope balance [19]. δ13C was run in triplicate, providing a standard deviation of 0.1‰.
Data interpretation involved evaluation of SO42− concentrations and vertical profiles to interpret the anaerobic oxidation of methane (AOM) and predict spatial variation in the vertical CH4 flux. An analysis of vertical SO42− profiles provides estimates of the deep system vertical methane flux to shallow sediments. AOM occurs by way of a metabolic partnership between methanogen-like archaea that oxidize CH4 and SO4−2 reducing bacteria [17,38,39], as described by the following net reaction:
CH4 + SO4−2 → HCO3 + HS + H2O
In sediments with vertical CH4 flux, AOM may be the dominant pathway for SO4−2 reduction [18,19]. In such locations, the depth of the sulfate–methane transition (SMT) and rates of AOM are controlled by the vertical CH4 flux (diffusive and advective) and downward SO4−2 diffusion [40,41]. Spatially quantifying CH4 fluxes and SMTZ depths provides summaries of potential deep sediment gas hydrate deposits [41,42]. For data interpretation in the following results and discussion, the 1:1 CH4 oxidation to SO42− reduction is stated to be negative diffusion rates with reference to loss of SO42− and CH4 (Equation (1)).

3. Results

This study compares seismic and geochemistry data in three locations, with two Mahia transects compared to a control site (Figure 1b). In the analysis of sediment gases, only CH4 was observed. Higher-molecular-weight gases were not present. The control site was intended to provide a region with low to no vertical gas fluxes. Selection of the control site was based on a review of seismic and TOPAS profiles that did not show any patterns indicative of vertical gas and fluid migration. Based on data across the Te Puke Ridge at a similar across-margin setting along line 05CM-01 further north, a BSR would be expected at ~400–500 ms two-way travel time beneath the seafloor. The data do not show any indications of vertical fluid migration in the form of blanking (Figure 2).
Sediment CH4 concentrations from cores at the three control sites were up to 3.11 mM (Figure 3). The downcore SO42− and CH4 profiles show a consistent decline in concentrations representative of anaerobic oxidation of CH4 at this control site that ranged from 257 to 495 cm below seafloor (cmbsf). We observed a decline through the SO42− profiles where the concentration slope results from a 1:1 correlation between CH4 oxidation and SO42− reduction with a range of −67.8 mmol m−2 a−1 down to -31.5 mmol m−2 a−1. These data confirm active vertical CH4 migration at this site. The apparent discrepancy between seismic and geochemical data will be discussed in Section 4.
In comparison with the control site, at Mahia Transect 1, there are strong variations in the seismic and TOPAS data with regions that indicate presence of free gas beneath the seafloor marked by high amplitudes (Figure 4). The upper termination of some of these high-amplitude reflections may mark the base of gas hydrate stability (BGHS). Further downslope, BSRs or similar seismic manifestations of the BGHS are not clearly identified. The core locations along Mahia Transect 1 are in water depths close to the predicted pinchout of the BGHS (Figure 1b), which is at ~650 m below sea level at the Tuaheni Landslide Complex further to the north [43]. Both seismic and TOPAS data show evidence for gas in shallow sediments in the range of core profiles (Figure 4). Our expectations from seismic and TOPAS data were that the highest vertical migration would occur at Core Stations 34, 61 and 4, with less active areas at Core Locations 63 and 30 (Figure 5). Porewater data matched this prediction, with the shallowest SMT and highest downward SO42− diffusion measured at Core Location 4 with values of 270 cmbsf and −73.2 mmol m−2 a−1 (Figure 5). Core 36 in this transect was observed to have the brightest reflection pattern in the TOPAS data. At this site, geochemical data also indicated active vertical gas and fluid migration with an SMT value of 550 cmbsf and a diffusion rate of −32.2 mmol m−2 a−1. Lowest vertical CH4 diffusion was measured at locations with clear horizontal stratification and no anomalous reflectivity observed in the seismic data. SMT values of 934 and 1096 cmbsf and downward SO42− diffusion measured to be −20.1 and −14.5 m−2 a−1 were measured at Cores 63 and 30, respectively (Figure 5). Note maximum SO42− diffusion and shallowest SMT at Mahia Transect 1 were in a similar range to values measured at the control site where TOPAS and seismic data did not indicate any vertical gas migration.
For Mahia Transect 2, as in Mahia Transect 1, we used high-amplitude reflections in seismic data marking shallow gas occurrence, as well as near-seafloor faults in TOPAS data, indicating potential fluid-migration paths, to select piston core sites (Figure 6). Through the seismic and TOPAS profiles there was a moderate indication of vertical fluid and gas migration upslope and downslope across a mound (Figure 6). Again, these seismic profiles corroborated geochemistry data, and profiles for this region showed a similar pattern across Sites 39, 57 and 43 with a range in SMT of 238 to 405 cmbsf and vertical fluid and gas migration of −47.5 to −69.8 mmol m−2 a−1 (Figure 7). With further review of seismic data, we do observe an indication of elevated fluid and gas migration at Core 37 with an SMT of 366 cmbsf and fluid and gas migration of −37.0 mmol m−2 a−1. Comparison of Mahia Transects 1 and 2 suggests moderately higher vertical CH4 migration across Mahia Transect 2 with an average of 551 cmbsf relative to 650 cmbsf for Mahia Transect 1. While seismic and geochemistry profiles at Mahia Transects 1 and 2, this correlation is not observed at the control site.
From each site, cores with the highest vertical CH4 flux and the shallowest SMT are presented for comparison of sediment organic and inorganic carbon concentration and δ13C (Figure 8). For all 3 sites, %OC ranged from 0.71% to 0.38%, with the high and low values measured at Control Station 01 (Figure 8). Mahia Transect 1 and Transect 2 were intermediate, with more consistent values. The δ13C of organic carbon through the cores ranged from −21.6‰ to −23.0‰. This scale was observed through Cores 01, 04 and 43, showing a narrower range at a consistent intermediate value (Figure 8). Over the scale of these data, there was an observation of δ13C depletion in each core, with Cores 01 and 04 observed in the shallow core sediment and Core 43 observed deeper in the core. For the same cores, the percent total inorganic carbon (%TIC), with a few exceptions, was generally higher than the organic carbon, with values ranging from 0.46% up to 1.34%. These profiles were similar; through all of the cores, there was a mid-profile increase in the %TIC and down core decrease in %TIC (Figure 8). The δ13C of sediment TIC ranged from −7.7‰ to 1.6‰ (Figure 8). Consistent values around 0‰ were observed for Core 43, while there was moderate depletion in the shallow depth of Core 01 to −1.5‰ and substantially greater depletion in Core 04 down to −7.7‰. Do note that Core 04 was consistently lower in δ13C values throughout the entire core.

4. Discussion

Seismic and TOPAS data provide indications for vertical gas and fluid migration in the form of shallow gas, potential BSRs and images of potential fluid-migration paths along Mahia Transects 1 and 2 (Figure 4, Figure 5, Figure 6 and Figure 7). In comparison, seismic and TOPAS data for the control site do not show any clear indications of vertical migration of gas (Figure 2). Note that with gas chromatograph profiles onboard, no higher-molecular-weight gases were observed, suggesting the sediment gas source in this region is biogenic, similar to observations from a study on the Porangahau Ridge, south of this study site [19,44]. Previous studies across the eastern coast of New Zealand have demonstrated many regions where seismic data indicate active fluid and gas advection and diffusion [15,20,27,28,29,30]. These seismic data sets have provided focus regions for thorough coupling of seismic and geochemical data to assess spatial variation of present-day vertical gas migration. Previous studies coupling geochemistry and seismic data enable a regional comparison with this study on the Mahia Peninsula (Table 1). The total range of SMT and vertical gas migration from this study off Mahia Peninsula is 183 to 11,700 cmbsf (SMT) and −11.4 to −86.2 mM CH4 m−2 a−1 (vertical gas migration). These ranges indicate slightly lower vertical gas flux than predicted at Porangahau Ridge, and substantially higher than at the Chatham Rise further south, where vertical CH4 flux is absent (Table 1). With an assumption that the seafloor CH4 flux is a proxy for subseafloor hydrate saturation, geochemical data from off the eastern coast of New Zealand suggest the broad gas hydrate saturation is likely to be moderately lower than observations at Atwater Valley in the Gulf of Mexico, in the Beaufort Sea and on the Mid-Chilean Margin, while being higher than other locations in the Gulf of Mexico, off the northern coast of Russia and off Japan and Argentina (Table 1).
Further investigation of sediment gas cycling is provided with analysis of sediment organic and inorganic carbon concentration and δ13C, assuming that CH4 cycling contributes to shallow sediment carbon pools [19] (Figure 8). These data are used in this study for confirmation of deep vertical gas migration to shallow sediment and comparison of geochemical, seismic and TOPAS data correlations. In the general interpretation of stable isotope data, we assume that sediment organic and inorganic carbon is a combination of phytodetritus sedimentation and upward vertical flux of CH4, higher-molecular-weight gases and oil. Oil or higher-molecular-weight gases were not present, and we assume CH4 and phytodetritus are the primary carbon sources to shallow sediment organic or inorganic carbon [18,19]. The CH4 contribution to these sediment carbon pools would be assimilation of CO2 during anaerobic CH4 oxidation [18,19,52] and production of 13C-depleted sediment organic and inorganic carbon [17,18,19,52]. An example of this contribution of deep sediment CH4 to shallow carbon sediment pools is observed on the Porangahau Ridge, where sediment organic carbon is measured to range from −21.7‰ down to −24.7‰, and the lower 13C value is created through CH4 cycling [19]. At this same site, the anaerobic oxidation of CH4 to CO2 with oversaturation of dissolved inorganic carbon leads to formation of calcium carbonate, resulting in a TIC value of −43.9‰ [19]. On the Porangahau Ridge, CH4 cycling was estimated to contribute up to 55% and 12% to sediment inorganic and organic carbon, respectively [19]. Sediment organic and inorganic carbon from this current study are similar to Porangahau Ridge carbon data, indicating down core contributions of CH4. For a core taken from each study area (including the control site) with the maximum vertical CH4 flux estimated from the porewater SO42− profiles, sediment organic carbon stable isotope depletion was observed in each of the core profiles, and the d13C range was from −21.6‰ down to −23.7‰ (Figure 8). Enriched d13C values are attributed to sedimentation of phytodetritus, and the depleted values are a result of CH4 cycling. Sediment inorganic carbon, where 13C depletion results from anaerobic CH4 oxidation, was observed in all three profiles, with the maximum down to −7.6‰ at Core 04 and minimum depletion at −0.46‰ at Core 43. The range of values for all three sites was 1.6‰ down to −7.6‰ and generally between 0.5‰ and 1.0‰. This data summary is presented to evaluate differences in the CH4 source between the control site and Mahia Transects 1 and 2. One possibility for observation of similar SMT and vertical CH4 flux at the control site is shallow sediment organoclastic carbon cycling and no vertical fluid or gas flux [17,18,19]. If this was the cycle for CH4 production, higher percent organic sediment carbon would be required to provide the measured sediment CH4 concentrations. Comparison of the sediment organic carbon concentration between all three sites is similar (Figure 8). Therefore, we conclude all three regions are similar with respect to deep sediment vertical CH4 migration.
For further interpretation of spatial variation in vertical CH4 flux across the control site, we analyzed seismic attributes to investigate possible causes for a lack of BSRs in the presence of relatively high CH4 flux at the seafloor, based on the shallow SMT. Root-mean-square (RMS) amplitudes over a window of 7 samples (14 ms) show a continuous layer of high amplitudes at ~1800 ms that crosses into the estimated GHSZ, extending up to ~200 ms beneath the seafloor at an anticline near the southeastern termination of the displayed section (Figure 2c). The data are displayed such that the seafloor amplitude roughly reaches the maximum displayed amplitude; reflections with similar amplitudes are typical for shallow gas [30]. We interpret high-amplitude patches beneath the anticline as reflections from gas and, potentially, hydrates [31]. It is unclear if the continuous high-amplitude reflection that reaches these high-amplitude patches contains gas; it appears to display a positive polarity, which is not compatible with the presence of gas in the pores. However, we interpret this reflection to mark a permeable layer, potentially sand, that “feeds” the gas and/or hydrate patches beneath the anticline. Seismic variance marks differences in reflection character between adjacent seismic traces. Lineaments of high variance (black to orange in our plots; Figure 2d) are typically interpreted as faults or fractures [53]. A region of lineaments extends across the high-amplitude reflection to about 100 ms beneath the seafloor. From this level to the seafloor, low variance coincides with undisturbed subparallel reflections. We interpret the region of lineaments as a zone of highly fractured sediments, overlain by a sequence of undisturbed sediments.
Methane flux was relatively high in all three cores, making it unlikely that these cores by coincidence hit locations of highly focused fluid expulsion, e.g., at seeps above faults or fractures. This suggests a system with widely distributed CH4 flux near the seafloor with flux rates that should support a broad gas hydrate system that typically would be expected to include a BSR.
The absence of BSRs (or other seismic manifestations of the BGHS) at the control site either indicates a mechanism that suppresses BSR formation or a different fluid migration system. Proposed mechanisms for BSR suppression focus on a downward migrating BGHS, e.g., from subsidence [54] or seafloor erosion [55]. There is no evidence of any mechanism that leads to downward movement of the BGHS. While we cannot rule out such suppression, we propose a different cause with consideration of highly focused fluid migration across the BGHS that does not lead to a broad layer of free gas underlying gas hydrate. Fluids charged with CH4, either in the free gas phase or in solution, migrate along a permeable layer marked by high-amplitude reflection into the zone of free gas and/or gas hydrate beneath the anticline. The seal of this layer is breached by faults that act as fluid conduits, “bleeding” off some of the CH4-charged fluids. Fluid migration occurs rapidly through a network of faults, without much dissipation into adjacent sediments, thus not leading to widespread occurrence of gas beneath gas hydrates, which is the cause of BSRs in seismic data. The fracture network is covered by a drape of undisturbed layers of ~100 ms thickness (~80 m for a typical velocity of 1600 m/s for near-seafloor sediments). Fluid migration dissipates from the top of the fracture networks resulting in more even migration of fluids through these layers to the seafloor and thus less variation of CH4 flux measured in seafloor cores. Further data analysis is required to unambiguously rule out a BSR suppression mechanism: BSR suppression would still support a gas hydrate system near the BGHS that should appear, e.g., as a zone of high seismic velocities and electric resistivity, whereas our proposed model would only lead to formation of hydrate in the immediate vicinity of faults, probably without any significant geophysical signature.
More generally, shallow-water gas hydrate provinces such as this one off the coast of Mahia Peninsula are ideal locations to study gas hydrate dynamics, since they represent the most susceptible part of the hydrate system to environmental changes [11]. Future studies would benefit from the acquisition of other data types to explore the shallow gas hydrate system, such as controlled-source electromagnetic data to better characterize hydrate distribution and saturation and heat flow data to investigate hydrate stability conditions and any evidence for transient stability.

5. Conclusions

In this multidisciplinary study, we investigated the shallow extent of gas hydrate stability in a region off the coast of Mahia Peninsula on the Hikurangi margin. Our investigations incorporate both long-offset and higher-frequency seismic datasets (05CM survey and TAN1508 survey, respectively), as well as sub-bottom profiler (TOPAS) data and comprehensive geochemical analyses from piston cores. We draw the following main conclusions:
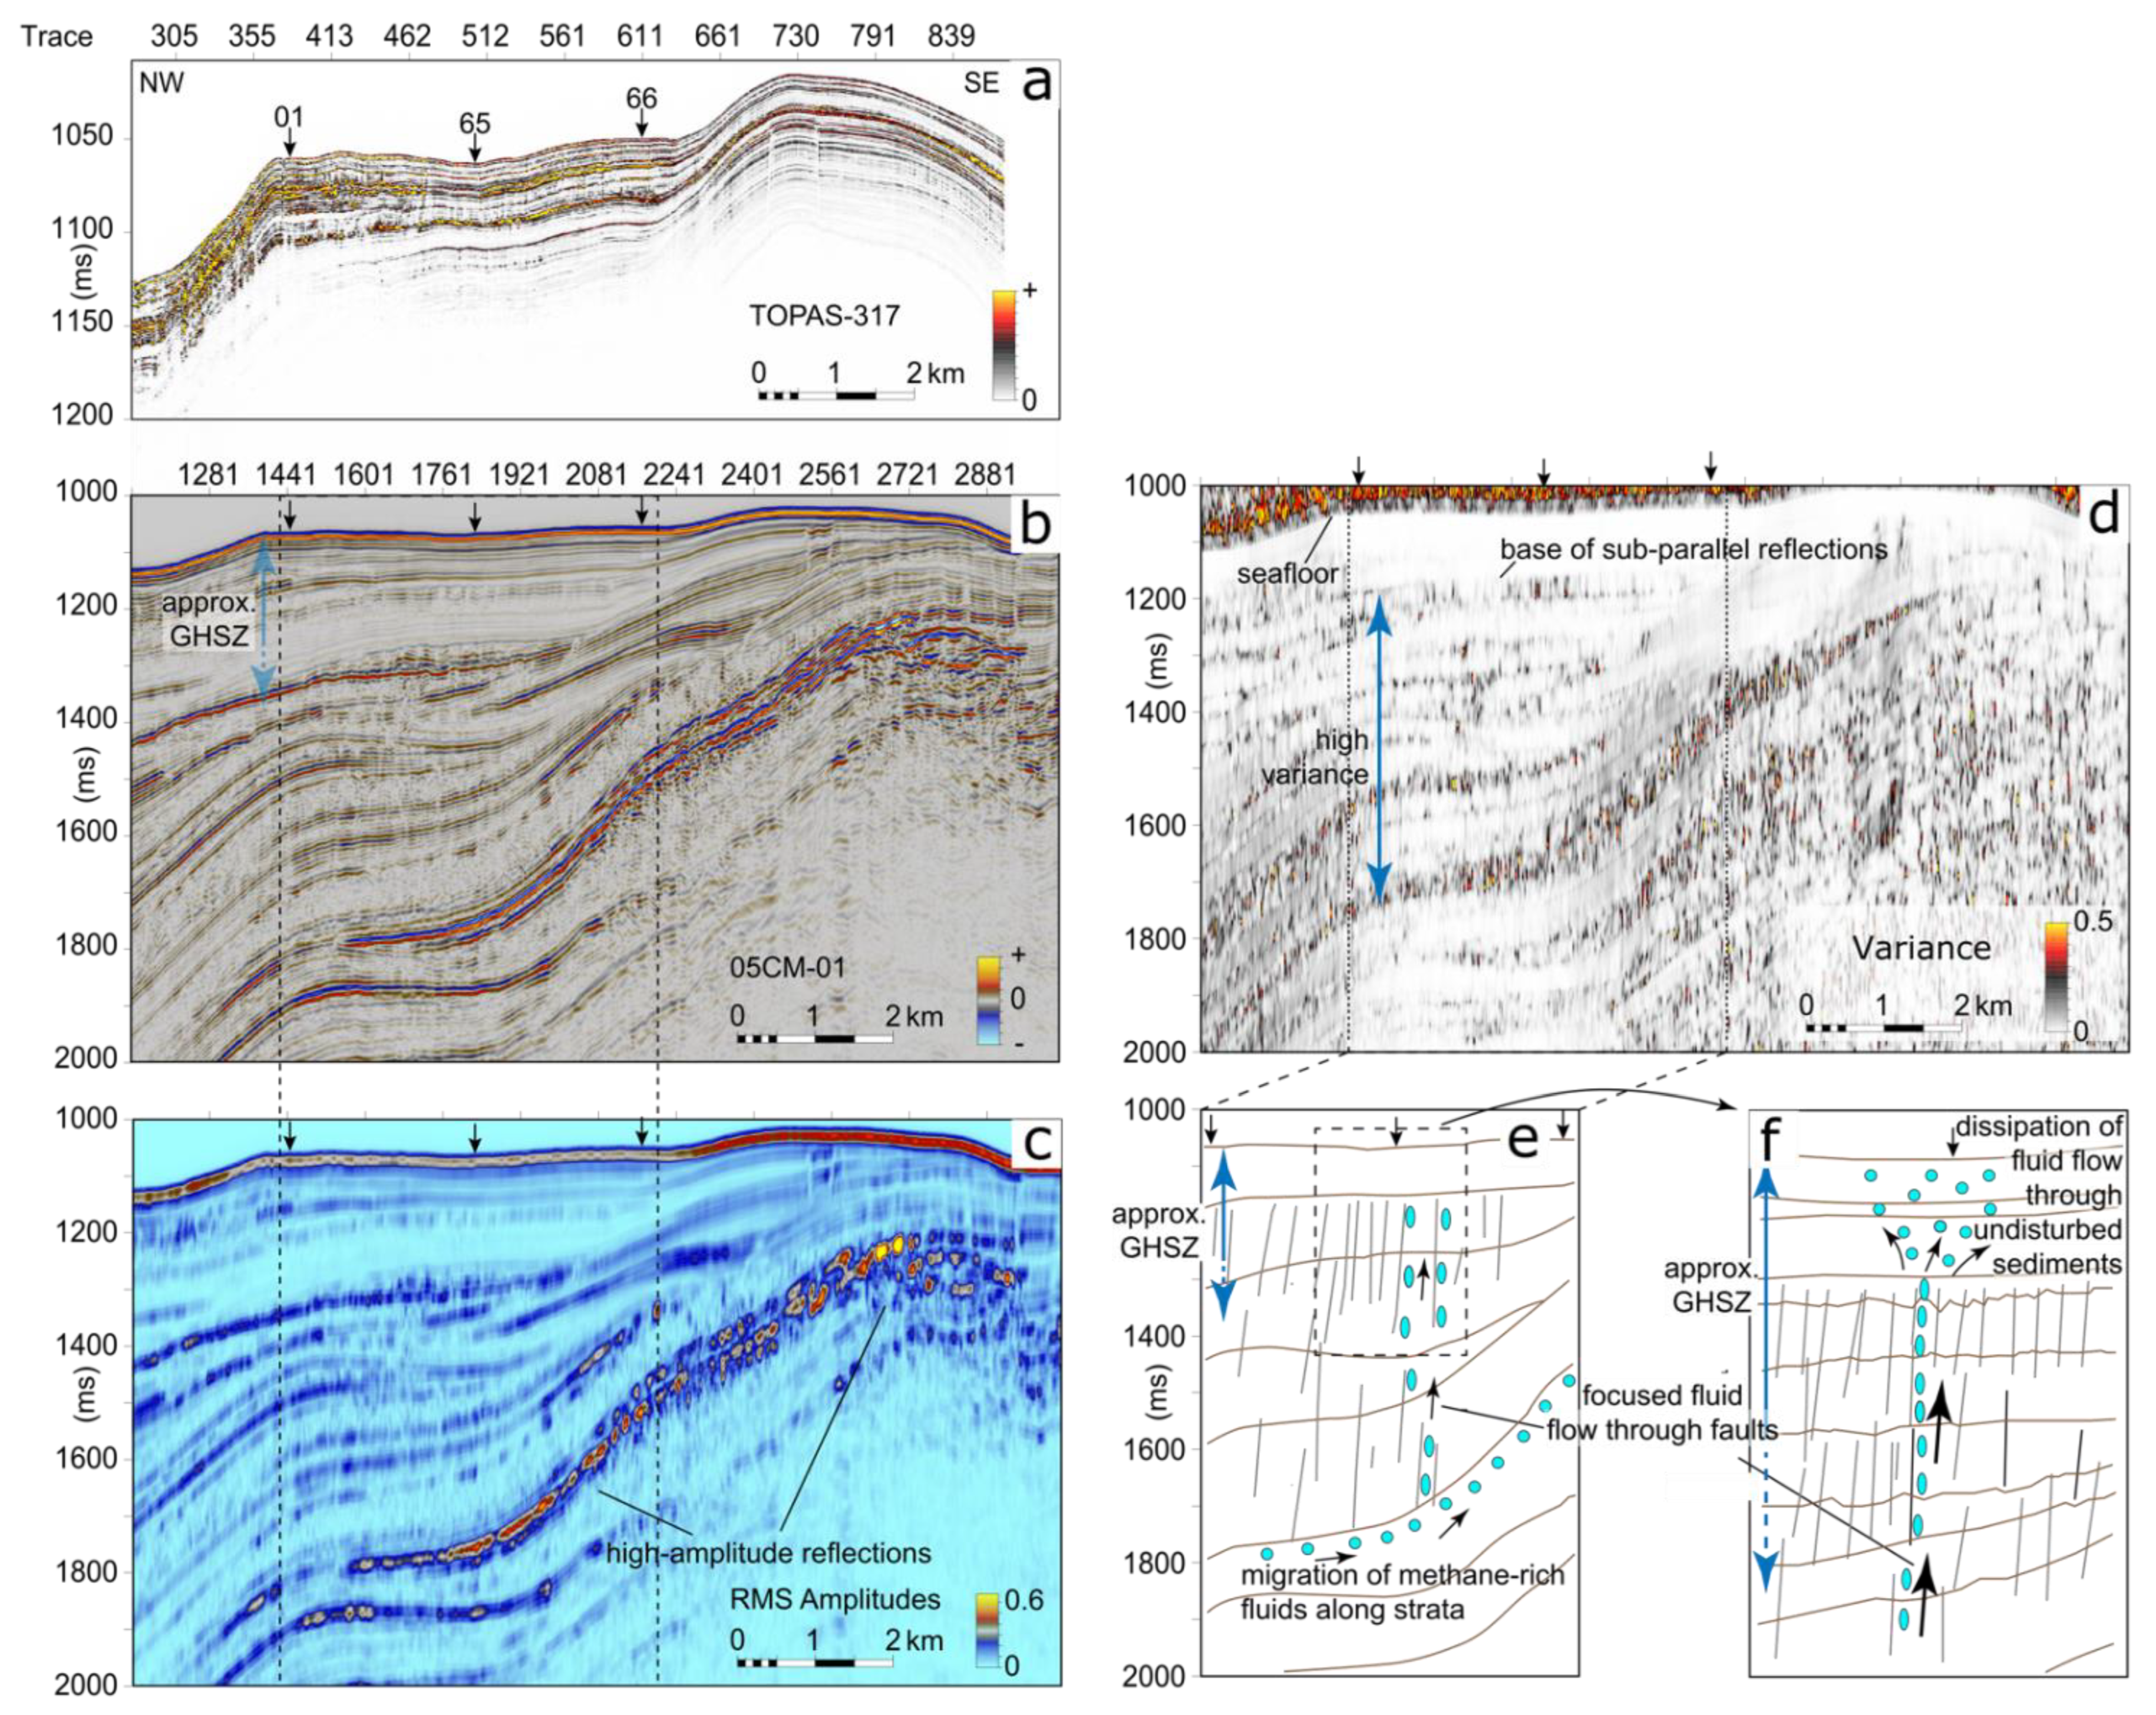
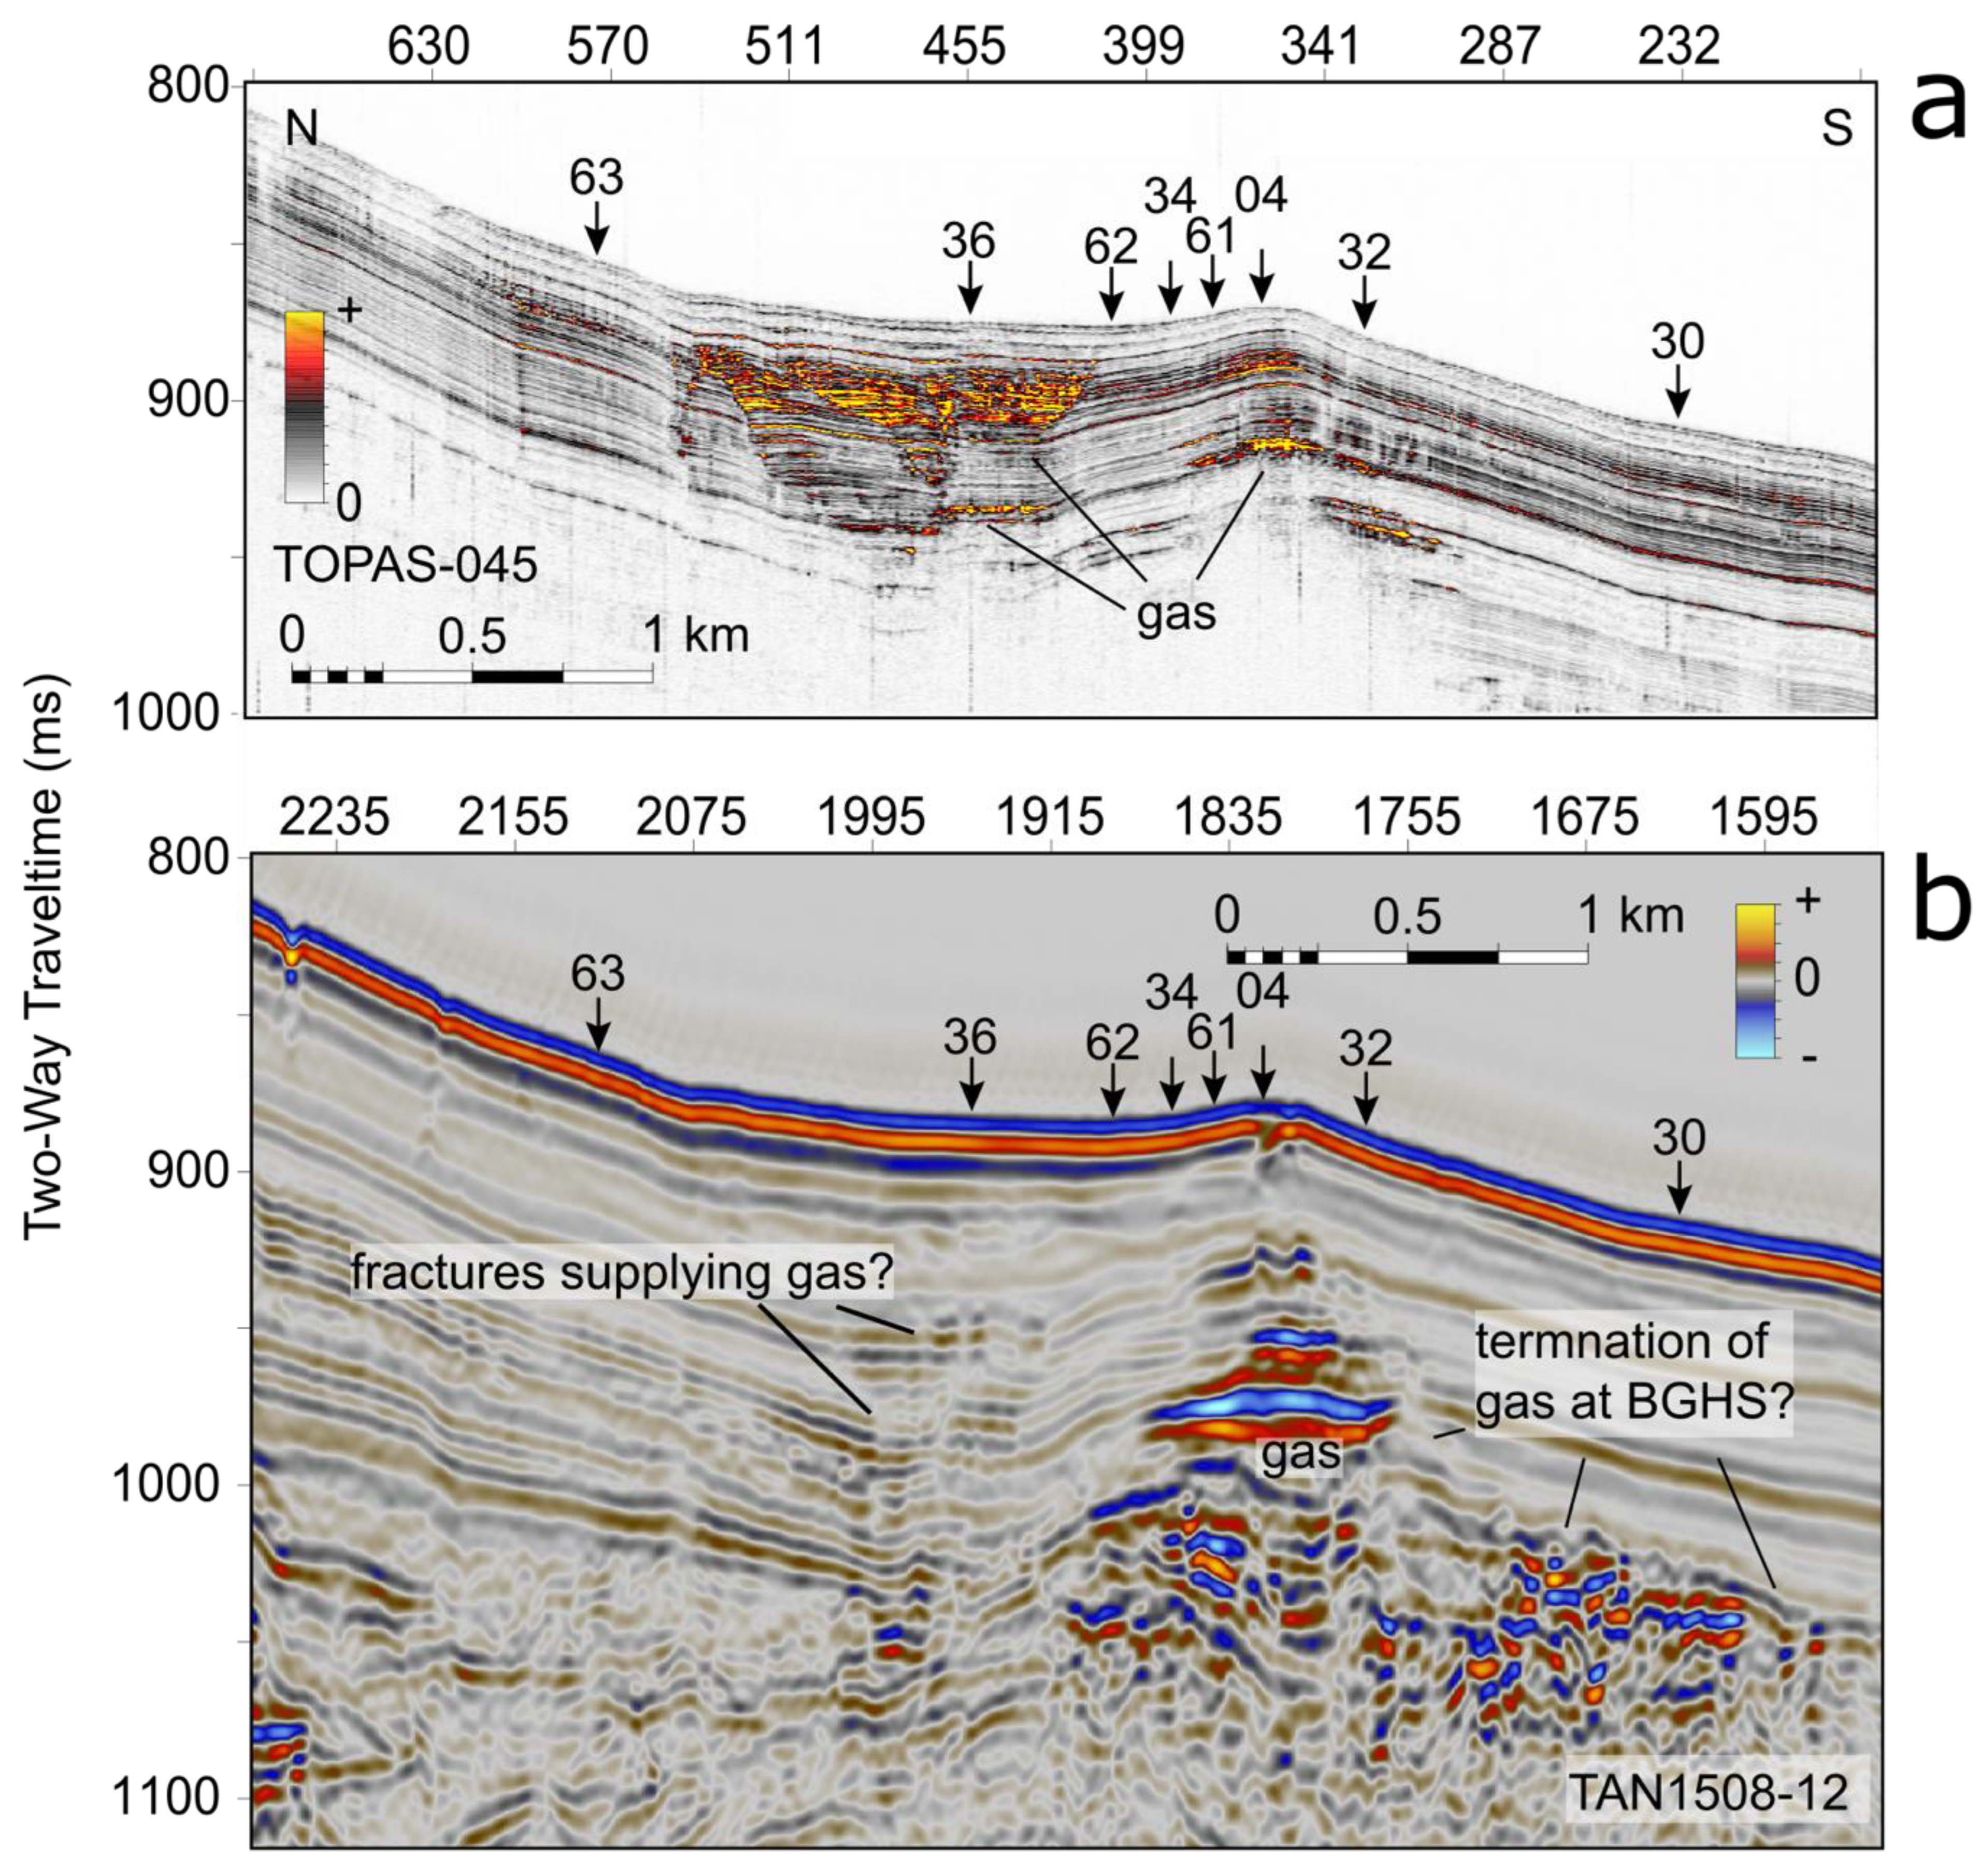
  • Seismic and sub-bottom profiler data show various indications for high vertical methane flux in the shallow subseafloor, in the shallow parts of the gas hydrate stability zone.
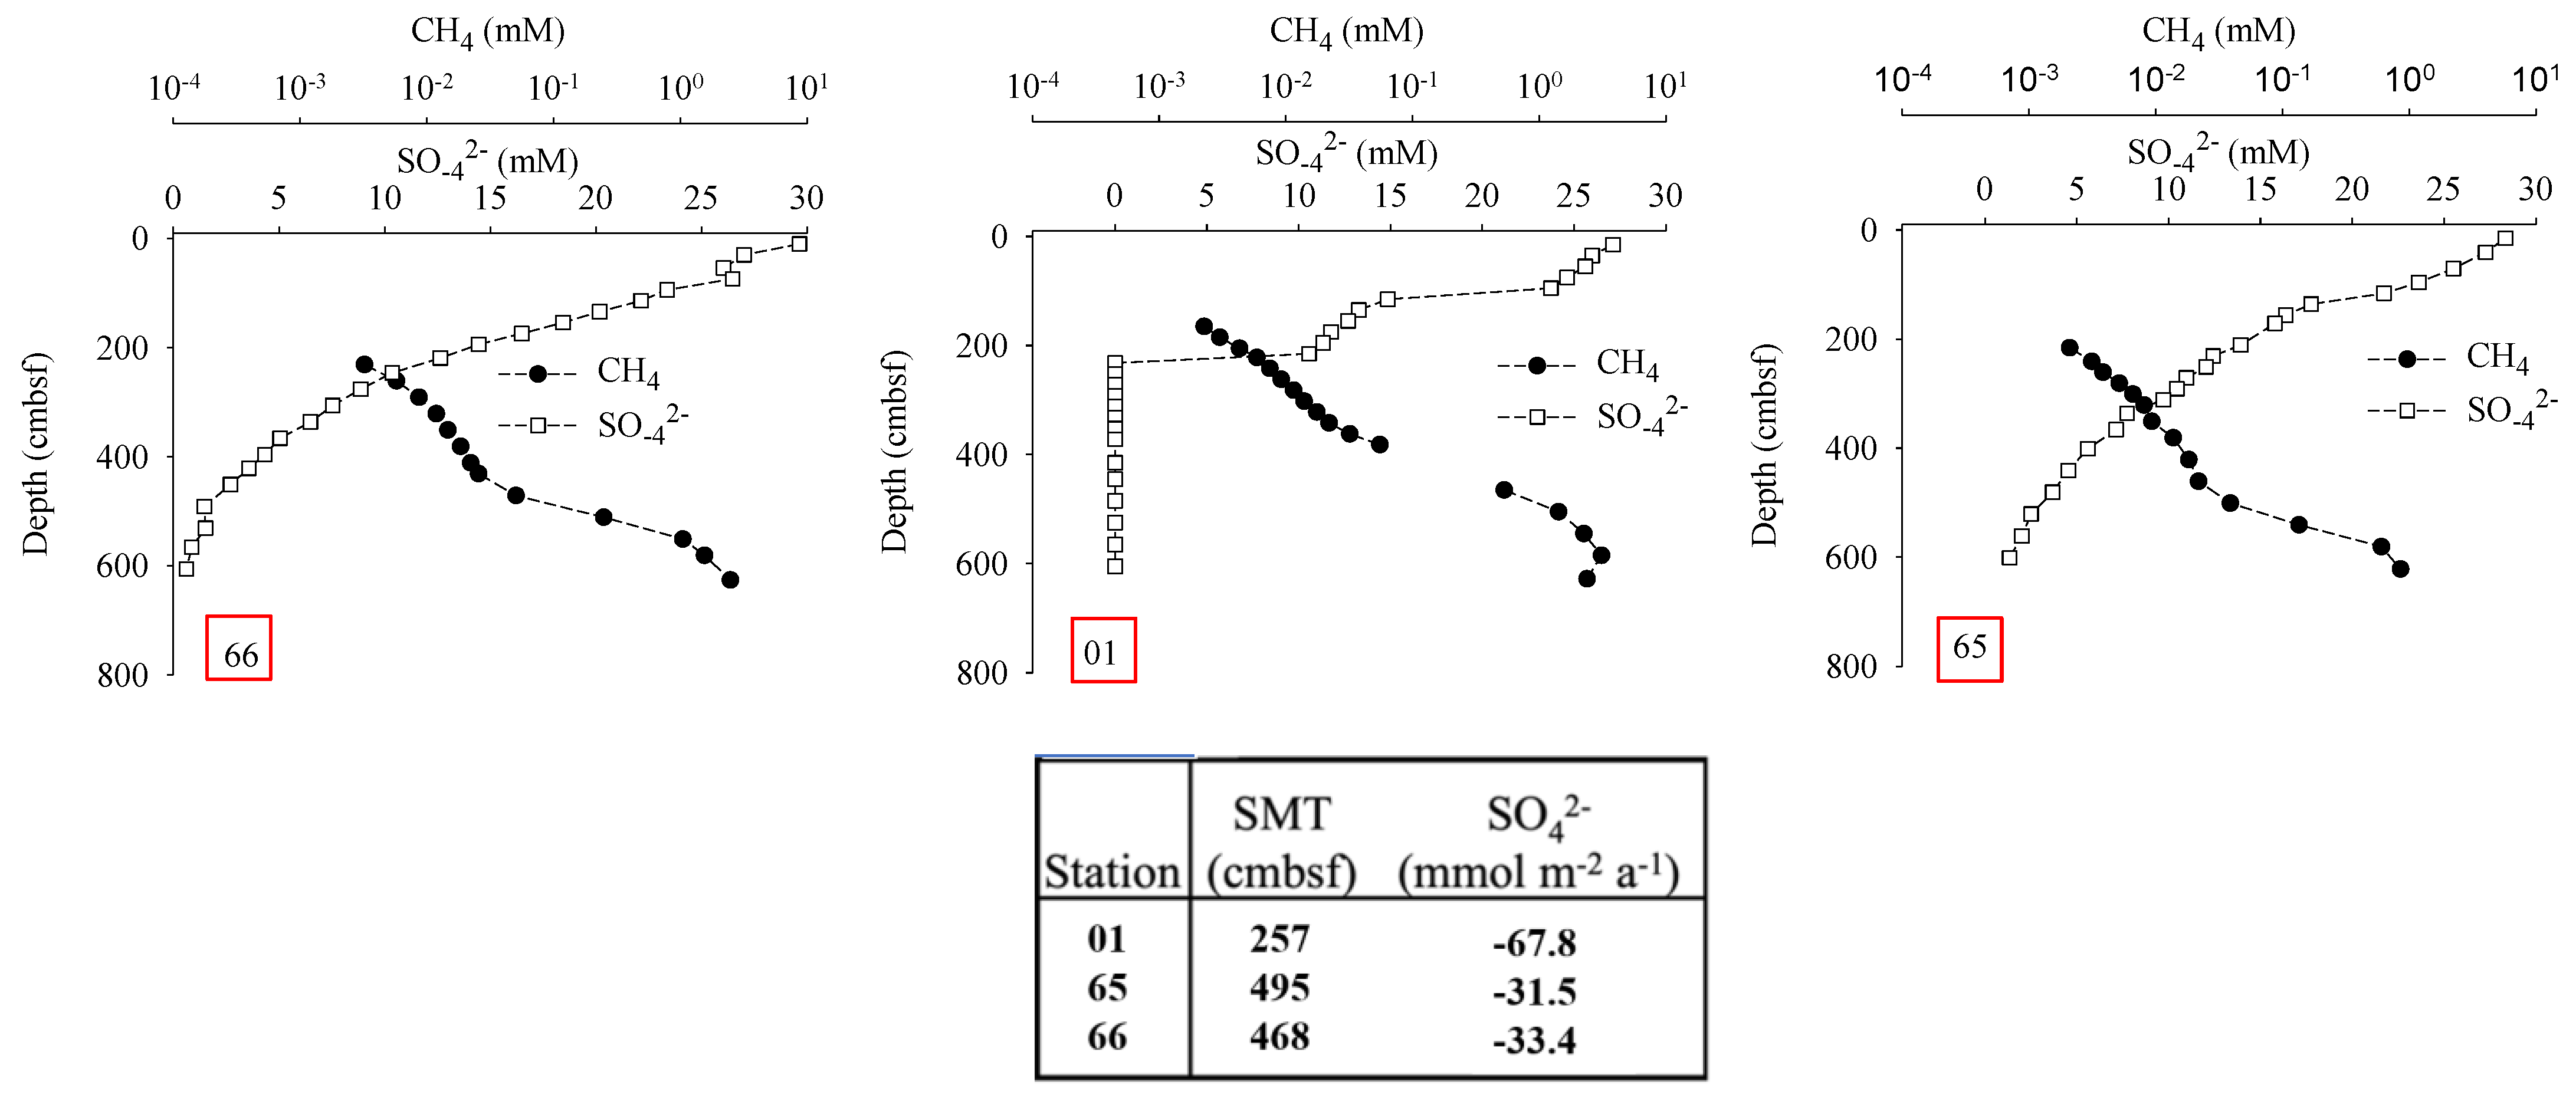
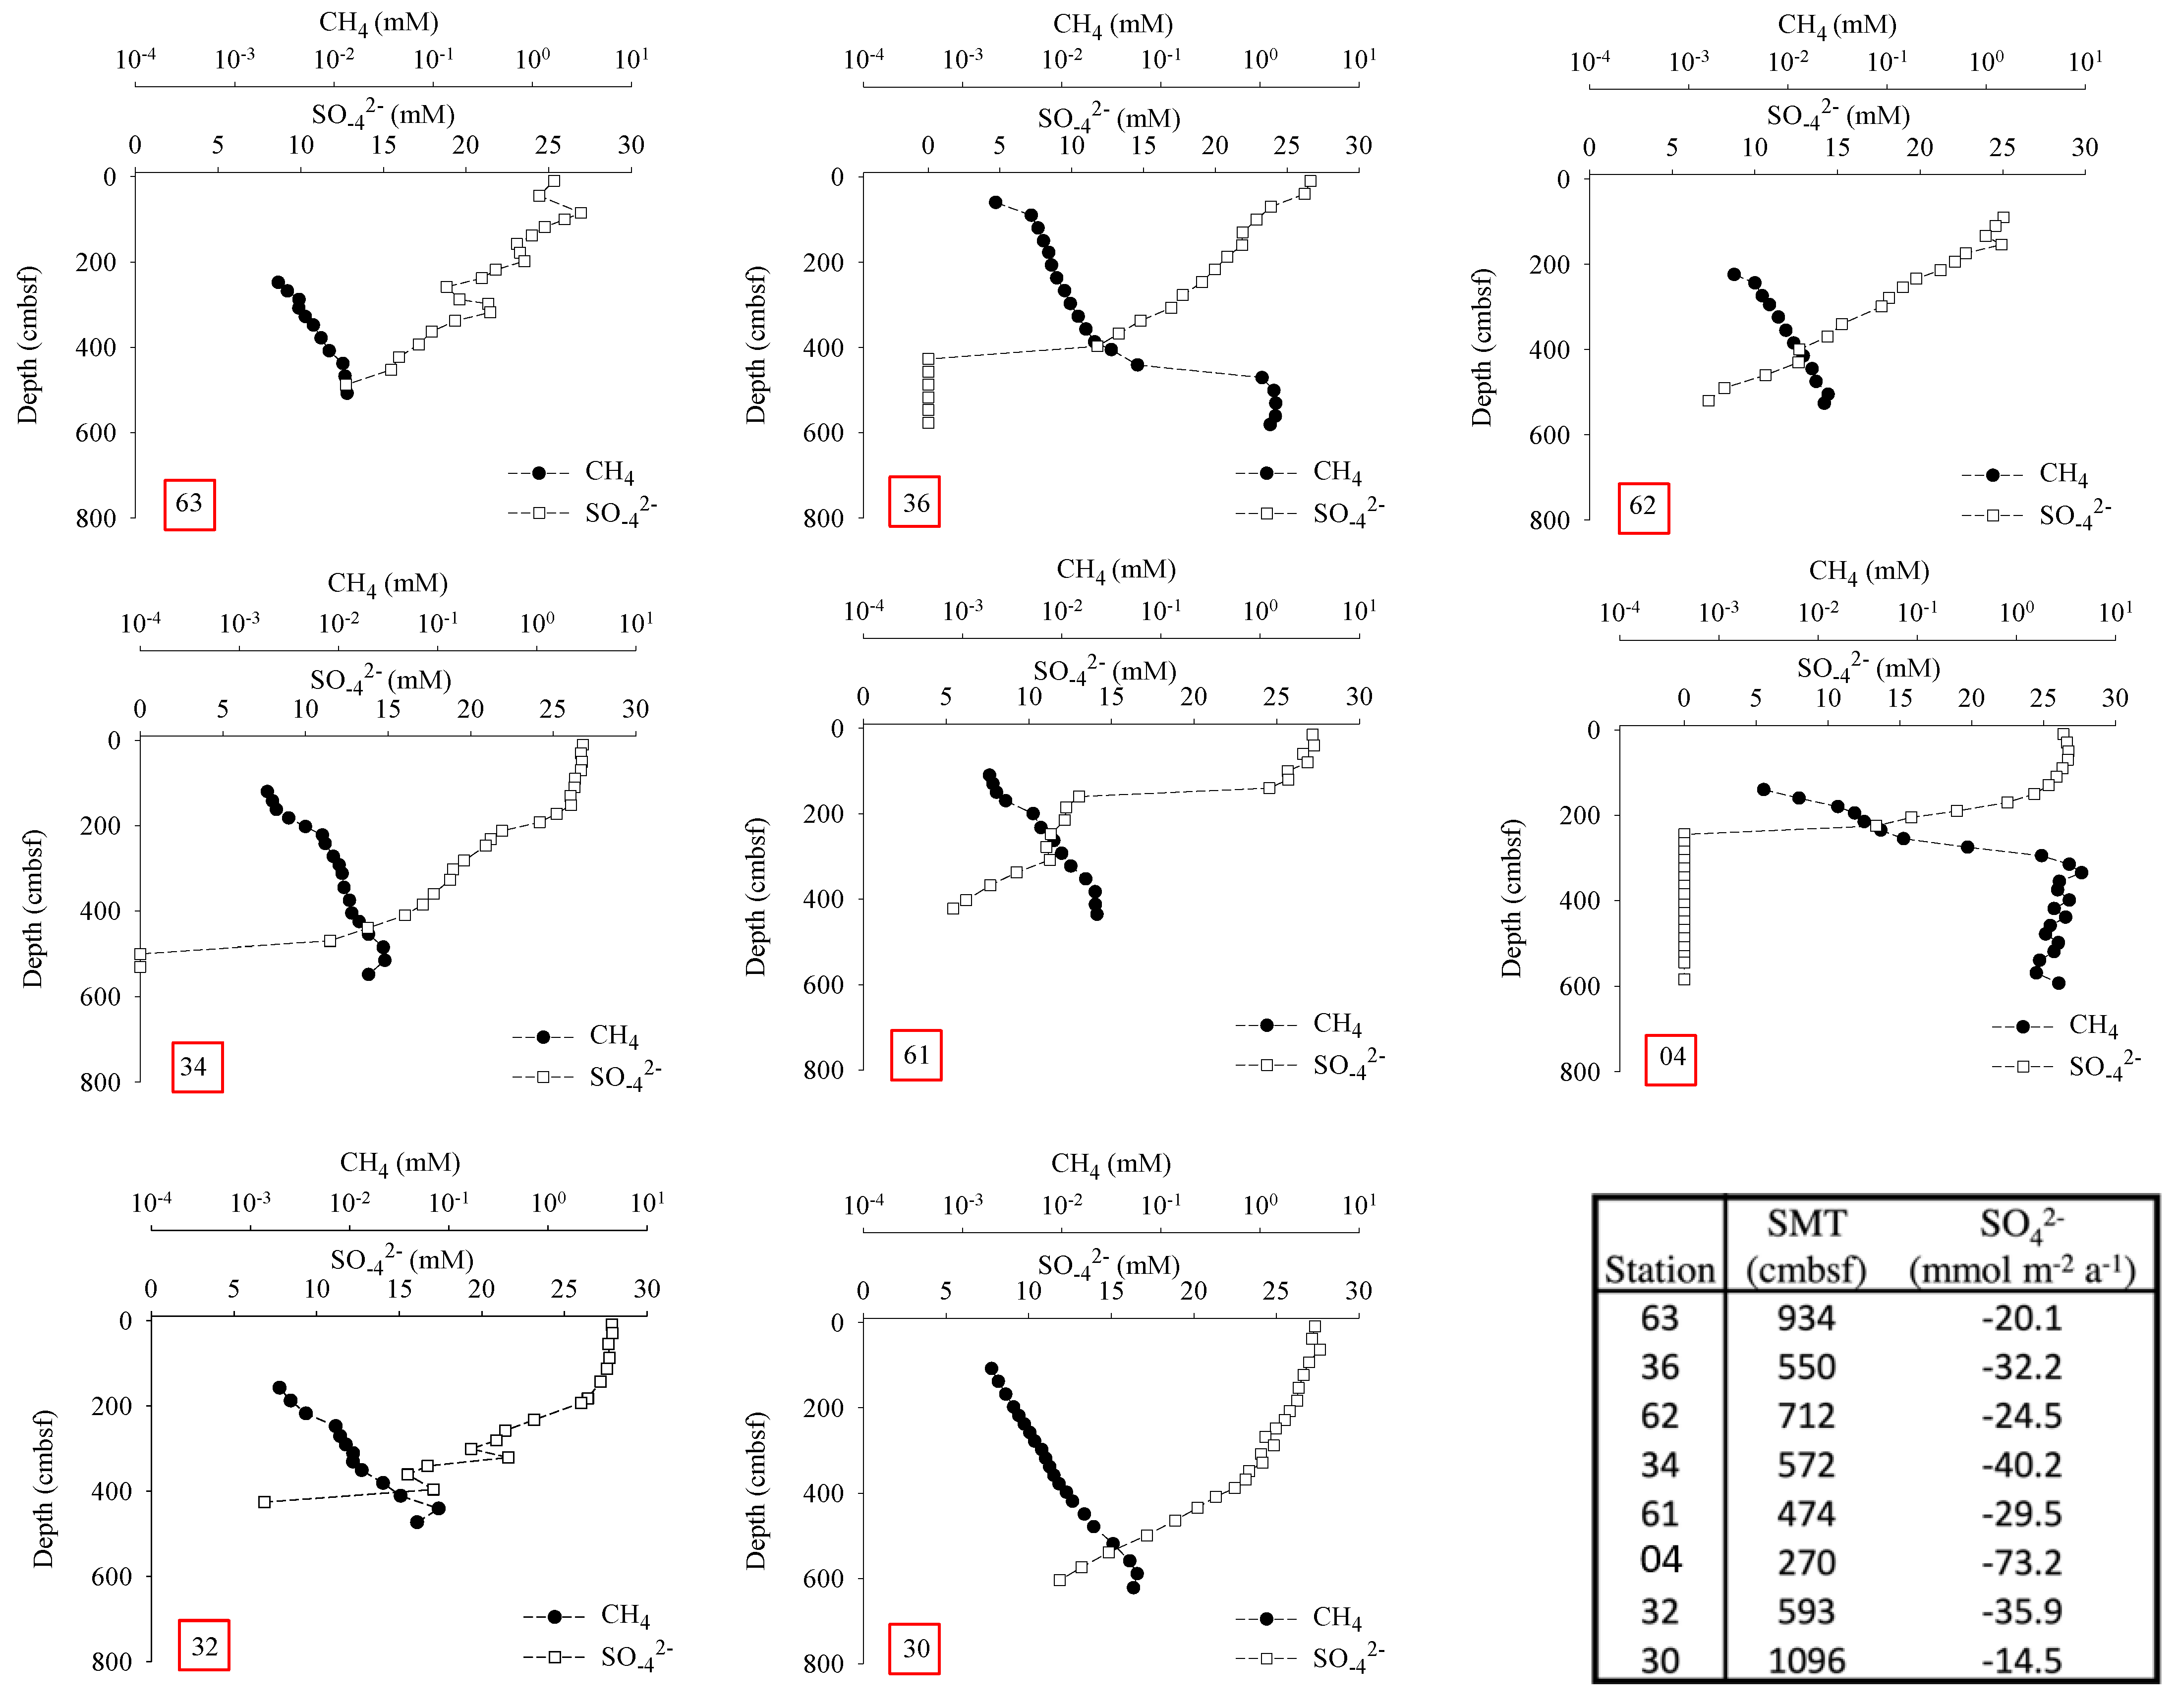
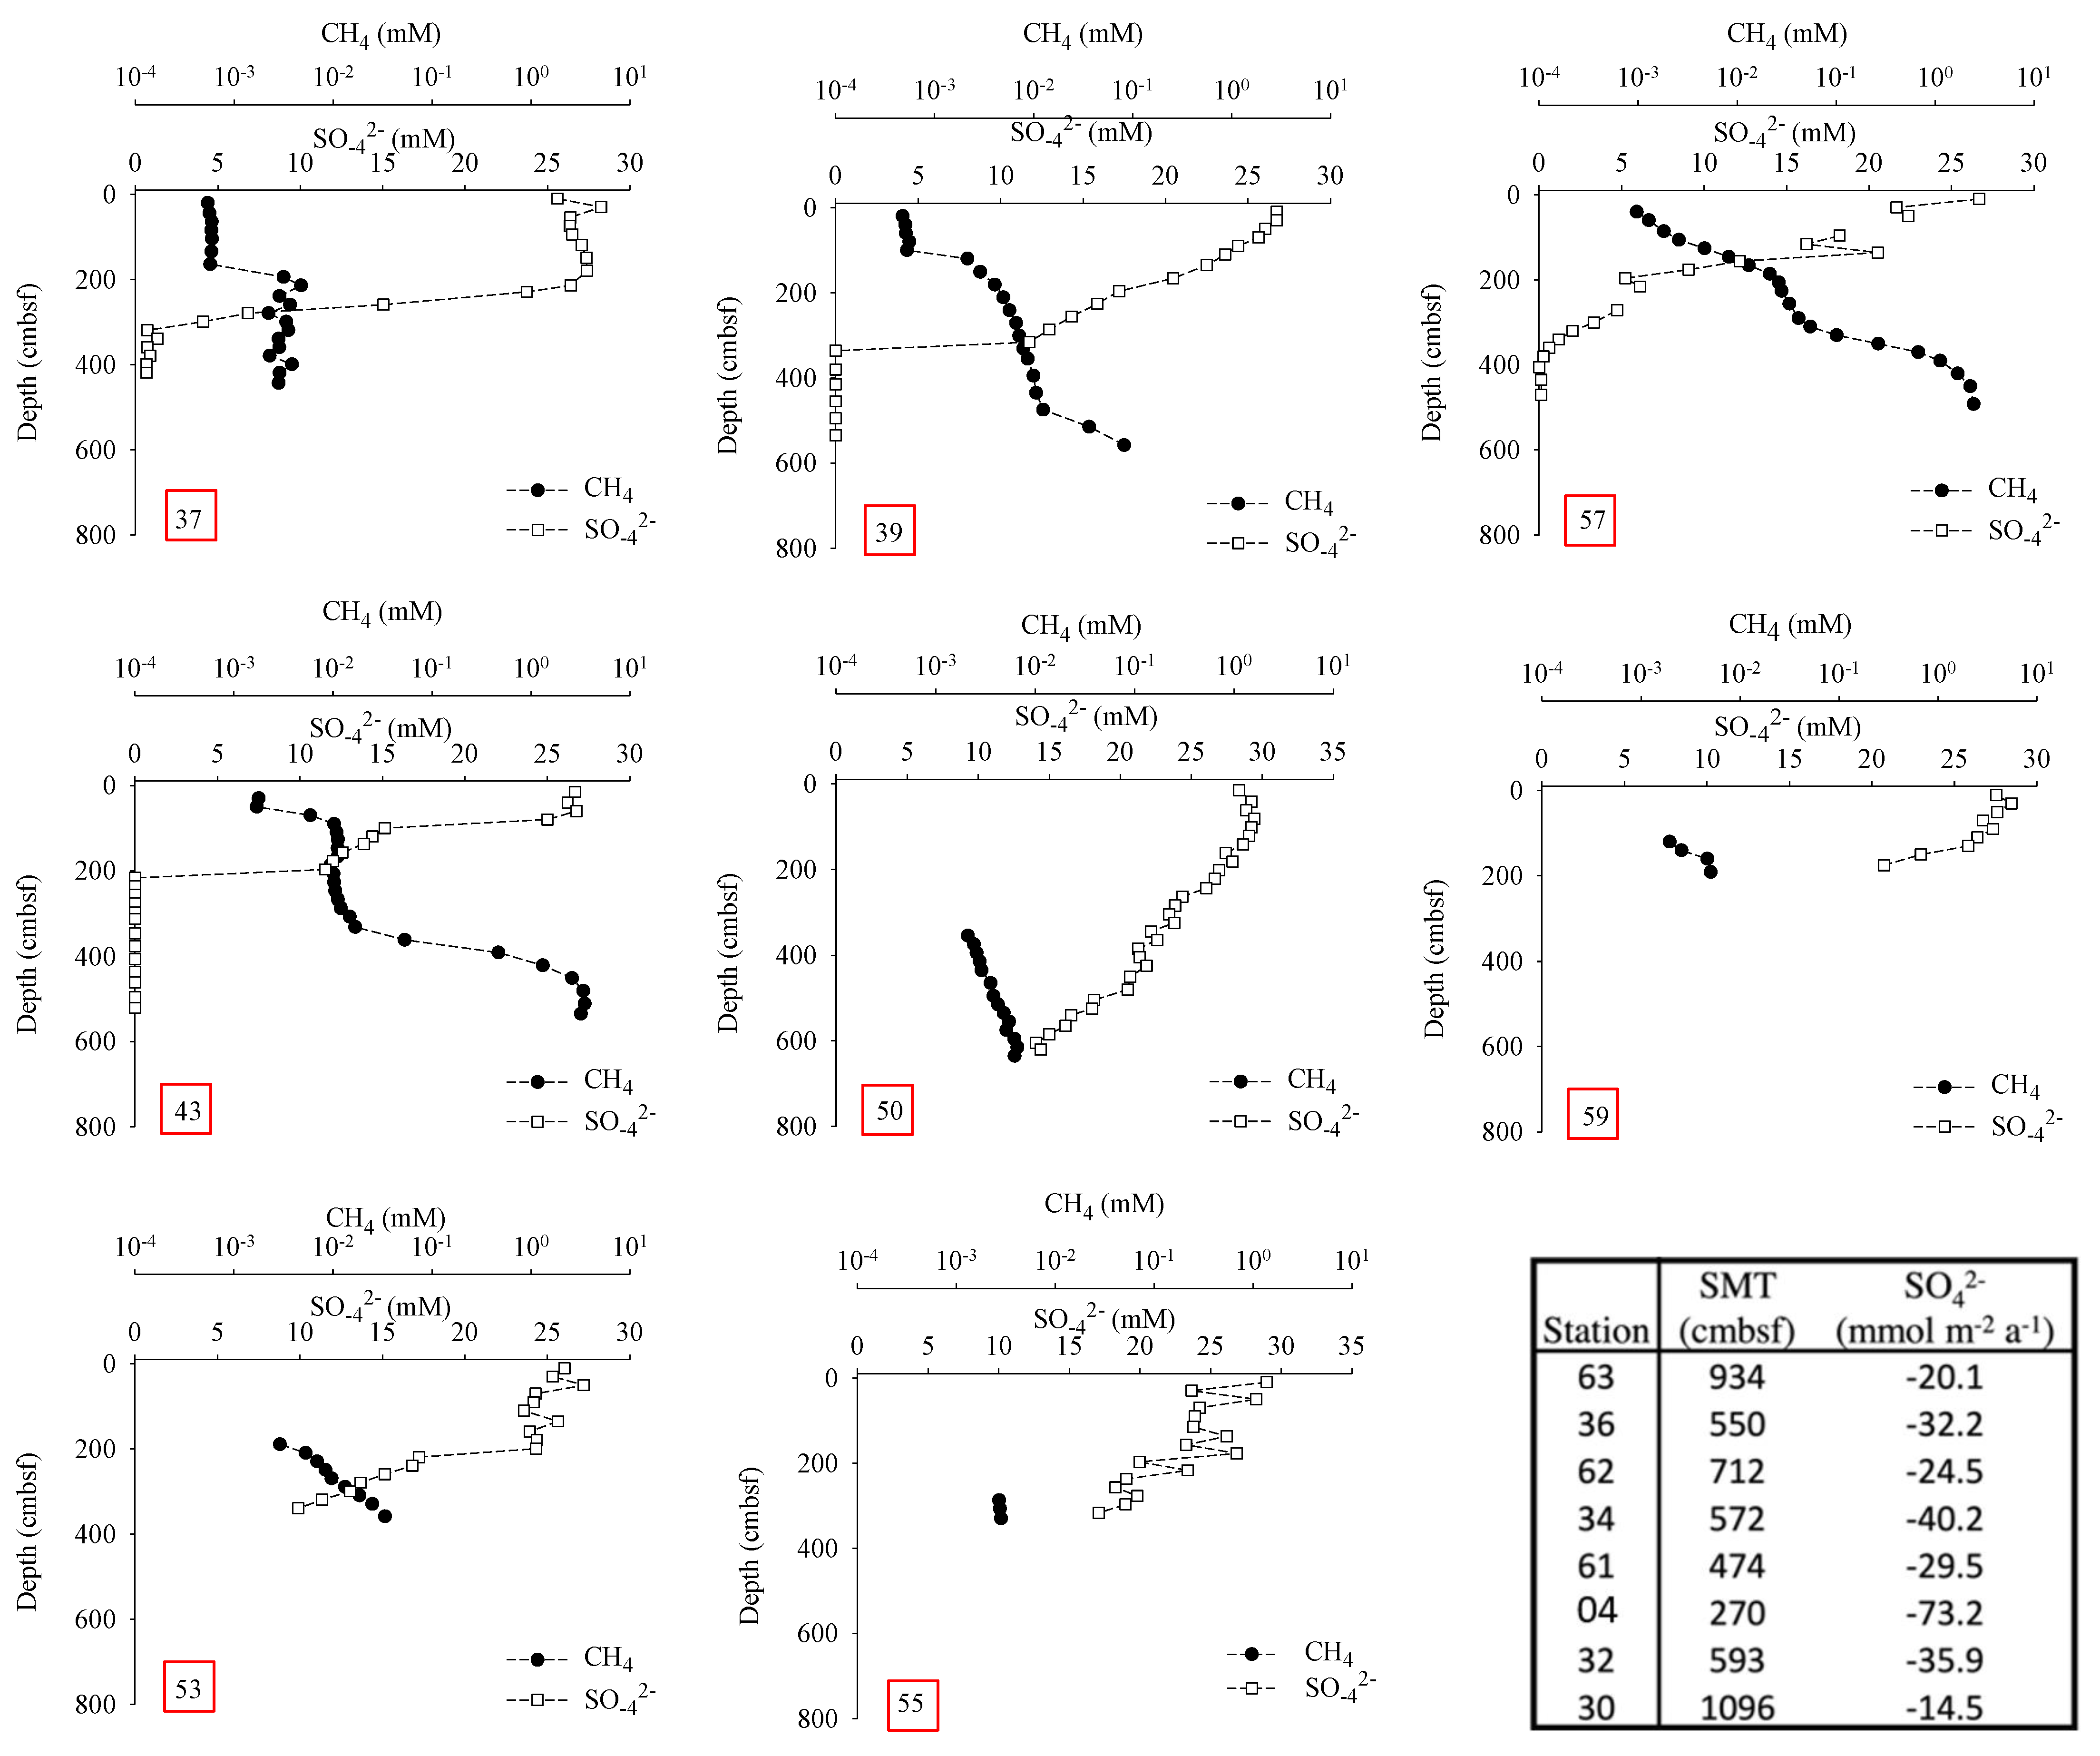
  • Porewater geochemistry analyses from targeted cores above these geophysical indicators corroborate the interpretations of high methane flux. This is reflected in quantifications of methane flux through the shallow sediments, as well as the depth of the sulfate–methane transition zone.
  • At a “control site”, there are no indicators in seismic data for BSRs, nor indicators for high vertical gas flux through the sediments in either seismic or TOPAS data. Despite this, geochemical data showed vertical methane fluxes and sediment methane concentrations that typically indicate the presence of gas hydrates at depth. The reason for this discrepancy between geophysical data and geochemical data is not immediately apparent.
  • We speculate that high gas flux at the control site does not result in BSRs because gas is transmitted into the gas hydrate stability zone through subseismic faults/fractures and does not accumulate beneath the base of hydrate stability. The result would be a lack of broad free gas zones at depth, required to generate BSRs. Further research is required to rule out other potential mechanisms for BSR absence, such as a downward movement of the BGHS that would consume free gas.
  • The geochemical indications for high methane flux, in the absence of seismic indicators for the same, have implications for regional identification and characterization of gas hydrate systems. Studies based primarily on geophysical data, without more detailed geochemical sampling, may result in a significant underestimation of gas hydrate distribution and methane flux through shallow sediments. Future studies should include further analysis of seismic data, heatflow surveys and controlled-source electromagnetic data to better constrain possible gas hydrate occurrences deeper beneath the seafloor.

Author Contributions

Conceptualization, R.B.C., I.P., G.C. and J.M.; methodology, I.P., G.C., T.J.B. and B.Y.; software, G.C., I.P. and J.M.; validation, R.B.C., G.C. and I.P.; investigation, R.B.C., G.C. and I.P.; formal analysis, T.J.B., G.C. and B.Y.; resources, J.M., I.P., G.C. and R.B.C.; data curation, G.C., I.P., R.B.C., J.M. and B.Y.; writing, R.B.C.; writing—review and editing, R.B.C., G.C., I.P. and T.J.B.; supervision, J.M., G.C. and R.B.C.; project administration, J.M., G.C. and R.B.C.; funding acquisition, J.M., I.P., G.C. and R.B.C. All authors have read and agreed to the published version of the manuscript.

Funding

Gareth Crutchley, Ingo Pecher and Joshu Mountjoy were partially supported by the New Zealand Ministry of Business, Innovation and Employment’s (MBIE) contract C05X1204 to GNS Science, “Harnessing New Zealand’s Gas Hydrate Resources”. We also gratefully acknowledge support by MBIE and by New Zealand Petroleum and Minerals (NZP&M) to R/V Tangaroa research voyage TAN1508. In addition, from the US side of the research resources were provided by the Department of Energy National Energy Technology Laboratory funded to the Naval Research Laboratory and transferred to the Department of Physical and Environmental Sciences, Texas A&M University—Corpus Christi Richard Coffin.

Informed Consent Statement

Not applicable.

Data Availability Statement

All geochemical data are available through email correspondence with Richard Coffin ([email protected]). Seismic and TOPAS data are available through correspondence with Gareth Crutchley ([email protected]) and Ingo Pecher ([email protected]).

Acknowledgments

Paula Rose was a strong contributor to the planning, fieldwork and sample geochemical processing. We thank Captain and Crew of R/V Tangaroa voyage TAN1508, as well as all NIWA technical staff who assisted with data collection. Three reviewers provided valuable comments that significantly improved the quality of this paper.

Conflicts of Interest

The authors declare no conflict of interest.

References

  1. Milkov, A.V.; Sassen, R. Economic geology of offshore gas hydrate accumulations and provinces. Mar. Pet. Geol. 2002, 19, 1–11. [Google Scholar] [CrossRef]
  2. Kvenvolden, K.A. Natural Gas Hydrate: Background and History of Discovery. In Natural Gas Hydrate; Max, M.D., Ed.; Coastal Systems and Continental Margins; Springer: Dordrecht, The Netherlands, 2000; Volume 5. [Google Scholar] [CrossRef]
  3. Milkov, A.V.; Claypool, G.E.; Lee, Y.J.; Xu, W.; Dickens, G.R.; Borowski, W.S. In situ methane concentrations at Hydrate Ridge, offshore Oregon: New constraints on the global gas hydrate inventory from an active margin. Geology 2003, 31, 833–836. [Google Scholar] [CrossRef]
  4. Milkov, A.V.; Sassen, R. Two-dimensional modeling of gas hydrate decomposition in the northwestern Gulf of Mexico: Significance to global change assessment. Glob. Planet. Chang. 2003, 36, 31–46. [Google Scholar] [CrossRef]
  5. Milkov, A.V.; Sassen, R. Estimate of gas hydrate resource, northwestern Gulf of Mexico continental slope. Mar. Geol. 2001, 179, 71–83. [Google Scholar] [CrossRef]
  6. Li, X.S.; Xu, C.G.; Zhang, Y.; Ruan, X.K.; Li, G.; Wang, Y. Investigation into gas production from natural gas hydrate: A review. Appl. Energy 2016, 172, 286–322. [Google Scholar] [CrossRef] [Green Version]
  7. Davies, R.J.; Yang, J.; Li, A.; Mathias, S.; Hobbs, R. An irregular feather-edge and potential outcrop of marine gas hydrate along the Mauritanian margin. Earth Planet. Sci. Lett. 2015, 423, 202–209. [Google Scholar] [CrossRef] [Green Version]
  8. Leonte, M.; Kessler, J.D.; Kellermann, M.Y.; Arrington, E.C.; Valentine, D.L.; Sylva, S.P. Rapid rates of aerobic methane oxidation at the feather edge of gas hydrate stability in the waters of Hudson Canyon, US Atlantic Margin. Geochim. Cosmochim. Acta 2017, 204, 375–387. [Google Scholar] [CrossRef]
  9. Davies, R.J.; Maqueda, M.Á.M.; Li, A.; Ireland, M. Climatically driven instability of marine methane hydrate along a canyon-incised continental margin. Geology 2021, 49, 973–977. [Google Scholar] [CrossRef]
  10. Berndt, C.; Davies, R.; Li, A.; Yang, J. Insights into Gas Hydrate Dynamics from 3D Seismic Data, Offshore Mauritania. In World Atlas of Submarine Gas Hydrates in Continental Margins; Springer: Cham, Switzerland, 2022; pp. 323–329. [Google Scholar]
  11. Ruppel, C.D.; Kessler, J.D. The interaction of climate change and methane hydrates. Rev. Geophys. 2017, 55, 126–168. [Google Scholar] [CrossRef]
  12. Biastoch, A.; Treude, T.; Rüpke, L.H.; Riebesell, U.; Roth, C.; Burwicz, E.B.; Park, W.; Latif, M.; Böning, C.W.; Madec, G.; et al. Rising Arctic Ocean temperatures cause gas hydrate destabilization and ocean acidification. Geophys. Res. Lett. 2011, 38, 8. [Google Scholar] [CrossRef] [Green Version]
  13. Liu, Y.; Liu, X.; Liu, D.; Wang, Y.; Zhao, Y. Applications of seismic techniques to gas hydrate predictions. Appl. Geophys. 2008, 5, 67–73. [Google Scholar] [CrossRef]
  14. Wood, W.T.; Hart, P.; Hutchinson, D.; Dutta, N.; Snyder, F.; Coffin, R.B.; Gettrust, J.F. Gas and Gas Hydrate Distribution Around Seafloor Seeps in Mississippi Canyon, Northern Gulf of Mexico, using Multi-Resolution Seismic Imagery. Mar. Pet. Geol. 2008, 25, 977–987. [Google Scholar] [CrossRef]
  15. Pecher, I.A.; Henrys, S.A.; Wood, W.T.; Crutchley, G.; Gorman, A.R.; Coffin, R.; Kukowski, N.; Greinert, J.; Faure, K. Focused Fluid Expulsion on the Hikurangi Margin, New Zealand—Evidence from Possible Local Upwarping of the Base of Gas Hydrate Stability. Mar. Geol. 2010, 272, 99–113. [Google Scholar] [CrossRef]
  16. Coffin, R.B.; Pohlman, J.W.; Gardner, J.; Downer, R.; Wood, W.; Hamdan, L.; Walker, S.; Plummer, R.; Gettrust, J.; Diaz, J. Methane Hydrate Exploration on the Mid Chilean xCoast: A Geochemical and Geophysical Survey. J. Pet. Sci. Eng. 2007, 56, 32–41. [Google Scholar] [CrossRef]
  17. Coffin, R.B.; Hamdan, L.; Plummer, R.; Smith, J.; Gardner, J.; Wood, W.T. Analysis of methane and sulfate flux in methane charged sediments from the Mississippi Canyon, Gulf of Mexico. Mar. Pet. Geol. 2008, 25, 977–987. [Google Scholar] [CrossRef]
  18. Coffin, R.B.; Hamdan, L.; Smith, J.P.; Plummer, R.; Millholland, L.; Larson, R. Spatial Variation in Shallow Sediment Methane Source and Cycling along the Alaskan Beaufort Sea. Mar. Pet. Geol. 2013, 45, 186–197. [Google Scholar] [CrossRef]
  19. Coffin, R.B.; Hamdan, L.J.; Smith, J.P.; Rose, P.S.; Plummer, R.E.; Yoza, B.; Pecher, I.; Montgomery, M.T. Contribution of Vertical Methane Flux to Shallow Sediment Carbon Pools across Porangahau Ridge, New Zealand. Energies 2014, 7, 5332–5356. [Google Scholar] [CrossRef] [Green Version]
  20. Schwalenberg, K.; Wood, W.; Pecher, I.; Hamdan, L.; Henrys, S.; Jergen, M.; Coffin, R. Preliminary interpretation of CSEM, heatflow, seismic, and geochemical data for gas hydrate distribution across the Porangahau Ridge, New Zealand. Mar. Geol. 2010, 272, 79–88. [Google Scholar] [CrossRef]
  21. Johnson, A.H. Global Resource Potential of Gas Hydrate—A New Calculation. In Methane Hydrate Newsletter Fire in the Ice; National Energy Technology Laboratory: Pittsburgh, PA, USA, 2011; Volume 11. [Google Scholar]
  22. Crutchley, G.J.; Klaeschen, D.; Planert, L.; Bialas, J.; Berndt, C.; Papenberg, C.; Hensen, C.; Hornbach, M.J.; Krastel, S.; Brückmann, W. The impact of fluid advection on gas hydrate stability: Investigations at sites of methane seepage offshore Costa Rica. Earth Planet. Sci. Lett. 2014, 40, 95–109. [Google Scholar] [CrossRef]
  23. Constable, S.; Kannberg, P.; Mejia, D.R. Mapping shallow geological structure with towed marine CSEM receivers. In SEG Expanded Abstracts, Proceedings of the Society of Exploration Geophysicist International Exposition and Annual Meeting, Las Vegas, NV, USA, 4–9 November 2012; Society of Exploration Geophysicists: Houston, TX, USA, 2012. [Google Scholar]
  24. Constable, S.; Kannberg, P.K.; Weitemeyer, K. Vulcan: A deep-towed CSEM receiver. Geochem. Geophys. Geosyst. 2016, 17, 1042–1064. [Google Scholar] [CrossRef] [Green Version]
  25. Crutchley, G.J.; Black, J.; Field, B.D.; O’Brien, G.; Stagpoole, V.M.; Mountjoy, J.J.; Bland, K.J.; Henrys, S.A.; Pecher, I.A.; Strogen, D.P.; et al. Petroleum Prospecitivity Screening Report of the Offshore Northern East Coast Basin; GNS Science Consultancy Report 2015/225; GNS Science: Avalon, New Zealand, 2016. [Google Scholar]
  26. Navalpakam, R.S.; Pecher, I.A.; Stern, T. Weak and segmented bottom simulating reflections on the Hikurangi Margin, New Zealand—Implications for gas hydrate reservoir rocks. J. Pet. Sci. Eng. 2012, 88, 29–40. [Google Scholar] [CrossRef]
  27. Barnes, P.M.M.; de Lépinay, B.M. Rates and mechanics of rapid frontal accretion along the very obliquely convergent southern Hikurangi margin, New Zealand. J. Geophys. Res. 1997, 103, 24931–24952. [Google Scholar] [CrossRef]
  28. Barnes, P.M.; Mountjoy, J.J.; Pedley, K.; Crutchley, G. Tectonic and geological framework for gas hydrates and cold seeps on the hikurangi subduction margin, New Zealand. Mar. Geol. 2010, 272, 26–48. [Google Scholar] [CrossRef]
  29. Barnes, P.; Mountjoy, J.; Wilcox, S.; Mitchell, J.; Palentin, A.; Amyes, D.; Cave, R.; Henrys, S.; Plaza, A.; Berthelsen, T.; et al. Tangaroa TAN114 OS2020 Northern Hikurangi Margin Geohazards; Report No. 2007/29; National Institute of Water and Atmospheric Research: Wellington, New Zealand, 2011. [Google Scholar]
  30. Pecher, I.A.; Villinger, H.; Kaul, N.; Crutchley, G.J.; Mounthjoy, J.J.; Huhn, K.; Kukowski, N.; Henrys, S.A.; Rose, P.S.; Coffin, R.B. A fluid pulse on the Hikurangi subduction margin—Evidence from heat flow transect across the upper limit of gas hydrate stability. Geophys. Res. Lett. 2017, 44, 12385–12395. [Google Scholar] [CrossRef] [Green Version]
  31. Pecher, I.; Crutchley, G.; Mountjoy, J.; Gorman, A.; Fraser, D.; Kroeger, K.; Henrys, S. Double Bsrs on the Hikurangi Margin, New Zealand—Possible Implications for Gas Hydrate Stability and Composition. In Proceedings of the 8th International Conference on Gas Hydrates (ICFH8-2014), Beijing, China, 28 July–1 August 2014. [Google Scholar]
  32. Hamdan, L.J.; Gillevet, P.M.; Pohlman, J.W.; Sikaroodi, M.; Greinert, J.; Coffin, R.B. Diversity and biogeochemical structuring of bacterial communities across the Porangahau ridge accretionary prism, New Zealand. FEMS Microbiol. Ecol. 2011, 77, 518–532. [Google Scholar] [CrossRef] [Green Version]
  33. Kroeger, K.; Plaza-Faverola, A.; Barnes, P.; Pecher, I. Thermal evolution of the New Zealand Hikurangi subduction margin: Impact on natural gas generation and methane hydrate formation—A model study. Mar. Pet. Geol. 2015, 63, 97–114. [Google Scholar] [CrossRef]
  34. Pecher, I.; Crutchley, G.; Kröger, K.F.; Hillman, J.; Mountjoy, J.; Coffin, R.; Gorman, A. New Zealand’s Gas Hydrate Systems. In World Atlas of Submarine Gas Hydrates in Continental Margins; Springer: Cham, Switzerland, 2022; pp. 415–424. [Google Scholar]
  35. Dickens, G.R.; Koelling, M.; Smith, D.C.; Schieders, L.; IODP Expedition 302 Scientists. Rhizon sampling of pore waters on scientific drilling expeditions: An example from the IODP Expeditions 302, Arctic Coring Expedition (ACEX). Sci. Drill. 2007, 4, 22–25. [Google Scholar] [CrossRef]
  36. Seeberg-Elverfeldt, J.; Koelling, M.; Schluter, M.; Feseker, T. Rhizon In Situ Sampler (RISS) for Pore Water Sampling form Aquatic Sediment. In Abstracts of Papers of the American Chemical Society, Proceedings of the 230th National Meeting of the American-Chemical-Society, Washington, DC, USA, 28 August–1 September 2005; ACS Publications: Washington, DC, USA, 2005. [Google Scholar]
  37. Dickson, A.G. Standards for ocean measurements. Oceanography 2010, 23, 34–47. [Google Scholar] [CrossRef] [Green Version]
  38. Orphan, V.J.; Hinrichs, K.U.; Ussler, W., III; Paull, C.K.; Taylor, L.T.; Sylva, S.P.; Hayes, J.M.; Delong, E.F. Comparative Analysis of Methane-Oxidizing Archaea and Sulfate-Reducing Bacteria in Anoxic Marine Sediments. Appl. Environ. Microbiol. 2001, 67, 1922–1934. [Google Scholar] [CrossRef] [Green Version]
  39. Valentine, D.L.; Reeburgh, W.S. New perspectives on anaerobic methane oxidation. Environ. Microbiol. 2000, 2, 477–484. [Google Scholar] [CrossRef]
  40. Borowski, W.S.; Paull, C.K.; Ussler, W., III. Marine porewater sulfate profiles indicate in situ methane flux from underlying gas hydrate. Geology 1996, 24, 655–658. [Google Scholar] [CrossRef]
  41. Borowski, W.S.; Paull, C.K.; Ussler, W., III. Global and local variations of interstitial sulfate gradients in the deep-water, continental margin sediments: Sensitivity to underlying amethane and gas hydrates. Mar. Geol. 1999, 159, 131–154. [Google Scholar] [CrossRef]
  42. Paull, C.K.; Ussler, W., III; Lorenson, T.; Winters, W.; Dougherty, J. Geochemical constraints on the distribution of gas hydraes in the Gulf of Mexico. Geo-Mar. Lett. 2005, 25, 273–280. [Google Scholar] [CrossRef]
  43. Mountjoy, J.J.; McKean, J.; Barnes, P.M.; Pettinga, J.R. Terrestrial-style slow-moving earth flow kinematics in a submarine landslide complex. Mar. Geol. 2009, 267, 114–127. [Google Scholar] [CrossRef]
  44. Coffin, R.B.; Rose, P.; Yoza, B.; Boyd, R.; Pecher, I.; Crutchley, G.; Mountjoy, J. TAN1508 Geochemistry Overview—Methane Gas Assessment and Hydrate Prediction: Seismic and Geochemical Interpretation; NRL Letter Report: 3905; Naval Research Laboratory: Washington, DC, USA, 2015. [Google Scholar]
  45. Lein, A.Y.; Savvichev, A.S.; Ivanov, M.V. Reservoir of dissolved methane in the water column of the seas of the Russian Arctic region. Doklady Earth Sci. 2011, 441, 1576–1578. [Google Scholar] [CrossRef]
  46. Smith, J.P.; Coffin, R.B. Methane Flux and Authigenic Carbonate in Shallow Sediments Overlying Methane Hydrate Bearing Strata in Alaminos Canyon, Gulf of Mexico. Energies 2014, 7, 6118–6141. [Google Scholar] [CrossRef] [Green Version]
  47. Snyder, G.T.; Hiruta, A.; Matsumoto, R.; Dickens, G.R.; Tomaru, H.; Takeuchi, R.; Komatsubara, J.; Ishida, Y.; Yu, H. Porewater profiles and authigenic mineralization in shallow marine sediments above the methane-charged system on Umitaka Spur, Japan Sea. Deep Sea Res. Part II Top. Stud. Oceanogr. 2007, 54, 1216–1239. [Google Scholar] [CrossRef]
  48. Hensen, C.; Zabel, M.; Pfiefer, K.; Schwenk, T.; Kasten, S.; Riedinger, N.; Schulz, H.D.; Boetius, A. Control of sulfate porewater profiles by sedimentary events and the significance of anaerobic oxidation of methane for the burial of sulfur in marine sediments. Geochim. Cosmochim. Acta 2003, 67, 2631–2647. [Google Scholar] [CrossRef]
  49. Ruppel, C.; Dickens, G.R.; Castellini, D.G.; Gilhooly, W.; Lizarralde, D. Heat and salt inhibition of gas hydrate formation in the northern Gulf of Mexico. Geophys. Res. Lett. 2005, 32, L04604. [Google Scholar] [CrossRef]
  50. Treude, T.; Niggemann, J.; Kallmeyer, J.; Wintersteller, P.; Schubert, C.J.; Boetius, A.; Jørgensen, B.B. Anaerobic oxidation of methane and sulfate reduction along the Chilean continental margin. Geochem. Cosmochim. Acta 2005, 69, 2767–2779. [Google Scholar] [CrossRef]
  51. Wehrmann, L.M.; Risgaard-Petersen, N.; Schrum, H.N.; Walsh, E.A.; Huh, Y.; Ikehara, M.; Pierre, C.; D’Hondt, S.; Ferdelman, R.G.; Ravelo, A.C.; et al. The Integrated Ocean Drilling Program Expedtion 323 Scientific Party, 2011. Couple organic and inorganic carbon cycling in the deep subseafloor sediment of the northeastern Bering Sea Slope (IODP Exp. 323). Chem. Geol. 2011, 284, 251–261. [Google Scholar] [CrossRef]
  52. Coffin, R.B.; Osburn, C.L.; Plummer, R.E.; Rose, P.S.; Grabowski, K.S. Deep sediment methane incorporation into shallow sediment carbon pools in Atwater Valley, Texas-Louisiana Shelf, Gulf of Mexico. Energies 2015, 8, 1561–1583. [Google Scholar] [CrossRef] [Green Version]
  53. Plaza-Faverola, A.; Pecher, I.; Crutchley, G.; Barnes, P.M.; Bünz, S.; Golding, T.; Klaeschen, D.; Papenberg, C.; Bialas, J. Submarine gas seepage in a mixed contactional and shear deformation regime: Cases from the Hikurangi oblique-subduction margin. Geochem. Geophys. Geosyst. 2014, 2, 414–433. [Google Scholar]
  54. von Huene, R.; Pecher, I.A. Vertical tectonics and the origins of BSRs along the Peru margin. Earth Planet. Sci. Lett. 1999, 166, 47–55. [Google Scholar] [CrossRef]
  55. Crutchley, G.J.; Kroeger, K.F.; Pecher, I.A.; Gorman, A.R. How tectonic folding influences gas hydrate formation: New Zealand’s Hikurangi subduction margin. Geology 2019, 47, 39–42. [Google Scholar] [CrossRef]
Figure 1. (a) Regional overview map showing the location of the study area (blue box) within the Hikurangi subduction wedge, east of New Zealand’s North Island. Map coordinates are in degrees (WGS84 datum). “mbsl” = meters below sea level. (b) Enlargement of the study area (Mahia Study Area) showing 2D seismic reflection lines shown in this study (blue lines), as well as piston core sites (yellow dots, labeled, e.g., PC01) at the three transects. The red contour marks the approximate upper limit of hydrate stability in sediments. Note: TOPAS data that we show in this manuscript are coincident with the seismic lines (blue lines).
Energies 15 01233 g001
Figure 2. Geophysical data and interpretations at the Control Site (see Figure 1b for location). (a) TOPAS data showing the locations (black arrows) of Piston Cores 01, 65 and 66 (see Figure 1b for geographic locations). (b) Multichannel seismic data—amplitudes. Same horizontal scale, but different vertical scale than (a). GHSZ: Gas hydrate stability zone (see text for details). (c) root-mean-square (RMS) amplitudes from (b). Identical scale and extent as (b). (d) Variance attribute of the seismic data in (b). Identical scale and extent as (b). (e) Structural interpretation of the seismic data that may explain the lack of BSRs in the presence of high CH4 flux near the surface (see discussion). Note: interpretation extent is from the vertical dotted lines in (d), which are also shown in (b,c). (f) Enlargement of shallow part of our interpretation, from the broken black box in (e).
Energies 15 01233 g002
Figure 3. Geochemical data from the Control Site. Piston core numbers presented in seismic profile (Figure 2) are indicated in red boxes. See Figure 1b for geographical locations and Figure 2 for locations on TOPAS and seismic data. Geochemical data include sediment CH4 and porewater SO42− concentrations. “cmbsf” = cm below seafloor. Table shows the sulfate–methane transition zone (SMT), determined from the SO42− concentrations.
Energies 15 01233 g003
Figure 4. (a) TOPAS data from Mahia Transect 1; see Figure 1b for geographical location. Numbered black arrows are piston core sites. Highly reflective regions interpreted as free gas (labeled). (b) Seismic data from the same location as the TOPAS data above. Horizontal and vertical scales are the same as those used for the TOPAS data. The possible base of gas hydrate stability (BGHS) is interpreted as the upper termination of strong reflectivity.
Energies 15 01233 g004
Figure 5. Geochemical data from Mahia Transect 1. Piston core numbers presented in seismic profile (Figure 4) are indicated in red boxes. See Figure 1b for geographical locations and Figure 4 for locations on TOPAS and seismic data. Geochemical data include sediment CH4 and porewater SO42− concentrations. “cmbsf” = cm below seafloor. Table in lower right shows the sulfate–methane transition zone (SMT), determined from the SO42− concentrations.
Energies 15 01233 g005
Figure 6. (a) TOPAS data from Mahia Transect 2; see Figure 1b for geographical location. Numbered black arrows are piston core sites. (b) Seismic data from the same location as the TOPAS data in (a). Horizontal scale is the same as for the above TOPAS data plot in (a), while the vertical scale differs. The possible base of gas hydrate stability (BGHS) is interpreted as the upper termination of strong reflectivity.
Energies 15 01233 g006
Figure 7. Geochemical data from Mahia Transect 2. Piston core numbers presented in seismic profile (Figure 6) are indicated in red boxes. See Figure 1b for geographical locations and Figure 6 for locations on TOPAS and seismic data. Geochemical data include sediment CH4 and porewater SO42− concentrations. “cmbsf” = cm below seafloor. Table in lower right shows the sulfate–methane transition zone (SMT), determined from the SO42− concentrations.
Energies 15 01233 g007
Figure 8. A comparison of sediment core total inorganic and organic carbon concentrations and d13C through piston core profiles. Sediment carbon profiles are presented from the core sites with highest vertical CH4 flux. Piston core numbers presented in seismic and TOPAS profiles (Figure 2, Figure 4 and Figure 6) are indicated in red boxes.
Energies 15 01233 g008
Table 1. An overview of published literature for sediment vertical CH4 migration and the sulfate–methane transition depth. This provides a global data summary for comparison to this work on the Mahia Peninsula.
LocationMinimum SMT (cmbsf)Maximum SMT (cmbsf)Minimum
Diffusion
(mM CH4 m−2 a−1)
Minimum
Diffusion
(mM CH4 m−2 a−1)
Reference
Mahia Peninsula, New Zealand238113714.573.2this
manuscript
Mid-Chilean Margin33101113.3362[16]
Atwater Valley,
Gulf of Mexico
041020.4249.1[17]
Beaufort Sea, Alaska14729052.1154.8[18]
Poranmgahau Ridge, New Zealand183128711.486.2[19]
Chatham Rise,
New Zealand
160011,700--[22]
Kara, Chuckchi & White Seas--0.4447.4[45]
Alaminos Canyou, Gulf of Mexico3081793--[46]
Umitaka Spur,
Japan
20030058102[47]
Western Argentine Basin37022,0001162.5[48]
GB&MC
Gulf of Mexico
~100~250--[49]
Southern Chilean Margin--46100[50]
Bering Sea Slope6--25.3[51]
Publisher’s Note: MDPI stays neutral with regard to jurisdictional claims in published maps and institutional affiliations.

