Article

A Comparative Study of Different Quality Oil Shales Developed in the Middle Jurassic Shimengou Formation, Yuqia Area, Northern Qaidam Basin, China

1
SinoProbe Center-China Deep Exploration Center, Chinese Academy of Geological Sciences, Beijing 100037, China
2
Key-Laboratory for Oil Shale and Coexisting Minerals Mineralization & Exploration and Exploitation, Jilin University, Changchun 130061, China
3
School of Natural Sciences, Macquarie University, Sydney, NSW 2109, Australia
4
Geology and Mineral Resource Program, Virginia Department of Energy, Charlottesville, VA 22903, USA
*
Author to whom correspondence should be addressed.
Energies 2022, 15(3), 1231; https://doi.org/10.3390/en15031231
Submission received: 16 December 2021 / Revised: 29 January 2022 / Accepted: 4 February 2022 / Published: 8 February 2022
(This article belongs to the Special Issue Research and Development Progress in Oil Shale)

Abstract

:
Oil shales are developed in the Shale Member of the Middle Jurassic Shimengou Formation in the Qaidam Basin, China. The oil shales can be classified into three quality groups (low-, medium-, and high-quality oil shales) through a comprehensive analysis protocol that includes Rock-Eval pyrolysis, total organic carbon (TOC) content, proximate analysis, gas chromatography-mass spectrometry (GC-MS), X-ray diffraction (XRD), major and trace element analyses, and maceral analysis. The low-quality oil shales mainly contain type II1 kerogen, the medium-quality oil shales mainly contain type I-II1 kerogen, and the high-quality oil shales mainly contain type I kerogen. All are immature to early thermally mature. The oil yield of the oil shales is directly related to their quality and are positively correlated with TOC content and calorific value. All studied samples were deposited under anaerobic conditions but in different paleoenvironments. The low-quality oil shales were mainly deposited in fresh-water environments, whereas the high-quality oil shales were usually developed in highly saline and reducing environments. Salinity stratification and evidence of algal blooms that are conducive to organic matter enrichment were identified in both medium- and high-quality oil shales, the latter having the highest paleoproductivity and the best preservation conditions. In summary, shale quality is controlled by a combination of factors, including algal abundance, preservation conditions, the existence of algal blooms and salinity stratification, and paleoproductivity. This study reveals how these different factors affect the quality of oil shales, which might provide an in-depth explanation for the formation process of lacustrine oil shales.

1. Introduction

Oil shale, a well-known unconventional oil resource, is composed of fine-grained sediments [1,2], in which the precursors of commercially-extractable oil are formed as a result of low-temperature carbonization [3,4]. In recent years, shale oil has become an ideal supplementary source of conventional crude oil around the world [5,6,7,8]. Many oil shale plays have been discovered in China, such as the Fushun Basin in Liaoning Province, the Maoming Basin in Guangdong Province, the Huadian Basin in Jilin Province, and the Songliao Basin in Heilongjiang Province [9,10,11,12,13,14,15].
A series of fine-grained sediments, such as mudstone, shale, bituminous shale, carbonaceous shale, and even carbonaceous diatomite, can be classified as shales [16,17,18]. Oil shale is typically defined by a minimum oil yield of 3.5 wt.% and a maximum ash yield of 40% and can be subdivided according to the oil yield into three groups: low-quality oil shale (oil yield of 3.5–5.0%), medium-quality oil shale (5.0–10.0%), and high-quality oil shale (10.0% and above) [11,19,20,21,22]. Large amounts of oil shales have been found in the Middle Jurassic Mudstone Member of the Shimengou Formation in the northern Qaidam Basin, where they are widely distributed with a large thickness but of different qualities [23,24,25,26]. Their average oil yield is 6.2 wt.%, with a maximum value of 11.5 wt.%. Previous studies mainly focused on the hydrocarbon generation potential and general geochemical characteristics of oil shale-bearing layers, and the palaeoclimate characteristics of oil shales developed in this region [23,27]. In contrast, no studies have unveiled some other characteristics, in particular, organic matter enrichment of oil shales with different qualities, as well as oil shale formation processes.
Given this, the Middle Jurassic Shimengou Formation was studied to identify and assess the main controlling factors for different qualities of oil shales and reveal the key sources and causes of organic matter enrichment. Finally, organic matter enrichment models were established for low-, medium-, and high-quality oil shales.

2. Geological Setting

The Yuqia area is located in the central part of the northern Qaidam Basin, which is located in central-western China, and is bordered by Dakendaban Mountain in the north and east and Lvliang Mountain in the south (Figure 1). The Middle Jurassic Qaidam Basin consists of the Dameigou Formation in the lower part and the Shimengou Formation in the upper part. The Shimengou Formation is further divided into the Coal-bearing Member in the lower part and the Shale Member in the upper part. The Shale Member of the Shimengou Formation is characterized and discussed in detail in this paper.
In the Yuqia area, the Shimengou Formation was only buried to relatively shallow depths and has a low thermal maturity (vitrinite reflectance = 0.5% to 0.7%). The lacustrine deposition was widely developed in the Shimengou Formation, especially in the Shale Member, when the lake water level reached its deepest extent. In the Coal-bearing Member, multilayered coal seams are predominant, and the coals are filled with pyrite particles. Therefore, its main depositional environment has been inferred to be a delta front/peat-mire. In contrast, the Shale Member mainly consists of dark gray siltstone and mudstone, and dark brown shale and oil shale. Oil shales in the Middle Jurassic Shimengou Formation were mainly formed in a semi-deep to deep lake environment (Figure 2) [23,24,28]. Laminations are highly developed, and large amounts of carbonate stripes, siderite concretions, ostracods, and lamelibranch fossils are present in the oil shales. Based on these findings, a shallow-to-deep lake has been deemed the main depositional environment of the oil shales in the region [23,24,25,27,29,30,31,32].

3. Data and Methods

The seven analytical tools that were employed to serve and satisfy the purpose of this research are: (1) total organic carbon (TOC) content; (2) Rock-Eval pyrolysis; (3) oil yield and proximate analysis; (4) gas chromatography-mass spectrometry (GC-MS) analysis; (5) vitrinite reflectance; (6) X-ray powder diffraction (XRD), and major, trace, and rare earth element analysis; and (7) maceral analysis. The extensive laboratory work used a total of 36 core samples from the YYY-1 well (Figure 2).

3.1. TOC Analysis and Rock-Eval Pyrolysis

TOC analysis and Rock-Eval pyrolysis were carried out at the Key Laboratory for Oil Shale and Coexistent Energy Minerals of Jilin Province (Changchun, China). A total of thirty-two rock samples cored between 335–376 m by the YYY-1 well were intact and analyzed by geochemical techniques (Figure 2). After acid treatment for the removal of carbonates, a LECO CS-230 instrument was used to analyze the TOC content of all of the samples following the Chinese national standard GB/T 19145-2003 [33]. Next, these samples were pretreated with 6 N HCl at 60 °C for two hours before pyrolysis using a Rock-Eval 6 instrument, following the widely used method proposed by Behar et al. [34] and Lafargue et al. [35]. In this analysis, 10–50 mg of pulverized sample was heated gradually in an inert atmosphere to obtain the values of S1, S2, S3, and Tmax, where Tmax is defined as the temperature of the maximum height of the S2 peak. The hydrogen index (HI) and oxygen index (OI) were obtained by normalizing the amounts of S2 and S3 pyrolyzate to TOC.

3.2. Oil Yield and Proximate Analyses

A total of fifteen samples, which are one-meter mixed samples, were tested for their oil yield, and then a proximate analysis was performed (Figure 2). The oil yield was determined following the Chinese Petroleum Chemical Industry Standard SH/T 0508-92 [36] using low-temperature carbonization furnaces. The heating process was conducted in five stages (85 °C–185 °C–300 °C–400 °C–475 °C–520 °C) with a 10 min stop and hold at the end of each stage, except for 520 °C (with a 20 min hold). The calorific value was assessed using a DC5015 calorimeter with Chinese national standard GB/T 213-2008 [37]. Ash yield and volatile matter were assessed using a muffle furnace X1-2000 under the Chinese national standard GB/T 212-2008 [38].

3.3. GC-MS Analysis

Fourteen samples selected from depths of 340–372 m (Figure 2) were used to conduct the GC-MS analysis following the methods documented by Ahmed and George [39] and Luo et al. [40]. The tests were carried out in the Organic Geochemical Lab of Macquarie University in Australia. The samples were crushed, and the solvent was extracted using a Dionex Accelerated Solvent Extractor (ASE300) with a mixture of dichloromethane and methanol (9:1, v/v). The solvent extraction method was repeated after repacking the sample in the cylinder, and the two extracts were combined to produce the extractable organic matter (EOM). Then, the extract solution was rotary evaporated to a small volume (~4 mL) with a 40 °C water bath. An aliquot of the EOM was transferred to a pre-weighed vial, the solvent was blown off by a stream of dry nitrogen at 40 °C, and then the weight of the total and remaining EOM was calculated. Fractionation was carried out in two stages using Pasteur pipettes packed with glass wool and silica gel by gravity elution. Total hydrocarbons were collected by eluting with n-hexane and dichloromethane (4:1, v/v), and polar compounds were collected by eluting with methanol and dichloromethane (1:1, v/v). Then, the total hydrocarbons were separated into a second column. The aliphatic hydrocarbons were eluted with 2.6 mL n-hexane, and the aromatic hydrocarbons were collected and eluted with n-hexane and dichloromethane (4:1, v/v). The aliphatic and aromatic hydrocarbon fractions were reduced in volume and analyzed by GC-MS on an Agilent GC (6890N) coupled to an Agilent Mass Selective Detector (5975B) equipped with a J&W DB-5MS fused silica column (length 60 m, inner diameter 0.25 mm, film thickness 0.25 μm). The inlet was held at 35 °C for 3 min then was programmed to 310 °C (0.4 min. isothermal) at a rate of 700 °C/min. Samples were injected in splitless mode. The temperature of the GC oven was initially held at 40 °C for 4 min and was programmed to 310 °C at 4 °C /min, then was held for 40 min. Helium (99.999%) was used as the carrier gas with a constant flow rate of 1.5 mL/min. The ion source of the mass spectrometer was operated in EI mode at 70 eV. The MS data were acquired in full scan and selected ion monitoring (SIM) modes.

3.4. Vitrinite Reflectance and Maceral Analysis

Random mean vitrinite reflectance (% Ro) measurements were carried out at the Geochemical Lab of Yangtze University using a Leitz MPV3-SP microscope equipped with a 50×/0.85 oil immersion microscope objective following the Chinese national standard SY/T 5124-2012 [41]. Six samples from the YYY-1 well were analyzed. Samples were crushed to 0.5–1 mm and filled into a 25 mm grinding tool. A consolidation agent and polishing agent were used to create a polished block. Statistical data were acquired over the entire polished section in 0.5 mm × 0.5 mm grids. A minimum of 21 points were counted for each sample, and the mean random vitrinite reflectance was calculated.
Fourteen samples were analyzed for their maceral composition by microscopic analysis at the Key Laboratory for Oil Shale and Associated Minerals of Jilin Province (Changchun, China), following the International Committee for Coal and Organic Petrology (ICCP) system: liptinite classification, Pickel et al. [42]; vitrinite classification, ICCP 1998 [43]; and inertinite classification, ICCP 2001 [44]. Polished blocks were examined using an MSP2000 microscope with a 50× oil immersion objective, using reflected white-light and blue-light irradiation. A minimum of 1000 points were counted per polished block using the single scan method [45,46].

3.5. X-ray Powder Diffraction, Major, Trace, and Rare Earth Element Analysis

X-ray powder diffraction was carried out in the analytical laboratory of the Beijing Research Institute of China Uranium Geology following the Chinese Petroleum Industry Standard of SY/T 6210-2010 [47]. Samples were crushed to 40μm and pressed into a frame. The sample frame was stuck to a ground-glass slide, with the lower side being the testing side. A Panalytical X’Pert PRO X-ray diffractometer was used to obtain the X-ray spectrogram. Since each mineral component has a specific X-ray diffraction pattern and the intensity of the characteristic peak in the spectrum correlates positively with mineral content in the sample, the content of each mineral could be determined.
Major, trace, and rare earth element analysis was completed in the same lab following China national standard GB/T 14506.30-2010 [48]. About 25–50 mg of sample was pulverized to 76μm and then dried for 2–4 h. 1 mL hydrofluoric acid and 0.5 mL nitric acid were added to the sample in a closed container where the sample was heated at 185 ± 5 °C for 24 h. This was followed by evaporation with 0.5 mL nitric acid drops. Next, the sample was sealed with 5 mL nitric acid and dried for 3 h in a drying oven. Once the solution was cooled down, it was diluted with water to 25 mL. In the last step, the solution was analyzed for trace and rare earth elements using inductively coupled plasma mass spectrometry on a NexION300D, following the Chinese national standard GB/T 14506.30-2010 [48]. Major elements, including Si, Al, Ca, K, Na, Fe, Mn, Mg, Ti, and P, were identified using X-ray fluorescence spectrometers AB104L, AL104, and AxiosmAX, following the analytical methods described by Kimura and Dai et al. [49,50]. The error was usually within 5%.

4. Results

4.1. Oil-Shale Quality and TOC Content

Oil shales in the Middle Jurassic Shimengou Formation have an oil yield of 3.8–11.0 wt.% (average 7.2 wt.%) (Table 1). The low-quality oil shales have the highest ash yield (average 77 wt.%), lowest TOC content (average 6.9 wt.%) and calorific value (average 3237 KJ/kg), and moderate volatile matter content (average 22 wt.%). The medium-quality oil shales have the highest volatile matter content (average 31 wt.%), lowest ash yield (average 68 wt.%), and medium TOC content (average 10.8 wt.%) and calorific value (average 5132 KJ/kg). The high-quality oil shales have the highest TOC content (average 15.6 wt.%) and calorific value (average 6502 KJ/kg), medium ash yield (average 72 wt.%), and lowest volatile matter content (average 16 wt.%) (Table 1).

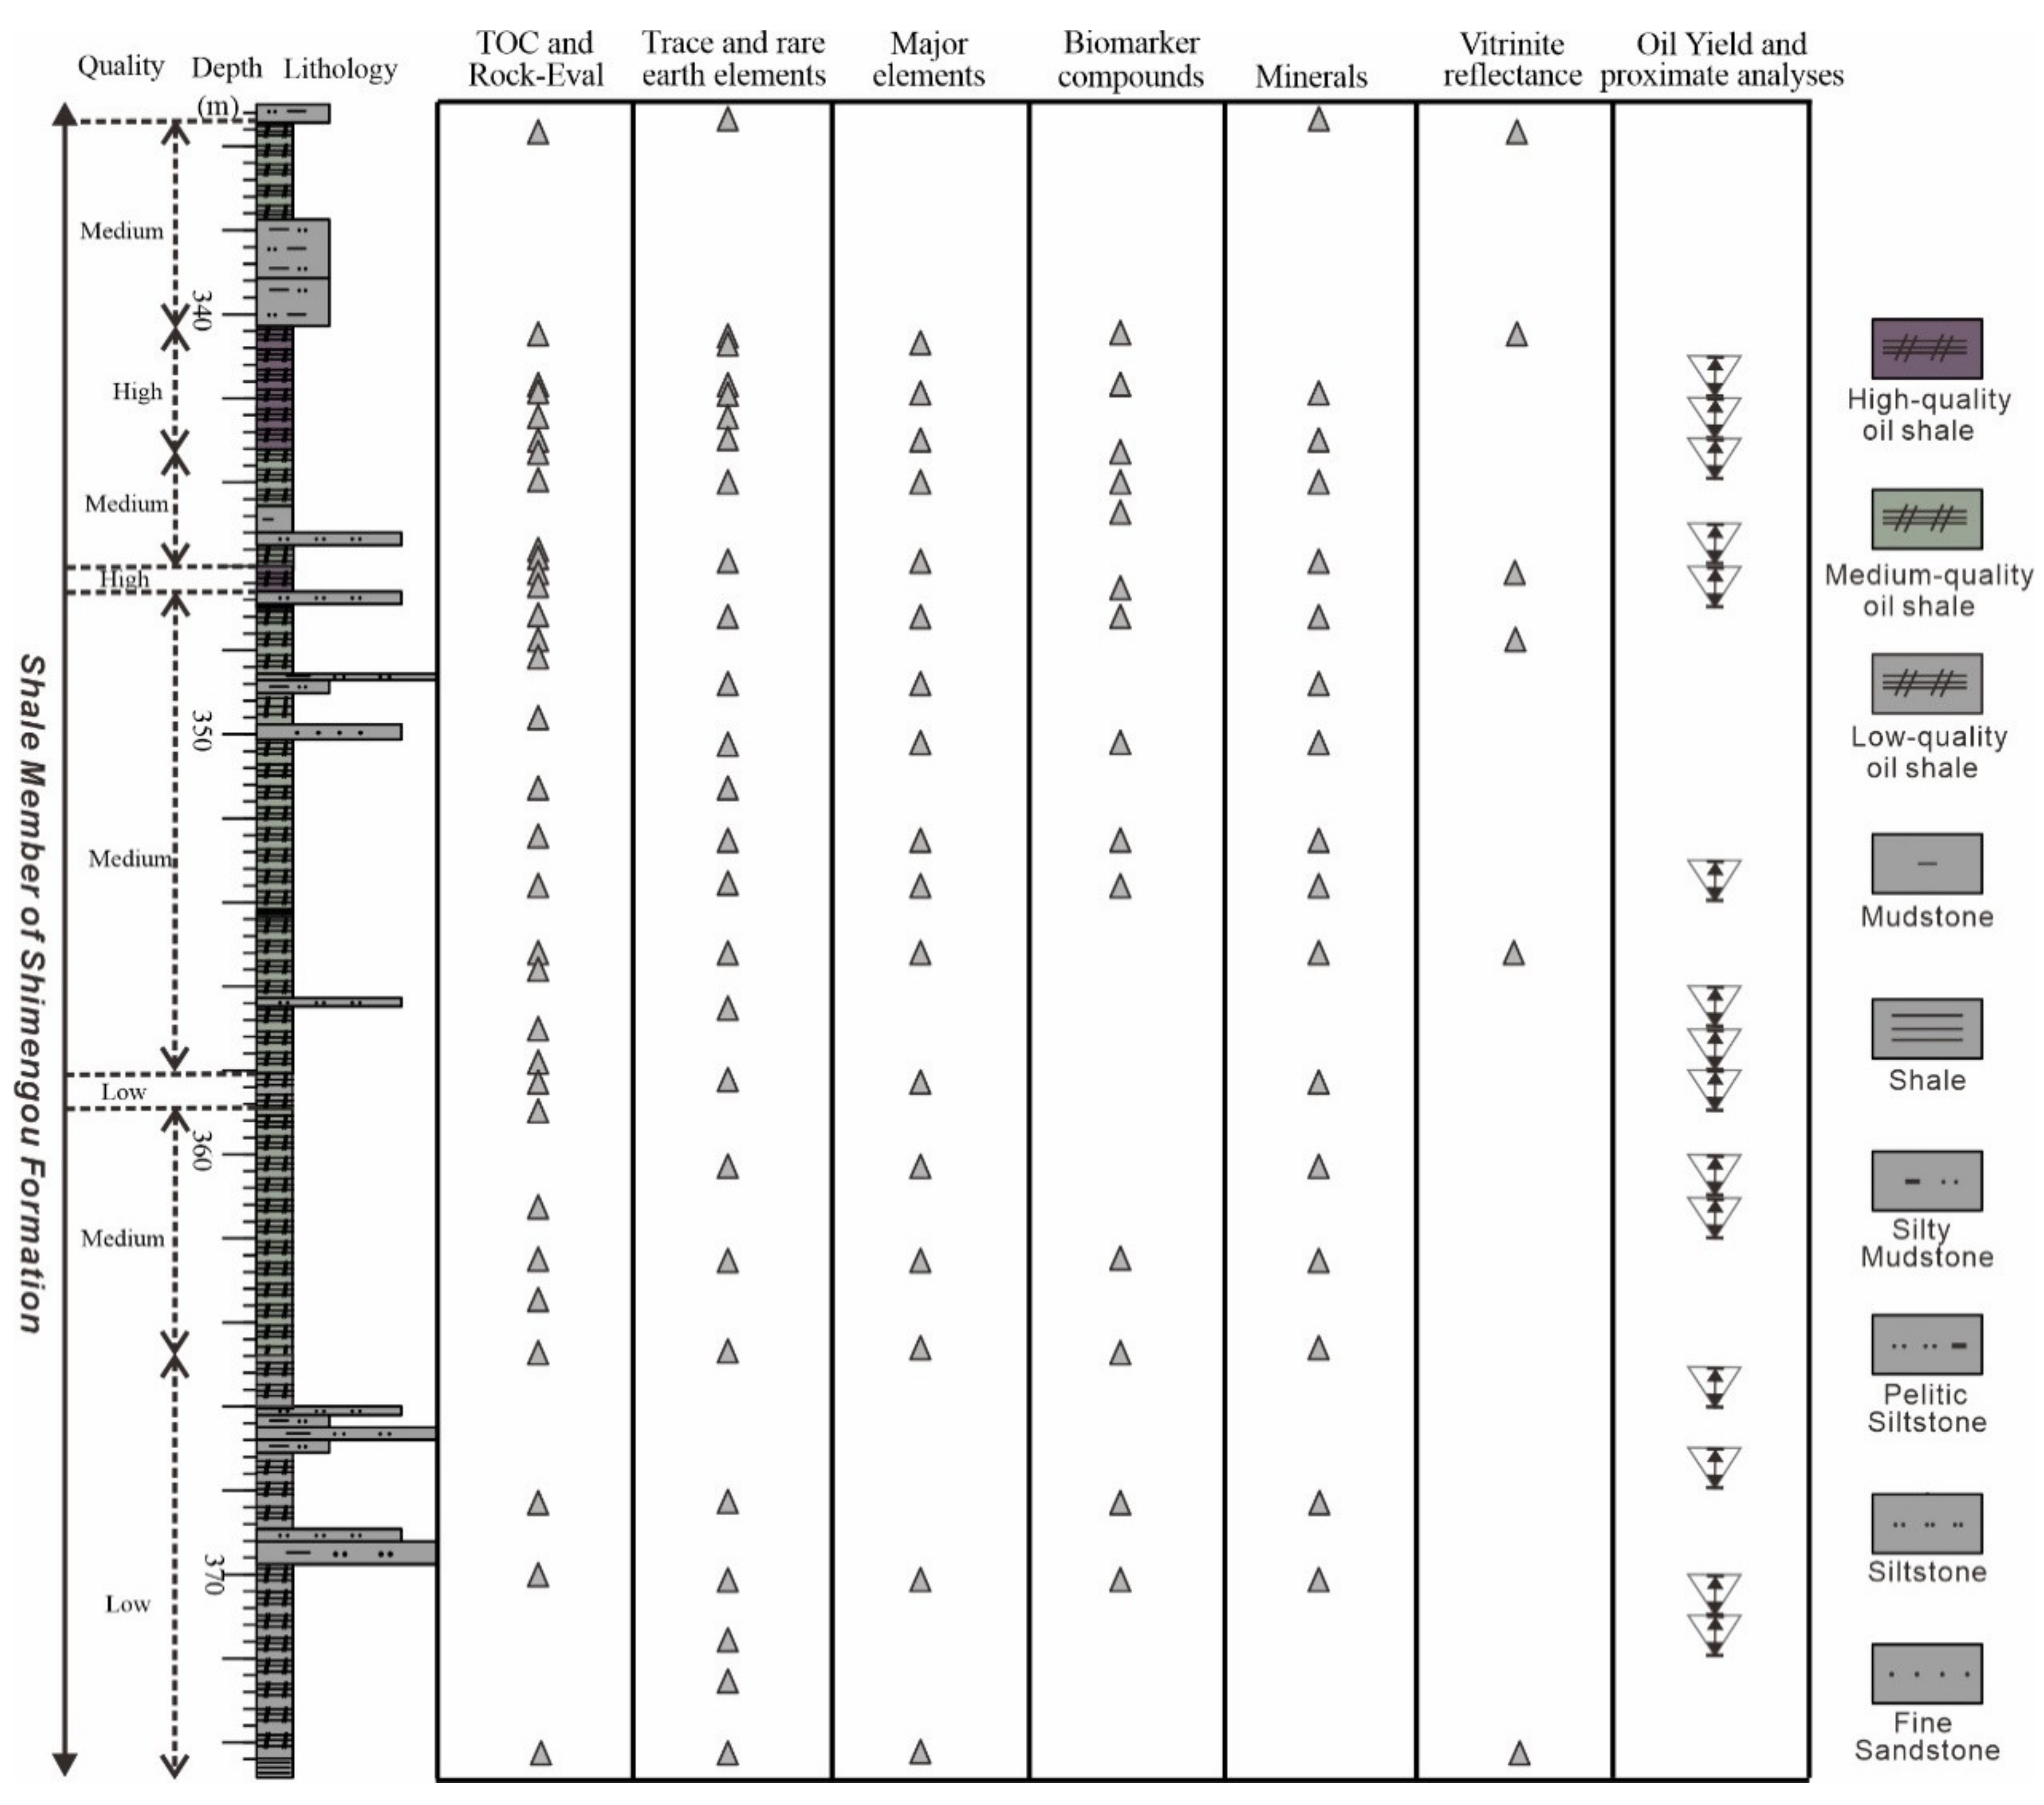
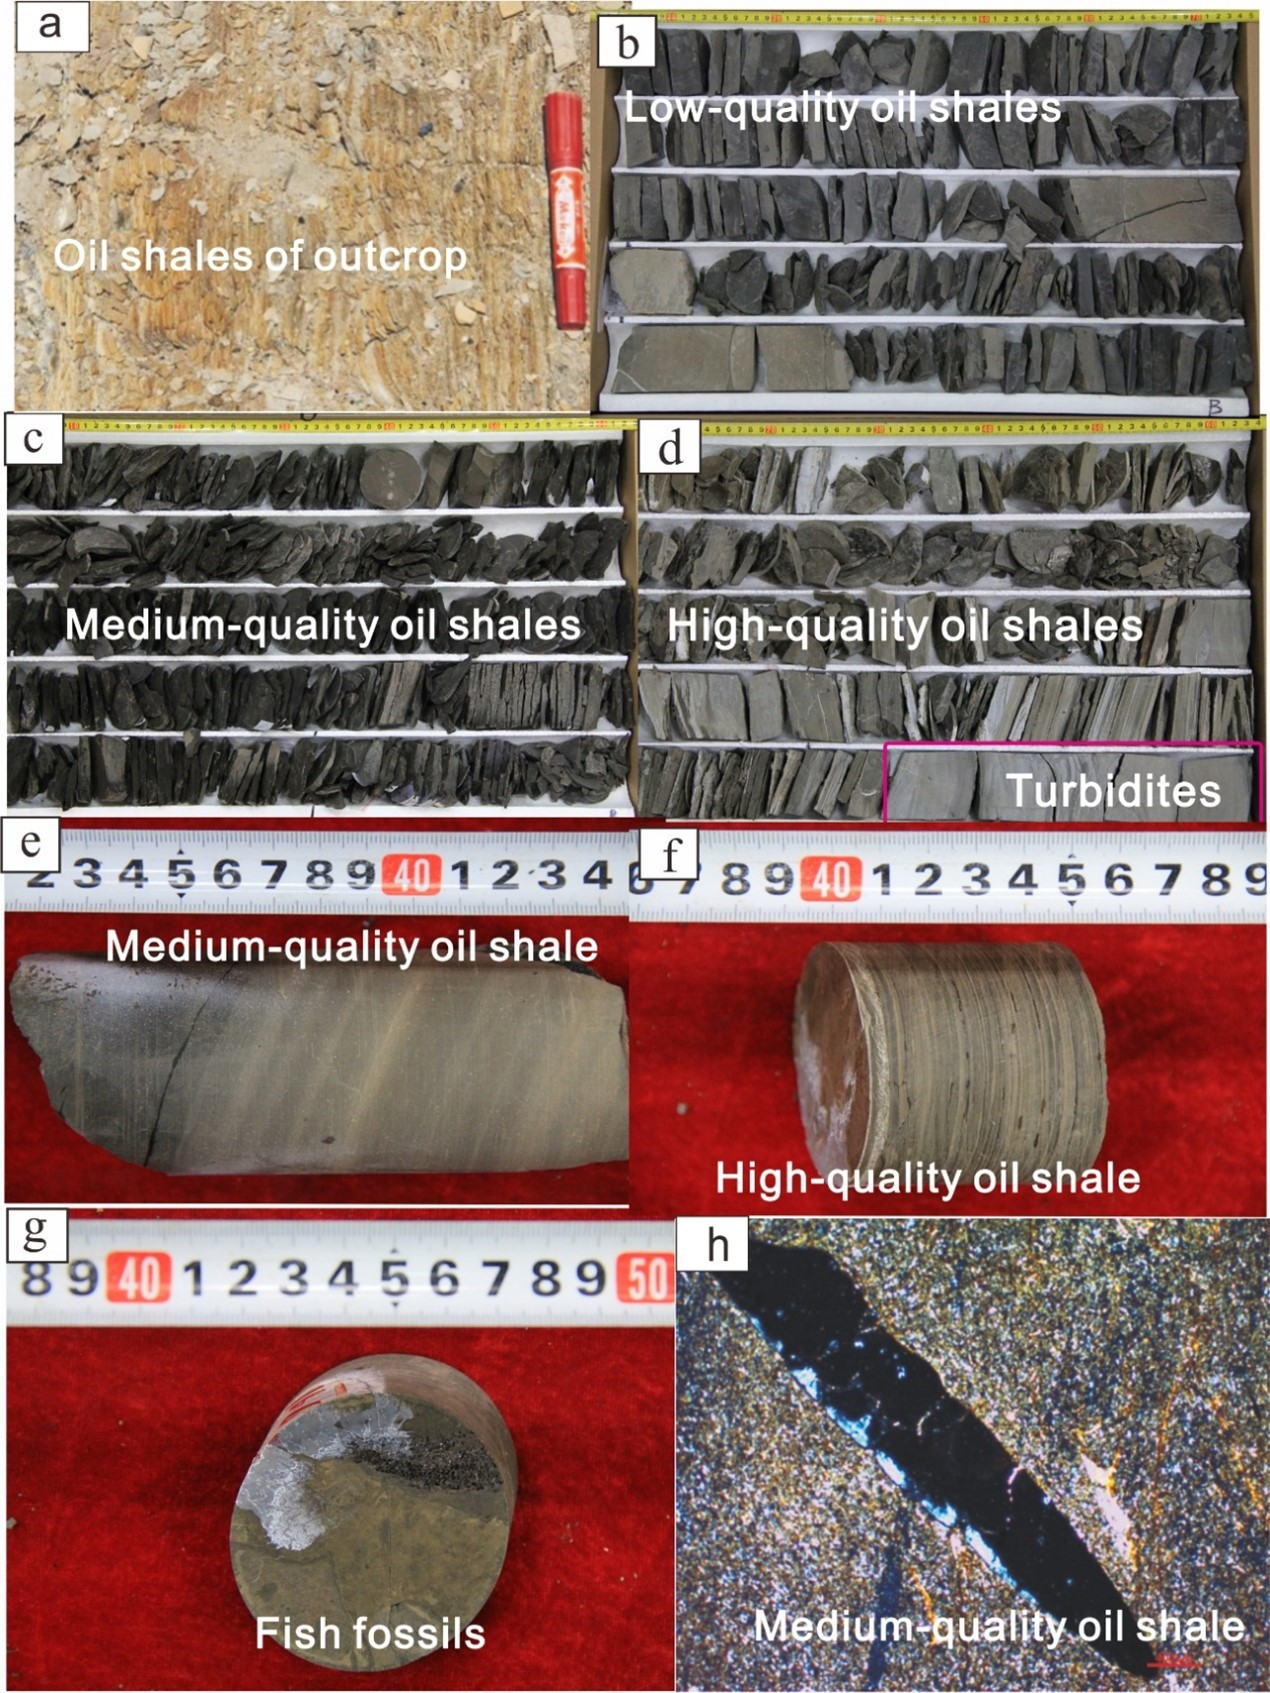
4.2. Lithological Characteristics

The semi-deep to deep lake oil shales in the Shale Member of the YYY-1 well are mainly from 335.0–376.0 m. The low-quality oil shales were developed in the lower section up to 365.0 m, while the medium- and high-quality oil shales were developed in the upper section (Figure 2).
The majority of the outcrop oil shales are severely weathered to a dark brown color (Figure 3a). The low-quality oil shales in the YYY-1 well are mostly dark gray or grayish black (Figure 3b). The medium-quality oil shales (Figure 3c) are mostly brown, and the high-quality oil shales (Figure 3d) are light brown. Above and below the medium- and high-quality oil shales are dark gray or grayish black argillaceous siltstones (Figure 3d).
The low-quality oil shales are characterized by a bulk structure (Figure 3b). The medium-quality oil shales are predominantly developed with horizontal bedding (Figure 3e). The high-quality oil shales feature rhythmic and horizontal bedding (Figure 3f). Fish fossils were observed in the low-quality oil shales (Figure 3g), and some shelly fossils (likely freshwater ostracods or lamellibranch fossils) [23,24,27,28,51,52,53] were found in the medium- and high-quality oil shales (Figure 3h). Carbonate sheets and stripes were developed in the high-quality oil shales (Figure 3d,f).

4.3. Mineralogical Composition

Based on XRD analysis, the dominant constituents of oil shales of all qualities are clay minerals and quartz (Table 2). There were no carbonate minerals found in the low-quality oil shales. However, in the medium-quality oil shales, not only was a small proportion of plagioclase (5.6–8.5%) detected but also a high proportion of carbonate minerals (32.8–48.3%) was found. The high-quality oil shales only contain 14.9% of dolomite on average, and no plagioclase was detected (Table 2).

4.4. Vitrinite Reflectance (Ro) and Rock-Eval Pyrolysis Parameters

The low-, medium-, and high-quality oil shales have the average measured %Ro values of 0.65, 0.6, and 0.65, respectively. For the low-quality oil shales, the average Rock-Eval parameters are S1 = 0.3 mg HC/g rock, S2 = 36.4 mg HC/g rock, and hydrogen index (HI) = 496 mg HC/g TOC (Table 3). For the medium-quality oil shales, the average Rock-Eval parameters are S1 = 0.9 mg HC/g rock, S2 = 55.9 mg HC/g rock and HI = 616 mg HC/g TOC. For the high-quality oil shales, the average Rock-Eval parameters are S1 = 2.4 mg HC/g rock, S2 = 85.4 mg HC/g rock, and HI = 803 mg HC/g TOC. The production index (PI) and Tmax ranges of the low-, medium-, and high-quality oil shales are 0.01 and 431–439 °C, 0.01–0.04 and 427–441 °C, and 0.01–0.04 and 427–441 °C, respectively (Table 3).

4.5. Hydrocarbons and Biomarkers

n-Alkanes, isoprenoids, steranes and diasteranes, hopanes, and related compounds were identified, and their relative contents and various ratios were calculated (Table 4). The C21–C25n-alkanes are the most abundant, followed by C15–C19n-alkanes, and the n-alkane carbon preference index varies from 1.4–2.1, indicating a strong odd carbon number predominance. Pristane (Pr) and phytane (Ph) are present in all samples, with Pr/Ph ratios of <0.7 for the high-quality oil shales, an average of 1.9 for the medium-quality oil shales, and >2.8 for the low-quality oil shales. Based on the regular C27–C29 steranes, the C27 isomers are the most abundant in the medium- and high-quality oil shales, while the C28 isomers have the lowest abundance. In contrast, in the low-quality oil shales, the C29 steranes are the most abundant. Gammacerane was also identified in all samples and is much more abundant in the high-quality oil shales (gammacerane/C30 αβ hopane average = 0.22) than in the medium-quality oil shales (average = 0.16) and low-quality oil shales (average = 0.03) (Table 4). The regular steranes/C30 αβ hopane ratio is highest in the high-quality oil shales (average = 1.12), moderate in the medium-quality oil shales (average = 0.79), and lowest in the low-quality oil shales (average = 0.43). The C19 + C20 tricyclic terpanes/C23 tricyclic terpane ratio is higher in the low-quality oil shales (average = 7.7) and lower in the high-quality oil shales (average = 1.68). The C27 diasteranes/C27 steranes ratio is always <0.24 and is lower in the high-quality oil shales (Table 4). Biomarker thermal maturity parameters that were measured are the Ts/(Ts + Tm) ratio based on hopanes and the C29 αββ 20S/(20S + 20R) sterane ratio. The Ts/(Ts + Tm) ratio is low (<0.1) for all except two medium-quality oil shales with ratios of 0.21. The C29 αββ 20S/(20S + 20R) sterane ratio is very low for the high-quality oil shales (average = 0.06) and has an average of about 0.18 for the other samples.

4.6. Trace Elements

For the low-, medium-, and high-quality oil shales, the Sr/Ba element ratios are 0.17–0.20 (average 0.18), 0.17–0.96 (average 0.34), and 0.36–1.09 (average 0.71), respectively. The V/(V + Ni) ratios are 0.64–0.75 (average 0.7), 0.65–0.77 (average 0.70), and 0.65–0.74 (average 0.71). The Ba/Ti element ratios are 747–937 (average 805), 667–2230 (average 986), and 881–2246 (average 1517). The Ba/Al element ratios are 27–32 (average 29), 25–89 (average 38), and 28–85 (average 55) (Table 3).

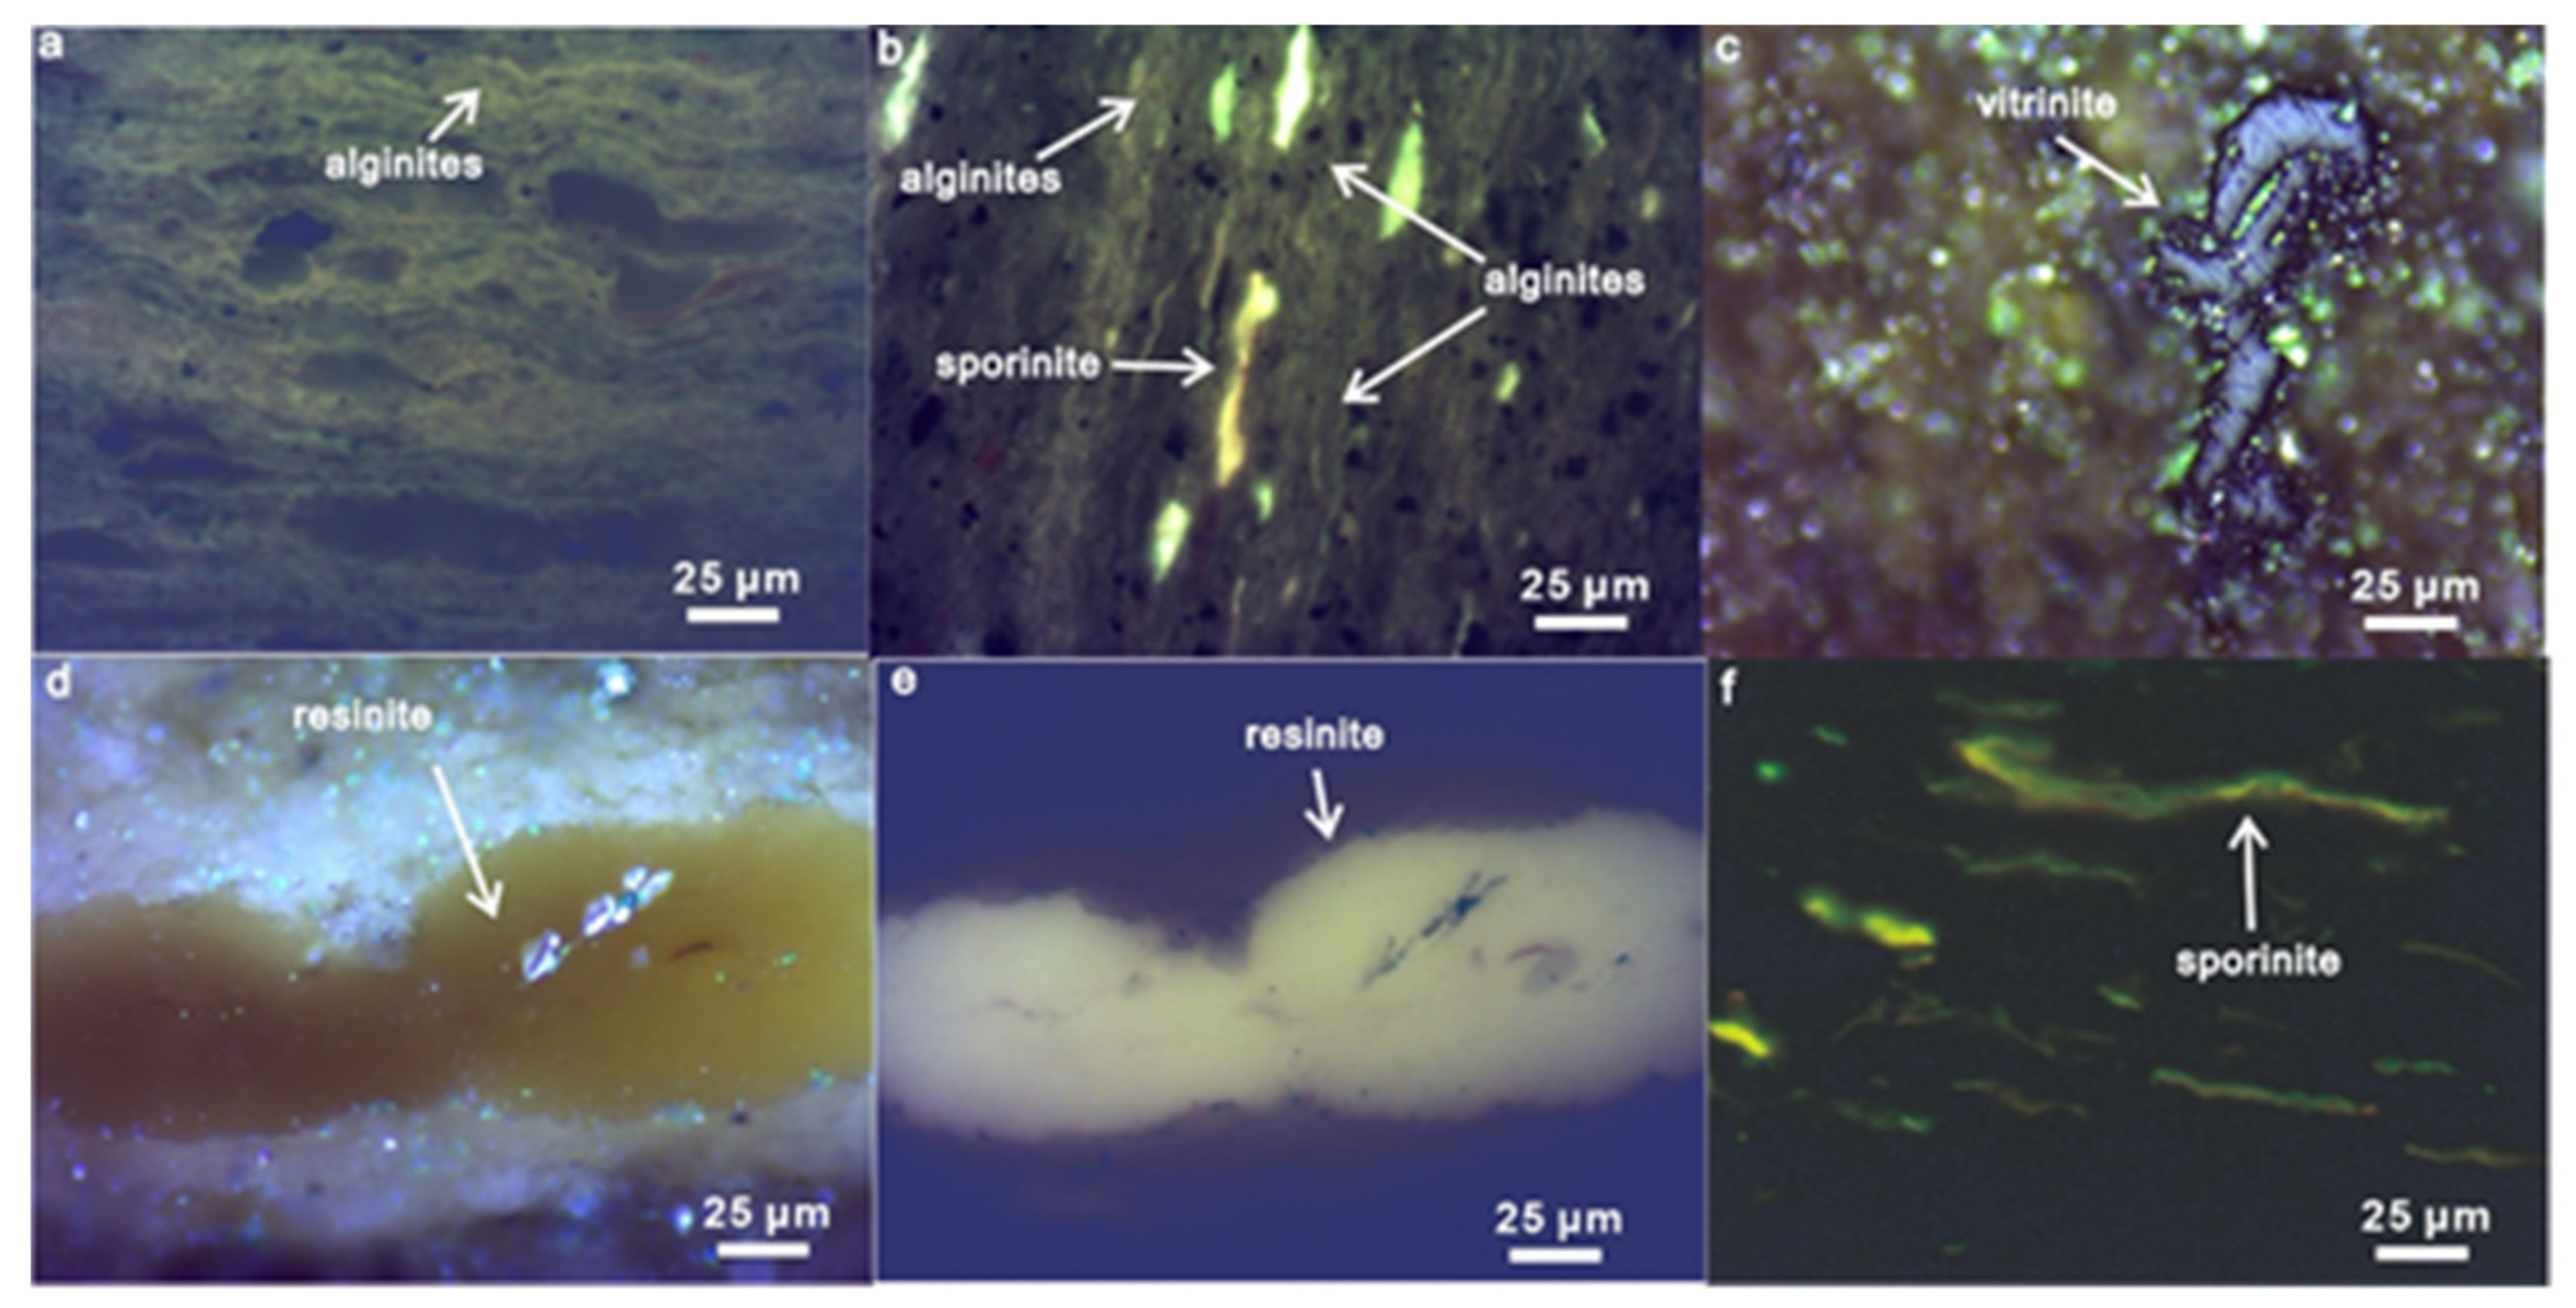
4.7. Maceral Composition

Maceral analysis is an effective approach to identify the organic matter type and source of oil shales [46,55,56]. The oil shales have a generally high content of alginite, a medium content of liptinite (sporinite, resinite, and fluorinite), and a low content of vitrinite and chlorophyllinite (Figure 4; Table 5). The average contents of alginite in the low-, medium-, and high-quality oil shales are 0.58, 0.62, and 0.69, respectively. The average contents of liptinite are 0.26, 0.29, and 0.26, and those of liptinite combined with vitrinite and chlorophyllinite are 0.36, 0.36, and 0.29 (Table 5).

5. Discussion

5.1. Characteristics of Organic Matter

5.1.1. Organic Matter Enrichment and Thermal Maturity

The results that relate to different qualities of oil shales show that the quality increases with TOC content, indicating that the oil-shale quality is controlled by organic matter enrichment (Table 3). In addition, judging from the uniform %Ro values and Rock-Eval Tmax range of 427–444 °C, the organic matter of all the oil shales is considered to be in the immature to early mature stages, notwithstanding the possibility that the vitrinite reflectance may be suppressed due to high amounts of liptinites and lipids [57]. Moreover, the biomarker thermal maturity parameters concur with this assessment, i.e., all the Ts/(Ts + Tm) ratios are below 0.25, all the C29 αββ 20S/(20S + 20R) sterane ratios are well below the equilibrium of 0.52, and all the n-alkane carbon preference indices are well above 1.0 (Table 4) [58,59,60,61,62,63].

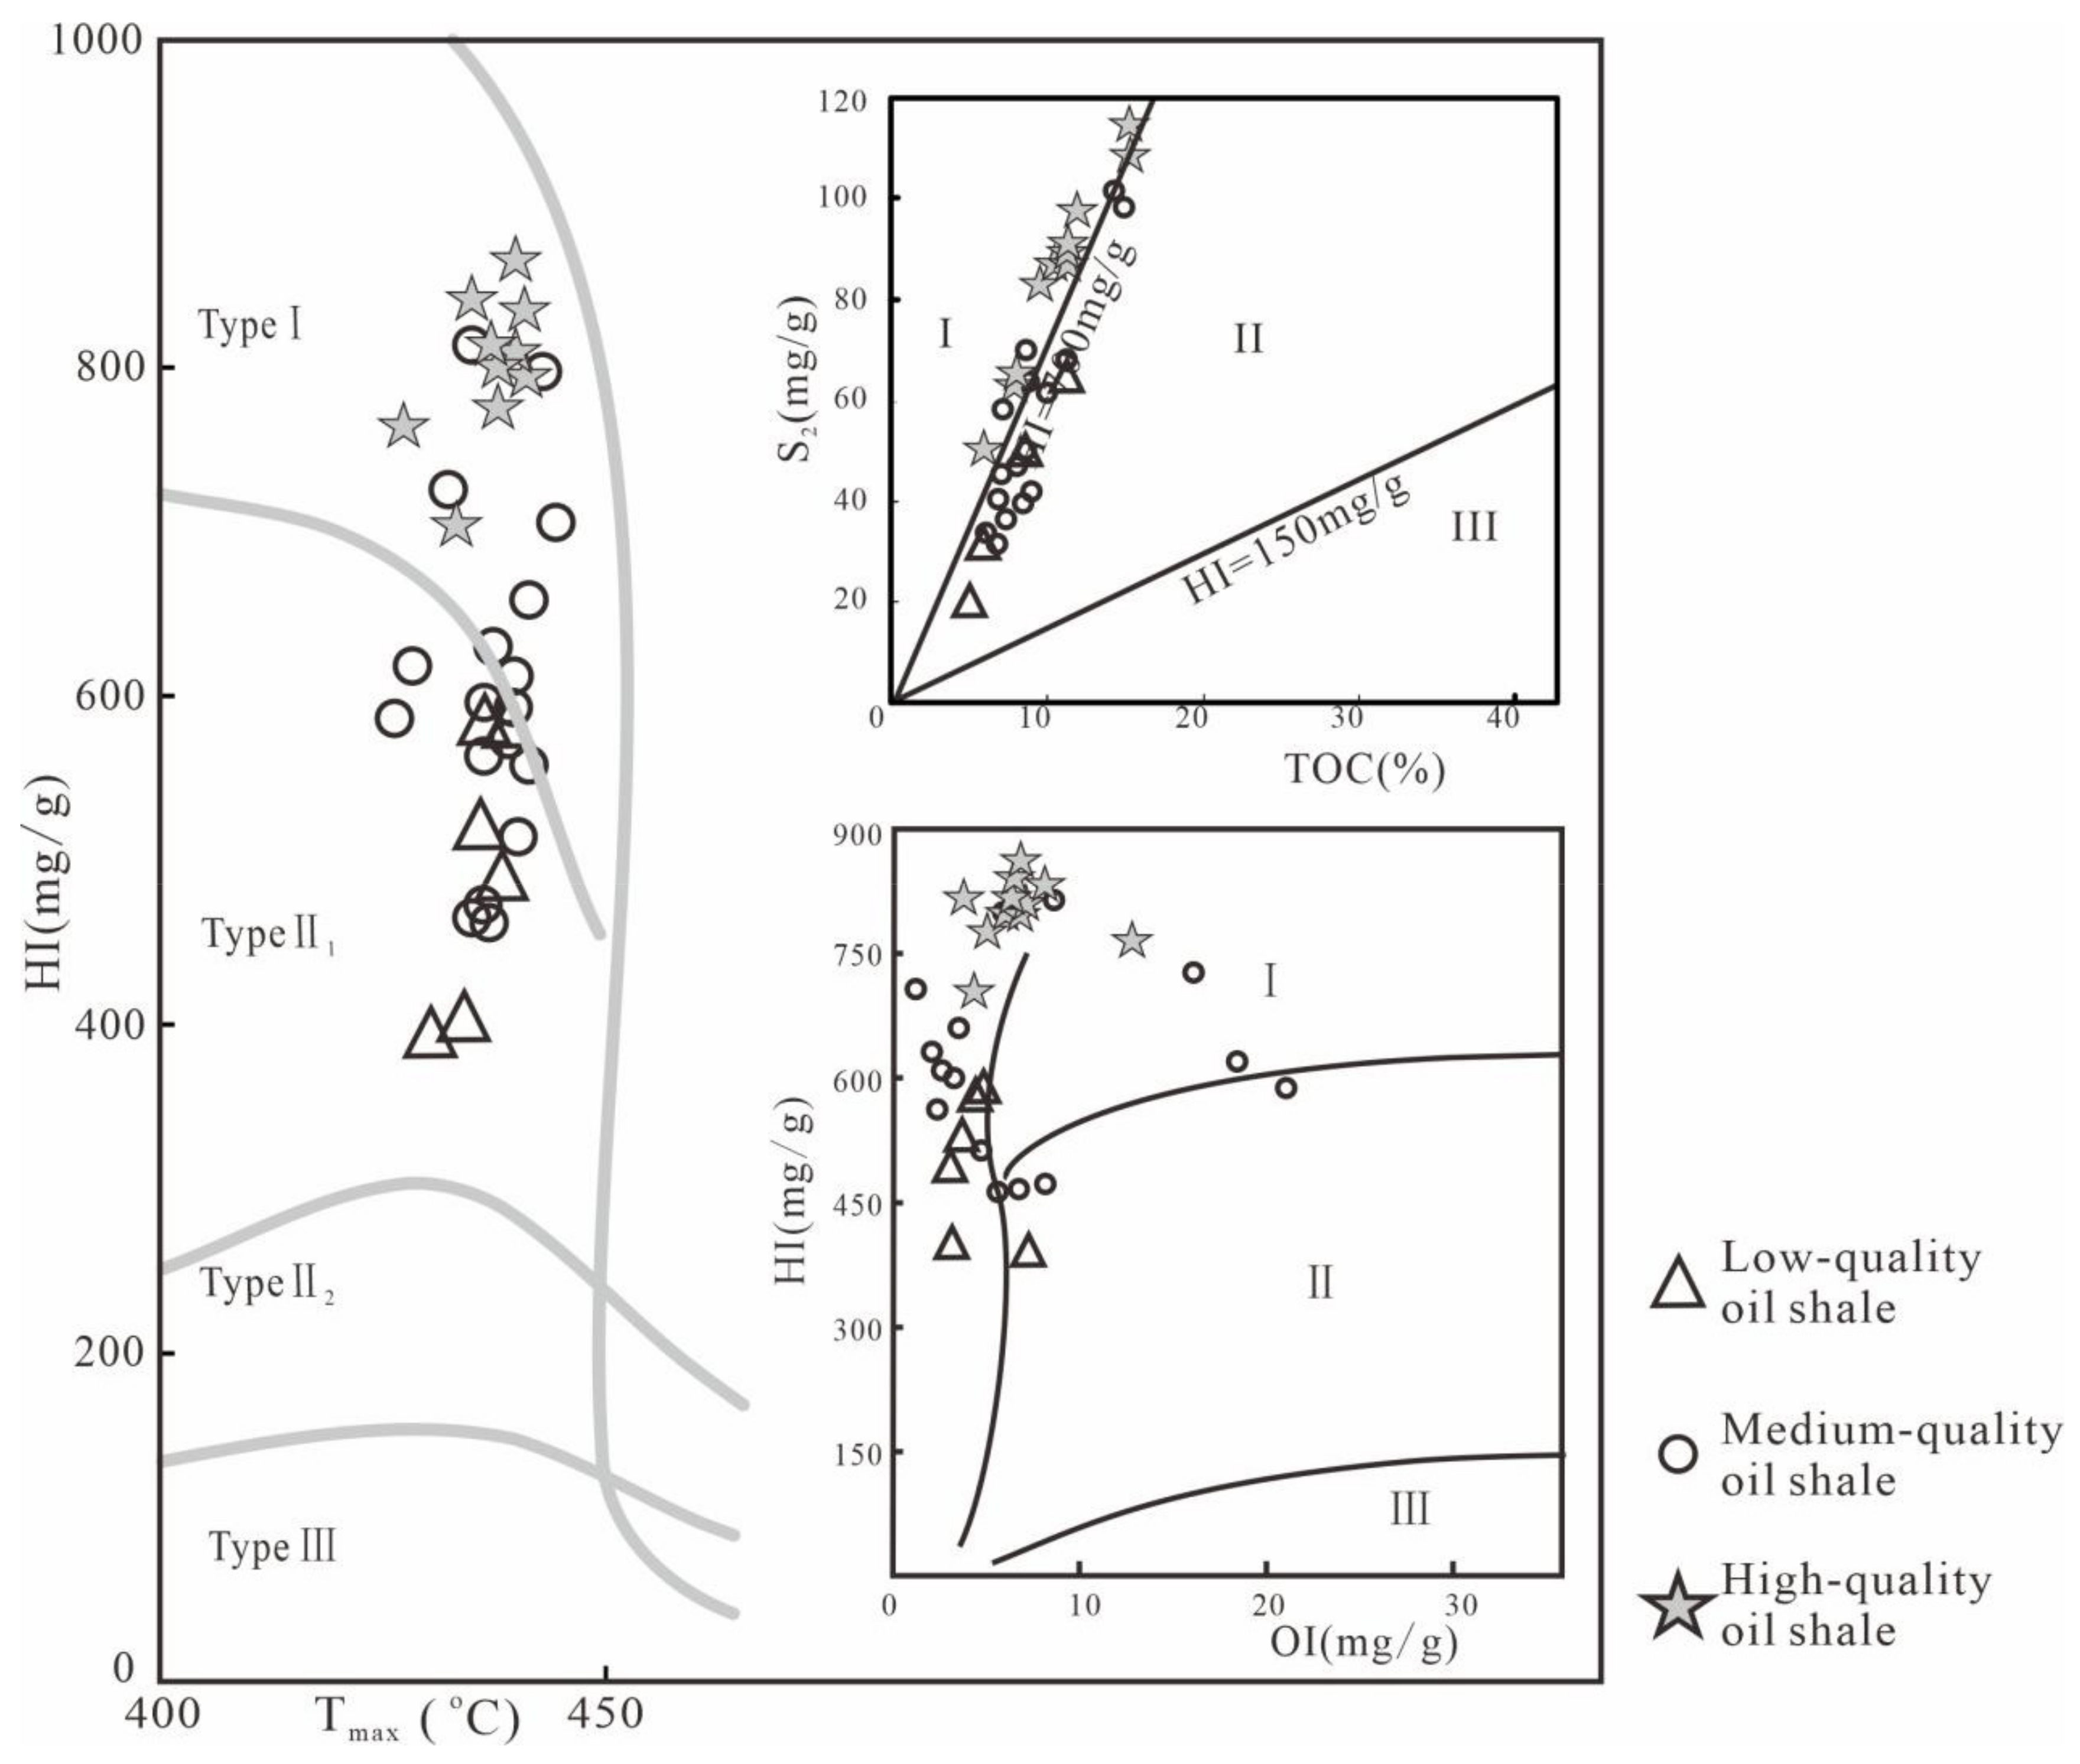
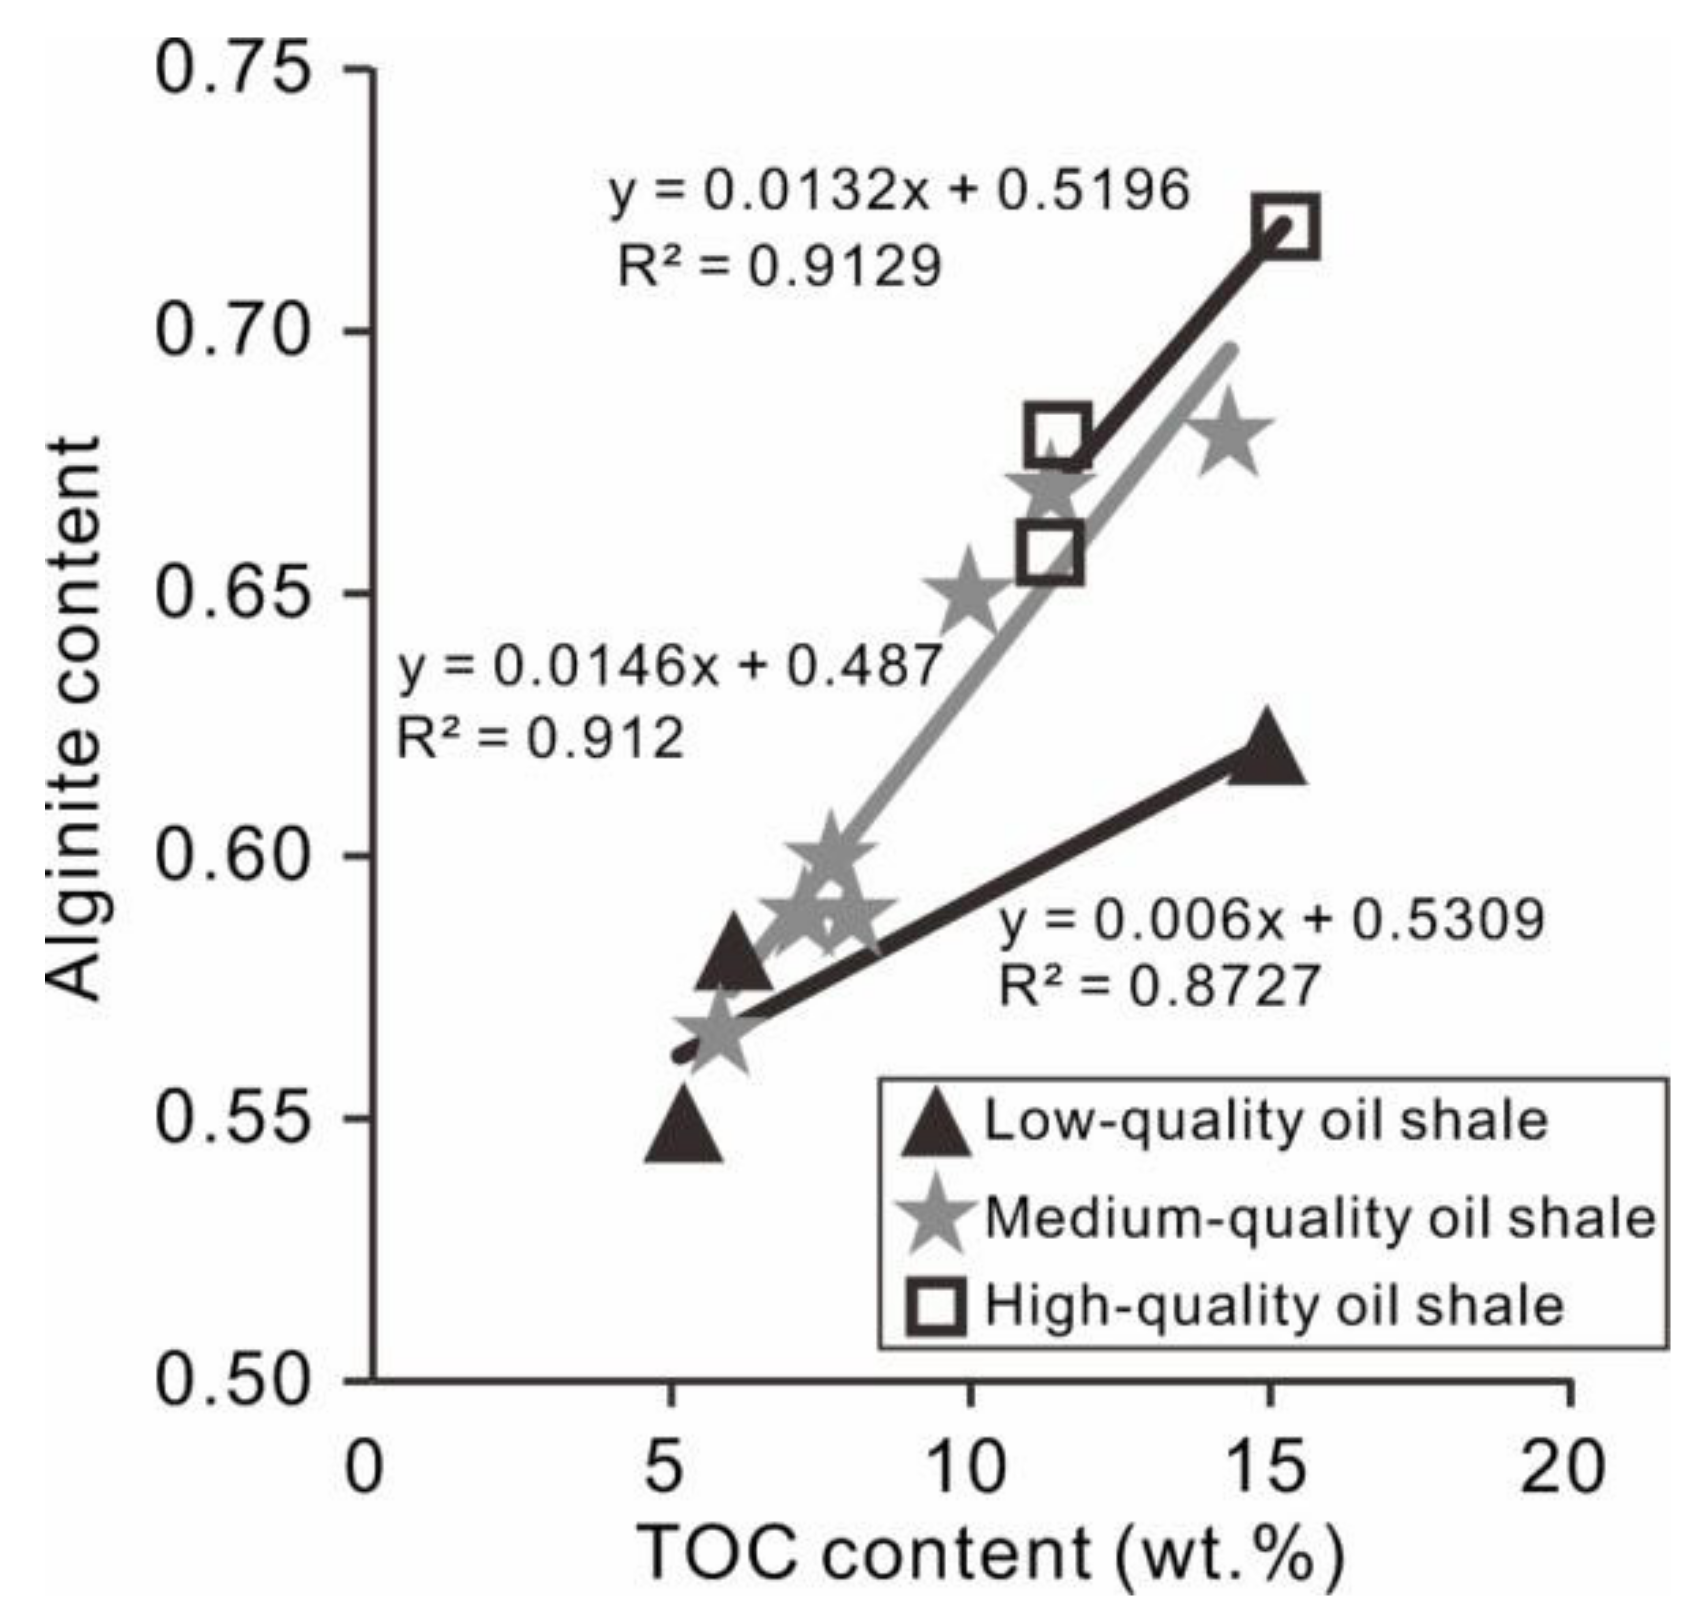
5.1.2. Organic Matter Type and Source

Cross plots of Tmax versus HI, TOC versus S2, and OI versus HI (Figure 5) indicate that the oil shales contain type I-II1 organic matter [64,65,66]. The low-quality oil shales contain type II1 kerogen, the medium-quality oil shales contain both type I-II1 kerogen, and the high-quality oil shales contain type I kerogen.
The high-quality oil shales have the highest proportion of 12 lginate in the macerals. Relatively high contents of liptinite and vitrinite are observed in the medium- and low-quality oil shales. This is interpreted as showing that the high-quality oil shales contain organic matter that is mainly derived from lacustrine aquatic organisms, such as algae and microbes [67,68,69,70]. In contrast, the medium- and low-quality oil shales are interpreted to contain organic matter from mixed sources of lacustrine aquatic organisms and terrigenous higher plants [58,67,71]. The low-quality oil shales have a high proportion of alginite and liptinite (Table 5), a high proportion of C29 steranes relative to C27 and C28 steranes (Table 4), and a lower regular sterane/C30 αβ hopane ratio than the other oil shales (Table 4). In contrast, the high-quality oil shales have the highest C27 steranes/(C28 + C29) steranes ratio, regular steranes/C30 αβ hopane ratio (Table 4), and alginite content (Table 5). Therefore, it can be concluded that the medium-quality oil shales were derived predominantly from two dissimilar sources: one was lacustrine aquatic organisms, and the other was lacustrine aquatic organisms mixed with terrigenous higher plants [58].

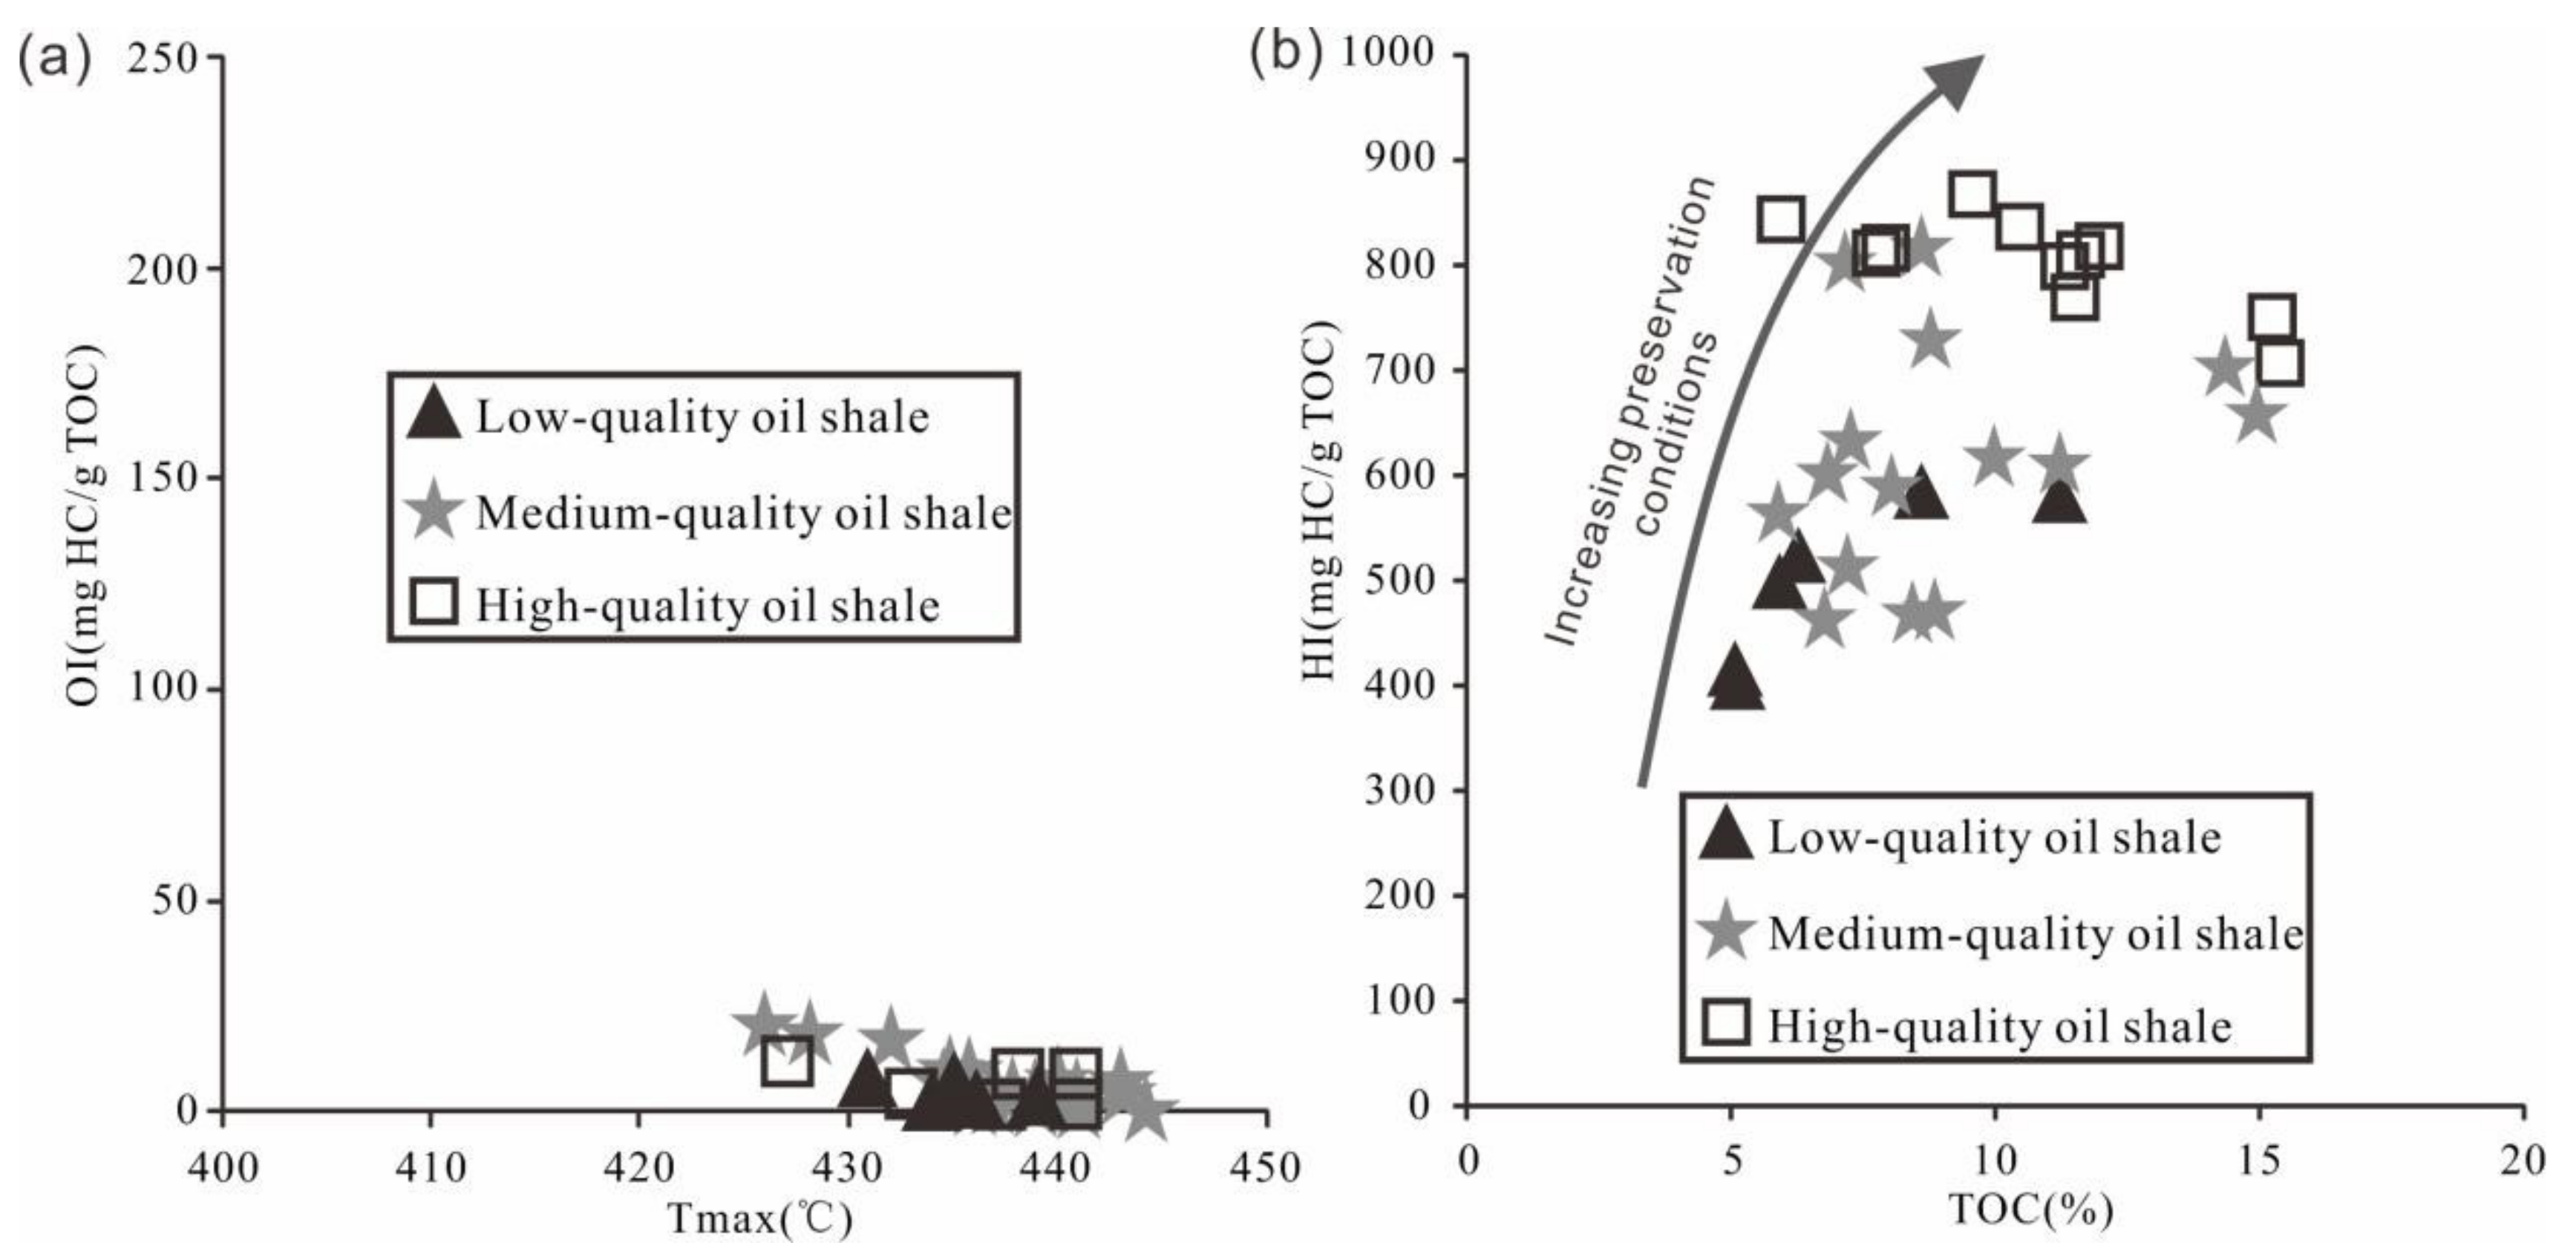
5.2. Preservation Conditions
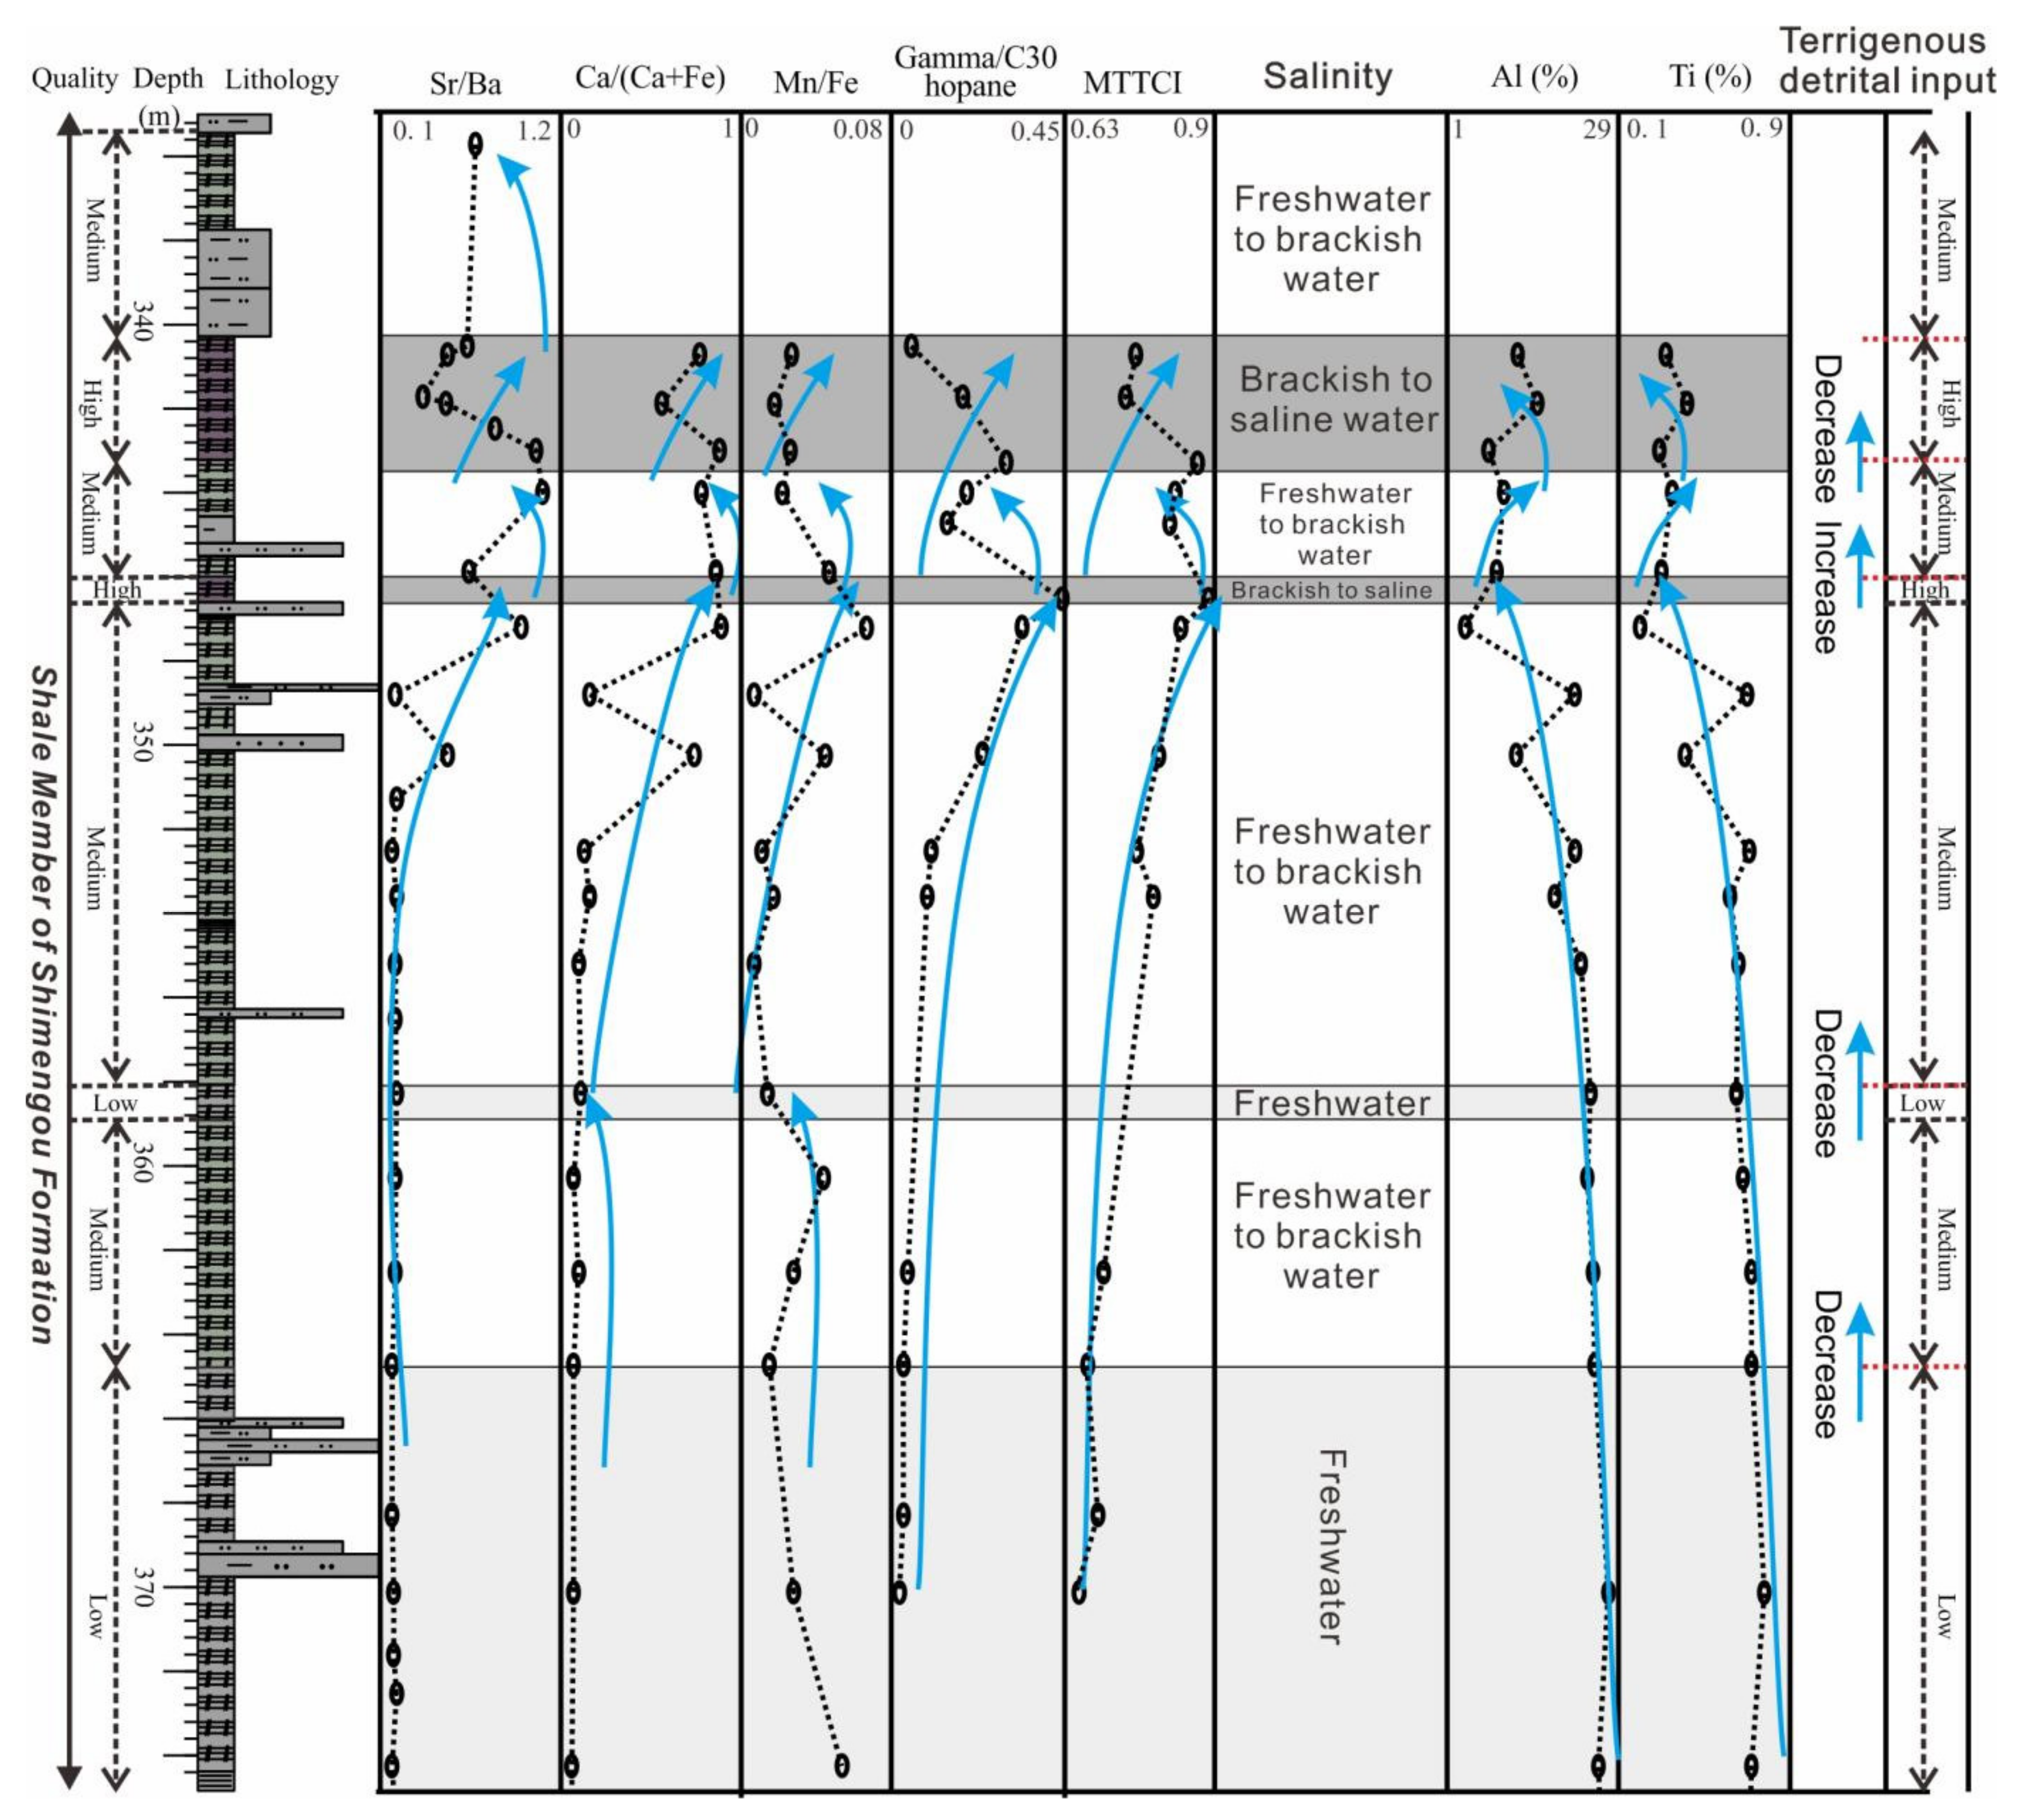
5.2.1. Salinity

Owing to well-matched positive correlations, the Sr/Ba, Ca/(Ca + Fe), Mn/Fe, gammacerane/C30 αβ hopane, and MTTCI ratios are considered to be good indicators of water salinity (Figure 6). A Sr/Ba ratio <0.5, a Ca/(Ca + Fe) ratio of <0.2, and a low gammacerane/C30 αβ hopane ratio are indicative of freshwater. A Sr/Ba ratio >1.0, a Ca/(Ca + Fe) ratio >0.5 and a high Mn/Fe, MCCTI and gammacerane/C30 αβ hopane ratio suggest saline water [58,72,73,74,75,76,77]. Based on this interpretational framework, these ratios (Table 3 and Table 4) indicate that low-quality oil shales were deposited in freshwater depositional environments, medium-quality oil shales were deposited in freshwater to brackish water depositional environments, and high-quality oil shales were deposited in brackish to saline water depositional environments. In general, from low- to medium- then to high-quality oil shales, the depositional water salinity shows an increasing trend (Figure 6).

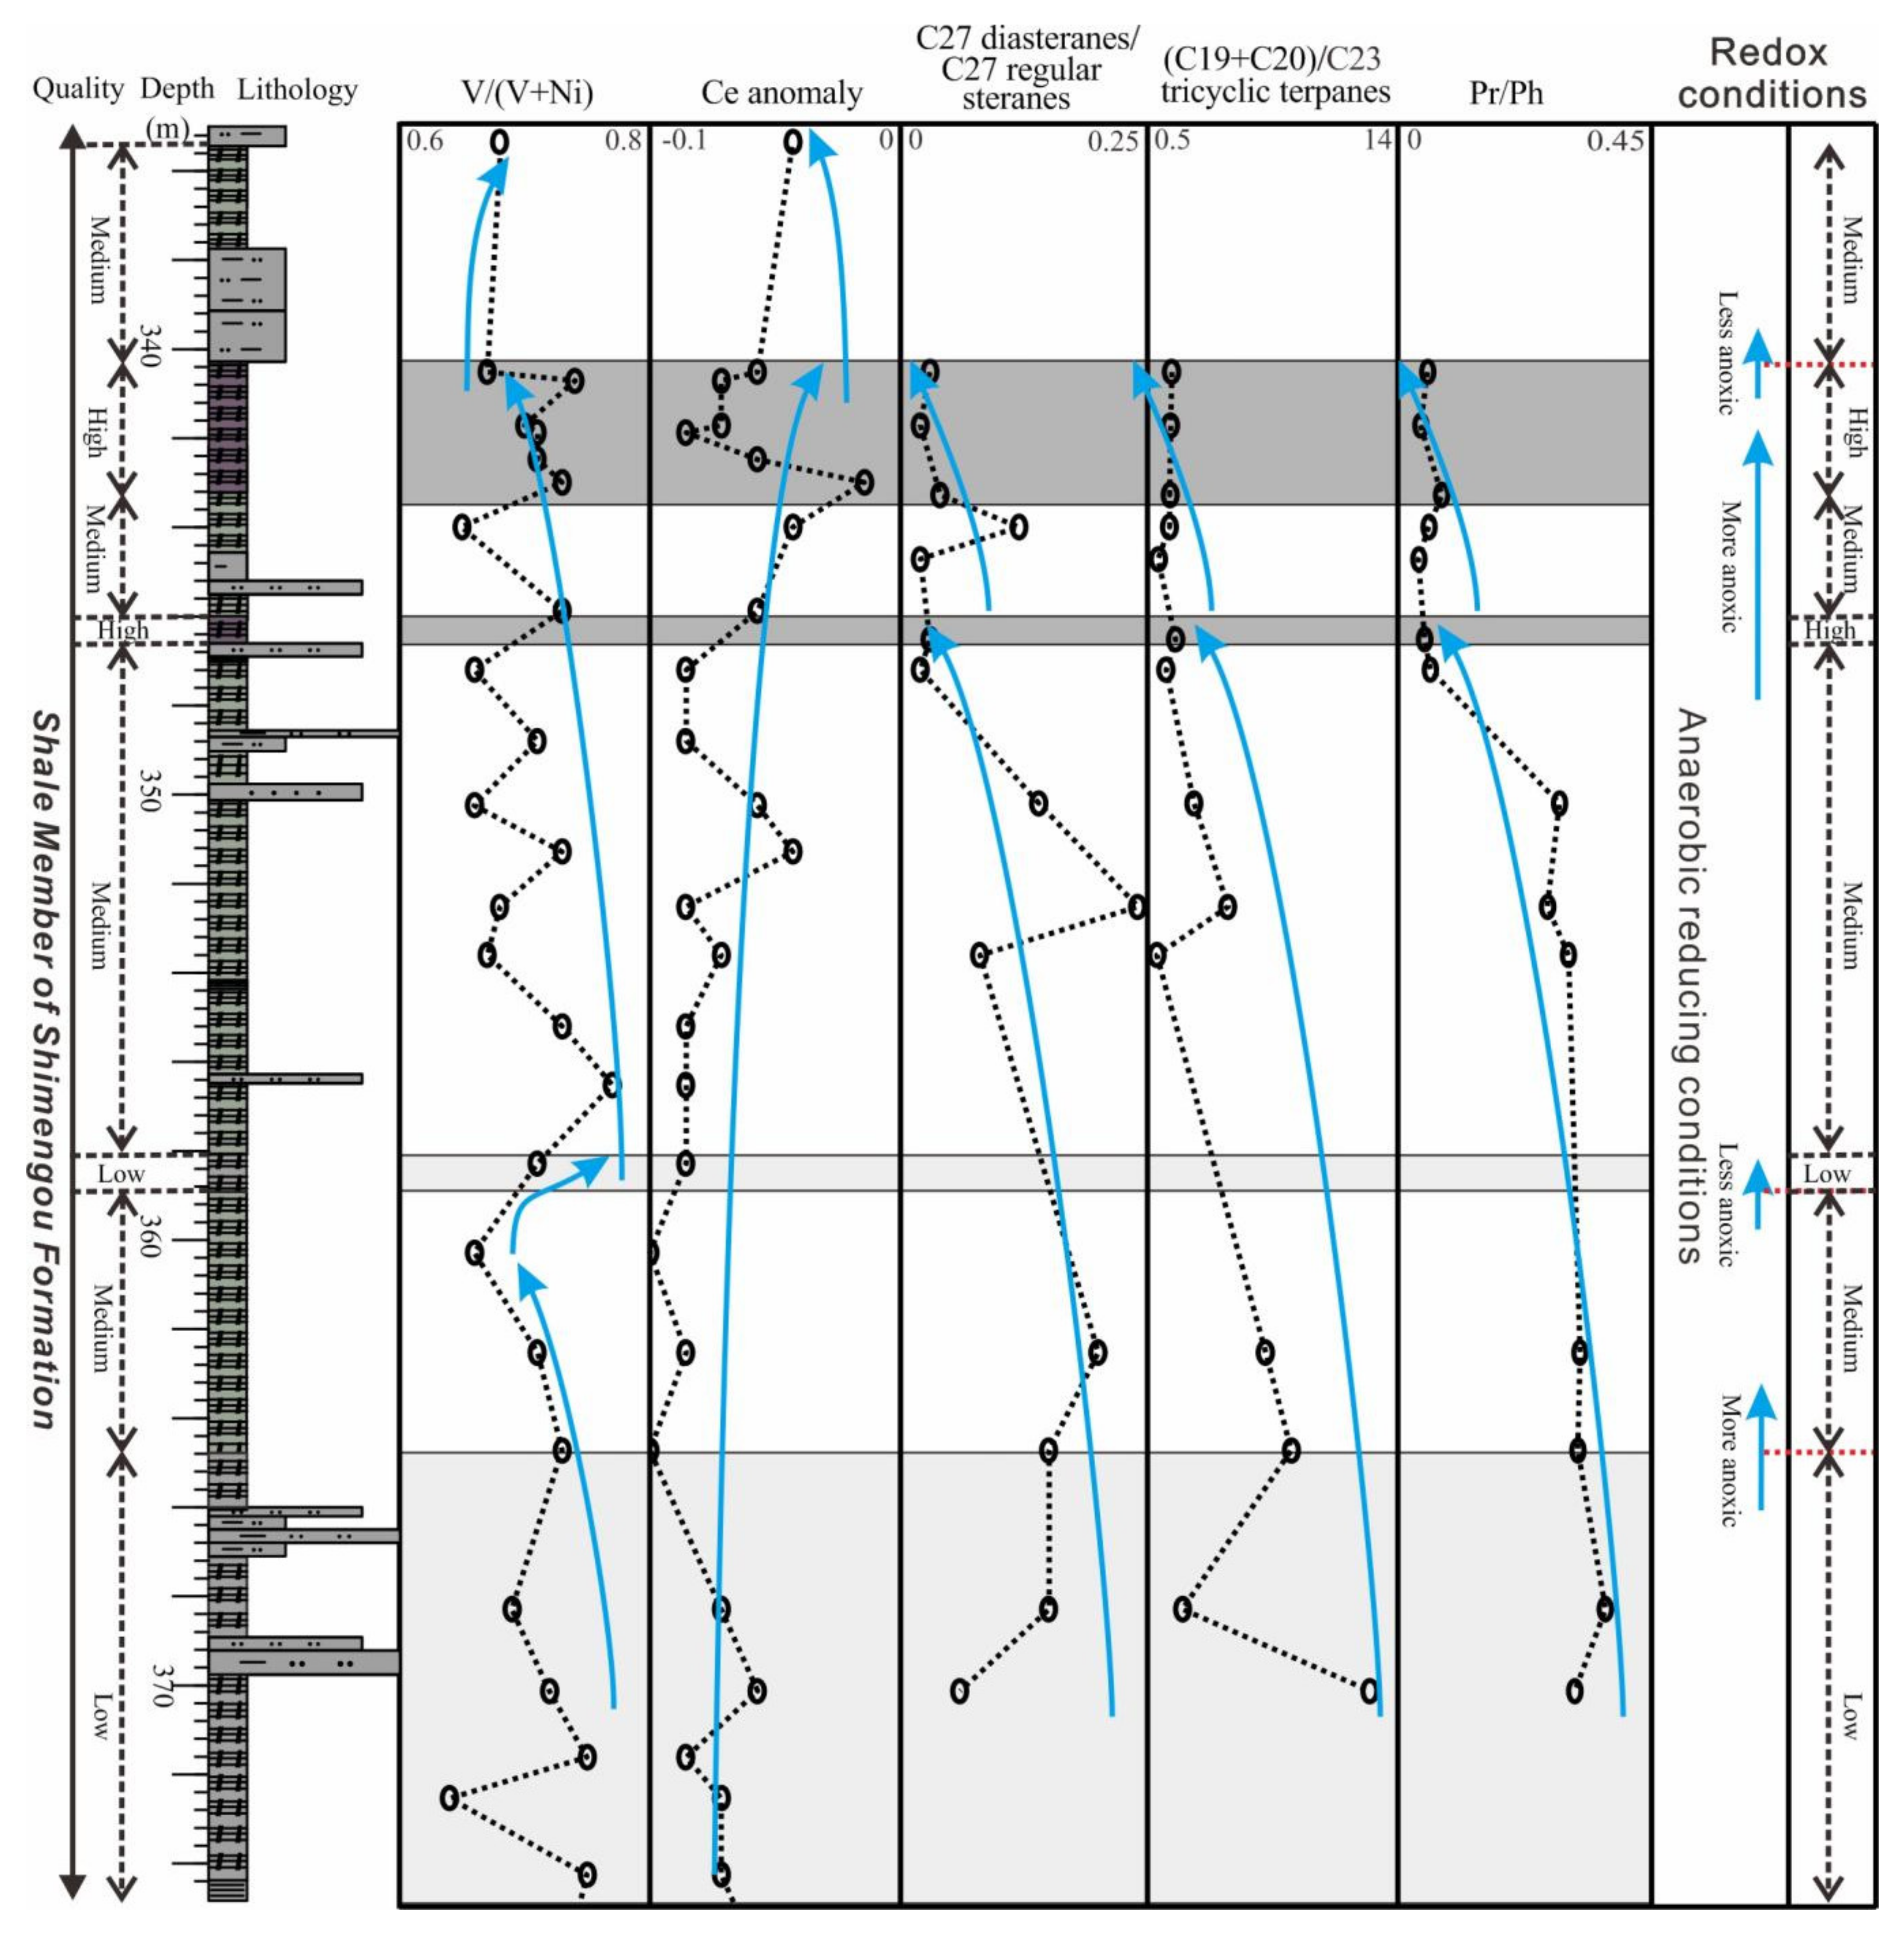
5.2.2. Redox Conditions

Despite the different oil shale qualities, the V/(V + Ni) ratios of the samples are all higher than 0.54 and the Ce anomaly ratios are all lower than −0.1 (Table 3), reflecting stable anaerobic reducing preservation conditions [33,78,79,80,81]. Biomarker ratios that are indicative of redox conditions include Pr/Ph, C27 diasteranes/C27 regular steranes, and (C19 + C20)/C23 tricyclic terpanes, although lithology can also influence the latter two [58,82,83,84]. These ratios are all lowest in the high-quality oil shales, and highest in the low-quality oil shales (Table 4). This shows that the high-quality oil shales were deposited in the most anaerobic and reducing preservation conditions (Figure 7).

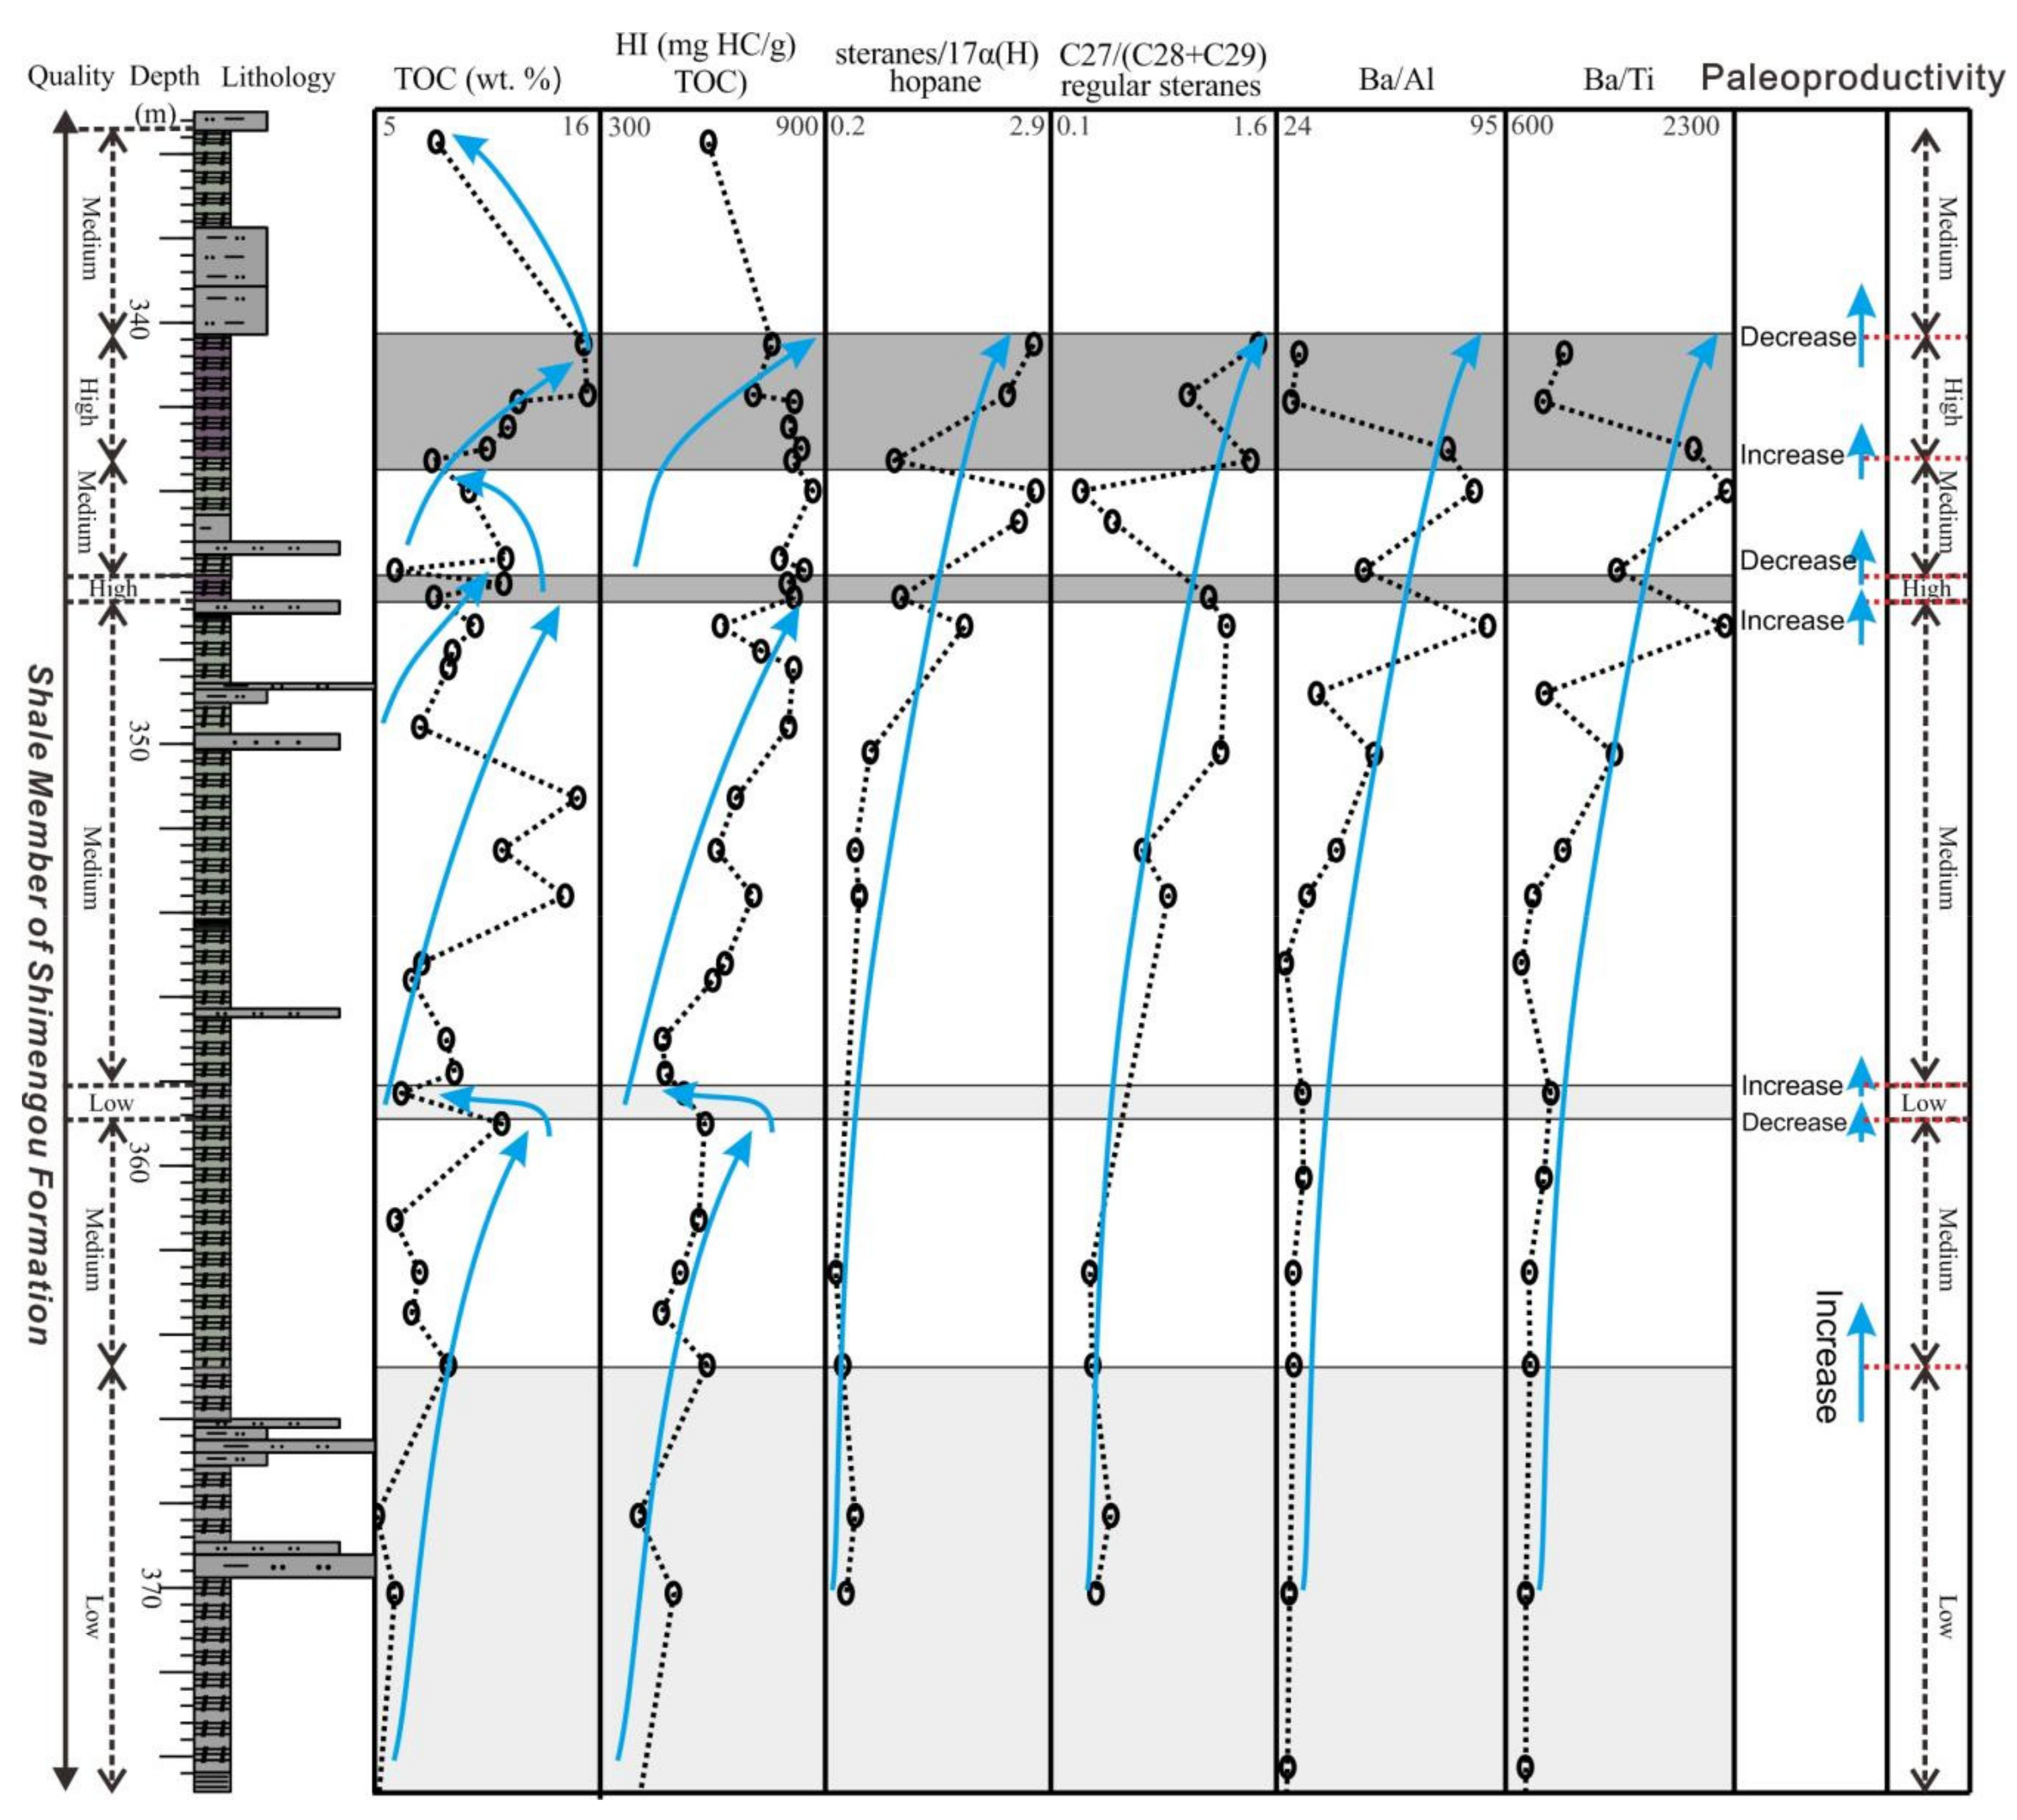
5.2.3. Paleoproductivity

The organic matter input in the study area was mainly controlled by the primary productivity of the paleo-lake, which can be evaluated by the Ba/Ti and Ba/Al element ratios [85,86,87,88] and the TOC content [89]. The results show that the high-quality oil shales had the highest paleoproductivity (Table 3; Figure 8).
Previous studies have suggested that algal blooms can be inferred from two biomarker ratios, regular steranes/C30 αβ hopane, and C27 regular steranes/(C28 + C29) regular steranes [55]. In the study area, the higher quality oil shales have higher values for both these ratios (Table 4; Figure 8). The total content of alginite is high, regardless of oil shale quality. Additionally, the alginite content of the oil shales displays a good positive correlation with the TOC content, and the correlation coefficients for the medium- and high-quality oil shales are higher than 0.9 (Figure 9). All the above support the argument that algal blooms existed during deposition of both the medium- and high-quality oil shales and were more pronounced during the latter. Usually, algae control the primary productivity of lakes [90,91], so the phenomenon of algal blooms is inferred to have caused increased productivity of the paleo-lake and therefore played an important role in the organic matter enrichment of oil shales.

5.3. Controlling Factors on Oil Shale Quality

The geochemical data demonstrate that all the oil shales have relatively low thermal maturity and similar %Ro values. Therefore, there is no obvious positive correlation between Tmax and OI values (Figure 10a). This enables the inference that Tmax is unrelated to the redox conditions but was mainly controlled by the changes in organic matter thermal maturity. The cross plot of TOC and S2 (Figure 5) shows that the organic matter content of the oil shales is mainly due to kerogen, consistent with the level of organic matter enrichment being related to its source. Thus, one conclusion that can be drawn is that organic matter source and the intensity of the algal blooms are key controlling factors on oil shale quality.
Nevertheless, the influence of minerals on organic matter enrichment should not be neglected. On the one hand, terrigenous clastic minerals can cause the degradation of organic matter [10,92,93]. On the other hand, clay minerals, in coexistence with organic matter, are the main components of oil shales, and clays are also very good adsorbers of organic matter [94,95] and have an influence on TOC content and Rock-Eval pyrolysis parameters [96,97,98,99]. Therefore, cross plots of TOC content versus terrigenous detrital minerals (Figure 11a) and clay mineral content (Figure 11b) were drawn, but no clear correlations could be identified. This means that the quality of the oil shales is neither controlled by detrital minerals nor by clay minerals. The elements Ti and Al are relatively stable during the transportation and depositional processes and can indicate the input of terrigenous detrital input [100,101,102]. The low-quality oil shales have the highest average Ti and Al amounts, while the high-quality oil shales have the lowest (Table 3; Figure 6). This indicates that the high-quality oil shales are least affected by terrigenous detrital input, and the medium-quality and low-quality oil shales are most affected.
Carbonate minerals do have an important impact on the quality of oil shales. Both medium- and high-quality oil shales contain light-colored calcareous laminae and dark-colored organic matter-rich laminae (Figure 3e,f). Carbonate sheets and stripes are developed in high-quality oil shales (Figure 3d,f). It has been argued that the presence of calcite sheets/layers may indicate algal blooms or high lake productivity, while relatively thick carbonate sheets or stripes may be caused by algal blooms or changes in water properties [103,104,105]. The analyses of biomarkers and macerals have confirmed the existence of algal blooms in medium-quality and high-quality oil shales. The algal blooms boosted the deposition of calcium carbonate and the enrichment of organic matter and ultimately led to the formation of medium-quality and high-quality oil shales.
The medium- and high-quality oil shales, especially the latter, have well-developed horizontal and rhythmic bedding (Figure 3e,f). The formation of these particular types of bedding is a sign of lack of bioturbation and bioglyphs during deposition and is related to anoxic to anaerobic preservation conditions. This environment may have been caused by high water salinity, leading to stratification of the water body [106]. When such stratification forms, the bottom of the water body is usually poorly circulated. Without disturbance caused by waves or currents, the activities of the benthos are limited. Consequently, horizontal and rhythmic bedding can be formed [107,108,109]. In addition to water salinity, HI values also reflect the redox preservation conditions. In general, high HI values represent good preservation conditions that are reducing, while low HI values represent poor preservation conditions that are oxidizing [110,111,112]. In the study area, it can be inferred that high-quality oil shales with the highest HI values (Figure 10b) were deposited under the best preservation conditions. In contrast, low-quality oil shales with the lowest HI values were formed most probably in freshwater environments where salinity stratification did not exist, and therefore they were developed in bulk with no bedded structures (Table 2; Figure 3b).

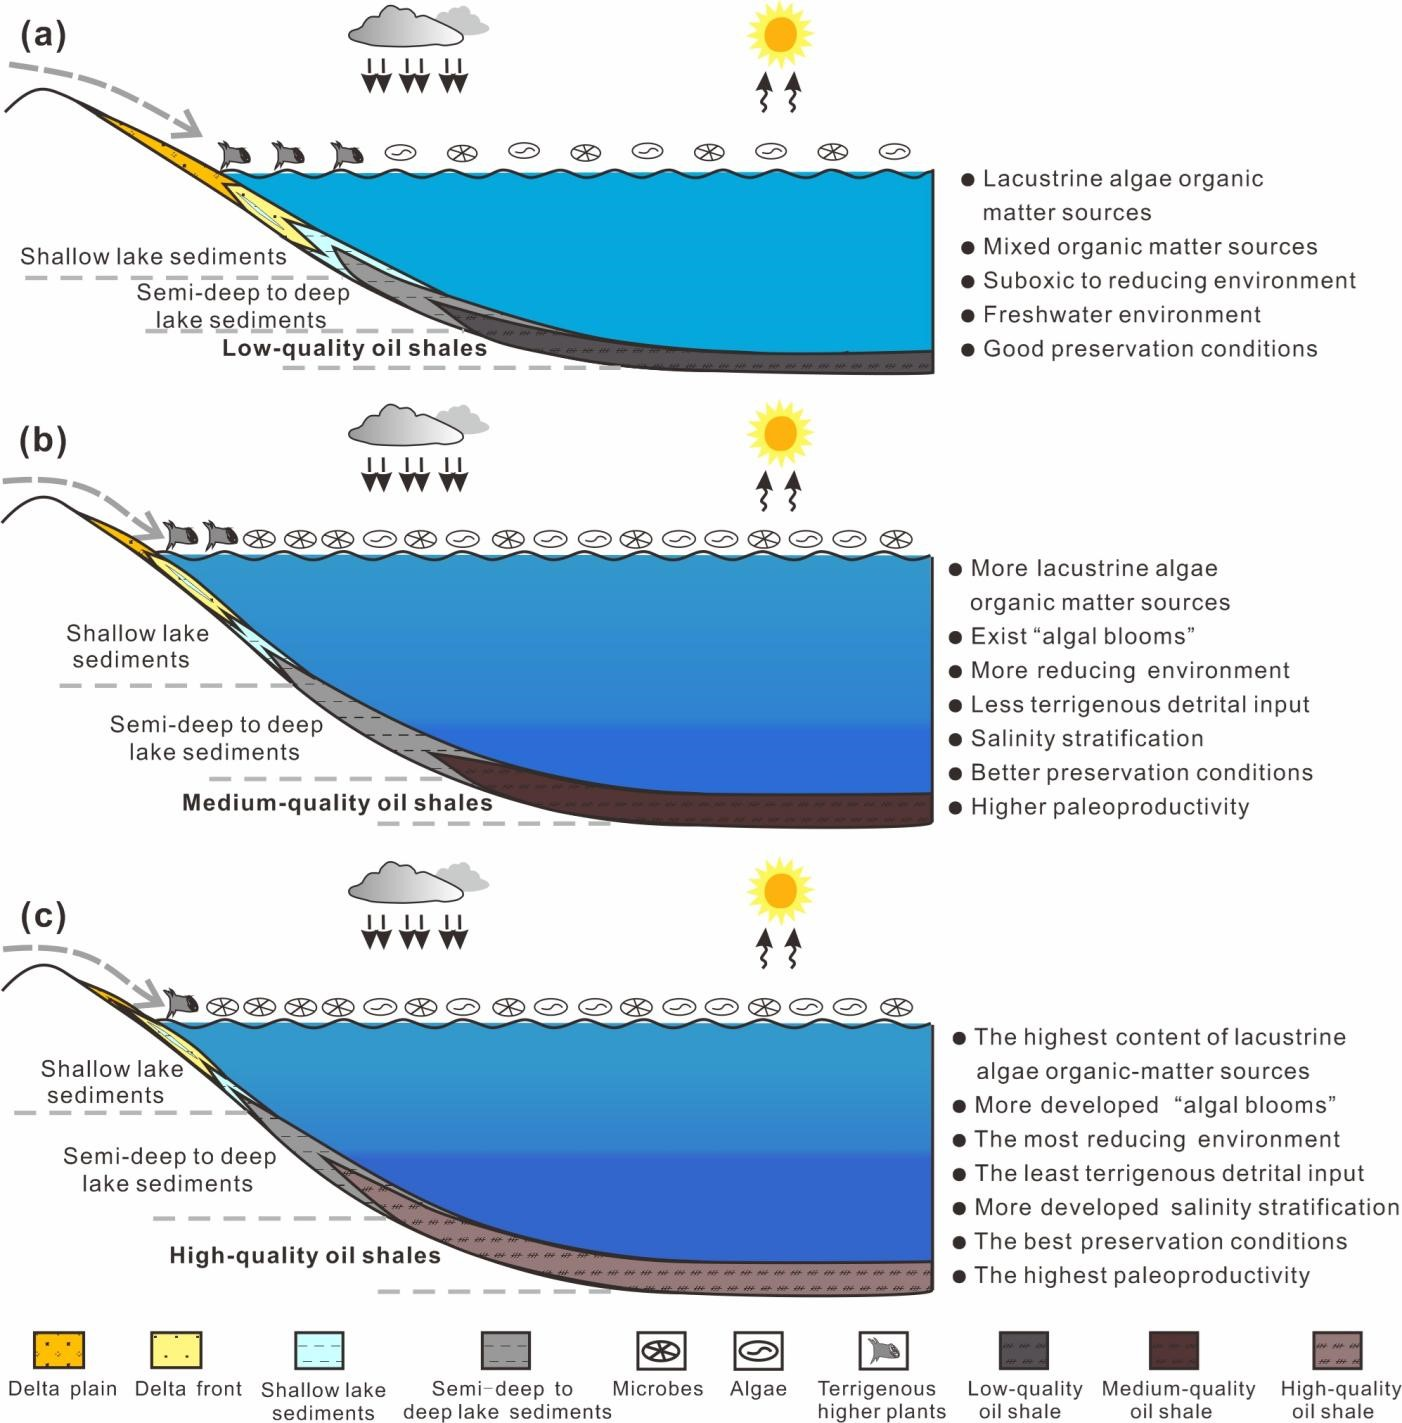
5.4. Organic Matter Enrichment Model

Although oil shales of all qualities in the Shale Member of the Shimengou Formation were formed in a semi-deep to deep lake sedimentary environment [23,24], different organic matter enrichment models apply to each quality oil shale.

5.4.1. Low-Quality Oil Shales

There are two main sources of organic matter for low-quality oil shale lacustrine algae, mixed with terrigenous higher plant inputs. These oil shales were formed in freshwater environments under suboxic to reducing preservation conditions, where rapid and continuous sedimentation occurred without seasonal suspension. Therefore, low-quality oil shales feature uniform, bulky internal structures, and homogeneous chemical properties. Due to the lack of oxygen at the sediment–water interface [113], organic matter was well-preserved, thus forming oil shales of low quality. In this model, a number of factors, including a stable and deep water column, abundant algal sources, weak dilution and degradation of terrigenous detritus, and good preservation conditions, led to organic matter enrichment and the formation of low-quality oil shales (Figure 12a).

5.4.2. Medium-Quality Oil Shales

Lacustrine algae are the main source of organic matter for medium-quality oil shales. During deposition, algal blooms and salinity stratification occurred, resulting in higher paleoproductivity, water salinity, and more reducing water column conditions than during the formation of low-quality oil shales. In this model, the lesser amounts of terrigenous detrital input, the existence of algal blooms and salinity stratification, better preservation conditions, and higher paleoproductivity contributed to the formation of medium-quality oil shales (Figure 12b).

5.4.3. High-Quality Oil Shales

Horizontal bedding and rhythmic bedding are the most developed in high-quality oil shales, indicating formation during the best preservation conditions. In this model, there was a combination of several ideal factors for oil shale formation, including the least terrigenous detrital input, the highest amount of algal content and massive algal blooms, highest water salinity with salinity stratification, the highest paleoproductivity, and the best preservation conditions with strongly reducing conditions, which together promoted the formation of high-quality oil shales (Figure 12c).
The Middle Jurassic Shimengou Formation of the Qaidam Basin hosts significant oil-shale resources. Beyond this initial study that outlines detailed comparisons between oil shales of different qualities, additional and more detailed research is needed in the future, including investigation of the geophysical properties and sporopollen analysis of the oil shales, characterization of the vertical and horizontal distributions of the oil shales, as well as assessment of the total resources of the low-, medium-, and high-quality oil shales.

6. Conclusions

Three groups of oil shales (low-, medium-, and high-quality) were identified in the Middle Jurassic Shimengou Formation of the Qaidam Basin. Oil shale quality increases with TOC content and calorific value. The low-quality oil shales contain mainly type II1 organic matter sourced from aquatic organisms and higher plants. The medium-quality oil shales contain type I-II1 organic matter from mixed or lacustrine sources. High-quality oil shales mainly contain type I organic matter dominated by lacustrine aquatic organisms. All oil shale samples are in the immature to early thermally mature stages.
The low-quality oil shales were mainly deposited in fresh-water environments. The medium-quality oil shales were deposited in freshwater to saline water environments. The high-quality oil shales were mainly formed in saline preservation conditions, with salinity stratification of the water column. Although all the groups of oil shales were deposited in anaerobic preservation conditions, algal blooms and salinity stratification did not occur in the low-quality oil shales with the lowest paleoproductivity.
Abundant algal sources and relatively good preservation conditions that promote organic matter enrichment control the uninterrupted sedimentation of low-quality oil shales. The existence of algal blooms and salinity stratification, good preservation conditions, and high paleoproductivity control the formation of medium-quality oil shales. Significant algae content, massive algal blooms, salinity stratification, very high paleoproductivity, and very good preservation conditions are key to the formation of high-quality oil shales.

Author Contributions

Conceptualization, Y.B.; methodology, Z.L. and S.C.G.; software, Y.B.; validation, Y.B., Z.L. and S.C.G.; formal analysis, J.M.; investigation, Y.B.; resources, Y.B., Z.L. and S.C.G.; data curation, S.C.G.; writing—original draft preparation, Y.B.; writing—review and editing, S.C.G. and J.M.; visualization, Y.B.; supervision, Y.B.; project administration, Z.L.; funding acquisition, Z.L. All authors have read and agreed to the published version of the manuscript.

Funding

This research was funded by the Fundamental Research Funds of Chinese Academy of Geological Sciences grant number JKY202012 and YWFBC201801 as well as the Geological Survey Project grant number DD20211341.

Institutional Review Board Statement

Not applicable.

Informed Consent Statement

Not applicable.

Data Availability Statement

Not applicable.

Conflicts of Interest

The authors declare no conflict of interest in any form.

References

  1. Amer, M.W.; Alhesan, J.S.A.; Marshall, M.; Fei, Y.; Jackson, W.R.; Chaffee, A.L. Energy efficient method of supercritical extraction of oil from oil shale. Energy Convers. Manag. 2021, 252, 115108. [Google Scholar] [CrossRef]
  2. Taheri-Shakib, J.; Kantzas, A. A comprehensive review of microwave application on the oil shale: Prospects for shale oil production. Fuel 2021, 305, 121519. [Google Scholar] [CrossRef]
  3. Qian, J.L.; Yin, L. Oil Shale–Petroleum Alternative. China Petrochem. 2010, pp. 1–15. (In Chinese with English Abstract). Available online: https://www.sciencedirect.com/science/article/abs/pii/S0016236121026491 (accessed on 20 July 2021).
  4. Saeed, S.A.; Taura, U.; Al-Wahaibi, Y.; Al-Muntaser, A.A.; Yuan, C.; Varfolomeev, M.A.; Al-Bahry, S.; Joshi, S.; Djimasbe, R.; Suwaid, M.A.; et al. Hydrothermal conversion of oil shale: Synthetic oil generation and micro-scale pore structure change. Fuel 2022, 312, 122786. [Google Scholar] [CrossRef]
  5. Altun, N.E.; Hicyilmaz, C.; Hwang, J.Y.; Suat BaǦci, A.; Kök, M.V. Oil shales in the world and Turkey; reserves, current situation and future prospects: A review. Oil Shale 2006, 23, 211–227. [Google Scholar]
  6. Alstadt, K.N.; Katti, K.S.; Katti, D.R. Nanoscale Morphology of Kerogen and In Situ Nanomechanical Properties of Green River Oil Shale. J. Nanomech. Micromech. 2016, 6, 04015003. [Google Scholar] [CrossRef]
  7. Yu, F.; Sun, P.; Zhao, K.; Ma, L.; Tian, X. Experimental constraints on the evolution of organic matter in oil shales during heating: Implications for enhanced in situ oil recovery from oil shales. Fuel 2019, 261, 116412. [Google Scholar] [CrossRef]
  8. Ofili, S.; Soesoo, A. General geology and geochemistry of the Lokpanta Formation oil shale, Nigeria. Oil Shale 2021, 38, 1–25. [Google Scholar] [CrossRef]
  9. Sun, P.; Liu, Z.; Bai, Y.; Xu, Y.; Liu, R.; Meng, Q.; Hu, F. Accumulation stages and evolution characteristics of oil shale and coal in the Dunhua-Mishan Fault Zone, northeast China. Oil Shale 2016, 33, 203–215. [Google Scholar] [CrossRef] [Green Version]
  10. Xu, S.-C.; Liu, Z.-J.; Zhang, P.; Boak, J.M.; Liu, R.; Meng, Q.-T. Characterization of depositional conditions for lacustrine oil shales in the Eocene Jijuntun Formation, Fushun Basin, NE China. Int. J. Coal Geol. 2016, 167, 10–30. [Google Scholar] [CrossRef] [Green Version]
  11. Liu, Z.; Meng, Q.; Dong, Q.; Zhu, J.; Guo, W.; Ye, S.; Liu, R.; Jia, J. Characteristics and resource potential of oil shale in China. Oil Shale 2017, 34, 15–41. [Google Scholar] [CrossRef] [Green Version]
  12. Wang, L.; Zhao, Y.; Yang, D.; Kang, Z.; Zhao, J. Effect of pyrolysis on oil shale using superheated steam: A case study on the Fushun oil shale, China. Fuel 2019, 253, 1490–1498. [Google Scholar] [CrossRef]
  13. Xu, Y.; Sun, P.; Yao, S.; Liu, Z.; Tian, X.; Li, F.; Zhang, J. Progress in exploration. development and utilization of oil shale in China. Oil Shale 2019, 36, 285–304. [Google Scholar] [CrossRef] [Green Version]
  14. He, W.; Sun, Y.; Guo, W.; Shan, X. Controlling the in-situ conversion process of oil shale via geochemical methods: A case study on the Fuyu oil shale, China. Fuel Process. Technol. 2021, 219, 106876. [Google Scholar] [CrossRef]
  15. Zhang, P.; Meng, Q.; Misch, D.; Sachsenhofer, R.F.; Liu, Z.; Hu, F.; Shen, L. Oil shale potential of the lower cretaceous Jiufotang Formation, Beipiao Basin, Northeast China. Int. J. Coal Geol. 2020, 236, 103640. [Google Scholar] [CrossRef]
  16. Elik, Y.; Karayigit, A.I.; Oskay, R.G.; Kayseri-Özer, M.S.; Christanis, K.; Hower, J.C.; Querol, X. A multidisciplinary study and palaeoenvironmental interpretation of middle Miocene Keles lignite (Harmancık Basin, NW Turkey), with emphasis on syngenetic zeolite formation. Int. J. Coal Geol. 2021, 237, 1–33. [Google Scholar]
  17. Döner, Z.; Hu, Q.; Kumral, M.; Kibria, G.; Qiao, H.; Sun, M. Petrophysical Characteristics of Silurian Mudstones from Central Taurides in Southern Turkey. J. Earth Sci. 2021, 32, 778–798. [Google Scholar] [CrossRef]
  18. Song, Y.; Zhu, K.; Xu, Y.; Meng, Q.; Liu, Z.; Sun, P.; Ye, X. Paleovegetational Reconstruction and Implications on Formation of Oil Shale and Coal in the Lower Cretaceous Laoheishan Basin (NE China): Evidence from Palynology and Terpenoid Biomarkers. Energies 2021, 14, 4704. [Google Scholar] [CrossRef]
  19. Ellis, R. Oil Shale: A Fuel Lifeline; Publisher Mining Journal Ltd.: London, UK, 2009; pp. 1–10. [Google Scholar]
  20. Knaus, E.; Killen, J.; Biglarbigi, K.; Crawford, P. An overview of oil shale resources. Oil Shale: A Solution to the Liquid Fuel Dilemma. ACS Symp. Ser. 2010, 1032, 3–20. [Google Scholar]
  21. Valgma, I.; Reinsalu, E.; Sabanov, S.; Karu, V. Quality control of oil shale production in Estonian mines. Oil Shale 2010, 27, 239–249. [Google Scholar] [CrossRef] [Green Version]
  22. Zhu, G.; Zhang, B.; Zhao, P.; Duan, C.; Zhao, Y.; Zhang, Z.; Yan, G.; Zhu, X.; Ding, W.; Rao, Z. Upgrading low-quality oil shale using high-density gas-solid fluidized bed. Fuel 2019, 252, 666–674. [Google Scholar] [CrossRef]
  23. Meng, Q.; Liu, Z.; Sun, P.; Xu, Y.; Li, F.; Bai, Y.; Xie, W.; Deng, S.; Song, S.; Wang, K.; et al. Characteristics and accumulation of Middle Jurassic oil shale in the Yuqia area, northern Qaidam Basin, northwest China. Oil Shale 2018, 35, 1–25. [Google Scholar] [CrossRef]
  24. Bai, Y.; Lv, Q.; Liu, Z.; Sun, P.; Xu, Y.; Meng, J.; Meng, Q.; Xie, W.; Wang, J.; Wang, K. Major, trace and rare earth element geochemistry of coal and oil shale in the Yuqia area, Middle Jurassic Shimengou Formation, northern Qaidam Basin. Oil Shale 2020, 37, 1–31. [Google Scholar] [CrossRef]
  25. Guo, W.; Chen, G.; Li, Y.; Li, Y.; Zhang, Y.; Zhou, J.; Han, W.; Xu, X.; Ma, Y.; Dang, H. Factors Controlling the Lower Radioactivity and Its Relation with Higher Organic Matter Content for Middle Jurassic Oil Shale in Yuqia Depression, Northern Qaidam Basin, China: Evidence from Organic and Inorganic Geochemistry. ACS Omega 2021, 6, 7360–7373. [Google Scholar] [CrossRef]
  26. Wang, Y.; Xu, S.; Hao, F.; Poulton, S.W.; Zhang, Y.; Guo, T.; Lu, Y.; Bai, N. Arid climate disturbance and the development of salinized lacustrine oil shale in the Middle Jurassic Dameigou Formation, Qaidam Basin, northwestern China. Palaeogeogr. Palaeoclim. Palaeoecol. 2021, 577, 110533. [Google Scholar] [CrossRef]
  27. Xie, W.; Tan, J.; Wang, W.; Schulz, H.-M.; Liu, Z.; Kang, X.; Wang, Y.; Shahzad, A.; Jan, I.U. Middle Jurassic lacustrine source rocks controlled by an aridification event: A case study in the northern Qaidam Basin (NW China). Int. J. Coal Geol. 2021, 242, 103779. [Google Scholar] [CrossRef]
  28. Wang, J.X.; Liu, Z.J.; Sun, P.C.; Bai, Y.Y.; Deng, S. Types and mineralizing differences for Middle Jurassic oil shale in Yuqia region of North margin in Qaidam Basin. Pet. Geol. Oilfield Dev. Daqing 2017, 4, 168–174, (In Chinese with English Abstract). [Google Scholar]
  29. Li, M.; Shao, L.; Lu, J.; Spiro, B.; Wen, H.; Li, Y. Sequence stratigraphy and paleogeography of the Middle Jurassic coal measures in the Yuqia coalfield, northern Qaidam Basin, northwestern China. AAPG Bull. 2014, 98, 2531–2550. [Google Scholar] [CrossRef]
  30. Wang, X.; Li, Y.; Zhang, Y.; Li, Z.; Guo, W.; Song, B. An analysis of reservoir-forming conditions of shale gas in Middle Jurassic strata of Yuqia area, Qaidam Basin. Geol. Bull. China 2016, 35, 231–241. [Google Scholar]
  31. Hou, H.; Shao, L.; Li, Y.; Li, Z.; Wang, S.; Zhang, W.; Wang, X. Influence of coal petrology on methane adsorption capacity of the Middle Jurassic coal in the Yuqia Coalfield, northern Qaidam Basin, China. J. Pet. Sci. Eng. 2017, 149, 218–227. [Google Scholar] [CrossRef]
  32. Hou, H.; Shao, L.; Li, Y.; Li, Z.; Zhang, W.; Wen, H. The pore structure and fractal characteristics of shales with low thermal maturity from the Yuqia Coalfield, northern Qaidam Basin, northwestern China. Front. Earth Sci. 2018, 12, 148–159. [Google Scholar] [CrossRef]
  33. GB/T 19145–2003; National Standard of the People’s Republic of China. Determination of Total Organic Carbon in Sedimentary Rock. General Administration of Quality Supervision, Inspection and Quarantine of the People’s Republic of China: Beijing, China, 2003; (In Chinese with English Abstract).
  34. Behar, F.; Beaumont, V.; Penteado, H.D.B. Rock-Eval 6 technology: Performances and developments. Oil Gas Sci. Technol. 2001, 56, 111–134. [Google Scholar] [CrossRef]
  35. LaFargue, E.; Marquis, F.; Pillot, D. Rock-Eval 6 Applications in Hydrocarbon Exploration, Production, and Soil Contamination Studies. Rev. Inst. Fr. Pétrole 1998, 53, 421–437. [Google Scholar] [CrossRef] [Green Version]
  36. SH/T 0508-92; Petrochemical Industry Standard of the People’s Republic of China. The Measuring Method of Oil Yield from Oil Shale—Low Temperature Carbonization. China Petrochemical Corporation: Beijing, China, 1992; (In Chinese with English Abstract).
  37. GB/T 213–2008; National Standard of the People’s Republic of China. Determination of Calorific Value of Coal. General Administration of Quality Supervision, Inspection and Quarantine of the People’s Republic of China: Beijing, China, 2008; (In Chinese with English Abstract).
  38. GB/T 212–2008; National Standard of the People’s Republic of China. Proximate Analysis of Coal. General Administration of Quality Supervision, Inspection and Quarantine of the People’s Republic of China: Beijing, China, 2008; (In Chinese with English Abstract).
  39. Ahmed, M.; George, S. Changes in the molecular composition of crude oils during their preparation for GC and GC–MS analyses. Org. Geochem. 2004, 35, 137–155. [Google Scholar] [CrossRef]
  40. Luo, Q.; George, S.; Xu, Y.; Zhong, N. Organic geochemical characteristics of the Mesoproterozoic Hongshuizhuang Formation from northern China: Implications for thermal maturity and biological sources. Org. Geochem. 2016, 99, 23–37. [Google Scholar] [CrossRef]
  41. SY/T 5124–2012; Petroleum and Natural Gas Industry Standard of the People’s Republic of China. Method of Determining Microscopically the Reflectance of Vitrinite in Sedimentary. National Energy Administration: Beijing, China, 2012; (In Chinese with English Abstract).
  42. Pickel, W.; Kus, J.; Flores, D.; Kalaitzidis, S.; Christanis, K.; Cardott, B.J.; Misz-Kennan, M.; Rodrigues, S.; Hentschel, A.; Hamor-Vido, M.; et al. Classification of liptinite–ICCP system 1994. Int. J. Coal Geol. 2017, 169, 40–61. [Google Scholar] [CrossRef] [Green Version]
  43. ICCP. The new vitrinite classification (ICCP system 1994). Fuel 1998, 77, 349–358. [Google Scholar] [CrossRef]
  44. ICCP. The new inertinite classification (ICCP system 1994). Fuel 2001, 80, 459–471. [Google Scholar] [CrossRef]
  45. Taylor, H.; Teichmüller, M.; Davis, A.; Diessel, C.F.K.; Littke, R.; Robert, P. Organic Petrology; Borntraeger: Stuttgart, Germany, 1998; pp. 15–169. [Google Scholar]
  46. Liu, B.; Bechtel, A.; Sachsenhofer, R.; Gross, D.; Gratzer, R.; Chen, X. Depositional environment of oil shale within the second member of Permian Lucaogou Formation in the Santanghu Basin, Northwest China. Int. J. Coal Geol. 2017, 175, 10–25. [Google Scholar] [CrossRef]
  47. SY/T 6210–2010; Petroleum and Natural Gas Industry Standard of the People’s Republic of China. Quantitative Analysis of Total Contents of Clay Minerals and Common Non-Clay Minerals in Sedimentary Rocks by X-ray Diffraction. National Energy Administration: Beijing, China, 2010; (In Chinese with English Abstract).
  48. GB/T 14506.30–2010; National Standard of the People’s Republic of China. Methods for Chemical Analysis of Silicate Rocks-Part 30: Determination of 44 Elements. General Administration of Quality Supervision, Inspection and Quarantine of the People’s Republic of China: Beijing, China, 2010; (In Chinese with English Abstract).
  49. Kimura, T. Relationships between inorganic elements and minerals in coals from the Ashibetsu district, Ishikari coal field, Japan. Fuel Process. Technol. 1998, 56, 1–19. [Google Scholar] [CrossRef]
  50. Dai, S.; Liu, J.; Ward, C.; Hower, J.C.; Xie, P.; Jiang, Y.; Hood, M.M.; O’Keefe, J.M.; Song, H. Petrological, geochemical, and mineralogical compositions of the low-Ge coals from the Shengli Coalfield, China: A comparative study with Ge-rich coals and a formation model for coal-hosted Ge ore deposit. Ore Geol. Rev. 2015, 71, 318–349. [Google Scholar] [CrossRef]
  51. Liu, Y.T.; Yang, S.Y.; Hu, K.; Cao, J.; Bian, L.Z.; Wang, L.Q.; Chan, Y. Organic geochemical features and its hydrocarbon generation potential of mudstone source rock from 7th Member of Middle Jurassic in the northern margin of Qaidam Basin. Geol. J. China Univ. 2007, 4, 703–713, (In Chinese with English Abstract). [Google Scholar]
  52. Chen, L. The Study of Sedimentary Characteristics and Accumulation of Iqe Coalfield in Qinghai Province. Master’s Thesis, Xi’an University of Science and Technology, Xi’an, China, 2013; pp. 20–80, (In Chinese with English Abstract). [Google Scholar]
  53. Ma, X.M.; Hao, H.Y.; Ma, F.; Duan, G.L.; Cheng, Y.H. Developmental value of oil shale in the 7th Member of Middle Jurassic in Yuqia Area, Qaidam Basin. J. Southwest Pet. Univ. Sci. Technol. Ed. 2013, 3, 52–58, (In Chinese with English Abstract). [Google Scholar]
  54. Boynton, W.V. Cosmochemistry of the rare earth elements. In Rare Earth Elements Geochemistry: Developments in Geochemistry; Henderson, P., Ed.; Elsevier: Amsterdam, The Netherlands, 1984; pp. 63–114. [Google Scholar]
  55. Jia, J.L. Research on the Recognition and Resource Evaluation of the Upper Cretaceous Oil Shale Based on Geochemistry-Geophysics Technique in the Songliao Basin (NE, China). Ph.D. Thesis, Jilin University, Jilin, China, 2012; pp. 53–126, (In Chinese with English Abstract). [Google Scholar]
  56. Mani, D.; Kalpana, M.S.; Patil, D.J.; Dayal, A.M. Chapter 3—Organic matter in gas shales: Origin, evolution, and characterization. Shale Gas 2017, 25–54. [Google Scholar] [CrossRef]
  57. Wilkins, R.W.; Wilmshurst, J.R.; Russell, N.J.; Hladky, G.; Ellacott, M.V.; Buckingham, C. Fluorescence alteration and the suppression of vitrinite reflectance. Org. Geochem. 1992, 18, 629–640. [Google Scholar] [CrossRef]
  58. Peters, K.E.; Walters, C.C.; Moldowan, J.M. The Biomarker Guide, Biomarkers and Isotopes in Petroleum Exploration and Earth History; Cambridge University Press: New York, NY, USA, 2005; pp. 1–256. [Google Scholar]
  59. Nazir, A.; Fazeelat, T. Geochemistry of cretaceous rocks, Pakistan: I. Biomarker approach to assess thermal maturity of OM. Pet. Sci. Technol. 2017, 35, 875–882. [Google Scholar] [CrossRef]
  60. Agrawal, V.; Sharma, S. Molecular characterization of kerogen and its implications for determining hydrocarbon potential, organic matter sources and thermal maturity in Marcellus Shale. Fuel 2018, 228, 429–437. [Google Scholar] [CrossRef]
  61. Patra, S.; Dirghangi, S.S.; Rudra, A.; Dutta, S.; Ghosh, S.; Varma, A.K.; Shome, D.; Kalpana, M. Effects of thermal maturity on biomarker distributions in Gondwana coals from the Satpura and Damodar Valley Basins, India. Int. J. Coal Geol. 2018, 196, 63–81. [Google Scholar] [CrossRef]
  62. Shalaby, M.R.; Osli, L.N.; Kalaitzidis, S.; Islam, A. Thermal maturity and depositional palaeoenvironments of the Cretaceous-Palaeocene source rock Taratu Formation, Great South Basin, New Zealand. J. Pet. Sci. Eng. 2019, 181, 106156. [Google Scholar] [CrossRef]
  63. Yi, L.; Liu, Z.; Chen, Z.; Li, M. Thermal maturity, source characteristics, and migration directions for the Ordovician oil in the Central Tabei Uplift, Tarim Basin: Insight from biomarker geochemistry. J. Pet. Sci. Eng. 2020, 189, 106975. [Google Scholar] [CrossRef]
  64. Espitalié, J.; Marquis, F.; Barsony, I. Geochemical logging. In Anal Pyrol; Voorhess, K.J., Ed.; Butterworths: Boston, MA, USA, 1984; pp. 53–79. [Google Scholar]
  65. Langford, F.F.; Blanc-Valleron, M.M. Interpreting Rock-Eval pyrolysis data using graphs of pyrolyzable hydrocarbons vs. total organic carbon. AAPG Bull. 1990, 74, 799–804. [Google Scholar]
  66. Mukhopadhyay, P.K.; Wade, J.A.; Kruge, M.A. Organic facies and maturation of Jurassic/Cretaceous rocks, and possible oil-source rock correlation based on pyrolysis of asphaltenes, Scotian Basin, Canada. Org. Geochem. 1995, 22, 85–104. [Google Scholar] [CrossRef]
  67. Tissot, B.P.; Welte, D.H. Petroleum Formation and Occurrence; Springer: New York, NY, USA, 1984. [Google Scholar]
  68. Qin, J.; Wang, S.; Sanei, H.; Jiang, C.; Chen, Z.; Ren, S.; Xu, X.; Yang, J.; Zhong, N. Revelation of organic matter sources and sedimentary environment characteristics for shale gas formation by petrographic analysis of middle Jurassic Dameigou formation, northern Qaidam Basin, China. Int. J. Coal Geol. 2018, 195, 373–385. [Google Scholar] [CrossRef]
  69. Cavelan, A.; Boussafir, M.; Le Milbeau, C.; Rozenbaum, O.; Laggoun-Défarge, F. Effect of organic matter composition on source rock porosity during confined anhydrous thermal maturation: Example of Kimmeridge-clay mudstones. Int. J. Coal Geol. 2019, 212, 103236. [Google Scholar] [CrossRef] [Green Version]
  70. Khan, I.; Zhong, N.; Luo, Q.; Ai, J.; Yao, L.; Luo, P. Maceral composition and origin of organic matter input in Neoproterozoic–Lower Cambrian organic-rich shales of Salt Range Formation, upper Indus Basin, Pakistan. Int. J. Coal Geol. 2020, 217, 103319. [Google Scholar] [CrossRef]
  71. Hu, G.; Pang, Q.; Jiao, K.; Hu, C.; Liao, Z. Development of organic pores in the Longmaxi Formation overmature shales: Combined effects of thermal maturity and organic matter composition. Mar. Pet. Geol. 2020, 116, 104314. [Google Scholar] [CrossRef]
  72. Cao, J.; Wu, M.; Chen, Y.; Hu, K.; Bian, L.; Wang, L.; Zhang, Y. Trace and rare earth element geochemistry of Jurassic mudstones in the northern Qaidam Basin, northwest China. Geochemistry 2012, 72, 245–252. [Google Scholar] [CrossRef]
  73. Jiang, K.; Lin, C.; Zhang, X.; Cai, C.; Xiao, F.; He, W.; Peng, L. Variations in abundance and distribution of methyltrimethyltridecylchromans (MTTCs) in sediments from saline lacustrine settings in Cenozoic lacustrine basins, China. Org. Geochem. 2018, 121, 58–67. [Google Scholar] [CrossRef]
  74. Martins, L.L.; Schulz, H.-M.; Ribeiro, H.J.P.S.; Nascimento, C.A.D.; de Souza, E.S.; da Cruz, G.F. Organic geochemical signals of freshwater dynamics controlling salinity stratification in organic-rich shales in the Lower Permian Irati Formation (Paraná Basin, Brazil). Org. Geochem. 2020, 140, 103958. [Google Scholar] [CrossRef]
  75. Said, I.; Merz, C.; Salman, S.A.E.-R.; Schneider, M.; Winkler, A. Identification of hydrochemical processes using multivariate statistics in a complex aquifer system of Sohag region, Egypt. Environ. Earth Sci. 2020, 79, 1–14. [Google Scholar] [CrossRef]
  76. Yin, J.; Xu, C.; Hao, F.; Wang, Q.; Miao, Q.; Wang, Z.; Zou, H. Controls on organic matter enrichment in source rocks of the Shahejie Formation in the southwestern Bozhong Sag, Bohai Bay Basin, China. Palaeogeogr. Palaeoclim. Palaeoecol. 2020, 560, 110026. [Google Scholar] [CrossRef]
  77. Argiriadis, E.; Bortolini, M.; Kehrwald, N.M.; Roman, M.; Turetta, C.; Hanif, S.; Erhenhi, E.O.; Aliaga, J.M.R.; McWethy, D.B.; Myrbo, A.E.; et al. Rapa Nui (Easter Island) Rano Raraku crater lake basin: Geochemical characterization and implications for the Ahu-Moai Period. PLoS ONE 2021, 16, e0254793. [Google Scholar] [CrossRef]
  78. Kocsis, L.; Gheerbrant, E.; Mouflih, M.; Cappetta, H.; Ulianov, A.; Chiaradia, M.; Bardet, N. Gradual changes in upwelled seawater conditions (redox, pH) from the late Cretaceous through early Paleogene at the northwest coast of Africa: Negative Ce anomaly trend recorded in fossil bio-apatite. Chem. Geol. 2016, 421, 44–54. [Google Scholar] [CrossRef]
  79. Tostevin, R.; Shields, G.A.; Tarbuck, G.M.; He, T.; Clarkson, M.; Wood, R.A. Effective use of cerium anomalies as a redox proxy in carbonate-dominated marine settings. Chem. Geol. 2016, 438, 146–162. [Google Scholar] [CrossRef] [Green Version]
  80. Chen, X.; Wei, K.; Zhang, B.M.; Li, P.; Li, H.; Liu, A.; Luo, S. Main geological factors controlling shale gas reservior in the Cambrian Shuijingtuo Formation in Yichang of Hubei Province as well as its and enrichment patterns. Geol. China 2018, 45, 207–226. [Google Scholar]
  81. Ocubalidet, S.G.; Rimmer, S.M.; Conder, J.A. Redox conditions associated with organic carbon accumulation in the Late Devonian New Albany Shale, west-central Kentucky, Illinois Basin. Int. J. Coal Geol. 2018, 190, 42–55. [Google Scholar] [CrossRef]
  82. Nguyen, K.; Love, G.D.; Zumberge, J.A.; Kelly, A.E.; Owens, J.D.; Rohrssen, M.K.; Bates, S.M.; Cai, C.; Lyons, T.W. Absence of biomarker evidence for early eukaryotic life from the Mesoproterozoic Roper Group: Searching across a marine redox gradient in mid-Proterozoic habitability. Geobiology 2019, 17, 247–260. [Google Scholar] [CrossRef]
  83. Zindorf, M.; Rush, D.; Jaeger, J.; Mix, A.; Penkrot, M.L.; Schnetger, B.; Sidgwick, F.R.; Talbot, H.M.; van der Land, C.; Wagner, T.; et al. Reconstructing oxygen deficiency in the glacial Gulf of Alaska: Combining biomarkers and trace metals as paleo-redox proxies. Chem. Geol. 2020, 558, 119864. [Google Scholar] [CrossRef]
  84. Song, Y.; Gilleaudeau, G.J.; Algeo, T.J.; Over, D.J.; Lyons, T.W.; Anbar, A.D.; Xie, S. Biomarker evidence of algal-microbial community changes linked to redox and salinity variation, Upper Devonian Chattanooga Shale (Tennessee, USA). GSA Bull. 2020, 133, 409–424. [Google Scholar] [CrossRef]
  85. Lopes, F.; Kochhann, K.G.D.; Norris, R.D.; Savian, J.F.; Fauth, G. Export Primary Productivity Changes in the Maud Rise (Weddell Sea) during the Maastrichtian. In AGU Fall Meeting Abstracts; AGU: San Francisco, CA, USA, 2019; p. PP13C-1479. [Google Scholar]
  86. Wang, Y.; Xu, S.; Hao, F.; Lu, Y.; Shu, Z.; Yan, D.; Lu, Y. Geochemical and petrographic characteristics of Wufeng-Longmaxi shales, Jiaoshiba area, southwest China: Implications for organic matter differential accumulation. Mar. Pet. Geol. 2018, 102, 138–154. [Google Scholar] [CrossRef]
  87. Zeng, S.; Wang, J.; Chen, W.; Fu, X.; Feng, X.; Song, C.; Wang, D.; Sun, W. Geochemical characteristics of Early Cretaceous marine oil shale from the Changshe Mountain area in the northern Qiangtang Basin, Tibet: Implications for palaeoweathering, provenance, tectonic setting, and organic matter accumulation. Geol. J. 2020, 55, 3229–3246. [Google Scholar] [CrossRef]
  88. Zhang, T.; Sun, S.; Li, Y.; Zong, W.; Sun, Q. Primary productivity and basin redox conditions within the Mesoproterozoic Hongshuizhuang Formation from Chaoyang area, Liaoxi sag. In IOP Conference Series: Earth and Environmental Science; IOP Publishing: Bristol, UK, 2020; Volume 600, p. 012052. [Google Scholar]
  89. Song, L.; Qiang, M.; Lang, L.; Liu, X.; Wang, Q.; Li, M. Changes in palaeoproductivity of Genggahai Lake over the past 16 ka in the Gonghe Basin, northeastern Qinghai-Tibetan Plateau. Chin. Sci. Bull. 2012, 57, 2595–2605. [Google Scholar] [CrossRef] [Green Version]
  90. Bao, Q.; Liu, Z.; Zhao, M.; Hu, Y.; Li, D.; Han, C.; Wei, Y.; Ma, S.; Zhang, Y. Primary productivity and seasonal dynamics of planktonic algae species composition in karst surface waters under different land uses. J. Hydrol. 2020, 591, 125295. [Google Scholar] [CrossRef]
  91. Guo, W.; Gong, D.; Qiao, Q. Research progress and ideas of Influence of hydrological regimes on river primary productivity of algae. In IOP Conference Series: Earth and Environmental Science; IOP Publishing: Bristol, UK, 2020; Volume 558, p. 42013. [Google Scholar]
  92. He, J.; Ding, W.; Jiang, Z.; Jiu, K.; Li, A.; Sun, Y. Mineralogical and chemical distribution of the Es3L oil shale in the Jiyang Depression, Bohai Bay Basin (E China): Implications for paleoenvironmental reconstruction and organic matter accumulation. Mar. Pet. Geol. 2017, 81, 196–219. [Google Scholar] [CrossRef]
  93. Chen, G.; Gang, W.; Liu, Y.; Wang, N.; Guo, Y.; Zhu, C.; Cao, Q. High-resolution sediment accumulation rate determined by cyclostratigraphy and its impact on the organic matter abundance of the hydrocarbon source rock in the Yanchang Formation, Ordos Basin, China. Mar. Pet. Geol. 2019, 103, 1–11. [Google Scholar] [CrossRef]
  94. Theng, B.K.G. Formation and Properties of Clay-Polymer Complexes; Elsevier: Kidlington, UK, 2012; Volume 4, pp. 1–50. [Google Scholar]
  95. Kuila, U.; McCarty, D.K.; Derkowski, A.; Fischer, T.B.; Topór, T.; Prasad, M. Nano-scale texture and porosity of organic matter and clay minerals in organic-rich mudrocks. Fuel 2014, 135, 359–373. [Google Scholar] [CrossRef] [Green Version]
  96. Katz, B.J. Limitations of ‘Rock-Eval’ pyrolysis for typing organic matter. Org. Geochem. 1983, 4, 195–199. [Google Scholar] [CrossRef]
  97. Spiro, B. Effects of minerals on Rock Eval pyrolysis of kerogen. J. Therm. Anal. 1991, 37, 1513–1522. [Google Scholar] [CrossRef]
  98. Yang, S.; Horsfield, B. Critical review of the uncertainty of Tmax in revealing the thermal maturity of organic matter in sedimentary rocks. Int. J. Coal Geol. 2020, 225, 103500. [Google Scholar] [CrossRef]
  99. Karayigit, A.I.; Oskay, R.G.; Çelik, Y. Mineralogy, petrography, and Rock-Eval pyrolysis of late Oligocene coal seams in the Malkara coal field from the Thrace Basin (NW Turkey). Int. J. Coal Geol. 2021, 244, 103814. [Google Scholar] [CrossRef]
  100. Li, W.; Lu, S.; Tan, Z.; He, T. Lacustrine Source Rock Deposition in Response to Coevolution of the Paleoenvironment and Formation Mechanism of Organic-Rich Shales in the Biyang Depression, Nanxiang Basin. Energy Fuels 2017, 31, 13519–13527. [Google Scholar] [CrossRef]
  101. Chen, Z.; Cui, J.; Ren, Z.; Jiang, S.; Liang, X.; Wang, G.; Zou, C. Geochemistry, Paleoenvironment and Mechanism of Organic-Matter Enrichment in the Lower Silurian Longmaxi Formation Shale in the Sichuan Basin, China. Acta Geol. Sin. Engl. Ed. 2019, 93, 505–519. [Google Scholar] [CrossRef]
  102. Bueno, C.; Figueira, R.C.L.; Ivanoff, M.D.; Toldo, E.E.; Ferreira, P.A.L.; Fornaro, L.; García-Rodríguez, F. Inferring centennial terrigenous input for Patos Lagoon, Brazil: The world’s largest choked coastal lagoon. J. Paleolimnol. 2021, 66, 157–169. [Google Scholar] [CrossRef]
  103. Liu, C.; Wang, P. The role of algal blooms in the formation of lacustrine petroleum source rocks-Evidence from Jiyang depression, Bohai Gulf Rift Basin, eastern China. Palaeogeogr. Palaeoclimatol. Palaeoecol. 2013, 388, 15–22. [Google Scholar] [CrossRef]
  104. Hu, Y.; Liu, C.-Y.; Yang, G.-P.; Zhang, H.-H. The response of the carbonate system to a green algal bloom during the post-bloom period in the southern Yellow Sea. Cont. Shelf Res. 2015, 94, 1–7. [Google Scholar] [CrossRef]
  105. Huh, J.-H.; Choi, Y.-H.; Lee, H.-J.; Choi, W.J.; Ramakrishna, C.; Lee, H.-W.; Lee, S.-H.; Ahn, J.-W. The Use of Oyster Shell Powders for Water Quality Improvement of Lakes by Algal Blooms Removal. J. Korean Ceram. Soc. 2016, 53, 1–6. [Google Scholar] [CrossRef] [Green Version]
  106. Bates, A.L.; Spiker, E.C.; Orem, W.H.; Burnett, W.C. Speciation and isotopic composition of sulfur in sediments from Jellyfish Lake, Palau. Chem. Geol. 1993, 106, 63–76. [Google Scholar] [CrossRef]
  107. Larsen, C.; MacDonald, G. Lake morphometry, sediment mixing and the selection of sites for fine resolution palaeoecological studies. Quat. Sci. Rev. 1993, 12, 781–792. [Google Scholar] [CrossRef]
  108. Gingras, M.K.; MacEachern, J.A.; Dashtgard, S.E. The potential of trace fossils as tidal indicators in bays and estuaries. Sediment. Geol. 2012, 279, 97–106. [Google Scholar] [CrossRef]
  109. Wang, X.; Jin, Z.; Zhao, J.; Zhu, Y.; Hu, Z.; Liu, G.; Jiang, T.; Wang, H.; Li, S.; Shi, S. Depositional environment and organic matter accumulation of Lower Jurassic nonmarine fine-grained deposits in the Yuanba Area, Sichuan Basin, SW China. Mar. Pet. Geol. 2020, 116, 104352. [Google Scholar] [CrossRef]
  110. Mort, H.P.; Adatte, T.; Föllmi, K.B.; Keller, G.; Steinmann, P.; Matera, V.; Berner, Z.A.; Stüben, D. Phosphorus and the roles of productivity and nutrient recycling during oceanic anoxic event 2. Geology 2007, 35, 483. [Google Scholar] [CrossRef]
  111. Hakimi, M.H.; Abdullah, W.H.; Alqudah, M.; Makeen, Y.M.; Mustapha, K.A. Organic geochemical and petrographic characteristics of the oil shales in the Lajjun area, Central Jordan: Origin of organic matter input and preservation conditions. Fuel 2016, 181, 34–45. [Google Scholar] [CrossRef]
  112. Torelli, M.; Battani, A.; Pillot, D.; Kohler, E.; De Azevedo, J.L.; Kowalewski, I.; Pastor, L.; Brandily, C.; Schmidt, S.; Jouet, G.; et al. Origin and preservation conditions of organic matter in the Mozambique Channel: Evidence for widespread oxidation processes in the deep-water domains. Mar. Geol. 2021, 440, 106589. [Google Scholar] [CrossRef]
  113. Maynard, J.B. Extension of Berner’s “New geochemical classification of sedimentary environments” to ancient sediments. J. Sediment. Res. 1982, 52, 1325–1331. [Google Scholar] [CrossRef]
Figure 1. Geological map of the Yuqia Area in the Qaidam Basin, China, showing the location of the YYY-1 well (modified from [24]).
Energies 15 01231 g001
Figure 2. Vertical distribution of samples from the Shale Member of the Shimengou Formation, YYY-1 well.
Energies 15 01231 g002
Figure 3. Characteristics of different-quality oil shales. (a) Oil shales in an outcrop, Yuqia area; (b) Low-quality oil shales, 358.30–358.40 m, YYY-1 well; (c) Medium-quality oil shales, 394.06–397.08 m, YYY-1 well; (d) High-quality oil shales, 342.18–343.21 m, YYY-1 well; (e) Medium-quality oil shales, rhythmic bedding, 353.56 m, YYY-1 well; (f) High-quality oil shales, horizontal bedding, 342.80 m, YYY-1 well; (g) Fish fossils in low-quality oil shales, 358.01 m, YYY-1 well; (h) Shell fossils in medium-quality oil shales, 399.67 m, YYY-1 well).
Energies 15 01231 g003
Figure 4. Characteristics of organic macerals in different quality oil shales. (a) 342.48 m, high-quality oil shale, alginites; (b) 346.20 m, high-quality oil shale, alginites, and sporinite; (c) 368.30 m, low-quality oil shale, vitrinite; (d) 348.80 m, medium-quality oil shale, resinite, incident ligh; (e) 348.80 m, medium-quality oil shale, resinite, fluorescence; (f) 370.10 m, low-quality oil shale, sporinite).
Energies 15 01231 g004
Figure 5. The organic matter type of different-quality oil shales in the Shale Member of the Shimengou Formation. Diagrams after Espitalié et al., Langford and Blanc-Valleron, and Mukhopadhyay et al. [64,65,66].
Energies 15 01231 g005
Figure 6. Vertical distribution of salinity and terrigenous detrital input in different-quality oil shales in the Shale Member of the Shimengou Formation (See Figure 2 for a legend; Gamma/C30 hopane = Gammacerane/C30 αβ hopane).
Energies 15 01231 g006
Figure 7. Vertical distribution of redox conditions and lithology in different-quality oil shales in the Shale Member of the Shimengou Formation (See Figure 2 for a legend; see Table 4 for ratio abbreviations).
Energies 15 01231 g007
Figure 8. Vertical distribution of paleoproductivity in different-quality oil shales in the Shale Member of the Shimengou Formation (See Figure 2 for a legend; see Table 4 for ratio abbreviations).
Energies 15 01231 g008
Figure 9. Correlations of total organic carbon (TOC) content and alginite content for the different quality oil shales in the Shale Member of the Shimengou Formation.
Energies 15 01231 g009
Figure 10. Relationships of (a) Tmax versus oxygen index (OI), and (b) total organic carbon (TOC) content versus hydrogen index (HI) for the different quality oil shales in the Shale Member of the Shimengou Formation.
Energies 15 01231 g010
Figure 11. Relationships between total organic carbon (TOC) content and (a) terrigenous detrital minerals, and (b) clay minerals in the different-quality oil shales in the Shale Member of the Shimengou Formation.
Energies 15 01231 g011
Figure 12. Organic matter enrichment models for the different quality oil shales in the Shale Member of Shimengou Formation. (a) organic matter enrichment model of low-quality oil shale; (b) organic matter enrichment model of medium-quality oil shale; (c) organic matter enrichment model of high-quality oil shale.
Energies 15 01231 g012
Table 1. Parameters showing the variation in different quality of oil shales from the Shale Member of the Middle Jurassic Shimengou Formation, Yuqia area, Qaidam Basin.
QualitySample No.Depth
(m)
Oil Yield
(wt.%)
Total
Organic
Carbon (TOC)
(wt.%)
Ash Yield
(wt.%)
Volatile Matter
(wt.%)
Calorific Value
(KJ/kg)
Low PZ-01367–3683.8576232917
PZ-02370–3714.26.468303654
PZ-03365–3664.27.873263663
PZ-04358–3594.46.484132392
PZ-05371–3724.78.981163560
MediumPZ-06356–3575.76.174243543
PZ-07357–3587.111.370315599
PZ-08361–3627.710.562374961
PZ-09353–354813.777216165
PZ-10345–3468.211.568295358
PZ-11360–3618.511.563395609
PZ-12343–3449.210.763354689
High PZ-13341–34210.215.571287308
PZ-14346–34711.016.874116302
PZ-15342–34310.714.672105897
Table 2. Relative content of minerals in different quality oil shales in the Shale Member of the Middle Jurassic Shimengou Formation, Yuqia area, Qaidam Basin, based on XRD analysis.
QualityDepth (m)TOC (wt.%)Relative Content of Minerals (%)
Terrigenous Detrital MineralsCarbonate MineralsCM
QtzPlTotalCalDolArgSdTotal
Low370.16.044.9 44.9 55.1
368.35.139.7 39.7 60.3
358.36.331.4 31.4 68.6
Medium364.78.627.9 27.9 72.1
362.57.241.3 41.3 58.7
360.311.338.9 38.9 3.43.457.7
355.27.338.85.644.4 55.6
353.614.343.18.551.6 48.4
352.511.245.06.351.3 48.7
350.26.631.3 31.332.8 32.835.9
348.87.841.4 41.4 58.6
335.78.016.8 16.837.5 10.848.334.9
High347.29.911.1 11.139.0 15.98.363.225.7
344.09.613.7 13.72.1 51.6 53.732.6
345.96.014.4 14.452.6 52.633.0
343.010.513.0 13.018.814.927.8 61.525.5
341.912.018.2 18.219.2 13.732.948.9
Notes: Qtz = Quartz; Pl = plagioclase; Cal = Calcite; Dol = Dolomite; Arg = Aragonite; Sd = Siderite; CM = Clay Mineral.
Table 3. Minimum, maximum, and average values of total organic carbon (TOC), Rock-Eval parameters, and element ratios of different quality oil shales in the Shale Member of the Middle Jurassic Shimengou Formation, Yuqia area, Qaidam Basin.
Oil Shale QualityLowMediumHigh
Min.–Max.AverageMin.–Max.AverageMin.–Max.Average
TOC (wt.%)5.1–11.27.16.0–14.99.06.0–15.410.8
S1 (mg HC/g rock)0.2–0.50.30.1–3.00.90.8–3.62.4
S2 (mg HC/g rock)20.2–64.936.431.5–101.255.950.3–115.185.4
S1 + S2 (mg HC/g rock)20.5–65.436.731.8–10256.851.8–118.687.8
PI0.010.010–0.040.020.01–0.040.03
Tmax (°C)431–439437426–444436427–441437
%Ro/
Tmax (°C)
0.61 ± 0.06/431 and 0.69 ± 0.07/4350.650.61 ± 0.08/432 and 0.59 ± 0.07/4260.600.69 ± 0.08/441 and 0.61 ± 0.08/4270.65
HI (mg HC/g TOC)392–584496463–815616707–866803
OI (mg HC/g TOC)3–741–2174–137
Sr/Ba0.17–0.200.180.17–0.960.340.36–1.090.71
Ca/(Ca + Fe)0.06–0.110.080.05–0.890.230.56–0.880.77
V/(V + Ni)0.64–0.750.710.66–0.770.700.65–0.740.71
Ce anomaly −0.06 to −0.04−0.05−0.07 to −0.03−0.05−0.05 to −0.01−0.04
Ba/Ti747–937805667–2230986881–22461517
Ba/Al27–322925–893828–8555
Ti (%)0.65–0.780.720.2–0.780.630.29–0.420.34
Al (%)18.89–20.8819.724.99–20.4116.407.58–12.999.83
Notes: TOC: total organic carbon; S1: the amount of thermovaporized-free hydrocarbon compounds present in the rock; S2: the amount of hydrocarbon compounds originating from kerogen cracking, an indication of residual petroleum potential of the rock; S3: the amount of CO2 generated through thermal heating as measured by Rock-Eval; PI: Production Index = S1/(S1 + S2); OI: Oxygen Index; OI = [100 × S3]/TOC; HI: Hydrogen Index; HI = [100 × S2]/TOC; Tmax: the temperature at which the maximum release of hydrocarbons from cracking of kerogen occurs during pyrolysis (top of S2 peak), and hence an indication of the stage of thermal maturation of the organic matte; Ce anomaly = lg [3CeN/(2LaN/+NdN)], CeN, LaN, and NdN represent the chondrite-normalized value [54].
Table 4. Hydrocarbon and biomarker parameters for different-quality oil shales in the Shale Member of the Middle Jurassic Shimengou Formation, Yuqia area, Qaidam Basin.
QualityDepth (m)TOC (wt.%)C15–C19
n-Alkanes (%)
C21–C25
n-Alkanes (%)
C27–C31
n-Alkanes (%)
CPIPr/PhC27 Regular Sterane /(C27 + C28 + C29) Regular Steranes (%)C28 Regular Sterane /(C27 + C28 + C29) Regular Steranes (%)C29 Regular Sterane /(C27 + C28 + C29) Regular Steranes (%)
Low364.78.60.280.490.141.772.8429.212149.79
Low368.35.10.280.50.131.833.2736.0913.5750.34
Low370.160.30.450.161.852.7931.1414.953.96
Average6.60.290.480.141.822.9732.1516.4951.36
Medium3449.60.220.620.112.010.4973.111.6415.26
Medium347.29.90.170.330.471.430.5165.1410.7524.11
Medium350.26.60.240.440.222.562.5542.5916.9140.49
Medium352.511.20.260.550.132.132.3635.7219.8444.45
Medium353.614.30.230.410.272.092.6937.8817.2344.89
Medium362.57.20.280.530.112.052.8724.6824.5750.76
Average9.80.230.480.222.051.9146.5216.8236.66
High340.515.20.270.550.131.840.4772.949.9117.15
High341.715.40.180.540.261.740.3670.4413.4416.13
High343.37.80.120.60.251.920.6950.7322.1727.1
High344.75.80.330.440.162.080.3371.5812.1716.25
High346.57.90.210.260.442.080.4252.3911.336.32
Average10.420.220.480.251.930.4563.6213.822.59
QualityDepth (m)TOC (wt.%)Ts/
(Ts + Tm)
C27 regular steranes/
(C28 + C29) regular steranes
C29 αββ 20S/(20S + 20R) steranesC27 diasteranes/C27 steranesRegular steranes/C30 αβ hopaneGammacerane/C30 αβ hopaneC19 + C20 tricyclic terpanes/C23 tricyclic terpane
Low364.78.60.060.410.160.150.380.038.27
Low368.35.10.050.560.180.150.50.032.4
Low370.160.050.450.180.060.40.0212.49
Average6.60.050.470.170.120.430.037.72
Medium3449.60.092.720.140.120.30.191.69
Medium347.29.90.061.870.40.021.270.331.5
Medium350.26.60.210.740.130.141.230.233.01
Medium352.511.20.10.560.170.240.710.14.83
Medium353.614.30.210.610.10.080.880.091.01
Medium362.57.20.060.330.160.20.360.046.86
Average9.80.121.140.180.130.790.163.15
High340.515.20.072.70.10.031.480.051.8
High341.715.40.12.380.030.021.010.181.74
High343.37.80.091.030.070.041.430.291.73
High344.75.80.082.520.040.020.510.141.09
High346.57.90.061.10.050.031.150.432.02
Average10.420.081.950.060.031.120.221.68
Table 5. Organic maceral composition of different-quality oil shales in the Shale Member of the Middle Jurassic Shimengou Formation, Yuqia area, Qaidam Basin.
QualityDepth
(m)
TOC
(wt.%)
Lacustrine Aquatic Organism Sources Terrigenous Higher Plants
AlginiteLiptiniteVitriniteChlorophyllinite Total
SporiniteResiniteFluoriniteTotal
Low370.15.960.580.190.040.030.260.08 0.34
368.35.130.550.29 0.020.310.090.010.41
370.2314.920.620.18 0.030.210.12 0.33
Average0.580.220.040.030.260.10.010.36
Medium362.57.230.590.26 0.030.290.1 0.39
361.35.970.570.26 0.090.350.050.010.41
359.87.640.60.29 0.020.310.050.010.37
356.5-0.570.34 0.020.360.06 0.42
353.614.30.680.180.050.030.260.03 0.29
348.87.840.590.10.130.020.250.11 0.36
347.29.940.650.23 0.230.1 0.33
346.611.340.670.28 0.280.02 0.3
Average0.620.240.090.040.290.070.010.36
High346.211.30.660.24 0.030.270.03 0.3
342.4811.450.680.250.03 0.280.020.010.31
341.515.20.720.19 0.030.220.03 0.25
Average0.690.230.030.030.260.030.010.29
Publisher’s Note: MDPI stays neutral with regard to jurisdictional claims in published maps and institutional affiliations.

