Abstract
Casing deformation is a common but serious problem experienced during hydraulic fracturing operations in shale reservoirs. The Multi-Finger Imaging Tool is used to measure the casing deformation where the casing inner diameter is the only parameter used to characterize the deformation. Many deformed casing geometric details are often ignored, and these geometric characteristics are helpful for revealing the casing deformation mechanism. In this study, we established a quantitative method to describe the casing deformation using methods of judging the similarity of curves. By comparing the field casing deformation sections and the initial casing section, we categorized the casing deformation sections into concave and elliptical types. Furthermore, using the centroid calculation, elliptical type was sub-divided into symmetric ellipse type and eccentric ellipse type. On the basis of the Weiyuan and Guandong oil field’s fault distribution maps, we demonstrated that the fault slip could be the main cause of concave type and eccentric ellipse type. A numerical study was then carried out to ascertain whether fault slip can cause concave type and eccentric ellipse type casing deformations and to establish the relationship between fault slip magnitude and casing deformation. The results support the idea that concave type and eccentric ellipse type casing deformation are caused by the fault slip. Sensitivity analysis showed that the shape of the casing section was largely influenced by the dip angle, while the change of the casing inner diameter was largely influenced by the strike angle. The method proposed herein presents a useful step towards the prediction of the causes of casing deformation and provides a relationship between casing inner diameter change and fault slip.
1. Introduction
During oil and gas development stages, the casing is subjected to extremely harsh environmental conditions for a long time, which could lead to deformation. It has previously been observed that casing deformation falls into four categories, namely, buckling, shear, extrusion, and pitting [1,2]. Typically, in most oil and gas formations, there is a presence of corrosive gas, and thus due to pitting corrosion and hydrogen embrittlement, the casing is likely to experience tensile and perforation damage [3,4,5]. Moreover, during the production process, the casing is subjected to complex loading due to temperature changes, creep of salt gypsum rock, or mudstone hydration, which causes buckling and extrusion [6,7,8]. Unconventional oil and gas resources are characterized by extremely low permeability and thus require hydraulic fracturing stimulation. Casing deformation, and in particular shear deformation [9,10], is one of the main problems experienced during the hydraulic fracture process [11].
A considerable amount of literature has been published on casing deformation during hydraulic fracturing. These studies indicate that the potential causes of casing damage are asymmetry of fracture propagation, stress concentration, temperature changes, and poor cementing quality [12,13,14,15]. In Weiyuan and Guandong blocks, out of 133 casing shear deformation cases 61 casing deformations had occurred near the fault plane. This implies that the fault slip is the main cause of shear deformation [16]. In addition, studies have explored the relationships between large-scale fluid injection and the seismic activity near the faults [17,18]. The fault slip can be estimated by using the fault geological parameters and seismic data [19,20]. However, the relationship between the fault slip and the casing inner diameter change is not clear. Finite element modeling studies show that fault slips induce shear deformation on casing [21]. Nevertheless, due to numerical convergence problems, the casing is modeled as an elastic material, and also the effects of both fault strike and dip angle are rarely considered. Modeling the casing based on plastic parameters and considering both strike and dip angles can improve the accuracy of the simulation results.
In this paper, we establish a quantitative method to describe the casing deformation using methods of judging the similarity of curves. Using the Multi-Finger Imaging Tool data from Weiyuang and Guandong blocks, the characteristics of the initial casing section were compared with the casing deformation section observed during hydraulic fracturing and classified. A numerical study was carried out to ascertain whether fault slip can cause observed casing deformations and to investigate the impact of strike and dip angles. Finally, the relationship between fault slip and casing inner diameter change was established.
2. Quantitative Analysis of Casing Deformation
2.1. Geological Characteristics of the Formation
The average Young’s modulus of Weiyuan block formation is 22.5 GPa, Poisson’s ratio is in the range of 0.115–0.258, the average pore size of the reservoir is 200 nm, the porosity is about 3%, and the permeability is 2.4 × 10⁻⁴ md. The faults are sporadically distributed and are less than 1 km in length with varying fault strikes. At about 3600 m, the max and min horizontal geo-stress gradients are 0.0243 MPa/m and 0.0201 MPa/m.
2.2. Methods of Describing Casing Deformation Sections
In the field report, the casing deformation is described by the length of the casing deformation section, the well depth at the max deformation position, and the max and min inner diameter of the casing. The multi-finger imaging tool is used to measure the inner diameter of the casing with a precision of ±0.5 mm. Generally, small casing deformations are usually described by ovality, as shown in Equation (1), which is defined as the difference between the maximum inner diameter and the minimum inner diameter of the casing. Definition of casing deformation sections by using Equation (1) does not describe the local deformation characteristics. For instance, it would be difficult to distinguish between an elliptical casing section (max and min inner diameter 124.3 mm and 104.3 mm) and a concave casing section (max and min inner diameter 114.3 mm and 94.3 mm) by using ovality Equation (1).
where φ is ovality; D is the diameter of the initial casing, mm; Dmax is the maximum diameter of casing section after deformation, mm; and Dmin is the minimum diameter of casing section after deformation, mm.
Most of the casings in Weiyuan oil field are made of P125 steel with an outer diameter of 139.7 mm and thickness of 12.7 mm. More than 80% of the 144 casing deformation sections examined from Weiyuan block show that the casing inner diameter change is within the range of 8–30 mm, that is, the ovality range is 7–26% (Figure 1). A total of 107 cases of casing deformation from Weiyuan and Guandong blocks are mainly located within 0–1000 m from the landing point, and 61 casing deformations are related to faults.
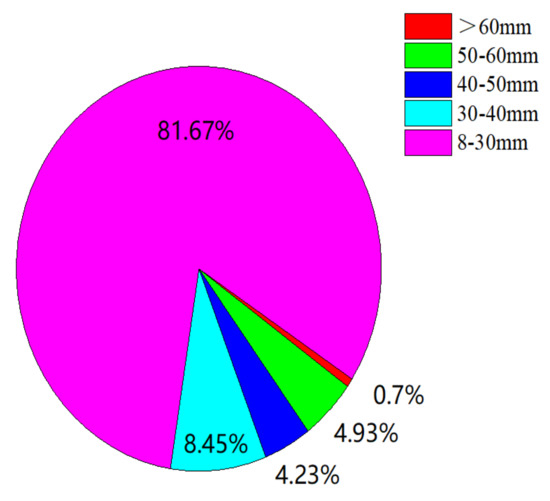
Figure 1.
Casing inner diameter change of 144 casing deformations at Weiyuan block.
Casing deformation during hydraulic fracturing can be quite large and irregular. Thus, Equation (1) is not suitable for describing such deformations. A new method needs to be established for characterizing these large and irregular deformation types and quantifying the influence of the overall size change and local deformation. In the oil field, the Multi-Finger Imaging Tool is used to measure and record the casing deformation by finger length (Figure 2).
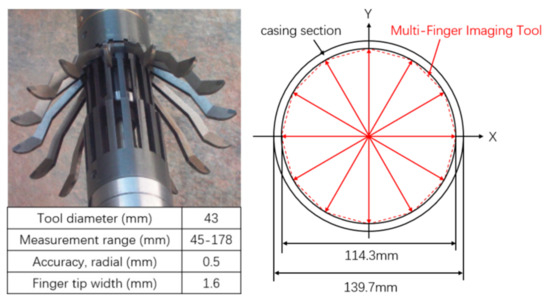
Figure 2.
The Multi-Finger Imaging Tool (left), and schematic diagram of typical results (right).
Usually, the minimum inner diameter is used to quantify the magnitude of casing deformation. However, some casing sections have the same magnitude, but their profiles are quite different. The deformation sections as shown in Figure 3 have the same magnitude of deformation (18 mm), but their profiles have different characteristics. Essentially, the causes of these two types of deformation may be different. Therefore, it is important to have a method that can accurately characterize the casing deformation profile to help predict the possible causes of deformation.
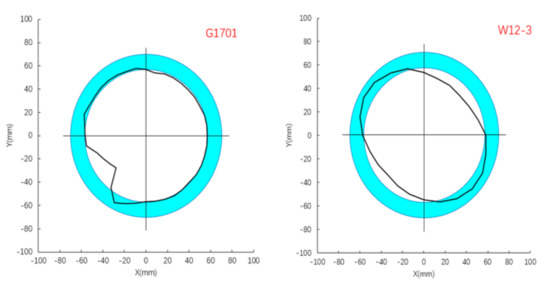
Figure 3.
Casing deformation section G1701 (left) from Guandong Block and W12-3 (right) from Weiyuan block with the same minimum inner diameter but the different profiles.
Several methods currently exist for describing the similarity of curves, such as Euclidean distance similarity and Fréchet distance [22,23]. In this study, we used these methods to describe the casing deformation profile by comparing the initial casing section and deformed casing sections. We used the Euclidean distance similarity (ES) method to judge the overall size difference and the Fréchet distance (FD) to define the change in local deformation.
On the basis of casing deformation data obtained by Multi-Finger Imaging Tool, we can calculate the xn and yn coordinate for each finger. Similarly, we can calculate the Xn and Yn coordinate of the initial casing section along the same radius. The Euclidean distance between these two profiles (Figure 4) is then estimated, as shown in Equations (2) and (3):
where dn is the Euclidean distance, mm; xn, yn are the coordinates for each finger; Xn, Yn are the coordinates of the initial casing section along the same radius; rs is the initial casing section radius, mm; and is the average Euclidean distance of all the fingers, mm.
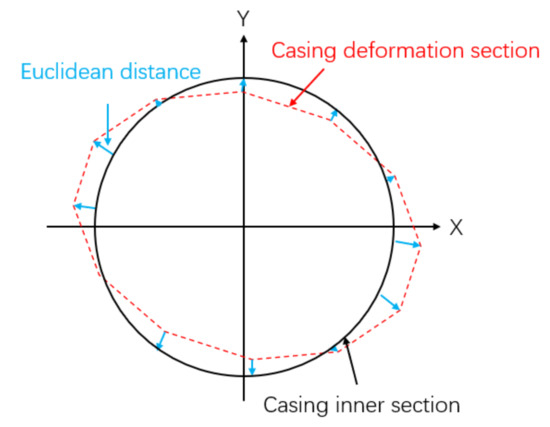
Figure 4.
A schematic of the Euclidean distance between the initial casing section and the elliptical casing section.
After obtaining the profile of the deformed section, Fréchet distance (FD) is used to define the change in local deformation, as shown in Figure 5. Let M and N be the deformed and initial (undeformed) casing sections. If set (a) contain points in M: a→M and set (b) contains points in N:b→N, then the Euclidean distance between points a and b in the same plane is d(a,b). If we let every point a(t) and b(t), 0 ≤ t ≤ 1. The minimum distance between M and N is shown in Equation (4) and is the Fréchet distance [24].
where a(t) is a set of points on the deformed casing section M, and b(t) is a set of points on the initial casing section N; d(a,b) is the Euclidean distance between M and N.
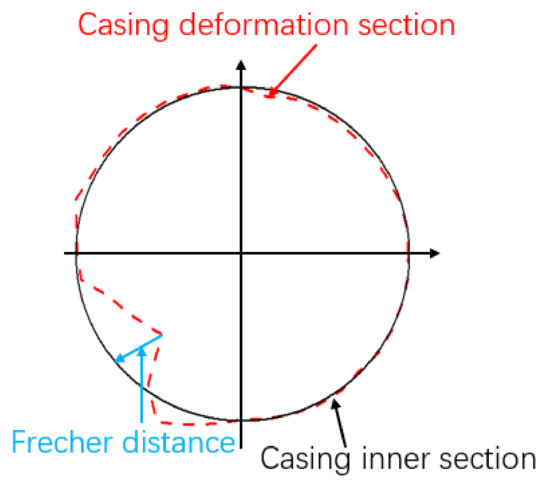
Figure 5.
A schematic of the Fréchet distance between the initial casing section and concave casing section.
2.3. Application of ES and FD in Casing Deformation
Using the data from Weiyuan and Guandong, oil field ES is calculated to judge the overall size difference and the FD is calculated to define the change in local deformation. After obtaining these two parameters, we take the ratio of FD and 1-ES to categorize the casing deformation, as shown in Table 1. Similarly, the ovality of these casing sections is calculated. However, by using ovality, it is difficult to describe the casing deformation characteristics. The precision in calculating both ES and FD depends on the precision accuracy of the Multi-Finger Imaging Tool (±0.5 mm).

Table 1.
Geometric characterization of casing deformation in Weiyuan and Guandong oil fields.
The type 1 deformation has a concave section and type 2 deformation has an elliptical section. As shown in Figure 3, the FD/(1-ES) ratio of well g1701 is 430.5, while that of well w12-3 is 109.8, and the magnitude of inner diameter changes of the two wells is 18 mm. For the same casing inner diameter change, the larger the magnitude of FD/(1-ES), the more severe the local casing deformation.
Using the centroid calculation Equations (5)–(7) [25], type 2 can be subdivided into two types, where type 2-1 (w1705) has a symmetric ellipse section, and type 2-2 (w1706 (2)) has an eccentric ellipse section, as shown in Figure 6.
where A is the area of casing section (polygon), mm2; Cx is X coordinate of the center point, mm; Cy is Y coordinate of the center point, mm; and xi, yi is coordinates of each vertex of the polygon, x1 = xn+1, and y1 = yn+1.
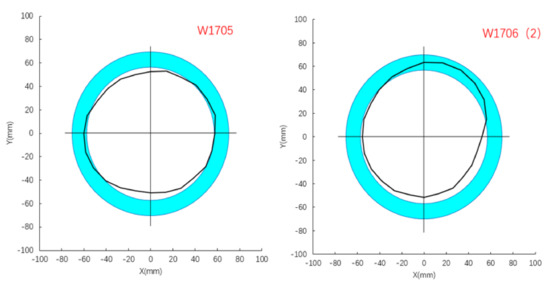
Figure 6.
Sub-divisions of type 2 (ellipse casing deformation) sections from Weiyuan oil field: W1705 symmetric ellipse section (left) and W1706(2) eccentric ellipse section (right).
From the fault distribution map (Figure 7), it can be seen that well W1706(2) and well W18-1 lie within the vicinity of the fault. The casing deformation position of these two wells is precisely at the points where the fault crosses the well trajectory, which indicates that the fault slip may be the main cause of type 1 and type 2-2 deformations.
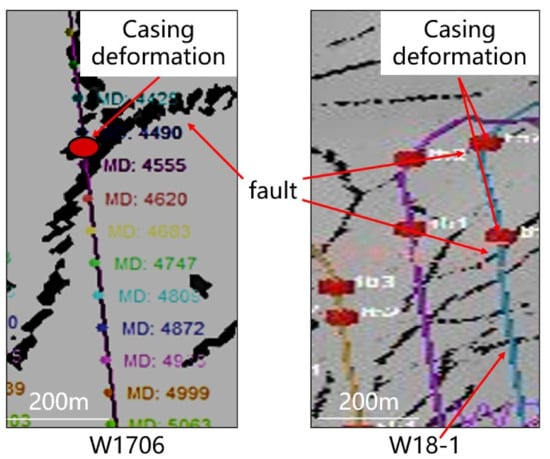
Figure 7.
Fault distribution map and trajectories of w1706 and w18-1.
3. Numerical Model Formulation and Implementation
The goal of the numerical model is to ascertain whether the fault slip can cause type 1 and type 2-2 casing deformations and establish the relationship between the fault slip and casing deformation. A horizontal well was modeled with its axial direction coinciding with the X-axis. The wellbore system included a casing, cement, and formation (Figure 8). The outer diameters of the cement sheath and casing were 215.9 and 139.7 mm, respectively, and the casing thickness was 12.7 mm. The total size of the model was 10 × 1 × 1 m (XYZ) and represented the formation, cement sheath, and casing system.
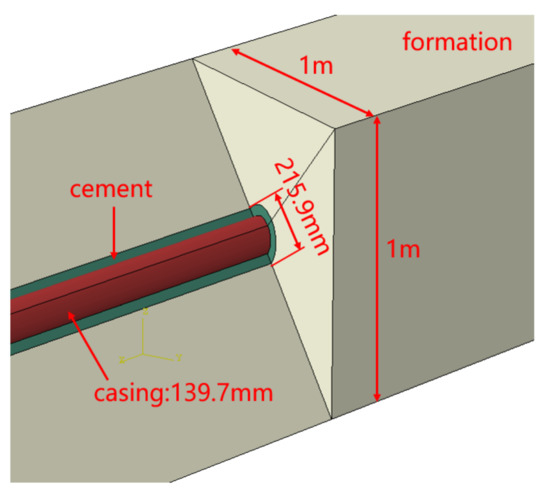
Figure 8.
Schematic diagram of finite element model (formation–cement–casing).
3.1. Material Models and Material Properties
Under confining pressure, cement exhibits nonlinear behavior [26]; however, there was little difference in the casing inner diameter change regardless of whether we modelled cement as either plastic or elastic material. Therefore, to reduce the computational burden, the formation and cement sheath were assumed to be linearly elastic. The casing was considered as an elastoplastic material, and all the elastic material properties are as shown in Table 2.
Table 2.
Material elastic properties.
Abaqus provides an isotropic elastoplastic hardening model useful for steel analysis involving gross plastic strain. The total strain is the sum of plastic strain and elastic strain, which is the ratio of the real stress to the elastic modulus. Therefore, to obtain the plastic strain, we only need to subtract the elastic strain from the total strain, as shown in Equation (8).
where εpl is the true plastic strain; εt is the total plastic strain; εel is the true elastic strain; σ is the true stress, MPa; and E is the modulus of elasticity, MPa.
To approximate the smooth stress–strain curve of the steel, Abaqus requires the tensile test data. Several test samples were obtained from the P125 casing and tested according to the testing standard (GB/T 228.1-2010), as demonstrated in Figure 9.
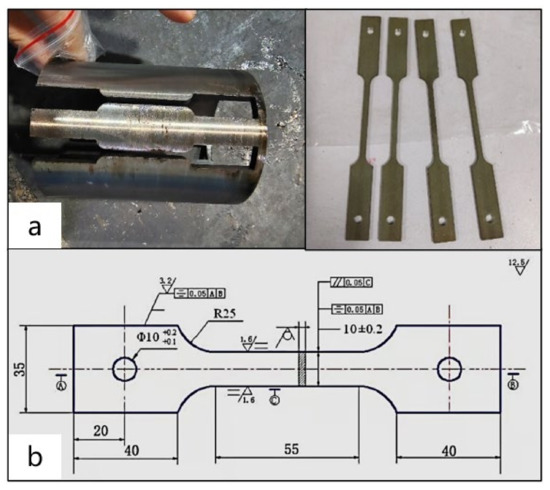
Figure 9.
Tensile test sample obtained from P125 casing (a) and sample dimension (b).
Figure 10 shows the true stress–strain curve from the test, and the casing plastic parameters used in this study are shown in Table 3.
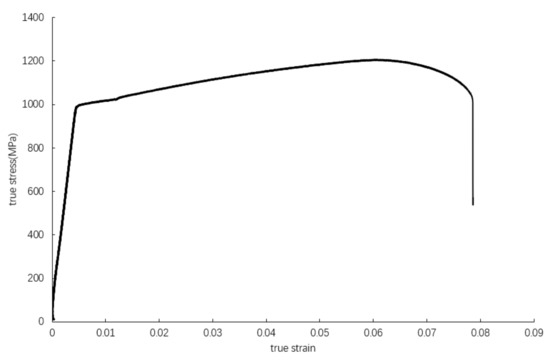
Figure 10.
The stress and strain test results of the P125 casing.
Table 3.
The plastic parameters of P125 casing steel.
A fault plane was established across the system at strike and dip angles α and β, respectively (Figure 11). For the first model, the initial strike and dip angles were 90°/30°. In an attempt to investigate the influence of strike and dip angles on casing deformation, 25 simulation models were run by changing the strike and dip angles in steps of 15°. The displacement of the fault was limited in the horizontal plane, and the direction of the fault slip was set along the fault strike, as shown in Figure 12. To compare the results in the same stress conditions and reduce the computation burden of the 3D model, the simulations were stopped when the casing reached its ultimate strength.
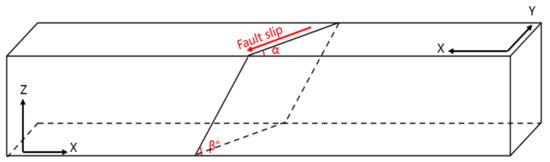
Figure 11.
Schematic diagram of fault slip.
3.2. Modeling Stages and Boundary Conditions
In this study, two analyses steps were run. In step 1, according to the geostress in the Weiyaun field, the max horizontal stress applied in the Y direction was 91.5 MPa, the min horizontal stress applied in the X direction was 68.4 MPa, and the vertical stress applied in the Z direction was 78 MPa. The pressure at the casing inner surface was evenly set at 90 MPa, and then the model was run to equilibrium. In step 2, 40 mm displacement was applied to the model to simulate the fault slip. Finally, the casing stress and displacement output fields recorded were then analyzed to establish the relationship between fault slip and casing deformation.
4. Results and Discussion
Using the finite-element model described above, the impact of fault slip on casing deformation was investigated for various combinations of strike and dip angles. The simulated casing section was discretized, and the Euclidean distance, Fréchet distance, and FD/(1-ES) ratios were calculated. The following subsections summarize the simulation results.
4.1. Calculation of ES and FD from Models Results
Our models are defined by the fault’s strike and dip angles, as shown in the first column of Table 4. The Euclidean distance similarity, Fréchet distance, and the ratio FD/(1-ES) for all the models’ deformation sections were calculated, and the results are shown in Table 4. From these results, we can see that under the same strike angle condition, increasing the dip angle in steps of 15°, the changes of Euclidean distance similarity and Fréchet distance were irregular, but the ratio of FD/(1-ES) was always decreasing. This indicates that the larger the dip angle, the smaller the local deformation of the casing section. When the casing reached the ultimate strength, the influence of fault slip on the deformation characteristics of the casing gradually changed from local deformation to overall deformation (from type 1 to type 2-2).
Table 4.
Analyses of geometric characteristics of deformed casing sections from the models.
4.2. Comparison between Simulation and Oil Field Casing Deformation Sections
From the previous geometric characterization of casing deformation in the Weiyuan and Guandong oil fields, the concave casing deformation (type 1) had the most serious local deformation (large value of FD/(1-ES)). From the analyses of deformed casing sections from the models (Table 4), we can see that the concave casing deformation was most likely to occur when the fault dip angle was 30°. Figure 12 shows the comparison of oil field casing sections and the simulation section. G1701 obtained from the oil field (left black curve) had a large inward bend that made the section appear concave; furthermore, it had a protruding part that overlapped the initial section (blue circle). This profile was similar to that of model 9090 (right colored circle) when the fault slip was about 27.5 mm.
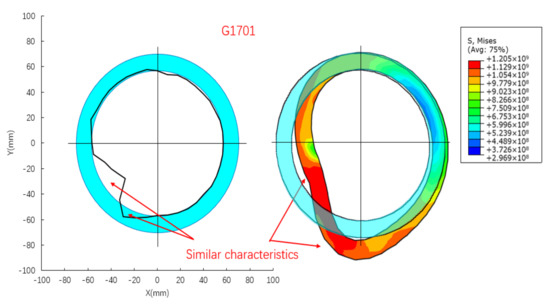
Figure 12.
Concave deformation section of G1701 (black curve) and model 9030 (colored circle) against the initial casing section (blue circles).
In Figure 13, we can see that the deformation sections (left black curve and right colored circle) had the same inward bend as casing sections in Figure 12 when the fault slip was about 35.6 mm. However, these sections did not have protruding parts overlapping the initial section (blue circles). The casing inner diameter change of model 9030 and model 3030 sections were 18.8 and 14.8 mm, respectively. Even though model 9030 had a smaller fault slip, its inner casing diameter change was larger; this was because of the difference in their t strike angles.
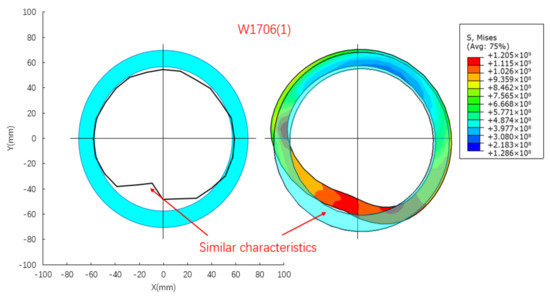
Figure 13.
Concave deformation section of W1706(1) (black curve) and model 3030 (colored circle) against the initial casing section (blue circles).
Type 2-2 casing deformation (well 1706(2)) in Table 1 matched with the deformation observed in model 6060. Furthermore, their Fréchet distances (8.357/8.399) and FD/(1-ED) ratios (114.5/129.2) were almost the same. Figure 14 shows the deformation sections (left black curve and right colored circle) when the fault slip was about 14.01 mm, wherein we can see that unlike type1, these sections did not have the inward bend. The casing inner diameter change for these sections was approximately 8.9 mm. It is also clear that the deformed sections had eccentric ellipse characteristics. This was because of the differences in both the fault strike and dip angles.
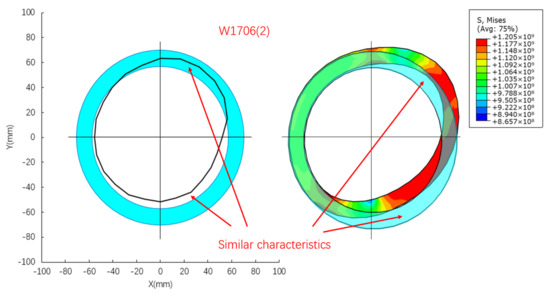
Figure 14.
Eccentric deformation section of w1706(2) (black curve) and model 6060 (colored circle) against the initial casing section (blue circles).
4.3. The Effect of Strike and Dip Angles on Casing Deformation
From the field casing deformation classification in Table 1, type 1 had the most severe local deformation, as indicated by the ratio FD/(1-ES), and also it was the most common type caused by fault slip. Thus, from the simulation results, we investigated the effect of strike and dip angles and established the relationship between fault slip and type 1 casing deformation (casing inner diameter change).
The larger the dip angle, the smaller the local deformation, indicating that the dip angle largely dictated the shape of the casing section (Table 4). Under the same strike conditions, the variation of the dip angle seemed to have little effect on the casing inner diameter, as shown in Figure 15 (black and red line). In contrast, under the same dip angle conditions, the strike angle had much larger effects on the casing inner diameter, as shown in the black and green line. As the fault slip displacement increased, the difference in casing inner diameter of model 9030 (green) and 3030 (black) increased, while in model 3090 (red) and 3030 (black), this was quite small. This indicates that the strike angle had more impact on the change of the casing inner diameter.
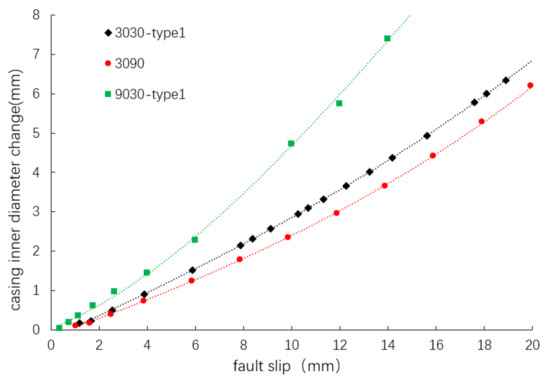
Figure 15.
The relationship between fault slip and casing inner diameter.
Initially the relationship between the fault slip and casing inner diameter change was nonlinear. This was because the elastic modulus of the casing was 10 times larger than the formation elastic modulus, and thus the fault displacement was not equivalent to the casing inner diameter change. It can be seen that for every fault slip displacement, the green line had the largest casing inner diameter change. Therefore, a conservative prediction of the casing inner diameter change can be given by the equation of the green line as follows:
where y the casing inner diameter change, mm; X is fault slip, mm; and R is correlation coefficient.
5. Conclusions
In this study, a quantitative method to describe the casing deformation using methods of judging the similarity of curves was established. By comparing the field casing deformation sections and the initial casing section, casing deformation sections were categorized into two types. A 3D finite-element model was then developed to investigate the effect of fault strike and dip angles on casing deformation. Finally, the relationship between casing inner diameter change and fault slip was determined. The following conclusions were drawn:
- (1)
- On the basis of the curve similarity method, the casing deformation section of Weiyuan and Guandong oil field can be categorized into two types: type 1, concave casing section, and type 2, elliptical casing section. The centroid calculation of type 2 showed that it can be subdivided into type 2-1, symmetric ellipse, and type 2-2 eccentric ellipse.
- (2)
- From the fault distribution map, the casing deformation position is precisely at the point where the fault crosses the well trajectory, which indicates that the fault slip may be the main cause of type 1 and type 2-2 deformations.
- (3)
- The numerical simulation ascertains that type 1 and type 2-2 casing deformations are caused by the fault slip. The larger the dip angle, the smaller the local deformation. The dip angle largely dictates the shape of the casing section, while the strike angle has much larger effects on the casing inner diameter.
- (4)
- For every fault slip displacement, model 9030-type 1 shows the most severe casing deformation. Therefore, a conservative prediction of the casing inner diameter change can be given by the equation of model 9030-type 1.
Author Contributions
Conceptualization, J.D. Methodology, K.W.; investigation, K.W. and D.M.N.; resources, Q.Y. and S.H.; writing—original draft preparation, K.W.; writing—review and editing, K.W. and D.M.N.; project administration, W.Y. All authors have read and agreed to the published version of the manuscript.
Funding
This research received no external funding.
Institutional Review Board Statement
Not applicable.
Informed Consent Statement
Not applicable.
Data Availability Statement
The data used to support this study are included in the article.
Acknowledgments
This work was supported by the National Natural Science Foundation of China (Basic Research on Drilling and Completion of Critical Wells for Oil and Gas (51821092)).
Conflicts of Interest
The authors declare that they have no conflicts of interest.
References
- Xi, Y.; Li, J.; Zha, C.; Guo, B.; Liu, G. A new investigation on casing shear deformation during multistage fracturing in shale gas wells based on microseism data and calliper surveys. J. Pet. Sci. Eng. 2019, 180, 1034–1045. [Google Scholar]
- King, G.E.; Valencia, R.L. Well Integrity for Fracturing and Re-Fracturing: What Is Needed and Why? In Proceedings of the Spe Hydraulic Fracturing Technology Conference, The Woodlands, TX, USA, 9–11 February 2016. [Google Scholar]
- Askari, M.; Aliofkhazraei, M.; Afroukhteh, S. A Comprehensive Review on Internal Corrosion and Cracking of Oil and Gas Pipelines. J. Nat. Gas Sci. Eng. 2019, 71, 102971. [Google Scholar] [CrossRef]
- Kermani, M.B.; Morshed, A. Carbon Dioxide Corrosion in Oil and Gas Production a Compendium. Corrosion 2003, 59, 659–683. [Google Scholar] [CrossRef]
- Chong, T.; Kumar, S.B.; Lai, M.O.; Loh, W.L. Effects of Wet H2S containing environment on mechanical properties of NACE grade C-Mn steel pipeline girth welds. Eng. Fract. Mech. 2014, 131, 485–503. [Google Scholar] [CrossRef]
- Brown, J.; Kenny, N.; Slagmulder, Y. Unique Cement Design to Mitigate Trapped Annular Pressure TAP Between Two Casing Strings in Steam Injection Wells. In Proceedings of the Spe Heavy Oil Conference & Exhibition, SPE Heavy Oil Conference and Exhibition, Kuwait City, Kuwait, 10–12 December 2016. [Google Scholar]
- Jiang, X.; Qian, L.; Yin, W. Mechanism of casing deformation caused by gypsum-salt layer creep and relevant countermeasures:A case study of Block X in the northern Sichuan Basin. Nat. Gas Ind. 2015, 35, 75–79. [Google Scholar]
- Li, Z.; Li, H.; Li, G.; Yu, H.; Jiang, Z.; Liu, H.; Hu, S.; Tang, B. The influence of shale swelling on casing deformation during hydraulic fracturing. J. Pet. Sci. Eng. 2021, 205, 108844. [Google Scholar] [CrossRef]
- Meyer, J.J.; Gallop, J.; Chen, A.; Reynolds, S.; Mildren, S. Can Seismic Inversion Be Used for Geomechanics? A Casing Deformation Example. In Proceedings of the Unconventional Resources Technology Conference, Houston, TX, USA, 23–25 July 2018. [Google Scholar]
- Chen, Z.; Xiang, D.; Zhang, F.; An, M.; Yin, Z.; Jiang, Z. Fault slip and casing deformation caused by hydraulic fracturing in Changning-Weiyuan Blocks, Sichuan: Mechanism and prevention strategy. Pet. Sci. Bull. 2019, 4, 364–377. [Google Scholar]
- Holland, A. Earthquakes triggered by hydraulic fracturing in south-central Oklahoma. Bull. Seismol. Soc. Am. 2013, 103, 1784–1792. [Google Scholar] [CrossRef]
- Shen, X.P.; Zhang, P. A calculation method for the allowable fracturing injection pressure of preventing casing deformation. Nat. Gas Ind. 2019, 39, 87–96. [Google Scholar] [CrossRef]
- Fan, M.T.; Li, J.; Liu, G. Study on Cement Sheath Integrity in Shale Formation Fracturing Process. China Pet. Mach. 2017, 45, 45–49. [Google Scholar]
- Wei, Y.; Lingzhan, Z.; Hong, L.; Jingen, D.; Hongkui, G.; Haige, W. Investigation of Casing Deformation during Hydraulic Fracturing in High Geo-stress Shale Gas Play. J. Pet. Sci. Eng. 2017, 150, 22–29. [Google Scholar]
- Wenqiang, M.; Dongying, W.; Lianchong, L.; Tianhong, Y.; Qingbo, F.; Sixu, W.; Fukun, X. Cement flow in interaction rock fractures and its corresponding new construction process in slope engineering. Constr. Build. Mater. 2021, 303, 124533. [Google Scholar]
- Tong, H.M.; Zhang, P.; Zhang, H.X. Geomechanical mechanisms and prevention countermeasures of casing deformation in shale gas horizontal wells. Nat. Gas Ind. 2021, 41, 9. [Google Scholar]
- Shapiro, S.A.; Dinske, C. On Stress Drop, Cohesion and Seismogenic Index of Fluid-Induced Seismicity. J Earth Space Sci. Open Arch. 2020. [Google Scholar] [CrossRef]
- McGarr, A. Seismic moments and volume changes. J. Geophys. Res. 1976, 81, 1487–1494. [Google Scholar] [CrossRef]
- Maxwell, S. Microseismic Imaging of Hydraulic Fracturing; Society of Exploration Geophysicists: Tulsa, OK, USA, 2014; pp. 31–52. [Google Scholar]
- Bourke, P. Calculating the Area and Centroid of a Polygon; Swinburne University of Technology: London, UK, 1988. [Google Scholar]
- Xi, Y.; Li, J.; Liu, G.; Zha, C.; Zeng, X.; Zhong, W. A new numerical method for evaluating the variation of casing inner diameter after strike-slip fault sliding during multistage fracturing in shale gas wells. Energy Sci. Eng. 2019, 7, 2046–2058. [Google Scholar] [CrossRef]
- Liberti, L.; Lavor, C.; Maculan, N.; Mucherino, A. Euclidean distance geometry and applications. Quant. Biol. 2012, 56, 3–69. [Google Scholar] [CrossRef]
- Har-Peled, S.; Raichel, B. The fréchet distance revisited and extended. ACM Trans. Algorithms 2014, 10, 1–22. [Google Scholar] [CrossRef] [Green Version]
- Efrat; Guibas; Har-Peled, S.; Mitchell; Murali. New Similarity Measures between Polylines with Applications to Morphing and Polygon Sweeping. Discret. Comput. Geom. 2002, 28, 535–569. [Google Scholar] [CrossRef] [Green Version]
- Li, S.; He, T.; Yin, X. Introduction to Rock Fracture Mechanics; China University of Science and Technology Press: Hefei, China, 2010. [Google Scholar]
- Li, Y.; Lu, Y.; Ahmed, R.; Han, B.; Jin, Y. Nonlinear Stress-Strain Model for Confined Well Cement. Materials 2019, 12, 2626. [Google Scholar] [CrossRef] [PubMed] [Green Version]
Publisher’s Note: MDPI stays neutral with regard to jurisdictional claims in published maps and institutional affiliations. |
© 2022 by the authors. Licensee MDPI, Basel, Switzerland. This article is an open access article distributed under the terms and conditions of the Creative Commons Attribution (CC BY) license (https://creativecommons.org/licenses/by/4.0/).