Article

Numerical Simulation Analysis of Heating Effect of Downhole Methane Catalytic Combustion Heater under High Pressure

1
State Key Laboratory of Shale Oil and Gas Enrichment Mechanism and Effective Development, Beijing 100083, China
2
State Center for Research and Development of Oil Shale Exploitation, Beijing 100083, China
3
College of Construction Engineering, Jilin University, Changchun 130021, China
4
National-Local Joint Engineering Laboratory of In Situ Conversion, Drilling and Exploitation Technology for Oil Shale, Jilin University, Changchun 130021, China
5
Provincial and Ministerial Co-Construction of Collaborative Innovation Center for Shale Oil & Gas Exploration and Development, Jilin University, Changchun 130021, China
6
Key Lab of Ministry of Natural Resources for Drilling and Exploitation Technology in Complex Conditions, Jilin University, Changchun 130021, China
*
Authors to whom correspondence should be addressed.
Energies 2022, 15(3), 1186; https://doi.org/10.3390/en15031186
Submission received: 5 January 2022 / Revised: 1 February 2022 / Accepted: 3 February 2022 / Published: 6 February 2022
(This article belongs to the Topic District Heating and Cooling Systems)

Abstract

:
The hot exhaust gas generated by a downhole combustion heater directly heats the formation, which can avoid the heat loss caused by the injection of high-temperature fluid on the ground. However, if the temperature of the exhaust gas is too high, it may lead to the carbonization of organic matter in the formation, which is not conducive to oil production. This paper proposes the use of low-temperature catalytic combustion of a mixture of methane and air to produce a suitable exhaust gas temperature. The simulation studies the influence of different parameters on the catalytic combustion characteristics of methane and the influence of downhole high-pressure conditions. The results show that under high-pressure conditions, using a smaller concentration of methane (4%) for catalytic combustion can obtain a higher conversion efficiency (88.75%), and the exhaust temperature is 1097 K. It is found that the high-pressure conditions in the well can promote the catalytic combustion process of the heater, which proves the feasibility of the downhole combustion heater for in situ heating of unconventional oil and gas reservoirs.

1. Introduction

Unconventional oil and gas resources refer to oil and gas resources that are continuously distributed over a large area. Traditional technology cannot obtain natural industrial production capacity. New technologies are needed to improve reservoir permeability or fluidity for economic development. These include heavy oil, oil sands, tight oil and gas, shale oil and gas, coalbed methane, natural gas hydrate, and oil shale [1]. Exploration and development practices and global new oil and gas resource evaluation have confirmed that unconventional oil and gas resources are abundant. According to the assessment of the International Energy Agency (IEA), the global recoverable oil resources are 9560 × 108 t, of which unconventional oil is 4210 × 108 t, and the global recoverable natural gas resources are 783.8 × 10¹² m3, of which unconventional natural gas is 195 × 1012 m3 [2]. According to IEA forecasts, global unconventional gas production will increase to 2.5 × 10¹² m3 in 2040, accounting for about 42% of total natural gas production, of which shale gas is 1.7 × 10¹² m3 and tight gas is 0.46 × 10¹² m3 [2]. Oil production will increase to more than 10 × 108 t, accounting for about 20% of total crude oil production, of which tight oil and shale oil production is 5.1 × 10⁸ t, and oil sands oil production is 3.4 × 10⁸ t [2]. The successful development of unconventional oil and gas has greatly increased the global oil and gas resources and promoted the growth of global oil and gas production.
However, unconventional petroleum resources such as heavy oil, oil sands, shale oil, and oil shale cannot be easily exploited through conventional methods. Among them, heavy oil and oil sands have high viscosity and poor fluidity, and it is difficult to achieve natural lift only by formation energy. The commonly used methods for viscosity reduction in heavy oil include thermal viscosity reduction, chemical viscosity reduction, mixing viscosity reduction, and microbial viscosity reduction. Among them, thermal viscosity reduction mainly includes steam stimulation (CSS), steam flooding (SF), gravity assisted oil drainage (SAGD), and combustion oil layers based on steam injection production [3,4]. For shale oil and oil shale, their main feature is the presence of undischarged liquid hydrocarbons and unconverted organic matter (kerogen) in the shale. To maximize the development of shale oil and oil shale resources, kerogen must be converted into oil and gas resources to improve oil and gas recovery [5]. Investigations, tests, and field trials have shown that underground in situ heating is the best choice for large-scale development and utilization of shale oil. The main mining technologies include reactive heat heating, conduction heating, convection heating, and radiant heating. The basic principle is that by injecting heat into the formation, the kerogen-rich rock formation continues to heat up, causing a cracking process. Heavy oil, bitumen, and other organic matter are converted into light oil and natural gas on a large scale, leaving residual carbon and CO2 and other pollutants underground, which is a clean and efficient mining method [6,7,8,9,10,11,12]. It can be seen that heat injection is the most important method for the effective exploitation of heavy oil, oil sands, shale oil, oil shale, and other unconventional petroleum resources. Therefore, how to effectively inject heat into the formation is a problem that must be solved in the development of unconventional petroleum resources.
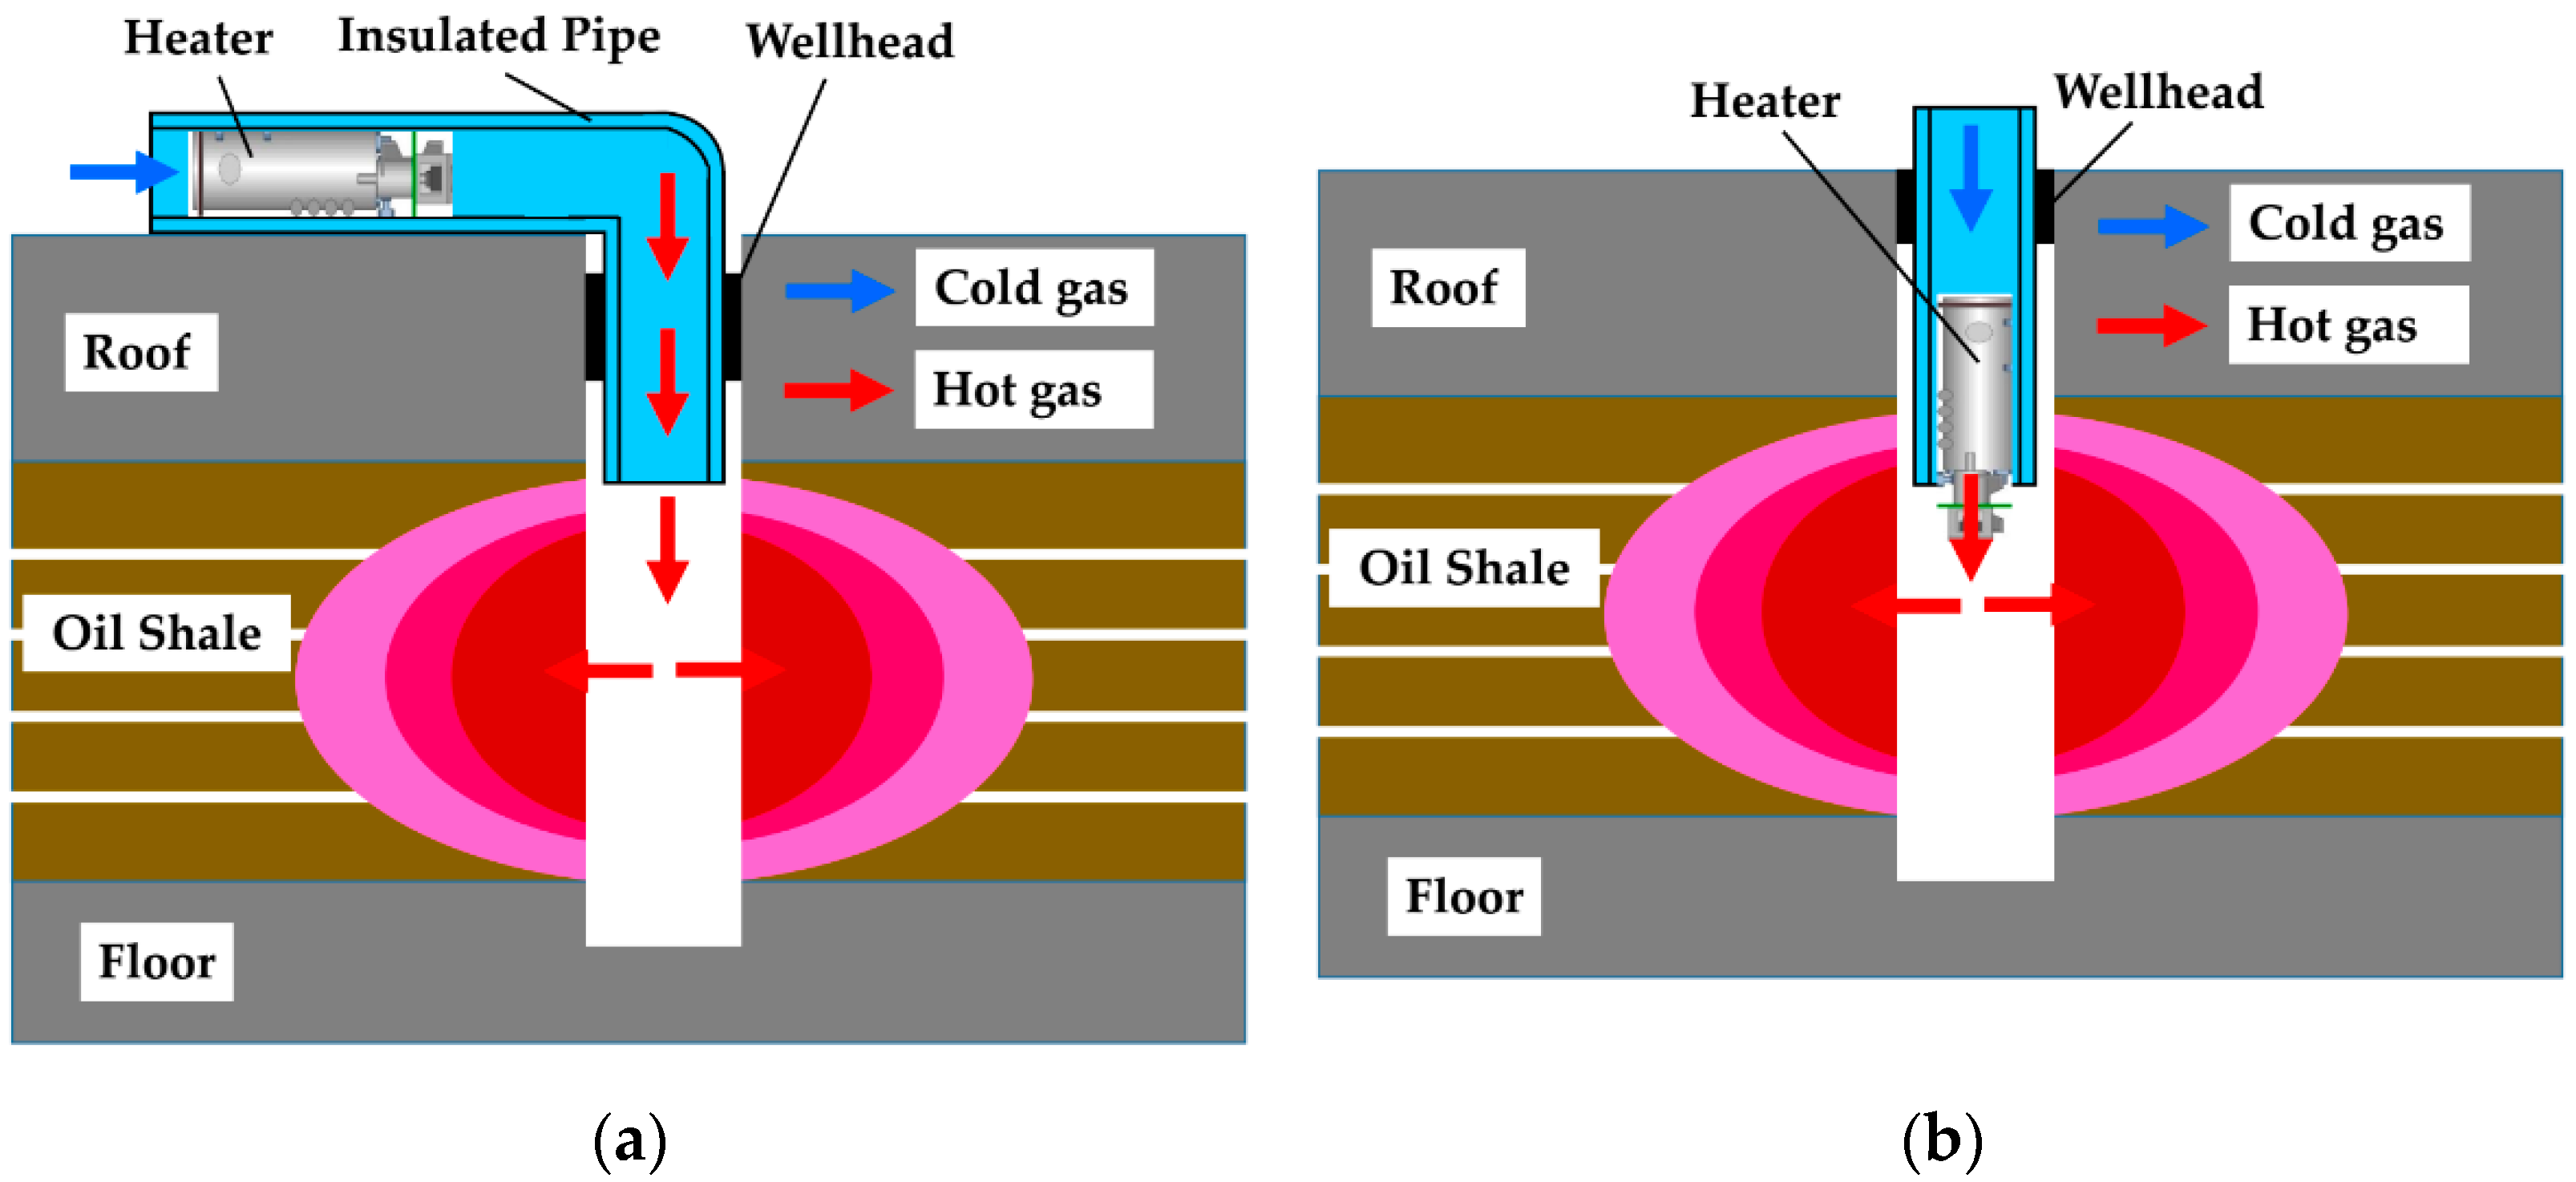
Heat injection methods for the exploitation of unconventional oil and gas resources can be divided into surface heating and downhole heating. Surface heating technology means that the high-temperature heat carrier generator is placed on the surface, the low-temperature heat carrier is transported to the surface heater through the gas injection pipeline, and the generated high-temperature heat carrier is transported to the target reservoir through the insulated pipeline, and the reservoir is heated to the cracking temperature, as shown in Figure 1a. The surface heating technology is mature, but the high-temperature heat carrier produces a large amount of heat loss during the process of injecting into the oil shale layer. Even after the heat-insulating pipe string is insulated, the heat loss of the high-temperature gas in the “transportation section” is still as high as 13.5 K/m. It can be seen that for the in situ mining of oil shale resources in the middle and deep layers, in order to improve the efficiency of heat injection and avoid the huge heat loss of the high-temperature heat carrier on the transmission path, it is necessary to develop heating technology for in situ mining of the oil shale resources in the middle and deep layers. Downhole heating technology involves placement of the high-temperature heat carrier generator downhole, and the low-temperature heat carrier is transported to the downhole heater through the heat injection pipeline. The high-temperature heat carrier produced by the downhole heater directly heats the target oil shale layer and heats the oil shale to cracking, as shown in Figure 1b. Downhole heating technology has fast heating speed, high energy utilization rate, and the prospect of large-scale commercial development. The downhole heater is the key equipment of this technology [13].
According to the source of heat, the downhole heater can be divided into two heating methods: electric heating and combustion heating. The heat source of the electric heating method is electric energy. The electric heating wire is used to convert the electric energy into heat energy to heat the oil shale by heat conduction, or the electric energy is converted into heat energy through the electromagnetic induction effect of the excitation coil to produce high-temperature fluid in the form of thermal convection, heating oil shale. Previous research on downhole electric heaters mainly focused on the study of the influence of heaters with different structures (electric heating rods) and heater materials on heater performance [14,15,16,17,18]. The heat transfer area of the electric heating rod is small, and the low thermal conductivity of the oil shale makes the heating efficiency of heating the oil shale by heat conduction lower, and the cost is higher, which is not suitable for large-scale applications. Electric heating downhole electric heaters that generate high-temperature fluids with resistance heat have no enhanced heat transfer structure on the surface of the heating body, which tends to produce local high-temperature areas, resulting in short heater life and poor stability. The heat source of combustion and heating is the combustion reaction heat of fossil fuels (oil or gas), and the high-temperature gas produced directly heats the oil shale layer by means of thermal convection, or the high-temperature gas generates a high-temperature heat carrier through the heat exchange structure to heat the oil shale layer. The combustion heater device does not have high requirements itself, so it has better stability [19,20].
The ignition temperature of methane is 538 °C, and the flame temperature is as high as 2861 °C, far exceeding the heating temperature required for heavy oil, oil sands, shale oil, and oil shale production, such as shale oil and organic matter conversion in oil shale. The temperature of oil and gas is between 300 °C and 500 °C. Excessive temperature leads to carbonization of organic matter, which is not conducive to oil production. Therefore, it is necessary to effectively reduce the ignition temperature and combustion temperature of methane by means of catalytic combustion. The use of catalysts enables flameless combustion of CH4 in air below the autoignition temperature of CH4 in air (595 °C) and can exceed the flammability limit (4.4 vol.% 16.5 vol.% in air) [21]. This leads to a double safety application and safe operation of the reactor. The total oxidation of CH4 is an exothermic reaction with a release of about 803 kJ/mol. Since the decomposition of CH4 hydrate requires +52 kJ/mol, the in situ combustion method is used to thermally increase production [22]. Under the action of the catalyst, methane can be burned at a lower air concentration and lower temperature. While ensuring the efficient conversion of methane, the temperature of the exhaust gas can be controlled by controlling the methane reaction. Methane catalytic combustion technology is relatively mature. At present, common methane combustion catalysts mainly include noble metal catalysts (Pd, Pt, Au, Rh, Ru, etc.) [5] and non-precious metal catalysts (transition metal oxides, perovskites, spinel, and other metal oxides) such as stone and hexaaluminate [23,24]. Under the action of noble metal catalysts, methane is decomposed and adsorbed into methyl (CH3) or methylene (CH2). The adsorbed oxygen directly generates CO2 and H2O or formaldehyde (HCHO), which then reacts with the noble-metal-adsorbed oxygen to generate CO2 and H2O [25]. Catalysis can reduce the ignition temperature and combustion peak temperature of methane and generate exhaust gas with different temperatures to meet the different process requirements of unconventional petroleum resources.
At present, the research on catalytic combustion of methane mainly focuses on coal mine tail gas treatment, Micro-Electro-Mechanical System, and other fields. The main focus is on how to improve the conversion efficiency of low-concentration methane in coal mine exhaust gas, and how to reduce the emission of nitrogen oxides (NOx) including nitrogen monoxide, nitrogen dioxide, and nitrous oxide and reduce air pollution [26,27,28,29]. A large number of studies have been carried out on the catalytic combustion efficiency of methane and the exhaust gas composition of methane catalytic combustion. However, for the in situ extraction of unconventional oil and gas resources, in addition to the catalytic combustion efficiency of methane, whether the temperature of the exhaust gas produced by combustion can meet the heat injection requirements of in situ extraction is also the main parameter of concern. In addition, the in situ mining of unconventional oil and gas resources is usually carried out at a depth of several hundred meters underground, so the high pressure of the formation must be overcome when high-temperature gas is injected into the formation. Under high pressure underground, the density of the gas, the contact area, and the reaction characteristics of the mixture on the catalyst surface are all affected. The effect of these changes on the downhole catalytic combustion process is unclear. Therefore, this the means of numerical simulation were adopted in this study to analyze the influence of high-pressure environment on methane catalytic combustion by comparing the methane catalytic combustion process under two different working conditions, atmospheric pressure and underground high pressure. A reference is provided for the selection of downhole catalytic combustion heating process parameters.

2. Principle of Downhole Catalytic Combustion Heater

The principle of the downhole catalytic combustion heater is shown in Figure 2, which mainly includes five parts: the gas injection mechanism, ignition mechanism, catalytic combustion mechanism, remote control components, and temperature monitoring components. It includes the following steps: (a) A mixture of methane and air is injected into the heater (Figure 3a). (b) After a period of injection, the ignition mechanism is turned on by the remote control component, and the ignition mechanism generates an open flame to ignite the mixture. The combustion of methane produces high-temperature exhaust gas to heat the precious metal catalyst (Pd) inside the catalytic combustion mechanism, and the temperature of the catalyst is monitored by the temperature monitoring component (Figure 3b). (c) When the catalyst reaches the required temperature, gas injection is stopped, and the combustion is stopped. The external thermal insulation layer ensures the temperature of the catalyst, and then the mixed gas is introduced again. At this time, methane is catalytically burned under the action of the high-temperature catalyst, and the generated high-temperature exhaust gas is injected into the formation (Figure 3c).

3. Numerical Simulation Method

3.1. Physical Model

The heater consists of a large number of porous media coated with platinum catalyst on the inner wall. The loading density is 2.72 × 10⁻⁹ mol/cm2. The porous medium material is foamed alumina, which has the advantages of reduced pressure, large specific surface area, and high mechanical strength. It has a diameter of Φ150 mm and a length of 30 mm, and the single pore diameter of the porous medium is about Φ1 mm. The simulated combustion process is the same as the working steps of the downhole catalytic combustion heater. First, a certain temperature is applied to the porous aluminum foam supporting the catalyst to cause the catalytic combustion reaction to occur. The methane-air mixture enters the pores from one side of the reactor and is preheated by the solid substrate to the catalytic reaction temperature. Under the action of the catalyst coated on the inner wall of the pore, a catalytic reaction occurs on the wall. The flue gas generated after the reaction exits the reactor through the vent outlet. Since the structure, internal flow and reaction of each channel are the same, the characteristics of the entire catalyst were selected in this study as the simulation object, as shown in Figure 4. The inner diameter is Φ1 mm, and the length is 30 mm.

3.2. Method

In the combustion process of porous media, the flow, heat transfer, and chemical reaction processes involved are quite complicated, and it is difficult to simulate the detailed process completely. Therefore, the combustion process must be simplified. The simplified assumptions involved in this study were:
The porous medium is isotropic and the porosity is constant,
The chemical reaction occurring on the surface of the catalyst is uniform,
The dispersion effect of gas in porous media is ignored,
The influence of gravity is negligible,
The solid wall surface is a radiant gray body.
The control equation used is as follows [30,31].
Continuity equation:
ρ g t + x ρ g μ + y ρ g ν = 0
Momentum equation:
t ρ g μ + x ρ g μ μ + y ρ g μ ν = p x + x μ u x + y μ u y
t ρ g ν + x ρ g ν ν + y ρ g ν ν = p y + x μ ν x + y μ v y  
Energy equation:
t ρ g h + x ρ g h u + y p h u = x k T x + y μ u x + y k T y l x h l J l + y h l J l + S h , r
Component conservation equation:
t p Y l + x p μ Y l + y p ν Y l = J l x J l y + R l
ρg is the gas density, u is the lateral velocity, p is the pressure, T is the temperature, v is the longitudinal velocity, μ is the dynamic viscosity, Jl is the mass flow, Sh,r are the chemical reaction sources, hl is the enthalpy of each component, Yl is the mass fraction of the component, and Rl is the net production rate of the component. The flow model in the article is a low-pressure laminar flow model. The component transport model is selected for the combustion model, and the chemical reaction rate follows Arrheniu’s law. For the detailed surface chemical reaction mechanism, the authoritative mechanism of methane catalytic reaction on the Pt surface proposed by Deutschmann is selected, which includes 7 adsorption reactions, 11 surface reactions, and 5 desorption reactions, as shown in Table 1 [32]. Since the space in the hole is extremely small, the temperature in the combustion chamber is not high, the fuel residence time is short, and the spatial reaction is ignored [33].

3.3. Boundary Conditions

The inlet of the mixed gas was set as the velocity inlet, the flow rate is set to 0.5, 1, 1.5, 2, 2.5, and 3 m/s, and the initial methane concentration was set to 3%, 4%, 5%, 6%, 7%, and 8%. The outlet was set as a pressure outlet, and the outlet pressure was set as normal pressure, 2 and 4 MPa. The hole wall was set as the wall, the loading density was 2.72 × 10⁻⁹ mol/cm2, and the initial temperature was 1500 K. The velocity inlet boundary conditions, the pressure outlet, and the inner wall were non-slip boundary conditions, and the wall had adiabatic boundary conditions. The simulated single pore was a pore in the porous medium, and the outside of this pore was the other identical pore. There was no temperature difference between the pore channels, and no heat exchange occurred between them. Therefore, the outer wall of a single channel was approximately adiabatic.

3.4. Validation of the Grid Independence

Grid independence research involves changing the number of grids and observing the influence of the number of grids on the calculation results. In order to ensure that the mesh can not only fully reflect the physical process of exhaust gas flow but also achieve good convergence, a mesh-independent study must be carried out. The quality of meshing directly affects the speed of convergence and even the success or failure of the solution. Quadrilateral grids were mainly used in this study, and the number of grids was: 750, 3000, 12,000, 27,000, 48,000, 75,000, and 108,000.
The grid independence is studied by comparing the variation of exhaust gas temperature of catalytic combustion under conditions of different grid numbers. The results show that the exhaust gas temperature changes significantly with the increase in grid number, and when the grid number increases to a certain value, the temperature remains relatively stable. The results are shown in Table 1. As the number of grids increases, the exhaust gas temperature decreases sharply. When the number of grids reaches 48,000, the temperature remains basically stable. Thus, the total number of grids used for the calculation is 48,000. The specific division of the grid is shown in Figure 5.
The SIMPLE algorithm was adopted for the model, and steady state calculations were used. The second-order upwind style was utilized for the discrete format, and the single-precision coupled solver was used to solve the control equations. The conversion rate of methane was calculated using the following formula:
η = m i n m o u t m i n × 100 %
min is the methane inlet mass concentration, and mout is the methane outlet mass concentration.

4. Result Analysis and Discussion

4.1. Influence of Methane Concentration on Conversion Rate and Exhaust Gas Temperature

The simulation parameters are shown in Table 2. Methane conversion and exhaust gas temperature were negatively correlated with methane volume fraction, as shown in Figure 6. Methane conversion is up to 96%, at which point the methane percentage is 3%. The exhaust gas temperature can reach up to 1696.25 K, and the methane percentage at this time is 8%. Although the conversion of methane decreases, the exhaust gas temperature increases. This is because the conversion rate of methane is as high as 91.63% even when the percentage of methane is 8%. As the percentage of methane increases, the total reaction amount of methane increases, the heat generated by combustion increases, and the temperature of the exhaust gas increases. However, the reduction in methane conversion means that the overall energy efficiency of the combustion of the mixture is reduced, which is detrimental to the overall energy utilization efficiency of the in situ mining process.
As the inlet volume concentration of methane decreases, the methane conversion rate also declines to a certain extent. This is because the increase in methane fraction increases the density of the adsorption reaction, and under the conditions of constant wall temperature, the frequency of reactions (7) and (8) is the main factor that determines the rate of catalytic reaction. Therefore, in practical applications, if the adiabatic loss of the burner can be reduced to a negligible level, the temperature of the catalytic bed maintains a certain value or even gradually increases, so increasing the inlet methane concentration can increase the methane conversion rate.
CH4 + 2 Pt (s) => CH3 (s) + H(s) + 2Pt
CH4 + 2 Pt (s) => CH3 (s) +H(s) + 2Pt
① Exhaust gas temperature
Figure 7 is a cloud diagram of temperature distribution in a single channel with different methane concentrations. From the axial temperature distribution, we can see that the higher the methane concentration, the longer the axial distance used to reach the maximum temperature. On the one hand, methane can react quickly under the conditions of constant wall surface temperature. When the methane concentration is lower, the methane reacts completely within a shorter reaction distance. The reaction speed is faster, and the low temperature zone is shorter. On the other hand, the higher the methane concentration, the slower the reaction rate, which requires a longer axial distance for the reaction. With the increase in methane concentration, the wall temperature and reaction rate both increase, and the preheating distance and methane reaction distance are both extended. The higher the methane concentration, the longer the axial length required to reach the maximum temperature in the pores.
  • ② Methane conversion rate
Figure 8 shows that the higher the methane concentration, the longer it takes for the methane to be completely consumed. The higher the methane concentration, the longer the required preheat section length. When the methane concentration is 3%, when the methane reaches the reaction temperature, because the methane concentration is low, the reaction speed is fast, and 12 mm of methane is required to complete the reaction. When the methane concentration is 8%, the length of the catalytic section is 26 mm, and the length of the preheating section is significantly increased compared to when the methane concentration is 3%. This is because the higher the concentration, the slower the reaction rate and the longer the reaction time. Therefore, the higher the methane concentration, the greater the increase in the catalytic section to completely consume methane.

4.2. Influence of Ignition Temperature on Conversion Rate and Exhaust Gas Temperature

The simulation parameters are shown in Table 3. The simulation results of catalytic combustion ignition temperature, methane conversion rate, and exhaust gas temperature are shown in Figure 9.
① Exhaust gas temperature
Figure 10 shows the change of heater outlet temperature with ignition temperature. It can be seen that different ignition temperatures have no significant effect on the methane conversion rate and exhaust gas temperature. There is also no effect on combustion efficiency. The scale distribution of methane catalytic combustion in the pipeline also presents the same characteristics. Including the length of the catalytic combustion zone, it can be seen that the ignition temperature only affects the ignition phase of methane.
② Methane conversion rate
Figure 11 shows that the higher the preheating temperature, the more violent the reaction at the inlet. This is because the increase in the intake air temperature makes it easier for the fuel to reach the gas phase reaction temperature. The length of the complete reaction of methane gradually becomes shorter with the increase in the inlet temperature, but the range of change is not large.
Figure 2 shows the working process of the heater. The heater first uses an open flame to ignite the mixture, and the mixture burns to generate low-temperature exhaust gas to heat the catalytic layer. The injection of the mixed gas is then stopped, and the mixed gas is re-introduced after the open flame is extinguished. At this time, the mixed gas undergoes a catalytic combustion reaction under the action of a high-temperature catalyst. Numerical simulation reproduces this process. First, a constant high temperature, i.e., the ignition temperature, is applied to the wall of the tunnel, and the steady-state calculation converges. At this time, the mixture is combusted at a high temperature reaching the ignition point, generating exhaust heating channels. The constant temperature on the wall of the channel is then stopped, while the mixture continues to be injected, the catalytic combustion reaction occurs, and the steady-state calculation converges. At this time, the obtained exhaust gas temperature is the temperature at which the combustion reaches a steady state. When the combustion reaches a steady state, the combustion process is only related to the ratio of fuel gas to auxiliary gas and the flow rate. Therefore, the ignition temperature is independent of methane conversion and exhaust gas temperature under the process conditions of Figure 2.

4.3. Influence of Injection Rate on Methane Conversion Rate and Exhaust Gas Temperature

A total of six sets of working conditions were simulated. The simulation parameters are shown in Table 4. The result is shown in Figure 12.
The rate of the injected gas changes the amount of fuel entering the heater and the residence time and affects the mass transfer and heat transfer process between the fuel and the inner wall of the pore and the temperature distribution, velocity distribution, and methane reaction process in the reactor. As the inlet gas velocity increases, the reactor outlet temperature gradually decreases, reaching the lowest value of 930 K at 3.0 m/s. The increase in gas velocity doubles the amount of fuel entering the reactor. The main reason why the methane conversion rate decreases with the increase in the rate is that the adsorption reaction time in the catalytic reaction on the wall surface is insufficient after the speed increases. It can be seen that proper control of the rate can effectively increase the methane conversion rate.
① Exhaust gas temperature
Figure 13 shows that in the flow rate range of 0.5 to 2.5 m/s, a pore length of 30 mm is sufficient for the fuel to react fully. But when the flow rate is greater than 2.5 m/s, the channel length of 30 mm is not enough to make the fuel fully react, so when the gas flow rate is 3 m/s, the outlet temperature reaches the lowest because although the wall temperature at the exit of the tunnel has reached the highest value, the gas temperature on the central axis has not yet reached the highest value and is discharged from the reactor, so the outlet flue gas temperature decreases. When the gas velocity reaches 3 m/s, due to the excessively high gas velocity, part of the methane on the central axis of the pore channel is not preheated to the reaction temperature and is discharged out of the pore channel, resulting in a decrease in the outlet flue gas temperature.
② Methane conversion rate
Figure 14 shows the variation of methane concentration distribution with flow velocity. As the gas velocity increases, the length required for the complete reaction of methane continues to increase. As the gas velocity increases, the amount of fuel entering the pores per unit time increases, and the residence time of the fuel becomes shorter. The residence time becomes shorter, and the amount of fuel becomes shorter. The double effect of the increase makes the length of the methane reaction continue to increase. When the gas velocity reaches 3 m/s, it can be seen that there is still a certain concentration of methane at the outlet of the tunnel that has not reacted completely, resulting in a waste of fuel and a decrease in the combustion efficiency of the burner.

4.4. The influence of Downhole Pressure on Methane Conversion Rate and Exhaust Gas Temperature

The simulated downhole pressure is 2 and 4 MPa, and the simulation parameters are shown in Table 5 and Table 6. The simulation results of methane conversion rate and exhaust temperature are shown in Figure 15 and Figure 16. Compared with 0.1 MPa (Figure 12), the exhaust gas temperature is higher when there is bottom hole pressure. For example, when the methane injection rate is 1m/s and the formation pressure is 2 MPa, the heater’s exhaust temperature is 1426.21 K, and when the formation pressure is 4 MPa, the heater’s exhaust temperature reaches 1892.9 K. Under the same conditions, the heater’s exhaust temperature under normal pressure is 1106.09 K. The downhole high pressure causes the gas to be compressed, the density increases, the specific heat capacity increases, and the heat carried per unit volume increases, indicating that the existence of downhole pressure can increase the exhaust gas temperature of catalytic combustion. As the injection volume of the mixed gas increases, the temperature of the exhaust gas gradually decreases. This is because as the injection volume increases, and the heat taken away during the gas flow increases, resulting in a decrease in the temperature of the exhaust gas per unit volume. Another main reason is that as the injection volume increases, the contact time between methane and the catalytic wall surface is shortened, and the methane conversion rate decreases, resulting in a decrease in the temperature of the exhaust gas produced by catalytic combustion.
The influence of downhole pressure on methane conversion rate is also obvious. As the amount of mixed gas injected increases, the methane conversion rate shows a downward trend. Taking the injection rate of 3 m/s as an example, the methane conversion rate under normal pressure is 67.17%. When the downhole pressure is 2 MPa, the methane conversion rate is 70.67%. When the downhole pressure is 4 MPa, the methane conversion rate is 70.83%. Under the action of pressure, the methane conversion rate increases to a certain extent, which also provides an explanation for the increase in the temperature of the exhaust gas. The increase in methane conversion rate is mainly due to the fact that the mixed gas is compressed under pressure, and the density increases. The content of methane and oxygen per unit volume of the mixed gas increases, and the amount of contact with the catalyst increases, resulting in an increase in the methane conversion rate. But under the conditions of 2 and 4 MPa, the increase in methane conversion rate is very small. This is mainly due to the increase in the content of methane and oxygen per unit volume of the mixed gas, which leads to an increase in the reaction volume of methane on the catalytic wall. As shown in Figure 17 and Figure 18, there is a sharp increase in temperature and flow velocity near the wall, which is also accompanied by a sharp decrease in methane concentration and gas mixture density at the same position. The gas mixture in the pores is caused by pressure. The density of the gas increases, and the content of methane and oxygen in the mixture per unit volume increases, resulting in an increase in the reaction amount of methane on the catalytic wall surface, an increase in the amount of gas generated by the catalytic combustion reaction, and a higher gas temperature, resulting in the reaction. The rapid increase in the flow rate hinders the subsequent adsorption of methane on the catalyst surface, resulting in a small increase in the conversion rate of methane. The amount of gas produced by the catalytic combustion reaction increases, and the gas temperature rises, causing the volume of the exhaust gas produced by the reaction to expand, hindering subsequent methane adsorption on the catalyst surface, resulting in a decrease in the methane conversion rate. At the same time, as the gas velocity increases, the length required for the complete reaction of methane continues to increase. As the gas velocity increases, the amount of fuel entering the pores per unit time increases, the residence time of the fuel becomes shorter, and the residence time becomes shorter. The dual effect of increasing the dose makes the catalytic reaction time continuously increase.

4.5. The Influence of Methane Percentage on Catalytic Combustion of Methane under Downhole Pressure Conditions

The pressures are respectively 2 and 4 MPa, and the simulation parameters are shown in Table 7 and Table 8. The simulation results of methane conversion rate and exhaust gas temperature when the methane percentage is 4% are shown in Figure 19 and Figure 20.
Comparing Figure 16, Figure 17, Figure 19, and Figure 20, it can be seen that the reduction in methane concentration significantly increases its catalytic combustion efficiency. When the injection rate of the mixed gas is 1 m/s and the downhole pressure is 2 MPa, the methane conversion rate is 88.5%. When the downhole pressure is 4 MPa, the methane conversion rate is 88.75%, it can be seen that when the methane percentage is 4%, the methane conversion rate is higher than 6%, indicating that the methane combustion efficiency is higher at this time. When the injection rate is 1m/s and the ambient pressure is 2 MPa, the exhaust gas temperature of methane combustion is 1092.68 K. When the ambient pressure is 4 MPa, the exhaust gas temperature of methane combustion is 1097.32 K. This shows that the combustion of the methane burner is more stable when the methane percentage is 4%.
When the pressure is 2 and 4 MPa, the injection rate is 1–5 m/s, and the methane percentage is 4%. The temperature distribution cloud diagrams of exhaust temperature, methane concentration, mixed gas density, and gas velocity during the combustion process are shown in Figure 21 and Figure 22. It can be seen from the cloud chart that when the percentage of methane in the mixed gas is 4%, there are no fluctuations in temperature, density, or gas velocity during the catalytic combustion of methane, and methane obtains higher combustion efficiency and combustion stability. The greater the methane concentration at the inlet, the longer it takes for the temperature in the burner to stabilize. Although the methane concentration in the early stage is large, the reaction speed is fast and the amount of heat released is large. As the temperature rises, the flow velocity of the mixed gas in the burner increases, and the high-temperature gas quickly moves to the outlet end. Under stable temperature and high concentration conditions, the length of the burner through which the mixed gas passes is increased. With the change of methane concentration, the velocity distribution trend in the combustor is basically the same. Because it is a non-slip wall, the velocity near the wall is basically zero. As the temperature of the gas in the combustor increases, the velocity increases and stabilizes after a certain distance. At the same length from the entrance, the greater the concentration of methane, the greater the conversion rate. This is because there is sufficient air at this time, and more methane molecules and oxygen molecules react chemically on the surface of the catalyst. At this time, the methane reaction rate is fast. A small amount of methane remains near the end. This is because the reaction speed is too fast. After the reaction reaches a certain level, the methane concentration is naturally low and the reaction speed decreases. At this time, the speed is relatively high, and it is already close to the end of the burner, so there is a small amount of methane unreacted.

5. Conclusions

(1)
The in situ cracking temperature of organic matter in unconventional oil and gas resources is between 623 and 823 K. When the flow rate is 0.5 m/s and the proportion of methane is 7–8%, the exhaust gas temperature is between 656.51 and 825.49 K, which can meet the technological requirements of in situ mining of oil and gas resources. The methane conversion rate is higher than 90%, and the energy utilization efficiency is high.
(2)
Under downhole pressure conditions, the catalytic combustion characteristics of methane are different from those under atmospheric pressure conditions. The main manifestation is that the downhole pressure increases the density of the mixed gas, resulting in unstable methane catalytic combustion process, fluctuating flue gas temperature, methane conversion rate, gas density, and conversion rate, which may seriously affect the performance of the heater and low energy utilization.
(3)
For the high-pressure environment in the well, the high concentration of methane in the mixed gas is not conducive to obtaining stable combustion, improving the utilization efficiency of methane and reducing energy consumption. It is necessary to appropriately reduce the mixed gas according to the actual working conditions. It is best to use a ratio of about 4%. When the injection flow rate is 1 m/s, the methane conversion rate can reach up to 88.75%, and the exhaust gas temperature can reach 824.32 K, which can meet the on-site mining process requirements of unconventional oil and gas resources.

Author Contributions

Conceptualization, Y.W. (Yiwei Wang), Y.W. (Yuan Wang) and S.D.; methodology, Y.W. (Yiwei Wang) and Y.W. (Yuan Wang); software, Y.W. (Yuan Wang); formal analysis, Y.W. (Yuan Wang); data curation, Y.W. (Yuan Wang) and Q.L.; writing—original draft preparation, Y.W. (Yuan Wang); writing—review and editing, W.G.; visualization, J.G. and H.S.; funding acquisition, Y.W. (Yiwei Wang). All authors have read and agreed to the published version of the manuscript.

Funding

This research was funded by the Sinopec “Research on design of underground high temperature heater and heating control method”, grant no. G5800-19-ZS-KFNK007, and the National Key Research and Development Program of China, grant no. 2019YFA0705502 and grant no. 2019YFA0705503. We are appreciative of the insightful comments on our manuscript from anonymous reviewers, which were beneficial for improving our work.

Institutional Review Board Statement

Not applicable.

Informed Consent Statement

Not applicable.

Conflicts of Interest

The authors declare no conflict of interest.

References

  1. SPE; AAPG; WPC; SPEE; SE. Petroleum Resources Management System; IEA: Washington, DC, USA, 2007. [Google Scholar]
  2. IEA. World Energy Outlook 2016[EB/OL]. 30 June 2016. Available online: www.eia.gov/forecasts/ieo/pdf/0484(2016).pdf (accessed on 2 January 2022).
  3. Dong, X.; Liu, H.; Chen, Z.; Wu, K.; Lu, N.; Zhang, Q. Enhanced oil recovery techniques for heavy oil and oilsands reservoirs after steam injection. Appl. Energy 2019, 239, 1190–1211. [Google Scholar] [CrossRef]
  4. Guo, K.; Li, H.; Yu, Z. In-situ heavy and extra-heavy oil recovery: A review. Fuel 2016, 185, 886–902. [Google Scholar]
  5. Kang, Z.; Zhao, Y.; Yang, D. Review of oil shale in-situ conversion technology. Appl. Energy 2020, 269, 115121. [Google Scholar] [CrossRef]
  6. U.S. Congress, Office of Technology Assessment. An Assessment of Oil Shale Technologies; U.S. Congress, Office of Technology Assessment: Washington, DC, USA, 1980. [Google Scholar]
  7. Lee, S.; Speight, J.G.; Loyalka, S.K. Handbook of Alternative Fuel Technologies; CRC Press: Boca Raton, FL, USA, 2014. [Google Scholar]
  8. Vinegar, H. Shells in-situ conversion process. In Proceedings of the 26th Oil Shale Symposium, Golden, CO, USA, 16–20 October 2006. [Google Scholar]
  9. Fowler, T.; Vinegar, H. Oil Shale ICP-Colorado Field Pilots//SPE Western Regional Meeting; Society of Petroleum Engineers: San Jose, CA, USA, 2009. [Google Scholar]
  10. Meijssen, T.; Emmen, J.; Fowler, T. In-situ oil shale development in jordan through icp technology. In Proceedings of the Abu Dhabi International Petroleum Exhibition and Conference, Abu Dhabi, United Arab Emirates, 11–13 November 2014. [Google Scholar]
  11. Crawford, P.M.; Killen, J.C. New challenges and directions in oil shale development technologies. ACS Symp. Ser. 2010, 1032, 21–60. [Google Scholar]
  12. Raytheon Technology. Radio Frequency/Critical Fluid Oil Extraction Technology. Available online: www.raytheon.com (accessed on 12 March 2019).
  13. Guo, W.; Wang, Z.; Sun, Z.; Sun, Y.; Lü, X.; Deng, S.; Li, Q. Experimental investigation on performance of downhole electric heaters with continuous helical baffles used in oil shale in-situ pyrolysis. J. Appl. Therm. Eng. 2018, 147, 1024–1035. [Google Scholar] [CrossRef]
  14. Parman, D.; Ojeda, S. Use of Electric Downhole Heaters to Improve Production and Recovery of Heavy, Viscous Oil in California and Venezuela. In Proceedings of the SPE Kuwait Oil and Gas Show and Conference, Kuwait City, Kuwait, 7–10 October 2013. [Google Scholar]
  15. Hao, Y.; Xiaoqiao, G.; Fansheng, X.; Jialiang, Z.; Yanju, L. Temperature distribution simulation and optimization design of electric heater for in-situ oil shale heating. J. Oil Shale 2014, 31, 105–120. [Google Scholar] [CrossRef] [Green Version]
  16. Bybee, K. Electrical Downhole Heaters for Faja Heavy-Oil Reservoirs. J. Pet. Technol. 2009, 61, 77–79. [Google Scholar] [CrossRef]
  17. Zhu, Z.; Zeng, F.; Zhao, G.; Laforge, P.D. Evaluation of the hybrid process of electrical resistive heating and solvent injection through numerical simulations. J. Fuel 2013, 105, 119–127. [Google Scholar] [CrossRef]
  18. Hassanzadeh, H.; Harding, T. Analysis of conductive heat transfer during in-situ electrical heating of oil sands. J. Fuel 2016, 178, 290–299. [Google Scholar] [CrossRef]
  19. Hester, S.A., III. Engineering and Economics of Enhanced Oil Recovery in the Canadian Oil Sands. 2014. Available online: https://repositories.lib.utexas.edu/bitstream/handle/2152/25742/HESTER-THESIS-2014.pdf?sequence=1&isAllowed=y (accessed on 23 May 2019).
  20. Schicks, J.; Spangenberg, E.; Giese, R.; Luzi-Helbing, M.; Priegnitz, M.; Beeskow-Strauch, B. A Counter-Current Heat-Exchange Reactor for the Thermal Stimulation of Hydrate-Bearing Sediments. Energies 2013, 6, 3002–3016. [Google Scholar] [CrossRef]
  21. Air Liquide. Downloadable Material Safety Data Sheet (MSDS) for CH4; Air Liquide: Paris, France, 1966. [Google Scholar]
  22. Rydzy, M.B.; Schicks, J.M.; Naumann, R.; Erzinger, J. Dissociation enthalpies of synthesized multicomponent gas hydrates with respect to the guest composition and cage occupancy. J. Phys. Chem. B 2007, 111, 9539–9545. [Google Scholar] [CrossRef]
  23. Chen, J.; Arandiyan, H.; Gao, X.; Li, J.H. Recent advances in catalysts for methane combustion. Catal. Surv. Asia 2015, 19, 140. [Google Scholar] [CrossRef]
  24. Monai, M.; Montini, T.; Gorte, R.J.; Fornasiero, P. Catalytic oxidation of methane: Pd and beyond. Eur. J. Inorg. Chem. 2018, 2018, 2884. [Google Scholar] [CrossRef]
  25. Huang, F.J.; Chen, J.J.; Hu, W.; Li, G.X.; Wu, Y.; Yuan, S.D.; Zhong, L.; Chen, Y.Q. Pd or PdO: Catalytic active site of methane oxidation operated close to stoichiometric airto-fuel for natural gas vehicles. Appl. Catal. B Environ. 2017, 219, 73. [Google Scholar] [CrossRef]
  26. Prathap, C.; Galeazzo, F.C.; Kasabov, P.; Habisreuther, P.; Zarzalis, N.; Beck, C.; Wegner, B. Analysis of NOX Formation in an Axially Staged Combustion System at Elevated Pressure Conditions. In Proceedings of the Asme Turbo Expo: Turbine Technical Conference & Exposition, Vancouver, BC, Canada, 6–10 June 2011. [Google Scholar]
  27. Li, Y.; Fan, W. Effect of char gasification on NOx formation process in the deep air-staged combustion in a 20 kW down flame furnace. J. Appl. Energy 2016, 164, 258–267. [Google Scholar] [CrossRef]
  28. Tu, Y.; Liu, H.; Chen, S.; Liu, Z.; Zhao, H.; Zheng, C. Effects of furnace chamber shape on the MILD combustion of natural gas. J. Appl. Therm. Eng. 2015, 76, 64–75. [Google Scholar] [CrossRef]
  29. Cimino, S.; Allouis, C.; Pagliara, R.; Russo, G. Effect of catalyst formulation (Rh, Rh–Pt) on the performance of a natural gas hybrid catalytic burner. J. Catal. Today 2011, 171, 72–78. [Google Scholar] [CrossRef]
  30. Neyertz, C.; Volpe, M.; Gigola, C. Methane combustion over Pd/γ-Al2O3 and Pd-VOx/γ-Al2O3 catalysts. Appl. Catal. 2004, 277, 137–145. [Google Scholar] [CrossRef]
  31. Moallemi, F.; Batley, G.; Dupont, V.; Foster, T.J.; Pourkashanian, M.; Williams, A. Chemical modelling and measurements of the catalytic combustion of CH4/air mixtures on platinum and palladium catalysts. Catal. Today 1999, 47, 235–244. [Google Scholar] [CrossRef]
  32. Deutschmann, O.; Schmidt, R.; Behrendt, F.; Warnat, J. Numerical modeling of catalytic ignition. Symp. Int. Combust. 1996, 26, 1747–1754. [Google Scholar] [CrossRef]
  33. Ran, J.Y.; Hu, J.H.; Zhang, L.; Tang, Q. Characteristics of generating hydrogen from methane-wet air catalytic reforming reaction in the microcombustor. Proc. CSEE 2007, 27, 42–48. [Google Scholar]
Figure 1. Formation heating technology [13]. (a) Ground heating technology. (b) Downhole heating technology. Reprinted with permission from Ref. [13] Copyright 2018 Applied Thermal Engineering, Elsevier.
Energies 15 01186 g001
Figure 2. Principle of downhole catalytic combustion.
Energies 15 01186 g002
Figure 3. Working steps of downhole catalytic combustion.
Energies 15 01186 g003
Figure 4. Physical model.
Energies 15 01186 g004
Figure 5. Schematic of the part of the grid.
Energies 15 01186 g005
Figure 6. Conversion rate and exhaust gas temperature under different methane concentrations.
Energies 15 01186 g006
Figure 7. Temperature distribution of exhaust gas with different methane contents.
Energies 15 01186 g007
Figure 8. Distribution of methane concentration with different methane contents.
Energies 15 01186 g008
Figure 9. Methane conversion rate and exhaust gas temperature at different ignition temperatures.
Energies 15 01186 g009
Figure 10. Distribution of exhaust gas temperature with different ignition temperatures.
Energies 15 01186 g010
Figure 11. Distribution of methane concentration with different ignition temperatures.
Energies 15 01186 g011
Figure 12. Conversion rate and exhaust temperature at different injection rates.
Energies 15 01186 g012
Figure 13. Distribution of exhaust temperature with different injection flow rates.
Energies 15 01186 g013
Figure 14. Distribution of methane concentration with different injection rates.
Energies 15 01186 g014
Figure 15. The influence of injection rate on conversion rate and exhaust gas temperature at 2 MPa.
Energies 15 01186 g015
Figure 16. The influence of injection rate on conversion rate and exhaust gas temperature at 4 MPa.
Energies 15 01186 g016
Figure 17. Temperature, concentration, density, and flow velocity distribution at 2 MPa. (a) Temperature distribution. (b) Methane concentration distribution. (c) Density distribution. (d) Velocity distribution.
Energies 15 01186 g017aEnergies 15 01186 g017b
Figure 18. Temperature, concentration, density, and flow velocity distribution, 4 MPa. (a) Temperature distribution. (b) Methane concentration distribution. (c) Density distribution. (d) Velocity distribution.
Energies 15 01186 g018aEnergies 15 01186 g018b
Figure 19. The influence of injection rate on conversion rate and exhaust gas temperature at 2 MPa, 4% of CH4.
Energies 15 01186 g019
Figure 20. The influence of injection rate on conversion rate and exhaust gas temperature at 4 MPa, 4% of CH4.
Energies 15 01186 g020
Figure 21. Temperature, concentration, density, and flow velocity distribution, 2 MPa, 4% of CH4. (a) Temperature distribution. (b) Methane concentration distribution. (c) Density distribution. (d) Velocity distribution.
Energies 15 01186 g021aEnergies 15 01186 g021b
Figure 22. Temperature, concentration, density, and flow velocity distribution, 4 MPa, 4% of CH4. (a) Temperature distribution. (b) Methane concentration distribution. (c) Density distribution. (d) Velocity distribution.
Energies 15 01186 g022aEnergies 15 01186 g022b
Table 1. Grid number assessment parameter table.
Number of GridsExhaust Gas Temperature /K
7501740.79
30001718.69
12,0001661.04
27,0001558.94
48,0001425.14
75,0001415.43
108,0001401.21
Table 2. Simulation parameters of the influence of Methane Concentration on Conversion Rate and Exhaust Gas Temperature.
Injection Flow Rate (m/s)Ignition Temperature (K)Methane Concentration (%)Outlet Pressure (MPa)Conversion Rate (%)Exhaust Gas Temperature (K)
0.5150030.196.83929.51
4961098.49
594.61265.18
693.51415.43
792.571558.82
891.631696.25
Table 3. Simulation parameters of the influence of ignition temperature on conversion rate and exhaust gas temperature.
Injection Flow Rate (m/s)Ignition Temperature (K)Methane Concentration (%)Outlet Pressure (MPa)Conversion Rate (%)Exhaust Gas Temperature (K)
0.570060.193.581142.14
80093.581141.8
90093.551141.68
110093.561141.13
130093.581142.03
150093.561142.43
Table 4. Simulation parameters of the influence of injection rate on methane conversion rate and exhaust gas temperature.
Injection Flow Rate (m/s)Ignition Temperature (K)Methane Concentration (%)Outlet Pressure (MPa)Conversion Rate (%)Exhaust Gas Temperature (K)
0.5150060.193.58%1142.43
184.73%1106.05
1.578.42%1049.18
273.67%999.89
2.570.00%958.32
367.17%925.08
Table 5. Simulation parameters of the influence of injection rate on conversion rate and exhaust gas temperature at 2 MPa.
Injection Flow rate (m/s)Ignition Temperature (K)Methane Concentration (%)Outlet Pressure (MPa)Conversion Rate (%)Exhaust Gas Temperature (K)
115006281.661426.21
272.831352.47
370.831325.07
466.671264.63
560832.8
Table 6. Simulation parameters of the influence of injection rate on conversion rate and exhaust gas temperature at 4 MPa.
Injection Flow Rate (m/s)Ignition Temperature (K)Methane Concentration (%)Outlet Pressure (MPa)Conversion Rate (%)Exhaust Gas Temperature (K)
115006485.51892.09
279.331753.55
370.671711.99
466.671595.5
5651394.28
Table 7. Simulation parameters of the influence of injection rate on conversion rate and exhaust gas temperature at 2 MPa, 4% of CH4.
Injection Flow Rate (m/s)Ignition Temperature (K)Methane Concentration (%)Outlet Pressure (MPa)Conversion Rate (%)Exhaust Gas Temperature (K)
115004288.5819.68
278751.19
371.37699.07
466.75660.99
563.5632.5
Table 8. Simulation parameters of the influence of injection rate on conversion rate and exhaust gas temperature at 4 MPa, 4% of CH4.
Injection Flow Rate (m/s)Ignition Temperature (K)Methane Concentration (%)Outlet Pressure (MPa)Conversion Rate (%)Exhaust Gas Temperature (K)
115004288.75824.32
278753.04
371.5700.09
467661.6
563.25632.04
Publisher’s Note: MDPI stays neutral with regard to jurisdictional claims in published maps and institutional affiliations.

