Article

Production and Economic Assessment of Synthetic Fuels in Agriculture—A Case Study from Northern Germany

Department of Agriculture and Food Sciences, University of Applied Sciences, 17033 Neubrandenburg, Germany
*
Author to whom correspondence should be addressed.
Energies 2022, 15(3), 1156; https://doi.org/10.3390/en15031156
Submission received: 21 November 2021 / Revised: 20 January 2022 / Accepted: 25 January 2022 / Published: 4 February 2022
(This article belongs to the Special Issue Alternative Fuels for Internal Combustion Engines)

Abstract

:
A climate-friendly and CO2-neutral energy supply for agricultural farms is the subject of investigation of this study. The supply concerns the internal economy (buildings and animal husbandry) as well as the production of synthetic fuels for outdoor work (cultivation of the fields). This energy is in demand with many customers, e.g., the dairy cooperative Arla Foods, whose goal is the production of cow’s milk with net-zero CO2 emissions by the year 2050. The operational energy system considered here included renewable electricity generation, covering electricity consumption in the cowshed, battery storage for times without electricity generation, the production of synthetic fuels and feeding into the public power grid. Fluctuations depending on the day and the season were taken into account for electricity at 15-min intervals and for fuel per calendar week for one year. The aim was to determine the necessary capacities of renewable energy (RE) generation systems and production systems for synthetic fuel, as well as an economic evaluation with the calculation of the energy costs per kWh and the break-evens for the capital expenses (CapEx). Two different scenarios were developed using the example of a survey dairy farm with an annual electricity consumption of approximately 80,000 kWh in the cowshed and an annual diesel consumption of 35,000 L, corresponding to 350,000 kWh for field work. To ensure the energy supply, Scenario 1 required a photovoltaic system (PV) on the roof with an output of 125 kWp, a 250 kW small wind turbine, a battery with a storage capacity of 2 kWh and synthetic fuel production with an output of 210 kW. Scenario 2 required a 200 kWp PV system on the roof and a 520 kWp PV system in the open fields, a battery with a 105 kWh storage capacity and a synthetic fuel production facility with an output of 385 kW to cover the farm’s energy needs. The results showed that a farm’s own electricity production is currently profitable; however, a farm’s production of synthetic fuel still has comparatively high costs and therefore is not yet profitable. Further technical advances, rising prices of fossil fuels and economies of scale, e.g., larger cooperatively-operated plants, could help new technology to make a breakthrough.

1. Introduction

In order to ensure the goal set by the European Union to achieve climate neutrality by 2050 and thus limit global warming to 1.5–2 °C, according to the Paris Climate Protection Agreement of 2015 [1], most countries, including Germany, still make great efforts in the use of renewable energies (RE). The conversion of wind and solar energy, which are available in large quantities on Earth, into electrical energy is practicable, inexpensive and well advanced due to the technical developments of recent decades. In Germany, this has been promoted since 2000 by the Renewable Energy Sources Act (RESA; in German, Erneuerbare-Energien-Gesetz, EEG 2000) [2]. The challenge is to significantly increase renewable electricity production and to transfer it to the two sectors of heat and mobility in order to displace fossil fuels.
Agriculture must also make its contribution to the energy transition in two ways. On the one hand, farms have good prerequisites for the production of RE, especially electricity, owing to their roofs (rooftop solar) and fields (offsite solar) for the construction of PV systems and wind turbines. On the other hand, the largest share of energy consumption in agricultural operations is the fuel requirement of fieldwork in the form of diesel. This raises the question of whether the drive energy for fieldwork can be generated again using renewable power to liquid, as was the case with oats for horses 80 years ago.
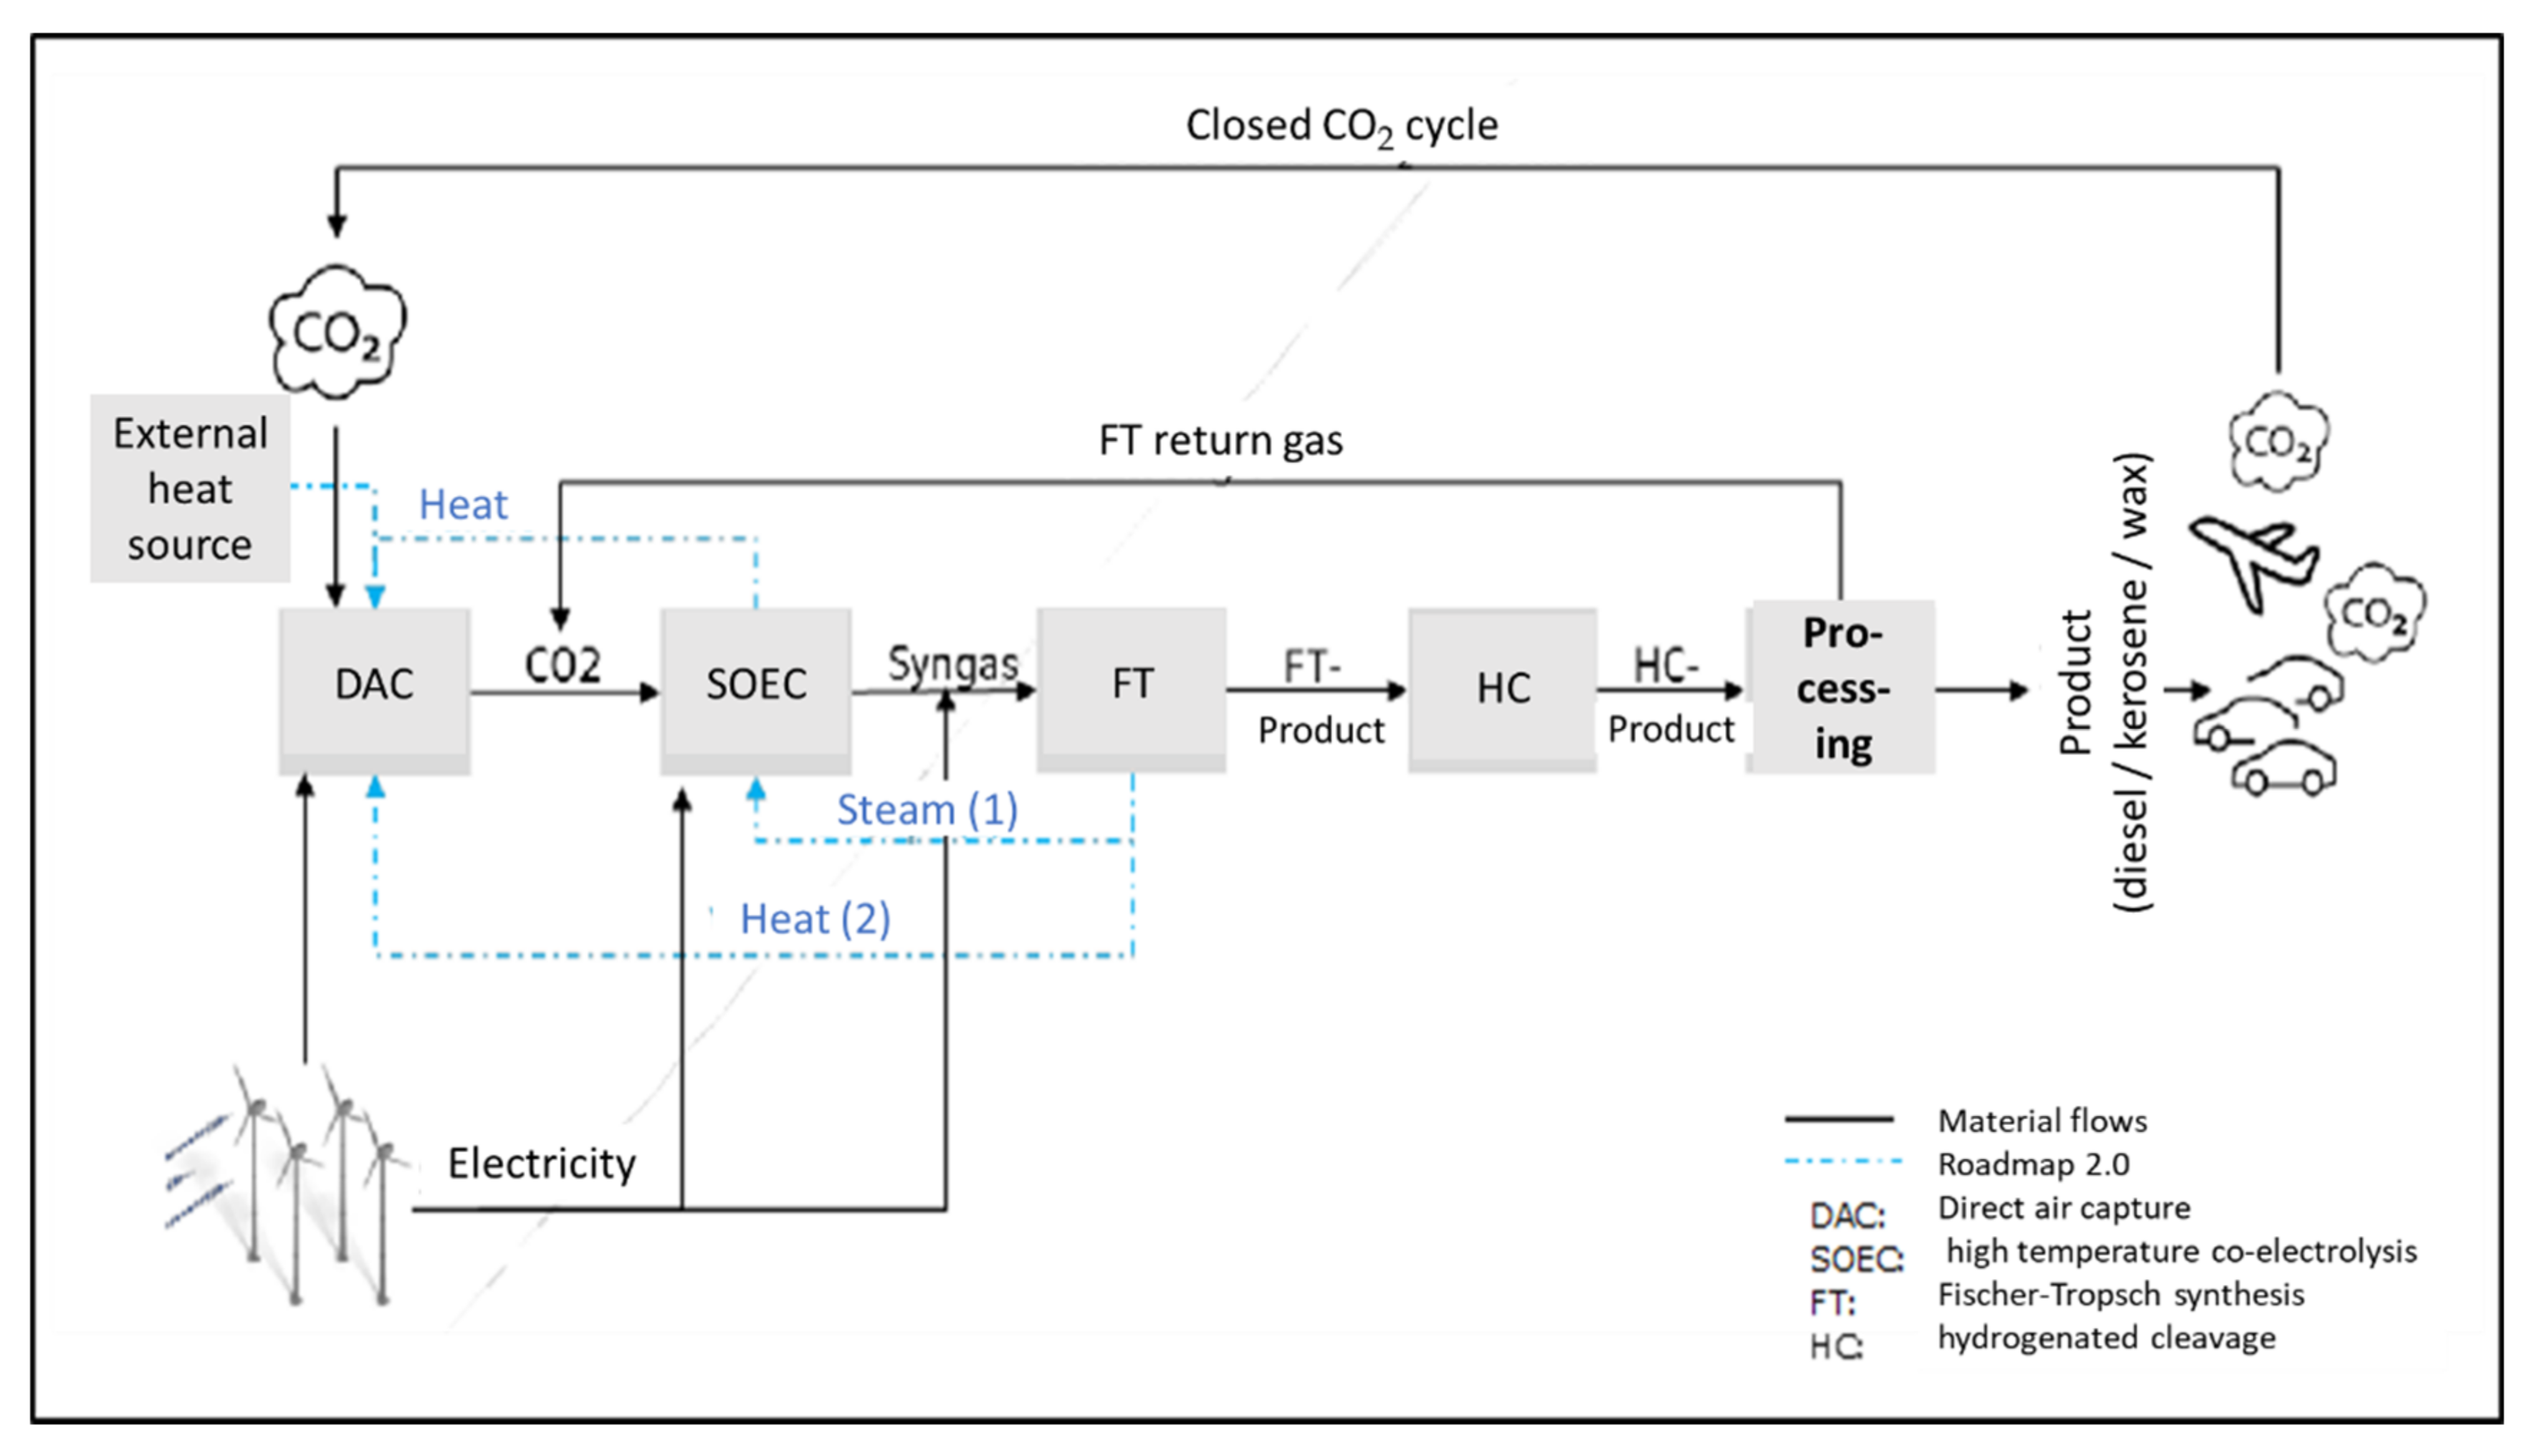
In principle, future CO2-neutral mobility can be achieved through battery-based electric vehicles or internal combustion engines, the latter being powered by synthetic fuels. With regard to agriculture, the electrification of tractors for fieldwork is currently impractical due to the large and heavy batteries required for this. In addition, due to the changing weather, it is difficult to plan the operating times of the tractors and very fast refuelling is necessary at peak times. Another possibility is the conversion of green electricity, water and CO2, the latter from the air, into synthetic fuels for outdoor work (cultivation of the fields). In a special electrolysis process, CO2 and water vapour are chemically split using electricity and the so-called synthesis gas, a gas mixture of hydrogen (H2) and carbon monoxide (CO), is generated. It serves as the basis for the Fischer–Tropsch synthesis, which uses it to form hydrocarbon chains of different lengths, comparable to fossil fuels. After a further processing step, the formed hydrocarbon chains can be used as a liquid synthetic fuel in conventional internal combustion engines. In addition, the advantages of fuels, e.g., high energy density and fast refuelling, can be utilized.
The pressure to develop new sustainable technologies comes not only from politics, but also from the market, i.e., processors and consumers. For example, the Arla Foods dairy carried out a climate check on dairy farms in 2020 in order to identify potential for CO2 savings. By 2050, the milk should be produced with net zero CO2 emissions and the payment could be based on the respective CO2 balance [3]. Using the example of a typical supplier to this dairy located in northern Germany, a survey dairy farm’s own production and storage of electrical energy and fuel is simulated and economically assessed in the present work. The survey dairy farm in question with a total usable agricultural area of 235 hectares and 150 dairy cows has an annual energy consumption of around 80,000 kWh of electricity and 35,000 L of diesel with an energy content of around 350,000 kWh. In 2008, the first PV system was installed on the roofs of the farm, and in 2019 another system was added to the dairy barn with battery storage; thus, the farm already supplied itself with electricity. The replacement of fossil diesel used in fieldwork, i.e., crops and grassland, with synthetic fuels from RE has not yet been resolved, and is the main research question in this article. The source of all RE for internal and external trade in agricultural operations is initially electrical power from wind and sun. Since the selected survey dairy farm uses typical production technologies, the results can also be scaled to other farm sizes.

1.1. Objective

The aim of the investigation is, on the one hand, to present the technical possibilities of self-production of synthetic fuels on the survey dairy farm and, on the other hand, to provide an economic assessment by determining the break-even point for the corresponding investments. The analysis of the synthetic fuel supply will be carried out in a first step as an isolated solution for a farm, whereby at the end we will discuss how economies of scale may be achieved through scaling or cooperative organization.
The technical energy system (mass model) includes the renewable electricity generation for the entire operation, the coverage of the electricity consumption in the cowshed, the battery storage, the production of synthetic fuels and an integration into the public electricity network. The aim is to use the model to simulate, as realistically as possible, an independent and regenerative energy supply to cover one’s own requirements for electricity and fuel. Fluctuations depending on the day and the season are taken into account for electricity at 15-min intervals and for fuel per calendar week for one year.
For the economic objective, the costs of the energy supply are determined in scenarios and the break-even for investments in RE generation is calculated by comparing it with the status quo (baseline). From this, the opportunities and risks of an operationally self-sufficient energy system are to be derived, the further development assessed and recommendations given as to how agriculture could contribute to climate protection through the use of synthetic fuels. In the conclusion, it will be explained to what extent individual farm solutions, or at least cooperative or cross-company approaches, would be necessary in order to achieve a CO2-neutral energy supply.

1.2. State of Research/Literature Review

The main task of agriculture is the production of high-quality and sustainable food to ensure that the population is fed. Due to its dependence on biological processes, which are influenced by weather, among other things, agricultural production is directly affected by climate change. In addition to adapting production processes to the effects of climate change in order to guarantee food security, politicians are also making demands on German agriculture to reduce the release of greenhouse gases in order to mitigate climate change. In contrast to the secondary and tertiary sectors, agriculture does not emit most of its emissions through the combustion of fuels for energy generation; the largest sources of emissions are agricultural soils and the digestion of ruminants. Here, no CO2 escapes, but the gases methane (CH4) and nitrous oxide (N2O) with the high CO2 equivalents of 23 and 296, respectively, do [4]. Agricultural transport, which is mainly powered by diesel engines, only emits around 10% of total agricultural CO2 emissions [5]. Replacing fossil diesel fuel with RE sources, such as synthetic diesel fuel, would make a significant contribution to achieving the politically prescribed reduction target of 20% of total agricultural emissions [6]. The fossil diesel consumption of engines can be reduced to four levels of action: machine efficiency, process efficiency, operator efficiency and alternative fuels and drives, the latter enabling CO2-neutral operation. Where appropriate, e.g., with farm loaders or mixer feeders, electric motors with their high efficiency and stepless control can also be used [7].
The introduction of technical innovations is driven by political initiatives and changed framework conditions, e.g., the EU Green Deal [8] and national initiatives accelerated or made possible in the first place. Renewable fuels can be found in the hydrogen strategy of the German federal government published in June 2020, whereby “green hydrogen” is intended to serve as an energy store, basic material for industry and as an essential element of sector coupling. The necessary market ramp-up has been supported by the CO2 tax since 2021 [9].
Synthetic fuels can be produced via different methods using different processes. This will not be discussed in more detail in this article. A good overview of green synthetic fuels, including hydrogen and natural gas, across the entire supply chain with regard to the production, transport, storage and end use of synthetic fuels is given by Rozzi et al. [10]. How thermochemical, electrochemical and photochemical processes are used in relevant technologies is also shown. One focus of research on power to liquid (PtL) is the production and use of green electricity-based fuels (e-fuels) in traffic. Among other things, the PtL process offers a possible solution for the decentralized production of synthetic kerosene. Meurer and Kern [11] describe the basic development of a simplified plant layout that addresses the specific challenges of decentralized kerosene production and shows the influence of the Fischer–Tropsch synthesis on the PtL process using a stationary reactor model. The results confirmed the decisive influence of the Fischer–Tropsch reactor on the PtL process. Samavati et al. [12] described the integration of the solid oxide co-electrolysis of water vapor and carbon dioxide using the Fischer–Tropsch process for converting electricity from renewable energy sources into Fischer–Tropsch diesel as a promising means of storing renewable energy. Among other things, the low capacity factor in view of the irregularities in the generation of electricity from renewable energy sources, and the economic efficiency compared to conventional diesel fuel were assessed critically. In addition, a new type of integrated system for the production of Fischer–Tropsch diesel from various renewable energy sources was proposed.
In a study by Özcan et al. [13], the thermodynamic and economic feasibility of using medium-temperature waste heat from an ironworks for the production of synthetic fuels through CO2 hydrogen separation was investigated. The process was presented, and the results showed that the methanol production plant used was able to achieve an efficiency of up to 19% under optimal conditions with methanol costs of $532 per ton and a daily methanol capacity of 3.69 tons and thus was competitive with other plants producing clean synthetic fuels. It should be noted that the configurations described here can be scaled for large amounts of carbon capture and utilization.
In addition to politics, companies are also taking measures for a future CO2-neutral economy. One example is the European dairy cooperative Arla Foods, which embarked on this path in 2019 and adopted a sustainability strategy for its dairy farming, with a long-term goal of achieving net-zero CO2 emissions by 2050. The goal by 2030 is for every dairy farm to reduce its emissions by 30%. To this end, there have been discussions with external advisory institutions in the dairy farm to identify areas for individual improvement. Of all the cooperative farmers participating in the program, 93% currently receive an allowance of 0.01 €/kg milk delivered [3].
An economic assessment of the effects of the proposed changes to the EU mechanisms for biofuel policy on agriculture using the example of Poland is given in the contribution by Gradziuk, P. et al. [14], wherein, among other things, the economic advantages of crop rotations with oilseeds, especially rapeseed, are emphasized. In the opinion of the authors, further arguments could be added to the main argument for the abandonment of the policy to promote the biofuel sector—in competition with the food industry—if a comparison of biofuel production with the production of synthetic fuels was made. Mention should also be made of the lower land consumption required for the production of synthetic fuels compared to, for example, biodiesel produced from rapeseed oil; here, even with open field photovoltaic (PV) systems, the land consumption is only 10% of a comparable vegetable oil production.
With the upcoming innovations in energy supply, intelligent power grids, also called smart grids, with their load and generation management play an important role at the technological level [15]. In smart grids, the individual components of the energy system are linked to one another using information and communication technologies. Information about generation, transport, storage, distribution and consumption is passed on to the network operators, which coordinate generation, network load and consumption with one another in a timely and largely automated manner. Well-coordinated components of intelligent power grids can help to reduce the expensive electricity demand in peak load times, to better utilize the power grids and to guarantee the security of the supply [16]. Microgrids are another important component of smart grids. Microgrids are small power supply systems that are equipped with decentralized energy generation systems in order to be able to supply themselves with the appropriate control technology without necessarily being connected to the transmission network, as is assumed for the model used in this investigation. Microgrids coordinate local energy generation and local energy consumption to help avoid peak loads and reduce losses [15]. There is now a comparable pilot plant for the production of CO2-neutral kerosene in Werlte, Emsland, Germany [17,18]. However, the annual output of this system is only sufficient for three flights from Europe to Singapore with return.

2. Methodology

2.1. Model Description

The agricultural operation from northern Germany under consideration aims to use regenerative energy to cover its electricity and fuel requirements in the future. The required electricity production and conversion steps will take place on farm. The energy system includes renewable electricity generation covering electricity consumption in the cowshed, battery storage for times with no electricity generation, the production of synthetic fuels and integration into the public electricity grid (Figure 1). The system for synthetic fuel production is not operated in a constant load range but adapts to the fluctuating electricity supply from wind and solar energy. Thus, the local energy system has the properties of a microgrid. For this planned energy system, a model that simulates the processes and electricity flows for one year was developed in the spreadsheet program Microsoft Excel (2016). An annual simulation was necessary because there are seasonal fluctuations in the generation of electricity from wind and solar energy, as well as in the fuel requirements of a farm. With the help of the simulation, the necessary electrical performance of the technical systems, e.g., for electricity or fuel production, was determined. Furthermore, the utilization of the technical systems and the current flows were shown, which finally allowed for an economic assessment. This included the calculation of the maximum capital expenses (CapEx) in a system for synthetic fuel production as well as the necessary operating costs, mainly in the form of renewable electricity.
In the model, electricity generation from wind power and photovoltaics was used as the starting point. The generation values were stored every 15 min for the whole year. The sizes of the individual components in the model could be changed with scaling factors, such that the model could be used flexibly for simulation or planning purposes. The current flow in the model, and thus in the energy system, took place in a cascade. This meant that the electricity generated flowed to the first stage of consumption, and the electricity that was not consumed there flowed to the next stage. On the first level, there was the dairy cattle shed with its electricity requirements for light, feeding, milking with a milking robot and manure removal (Figure 2). If the stable’s electricity requirements could not be met directly by its own power generation, the battery was discharged or the electricity was drawn from the grid.
The second point of consumption was the battery charge, in the case of excess electricity from the first stage. If the battery storage was fully charged, the unused electricity was made available for the next stage. The battery discharged when the renewable electricity generation could not cover the direct electricity consumption of the cowshed. The stored electricity was used exclusively to cover the electricity demand in the cowshed, on the condition that enough electricity was stored.
Farm vehicles, such as tractors, combine harvesters, forage harvesters, wheel loaders, trucks, etc., need fuel for fieldwork. The annual diesel demand in the example operation showed seasonal fluctuations (Figure 3) and was approximately 35,000 l (approx. 150 l/ha) with a calorific value around 350,000 kWh. This meant that the energy requirement was about three times as high as the electricity requirement in the cow barns (about 80,000 kWh). At the baseline, the annual costs for energy from fossil resources amounted to 24,128 € for electricity purchase (market price: 0.30 € per kWh) and 45,066 € for diesel purchase (market price: 1.25 € per l). In the break-even calculation for the scenarios with renewable resources, the sum of these two amounts, 69,194 €, should be matched by the value search of the maximum investment for the synthetic fuel production plant.
The self-generated electricity that did not flow off at the stages of direct consumption and battery charging was used for synthetic fuel production. The input of the technical system for the production of synthetic fuel was electricity in kWh. The output was the synthetic fuel produced, the unit of which is also given in kWh. The fuel was temporarily stored in a fuel store until it is needed. The model envisages that only as much energy as is necessary is converted into fuel and that the system is utilized as evenly as possible. In order to guarantee this, the fuel requirements of an agricultural farm with arable and fodder cultivation were calculated in the model for the individual weeks of the year.
Only when the power generation exceeded the sum of the power consumption from the cowshed, battery charge and fuel production, the surplus was fed into the public power grid. Electricity purchases from the public grid only occurred if the power demand of the cowshed could not be covered by renewable power generation and battery discharge. In the model, electricity purchases were not used for battery charging or synthetic fuel production. Downtimes or maintenance times for the entire technical equipment of the energy system were not taken into account.
In addition, the flexible electricity consumption for fuel production can reduce the disadvantages of renewable electricity generation from wind and PV, increase energy efficiency and lower overall energy system costs. Wind turbines and PV systems do not generate electricity evenly, and rather are dependent on changing environmental influences. This means that power generation cannot be adapted to power consumption. The electricity generated is used most efficiently when it is consumed directly, as there are no storage or conversion losses. In the energy system described, the constant electricity consumer benefited from the additional flexible electricity consumer, the production of synthetic fuels, which adapted to the fluctuating electricity generation. The flexible consumer has an additional total electricity requirement per year. In order to cover this, a greater power generation capacity must be installed. This higher output from RE systems could cover the electricity needs of the constant consumer, the cow barn, even when there was less sunshine or wind, thereby increasing the degree of self-sufficiency of the energy system and reducing purchases from the grid, including its costs. However, a higher degree of self-sufficiency is not bought at a higher price, since when more electricity is generated than is consumed by the constant consumer, the generation system is not throttled but can be used sensibly with the flexible consumer (synthetic fuel production). Due to these relationships and interactions in the energy system, the required energy generation capacities cannot be precisely assigned to the individual consumers. An individual consideration cannot take into account the advantages of the entire energy system, which is why the economic evaluation (Section 2.4) takes into account the entire energy cost.

2.2. Technical Description of Synthetic Fuel Production

The technologies of PV and wind power plants as well as the batteries used in agriculture, including their optimal combination for economic efficiency, have already been presented elsewhere [19]; thus, only the technical components for synthetic fuel production are explained below. For the model calculation in this work, it was assumed that the farm invested in a plant for the production of synthetic fuel. This was decentralized at the place of power generation, and thus on the farm premises. The carbon necessary for production was obtained from the air. A facility for the production of CO2-neutral liquid fuels is being tested on the premises of the Energy Lab 2.0 at the Karlsruhe Institute of Technology (KIT) [20,21].
In the container system (Figure 4), up to 10 L of fuel can be produced per day in an integrated process chain. The process chain, with a daily output of approx. 200 l, is being created in the ongoing second phase of the Kopernikus project at KIT’s Energy Lab 2.0. The process chain has not yet been fully established, although the synthesis facility is already in place [22]. Owing to its modular design, the process chain is scalable for future industrial use (Figure 5).
The company Climeworks [23] supplies the direct air capture process to filter CO2 as a necessary raw material from the atmosphere. For this processing step, among other things, electricity is required to suck in ambient air. The air is passed through a special filter that traps the CO2 molecules. Heat is also required to release the CO2 molecules. The filter is heated to 95 °C to obtain pure CO2.
The next step is the high-temperature co-electrolysis from Sunfire [24]. Water (H2O) and carbon dioxide (CO2) serve as raw materials. Energy is required in the form of heat and electricity. Water vapor is generated using heat and fed into the electrolysis system together with CO2. An electrolytic cell consists of a cathode, an anode and a membrane in between. When electricity is applied, the water vapor and carbon dioxide are split into hydrogen and carbon monoxide at the cathode. The gas mixture of H2 and CO is called synthesis gas and is the starting material for synthetic fuels and other substances in the chemical industry. The resulting oxygen ions pass through the membrane to the anode and become oxygen molecules.
In the third processing step, the Fischer–Tropsch synthesis takes place in a micro-structured reactor from Ineratec GmbH [25]. Here, hydrocarbons with different chain lengths are formed from the synthesis gas. The reaction takes place on the catalyst; the innovative internal structure of the reactor (microstructuring) enables the efficient extraction of the heat of the reaction in the form of steam. The released heat is dissipated and can be used in high-temperature co-electrolysis.
The resulting product mixture, made up of hydrocarbon chains of different lengths, still needs to be processed in order to be used as a synthetic fuel. This is because the short hydrocarbon chains are gaseous at ambient temperatures while the long chains remain in a solid state.
A reactor for converting the short chains to long hydrocarbon chains was developed by the KIT Institute for Micro Process Engineering. In the so-called hydrogenative cleavage, or ‘hydrocracking’, the long hydrogen chains are split with the aid of hydrogen and a catalyst. The following isomerization ensures the formation of the isomer; the resulting hydrocarbon chains are shorter and partially branched. The properties of the catalytic converter and the operating conditions allow the product range to be controlled towards the desired fuel. Subsequent distillation can produce gasoline, diesel or kerosene [26].
The decentralized container system described for the production of synthetic diesel can store approximately 57% of the electricity used in fuel. Ninety percent of the carbon extracted from the air is found in the liquid end product. In contrast to fossil fuels, synthetic fuels do not contain any aromatics or sulfur compounds, and thus burn more cleanly.
Figure 5. Schematic representation of the provision of synthetic diesel [27].
Energies 15 01156 g005

2.3. Investment Needs

Individual components of the energy system, especially the energy generation systems, have already seen widespread use as proven technologies, and their investment costs are known. In order to finance the capital requirement, a loan in the amount of the capital expenses (CapEx) should be taken out on the capital market. In addition to the capital expenses (CapEx), Table 1 also shows the assumed useful life, the interest rate for financing and the annual costs for maintenance and servicing. For PV systems, these amount to between € 800/kWp and approximately € 1000/kWp; for small wind power systems, the costs are approximately € 2000/kW [28,29]. A useful life of 20 years and financing at an interest rate of 2% were assumed for all devices. The annual costs for maintenance and servicing are also listed in Table 1 as a proportion of the acquisition costs.
The plant for synthetic fuel production (Figure 4) in Karlsruhe, Germany only exists as a pilot plant. Another pilot plant for the production of synthetic kerosene was put into operation in October 2021 in Wertle, Emsland, Germany [17]. The range cited in the literature for the level of capital expenses (CapEx) ranges from € 3840 to over € 4000/kW for the price level in 2020; a slight decrease is expected for 2050, and the estimates from Frontier Economics (2018) [29] amount to between € 2335 and € 3235/kW (Table 2).

2.4. Cost Calculation and Break-Even Calculation

The farm must cover electricity and fuel requirements and would like to ensure this independently from renewable energy sources. The advantages described in Section 2.1 for the efficient use of wind and solar energy by means of a (daily) constant electricity consumer, the cow barn, and an electricity consumer that is flexible in the course of the year, the synthetic fuel production, cannot be separated; therefore, the energy costs of the company for electricity and fuel requirements are summarized in the following economic assessment. The aim is to generate the required resources (diesel and electricity) on-farm. In the break-even analysis carried out below, the self-generated diesel/electricity should only be as expensive as buying conventional fossil fuels. Therefore, the maximum capital expenses (CapEx) for a synthetic fuel production plant will be determined.
Due to the advantages described in Section 2.1 of the inseparable interactions of an energy system that includes renewable electricity generation from wind and solar energy along with a constant electricity consumer and a flexible electricity consumer, the economic assessment took into account the total energy costs of the agricultural operation for electricity and considered fuel consumption. For the new energy system, the annual costs (Cy) for investments in renewable electricity generation, battery storage and synthetic fuel production were approximatively calculated as depreciation plus interest costs and other operating expenses (maintenance, upkeep and repairs, etc.) as follows:
C Y = Depreciation   +   Interest   costs   + Operating   Expenses   OpEx
where Cy is the yearly cost of an investment, depreciation is calculated as CapEx/N, N is service life in years, i is the interest rate, the annual interest term is calculated as CapEx*i/2 and OpEx is the annual operating expenses (maintenance, repairs, insurance, etc.).
In addition to the annual costs of the investments, annual expenses for the purchase of electricity and fuel were also included in the cost-performance calculation, as well as expenses for the Renewable Energy Sources Act (RESA) surcharge of 0.065 €/kWh for electricity consumption, which is currently 40% of the RESA surcharge. The amendment to the Renewable Energy Sources Act in 2021 states that there should no longer be an RESA levy for the production of hydrogen from RE sources [31]. In particular, for the system used for the production of synthetic fuel, no operating costs for electricity were taken into account, as this was operated with electrical energy from the farm’s own PV systems or wind turbines. The annual earnings (Ey) for the sale of electricity, which was fed into the public electricity grid in the event of a surplus, were taken into account as output. The result was the maximum annual costs available for synthetic fuel production in order to have the same costs for the entire system as for a fossil fuel purchase and complete (coal-based) electricity purchase from the public grid (Equation (2)):
m a x . C y synth .   fuel = C y fossil C y PV ,   wind ,   battery ,   RESA ,   el . purchase + E y el
where Cy is an abbreviation for yearly or annual cost of several variables, and “max.Cy(synth. fuel)” is the term for the maximal annual costs for synthetic fuel production, a balance of all yearly costs excluding annual costs for electricity that are RE; “Cy(fossil)” is the term for the annual purchase of electricity from the public grid (coal-based) plus the annual costs for fossil fuel purchase, which portray the status quo without RE; “Cy(PV, wind, battery, RESA, el.purchase)” is the term for the annual costs of producing electricity with PV systems and wind turbines, the storage of electricity in batteries, the RESA surcharge and the residual purchase of electricity; “Ey(el)” is the term for annual earnings from surplus electricity sales.
The economic objective was to determine the break-even point at which the costs of synthetic fuel production would correspond to the previous costs of fossil diesel (Equation (3)). Therefore, the variable value (the capital expenses (CapEx) of the fuel production plant) was calculated such that the resulting annual costs Cy for synthetic fuel production (Equation (1)) equalled the maximal Cy for synthetic fuel production (Equation (2)):
Cy for synth. fuel production (eq. 1) = max.Cy(synth. fuel) (eq. 2)
The breakdown of the total costs for energy consumption on the farm in cost per kWh of electricity consumed without fuel production and per kWh of fuel produced is calculated as follows. The annual costs of the total self-generated electricity (Cy (el. generation)), is the amount of the annual costs of producing electricity with PV systems and wind turbines (Cy(PV, wind)) minus the annual earnings from surplus electricity sales (Ey(el)) (Equation (4)):
C y el .   generation = C y PV ,   wind     E y el
The proportion of electricity used for synthetic fuel production (share el. synth. fuel) can be measured directly in the system. The share of the primary electricity consumption (share direct used el.) is the residual from the total electricity generation on the farm minus “share el. synth. fuel” (Equation (5)):
share   direct   used   el . = total   el .   generation     share   el .   synth .   fuel
Finally, the calculation of the costs per kWh for self-generated electricity (CkWh el) and for synthetic fuel (CkWh sy. fuel) is calculated according to Equations (6) and (7):
C k W h   e l . = C y e l .   g e n e r . ) * s h a r e   d i r e c t   u s e d   e l . + C y b a t t e r y ,   R E S A ,   e l . p u r c h . annual   electricity   consumption   in   kWh
C k W h   s y .   f u e l = C y e l .   g e n e r a t i o n ) * s h a r e   e l .   s y n t h .   f u e l + C y s y n t h .   f u e l annual   synthetic   fuel   production   in   kWh

3. Different Scenarios

The establishment of a farm’s own CO2-neutral energy supply depends not only on the technical options described and the cost-price ratios, but also on the farm’s capacities and a building permit. In order to be able to map different operational starting situations on the one hand, and possible future price developments on the other hand, two scenarios for different technical solutions for renewable electricity generation were created. In Scenario 1, electricity was generated with a PV system on the roof and a wind turbine. Scenario 2 only produced the required electricity with PV systems, but this time on the roofs (rooftop solar) and in the open fields (offsite solar) of the farm. Furthermore, sensitivity analyses for the current and rising energy prices for electricity and diesel were simulated. Both scenarios were compared with the status quo, the baseline where energy is gained exclusively from fossil resources, which causes annual costs of 69,194 € (Table 3).
In Scenario 1, investments were made in addition to the first installed PV system on the roof (125 kWp) in the form of a small wind power system (250 kW) and synthetic fuel production (210 kW) (Table 3). Here, the investment in a battery (2 kW) was also part of the optimisation results; however, this turned out to be negligible with existing wind turbines due to its small effect, as previously shown [19]. In addition to the small wind turbine, participation in a large wind power plant was also examined, as the electricity production costs were only half as high there as with a small wind power plant. For reasons of space, however, this variant is not presented in detail and is rather taken up in the conclusions. For all scenarios, with increases in the market prices for electricity from 0.30 €/kWh to 0.45 €/kWh and for diesel from 1.25 €/l to 2.00 €/l, the profitability of one’s own energy supply should increase.
The capacities of Scenario 1 were derived as follows: The survey dairy farm has an annual fuel requirement of 350,000 kWh, which is to be covered by its own fuel generation. In order to be able to compensate for possible annual fluctuations in the production of solar and wind energy of +/− 15%, a safety reserve of the same amount was taken into account. Therefore, it was assumed that a fuel requirement of 402,500 kWh had to be covered. With an efficiency of converting electricity into synthetic fuel of 60%, electricity generation of approximately 670,000 kWh per year was necessary. Including the direct self-consumption of the cowshed and the battery charging, an annual total electricity generation of 742,000 kWh was required. In order to provide renewable electricity, a small wind turbine at the site with an output of 250 kW and a roof PV system with an output of 125 kWp were required. For fuel production in Scenario 1, a maximum electrical output of the system of 210 kW was necessary. The use of a battery storage system was also examined in Scenario 1. Since the battery size determined was only 2 kWh, this component is not commented on here.
In Scenario 2, the electricity was produced exclusively by PV systems. Since a maximum output of 200 kWp could be installed on the roof of the cowshed, the additional output required was installed in open fields near the barn. For better comparability of the different scenarios, the capacity of the PV systems was chosen in such a way that an annual total generation of 742,000 kWh was achieved in each case. The installed capacity was 200 kWp on the roof and 520 kWp on open fields. The usable storage capacity of the battery system was larger at 105 kWh. The fuel generation system had to have a maximum power consumption of 385 kW in order to convert approximately 600,000 kWh of electrical power into synthetic fuel per year. The installed electrical output of the systems in Scenario 2 was higher compared to the Scenario 1, since the same energy requirement had to be covered with fewer full load hours, due to solar energy that is only available during the day.

4. Results of the Model Simulations

The results show the technical and economic differences between the two scenarios explained above: electricity production with wind turbines and PV systems (Scenario 1) or production only with PV systems on the roofs and in open fields (Scenario 2).

4.1. Generation and Consumption of Electricity and Synthetic Fuel

The amounts of electricity that are required to supply the survey dairy farm with electricity and fuels from renewable sources are shown in Table 3. In addition, in both scenarios, around 10,000 kWh (1.4% to 1.6% of total electricity) was drawn from the public power grid to cover the power consumption of the cowshed in times when there was no self-generation of renewable power. Thus, the degree of self-sufficiency of the cowshed was around 87% in both scenarios. 
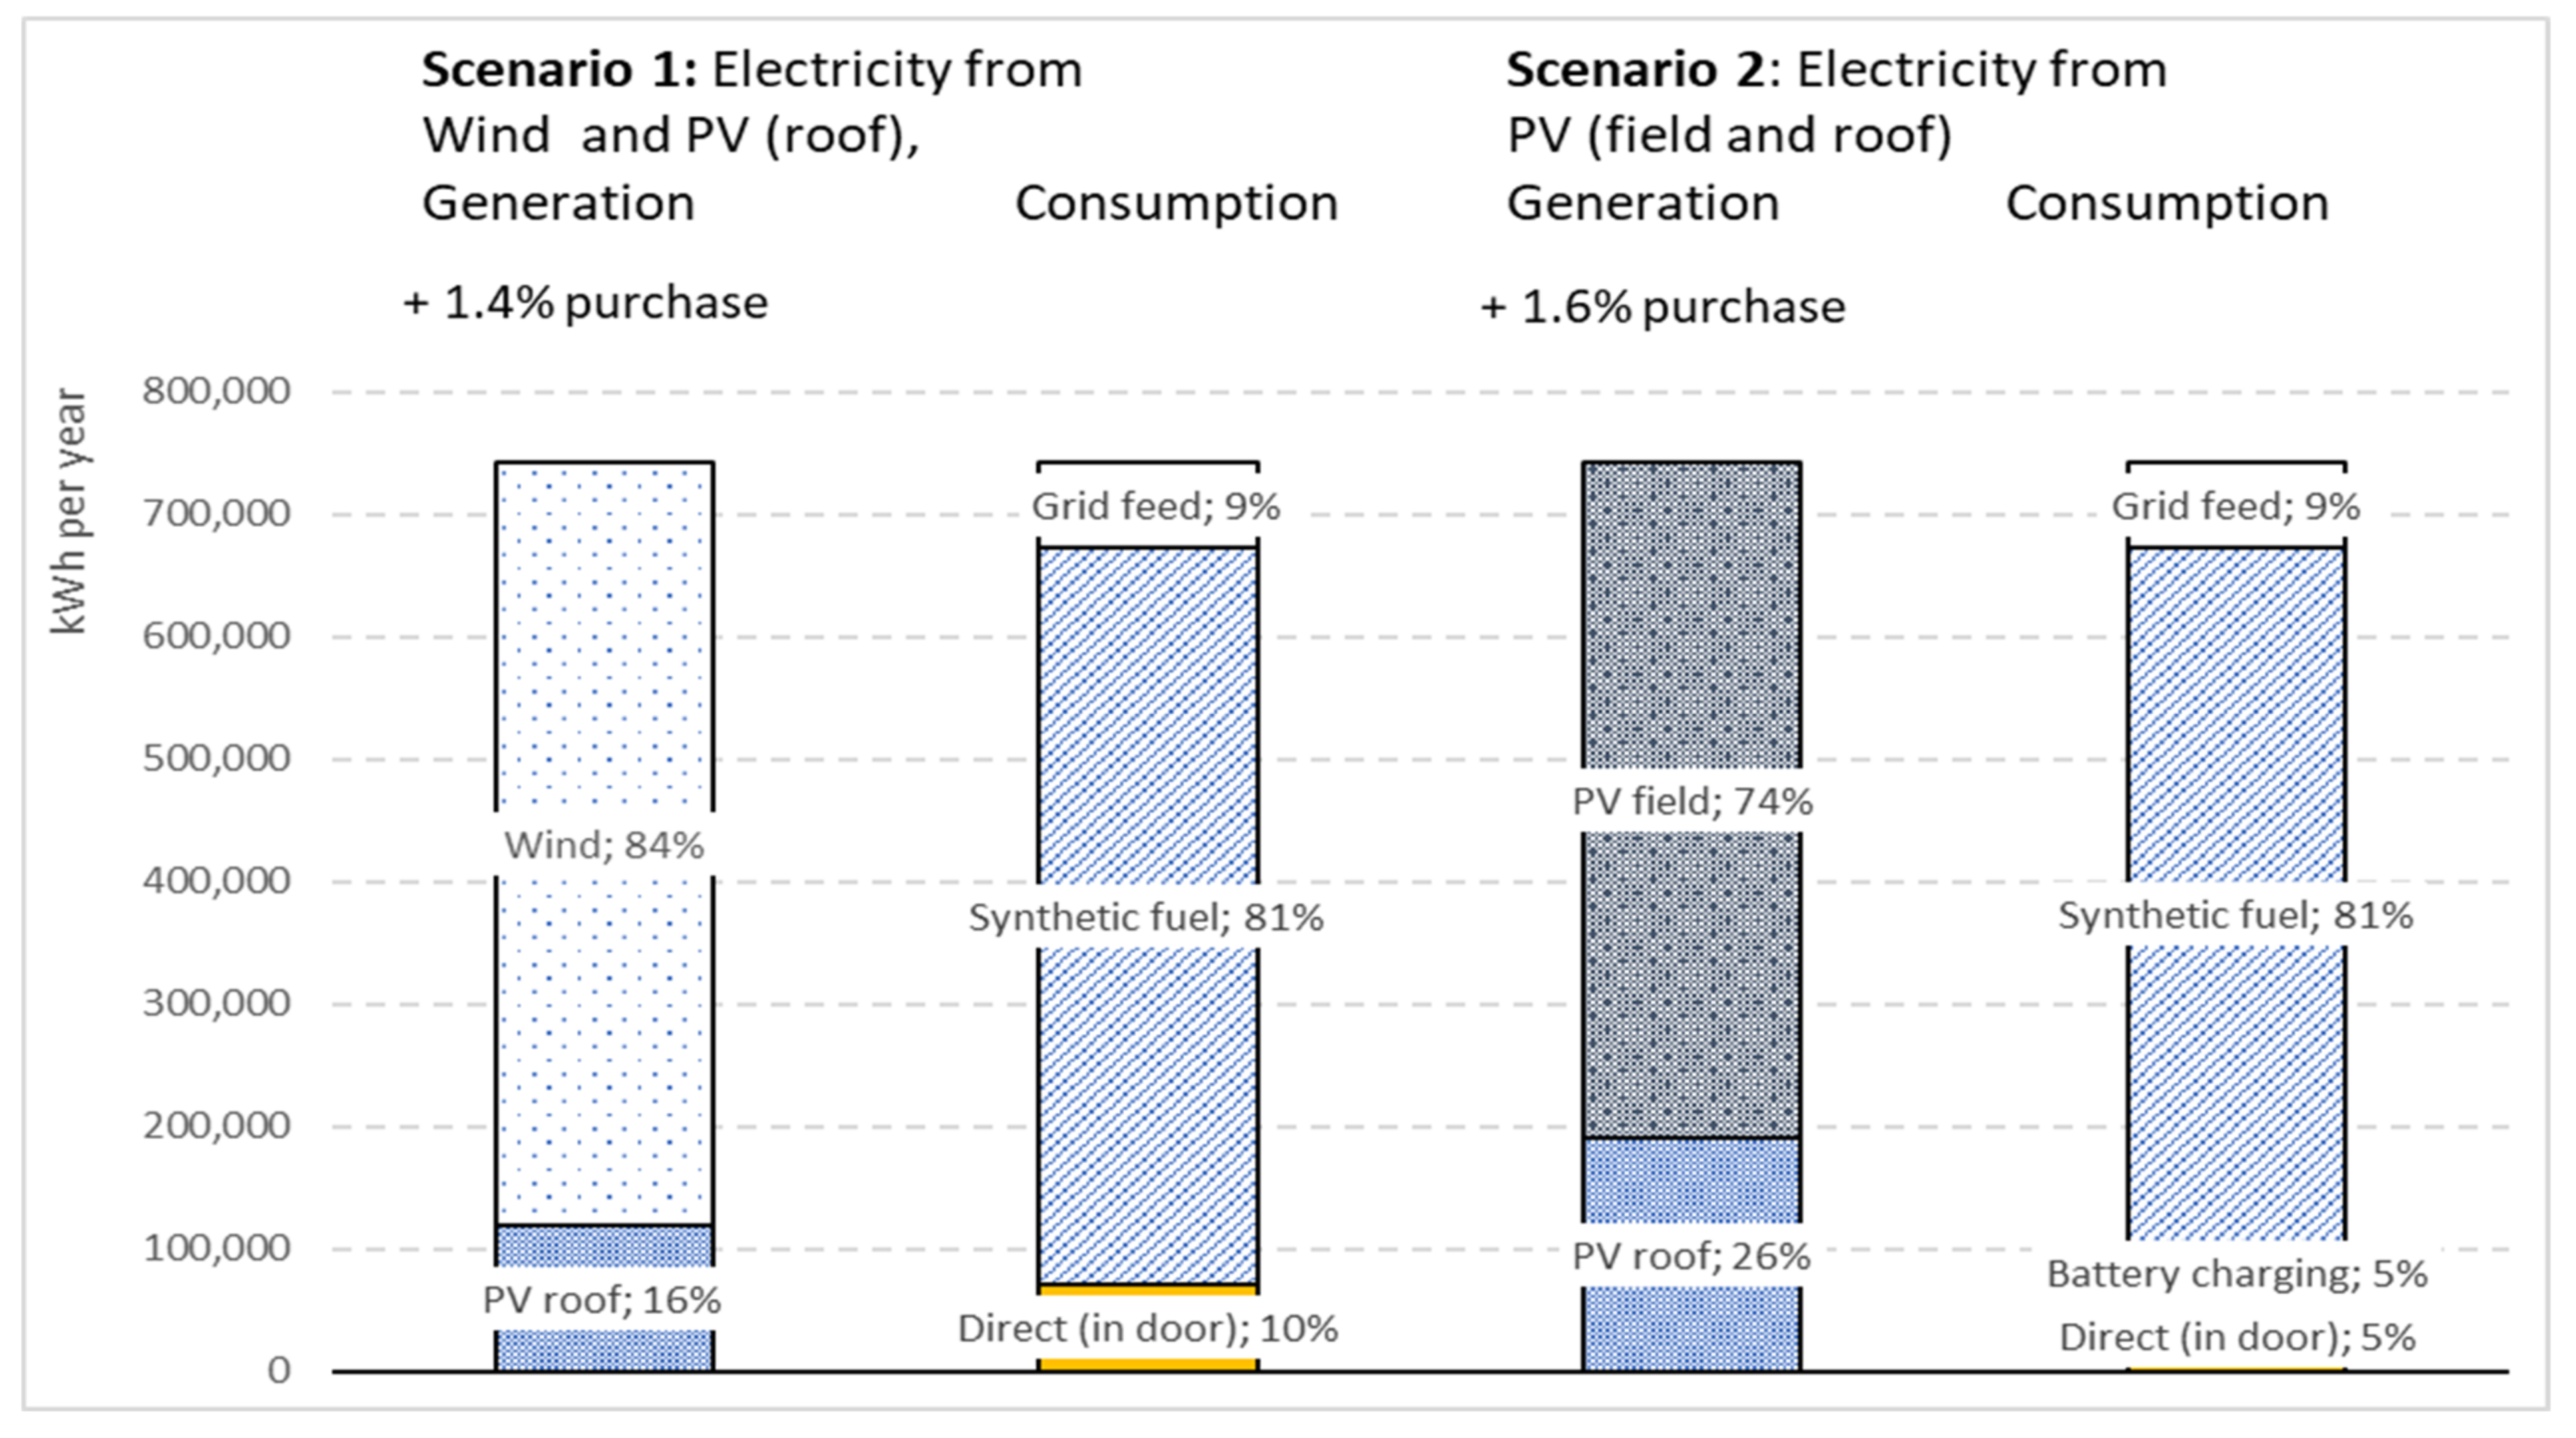
Figure 6 shows the percentages of generation and electricity consumption. Most of the electricity generation was carried out by the wind turbine, with 84% in Scenario 1, and the open field PV system with a share of 74% in Scenario 2. The additional electricity was generated by the PV system on the roof.
The use of the electricity was the same in both scenarios, with the grid feed-in at 9%, the synthetic fuel production at 81% and the electricity consumption in the indoor economy at 10%, mainly in the cowshed. In Scenario 2, the latter was divided again into electricity that was directly consumed (5%) and that which was temporarily stored in the battery with (5%) (Figure 6).
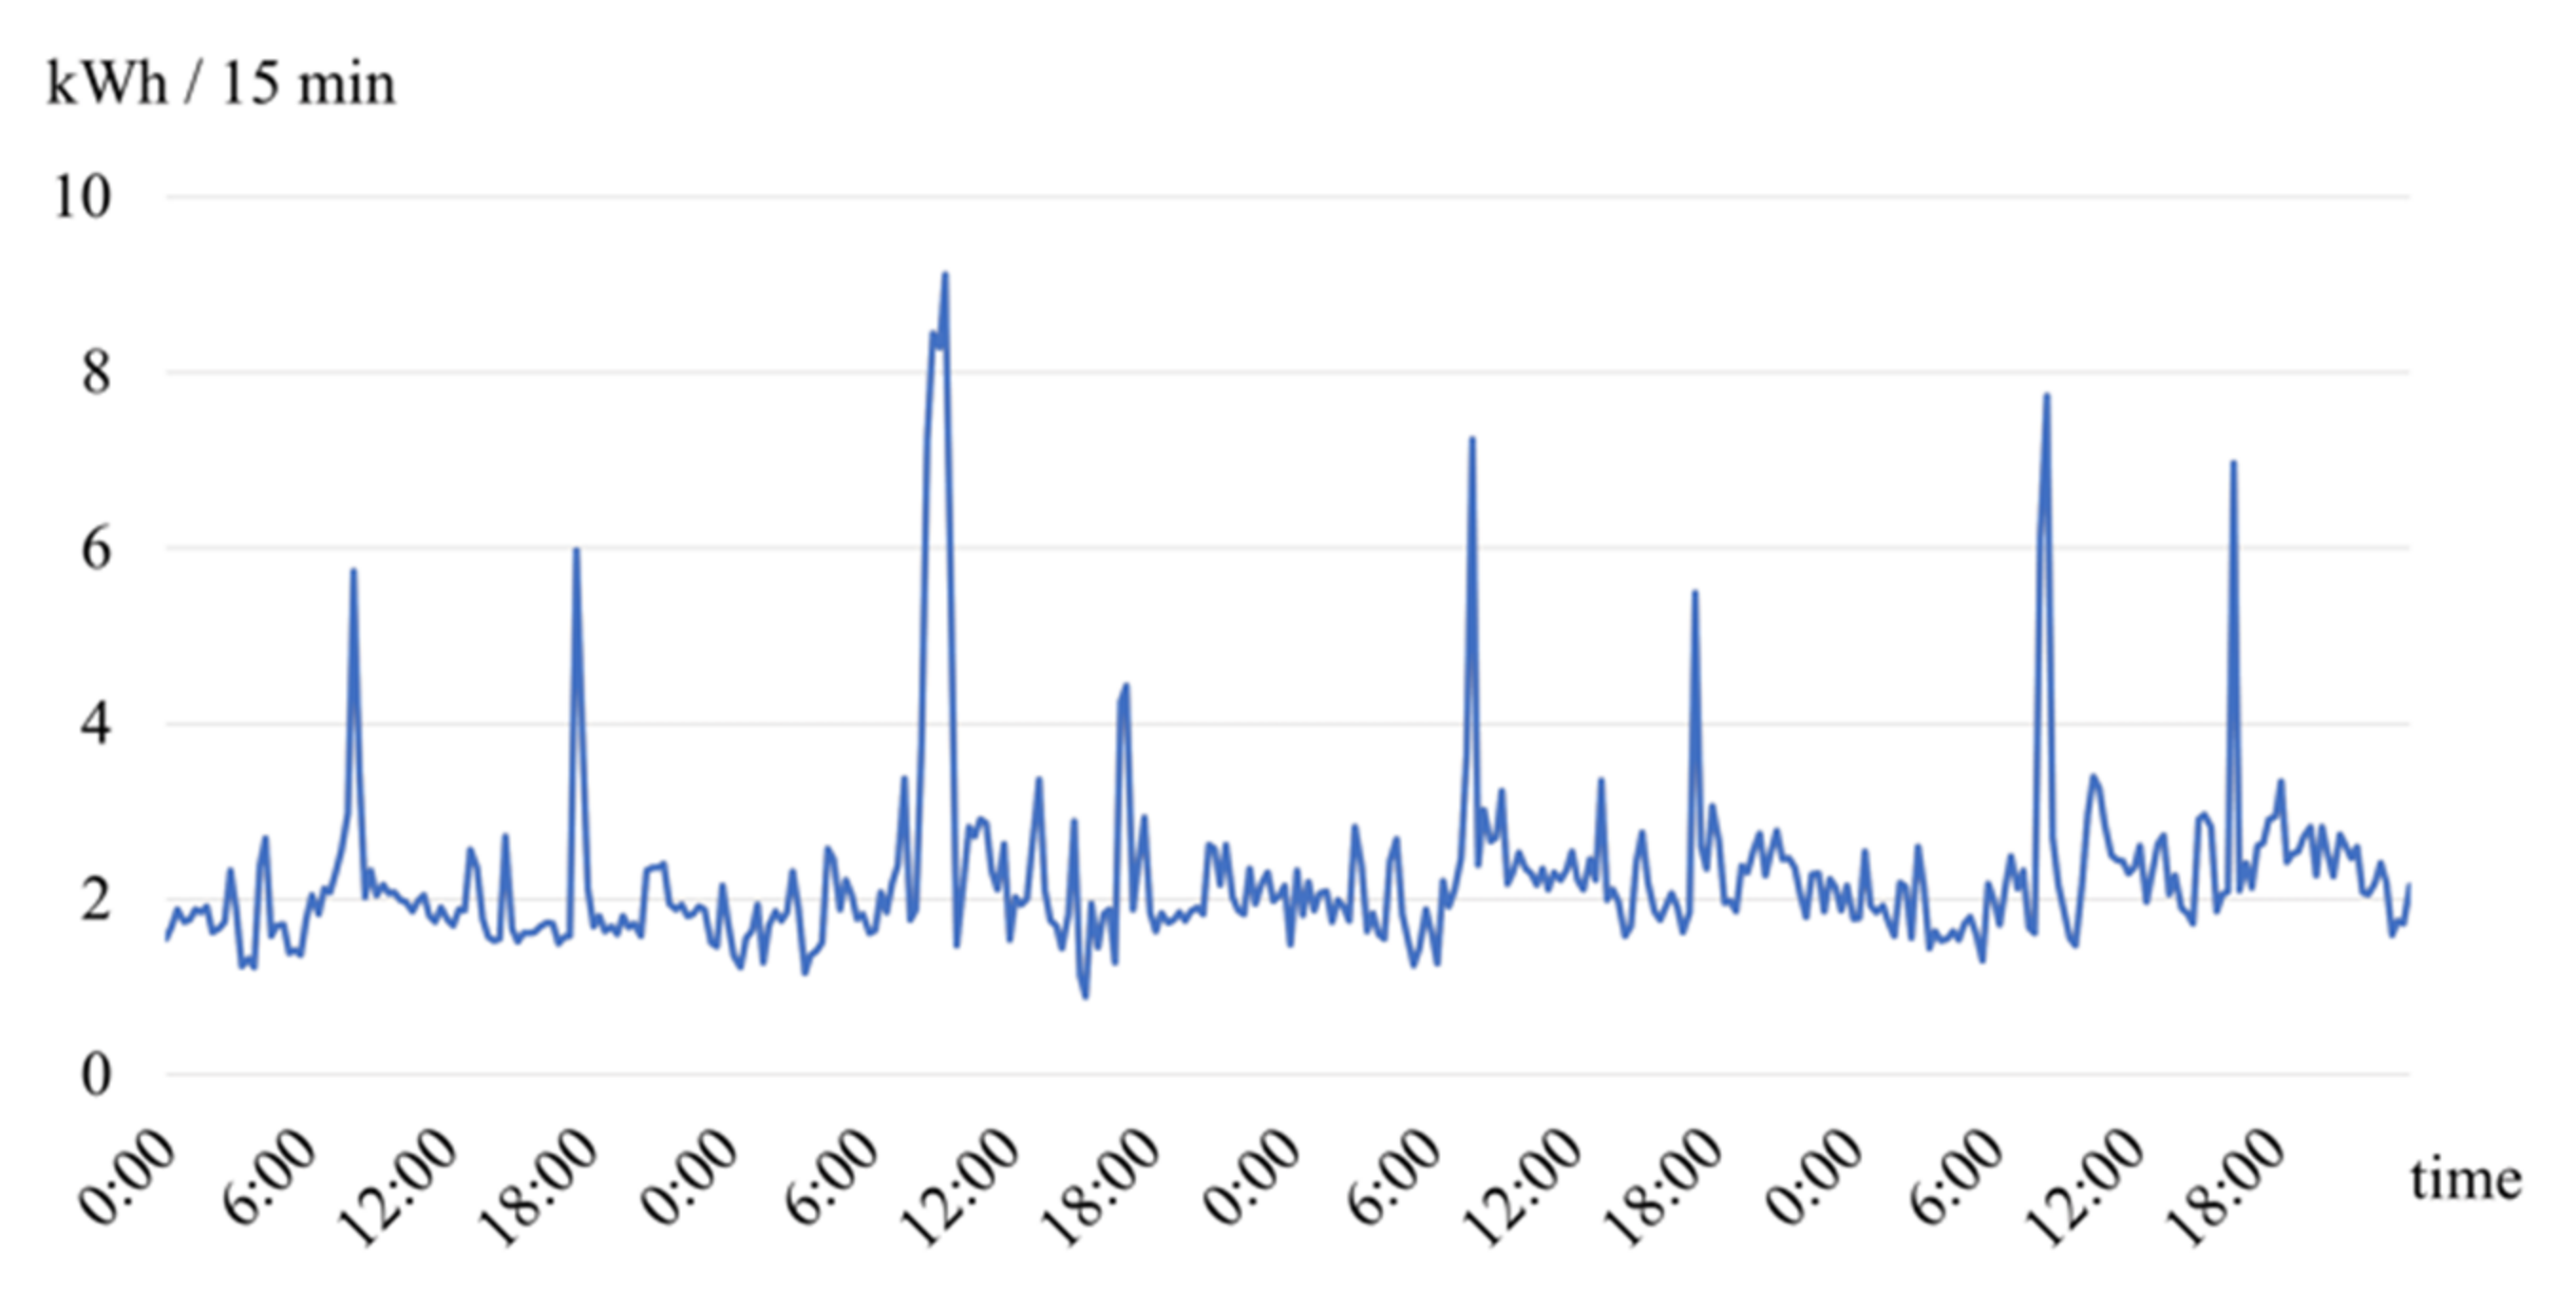
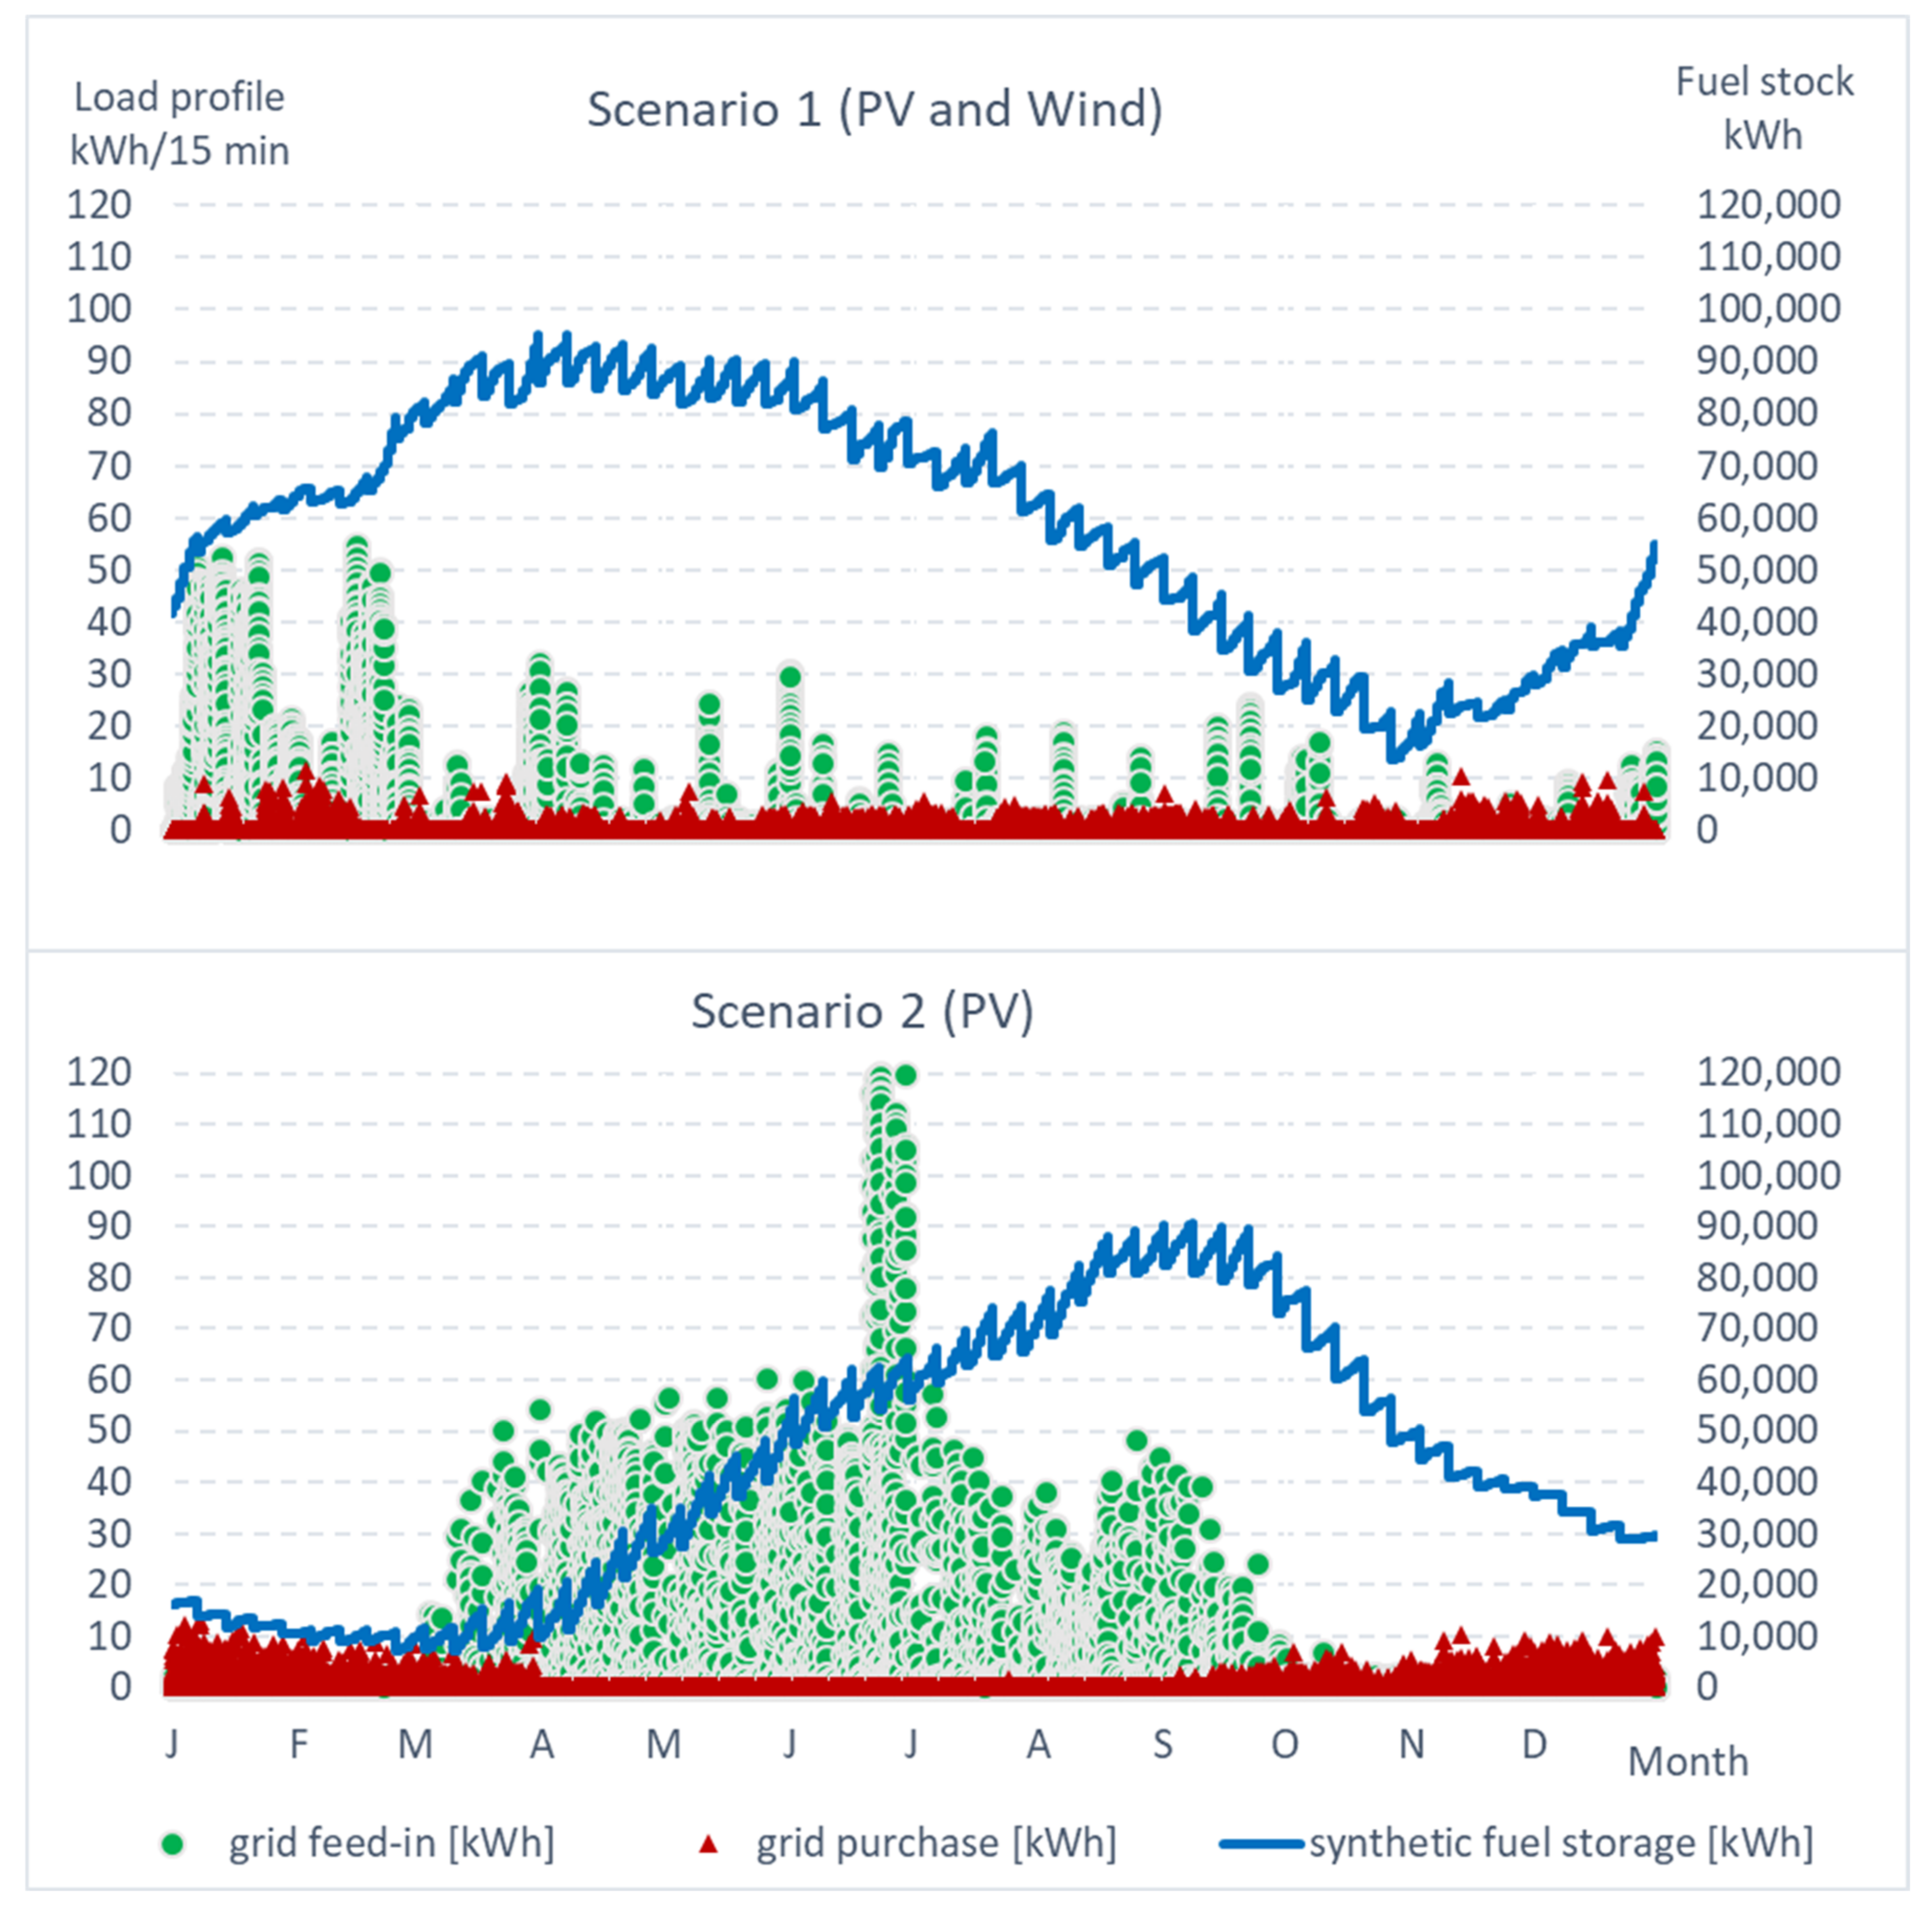
The influence of the various properties of the power generation systems on the fuel store, the grid feed-in and the grid purchase in the energy system over the course of a year is shown in 
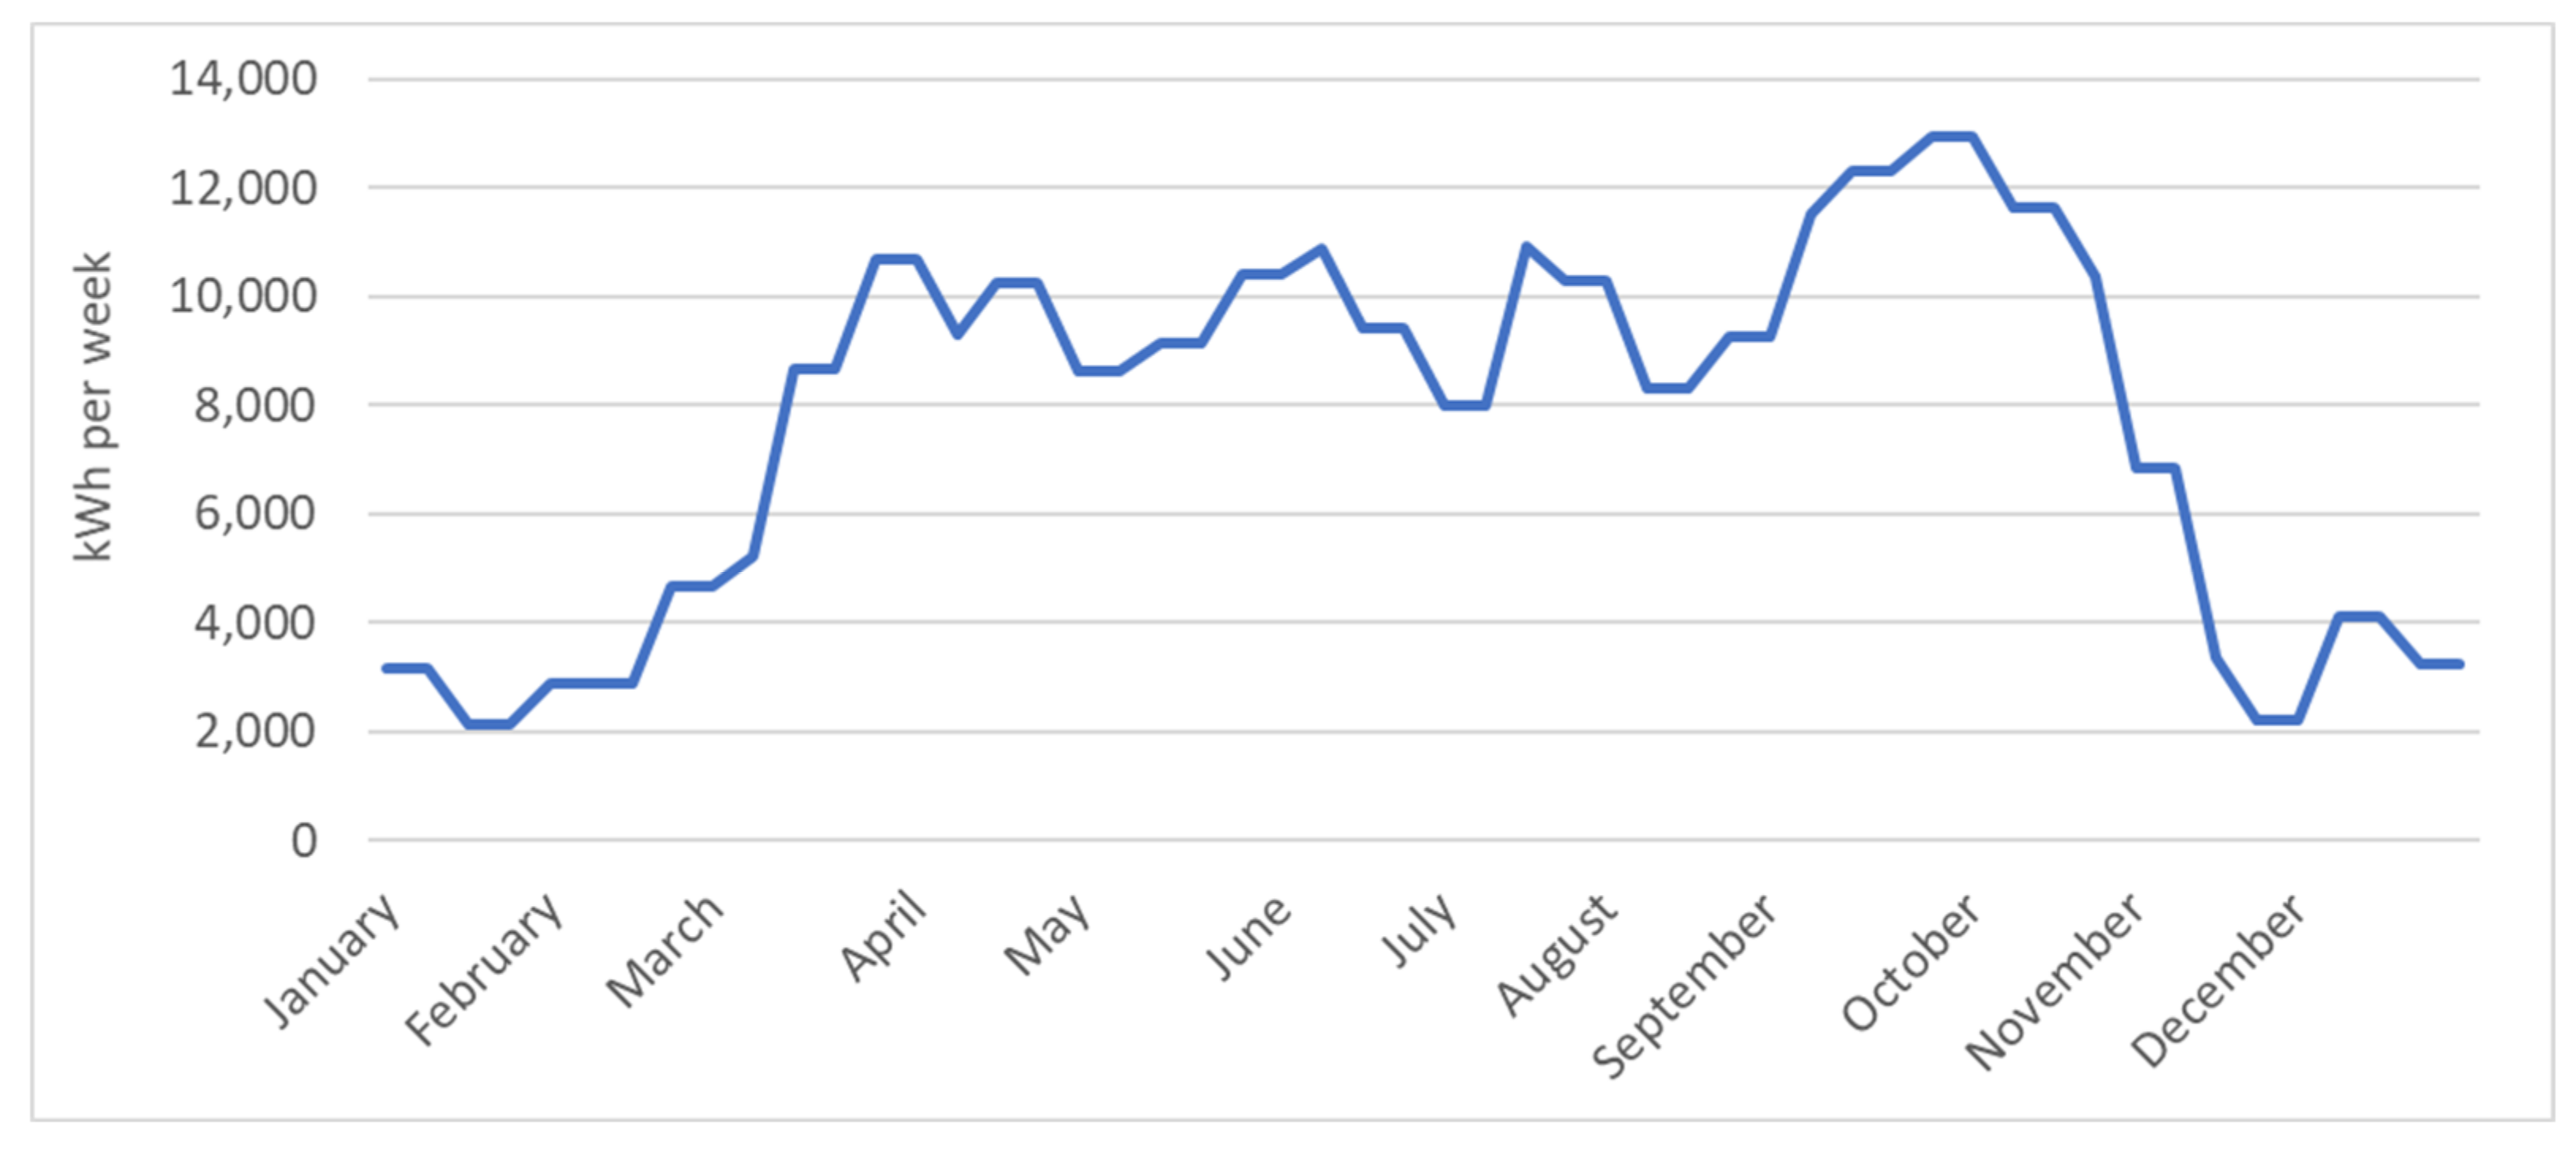
Figure 7. The blue line shows the current synthetic fuel inventory for Scenario 1 (PV and wind) and Scenario 2 (PV). Over the course of both curves, the weekly fuel consumption for tractors for fieldworks was observed as a more pronounced decrease in the inventory, which was built up again in the following days due to the synthetic fuel production at the farm. Diesel consumption was at a consistently high level from March to October (Figure 3).
The production of electricity in the summer months, which was restricted in Scenario 1 due to the lower amount of wind, along with the simultaneous high fuel consumption, led to a constantly dwindling fuel inventory from April to November. In December, the inventory rose sharply again, such that electricity was fed into the public grid at the beginning of the year, since the target minimum stock of the fuel store had been reached. The grid purchase was similarly low over the entire year. It became clear that in Scenario 1, a fuel reserve had to be built up over the winter months in order to have enough diesel in storage for the maize harvest at the end of autumn.
In Scenario 2, the increased electricity production of the PV system in the summer months led to an increase in fuel stocks, even with the increased consumption of diesel at the same time. It turns out that a fuel reserve had to be created over the summer months in order to be able to start the fieldwork at the beginning of March. The grid feed-in load profile of approximately 50 kWh/15 min was due to the peak load times of the PV system over midday. The electricity generated exceeded the installed consumption of synthetic fuel production. In July, the feed-in was more than twice as high, as the fuel production system did not consume any electricity. The fuel store was sufficiently full at this point. From April to September, there was a small amount of electricity drawn from the grid due to the battery storage system. In the winter months, there were higher purchase shares due to the reduced electricity production from the PV systems.
The lower load hours of a PV system per year not only require a larger battery storage system, but also energy generation and energy conversion systems if a similar amount of energy is to be used over the course of the year (Table 3). The power generation systems in Scenario 2 (PV) had an output of 1210 kW, almost twice as high as in Scenario 1 (PV + wind) with 587 kW (Table 3). There were similar differences in the installed capacity between the systems for synthetic fuel production.

4.2. Energy Supply Costs and Break-Even for Investments

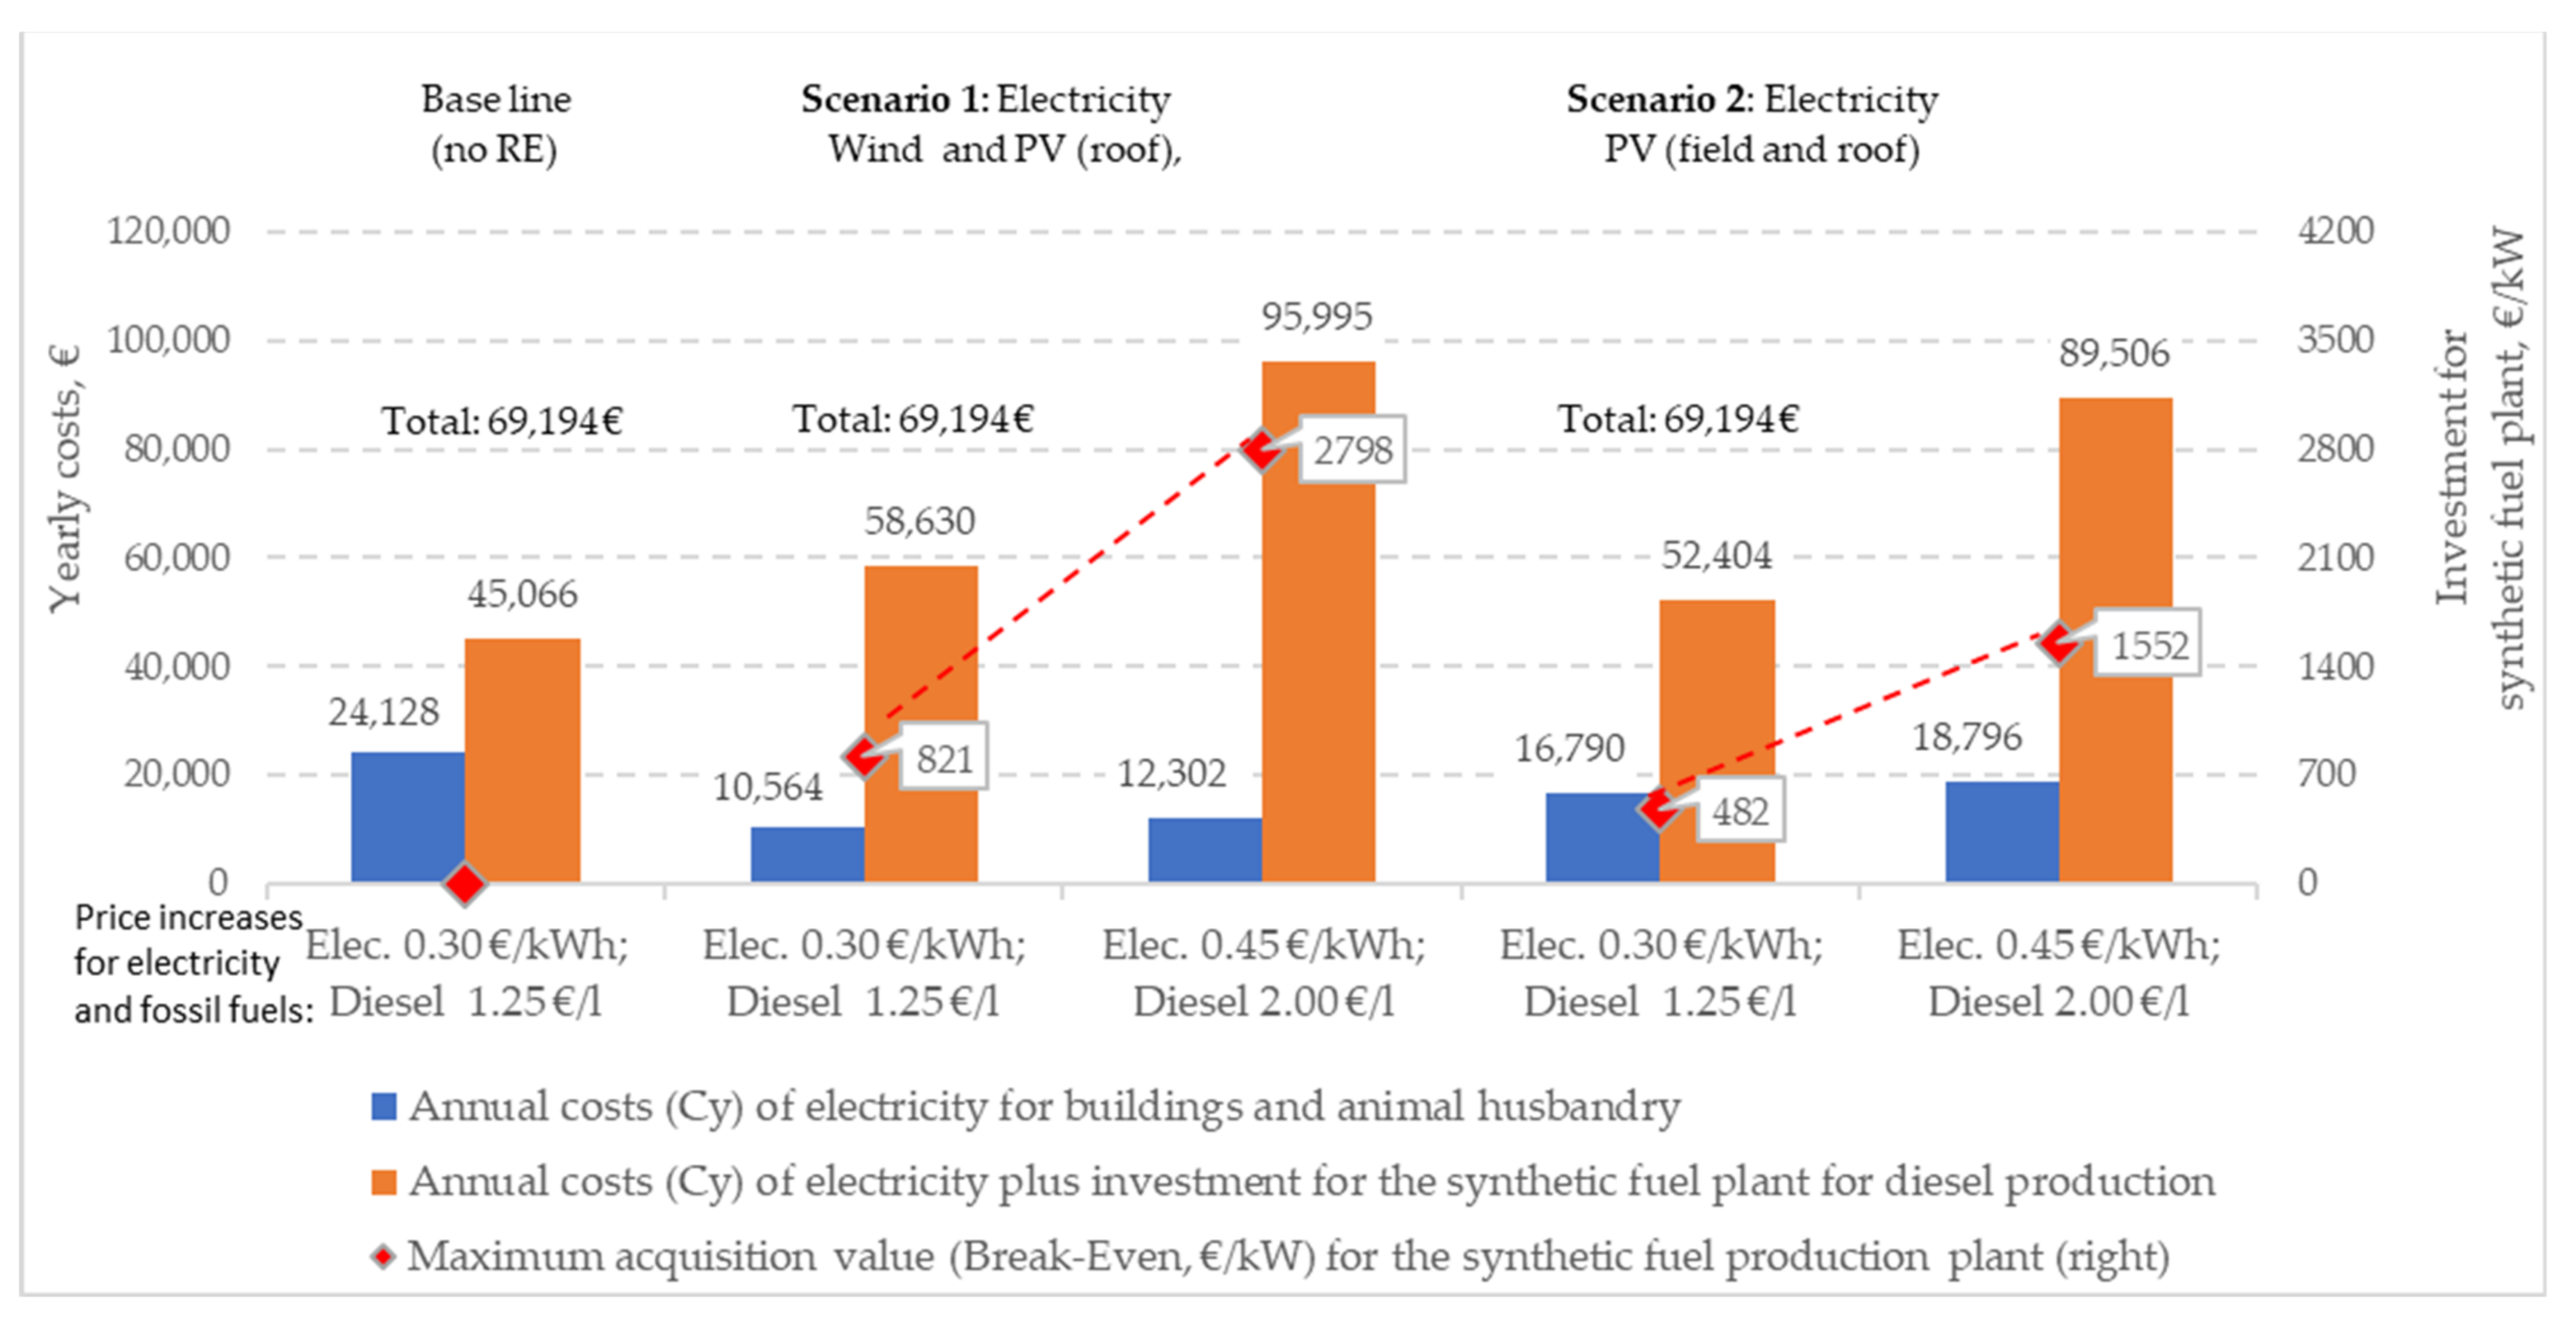
The energy supply for the survey dairy farm was initially supplied entirely through electricity, which was then converted into synthetic fuel through sector coupling. Electricity was mainly required for high-temperature co-electrolysis. Due to the high electricity demand for this conversion step, the electricity generation costs represent a large part of the total costs for synthetic fuel. Subsequently, a break-even analysis for the maximal capital expenses (CapEx) for synthetic fuel production to reach competitiveness was made. The annual costs for renewable energy production were calculated stepwise: (A) annual costs for all electricity production on the farm (cow barn electricity need and diesel), (B) annual costs for the investment of the synthetic fuel production plant (without electricity demand) to meet total annual costs Cy of the base line scenario, and (C) the redistribution of the cost according to Equation (7), where the annual cost of synthetic diesel production includes facility investment and electricity.
Electricity generation using a combination of a PV roof system and a small wind turbine (Scenario 1) costed around € 53,000 p.a., which was roughly the same as that of the PV systems in combination with a battery (Scenario 2) (Table 4, Part A). If the electricity could be obtained more cheaply from a large wind turbine, the annual costs (Cy) would drop to around € 35,000, which means a difference and therefore an annual cost reduction of about 20,000 €.
At the baseline (fossil market resource) with an electricity price of 0.30 €/kW and a diesel price of 1.25 €/l, the survey dairy farm had energy costs totalling around 70,000 €, where around two-thirds of this was spent on buying diesel.
The average electricity costs that the survey dairy farm had in the two scenarios were between 0.13 and 0.16 €/kWh. The reason for the cost reductions compared to the initial situation (0.30 €/kWh) are the additional investments in large-scale PV systems or wind turbines, which are necessary, among other things, for synthetic fuel production. In contrast, the cost of synthetic diesel increases when investments are made in more expensive systems.
In order to avoid the total annual costs exceeding approximately 70,000 €, in the energy system of Scenario 1 and 2, which generates the required electricity exclusively with RE systems, the investment in the synthetic fuel production plan must not be higher than € 821/kW for Scenario 1 or € 482/kW for Scenario 2. This amount is far below the current market values of approximately € 4000/kW (Table 2). Therefore, in the assessment at the end of the article, the statement is made that it is currently not economically viable. The subtotal annual costs Cy for synthetic fuel production facilities (without electricity costs) amounted to € 15.513 for Scenario 1 and € 16.694 for Scenario 2 (Table 4, Part B). The two partial sums of A) and B) together result in an amount of approximately € 70,000 in energy costs for the entire operation/farm, as in the baseline.
In a direct comparison of the scenarios, the capacity for the synthetic fuel production plant in Scenario 2 was nearly doubled in size (Table 4). This was due to the lower load hours of a solo PV system (Scenario 2) compared to the combination with a wind turbine (Scenario 1); thus, electrical power is available to the subsequent consumers for fewer hours per year.
When the highest energy price level of 0.45 €/kW for electricity and 2.00 €/l for fossil diesel was reached, Scenario 1 allowed a maximum acquisition cost of 2798 €/kW for the fuel production system. In Scenario 2, this figure was only € 1552/kW (Figure 8).
Due to the lower cost of electricity production, the “large wind turbine” scenario allowed a maximum price of 1833 €/kW for the synthetic fuel production plant at the lowest energy price level. At the highest energy price, up to € 3810/kW could be spent on the system for synthetic fuel production in order to supply the energy system of the survey dairy farm independently and regeneratively with electricity and fuel equal to the amount of the cost of purchasing fossil diesel and electricity. This calculated break-even of capital expenses (CapEx) was not far from or even below the expected capital expenses (CapEx) for synthetic fuel production plants forecasted for the year 2050 (Table 2). With rising prices for fossil diesel, higher investment costs would be justified to reach the break-even.

5. Discussion and Recommendation

The energy requirements of an agricultural operation, which is to be replaced by a regenerative energy supply with synthetic fuels and renewable electricity, do not make up the largest share of the greenhouse emissions that come from agriculture. The main sources of emissions are agricultural soils and ruminant digestion [6]. To achieve climate goals and limit global warming to 1.5 °C if possible, several adjusting screws must be turned, including the replacement of diesel fossil fuel in agriculture with synthetic fuels. According to the national hydrogen strategy of the German federal government, a large proportion of hydrogen and synthetic fuels are to be imported in the future, since the generation capacities for RE in Germany are limited.
The present work clearly shows that it is possible to increase the efficiency of a farm’s energy system if synthetic fuel production takes place on the farm. In this way, an independent and regenerative energy supply can be guaranteed. For the small energy system of the survey dairy farm studied here, it was positive to have a flexible but necessary electricity consumer, e.g., in the form of synthetic fuel production, in order to cover the constant electricity consumption of the dairy barn with a very high proportion of energy from RE generation systems. Furthermore, a coupling between the electricity and mobility sectors was necessary in this agricultural operation. However, this requirement applies in principle to the entirety of German agriculture, since the fuel requirement represents the greatest energy position, and the mobile energy requirement of the tractors cannot be electrified practically.
The model calculations of this energy system for a location in northern Germany showed that electricity was optimally generated by a wind turbine with the addition of a PV system. In the majority of the hours in the year, electricity was produced on-farm, which means that 87% of the entire electricity demand of the cowshed was covered by direct self-consumption. As a result, the plant for synthetic fuel production also had a good utilization rate.
The energy system showed different results when electricity was generated exclusively with PV systems. A large battery storage system was required here so that the constant electricity consumption of the cowshed was largely covered by the electricity generated by the farm itself. Owing to the flexible electricity consumer in the form of synthetic fuel production, the energy system of the survey dairy farm could make good use of the electricity even during the increased generation times of the PV system, and it did not lead to a peak load in the public grid at noon.
The evaluation of Scenario 2 (PV) showed that from an economic point of view, it was very expensive to use the phases of high generation load of the PV system with the flexible consumer, since the load hours were too low due to the lack of electricity production at night. The synthetic fuel system may cost a maximum of 482 €/kW of installed power at energy prices of 0.30 €/kW for electricity and 1.25 €/l for fossil diesel. In order to produce the same amount of synthetic fuel with similarly high electricity supply costs, the fuel production system in Scenario 1 (PV + wind) should cost a maximum of 821 €/kW, since only just under half of the system output is required compared to Scenario 2. The flexible consumer becomes more expensive in Scenario 2, since the costs per kW of installed power of the synthetic fuel production system were the same regardless of the type of renewable electricity generation. Thus, in Scenario 2 (PV), significantly higher acquisition costs for the fuel production system were incurred for the same amount of fuel produced, which is also reflected in higher costs per kWh/l of fuel. On the other hand, it can be said that a system with fewer load hours per year might last a few years longer, which was not taken into account in Equation (1) for calculating the annual costs.
According to the literature, today’s capital expenses (CapEx) per kW for a synthetic fuel production system would cost around 4000 €/kW of installed capacity in 2020. According to the current status, these acquisition costs would not be profitable even for Scenario 1 with a large wind turbine at the highest energy price level of 0.45 €/kW electricity and 2.00 €/l diesel fuel. For Scenario 1, the cost should be a maximum of € 3810/kW.
Due to increased demand and thus an increased production volume of systems for synthetic fuel production, the acquisition costs could be reduced to 3000 €/kW by 2050. In this case, Scenario 1 (large wind turbine) could profitably produce synthetic fuel on its own at an energy price level of 0.40 €/kW electricity and 1.75 €/l diesel fuel to cover personal needs. In Scenario 1, with a small wind turbine, and Scenario 2, with only electricity generated from PV systems, it is not profitable to produce synthetic fuel in operations under the given circumstances, even at the highest assumed fossil energy price level.
Since synthetic fuel was not produced profitably in either of the two scenarios at today’s energy price level, no recommendation could be made for the survey dairy farm to invest in an independent and regenerative energy supply, as provided in the energy system presented. Another argument against this is the fact that the container systems for synthetic fuel production have not yet reached market maturity. In a few years, the potential investment could be profitable if the energy price level rises sharply, as assumed, and the required renewable electricity is produced inexpensively by a large wind turbine. When using an old large wind turbine where the 20-year RESA subsidy expires, it should be ensured that the remaining service life of the system is long enough for the depreciation of the fuel production system.
The market maturity of fuel production systems and their prices should be observed in the next few years, as well as the acquisition costs of the power generation systems. A stronger integration into the public energy network is conceivable for a further development of the presented energy system. For synthetic fuel production, for example, not only renewable electricity from the local energy system could be taken into account, but also electricity drawn from the public grid. This could happen at times when the grid is heavily loaded or when electricity prices are cheap. A cooperative solution could also exploit the economies of scale. The aim of further research work should be to ensure that the energy generated from renewable sources can be used as efficiently and cost-effectively as possible.
The limitations of the simulation model could be seen in the negation of other means of energy management on a farm, as there are additional load shifting possibilities for electricity consumers, such as controlling the operation hours of manure pumping or a grist mill. Such possibilities have been modelled in previous research [32]. Compared to the flexible electricity consumer considered here (the production of synthetic fuels) the expected effects of other additional direct load shifts are estimated to be comparatively small; nevertheless, direct additional load shifts should also be investigated in the forthcoming research projects.
As a positive aspect of synthetic diesel production, the means of temporary self-sufficient energy supply for crisis protection should be noted. With the synthetic diesel produced, it is conceivable to use a diesel generator for a regenerative emergency power supply on the farm. Should there be a power failure, e.g., in the public power grid, important electricity consumers, such as the milk tank cooling and the milking robot or ventilation systems in pig and chicken coops, can continue to be operated. Such a power failure would also occur if the public grid, and thus the connection to regional wind parks or PV systems, was temporarily switched off due to repair work. An emergency power generator is even a legal requirement for larger livestock facilities.
Another advantage of the technology presented is the lower land consumption compared to the production of biofuels, e.g., bio-diesel from rapeseed oil [14]. Here, even with open field PV systems, the land consumption was only 10% of a comparable vegetable oil production.

Author Contributions

Conceptualization and methodology, C.F. and A.P; data collection and calculation, D.M.; writing—original draft preparation, all authors; writing—review and editing, C.F and A.P. All authors have read and agreed to the published version of the manuscript.

Funding

The authors would like to thank the Neubrandenburg University of Applied Sciences, which sponsored this work as part of its internal research funding in 2020 under the project title “The application of hydrogen technology for the storage of green energy in rural areas in Mecklenburg-Western Pomerania”. We acknowledge support for the article processing charge from the Deutsche Forschungsgemeinschaft (DFG, German Research Foundation, 414051096) and the Open Access Publication Fund of the Hochschule Neubrandenburg (Neubrandenburg University of Applied Sciences).

Institutional Review Board Statement

Not applicable.

Informed Consent Statement

Not applicable.

Conflicts of Interest

The authors declare no conflict of interest.

References

  1. UNFCCC. United Nations Framework Convention on Climate Change: The Paris Agreement. 2017. Available online: http://unfccc.int/paris_agreement/items/9485.php (accessed on 7 November 2020).
  2. EEG 2000. Gesetz für den Vorrang Erneuerbarer Energien (Erneuerbare-Energien-Gesetz—EEG) sowie zur Änderung des Energiewirtschaftsgesetzes und des Mineralölsteuergesetzes vom 29. März 2000 (BGBl. I S. 305); Bundesministerium der Justiz und für Verbraucherschutz: Bonn, Germany, 2020. [Google Scholar]
  3. IPCC (Intergovernmental Panel on Climate Change): Third Assessment Report “Climate Change 2001”–The Scientific Basis. p. 388. Available online: https://www.ipcc.ch/report/ar3/wg1/ (accessed on 14 November 2021).
  4. Arla Foods: Corporate Responsibility Report 2020. 2020. Available online: https://www.arla.com/492ee1/globalassets/arla-global/company---overview/responsibility/csr-reports/2020/de_csr_arla_2020.pdf#page=12 (accessed on 17 June 2021).
  5. UBA (Umweltbundesamt): Landwirtschaft und Umwelt-Wo Stehen Wir? Wo Wollen Wir Hin? Vortrag Dirk Messner. 2019. Available online: https://www.umweltbundesamt.de/sites/default/files/medien/421/dokumente/vortrag_dirk_messner.pdf (accessed on 9 June 2021).
  6. BMU (Bundesministerium für Umwelt, Naturschutz und Nukleare Sicherheit): Klimaschutzprogramm 2030 der Bundesregierung zur Umsetzung des Klimaschutzplans 2050. 2019. Available online: https://www.bundesregierung.de/resource/blob/975226/1679914/e01d6bd855f09bf05cf7498e06d0a3ff/2019-10-09-klima-massnahmen-data.pdf?download=1 (accessed on 9 June 2021).
  7. VDMA (Verband Deutscher Maschinen- und Anlagenbau e.V.): Mehr Ertrag, Weniger CO2-Diesel Sparen Mit Innovativer Landtechnik. 2019. Available online: https://lt.vdma.org/documents/18374/0/158404VDMA_Leitfaden_EKoTech_Screen_de.pdf/084cad3d-0f4d-ffcc-3d30-52dcc29888a3 (accessed on 13 June 2021).
  8. European Commission. A European Green Deal. 14 July 2021. Available online: https://ec.europa.eu/info/strategy/priorities-2019-2024/european-green-deal/delivering-european-green-deal_en (accessed on 2 October 2021).
  9. BMWI (Bundesministerium für Wirtschaft und Energie): Die Nationale Wasserstoffstrategie. 2020. Available online: https://www.bmwi.de/Redaktion/DE/Publikationen/Energie/die-nationale-wasserstoffstrategie.html (accessed on 15 June 2021).
  10. Rozzi, E.; Minuto, F.D.; Lanzini, A.; Leone, P. Green Synthetic Fuels: Renewable Routes for the Conversion of Non-Fossil Feedstocks into Gaseous Fuels and Their End Us-es. Energies 2020, 13, 420. [Google Scholar] [CrossRef] [Green Version]
  11. Meurer, A.; Kern, J. Fischer–Tropsch Synthesis as the Key for Decentralized Sustainable Kerosene Production. Energies 2021, 14, 1836. [Google Scholar] [CrossRef]
  12. Samavati, M.; Martin, A.; Santarelli, M.; Nemanova, V. Synthetic Diesel Production as a Form of Renewable Energy Storage. Energies 2018, 11, 1223. [Google Scholar] [CrossRef] [Green Version]
  13. Özcan, H.; Kayabasi, E. Thermodynamic and economic analysis of a synthetic fuel production plant via CO2 hydrogenation using waste heat from an iron steel facility. Energy Convers. Manag. 2021, 236, 114074. [Google Scholar] [CrossRef]
  14. Gradziuk, P.; Jonczyk, K.; Gradziuk, B.; Wojciechowska, A.; Trocewicz, A.; Wysokinski, M. An Economic Assessment of the Impact on Agriculture of the Proposed Changes in EU Biofuel Policy Mechanisms. Energies 2021, 14, 6982. [Google Scholar] [CrossRef]
  15. Klausmann, F.; Zhu, L. (Fraunhofer-Institut für Arbeitswirtschaft und Organisation): Technologiestudie Microgrid-Markt- und Technologieübersicht für Komponenten eines Microgrids. 2018. Available online: https://www.muse.iao.fraunhofer.de/content/dam/iao/muse/de/documents/Labore/Technologiestudie%20Microgrid_final_190221.pdf (accessed on 2 July 2021).
  16. BMWI (Bundesministerium für Wirtschaft und Energie): Intelligente Netze. 2021. Available online: https://www.bmwi.de/Redaktion/DE/Artikel/Energie/intelligente-netze.html (accessed on 6 July 2021).
  17. NDR Emsland: Anlage in Werlte Produziert CO2-neutrales Kerosin. 2021. Available online: https://www.ndr.de/nachrichten/niedersachsen/osnabrueck_emsland/Emsland-Anlage-in-Werlte-produziert-CO2-neutrales-Kerosin,werlte224.html (accessed on 16 October 2021).
  18. Deutsches Zentrum für Luft- und Raumfahrt e. V. (DLR) Biokerosin und EE-Kerosin für die Luftfahrt der Zukunft–von der Theorie zu Pilotvorhaben. Leipzig, München, Berlin, Heidelberg, 11/2015; Aktualisierte Zusammenfassung 07/2016. 2016. Available online: https://www.bmvi.de/SharedDocs/DE/Artikel/G/MKS/biokerosin-eekerosin-luftfahrt.html (accessed on 16 October 2021).
  19. Fuchs, C.; Poehls, A.; Skau, K.; Kasten, J. Economics of Battery Use in Agriculture: Economic Viability of Renewable Energy Complemented with Batteries in Agriculture. Energies 2021, 14, 2430. [Google Scholar] [CrossRef]
  20. Energy Lab 2.0. 2021. Available online: https://www.elab2.kit.edu/index.php (accessed on 19 November 2021).
  21. Karlsruher Institut für Technologie (KIT) Kohlendioxidneutrale Kraftstoffe aus Luft und Strom. Presseinformation 107/2019. 2019. Available online: https://www.kit.edu/kit/pi_2019_107_kohlendioxidneutrale-kraftstoffe-aus-luft-und-strom.php (accessed on 29 November 2021).
  22. Karlsruher Institut für Technologie (KIT) Synthetische Kraftstoffe: Containeranlage am KIT im Gekoppelten Betrieb Erfolgreich. Presseinformation 069/2021. 2021. Available online: https://www.kit.edu/kit/pi_2021_069_synthetische-kraftstoffe-containeranlage-am-kit-im-gekoppelten-betrieb-erfolgreich.php (accessed on 11 December 2021).
  23. Climeworks. 2021. Available online: https://climeworks.com/ (accessed on 19 November 2021).
  24. Sunfire. 2021. Available online: https://www.sunfire.de/de/home (accessed on 19 November 2021).
  25. INERATEC–Innovative Chemical Reactor Technologies Company description on the Internet. 2021. Available online: https://ineratec.de/ (accessed on 20 November 2021).
  26. ZML (Zentrum für Mediales Lernen am Karlsruher Institut für Technologie) Power-to-X: CO2-neutrale E-Fuels aus regenerativem Strom und CO2 aus der Luft. 2020. Available online: https://www.youtube.com/watch?v=KOawGXRRJFY&feature=emb_logo (accessed on 4 April 2021).
  27. Forster, S. Bereitstellung und Nutzung von FT-Diesel. Technischer Anhang 2. Roadmap des Kopernikus-Projektes „Power-to-X“. DECHEMA Gesellschaft für Chemische Technik und Biotechnologie e.V. 2019. Available online: https://www.kopernikus-projekte.de/lw_resource/datapool/systemfiles/elements/files/B0ED1438B6123754E0537E695E86A220/live/document/Power-toX_Roadmap_2.0_Anhang.pdf (accessed on 4 April 2021).
  28. Wendel, M. (E.ON Energie Deutschland) Autarke Stromversorgung in lokalen Netzen mit speichergestützten Kleinwindanlagen. 2019. Available online: https://www.smart-systems-conference.de/wp-content/uploads/2020/01/E.ON-SmartEnergy2019_MWE.pdf (accessed on 6 April 2021).
  29. Kost, C.; Shammugam, S.; Jülch, V.; Nguyen, H.-T.; Schlegl, T. (Frauenhofer Institut für Solare Energiesysteme): Stromgestehungskosten Erneuerbare Energien. 2018. Available online: https://www.ise.fraunhofer.de/content/dam/ise/de/documents/publications/studies/DE2018_ISE_Studie_Stromgestehungskosten_Erneuerbare_Energien.pdf (accessed on 8 July 2021).
  30. Frontier Economics: Die zukünftigen Kosten strombasierter synthetischer Brennstoffe. Studie im Auftrag von Agora Verkehrswende und Agora Energiewende. In Agora Verkehrswende, Agora Energiewende und Frontier Economics: Die zukünftigen Kosten strombasierter synthetischer Brennstoffe. 2018. Available online: https://www.agora-verkehrswende.de/fileadmin/Projekte/2017/Die_Kosten_synthetischer_Brenn-_und_Kraftstoffe_bis_2050/Agora_SynCost-Studie_WEB.pdf (accessed on 23 July 2021).
  31. EEG 2021. Erneuerbare-Energien-Gesetz vom 21. Juli 2014 (BGBl. I S. 1066), das Zuletzt Durch Artikel 11 des Gesetzes vom 16. Juli 2021 (BGBl. I S. 3026) Geändert Worden ist. 2021. Available online: https://www.gesetze-im-internet.de/eeg_2014/BJNR106610014.html (accessed on 14 November 2021).
  32. Schock, K.; Bettinger, C.; Schild, V.; Fuchs, C.; Beck, H.-P. Speicherung von PV-Energie und Nutzung in der Milchproduktion—Netzdienlichkeit und Wirtschaftlichkeit. Poster auf der Gewisola-Tagung 23.09. bis 25.09.2015 in Gießen und Schriften der Ge-WiSoLa e.V., Perspektiven für die Agrar- und Ernährungswirtschaft nach der Liberalisierung, Bd. 51. 2016, pp. 475–478. Available online: https://www.gewisola.de/schriftenreihe/Schriften_der_GEWISOLA_Bd_51_2016.pdf (accessed on 20 November 2021).
Figure 1. Scheme of a regenerative energy supply from self-power generation in the survey dairy farm.
Energies 15 01156 g001
Figure 2. Daily load curves of electricity consumption in the dairy barn with milking robot on four consecutive days. Source: survey dairy farm 2020.
Energies 15 01156 g002
Figure 3. Annual distribution of fuel requirements in a dairy farm with crop and forage production. Source: survey dairy farm 2020.
Energies 15 01156 g003
Figure 4. Container facility for the production of synthetic fuel at KIT [21].
Energies 15 01156 g004
Figure 6. Annual electricity generation and comparison of the consumption of electricity generated (Scenario 1 and Scenario 2).
Energies 15 01156 g006
Figure 7. Load profile of grid feed-in and purchased electricity, as well as stocks of synthetic fuels for both scenarios (1 and 2) over the course of the year.
Energies 15 01156 g007
Figure 8. Annual costs for providing electricity to the barn and for producing synthetic fuel, comparing baseline, Scenario 1 and 2 (according to Equations (6) and (7)) and the maximum acquisition values (€/kW) for the synthetic fuel production plant to meet the total annual costs Cy of the baseline scenario.
Energies 15 01156 g008
Table 1. Costs for systems for energy generation, storage and conversion.
Capital Expenses (CapEx)Useful Life (N) in YearsInterest Rate (i) in%Operating Expenses (OpEx) in% of CapEx
PV on the roof975 €/kWp202.0%1.0%
Open field PV800 €/kWp202.0%1.0%
Small wind turbine2000 €/kW202.0%2.5%
Large wind turbine1100 €/kW202.0%2.5%
Battery storage900 €/kWh202.0%1.0%
Synthetic fuel productionsee Table 2202.0%3.0%
Source: Survey dairy farm 2020 and [28,29].
Table 2. Capital expenses (CapEx) for systems for the production of synthetic fuels in €/kW.
Year20202050
RangeMin.Max.Min.Max.
CO2 extraction from the air using temperature swing adsorption technology2231223116351635
High temperature electrolysis877969400800
Fischer–Tropsch synthesis and upgrading732843300800
Total3840404323353235
Source: Based on Frontier Economics (2018) [30].
Table 3. Comparison of the technical parameters of the installed systems and their output (baseline, Scenario 1 and Scenario 2).
ScenarioBaseline (Fossil Energy Resources)Scenario 1 (PV + Wind)Scenario 2 (PV on Roof and Open Field)
(A) Purchase of energy from fossil resources
Electricity (price 0.30 €/kWh)80,000 kWh;
24,128 €
––––––––––––––––––––
Diesel (price 1.25 €/l)350,000 kWh;
45,066 €
––––––––––––––––––––
(B) Investment in renewable energy sytems Installed powerGeneration/discharge/consumptionInstalled powerGeneration/discharge/consumption
PV on the roof 125 kWp
(~1250 m2)
118,722 kWh200 kWp
(~2000 m2)
189,995 kWh
PV in open fields ––––––––––520 kWp
(~5200 m2)
552,045 kWh
Small or large wind turbines 250 kW623,278 kWh––––––––––
Battery storage 2 kWh607 kWh105 kWh31,945 kWh
Synthetic fuel production 210 kW600,887 kWh385 kW600,918 kWh
Sum of the energy generation and transformation capacities 587 kW 1210 kW
Table 4. Capacities and annual costs of the electricity supply energy system and the synthetic fuel production plant, in addition the revenues from surplus electricity sales.
Baseline
(Fossil Energy Resources)
Scenario 1
(Wind and PV)
Scenario 2
(PV)
(A) Electricity production system (electricity production for direct use and for synthetic diesel production)
Cy PV roof–––––125 kWp:
8523 €
200 kWp:
13,636 €
Cy PV open fields––––––––––520 kWp:
29,120 €
Cy small wind turbine 1)–––––250 kW:
42,500 €
–––––
Cy battery storage–––––2 kWh:
126 €
105 kWh:
6615 €
Cy share of RESA surcharge–––––1851 €1875 €
Cy electricity purchase (-)–––––3478 €4013 €
Ey electricity sales (+)–––––2797 €2758 €
Subtotal of annual costs Cy for electricity production (for Scenario 1 with small wind turbine) 53,681 €52,500 €
(B) Synthetic fuel production system
Capacity 210 kW385 kW
Break-even acquisition value (€/kW) for the synthetic fuel plant to meet total annual costs Cy of the base line scenario 821482
Subtotal annual costs Cy for synthetic fuel production facilities (without electricity costs) 15,513 €16,694 €
Total annual costs Cy for renewable energy production on farm level69,19469,19469,194
(C) Redistribution of annual costs Cy (according to Equations (6) and (7))
Cy of electricity for buildings and animal husbandry
Annual costs
Costs per kWh
Fossil elec.:
24,128 €
0.30 €
RE elec.:
10,564 €
0.130 €
RE elec.:
16,790 €
0.146 €
Cy of electricity plus investment for the synthetic fuel plant Annual costs
Costs per l diesel
Fossil diesel:
45,066 €
1.25 €
RE diesel:
58,630 €
1.63 €
RE diesel:
52,404 €
1.45 €
Total annual costs Cy69,194 €69,194 €69,194 €
1) Lower costs when using a large wind turbine instead of a small wind turbine, proportion used 250 kW; annual costs Cy reduced to 23,375 € (difference: −19,125 €).
Publisher’s Note: MDPI stays neutral with regard to jurisdictional claims in published maps and institutional affiliations.

