Article

Comprehensive Study of the Aerodynamic Influence of Ground and Wheel States on the Notchback DrivAer

1
Shanghai Automotive Wind Tunnel Center, Tongji University, Shanghai 201804, China
2
Beijing Aeronautical Science & Technology Research Institute, Beijing 102211, China
*
Author to whom correspondence should be addressed.
Energies 2022, 15(3), 1124; https://doi.org/10.3390/en15031124
Submission received: 22 December 2021 / Revised: 17 January 2022 / Accepted: 1 February 2022 / Published: 3 February 2022
(This article belongs to the Section E: Electric Vehicles)

Abstract

:
This paper conducts an analysis of the aerodynamic influence of different ground and wheel states on the Notchback DrivAer by numerical simulation. The effects of the moving ground and rotating wheels are investigated individually and comprehensively. Experimental data are also included for validation. Through this study, a unique and important low-drag state is observed, in which the vehicle wake near the center region becomes more symmetrical, the pressure on the upper middle base is recovered and the total aerodynamic drag decreases significantly. Furthermore, the formation of this state is determined by the flow rate near the surface of the rear underbody. When the wheels are rotating, the wheel wakes are weakened. On one hand, the drag of wheels and the two sides of the base region is reduced. On the other hand, the boundary layer near the underbody is thinned and the flow near the underbody surface is accelerated, transforming the wake to the low-drag state. Moreover, the moving ground can enhance the wheel wake but its effect on the flow rate near the underbody is complicated. This may be one of the important reasons why the aerodynamic effects of wheel & ground states depend on the vehicle model. Finally, the global effects of wheel rotation and ground movement can affect each other so they should be analyzed together in the vehicle design process.

1. Introduction

Environmental problems derived by greenhouse gas emissions have attracted increased social attention in recent years. Owing to this circumstance, manufacturers are responsible for producing more environmentally friendly automobiles. Aerodynamic drag plays an important role in total vehicle drag. Furthermore, as an irreplaceable component, wheels have notable influence on the overall car aerodynamic performance. A previous study found that wheels are responsible for about 25% of total vehicle aerodynamic drag [1]. Therefore, studying the aerodynamic influence of wheels is of great significance for comprehensively studying the aerodynamic performance of a vehicle.
However, the specific effect of wheels on the whole car still remains unclear. For example, as all the wheels are rotating on the real driving vehicle, it is necessary to comprehensively understand the influences of rotating wheels (plus the moving ground) on the global vehicle aerodynamics, but researchers have different opinions on this. Many published works point out that the rotating wheels can result in total drag decrease [2,3]. They found that drag reduction mainly results from the interaction between the rear wheels and the vehicle base region: When the wheels are rotating, the momentum of the rear wheel wake is supplied and its direction is deflected toward the inner side of the vehicle, which finally leads to the recovery of base pressure. However, other studies showed that the application of moving ground and rotating wheels may even result in a total drag increase due to the flow field altered by the accelerated flow near the underbody [4,5]. In general, results show that the influence of wheel and ground states on total aerodynamic force are affected by the vehicle type [6]. This phenomenon further illustrates the complexity of wheel aerodynamics.
Due to this circumstance, flow characteristics brought about by wheels and wheel–vehicle aerodynamic interactions have attracted increased attention in recent years. Regert et al. [7] and Rajaratnam et al. [8] investigated the local flow field around the wheelhouse. They found that, compared with stationary wheels, rotating wheels will induce notable influence on the vortex structure and even increase the total aerodynamic drag. Basso et al. [9] and Fernandez-Gamiz et al. [10] studied the aerodynamic impact of the Gurney flap in front of the front wheels. It was found that the GF can increase the total downforce significantly, while only tiny drag increase is obtained. Besides this, the 3D flow structure near the wheel and the body can also be clearly changed. Pavia et al. [11] studied the unsteady flow characteristics generated by rotating wheels and pointed out that wheel rotation can affect the wake bi-stability of the vehicle as well as the aerodynamic forces. Bonitz et al. [12] found that the flow frequency downstream of the wheels can be altered by the wheel rotation. Wang et al. [13] conducted research on the effect of the moving ground and rotating wheels on the aerodynamics of a square-back car model and found that the wheel and ground conditions mainly influence flow near the ground. The general wake structure and the total drag are not obviously altered. Wang et al. [14] proposed a wake statue named “wake balance” by comparing the flow field of a square back model with rotating and stationary wheels. When the wake stays in this state, its turbulent kinetic energy appears as symmetrical and the pressure on the vehicle base is higher; therefore, the overall drag will decrease. However, the specific causes of this state are not yet clear. All these studies illustrated that uncertain changes in aerodynamic forces may result from the complex flow changes derived from the wheels.
The ground effect is also an important research topic in vehicle aerodynamics. Previous studies have proposed many approaches to change the underbody flow so as to analyze the flow field changes. These approaches include changing the ground clearance [15], applying perturbations [16], adding flaps [17] or underbody diffusers [18], and so on. These studies proved that the underbody flow is sensitive to the underbody parameters and can be altered significantly, which finally results in differences in the flow field and the aerodynamic forces. However, these studies mainly focused on a simplified vehicle model. As the real driving vehicle experiences a moving ground and rotating wheels together, its flow field may be more complicated.
According to previous work, although the significant influence of wheels on global vehicle aerodynamics has been proposed, researchers have not yet reached a consensus on the aerodynamic effects of the wheels and ground. The changes in aerodynamic forces have not been explained thoroughly. Due to this circumstance, this study comprehensively analyzes the effect of rotating wheels and moving ground on the aerodynamic characteristics of a generic notchback sedan by numerical simulation. Experimental data are also applied for validations. In order to deeply understand the aerodynamic effects of the wheels and ground, after the global analysis these two aspects are studied individually. The aerodynamic forces and flow field characteristics will be discussed in depth. Finally, the wheel and ground states are investigated comprehensively in order to further explore the complex wheel–ground–vehicle interaction.

2. Methodology

2.1. Vehicle Geometry

In this research, the 40%-scaled notchback DrivAer (with mirrors and smooth underbody) is selected as the car model (seen in Figure 1). The DrivAer model size is 1.85, 0.70 and 0.57 m in length, width and height respectively. The total frontal area is 0.35 m2. The radius of wheels is 0.1274 m and each wheel has five spokes. More detailed information about the DrivAer model can be found in a study by Heft et al. [19].

2.2. Computational Domain and Boundary Conditions

In order to avoid inference from the boundaries, the computational domain is chosen as 11 L (4 L in front of the car model, where L represents the length of car) in length, 8 H in height and 12 W in width, and the blockage ratio is limited to 1%. The inlet velocity is set at 40 m/s. In this situation, the Reynolds number based on the wheel diameter is 1.26 × 10⁶, meeting the requirement of Reynolds number independence proposed by the current study [19]. The angular velocity of the wheels is about 314 rad/s, which ensures that the linear velocity of the tire tread is equal to the freestream velocity. The pressure-outlet boundary condition specified with a gauge pressure of 0 is applied at the outlet. For the moving ground cases, the ground is set as the moving wall condition and its velocity corresponds to the freestream. A symmetry boundary condition is specified on the walls to avoid interference of the boundary layer from these surfaces. For wheel-rotating cases, the unsteady Sliding Mesh method is applied on wheel rims, and no-slip rotating wall boundary is selected for the tires. This method is commonly used in wheel aerodynamic studies and its accuracy has been proven in former studies [20]. The cut angle between wheels and the ground is about 15 degrees; therefore, the global flow field will not be altered significantly [21]. The computational domain and boundary conditions can be seen in Figure 2 and Table 1.

2.3. Cases Setup and Mesh Strategy

In this study, Star-CCM+ v12 is used for the numeral simulation. The implicit unsteady IDDES model, fitting with k-ω SST turbulent model and all y+ wall functions, is applied. This is a hybrid RANS-LES model, which combines the advantages of the DDES and the wall-modelled large eddy simulation (WMLES) [22]. The DDES provides shielding against grid-induced separation (GIS) generated by grid refinement beyond the limit of the modelled stress depletion (MSD) [23]. The WMLES model is designed to reduce the Reynolds number dependency so as to allow the LES simulation of wall boundary layers at much higher Reynolds numbers than in standard LES models [22,24]. In the present IDDES model, a new sub-grid length-scale is defined in Equation (1) including explicit wall–distance dependence, which is different from the former LES and DES involving only grid spacing. The primary effect of Equation (1) is to reduce △ and to give it a fairly steep variation leading to a similar trend in the eddy viscosity, which is likely to de-stabilize the flow [22].
= min max C w d w , C w h m a x , h w n , h m a x
In Equation (1), d w is the distance to the wall, h w n is the grid step in the wall-normal direction, and C w is an empirical constant that is equal to 0.15 based on a wall-resolved LES of channel flow [22]. h m a x in Equation (1) represents the largest local grid spacing, as shown in Equation (2). The complete formulations for the IDDES are not shown here for simplicity. More detail can be obtained in [22].
h m a x = max h x , h y , h z
The convective terms of the momentum equations are discretized by a hybrid numerical scheme [25] that switches between a Bounded Central Differencing Scheme (BCDS) where LES is active and a second order upwind scheme where the RANS mode is active. The scheme for turbulent quantities is a second order upwind. Second order accuracy is used for temporal discretization. It was proven that this model can simulate the flow field of a vehicle accurately in the preliminary work for this study. The length of each time step is equal to the time for wheel rotation of 1° and the total calculation time is equal to 10 rotation periods. Moreover, in vehicle engineering, the main focus is on the time-average results of aerodynamic forces; therefore, most of the results in this paper are time-averaged in the last five rotation periods. The transient flow field changes will be comprehensively studied in the future.
Considering different ground and wheel states, the following fur numerical cases are generated for this study: stationary ground plus stationary wheels (abbreviated to SGSW), stationary ground plus rotating wheels (SGRW), moving ground plus stationary wheels (MGSW) and moving ground plus rotating wheels (MGRW). Although some states do not exist in the real driving condition (such as MGSW), we believe that they are still necessary for a complete understanding of wheel–vehicle interactions.
The surface mesh size of the main body is set at 4 mm, the size of wheels is set at 1 mm and the maximum CFL number is about 2.2. In order to improve the accuracy of the calculations, Y+ for the first boundary layer is set below 1 in most of the regions. The exceptions lie on the mirror and wheel contact patch as there are some small gaps which limit the grid generations, seen in Figure 3. In order to eliminate the interference of grid numbers, a grid-independence study is conducted: three different meshes are generated by shrinking the maximum volume of meshes, seen in Figure 4. Time-averaged drag and lift coefficient (CD and CL) varieties of MGRW are presented in Table 2.
It can be concluded that, as the total mesh becomes denser, CD and CL both experience no significant changes. Therefore, the baseline mesh is applied for both models in this study, while the total number of cells is about 38.3 million.

2.4. Numerical Validation

2.4.1. Aerodynamic Forces

Numerical validation is of great importance for a CFD simulation. In this study, the accuracy of both aerodynamic coefficients and the local pressure distribution is concerned. In Table 3, the drag coefficients of experimental data from the moving ground and rotating wheels cited from several presented papers are given, while the delta between MGRW and these experiments is listed.
It is demonstrated that the differences between the simulations and experiments are lower than 5%. In general, these differences are not notable; therefore, the accuracy of aerodynamic drag is considered acceptable.

2.4.2. Pressure Distribution

The time-averaged static pressure coefficient (CP) distribution on the center line of the car body of MGRW is shown in Figure 5. Experimental data from [19,26] are included, named CP (1) and CP (2), respectively. It can be seen that, both on the upper body and underbody, the differences between experimental data and the numerical simulation are relatively small, especially on the base region, which has the dominant effect on body drag. This indicates that the local flow field near the middle and the rear end of the car body are simulated accurately in this study. In the middle part of both the upper and underbody, the simulation results are slightly lower than those of the experimental data. It is supposed that this discrepancy results from the experimental setup. For example, the surface friction of the tested model is larger than the simulation, so the flow velocity is lower and the pressure is higher. However, in general, the accuracy of the numerical simulation of both the aerodynamic drag and pressure distribution in this study is acceptable; therefore, the CFD method is considered trustworthy.

3. Results and Discussions

3.1. General Uasnderstanding of MGRW

In the first section, it is necessary to compare MGRW with SGSW in order to generally understand the aerodynamic interaction of the wheels and ground in real driving condition. The time-averaged drag and lift coefficients are shown in Table 4. Compared with SGSW, the total drag coefficient of MGRW decreases by 11 counts, while the body drag coefficient decreases by four counts. This means that the moving ground and rotating wheel condition can reduce the drag on both wheels and the car body, which corresponds to [3,13,14]. Moreover, the lift coefficient decreases by about 100 counts and most of these come from the body. Both the CD and CL results indicate significant flow field changes around the vehicle.
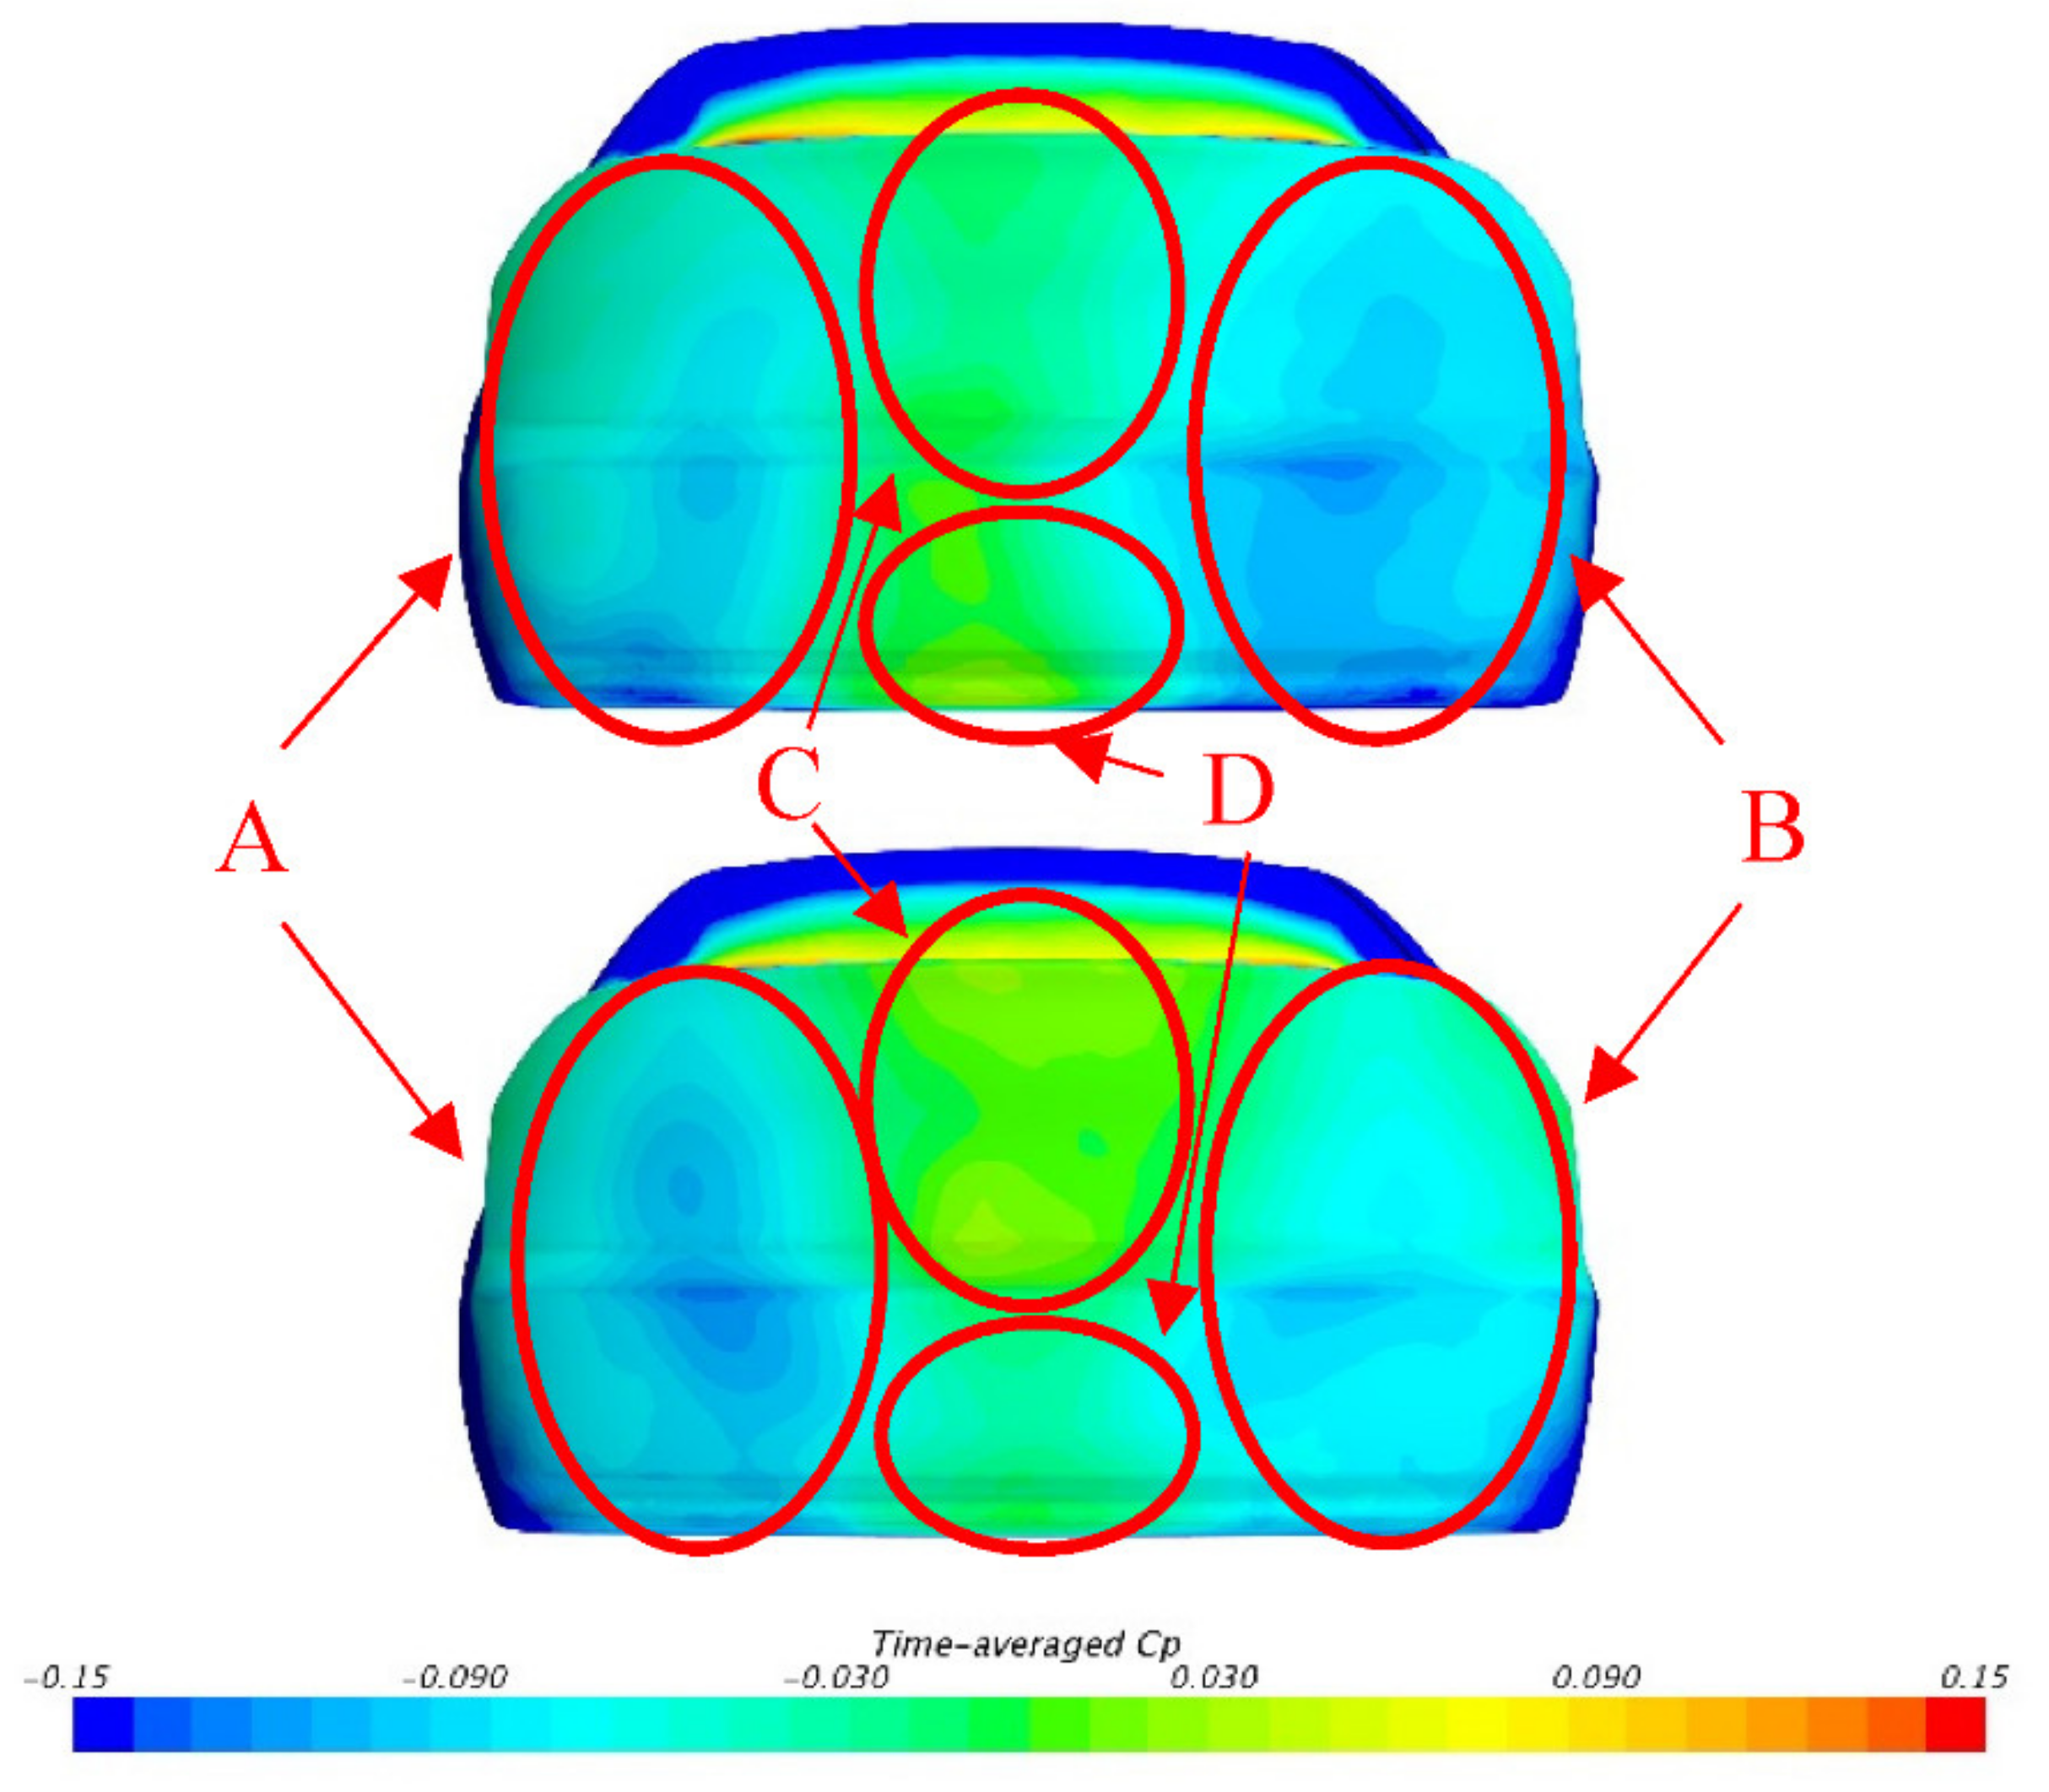
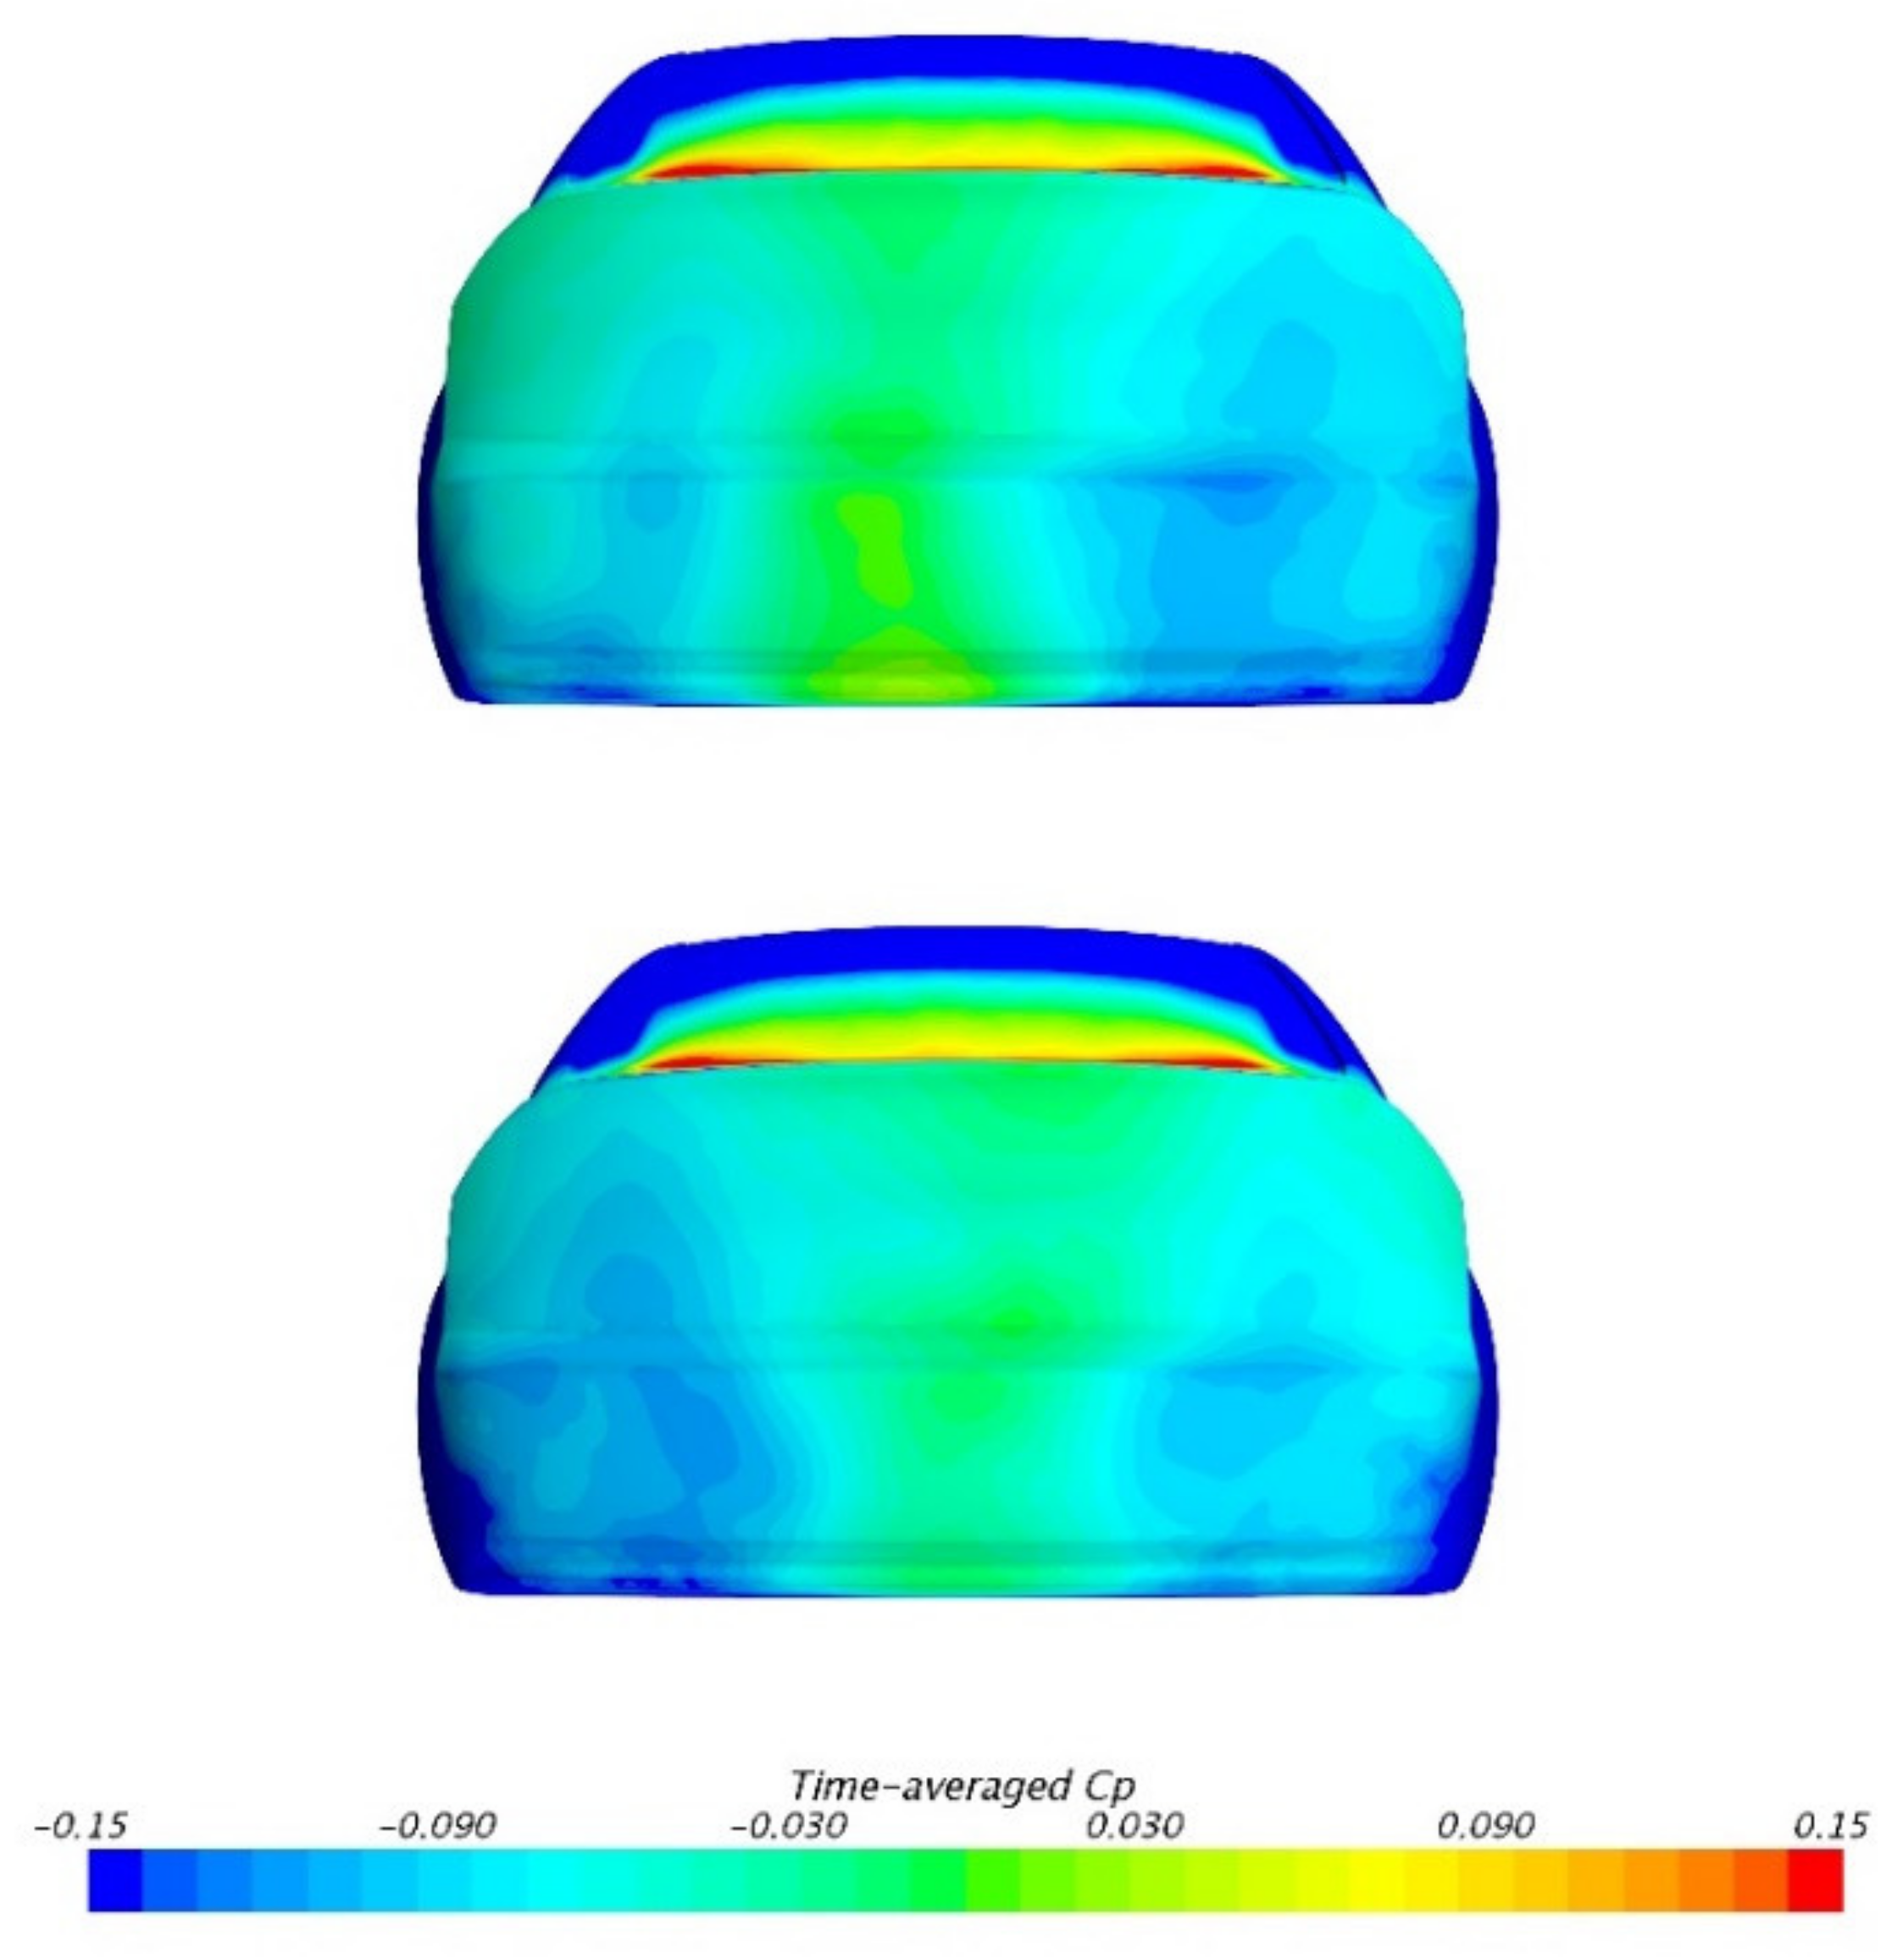
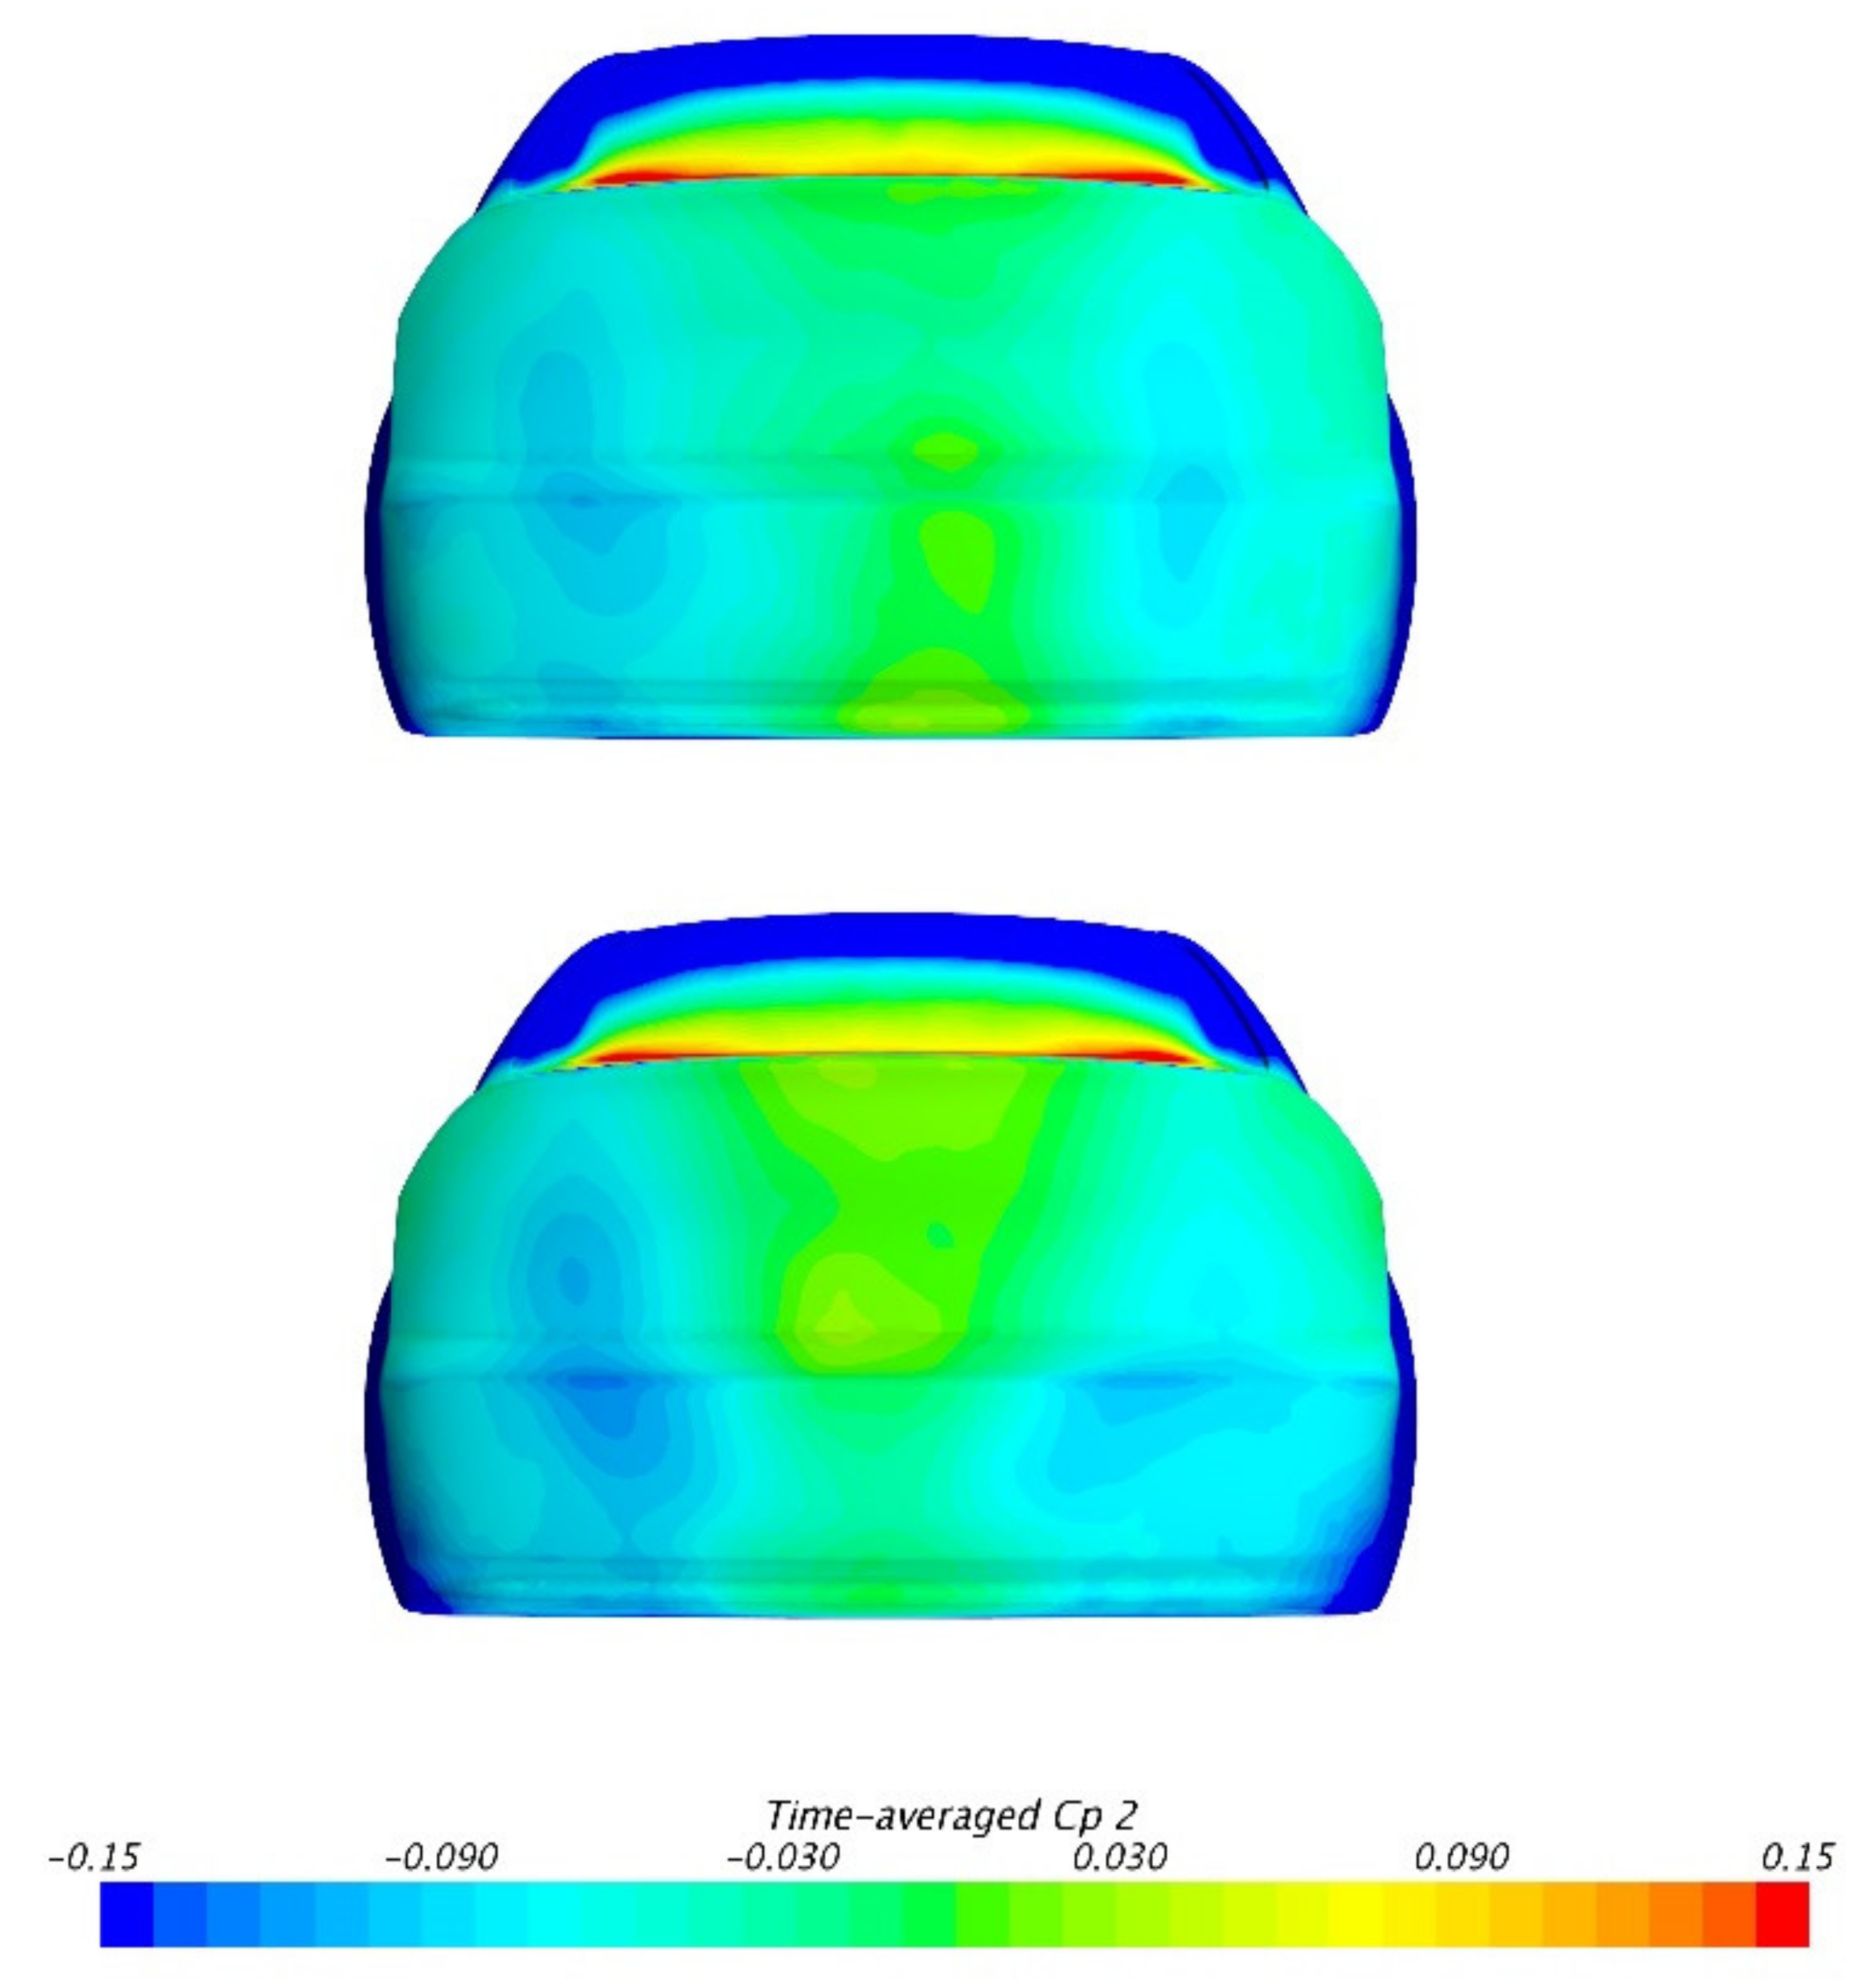
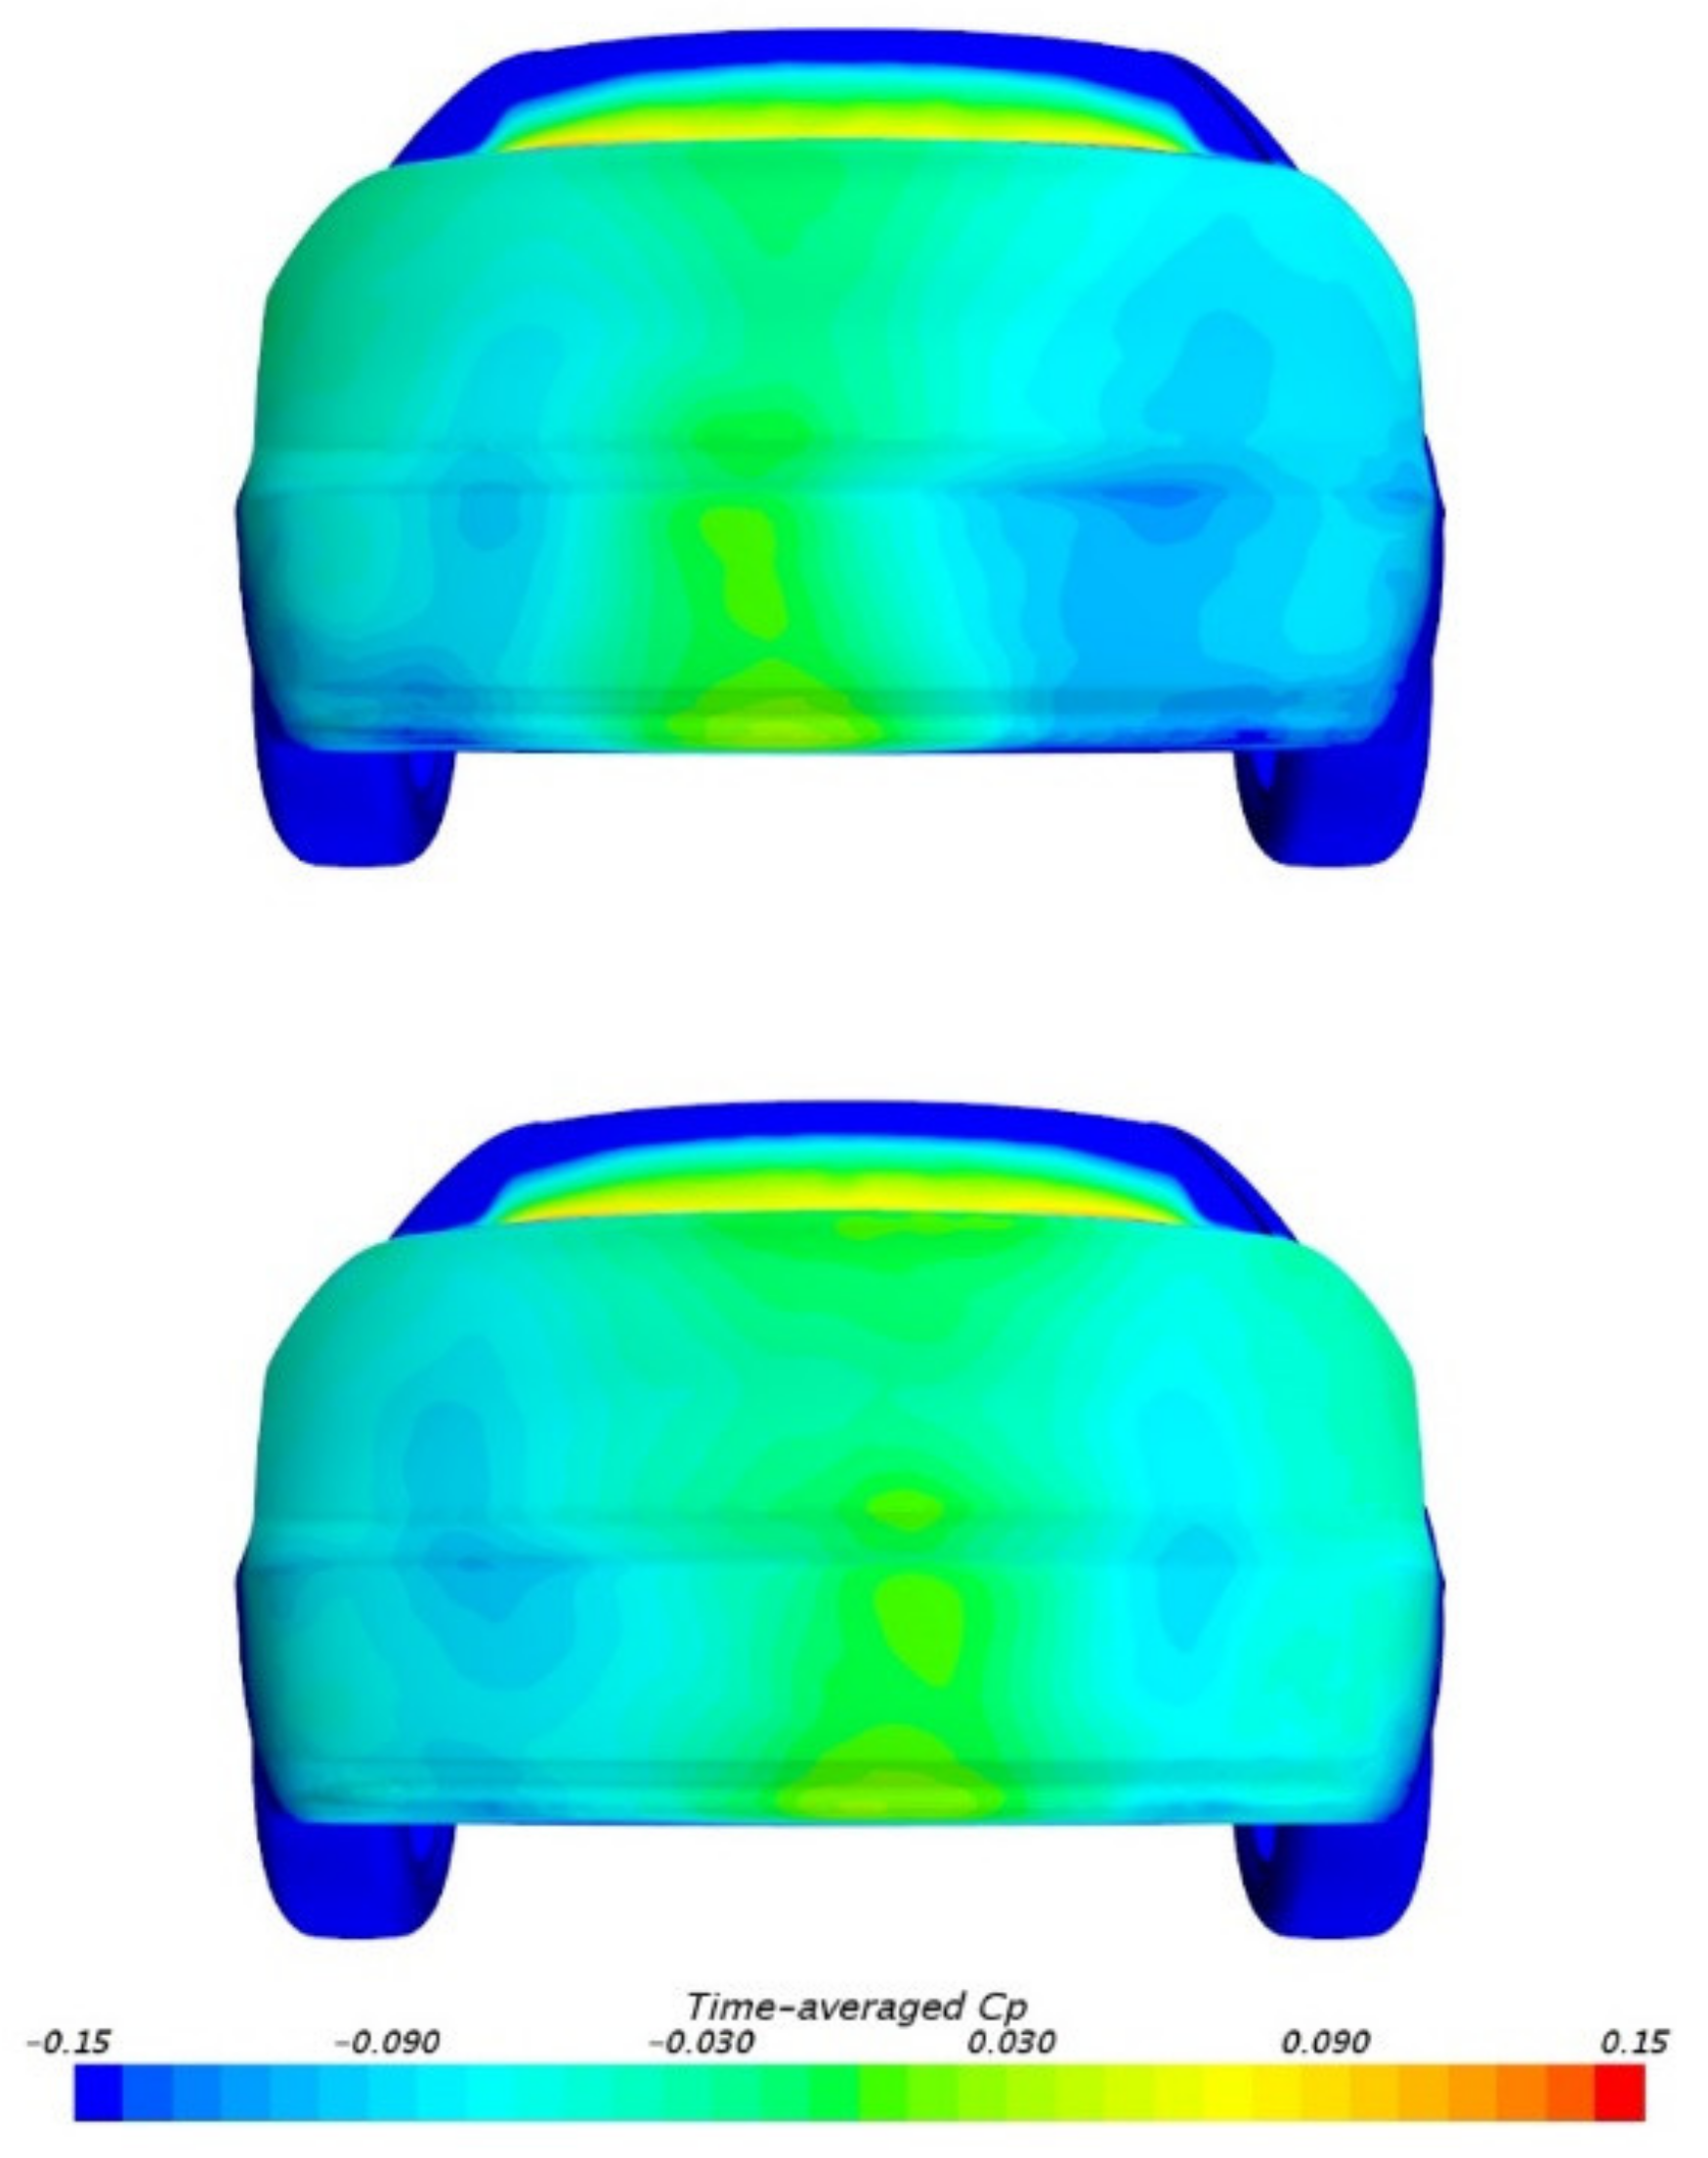
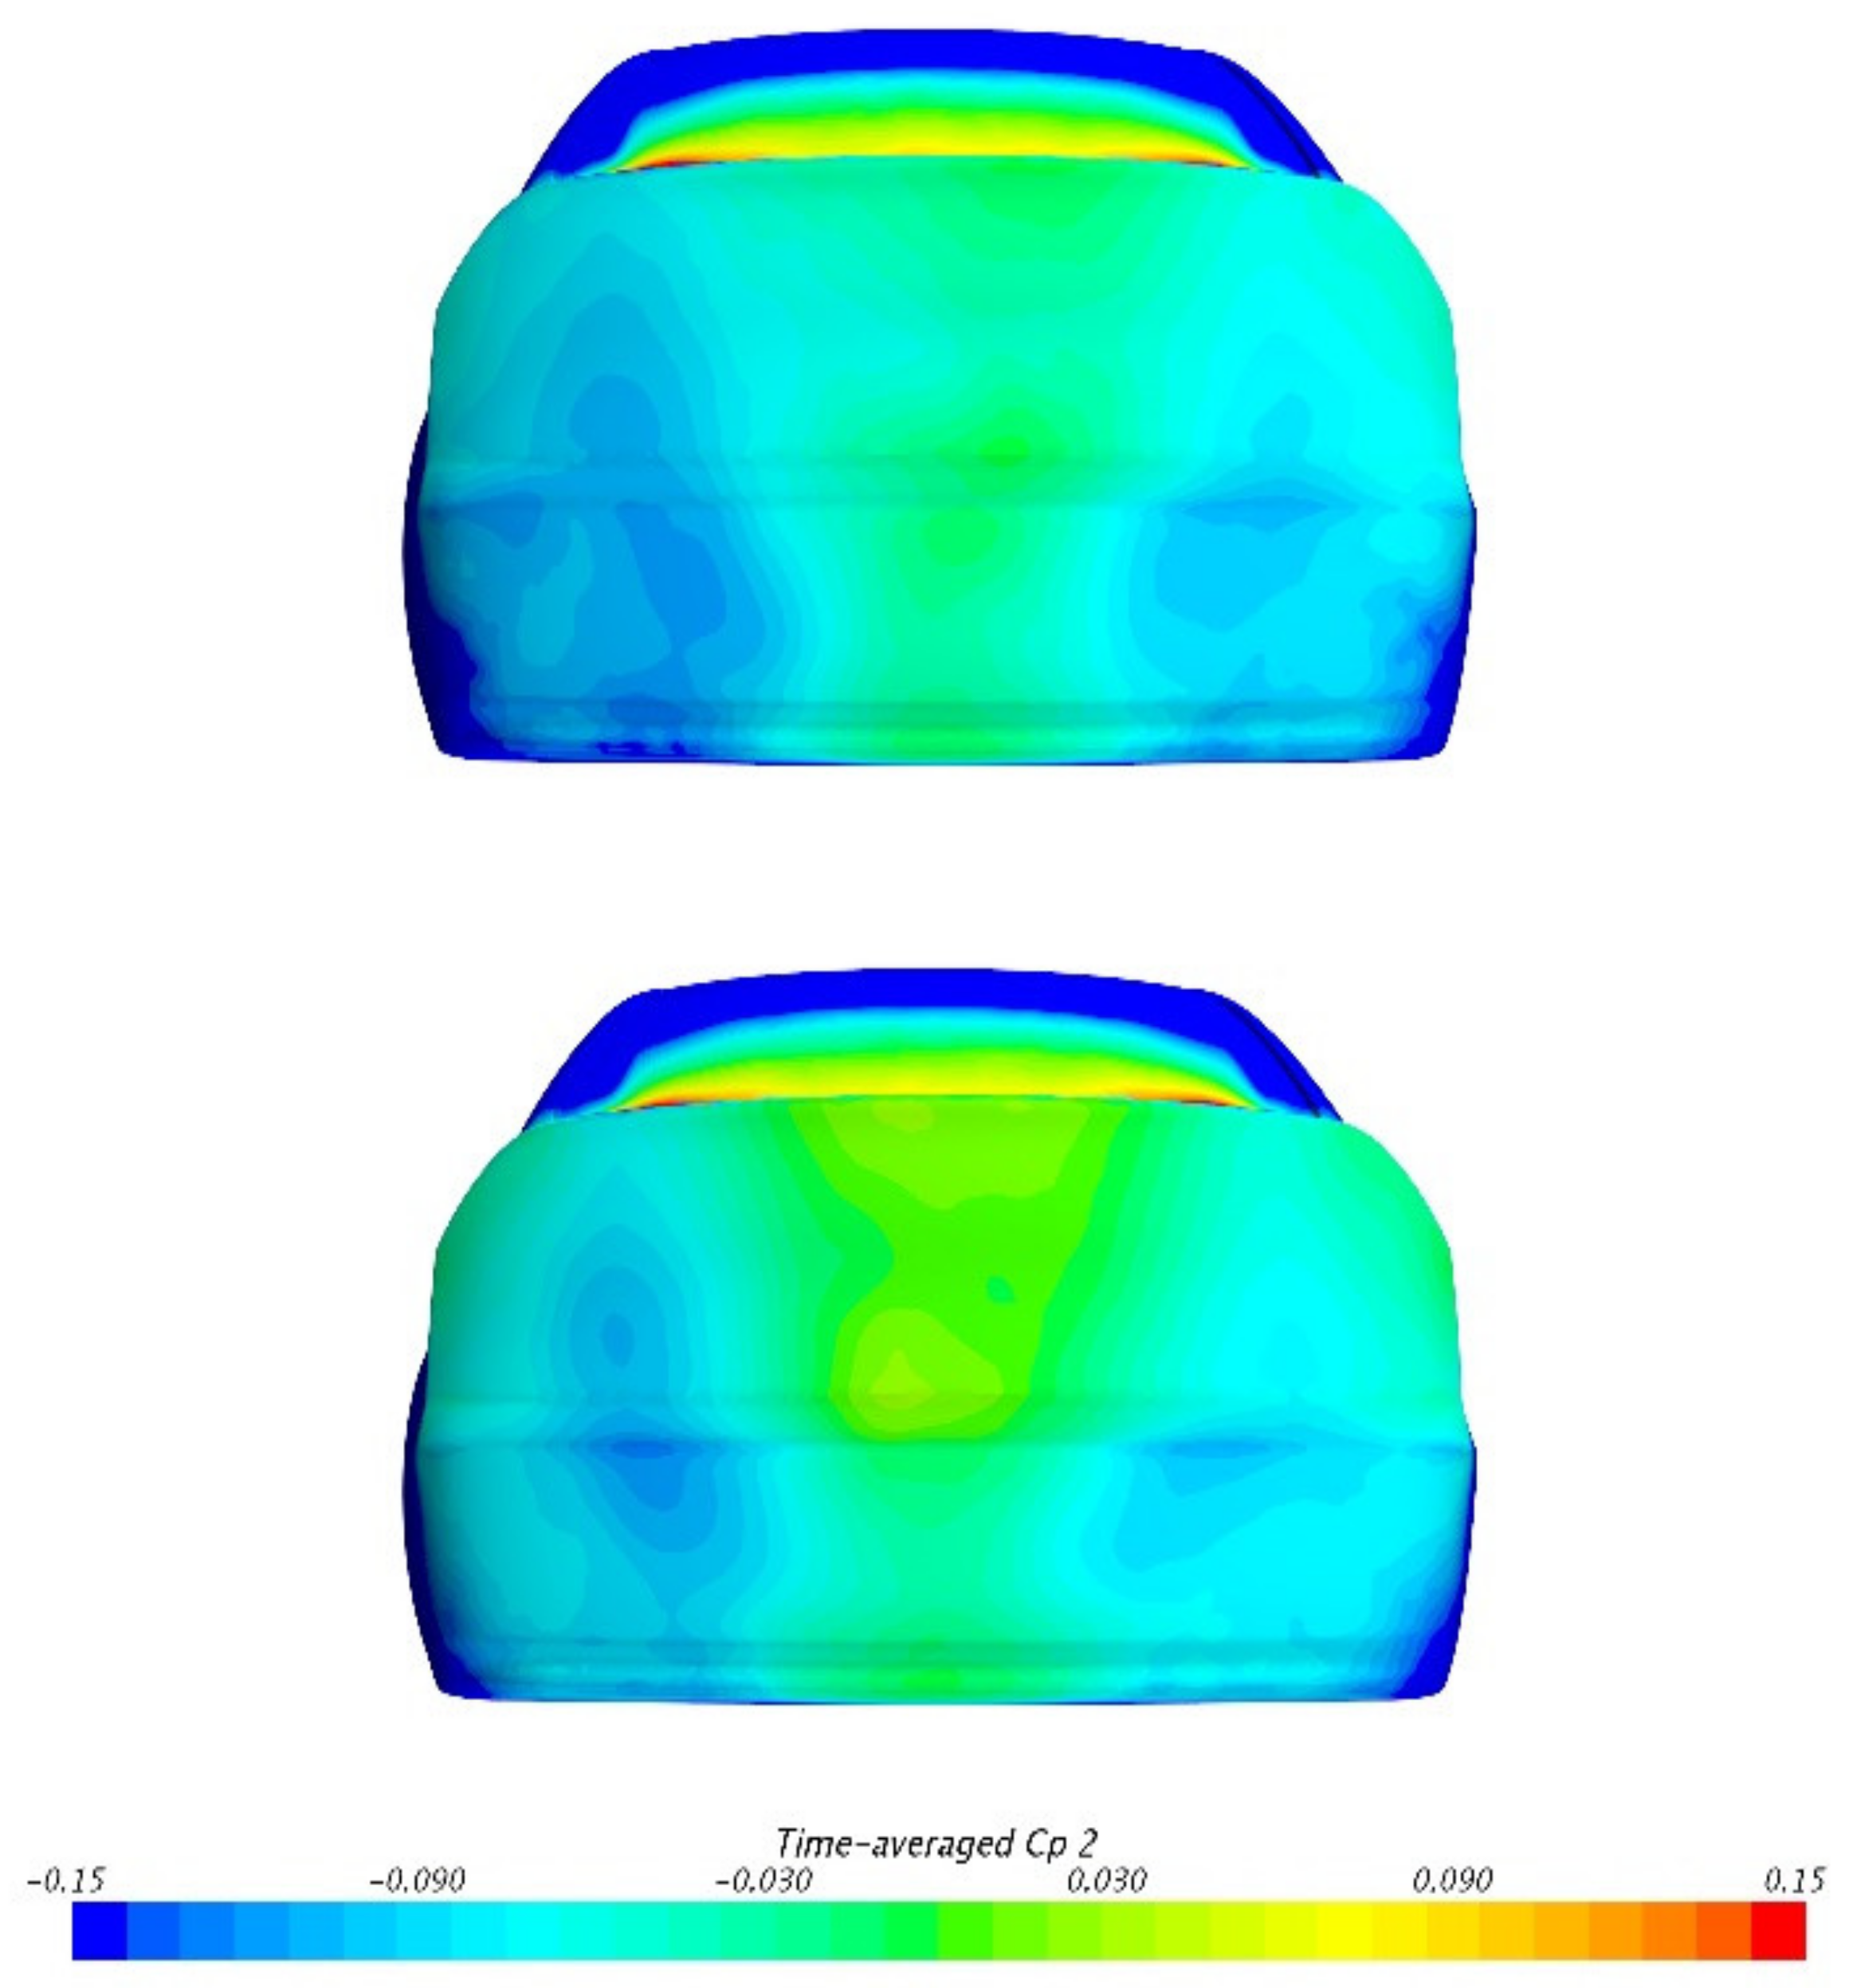
As the drag of the car body is mainly affected by the base pressure, it is necessary to investigate the pressure distribution on the base, seen in Figure 6. It must be mentioned that, in this study, the flow field results around the wake base are not completely symmetrical. It is considered that this phenomenon may result from numerical error from the time-averaged results. However, as the asymmetry of the results is not fundamental and they can still illustrate the main flow field characteristics, they are still considered acceptable. It can be seen that the base can be divided into four sub-regions according to the pressure distribution: Region A and B on the two sides of the base. These two sub-regions account for about 69% of the total base area and the pressure on them is relatively low. Region C is on the upper middle part (24% of the total area) and Region D (7% of the total area) on the lower middle part.
Detailed average CP values in these sub-regions are listed in Table 5. As the pressure distribution is not completely symmetrical, Region A and B are considered together. Compared with SGSW, the pressure on Region C is significantly higher in MGRW. The pressure on Region A&B also increases slightly, but the pressure on Region D decreases. The overall pressure discrepancies are consistent with the changes in the CD body. It must be noticed that, although the area of Region C is smaller, its pressure recovery is about five times larger than that in Region A&B; therefore, this sub-region has the dominant effect on total drag reduction. It can be supposed that Region A and B are related to the wakes of the rear wheels, as the rotating wheel can weaken the vehicle wake near the side of the base [3]. However, Region C and D are not clearly related to the wheels and ground; therefore, further investigation is required.
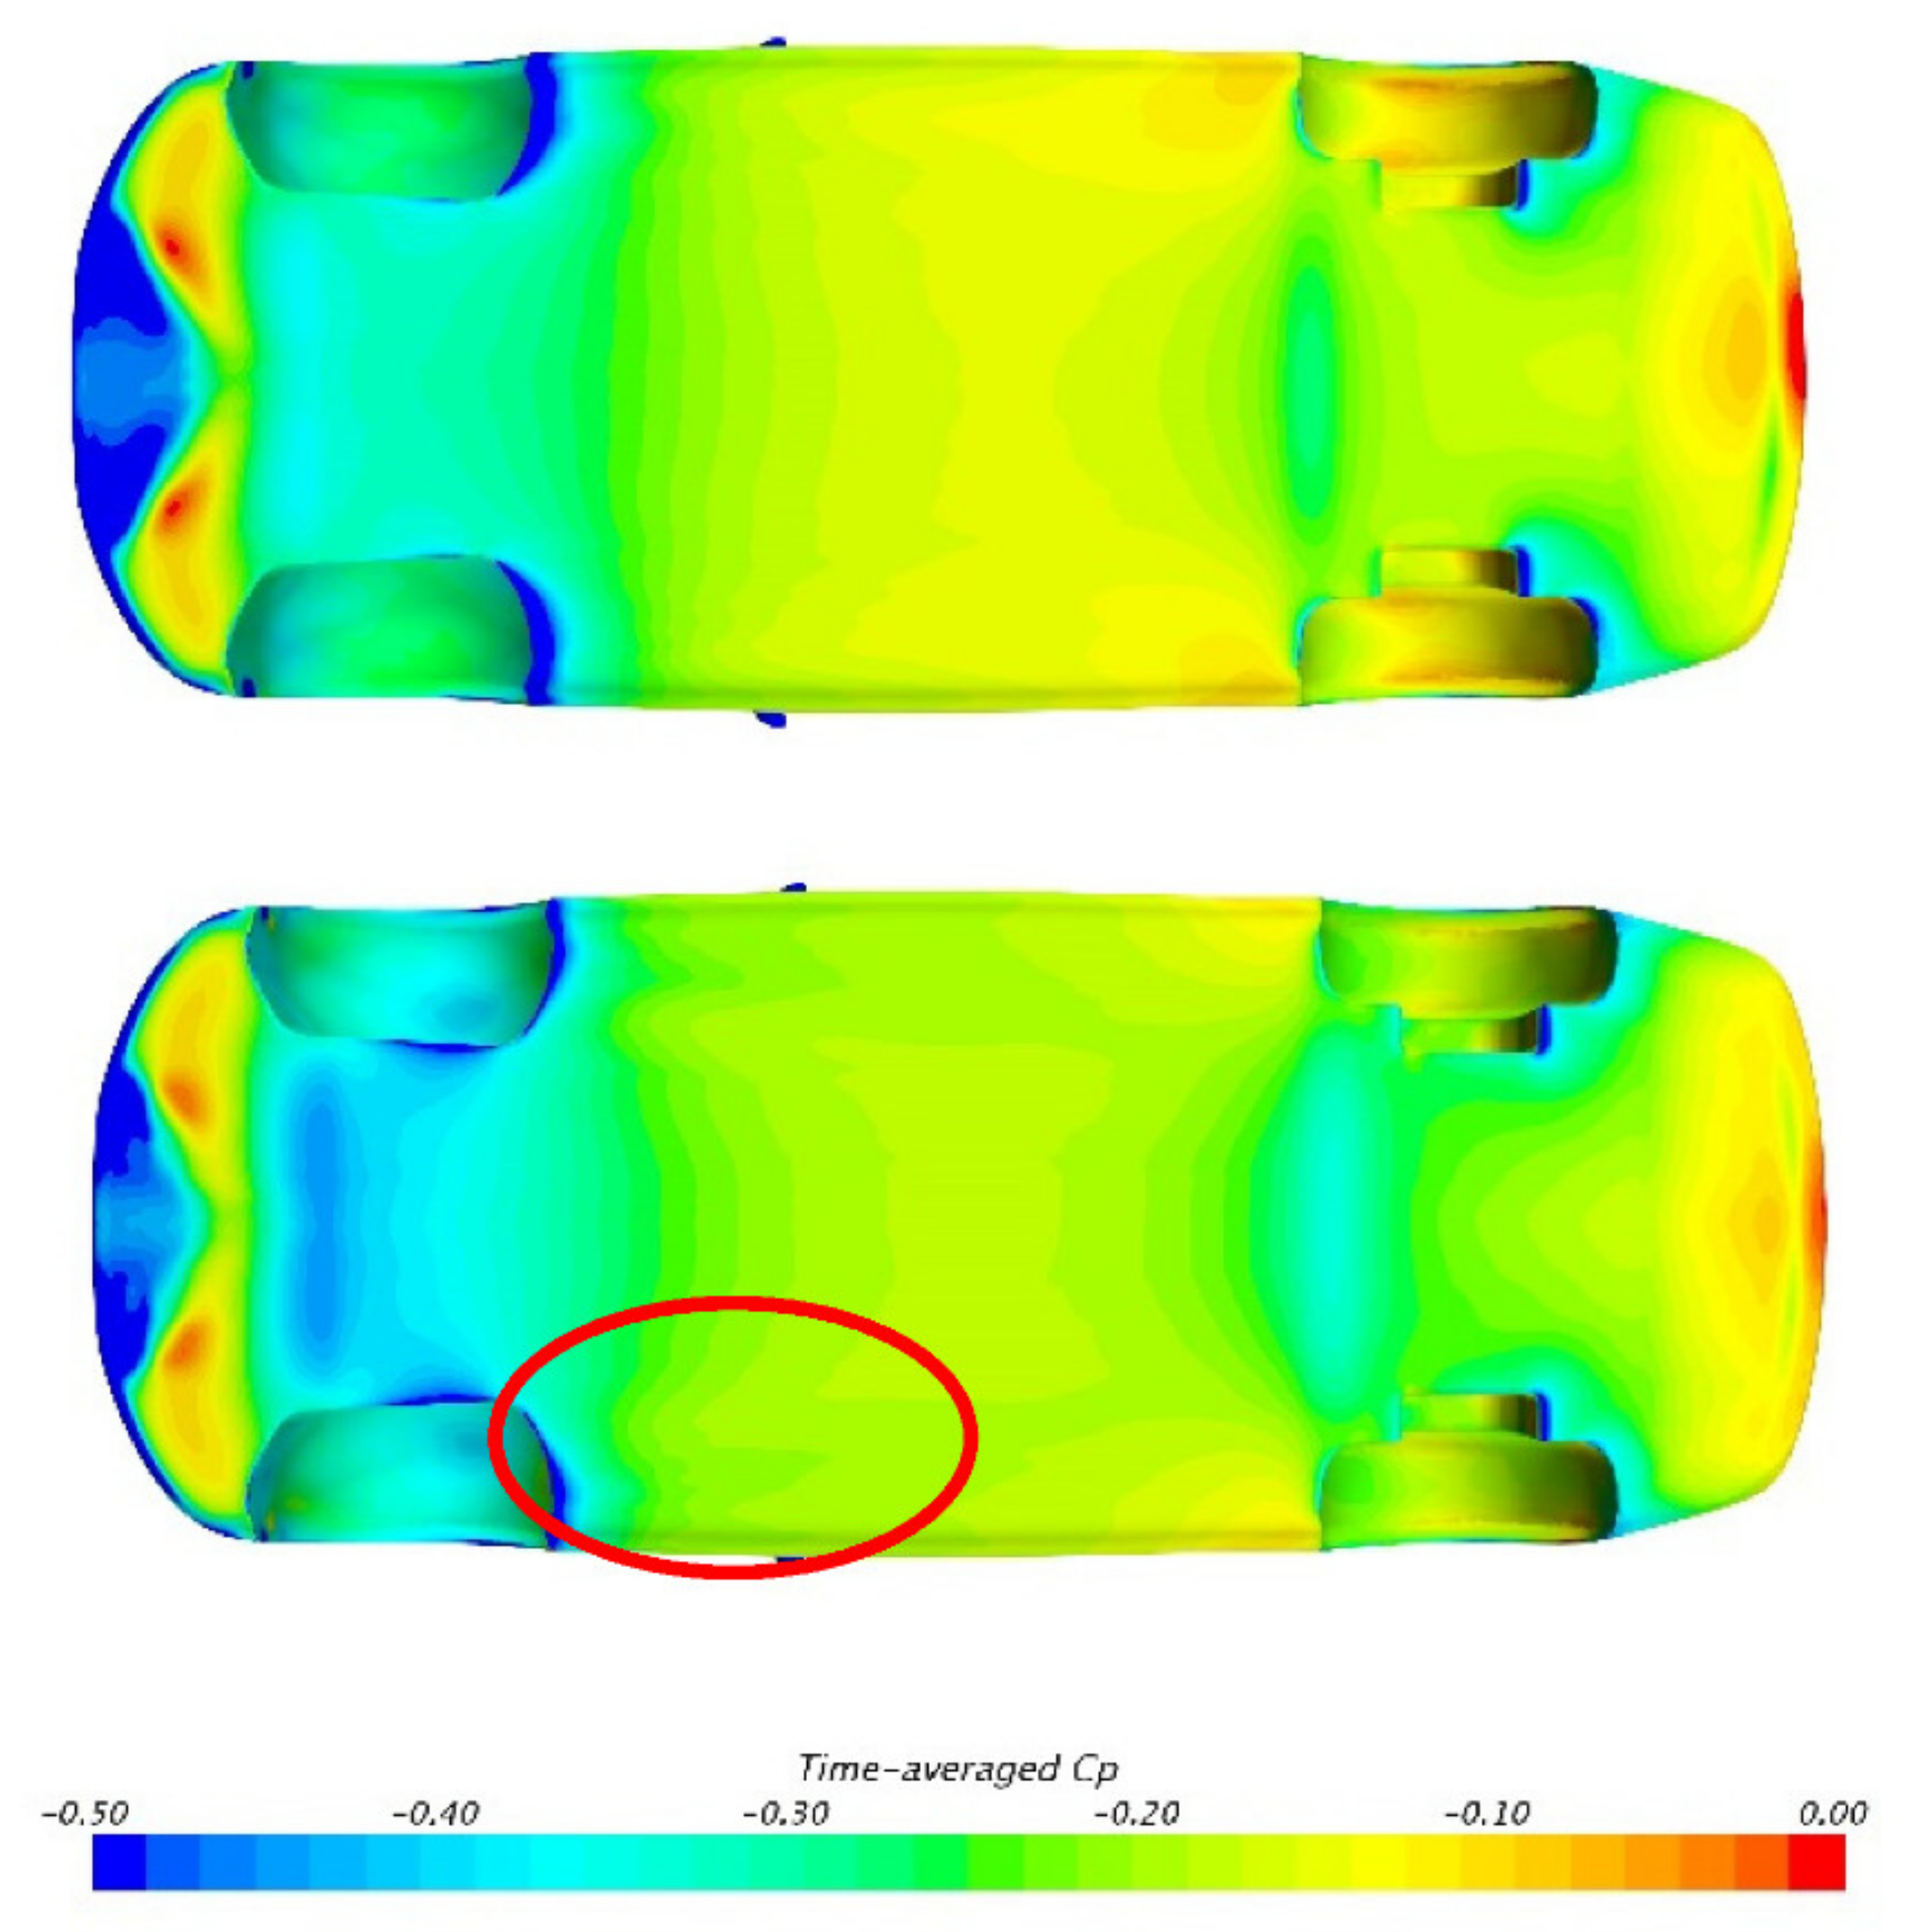
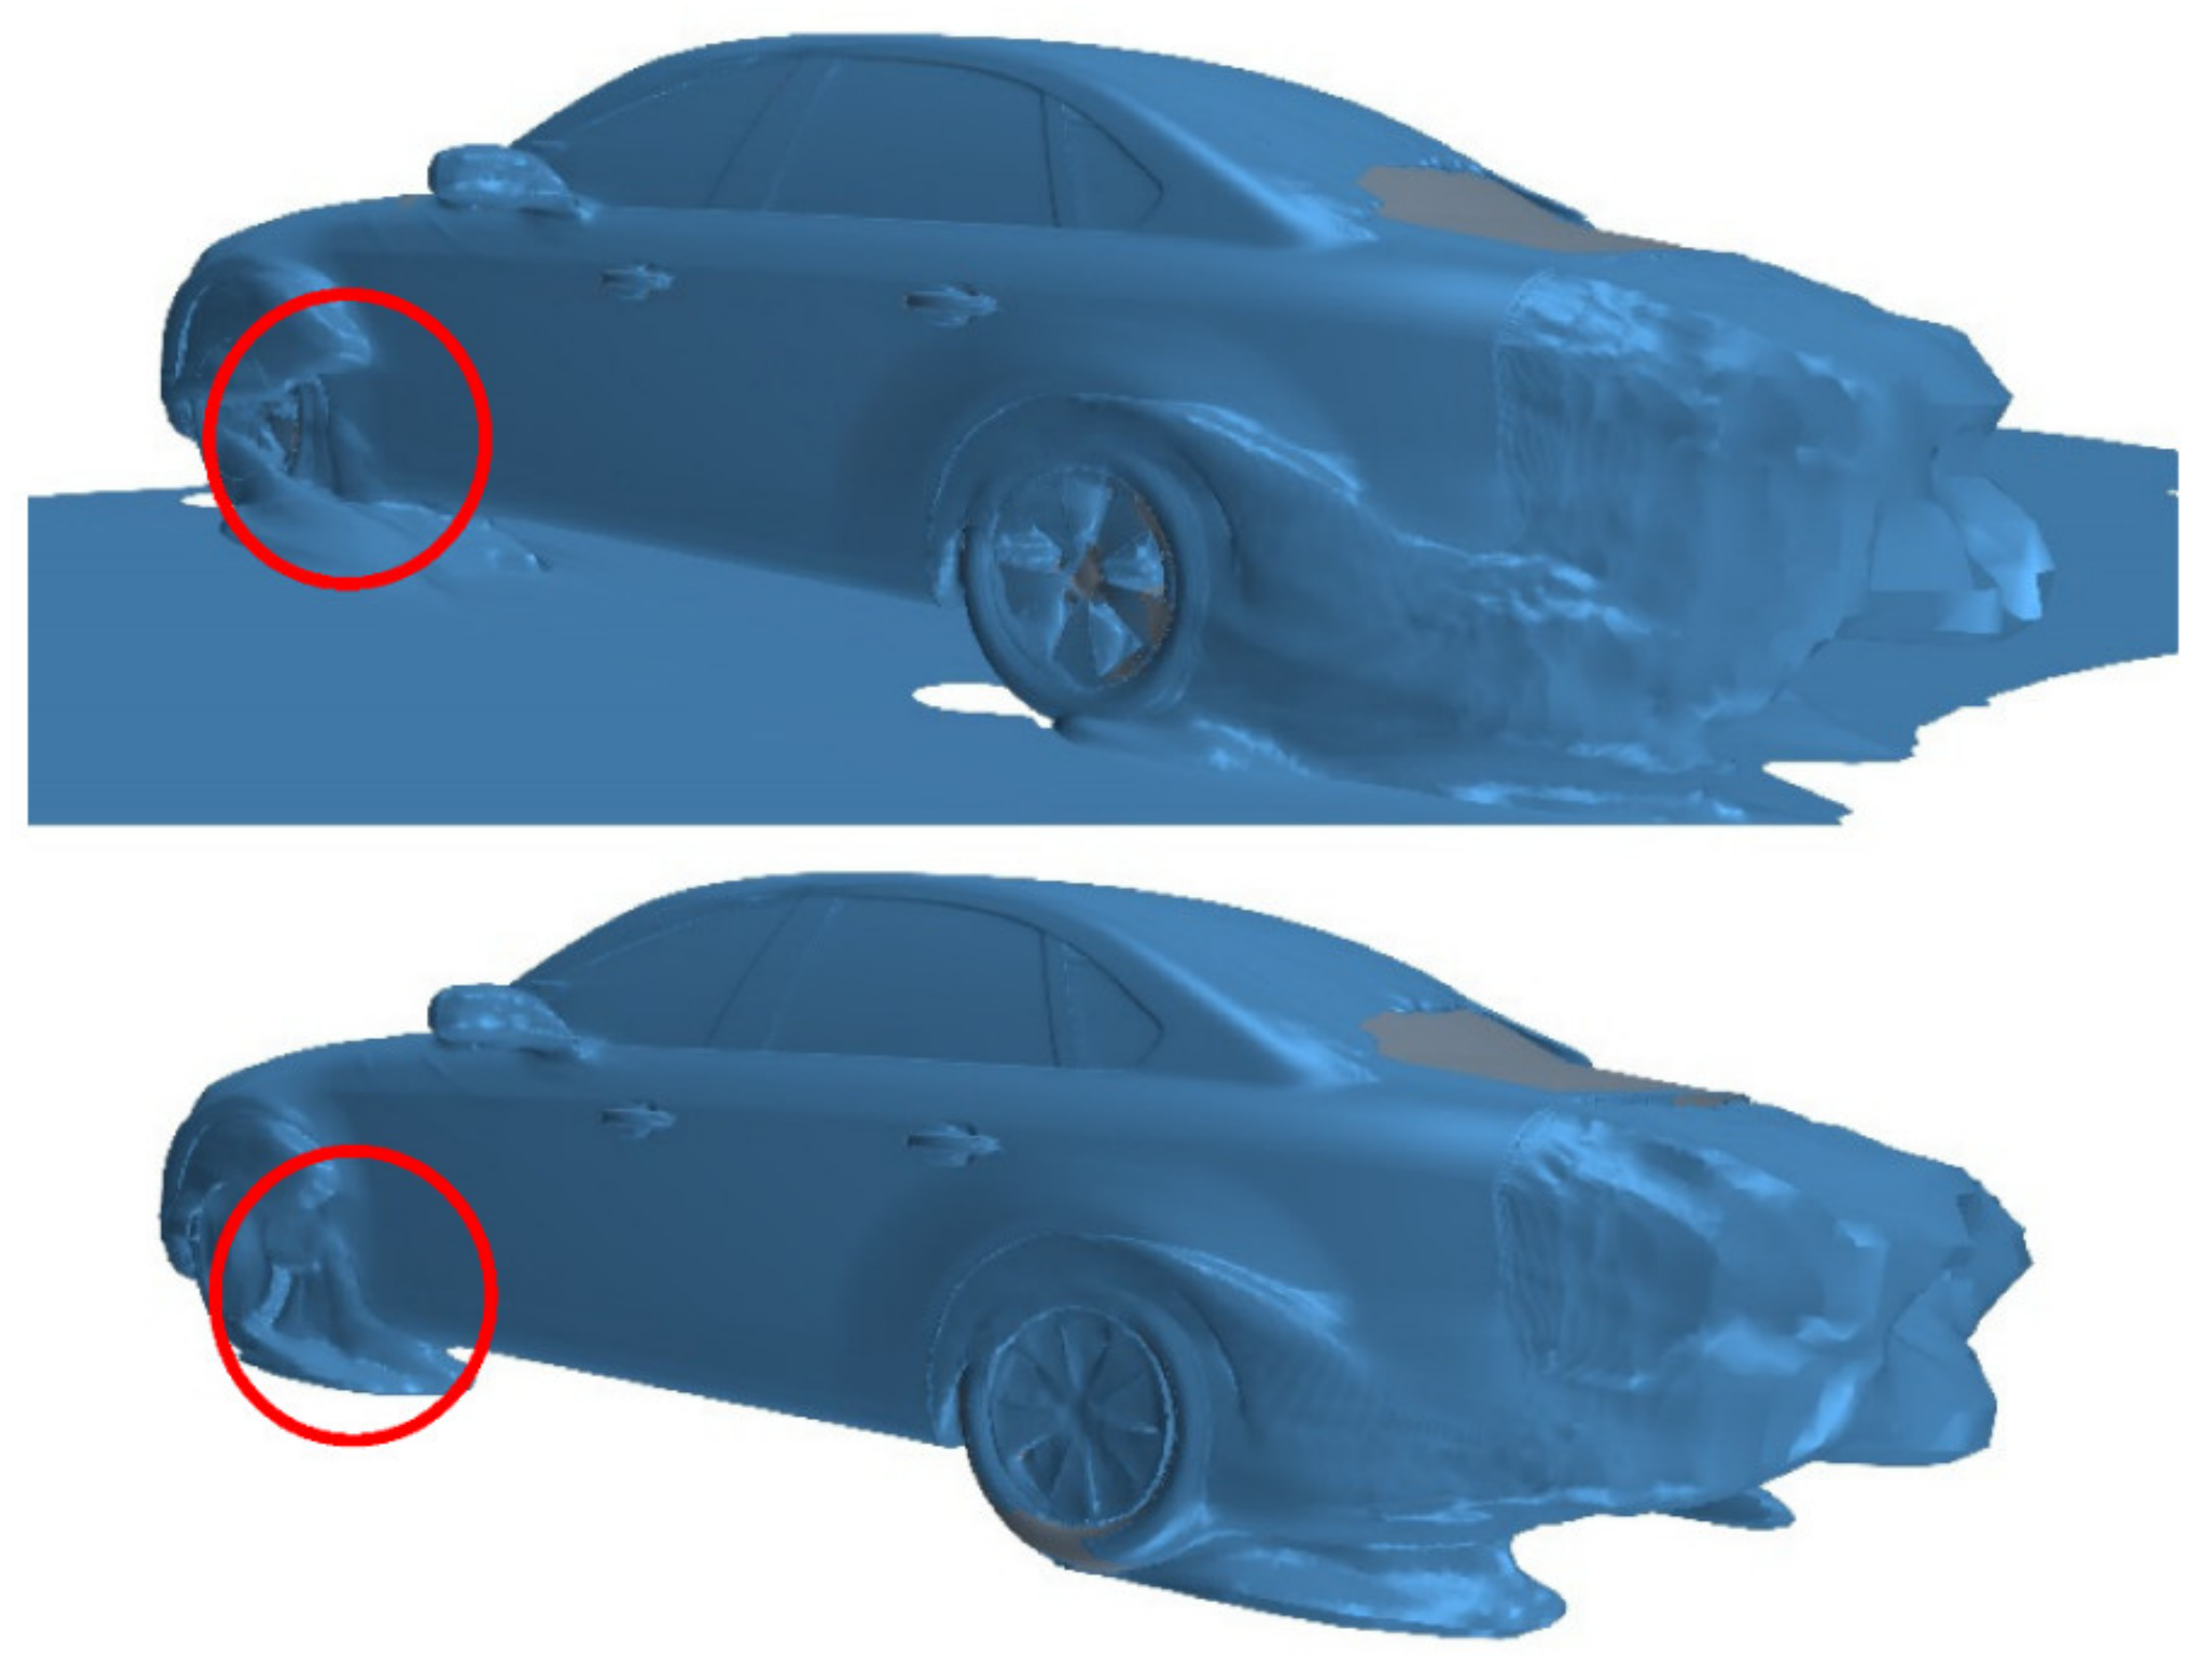
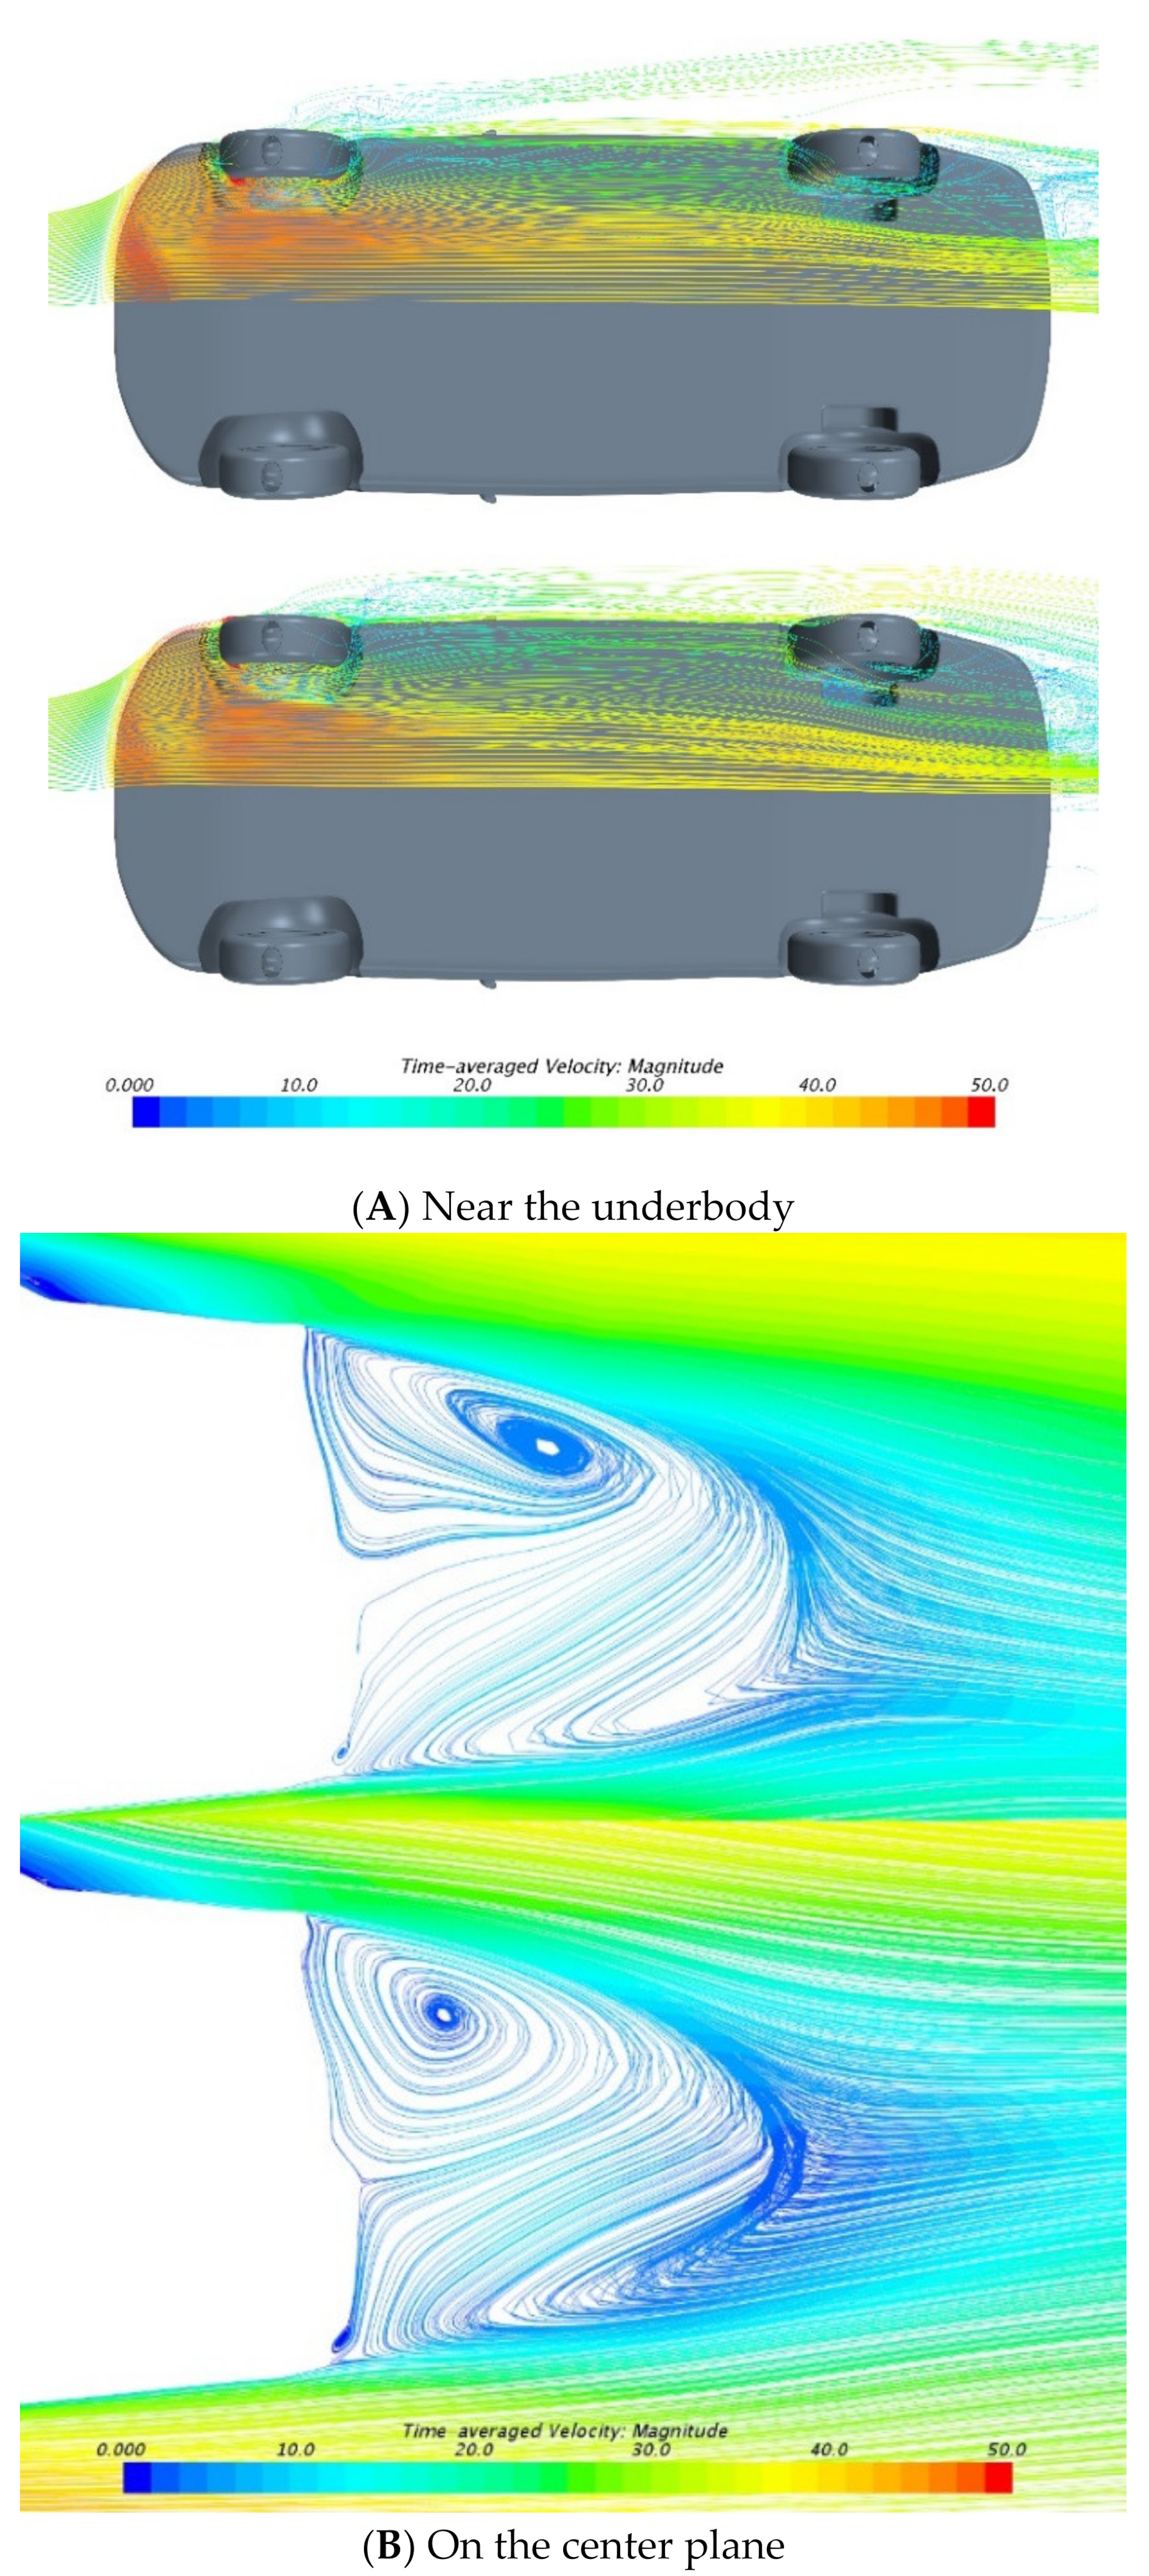
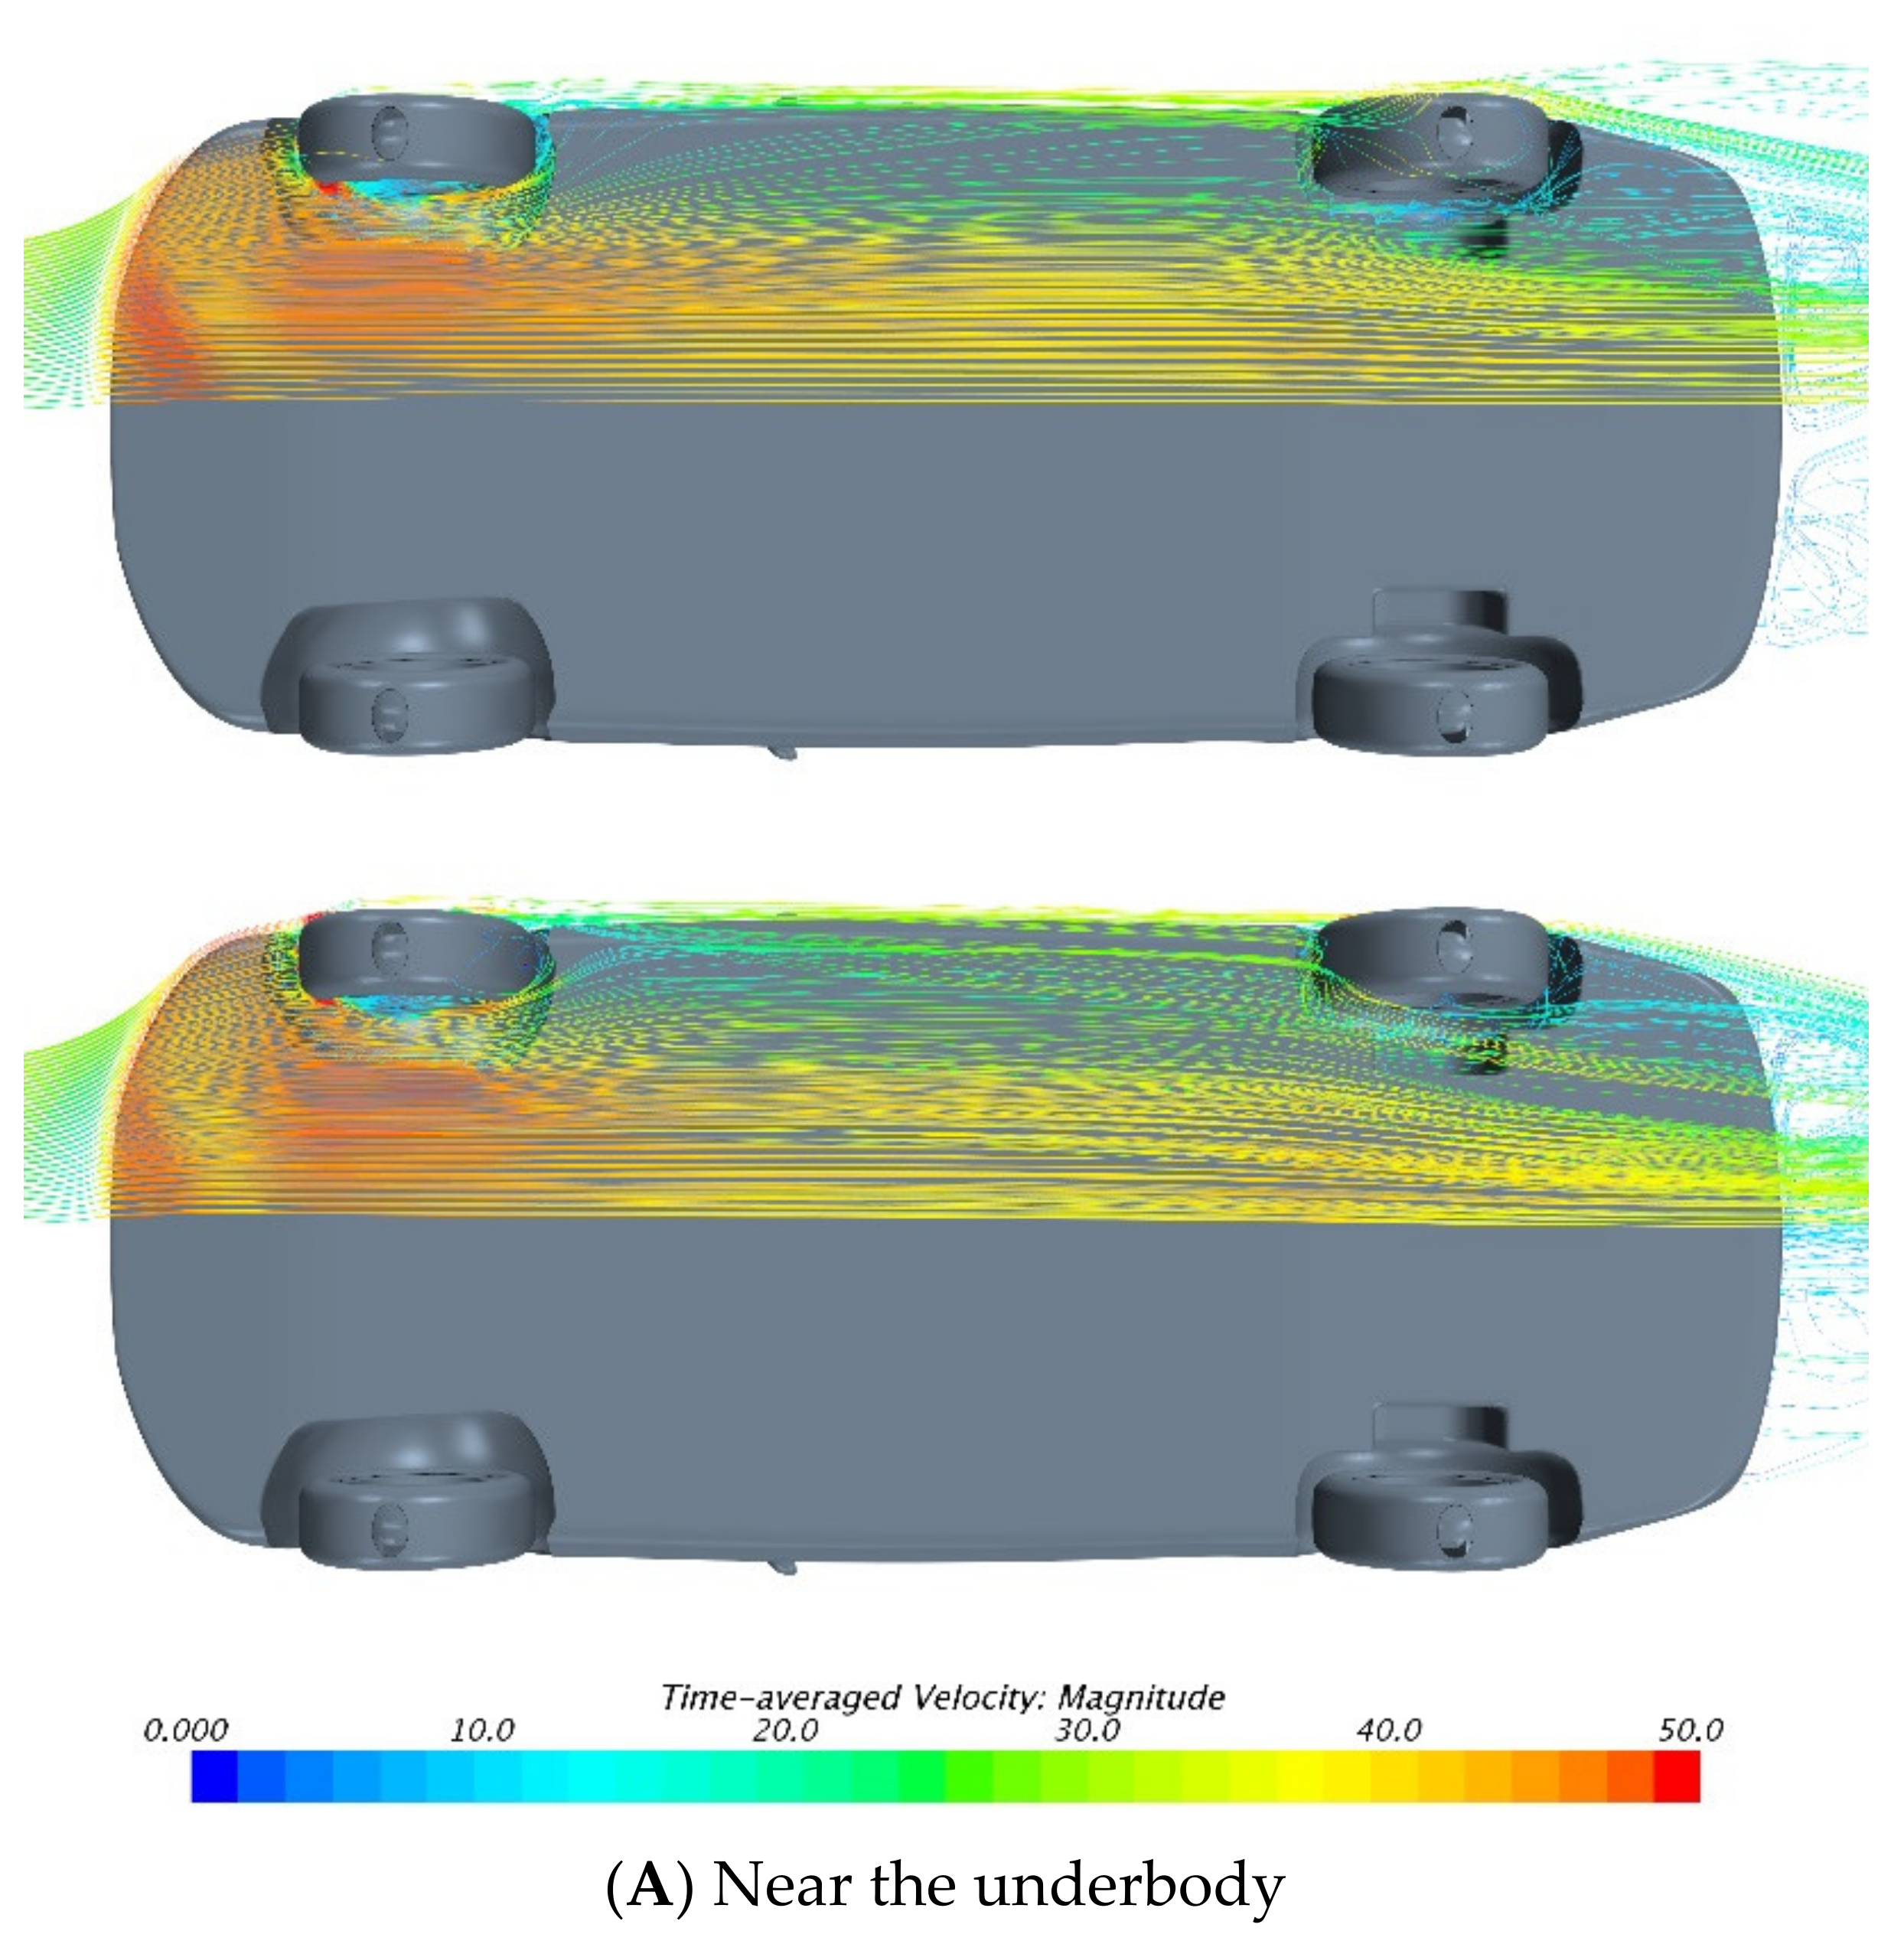
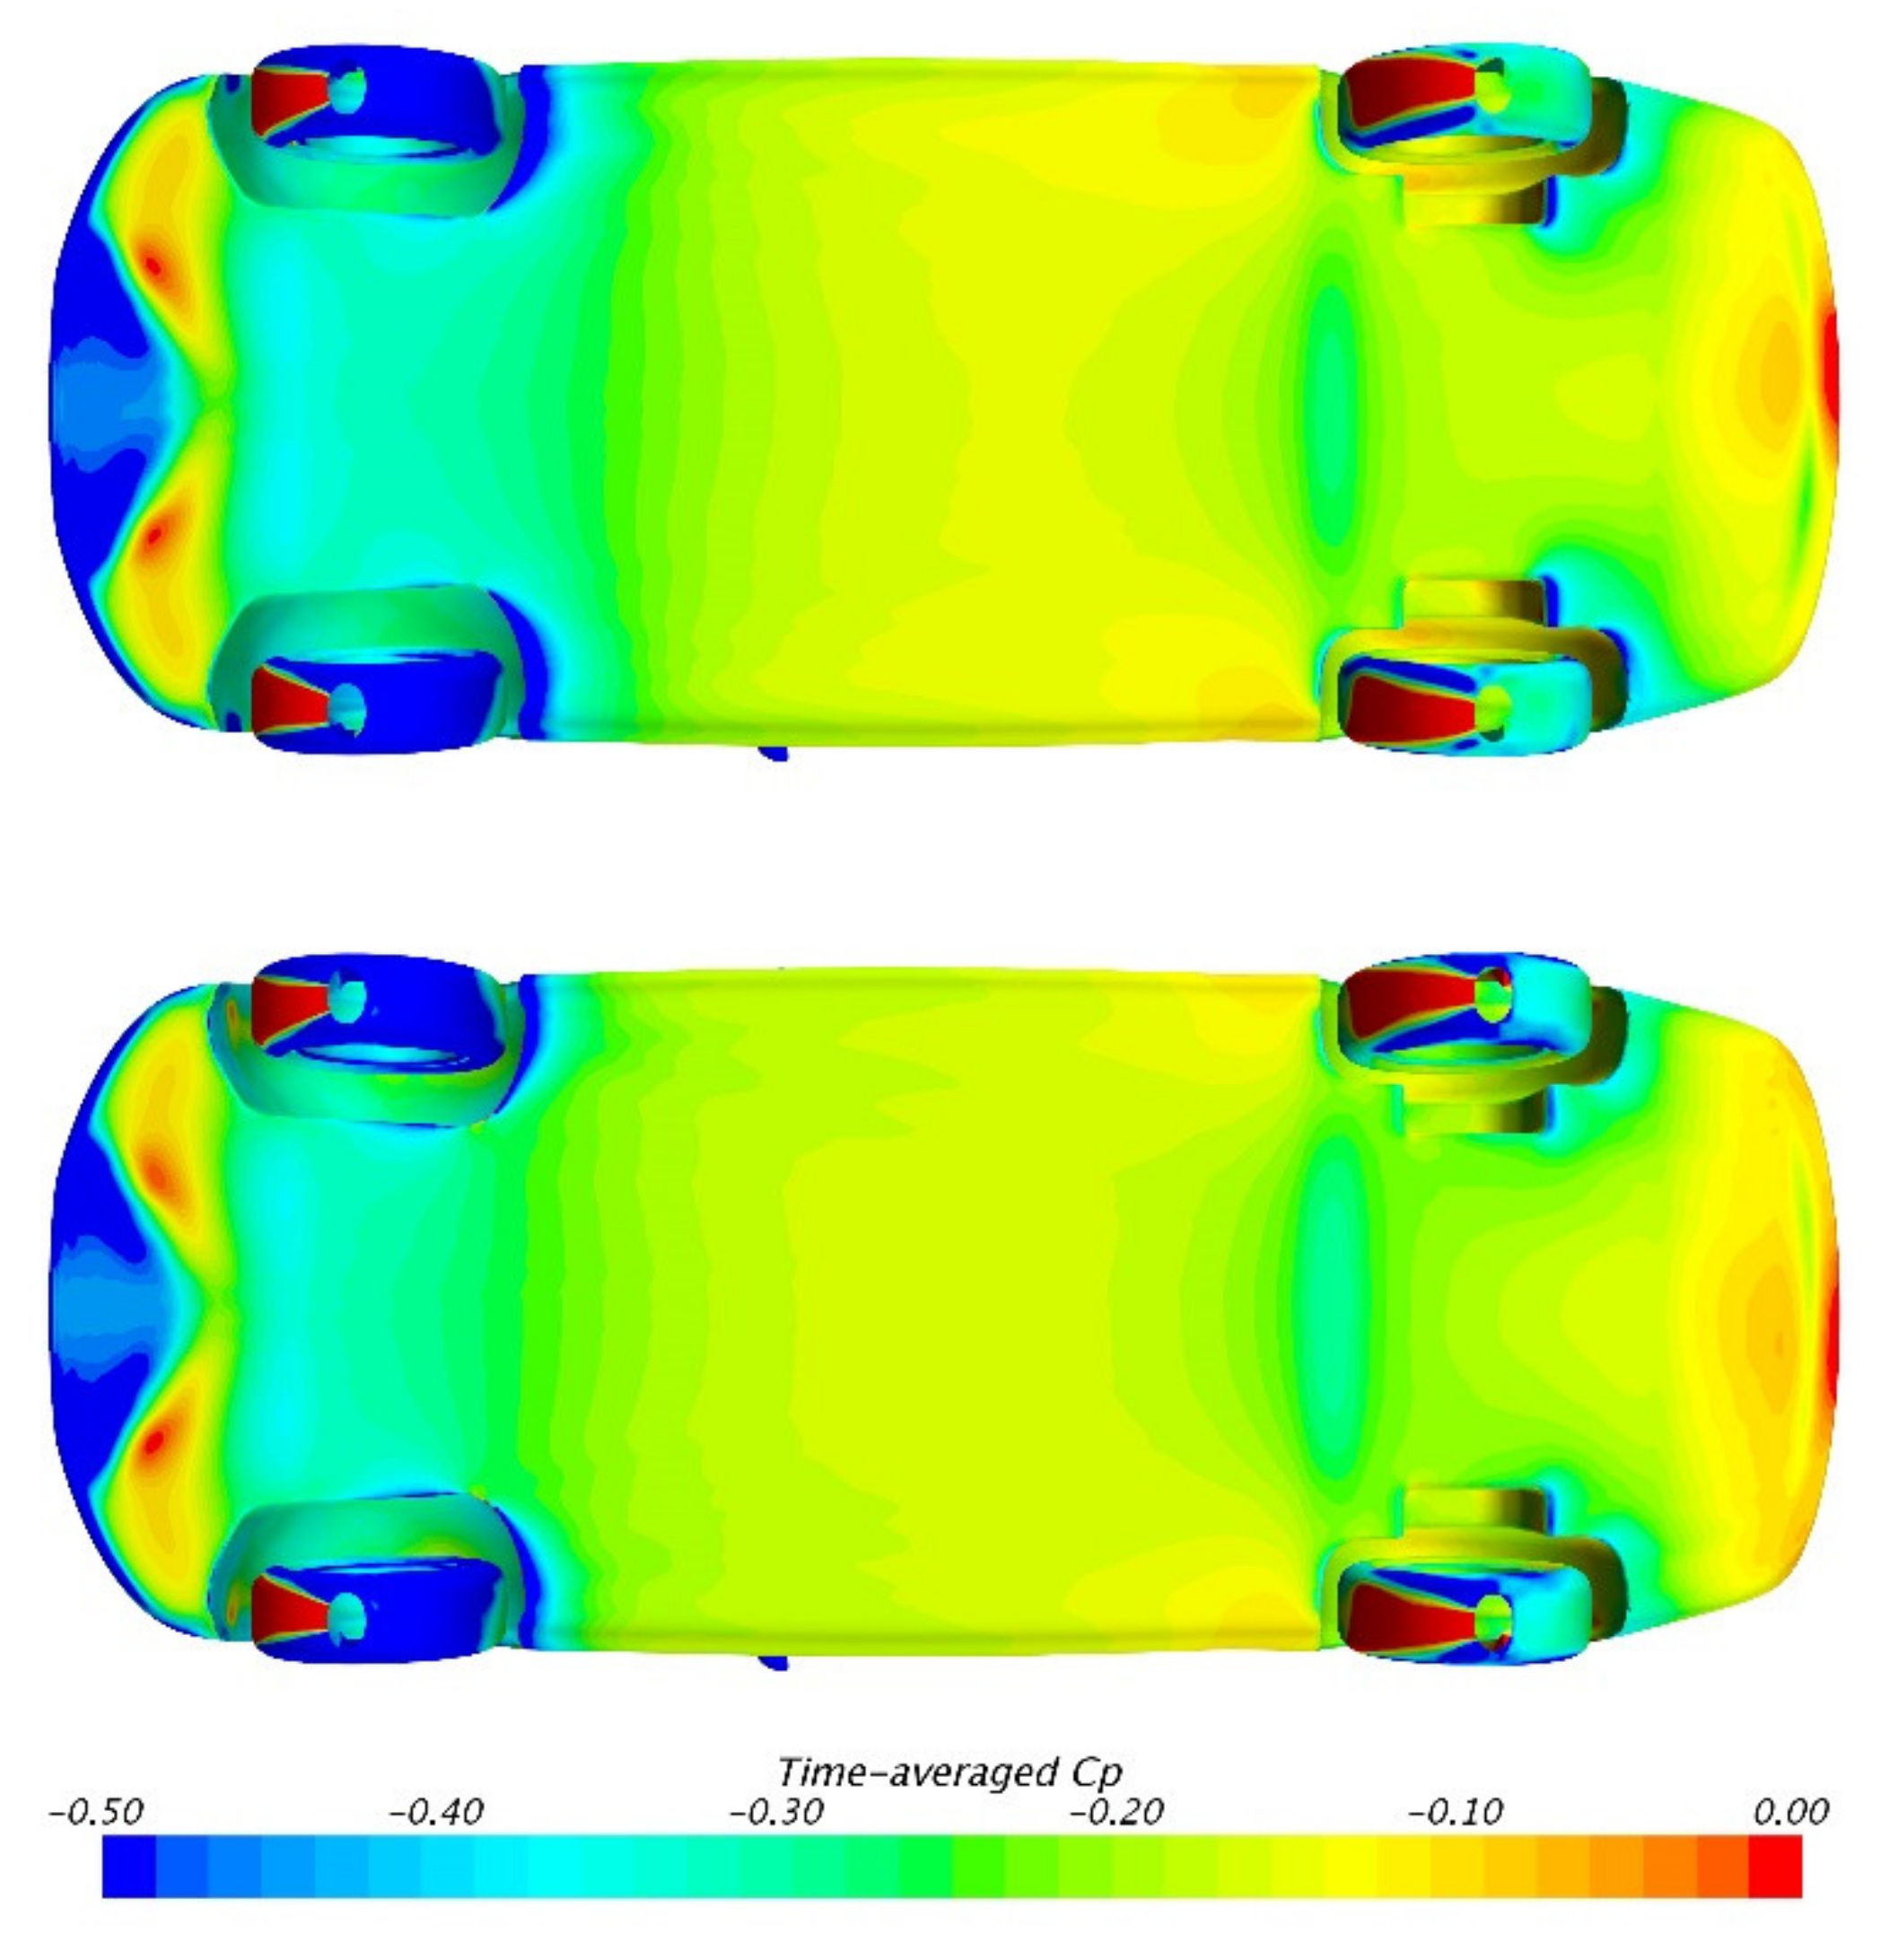
Figure 7 illustrates the pressure distribution on the underbody. It is shown that the overall pressure in MGRW is obviously lower than SGSW, which corresponds to their lift coefficients. The decreased underbody pressure is supposed to be generated by the increased velocity of underbody flow, as the moving ground condition can eliminate the ground boundary layers. Moreover, another phenomenon that should be noticed is the low-pressure region behind the front wheelhouses in MGRW (marked in the red oval). However, as mentioned in previous studies, because the rotating wheel can reduce its own wake [3,12], the results in Figure 7 seem to be in contradiction.
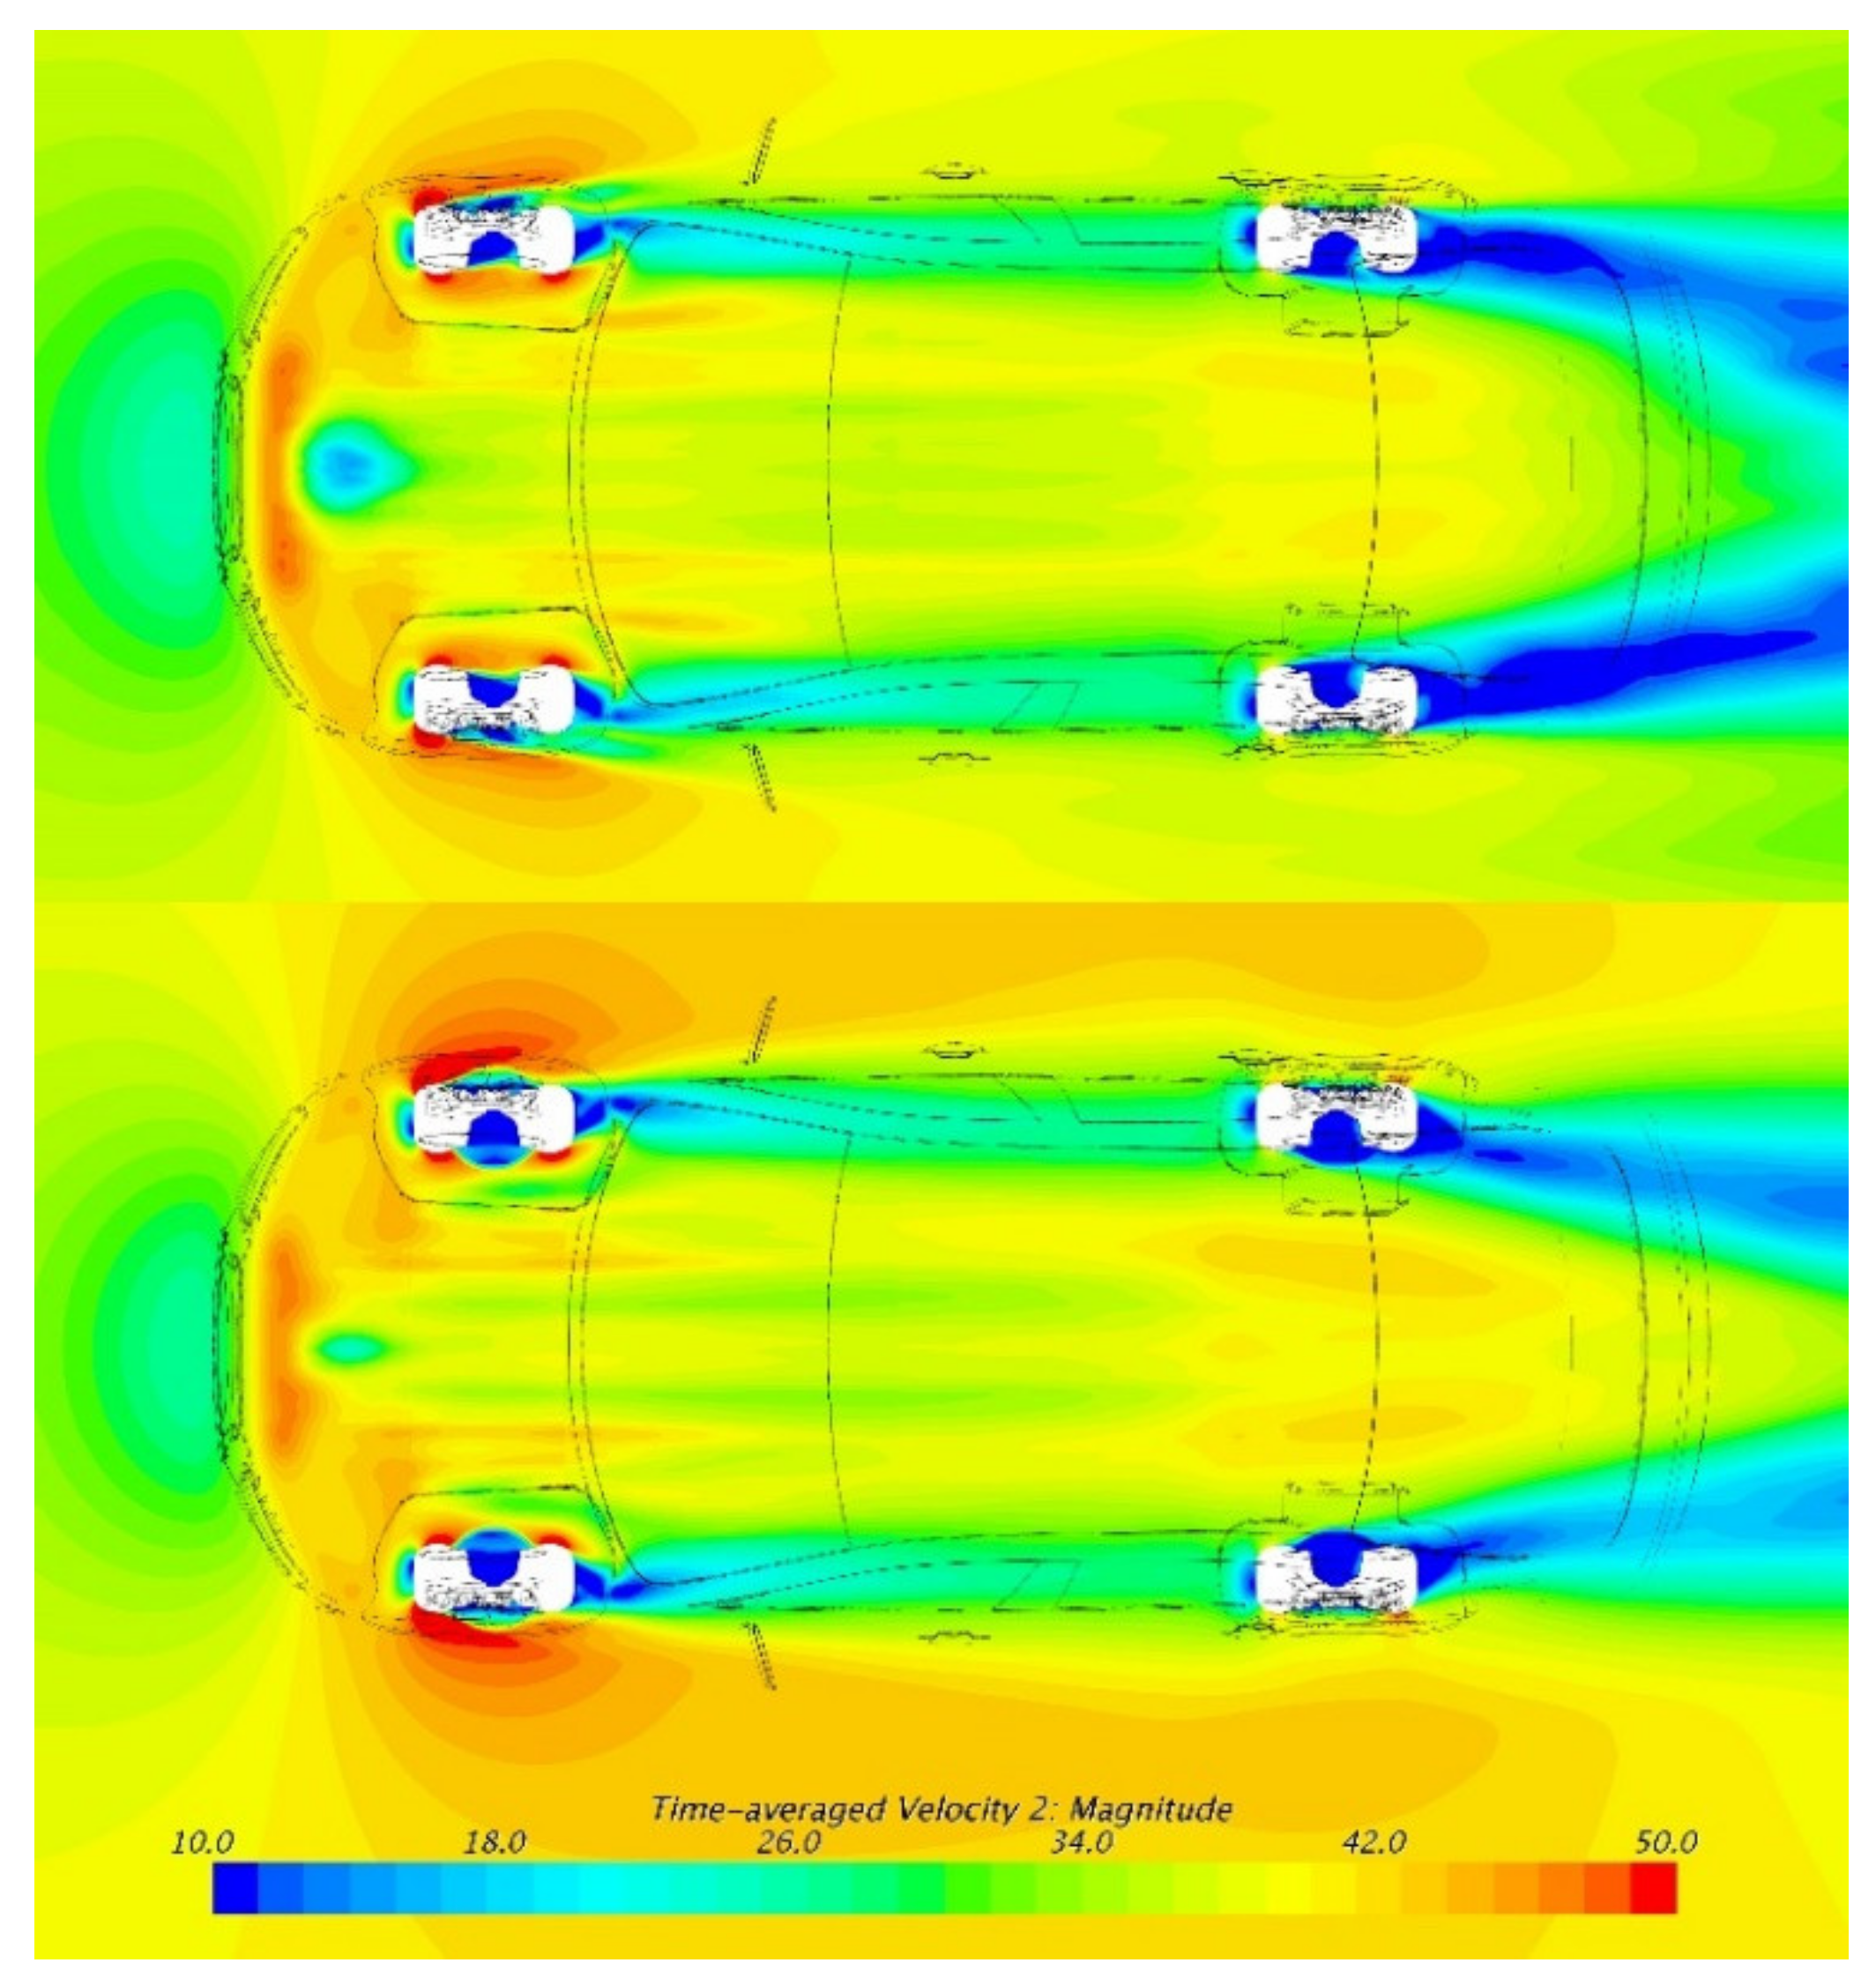
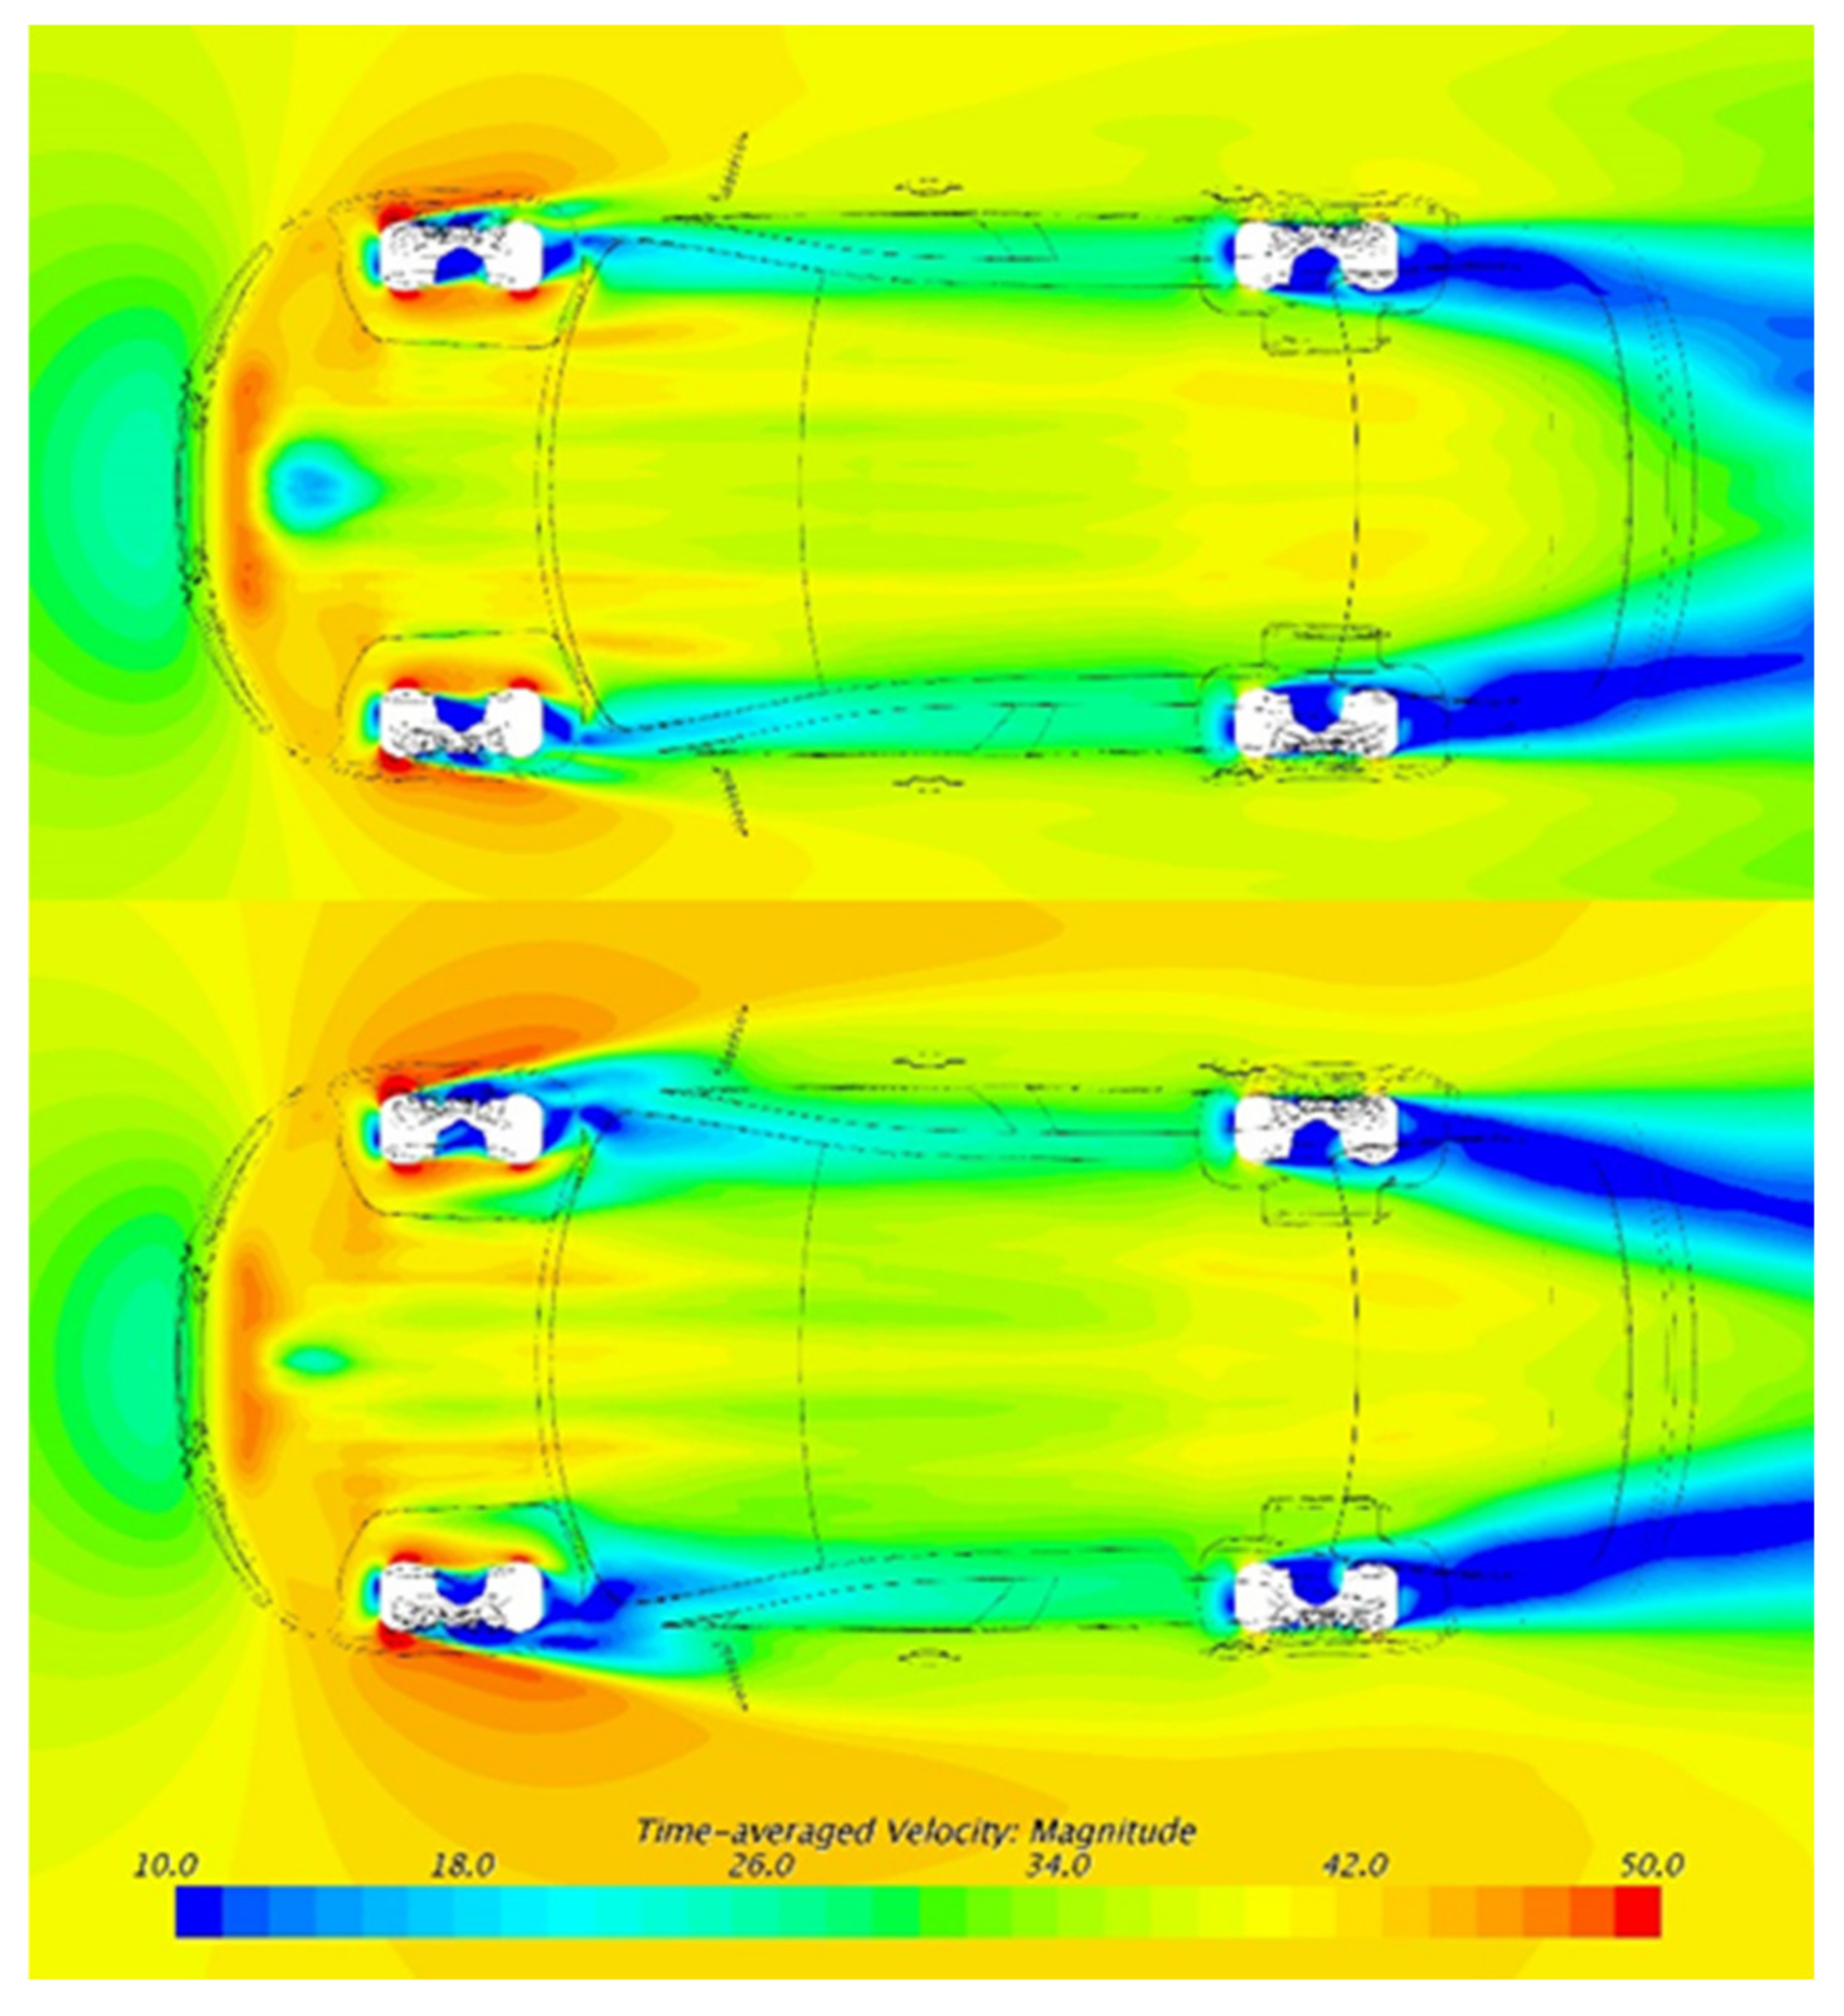
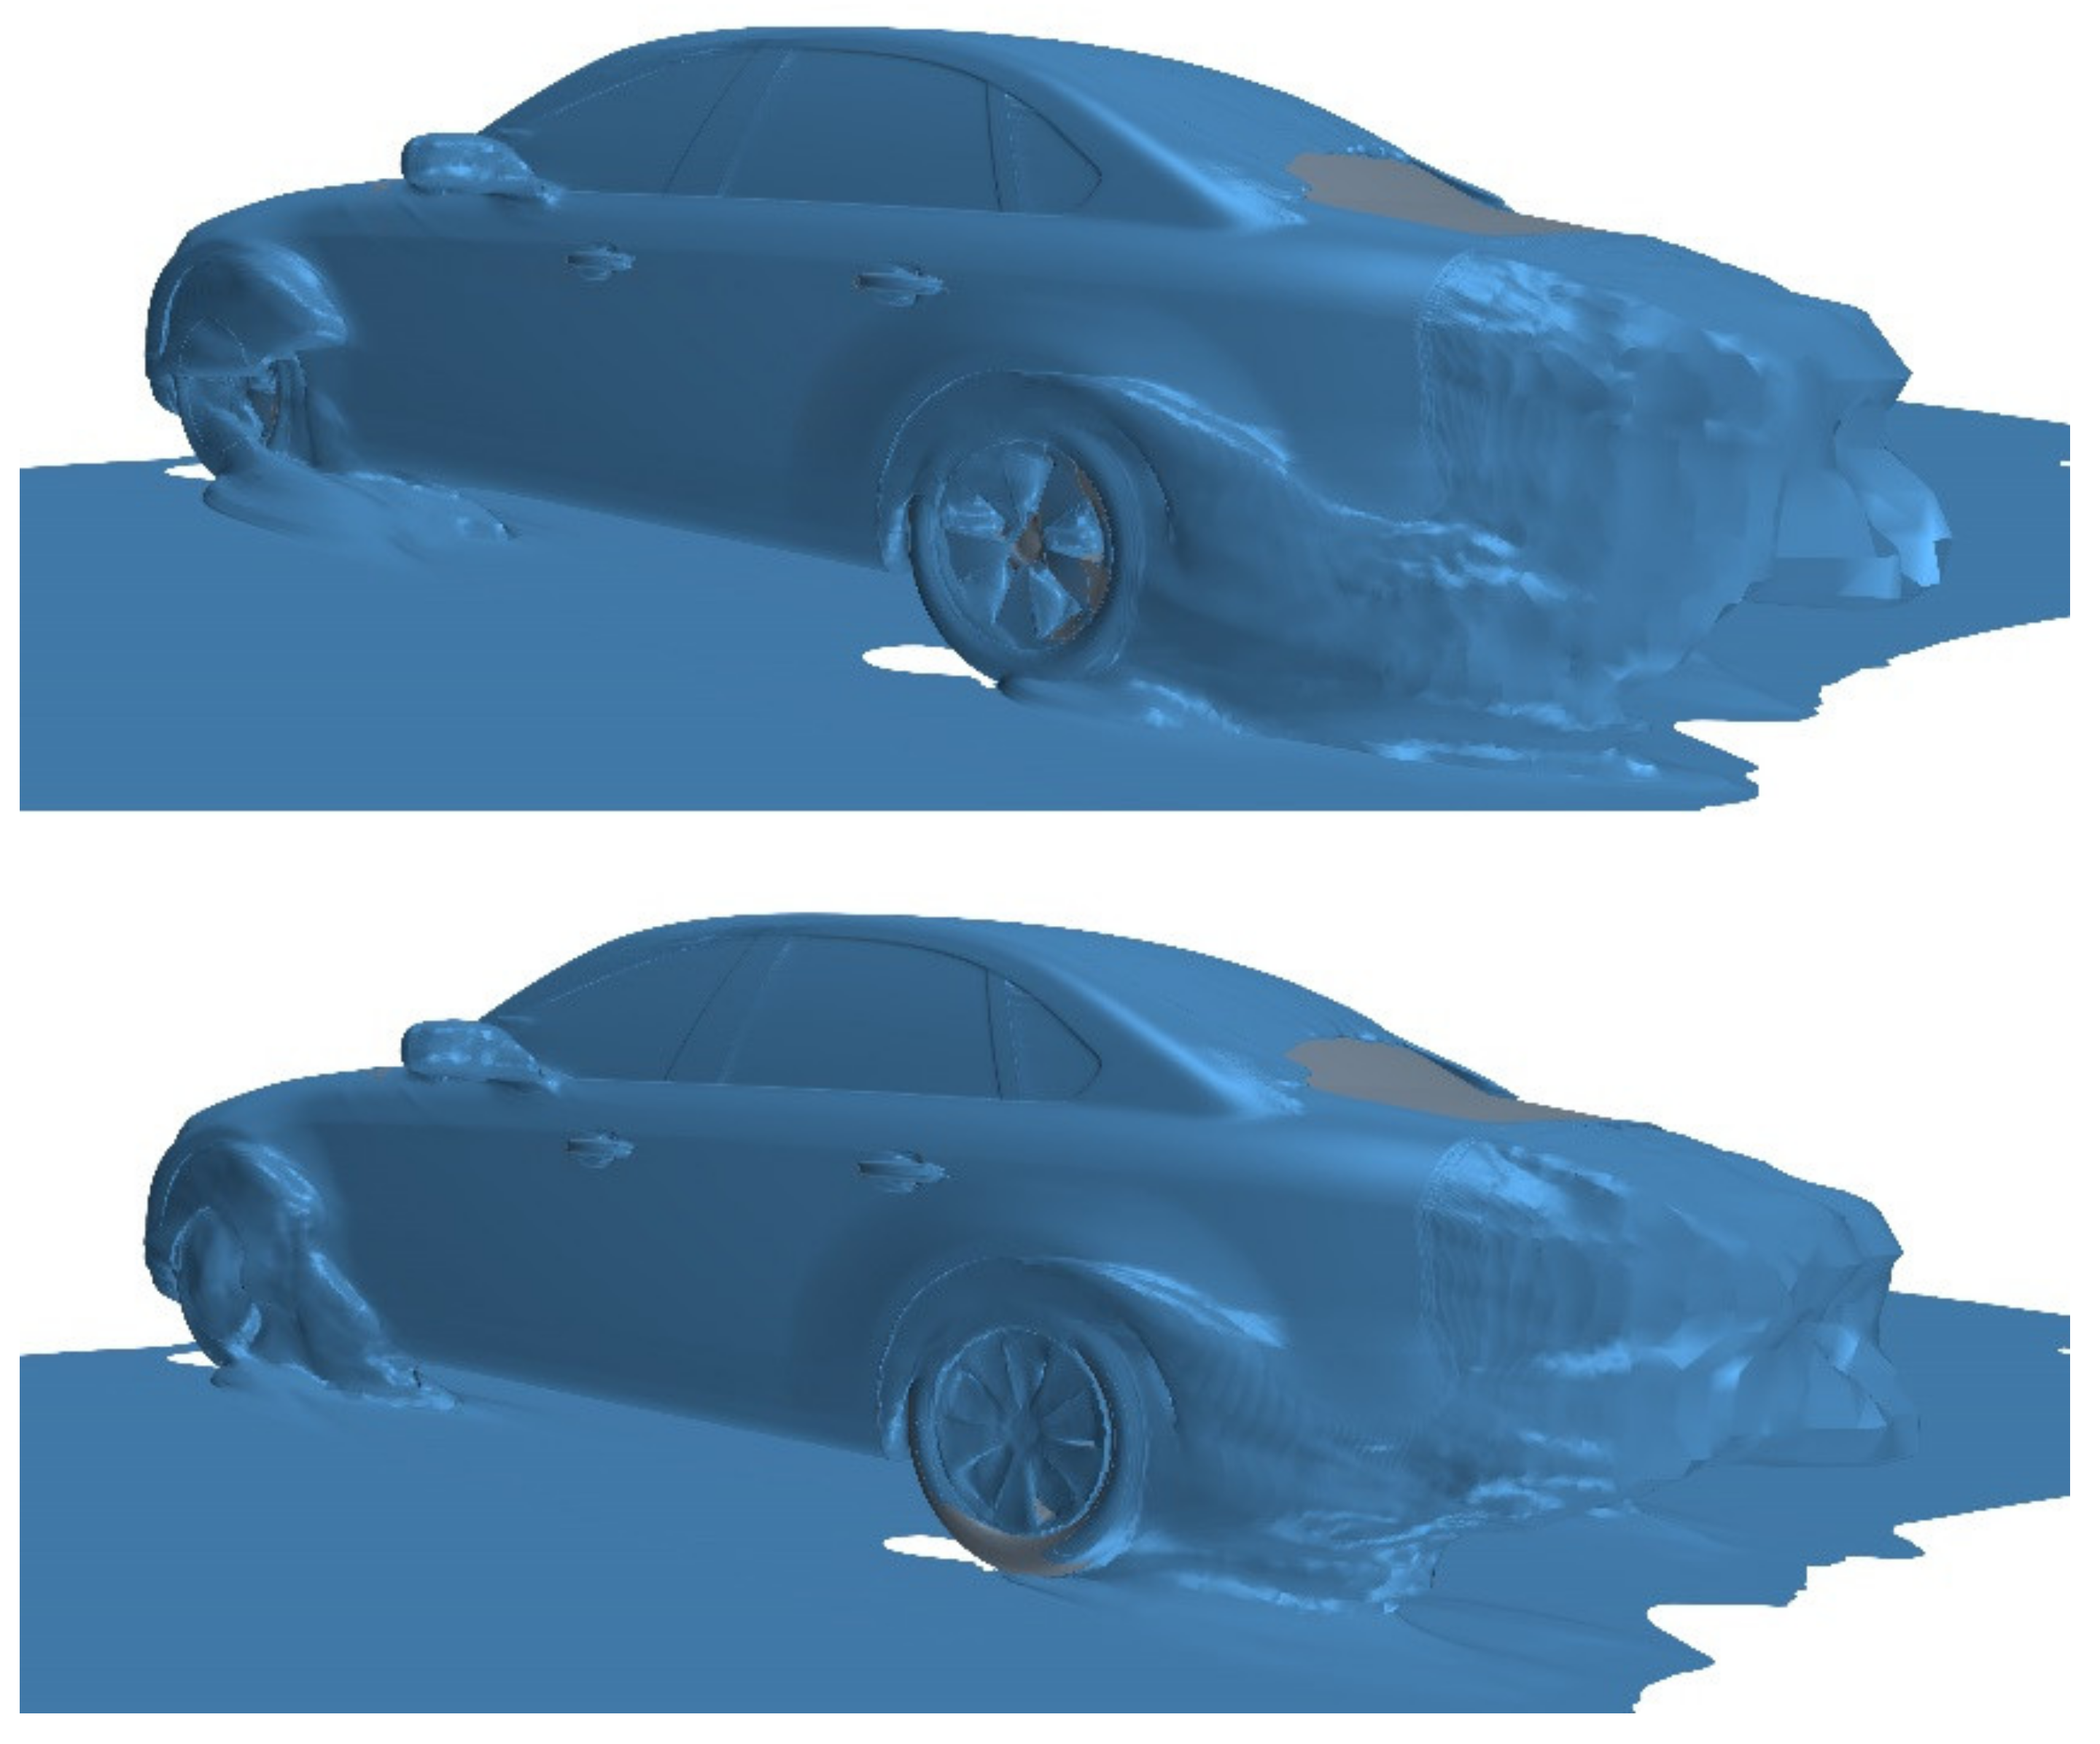
Figure 8 shows the time-averaged velocity contour on z = −0.07 m plane. This plane is located beneath the underbody. It can be seen that the velocity after the rear wheels significantly increases in MGRW, which can prove that the rear wheel wakes are weakened by rotating wheels. The width of rear wheel wakes is also reduced, which accelerates the flow between the wheels. Furthermore, the wakes of the front wheels are not obviously altered, which means that the wheel rotation mainly affects the rear wheels.
The total pressure coefficient (CTP) can be applied to describe the vortex structure in aerodynamic analysis. Figure 9 illustrates the iso-surface of CTP = 0, and the differences of the wheel wakes between SGSW and MGRW can be clearly observed. The wake near the bottom of both the front and rear wheels in MGRW is shortened, indicating that the wake is weakened due to the momentum supplement from the rotating wheels. However, the wake of the front wheel becomes longer at the same time (marked in the red oval), which results in the interference on the underbody and the low-pressure region in Figure 7. Moreover, in MGRW, the wake on the upper part of the rear wheel is also shortened, which also causes the effect of the wake on the left and right side of the car to be weakened,. This is consistent with the pressure recovery in Region A&B in Figure 6.
Although the local flow field changes near the wheels can be ensured, as the pressure changes in the Region C and D are also very significant, it is necessary to analyze the changes in the flow field in the middle area of the vehicle base. 
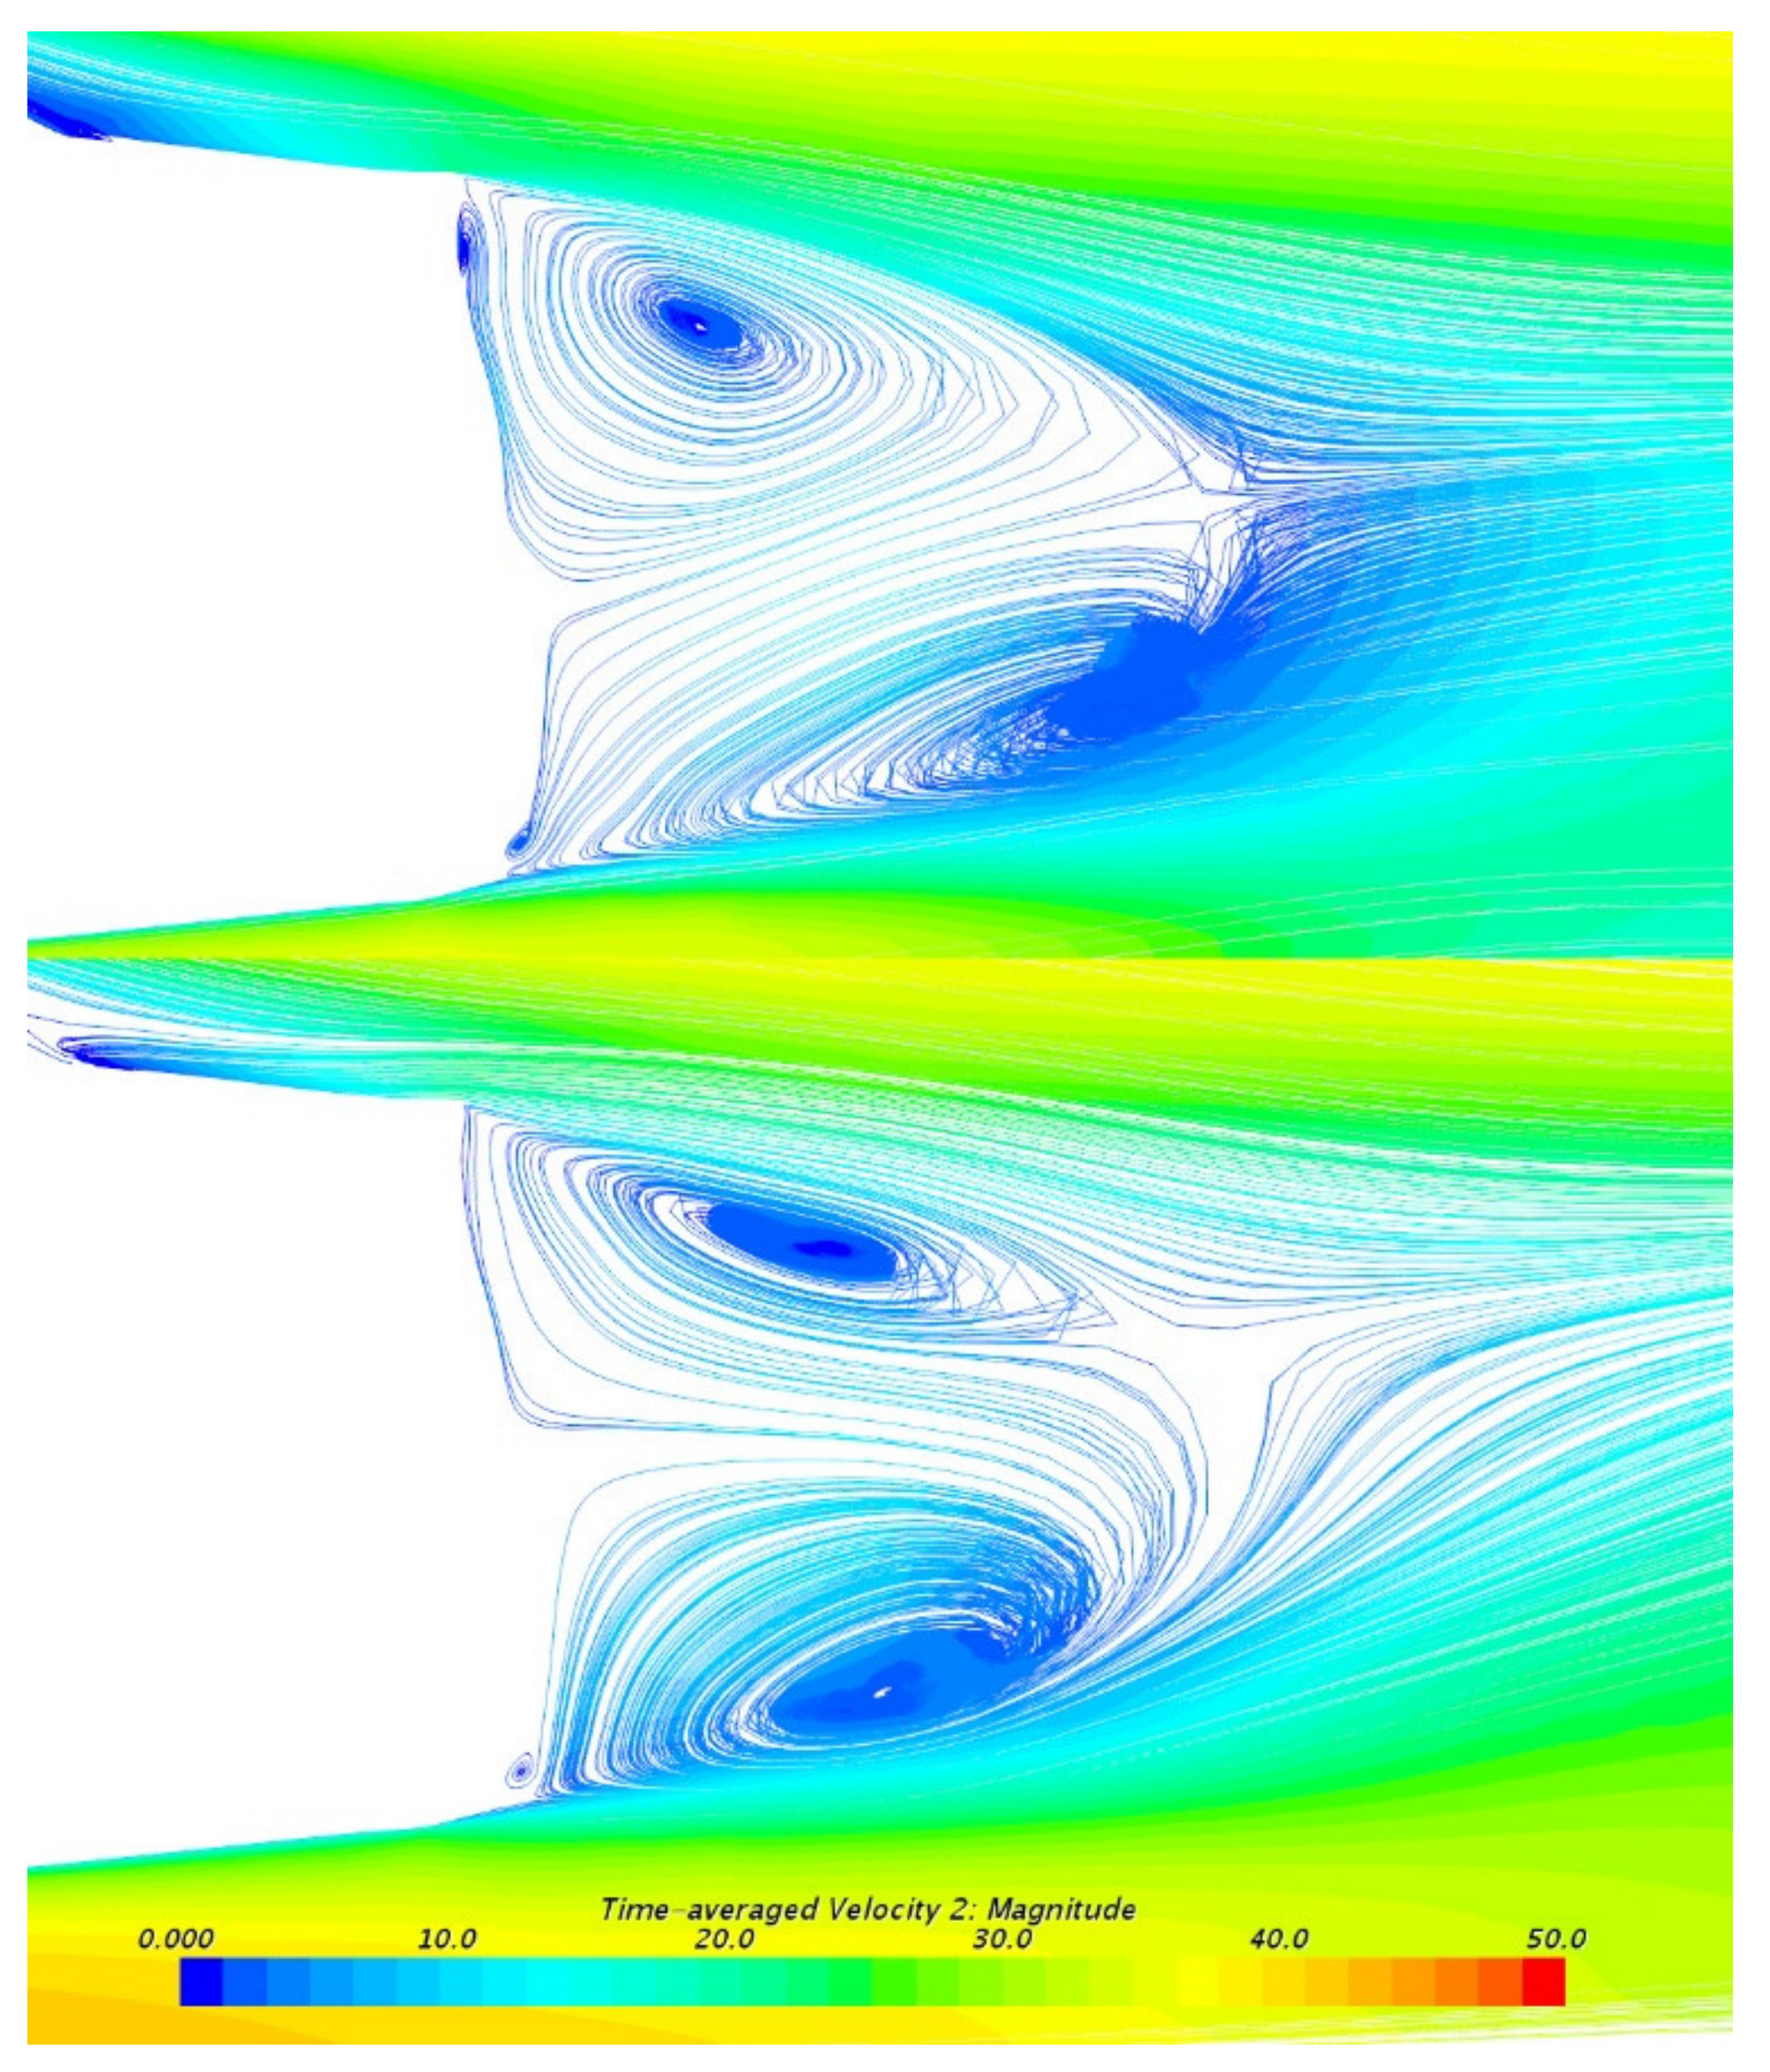
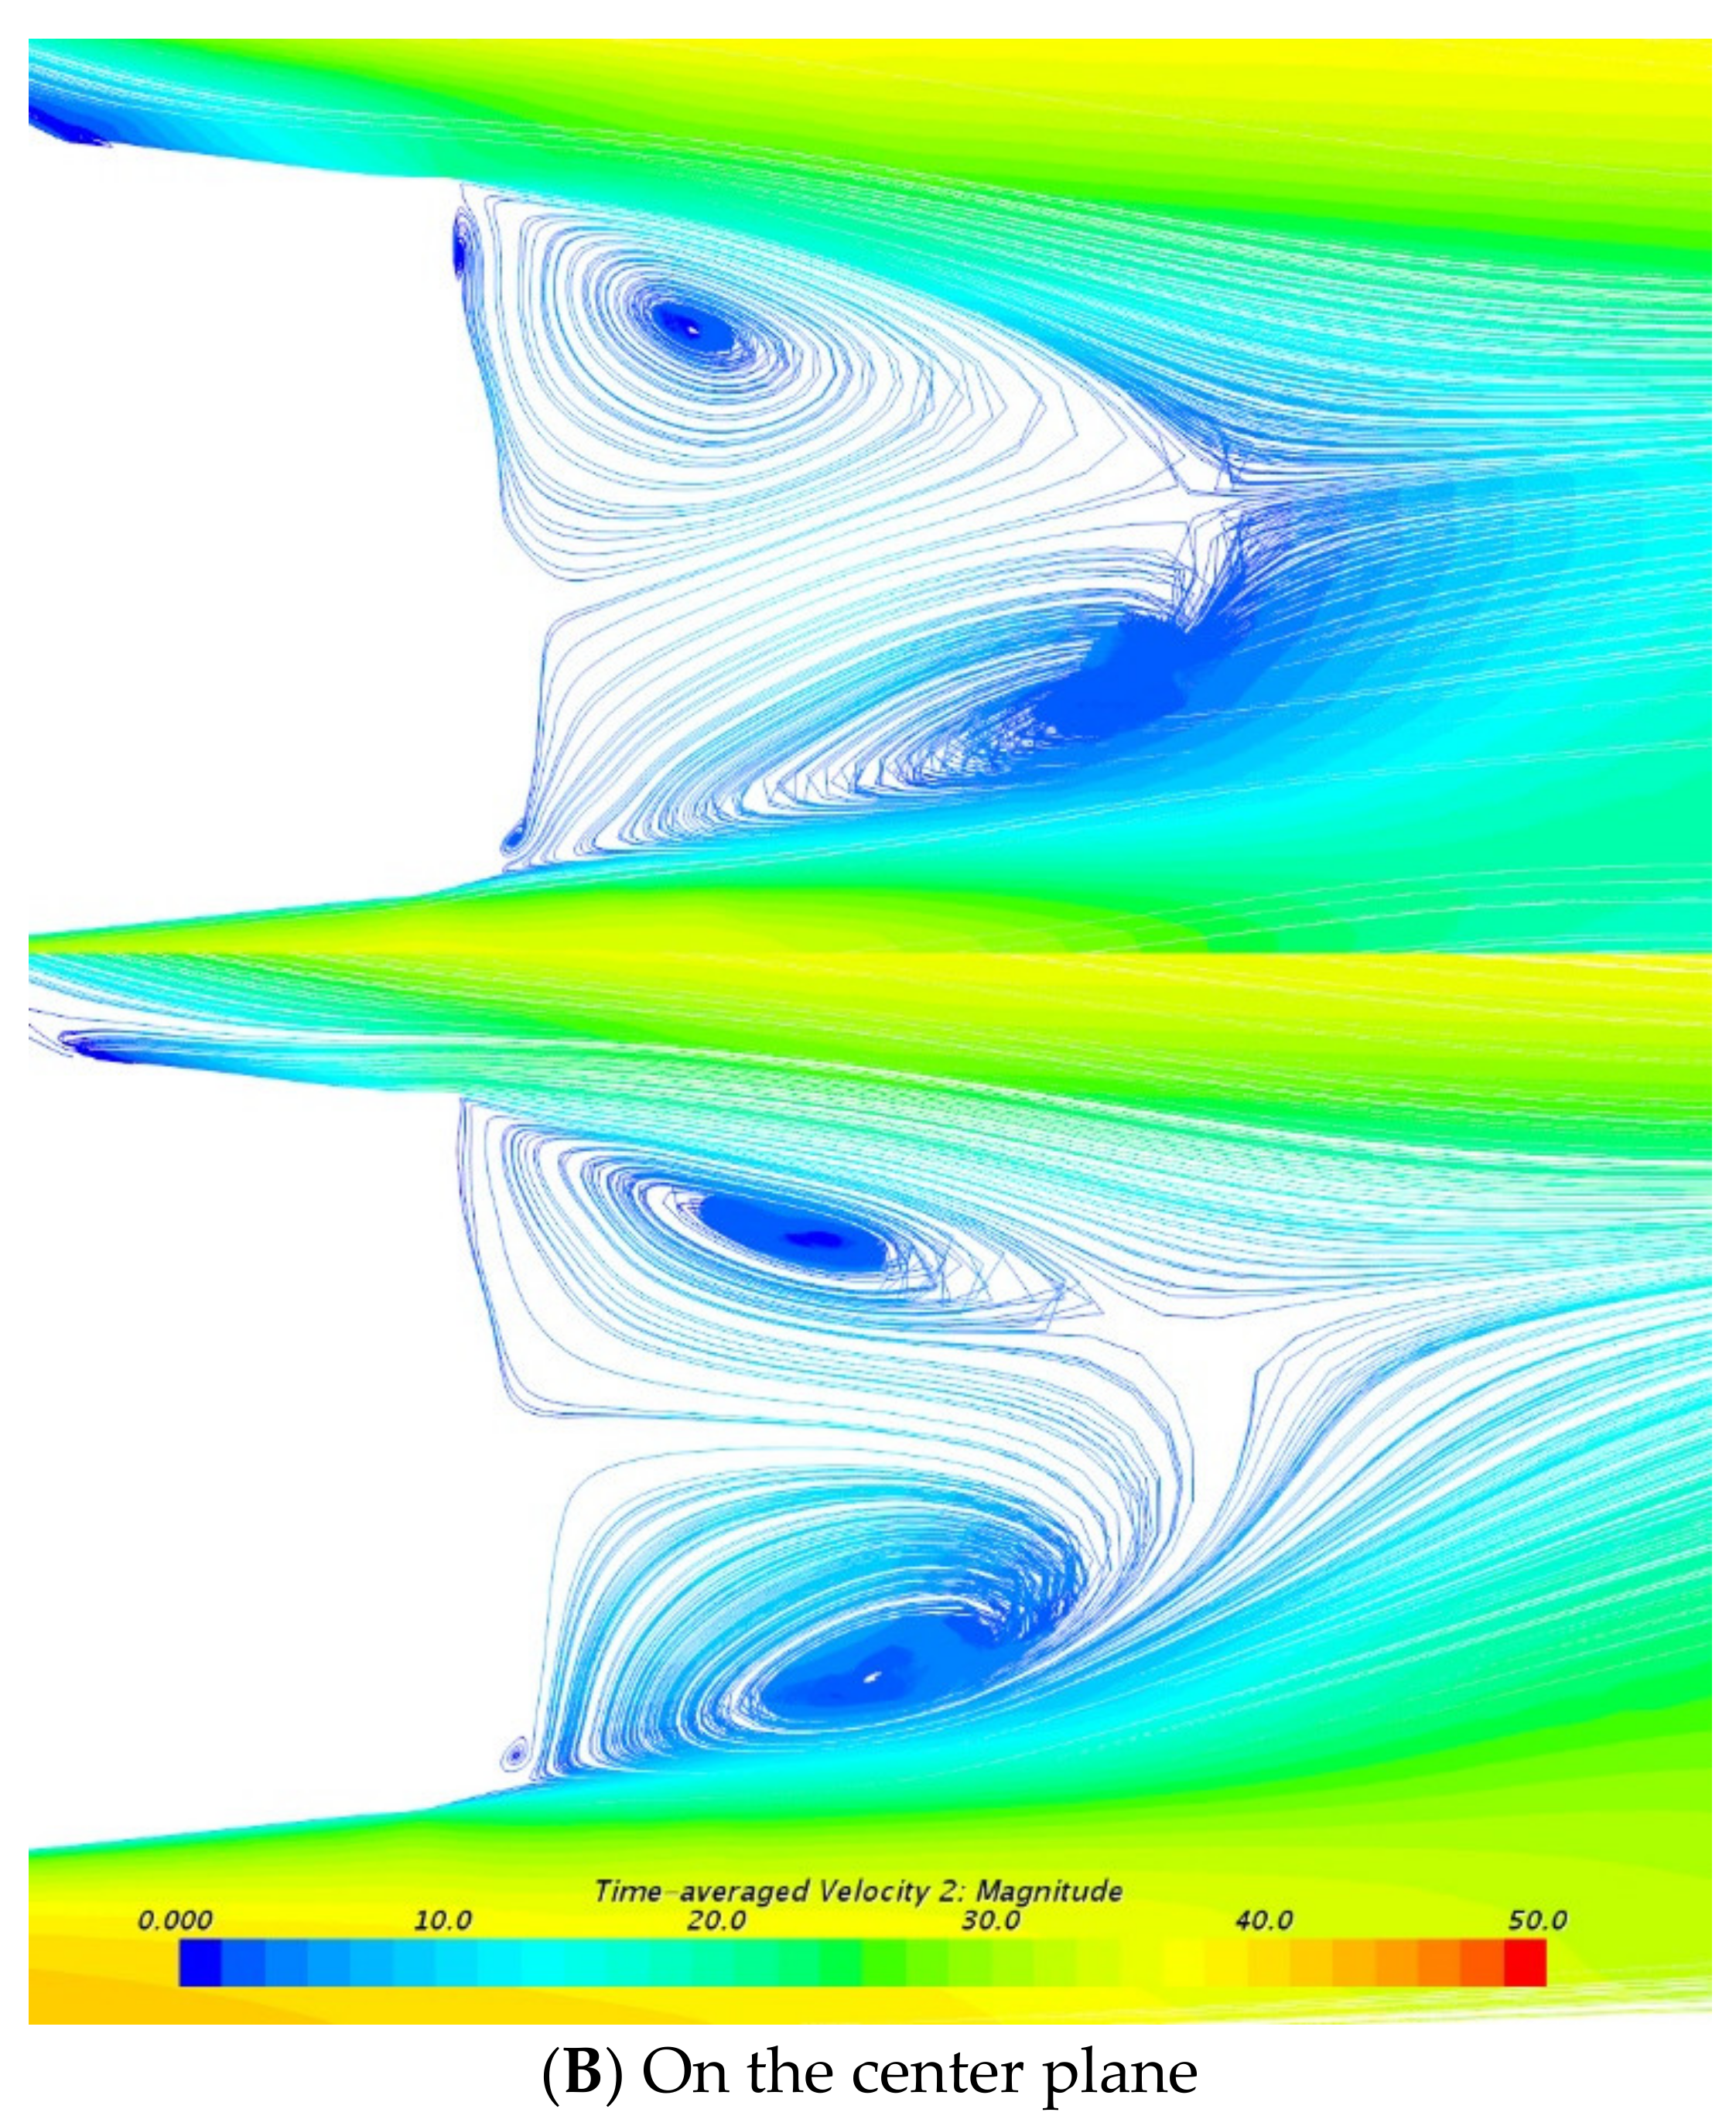
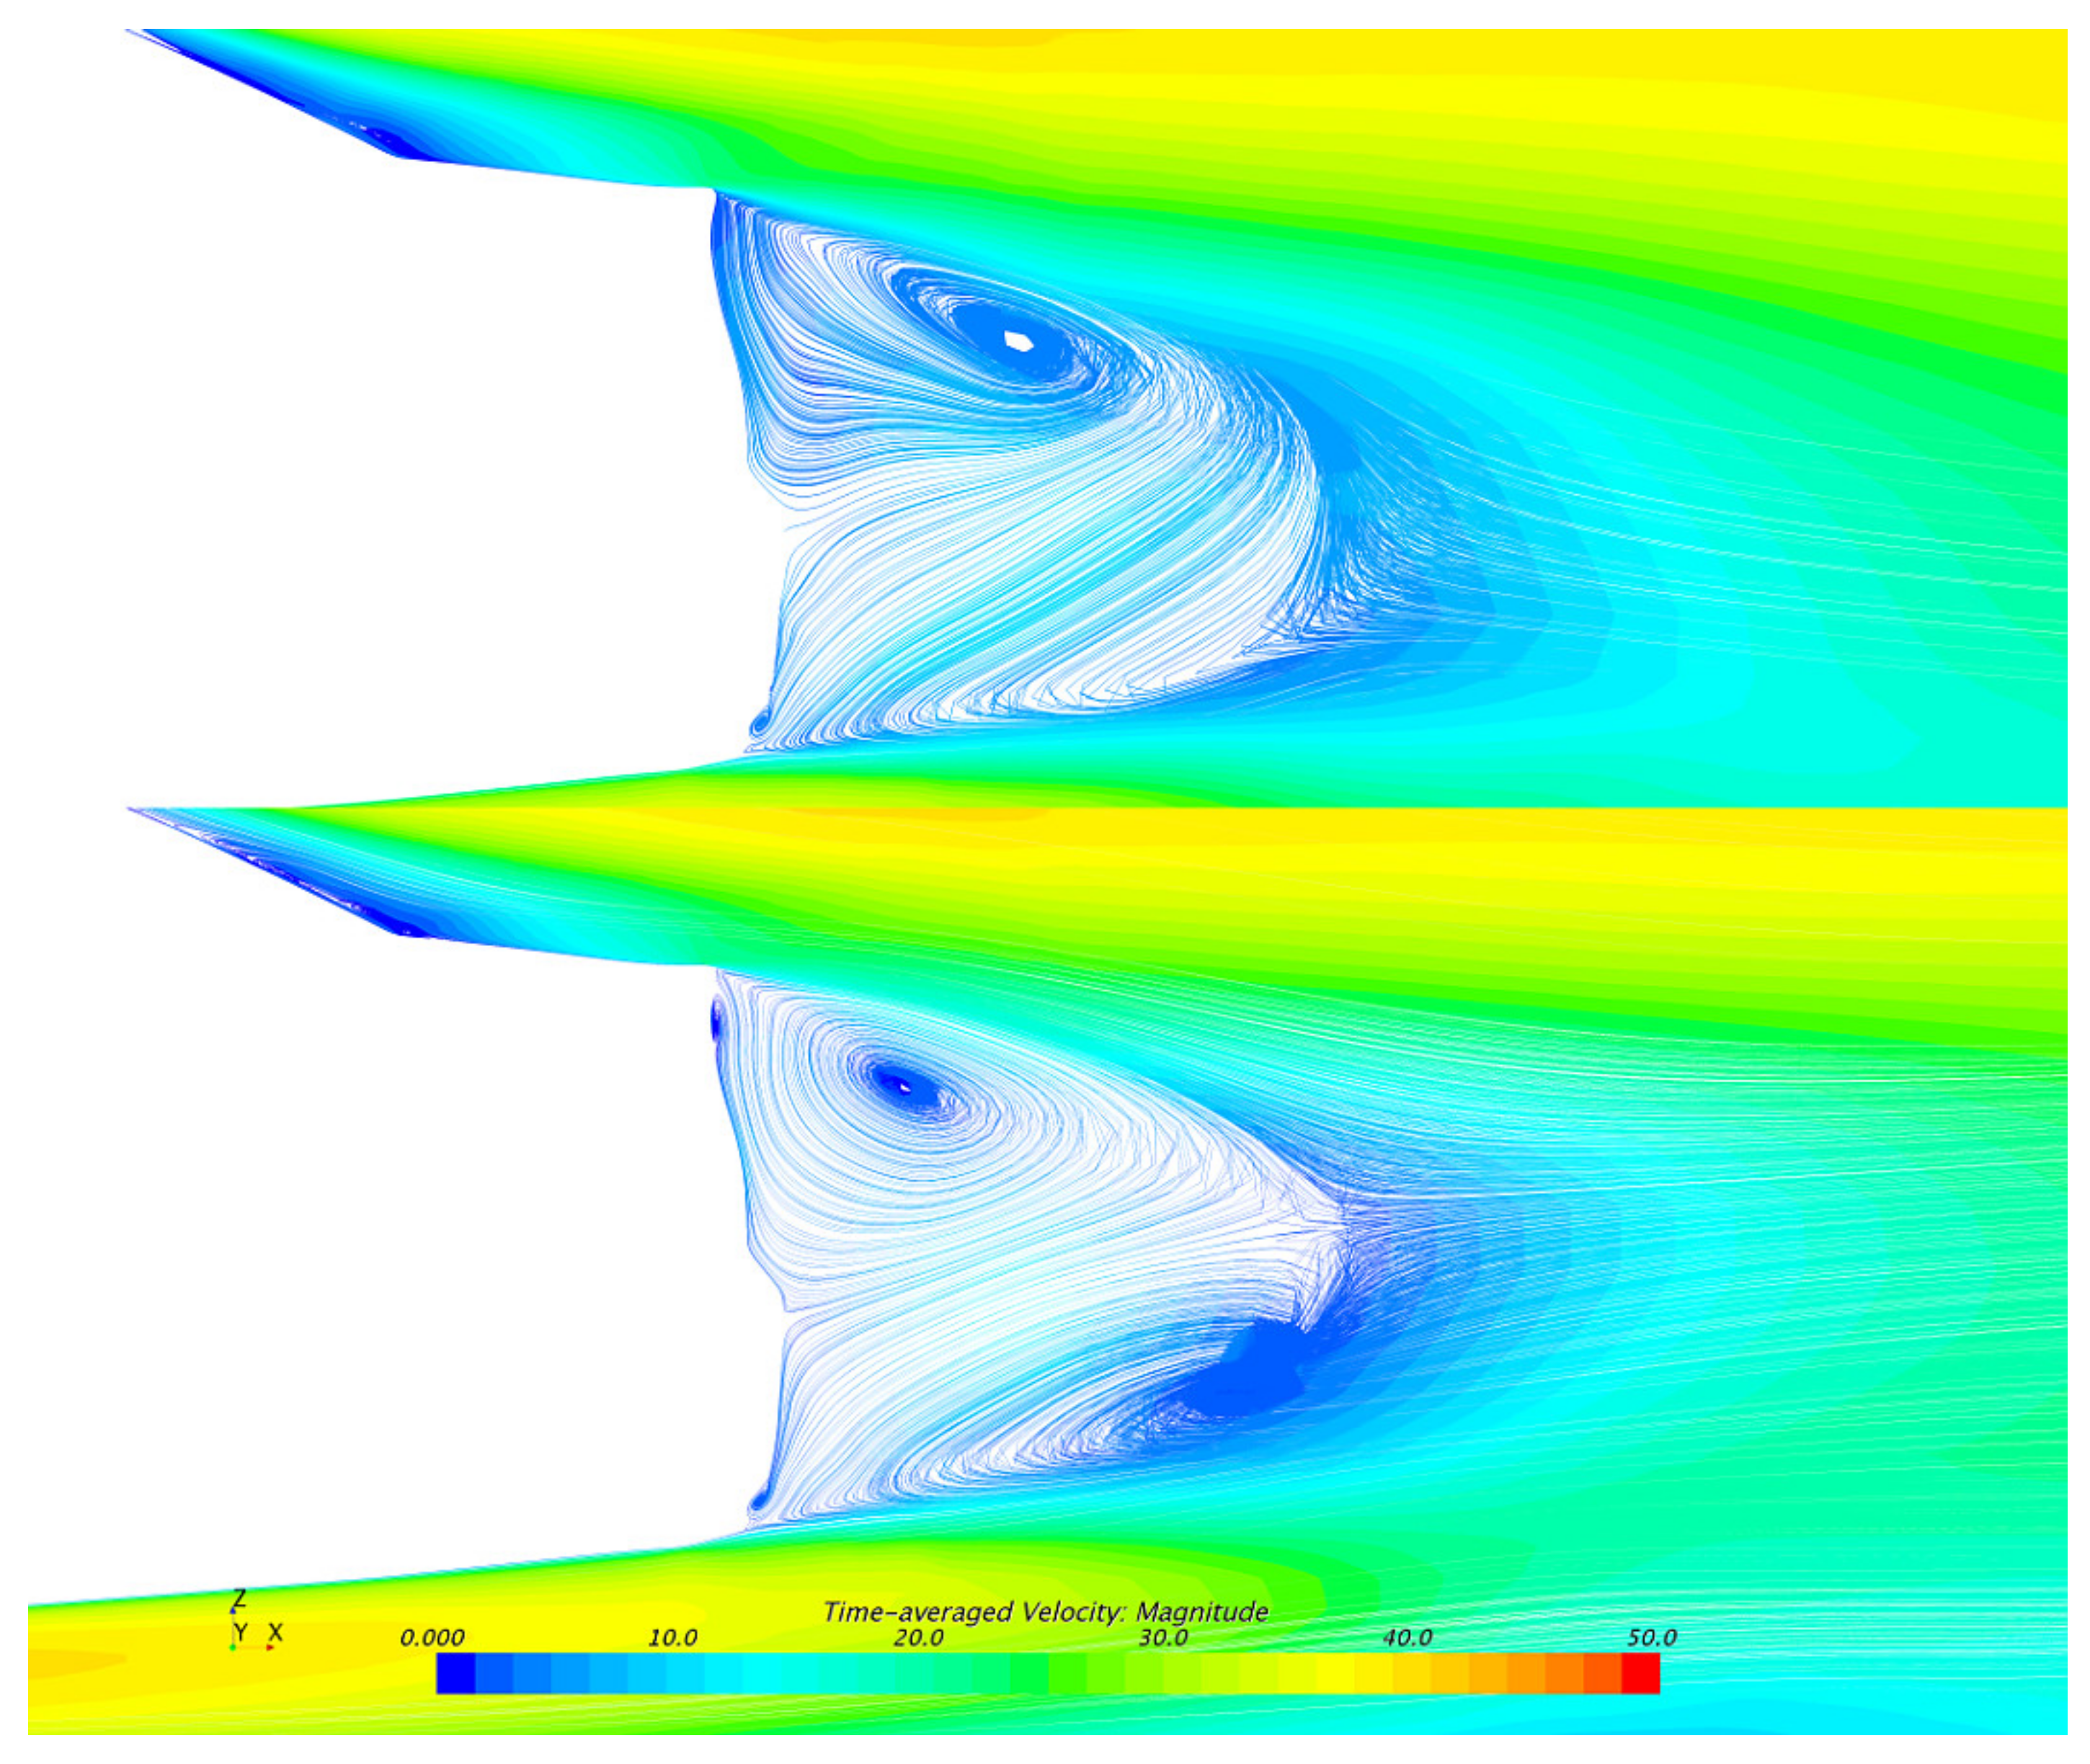
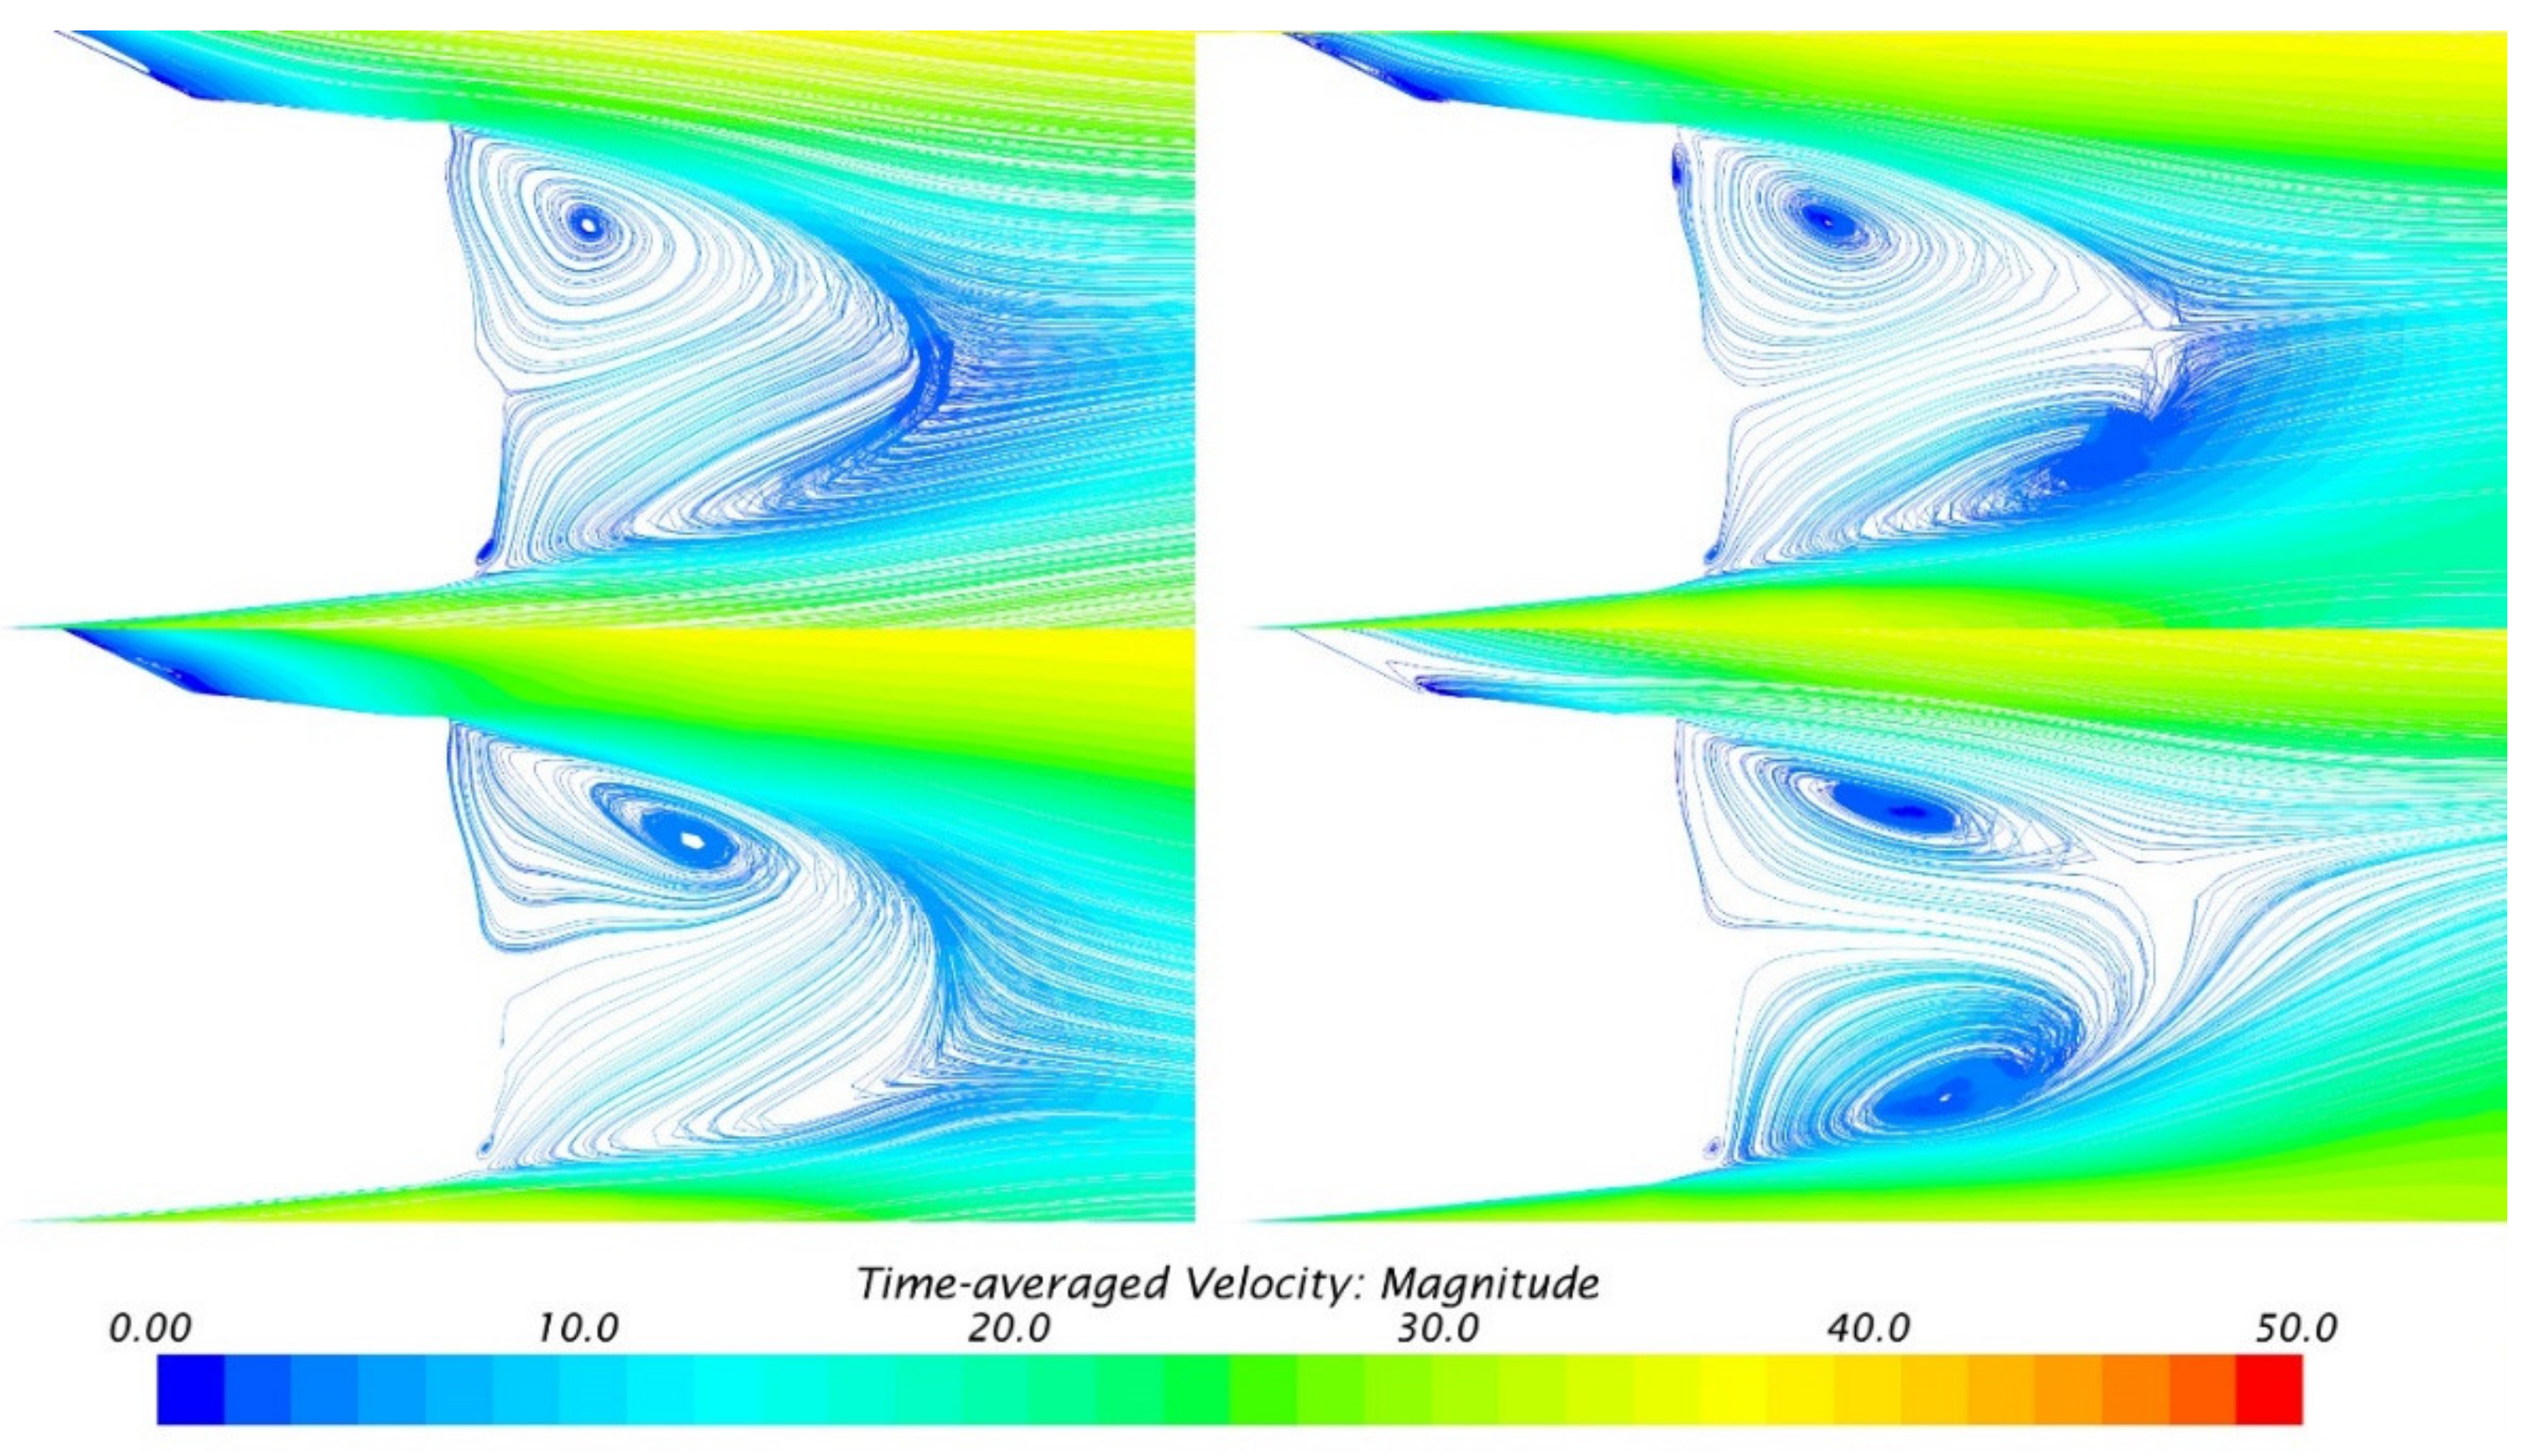
Figure 10 shows the streamlines on the central plane of the body. In SGSW, the upper and lower vortices are completely asymmetrical: the upper vortex is large in size, while the lower vortex looks small and incomplete. Moreover, the upper vortex is closer to the base and the lower vortex is farther.
However, in MGRW, the sizes and positions of these two vortexes are basically symmetrical. Compared with SGSW, the upper vortex of MGRW has a weaker effect on the base, while the lower vortex has a stronger one. Therefore, this is consistent with the pressure distribution in Figure 6 and Table 5 (the pressure in Region C is higher and the surface pressure in Region D is lower). As Region C has the most important effect on the total drag reduction, the symmetrical-wake state may result in lower aerodynamic drag. In this study, this is named the “low-drag state”. This state has some similarities with the Wake Balance state in the literature [14]. However, Wake balance is defined by the symmetrical turbulence kinetic energy (TKE) and its causes have not been completely understood.
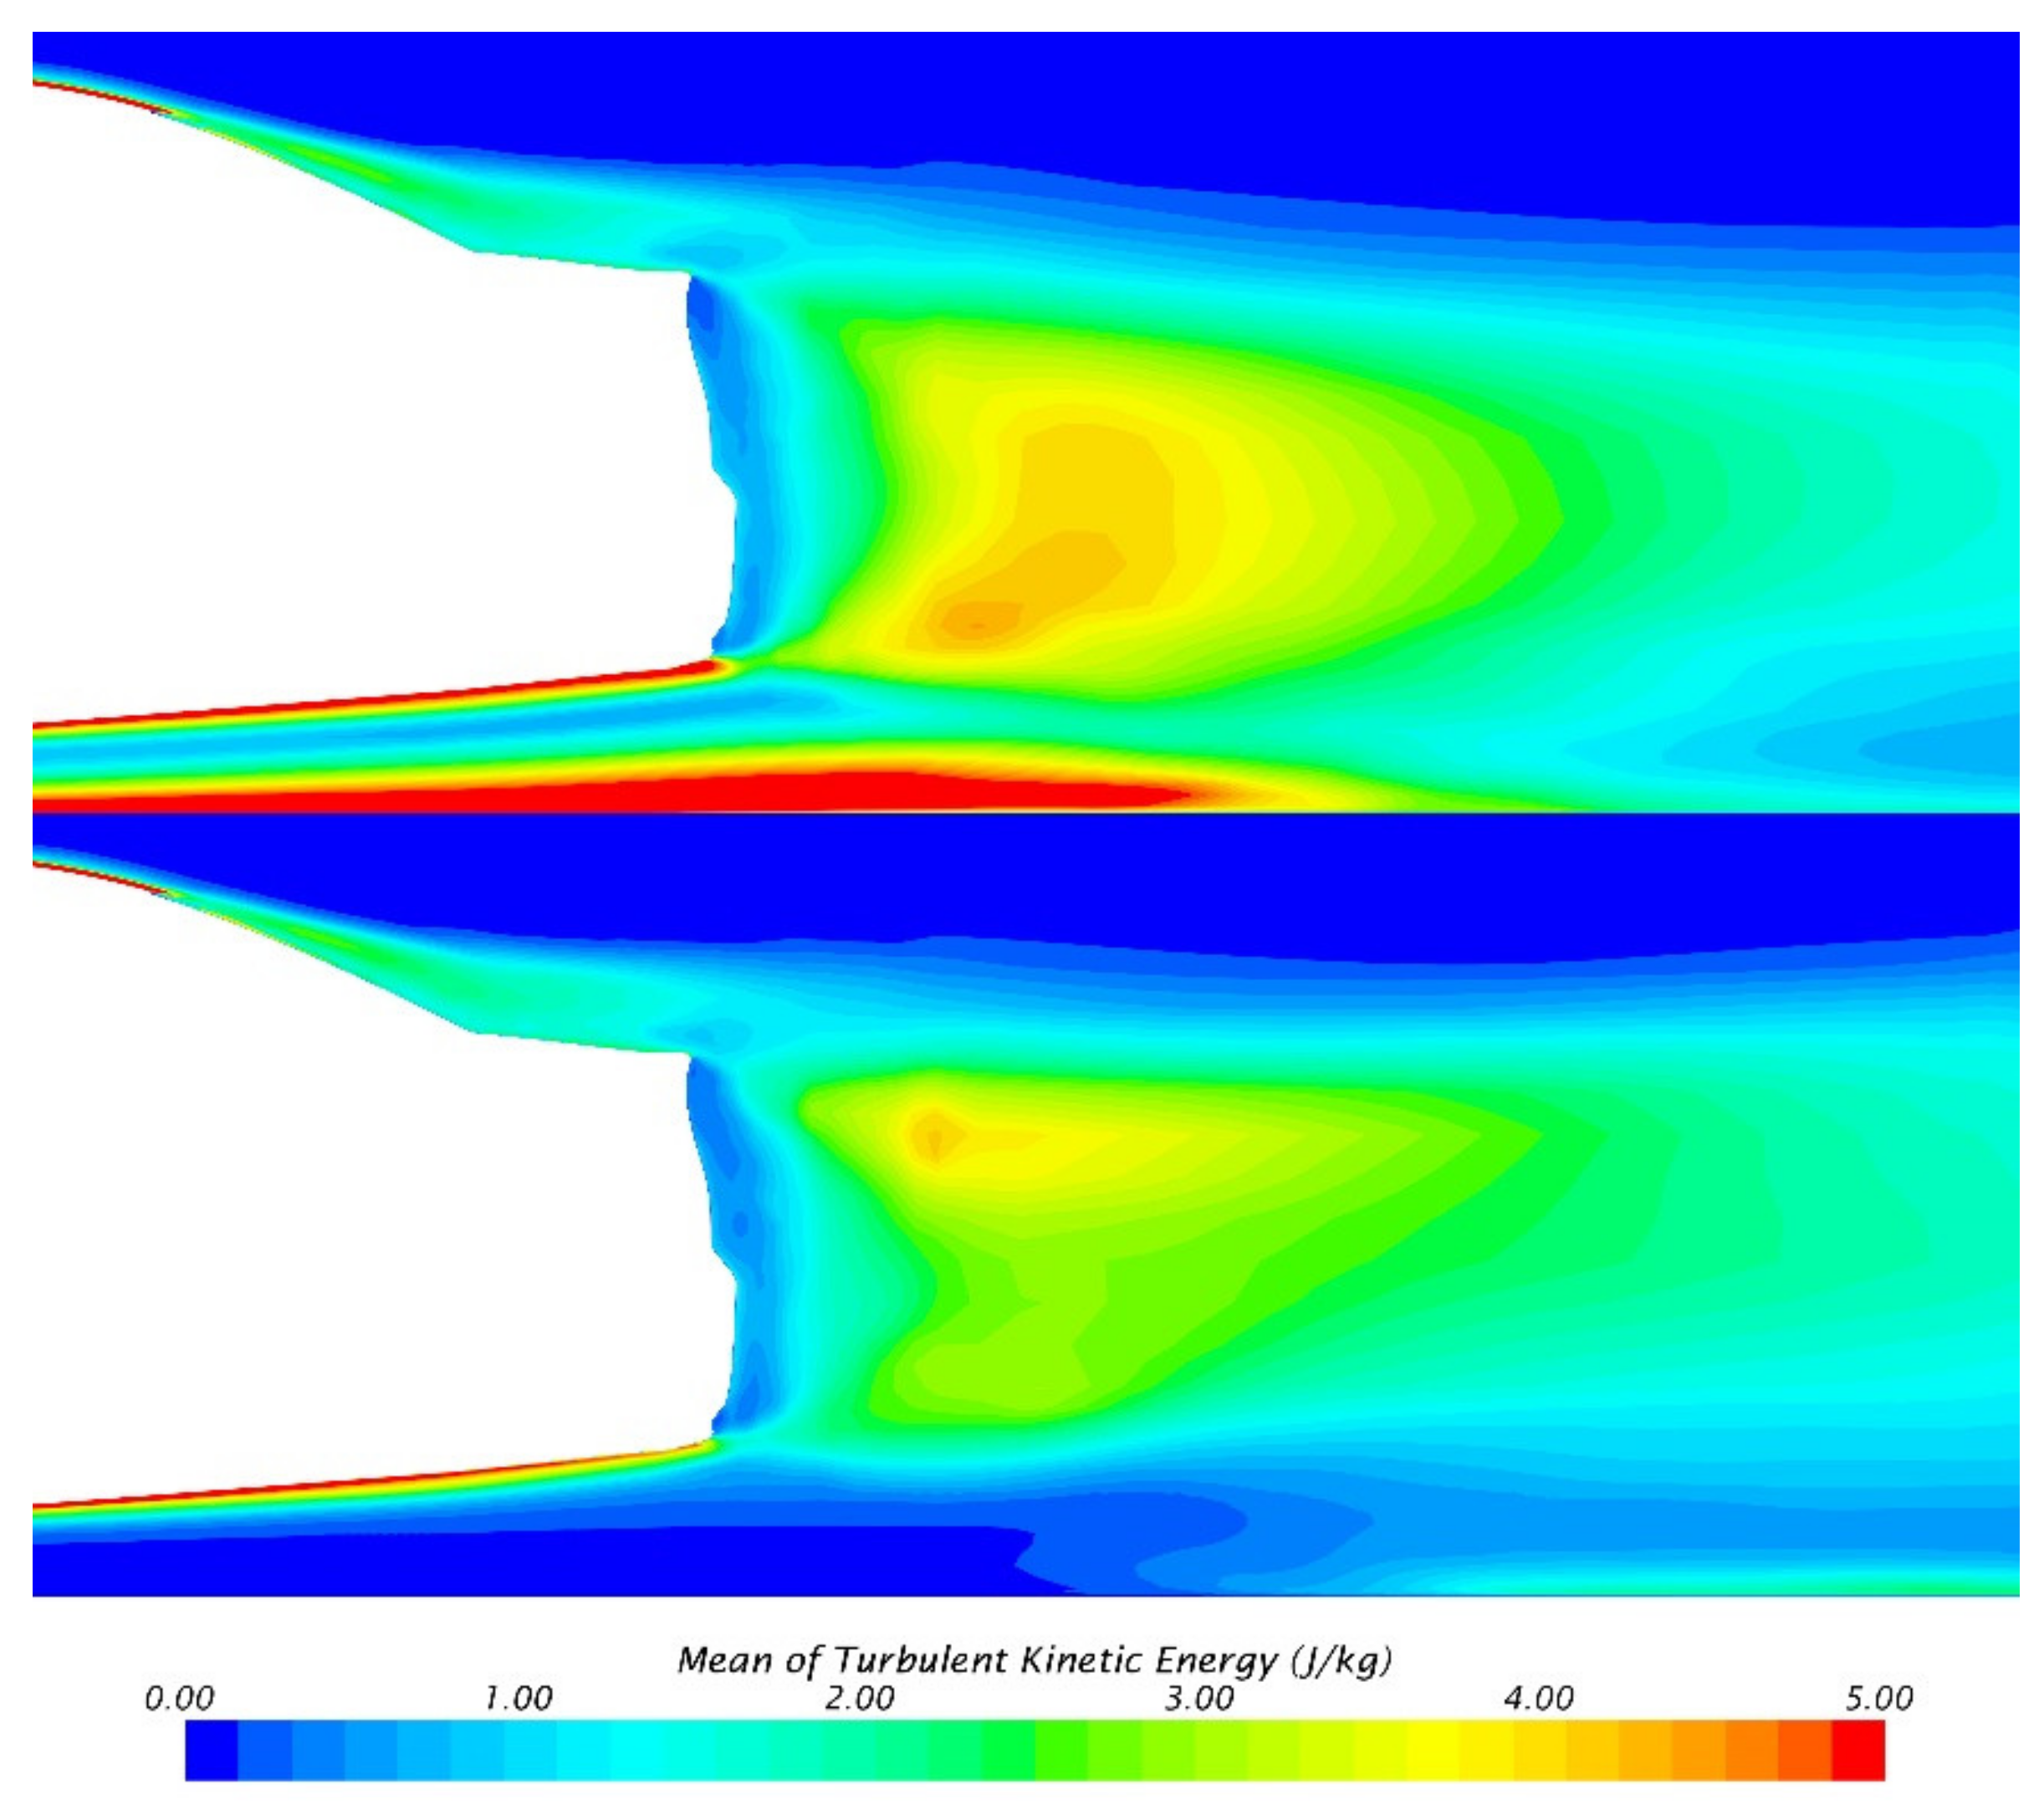
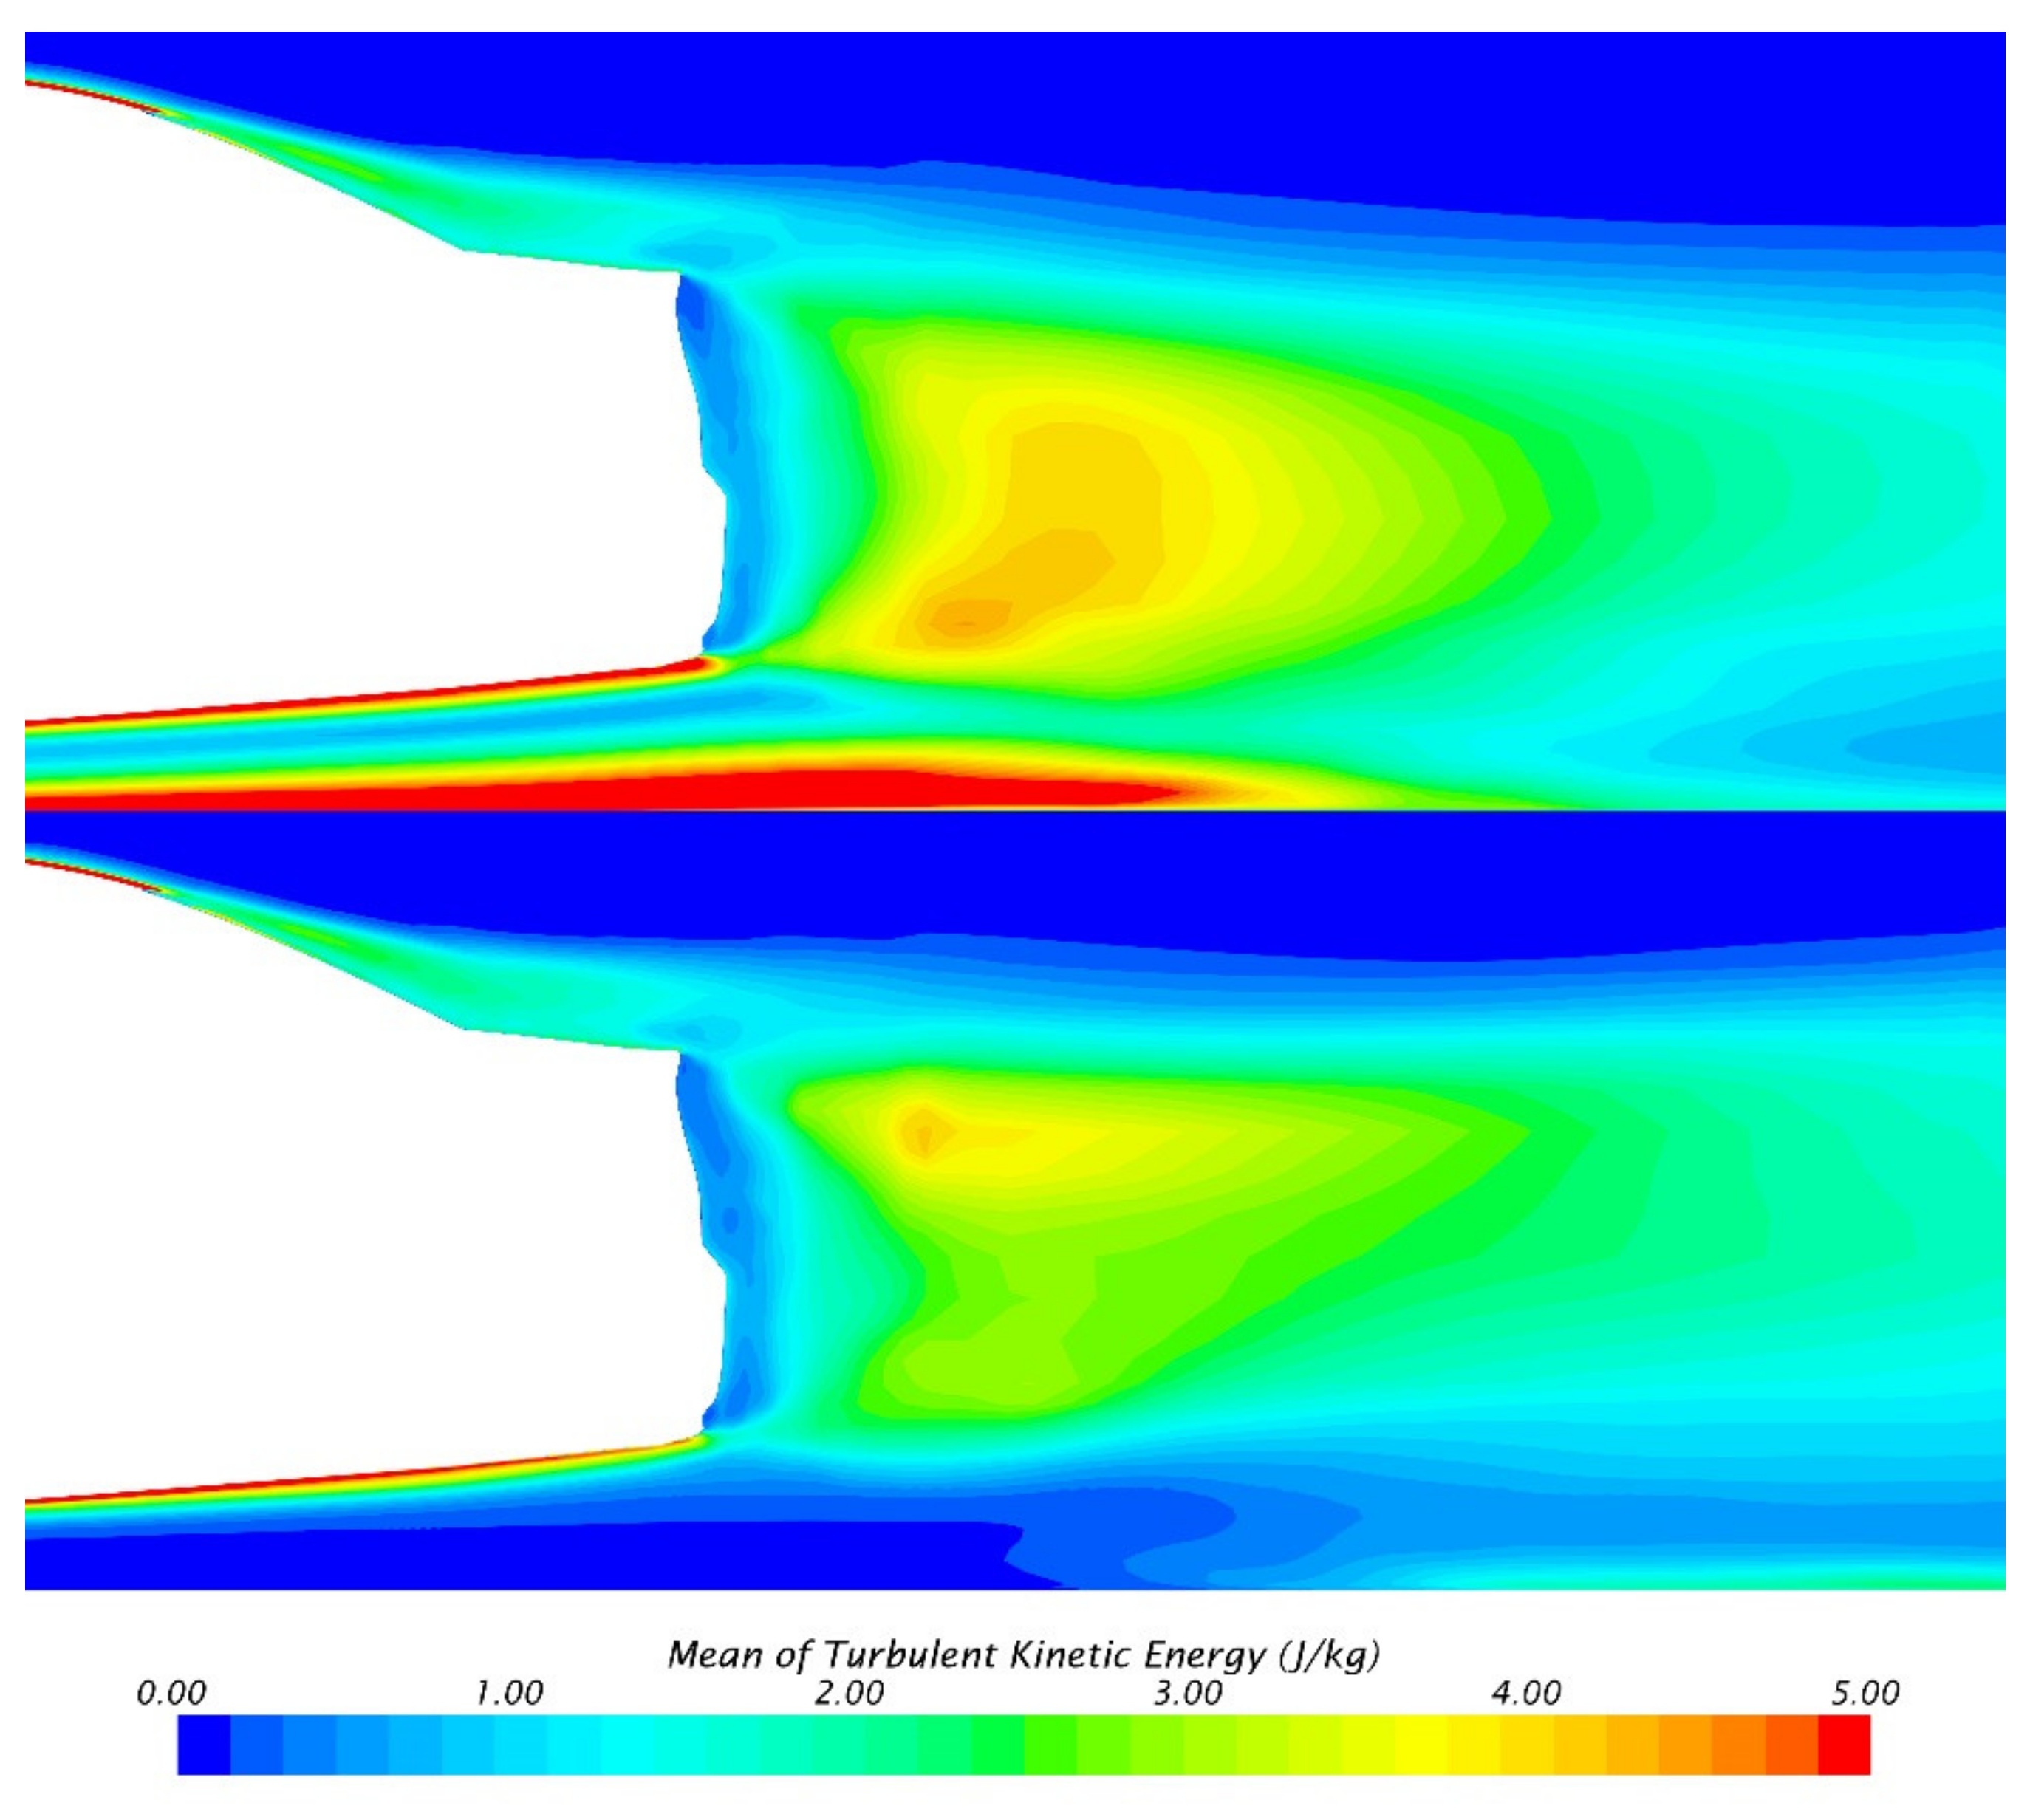
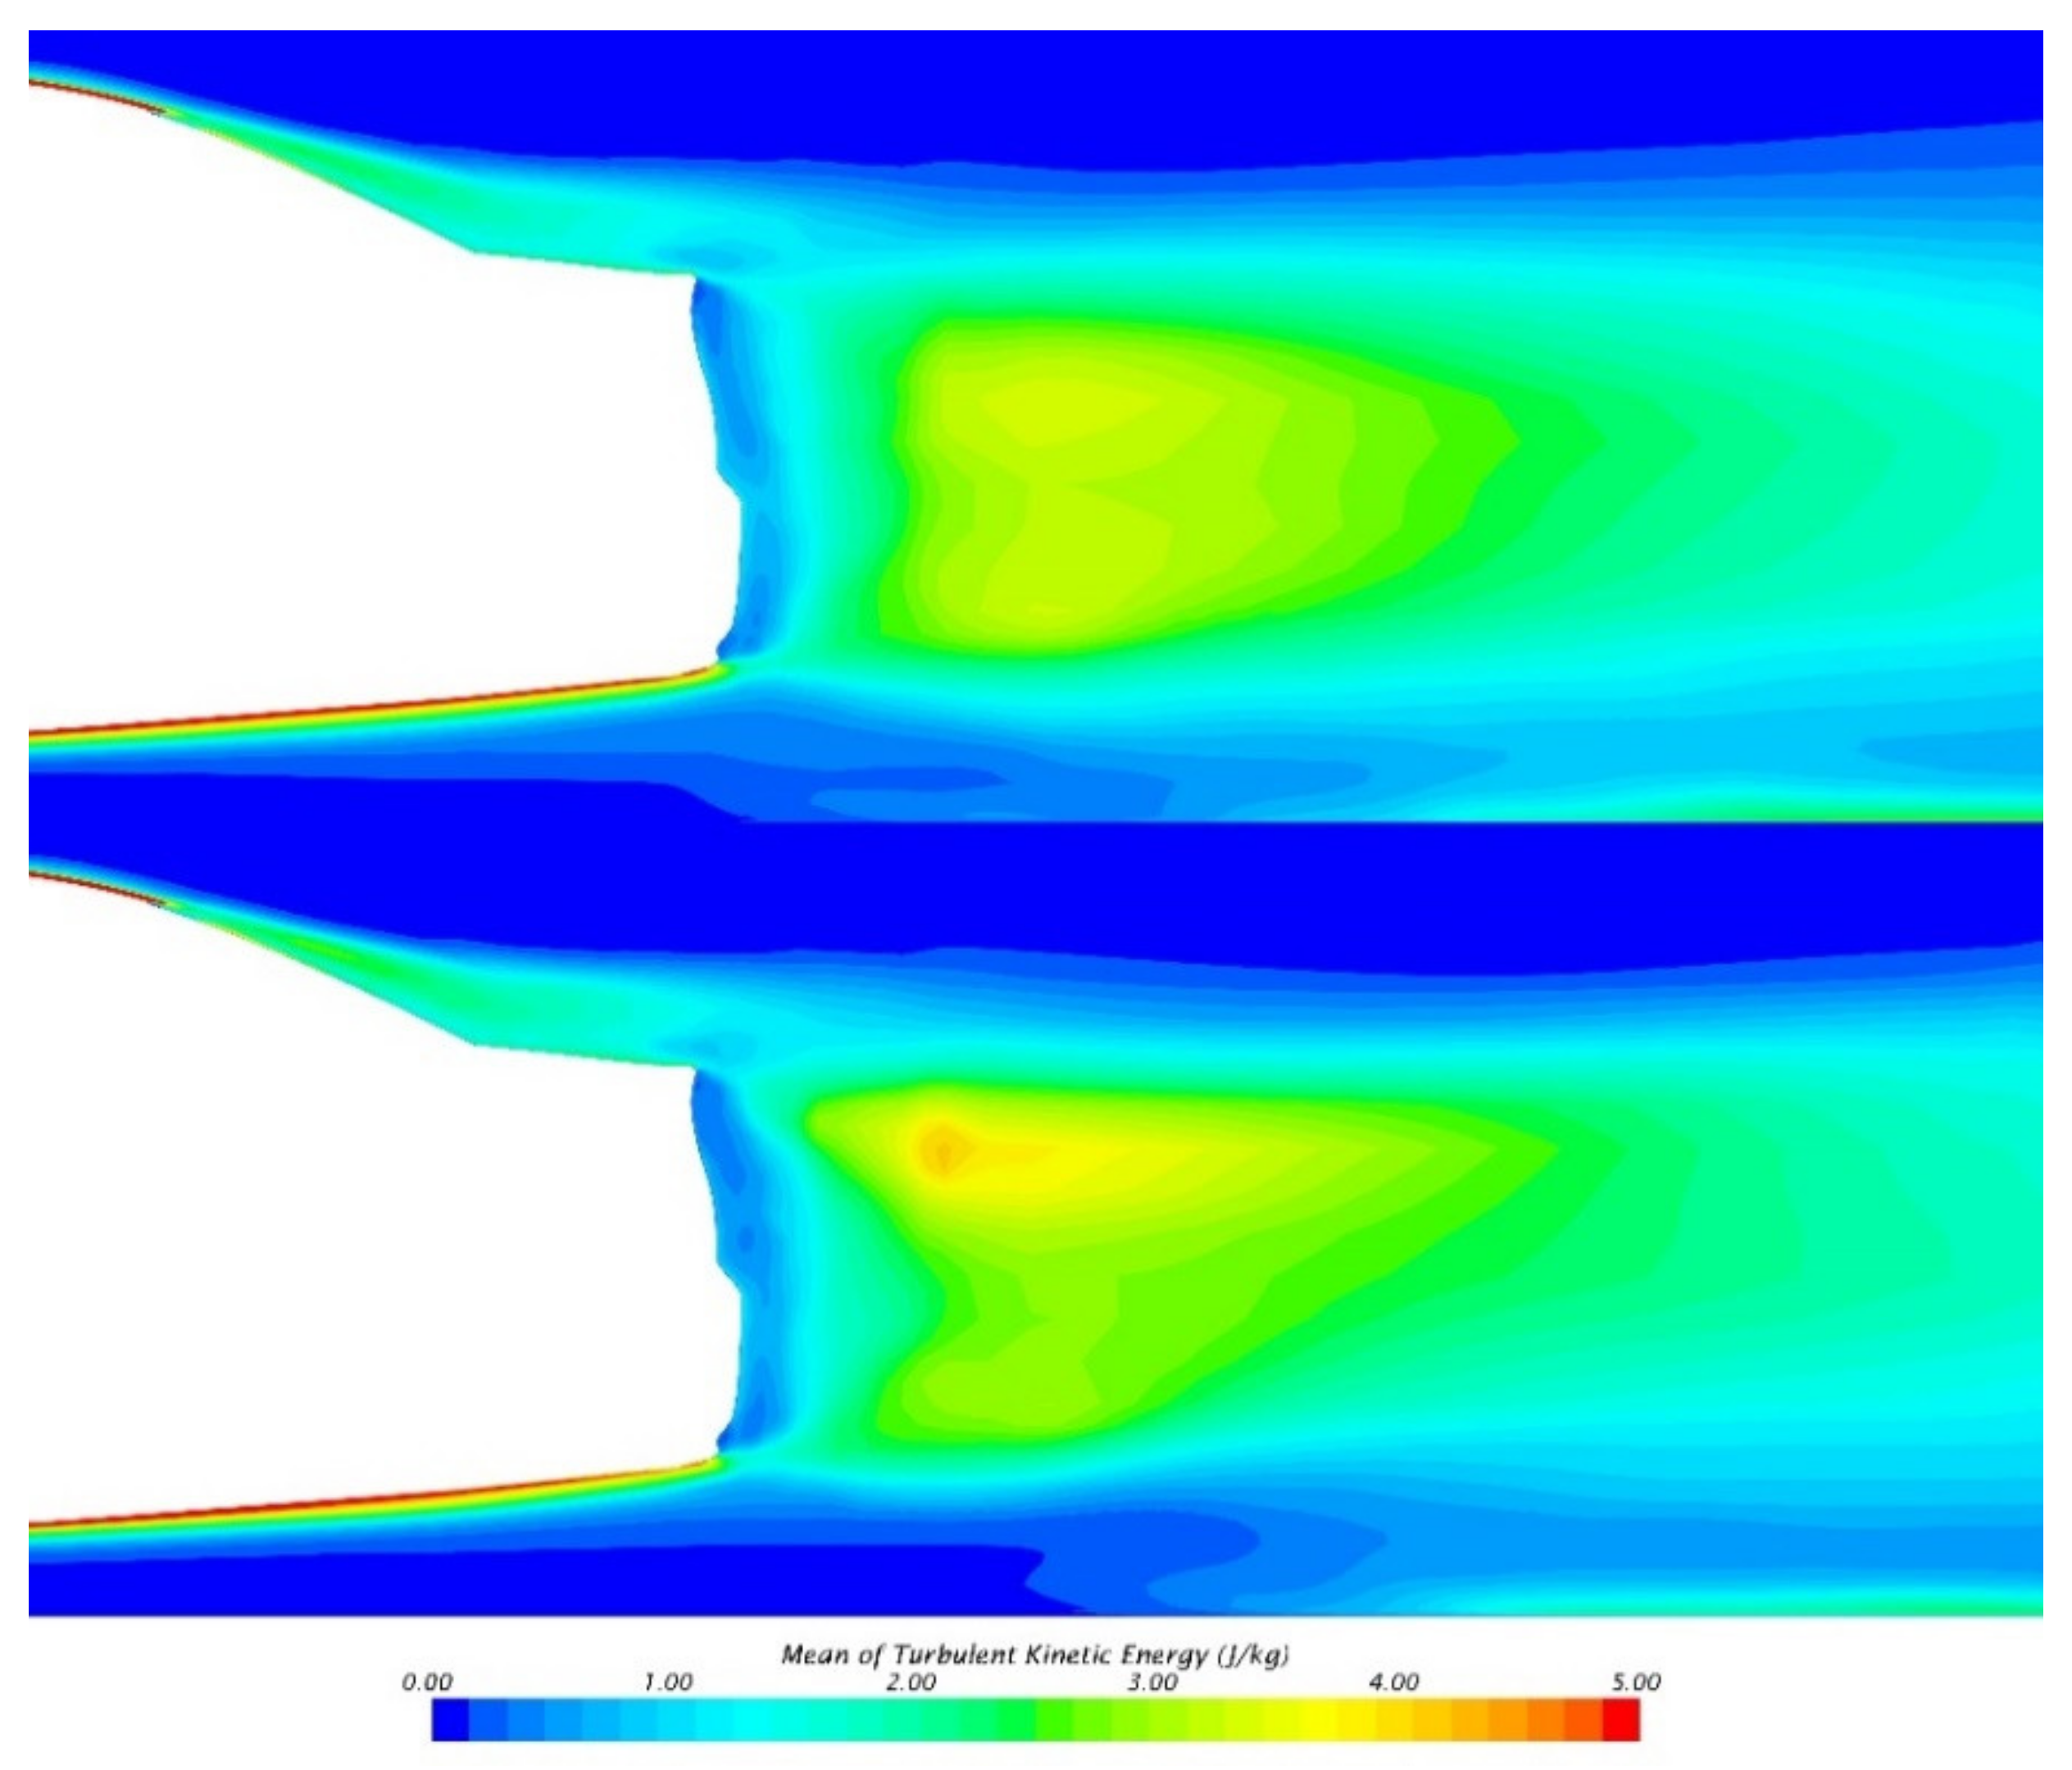
For comparisons with Wake Balance, the TKE on the center plane of SGSW and MGRW is shown in Figure 11. In MGRW, the TKE in the lower part of the center plane is significantly smaller than that in SGSW, indicating that the vortex in this area has basically formed and the strong velocity pulsation does not exist anymore. However, unlike the Wake Balance [14], the TKE of the upper and lower parts of the center plane is no longer symmetrical; therefore, the causes of the low-drag state may be different from those of the Wake Balance.
In general, the MGRW state can reduce the aerodynamic drag on both the wheels and the body. This state can weaken the wheel wake and change its structure, reducing wheel aerodynamic drag and affecting the local pressure distribution near the wake. Furthermore, the weakening of the rear wheel wake will also lead to the weakening of the wake on the sides of the vehicle base, leading to pressure decrease in Region A&B. In addition, the MGRW state can also make the upper and lower vortex of the central region become symmetrical, push the vehicle wake to form the low-drag state, affect the pressure in Region C&D and reduce the total aerodynamic drag.

3.2. Influences of Moving Ground

In the last section, the complexity of wheel–ground–vehicle interaction is shown. The wheels and ground can affect not only the local flow field near themselves, but also the wake structure. This section will study the aerodynamic effects of the moving ground under stationary and rotating wheel states, respectively, in order to comprehensively understand its aerodynamic impact on the vehicle.

3.2.1. With Stationary Wheels

Table 6 shows the time-averaged aerodynamic forces of SGSW and MGSW. When the moving ground condition is applied, the overall drag coefficient increases by six counts, most of which come from the car body (five counts). The aerodynamic lift decreases significantly, which is similar to Section 3.1, as the underbody flow is accelerated by the disappearance of ground boundary layers.
Figure 12 shows the pressure distribution on the base and Table 7 shows the specific average CP in the sub-regions. It can be seen that, in MGSW, the average CP in Regions A and B drops by about 0.01. It has been pointed out above that the pressure in these two areas is affected by the wake of the rear wheels. In the middle area of the base, the pressure in Region C does not obviously change but the pressure in Region D decreases slightly. Therefore, the aerodynamic drag generated by Region A, B and D all increase, resulting in a notable increase in the aerodynamic drag of the vehicle body. Moreover, the most dominant effect of drag increase may come from the wake of the rear wheel (Regions A and B).
Figure 13 shows the velocity distribution near the underbody. The elimination of the ground boundary layer leads to the enhancement of both the front and rear wheel wake. As mentioned in Section 3.1, the strengthened rear wheel wake can reduce the pressure in Region A and B, which is consistent with the results in Figure 12 and Table 7.
Figure 14A,B show the streamlines near the underbody and on the center plane, respectively. It can be seen from the streamlines that the width of both the front and rear wheel wakes is expanded when the ground is moving. This means that the elimination of the ground boundary layer leads to the enhancement of both the front and rear wheel wake, which may come from the accelerated flow near the wheel separation region. Furthermore, due to the expansion of the width of the front wheel wake, the middle area of the underbody is more strongly affected by the wheels, resulting not only in a decrease in air flow velocity in this area, but also a decrease in surface pressure.
However, both the upper and lower vortices on the center plane are not significantly affected by the moving ground, as shown in Figure 14B. Moreover, the lower vortex has still not been formed completely, but its position becomes more compact and the distance from the base is closer; therefore, its effect on the base pressure increases, too. This may be the main reason for the slight pressure decrease of Region D in MGSW.
Figure 15 shows the time average TKE distribution on the center plane of the car body. It can be seen that, when the ground is moving, the TKE in the lower region is significantly reduced. This indicates that the vortex is stronger in this region, which is consistent with the pressure distribution in Figure 12. In addition, the upper and lower TKE regions of MGSW are basically symmetrical, which is in line with the description of Wake Balance [14]. However, as MGSW is not in the low-drag state, Wake Balance cannot simply be used to explain the base flow field in this study.

3.2.2. With Rotating Wheels

Table 8 shows the time-averaged aerodynamic forces of SGRW and MGRW. Contrary to the stationary wheel state, the moving ground causes the drag coefficient of the vehicle to decrease by about five counts, while the drag coefficient of the vehicle body decreases by about two counts. This result indicates that the moving ground has different aerodynamic effects. Therefore, further investigations are necessary. Moreover, the aerodynamic lift of the wheel still has a large drop, whose mechanism is supposed to be similar to the stationary wheel state—the elimination of boundary layers can lead to the underbody flow having a higher velocity.
Figure 16 and Table 9 show the pressure distribution on the base region when the wheels are rotating. It can be observed that the surface pressure in Regions A, B and D shows a certain drop, which is basically similar to the stationary wheel state. However, there are some obvious differences occurring in Region C. When the wheels are stationary, ground movement will not cause significant pressure changes in Region C. Therefore, the overall pressure on the base is reduced. On the contrary, when the wheels are rotating, the surface pressure in Region C shows a significant recovery. The average CP increases by about 0.023 and its effect exceeds the sum of the pressure decrease in the other three regions. This result proves that, when the wheels are rotating, the flow field near the base region can be greatly altered by the moving ground.
The velocity distribution near the underbody when the wheels are rotating is shown in Figure 17 and Figure 18A, respectively. In general, the effect of the moving ground on the wheel wakes is similar to that of the stationary wheel state. The rear wakes are slightly strengthened, but this effect is less obvious, so the pressure decrease in Region A and B is also lower than the stationary wheel state (seen in Table 7 and Table 9). Moreover, as the width of the wheel wake is not as wide as the stationary wheel condition, the influence of the wheel wake on the underbody flow is weakened so the flow near the center region is accelerated.
Furthermore, in Figure 18B. It can be seen relatively intuitively that, when the ground is moving, the upper and lower vortexes near the center region become basically symmetrical and the low-drag state mentioned in Section 3.1 is reached. Compared with SGRW, the upper vortex of MGRW is farther away from the vehicle base, while the lower vortex is closer, which causes the pressure in Region C to rise and the pressure in Region D to drop. As the pressure rise in Region C is significantly stronger than the pressure drop in the other regions shown in Table 9, the importance of the low-drag state is again emphasized. Compared with Section 3.2.1, when the wheels are stationary, although the ground movement also causes an increase in the underbody airflow as the boundary layers are eliminated, this state is not reached. Therefore, the specific relationship between the ground, wheels and the low-drag state cannot simply be blamed for the accelerated underbody flow.
Figure 19 shows the time averaged TKE on the center plane in SGRW and MGRW. Compared with the stationary-ground state, the TKE in the upper area shows a significant increase, which means that the upper vortex is smaller. Furthermore, this result means that, if the low-drag state is reached, the upper vortex must be weakened to a certain extent. This phenomenon may indicate that the weakened downwash is related to the low-drag state.
In summary, the moving ground has a relatively notable effect on the local flow field of the wheel. Ground movement will eliminate the ground boundary layer, increase the airflow speed near the underbody and reduce the aerodynamic lift of the entire vehicle. Moreover, the width of the wheel wake is slightly expanded, resulting in a decrease in the base pressure in Regions A and B. Furthermore, the impact of ground movement on the global aerodynamic performance of the vehicle is strongly affected by the wheel state. When the wheels are stationary, the wake structure of the vehicle is not greatly altered. However, when the wheels are rotating, the enhancement effect of ground movement on the wake is weakened and the low-drag state is reached, leading to a significant drag reduction on the base. Due to this circumstance, the aerodynamic effect of the ground should not be treated in isolation.

3.3. Influences of Rotating Wheels

As mentioned in the last section, the aerodynamic influence of the ground state is related to the wheel state. In this section, the aerodynamic effects of rotating wheels will be investigated in stationary and moving ground conditions in order to further understand the aerodynamic influences generated by the wheels.

3.3.1. With Stationary Ground

Table 10 shows the time-averaged aerodynamic forces of SGSW and SGRW.
The total aerodynamic drag coefficient drops when the wheels are rotating, but the amplitude is not very large (about six counts) and most of the drag decrease comes from the wheels. The aerodynamic lift coefficient of the vehicle also decreases to a certain extent, but the decrease amplitude is much smaller than that caused by ground movement. Published research has pointed out that, whether a wheel is isolated or installed on a vehicle, the wheel rotation will cause acceleration of the airflow under the wheel, weaken the wake and reduce both the aerodynamic drag and the lift [14,27], which is basically consistent with the results of this study. Therefore, from the perspective of aerodynamic forces alone, when the ground is stationary, the aerodynamic effects of wheel rotation are basically limited to the wheels themselves. There is no significant impact on the aerodynamic performance of the entire vehicle.
Figure 20 and Table 11 show the pressure distribution in SGSW and SGRW. It can be seen that the pressure in Regions A and B recovers clearly, while the pressure in Regions C and D drops slightly when the wheels are rotating. Therefore, the body drag reduction is mainly due to the pressure rise on both sides of the base (although the overall reduction is only two counts). As has been pointed out in the sections above, Regions A and B are mainly affected by the wake of the rear wheels; the pressure rise in these two areas proves that the rotation of the wheels itself can weaken the wake.
Figure 21 shows the underbody surface pressure of SGSW and SGRW. In general, the effect of wheel rotation on the underbody pressure is not significant. The surface pressure on the middle and rear of the car body slightly drops, which indicates that the underbody flow rate rises due to the weakened wheel wakes. Moreover, the pressure near the rear end is recovered; therefore, the overall aerodynamic lift of the body almost remains unchanged.
Figure 22 shows the Iso-surface on CTP = 0 in SGSW and SGRW. The overall result is similar to Figure 9, in that the wheel rotation can weaken the wheel wakes near the ground and change its structure near the underbody, which reduces the pressure in the rear area of the front wheels in Figure 21. Moreover, the effect of rear wheel wakes on the vehicle base is also weakened, which leads to a reduction in the vehicle wake and pressure recovery in Regions A and B.
Although the wheel rotation does not have a significant effect on the surface pressure in the middle part of the base, it is still necessary to analyze the changes in the flow field in the middle of the car body. Figure 23 shows the streamlines on the center plane. It can be seen that, when the wheels are rotating, the size of the lower vortex becomes larger, and a relatively complete vortex structure is formed. Moreover, the upper and lower vortex are closer to the low-drag state at this time. However, these two vortexes are still relatively asymmetrical; therefore, the low-drag state has not been formed and there are no significant changes in the surface pressure of Regions C and D, as well as in the drag.

3.3.2. With Moving Ground

Table 12 shows the time-averaged aerodynamic forces of MGSW and MGRW. The overall aerodynamic drag coefficient dropped by 17 counts. The body aerodynamic drag coefficient dropped by nine counts and the wheel aerodynamic drag coefficient dropped by eight counts. The decreases in the aerodynamic drag of the body and the wheels are both significantly greater than the decrease in the stationary ground state, and the body becomes the main source of the total drag reduction. In addition, the aerodynamic lift of the vehicle remains basically unchanged, while the aerodynamic lift of the vehicle body increased by 13 counts instead. The changes in aerodynamic drag and lift indicate that when the ground is moving, the rotation of the wheels can induce a more significant influence on the flow field around the vehicle body.
Figure 24 and Table 13 shows the pressure distribution on the base region in MGSW and MGRW. On the one hand, consistent with the stationary ground condition, when the wheels are rotating, the surface pressure in Regions A and B rises. As mentioned in Section 3.3.1, wheel rotation can weaken the wheel wakes and reduce their effect on these two areas. However, on the other hand, the surface pressure in Region C appears to rise significantly (on average, CP rises by about 0.04) in MGRW. Therefore, the significant drop in the aerodynamic drag caused by the wheel rotation should be attributed to the change in surface pressure in Region C. Furthermore, the importance of the low-drag state is again shown.
Figure 25 shows the streamlines on the center plane of MGSW and MGRW. It can be clearly seen that the vortex structure in the middle area has changed significantly at this time. When the wheel is stationary, the lower vortex is not formed and the upper vortex is huge. However, when the wheel is rotating, the upper and lower vortices are in the low-drag state, as mentioned in Section 3.1 and Section 3.2.2. This means that the effect of rotating wheels is much more significant when the ground is moving. In other words, the existence of ground boundary layers can weaken the global aerodynamic effect of rotating wheels.
The different effects of rotating wheels can also be observed through time-averaged TKE, seen in Figure 26. Similar to the stationary ground condition, TKE on the lower part drops slightly but the amplitude is smaller. However, TKE in the upper region increases significantly. Commonly, the higher TKE represents stronger velocity pulsation, which may result in smaller vortex and higher base pressure. This is consistent with the results in Figure 24 and Figure 25.
In summary, rotation can weaken the flow separation on the wheels, resulting in the weakening of the wheel wakes, which can affect the wake near the base region, resulting in the drag reduction on both sides of the base. Furthermore, the effect of rotating wheels is affected by the ground state. When the ground is stationary, due to the low-speed area brought about by the ground boundary layer, the weakening effect of the rotating wheels on the wake is reduced. Moreover, when the ground is moving, the wheel rotation can push the vehicle wake to reach the low-drag state and a significant drag reduction can be obtained. However, when the ground is stationary, the low-drag state cannot be reached by wheel rotation; therefore, the total drag is not altered as much as the moving ground state.

3.4. Comprehensive Investigation of Ground and Wheels

In Section 3.2 and Section 3.3, the aerodynamic effects of the ground and wheel states are studied separately. Their influences on the local flow field near the wheel wakes as well as the influences on the aerodynamic characteristics of the whole vehicle are discussed and the mechanisms are also pointed out. Compared with Section 3.1, most of the flow field changes generated by the different wheel and ground states can be explained. However, there is still a problem that remains unsolved: how do the wheels and the ground affect the flow field near the center part of the base? Although the low-drag state has been discovered, the relationship between the wheels, the ground and this state is not very clear. As mentioned in Section 3.2.2 and Section 3.3.2, the center region has the dominant effect on the overall aerodynamic drag; therefore, it is extremely necessary to explore this
According to Section 3.2 and 
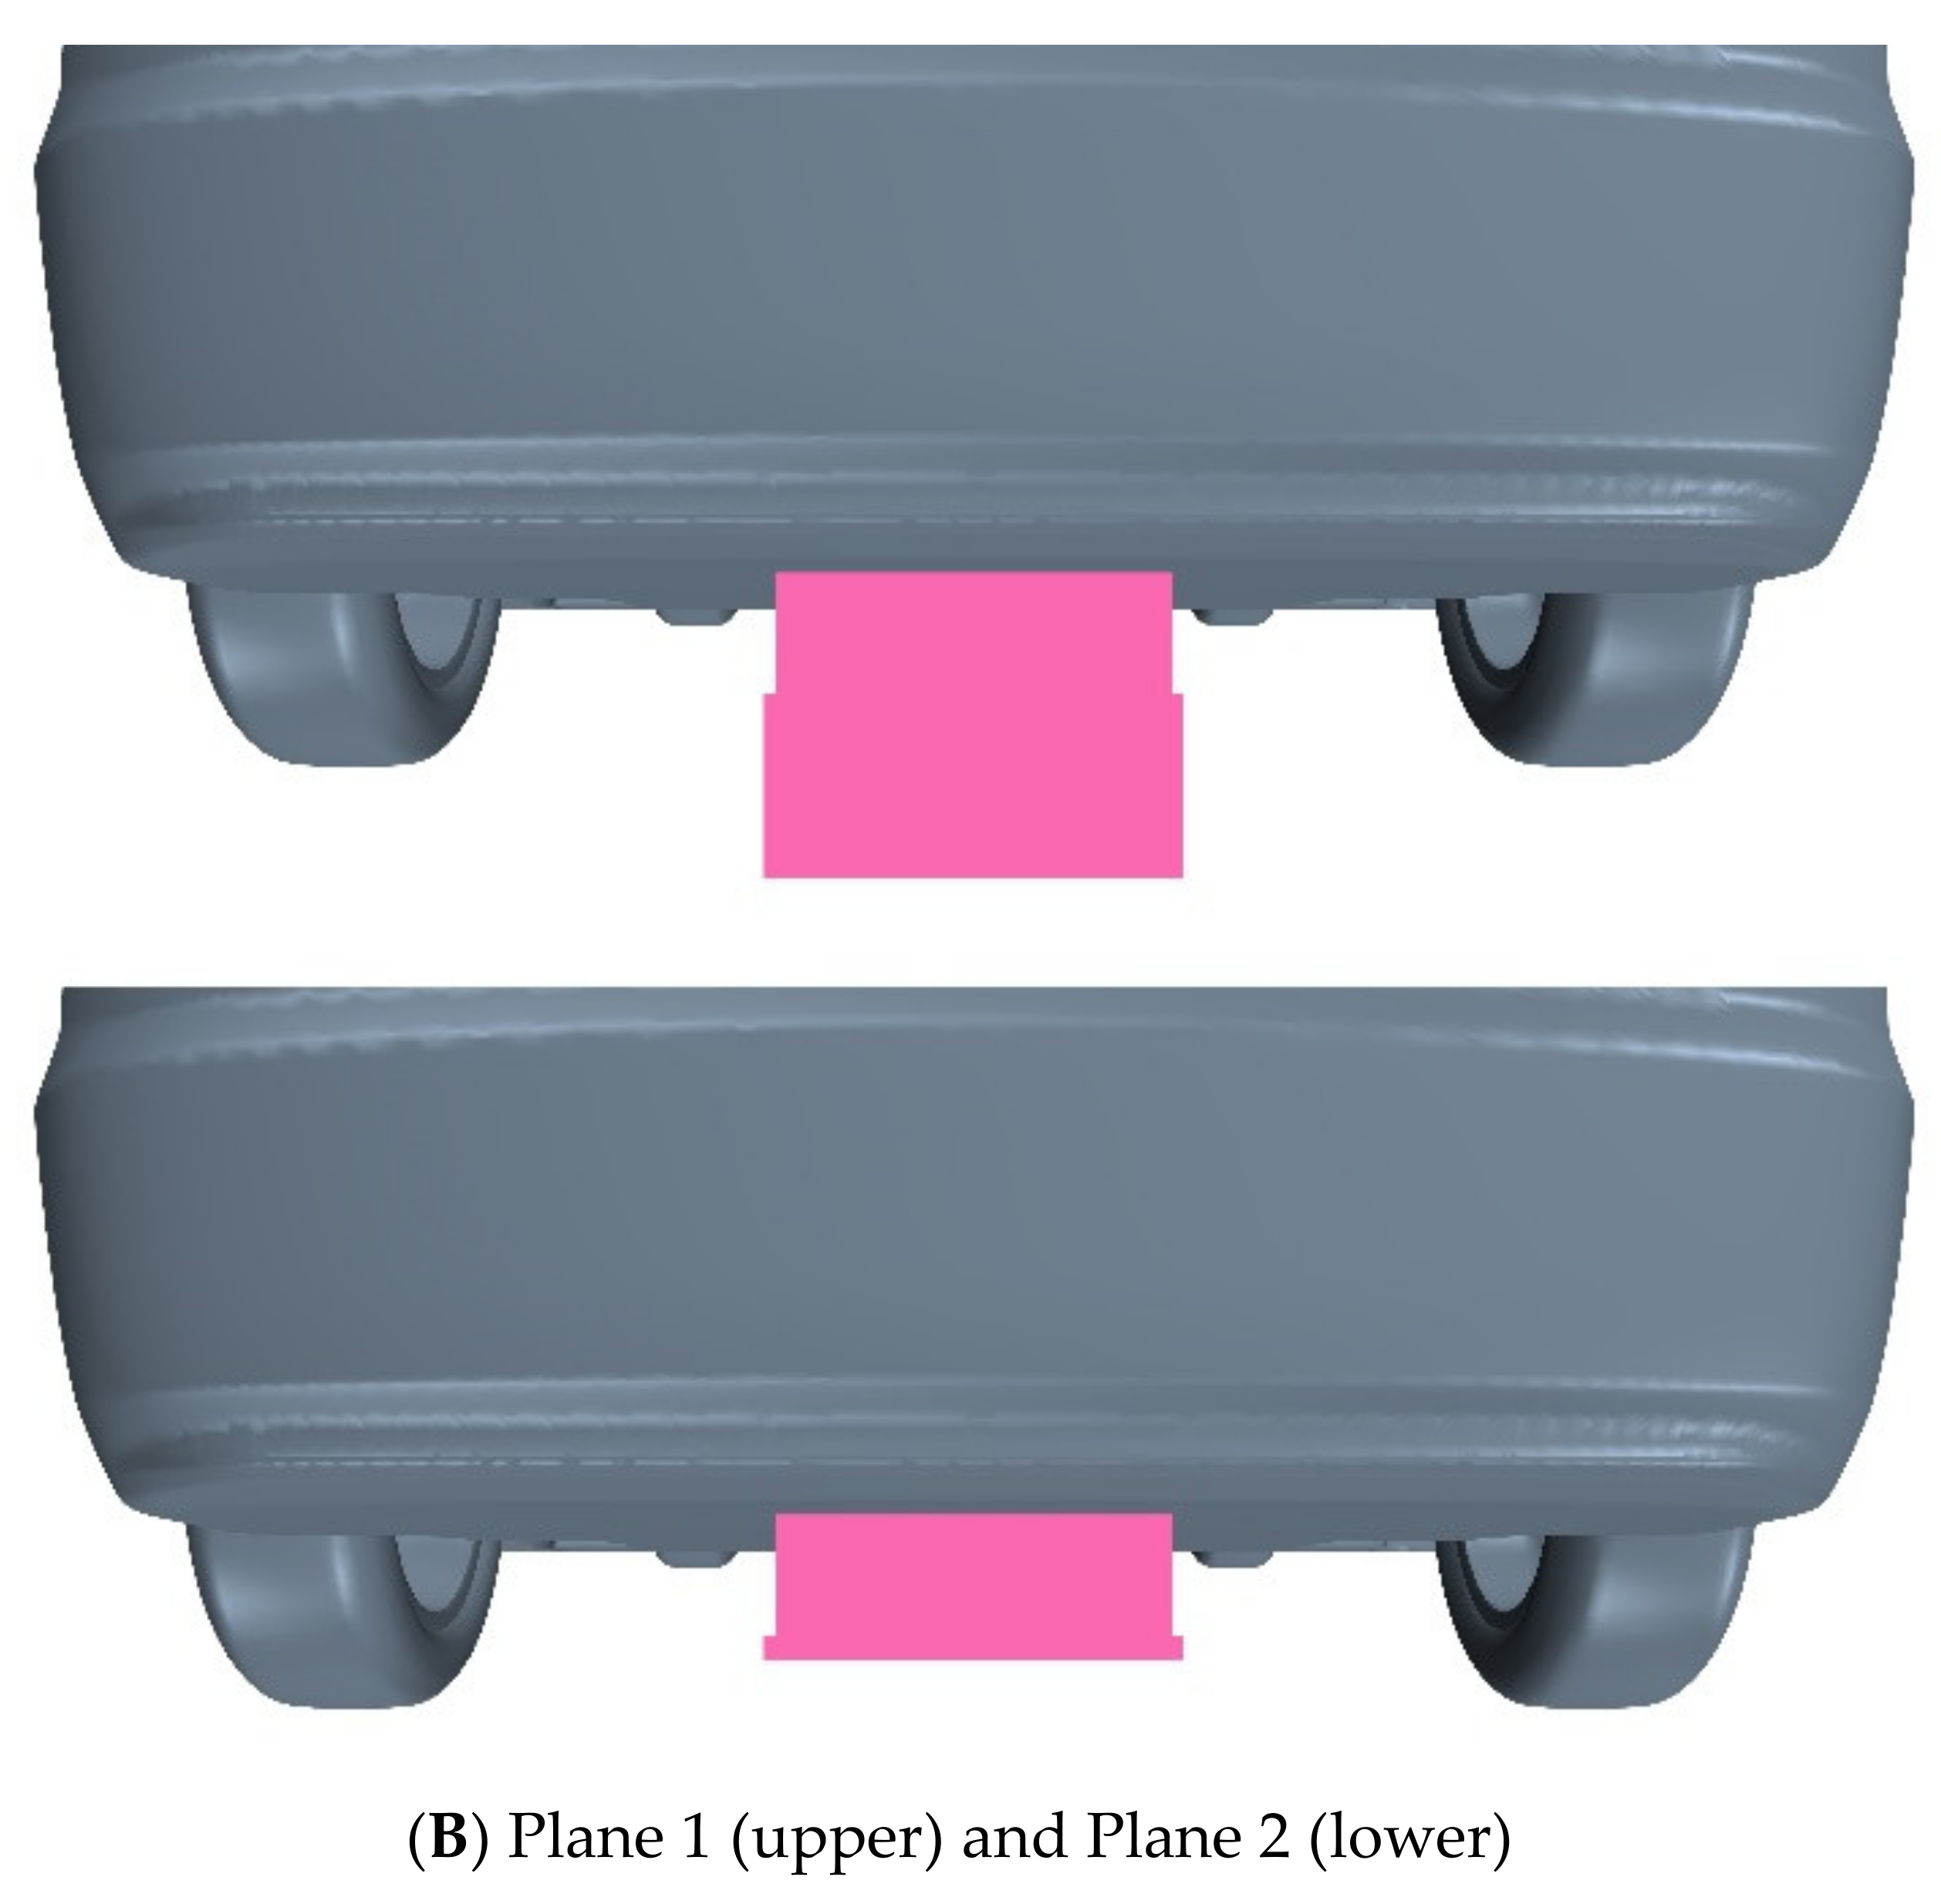
Section 3.3, it can be found that the low-drag state is decided by both the ground and wheel states; therefore, their comprehensive effects need to be investigated. Furthermore, even though the specific cause is not clear, it can be supposed that the low-drag state is linked to the flow rate near the underbody. In order to evaluate the lower underbody air flow rate, this study selected a set of sampling planes perpendicular to the x-axis at the following four important positions near the underbody: the axle of the front wheels (Plane A), the rear side of the front wheels (Plane B), the axle of the rear wheels (Plane C) and the rear end of the underbody (Plane D). The centerline of each sampling plane in y-direction coincides with the centerline of the vehicle body. The widths of the first three sets of planes are set to 0.3 m, and the sampling width of the last set of planes is set to 0.15 m. In addition, since the flow rate near the ground may be affected by the ground boundary layers, each set of sampling planes includes two planes with different heights. Plane one extends from the underbody to the ground, covering the complete ground clearance. Plane two only extends from the underbody to about half of the ground clearance, which is closer to the lower body. The specific location and size of each sampling plane are shown in Figure 27. In total, eight different sampling planes are generated, which are sequentially numbered as A1, A2, B1, B2, C1, C2, D1 and D2.
Table 14 shows the averaged velocity on the two sets of planes near the front wheels (A and B). It can be seen that the average flow rate is significantly affected by the ground. When the ground is moving, because the ground boundary layer is eliminated, the increase in the underbody flow rate is reasonable. When the wheels are rotating, the airflow rate is slightly lower than the stationary wheel state. This is probably due to the enhanced effect of the wheel wake near the underbody surface, as described in Section 3.3. However, because the front wheel area is still far from the base of the vehicle, there is no obvious correspondence between the average flow rate on planes A and B and the aerodynamic drag of the car body.
Table 15 shows the flow rate results on the two sets of planes near the rear wheels. Firstly, the results on the C1 and D1 planes are still similar to the results on Plane A and B. Since these two planes cover the entire ground clearance area, the average flow velocity on them is affected by the ground boundary layer, too. Moreover, when the wheels are rotating, the local effect of the rear wheel wake is not as strong as the front wheels; therefore, the wheel rotation will no longer decelerate the airflow of the underbody.
However, on the C2 and D2 planes, the air flow rate is changed significantly. The most noteworthy phenomenon is that there is a corresponding negative correlation between the flow velocity on Plane C2 and the drag coefficients of both the body and the entire vehicle. In MGSW, the flow velocity on Plane C2 is the smallest, and its aerodynamic drag is the largest. As the flow velocity on Plane C2 rises, the aerodynamic drag of the vehicle continues to decrease. In MGRW, the flow velocity on Plane C2 reaches about 36 m/s (90% of the free stream velocity). At this time, the low-drag state is reached, and the aerodynamic drag is also the smallest. On Plane D2, the negative correlation between the air flow velocity and the aerodynamic drag still basically exists, except SGSW. Despite this expectation, it can still be concluded that there is a corresponding relationship between the aerodynamic drag of the vehicle body and the airflow velocity near the rear part of the underbody surface. Combined with the previous analysis, it can be further speculated that there is a connection between the near-wall velocity and the low-drag state.
In order to analyze this relationship, it is necessary to comprehensively compare the flow field characteristics. 
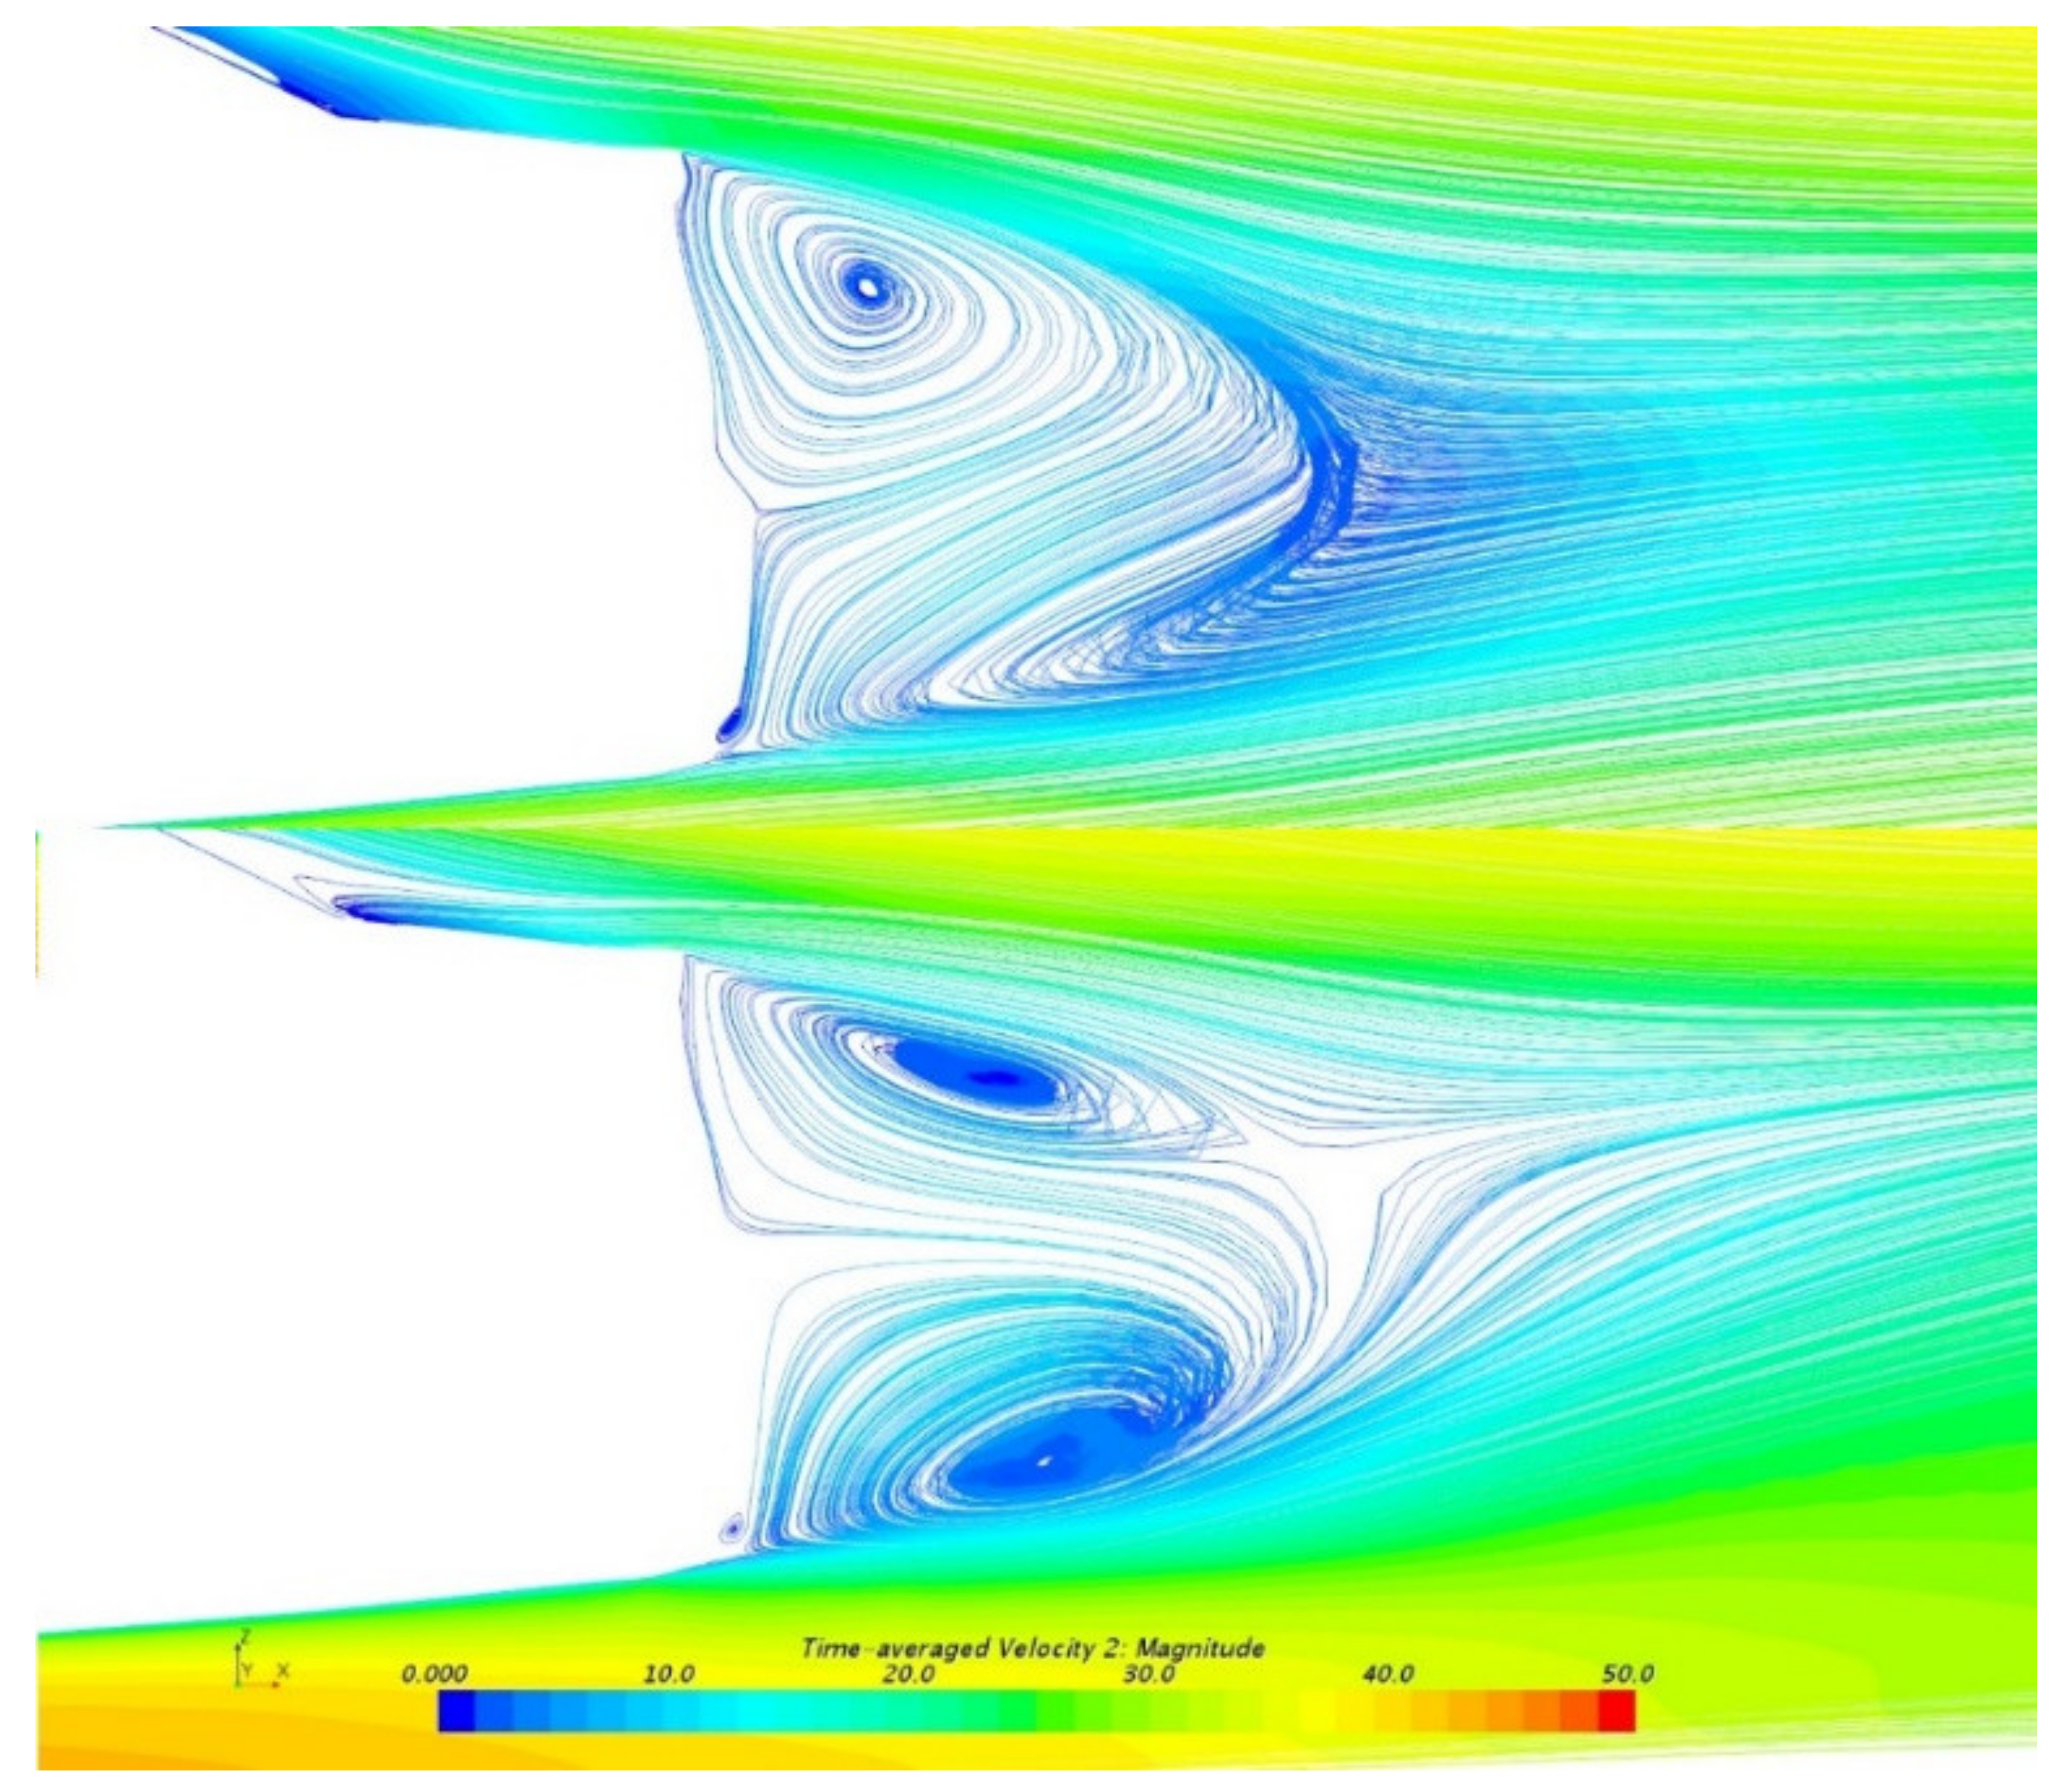
Figure 28 shows the streamlines on the center plane in the four conditions. The conditions from top to bottom and from left to right are MGSW, SGSW, SGRW and MGRW, in order. It is not difficult to see that when the velocity near the underbody surface is relatively low, the lower vortex on the center plane is almost completely absent. As the velocity rises, the lower vortex begins to form gradually and eventually grows to a state that is basically equivalent to the upper vortex. At this time, the wake looks symmetrical, and a low-drag state is reached. In this process, the change of the stagnation point is also worth noting. During the continuous development of the lower vortex, the position of the stagnation point is constantly rising. Therefore, it can be inferred that the increase in the flow velocity near the underbody surface can enhance the upwash, which pushes the stagnation point higher and leads to the formation of a lower vortex.
Figure 29 shows the iso-line of u = 0 on the center plane. The overall contour of the recirculation zone can be observed. It can be seen that as the flow rate near the underbody surface increases, the length of the recirculation region also increases, while the height of the stagnation point rises. Commonly, the lengthening of the recirculation region may weaken its effect on the base pressure and result in drag reduction, which corresponds to the results of drag reduction.
However, although the importance of the airflow velocity near the rear underbody surface has been determined and the mechanism is also explained, the relationship between the wheel and the ground states and the flow rate near the underbody is not clear. Based on common sense, when the ground is moving, flow speed near the underbody will naturally increase overall, but the result here is not the case. Therefore, it is still essential to analyze further the physical changes brought about by the different ground and wheel states.
The velocity distribution can be used to analyze the flow field changes in this area intuitively. 
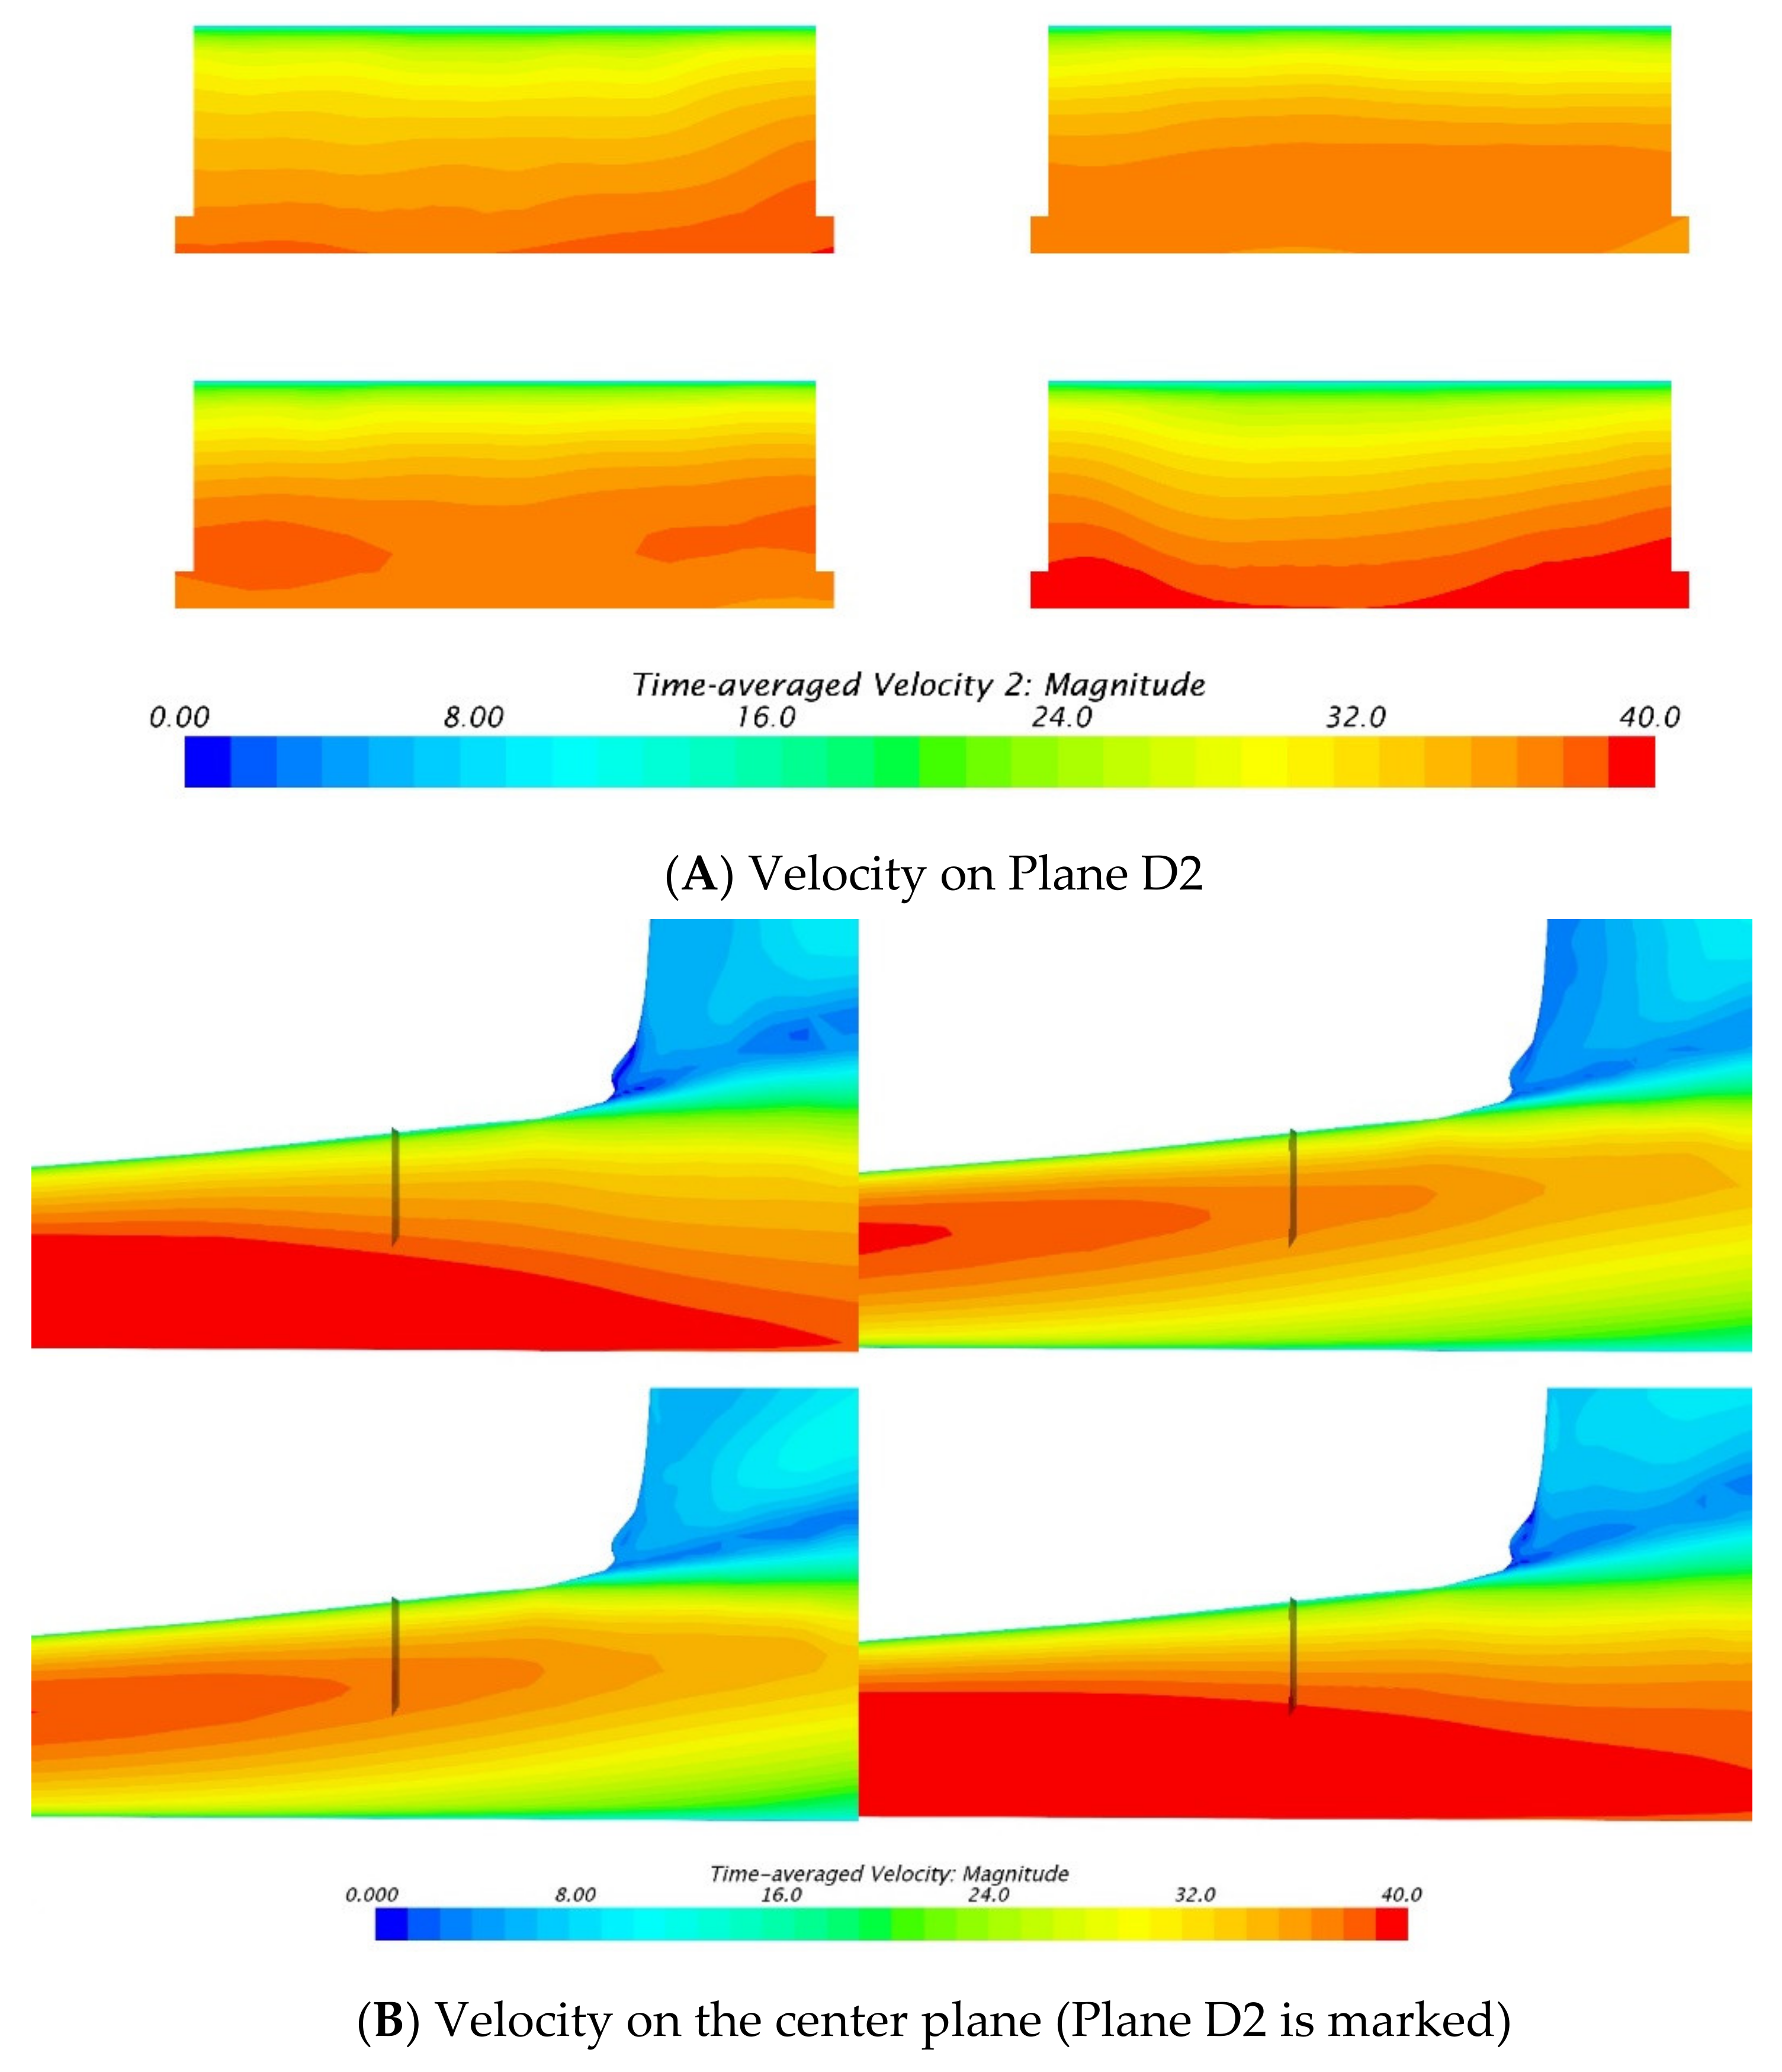
Figure 30 shows the velocity contour on Plane D2 and the center plane. It can be seen that when the ground is moving, the velocity gradient near the underbody surface is obviously smaller than that in the stationary ground condition. In other words, when the ground is moving, the boundary layer near the underbody is significantly thicker than that when the ground is stationary (by almost twice). Due to the larger thickness of the ground boundary layer, the lower air flow rate on Plane D2 can be explained. Moreover, it can also be observed that since the wheel rotation can weaken the rear wheel wake, the average flow velocity around the underbody rises. Under this circumstance, although the boundary layer in MGRW is still very thick, the average velocity on Plane D2 is the largest. Results of SGSW and SGRW are relatively close. Although the speed of SGSW is slightly higher than that of SGRW on the left and right sides of Plane D2, resulting in a higher overall speed, in the most important central area the boundary layer of SGRW is also slightly thinner than SGSW; therefore, the speed is also higher.
Through the velocity contour of the center plane, the speed changes near the underbody can be seen more clearly, as shown in Figure 30B. The position of plane D is also marked in the figure. When the ground is stationary, the thickness of the boundary layer of the ground, which continuously develops from the inlet to plane D, is very considerable. Due to the existence of the ground boundary layer, the airflow passing the ground clearance is deflected upward, squeezing and thinning the boundary layer of the underbody significantly. Therefore, although the presence of the ground boundary layer reduces the air flow velocity in the entire ground clearance region, it can eventually accelerate the flow near the underbody surface. At the same time, since the wheel rotation can weaken the wheel wake and increase the airflow velocity of the lower body, it can further thin the thickness of the boundary layer of the underbody and increase the flow rate near the wall.
In summary, the flow field near the center part of the base is not determined by the overall underbody flow, but by the flow rate near the underbody surface. When the near-underbody airflow is accelerated, the upwash airflow from the underbody becomes stronger. The stronger upwash can gradually oppose the downwash from the upper body; therefore, the stagnation point position is continuously raised, and the vehicle wake becomes longer. Finally, when the airflow velocity reaches a certain level (for this vehicle, the airflow near the rear wheel axis is about 90% of the free stream velocity), the size and position of the upper and lower vortices are basically symmetrical, reaching the low-drag state. At this time, the upper vortex is weakened and its impact on the surface pressure in Region C is reduced, resulting in an increase in the surface pressure and a decrease in the aerodynamic drag of the body and the entire vehicle. The influences of the ground and wheels on the airflow near the underbody surface mainly come from the changes in the average flow rate near the rear underbody. When the ground is stationary, the ground boundary layer is fully developed, which squeezes the underbody airflow and thins the boundary layer. Although the overall speed of the underbody airflow is low at this time, the airflow speed near the wall increases. Moreover, the weakening effect of the wheel rotation on the wake of the rear wheels will cause the overall underbody flow rate to increase (although this effect will be weakened by the ground boundary layer), and it will also further compress the underbody boundary layer. Therefore, the air velocity near the wall is also higher, the wake is more symmetrical, and the aerodynamic drag is reduced.

4. Conclusions and Future Work

This study conducted a comprehensive analysis of the impact of wheels and the ground on the aerodynamic performance of the Notchback DrivAer by numerical simulation. The main conclusions are listed as follows:
(1)
Firstly, an important low-drag state was observed. In this state, the upper and lower vortex near the center region of the vehicle wake is basically symmetrical in both position and size, the pressure on upper center region of the vehicle base (Region C) recovers and the total drag decreases significantly. It was discovered that the low-drag state is determined by the flow rate near the surface of the rear underbody. When the flow is accelerated, the enhanced upwash will lengthen the recirculation zone and raise the stagnation point in order to induce the wake to form the low-drag state.
(2)
Compared with the stationary wheel, wheel rotation can increase the air flow around the wheels and alter the wheel wake. On the one hand, wheel drag is reduced due to the weakened wake. On the other hand, the pressure on the two sides of the base is recovered and the body drag is reduced. Furthermore, the weakened wheel wakes can also increase the flow rate near the surface of the rear underbody and enhance the upwash, which can push the wake to arrive at the low-drag state.
(3)
Compared with the stationary ground, the ground movement can eliminate the ground boundary layer so the airflow velocity near the ground will increase, and the wheel wake will be slightly enhanced, resulting in an increase in the wheel and body drag. Moreover, the elimination of the ground boundary can result in a higher underbody flow rate. However, the ground boundary layer can deflect the airflow near the middle part of the underbody upwards, compress the boundary layer on the underbody and increase the average airflow velocity near the surface. Due to these opposite aspects, the global effect of ground movement is not sure. This may be one of the reasons why the MGRW state shows different effects on different vehicle types, as mentioned in the introduction.
(4)
The general effects of the wheel and ground states are independent of each other. However, its strength will be affected. The wheel rotation can weaken the wheel wakes, which make the effect of ground movements no longer obvious. Moreover, the existence of the ground boundary layer will decrease the flow velocity near the ground in order to weaken the effect of the rotating wheel.
In the future, we will first focus on the effect of the wheel and ground states on other vehicle types in order to verify the conclusions of this study. Furthermore, the transient effect of the ground and wheel states is also a critical point. Moreover, the low-drag state will also be investigated comprehensively in order to further understand the aerodynamic effect of the wheels and the ground.

Author Contributions

Conceptualization, Q.J. and Z.Y.; methodology, X.Y.; software, X.Y.; validation, X.Y. and Q.J.; formal analysis, X.Y.; investigation, X.Y.; resources, X.Y.; data curation, Q.J.; writing—original draft preparation, X.Y.; writing—review and editing, Q.J.; visualization, Q.J.; supervision, Z.Y.; project administration, Z.Y.; funding acquisition, Z.Y. All authors have read and agreed to the published version of the manuscript.

Funding

This research is funded by National Natural Science Foundation of China (Grant No. 51875306.

Institutional Review Board Statement

Not applicable.

Informed Consent Statement

Not applicable.

Data Availability Statement

Not applicable.

Conflicts of Interest

The authors declare no conflict of interest.

References

  1. Hobeika, T.; Sebben, S.; Landstrom, C. Investigation of the influence of tyre geometry on the aerodynamics of passenger cars. SAE Int. J. Passeng. Cars-Mech. Systems. 2013, 6, 316–325. [Google Scholar] [CrossRef] [Green Version]
  2. Elofsson, P.; Bannister, M. Drag reduction mechanisms due to moving ground and wheel rotation in passenger cars. SAE Tech. Pap. 2002. [Google Scholar] [CrossRef]
  3. Koitrand, S.; Lofdahl, L.; Rehnberg, S.; Gaylard, A. A computational investigation of ground simulation for a saloon car. SAE Int. J. Commer. Veh. 2014, 7, 111–123. [Google Scholar] [CrossRef]
  4. Howell, J.; Hickman, D. The influence of ground simulation on the aerodynamics of a simple car model. SAE Tech. Pap. 1997. [Google Scholar] [CrossRef]
  5. Huminic, A.; Chiru, A. On CFD investigations of vehicle aerodynamics with rotating wheels’ simulation. SAE Tech. Pap. 2006. [Google Scholar] [CrossRef]
  6. Yamashita, T.; Makihara, T.; Saito, Y.; Kato, C.; Takayama, R.; Takayama, T.; Yamade, Y. Effects of Moving Ground and Rotating Wheels on Aerodynamic Drag of a Two-Box Vehicle. SAE Int. J. Passeng. Cars-Mech. Syst. 2018, 11, 415–428. [Google Scholar] [CrossRef]
  7. Regert, T.; Lajos, T. Description of flow field in the wheelhouses of cars. Int. J. Heat Fluid Flow. 2007, 28, 616–629. [Google Scholar] [CrossRef]
  8. Rajaratnam, E.; Walker, D. Investigation of wheelhouse flow interaction and the influence of lateral wheel displacement. Energies 2019, 12, 3340. [Google Scholar] [CrossRef] [Green Version]
  9. Basso, M.; Cravero, C.; Marsano, D. Aerodynamic Effect of the Gurney Flap on the Front Wing of a F1 Car and Flow Interactions with Car Components. Energies 2021, 14, 2059. [Google Scholar] [CrossRef]
  10. Fernandez-Gamiz, U.; Gomez-Mármol, M.; Chacón-Rebollo, T. Computational modeling of gurney flaps and microtabs by POD method. Energies 2018, 11, 2091. [Google Scholar] [CrossRef] [Green Version]
  11. Pavia, G.; Passmore, M. Characterisation of wake bi-stability for a square-back geometry with rotating wheels. In Proceedings of the 11th FKFS Conference, Sttutgart, Germany, 26–27 September 2017; Springer: Cham, Switzerland, 2017; pp. 93–109. [Google Scholar]
  12. Bonitz, S.; Larsson, L.; Sebben, S. Unsteady pressure analysis of the near wall flow downstream of the front wheel of a passenger car under yaw conditions. Int. J. Heat Fluid Flow. 2018, 73, 188–198. [Google Scholar] [CrossRef] [Green Version]
  13. Wang, S.; Avadiar, T.; Thompson, M.C.; Burton, D. Effect of moving ground on the aerodynamics of a generic automotive model: The DrivAer-Estate. J. Wind. Eng. Ind. Aerodyn. 2019, 195, 104000. [Google Scholar] [CrossRef]
  14. Wang, Y.; Sicot, C.; Borée, J.; Grandemange, M. Experimental study of wheel-vehicle aerodynamic interactions. J. Wind. Eng. Ind. Aerodyn. 2020, 198, 104062. [Google Scholar] [CrossRef] [Green Version]
  15. McArthur, D.; Burton, D.; Thompson, M.; Sheridan, J. On the near wake of a simplified heavy vehicle. J. Fluids Struct. 2016, 66, 293–314. [Google Scholar] [CrossRef]
  16. Barros, D.; Borée, J.; Cadot, O.; Spohn, A.; Noack, B.R. Forcing symmetry exchanges and flow reversals in turbulent wakes. J. Fluid Mech. 2017, 829, 1–12. [Google Scholar] [CrossRef]
  17. Littlewood, R.; Passmore, M. The Optimization of Roof Trailing Edge Geometry of a Simple Square-Back. SAE Tech. Pap. 2010. [Google Scholar] [CrossRef]
  18. Jowsey, L. An Experimental Study of Automotive Underbody Diffusers; Loughborough University: Loughborough, UK, 2013. [Google Scholar]
  19. Heft, A.I.; Indinger, T.; Adams, N.A. Introduction of a New Realistic Generic Car Model for Aerodynamic Investigations. SAE Tech. Pap. 2012. [Google Scholar] [CrossRef]
  20. Yu, X.; Jia, Q.; Bao, D.; Yang, Z. A Comparative Study of Different Wheel Rotating Simulation Methods in Computational Fluid Dynamics. SAE Tech. Pap. 2018. [Google Scholar] [CrossRef]
  21. Yu, X.; Jia, Q.; Rashidi, M.M.; Yang, Z. Comprehensive investigating on the aerodynamic influences of the wheel contact patch. J. Appl. Comput. Mech. 2020, 6, 934–955. [Google Scholar] [CrossRef]
  22. Shur, M.L.; Spalart, P.R.; Strelets, M.K.; Travin, A.K. A hybrid RANS-LES approach with delayed-DES and wall-modelled LES capabilities. Int. J. Heat. Fluid Flow. 2008, 29, 1638–1649. [Google Scholar] [CrossRef]
  23. Spalart, P.R. Detached-eddy simulation. Ann. Rev. Fluid Mech. 2009, 41, 181–202. [Google Scholar] [CrossRef]
  24. Huang, S.; Hemida, H.; Yang, M.Z. Numerical calculation of the slipstream generated by a CRH2 high-speed train. Proc. Inst. Mech. Eng. Part F J. Rail Rapid Transp. 2016, 230, 103–116. [Google Scholar] [CrossRef]
  25. Travin, A.; Shur, M.L.; Strelets, M.K.; Spalart, P.R. Physical and numerical upgrades in the detached-eddy simulation of complex turbulent flows. In Proceedings of the 412th Euromech Colloquium on LES and Complex Transitional and Turbulent Flows, Munich, Germany, 4–6 October 2000. [Google Scholar]
  26. Peichl, M.; Mack, S.; Indinger, T.; Decker, F. Numerical Investigation of the Flow Around a Generic Car Using Dynamic Mode Decomposition. In ASME 2014 4th Joint US-European Fluids Engineering Division Summer Meeting collocated with the ASME 2014, In Proceedings of the 12th International Conference on Nanochannels, Microchannels, and Minichannels, ASME, Chicago, IL, USA, 3–7 August 2014; ASME: New York, NY, USA, 2014; p. V01CT17A002. [Google Scholar]
  27. Diasinos, S.; Barber, T.J.; Doig, G. The effects of simplifications on isolated wheel aerodynamics. J. Wind. Eng. Ind. Aerodyn. 2015, 146, 90–101. [Google Scholar] [CrossRef] [Green Version]
Figure 1. Notchback DrivAer.
Energies 15 01124 g001
Figure 2. Computational domain and boundary conditions.
Energies 15 01124 g002
Figure 3. Y+ distribution on the car.
Energies 15 01124 g003
Figure 4. Coarse and refined meshes.
Energies 15 01124 g004
Figure 5. CP on the centerline of the body.
Energies 15 01124 g005
Figure 6. CP on the base, Region A to D are marked. (upper: SGSW; lower: MGRW).
Energies 15 01124 g006
Figure 7. CP on the underbody (upper: SGSW; lower: MGRW).
Energies 15 01124 g007
Figure 8. Time-averaged velocity on z = −0.07 m plane (upper: SGSW; lower: MGRW).
Energies 15 01124 g008
Figure 9. Iso-surface of CTP = 0 (upper: SGSW; lower: MGRW).
Energies 15 01124 g009
Figure 10. Streamlines on the center plane (upper: SGSW; lower: MGRW).
Energies 15 01124 g010
Figure 11. TKE on the center plane (upper: SGSW; lower: MGRW).
Energies 15 01124 g011
Figure 12. CP on the base (upper: SGSW; lower: MGSW).
Energies 15 01124 g012
Figure 13. Time-averaged velocity on z = −0.07 m (upper: SGSW; lower: MGSW).
Energies 15 01124 g013
Figure 14. Surface streamlines on different positions (upper: SGSW; lower: MGSW).
Energies 15 01124 g014
Figure 15. TKE on the center plane (upper: SGSW; lower: MGSW).
Energies 15 01124 g015
Figure 16. CP on the base (upper: SGRW; lower: MGRW).
Energies 15 01124 g016
Figure 17. Time-averaged velocity on z = −0.07 m (upper: SGRW; lower: MGRW).
Energies 15 01124 g017
Figure 18. Surface streamlines on different positions (upper: SGRW; lower: MGRW).
Energies 15 01124 g018aEnergies 15 01124 g018b
Figure 19. TKE on the center plane (upper: SGRW; lower: MGRW).
Energies 15 01124 g019
Figure 20. CP on the base (upper: SGSW; lower: SGRW).
Energies 15 01124 g020
Figure 21. CP on the underbody (upper: SGSW; lower: SGRW).
Energies 15 01124 g021
Figure 22. Iso-surface of CTP = 0 (upper: SGSW; lower: SGRW).
Energies 15 01124 g022
Figure 23. Streamlines on the center plane (upper: SGSW; lower: SGRW).
Energies 15 01124 g023
Figure 24. CP on the base (upper: MGSW; lower: MGRW).
Energies 15 01124 g024
Figure 25. Streamlines on the center plane (upper: MGSW; lower: MGRW).
Energies 15 01124 g025
Figure 26. Time-averaged TKE on the center plane (upper: MGSW; lower: MGRW).
Energies 15 01124 g026
Figure 27. Sampling planes.
Energies 15 01124 g027aEnergies 15 01124 g027b
Figure 28. Streamlines on the center plane (upper left: MGSW; lower left: SGSW; upper right: SGRW; lower right: MGRW).
Energies 15 01124 g028
Figure 29. Iso-line u = 0 on the center plane (upper left: MGSW; lower left: SGSW; upper right: SGRW; lower right: MGRW).
Energies 15 01124 g029
Figure 30. Velocity distribution on specified planes (upper left: MGSW; lower left: SGSW; upper right: SGRW; lower right: MGRW).
Energies 15 01124 g030
Table 1. Boundary conditions.
BoundarySetups
InletVelocity inlet, 40 m/s
OutletPressure outlet
Roof/Side wallsSymmetry
GroundStationary/Moving wall
Car bodyStationary Wall
WheelsRotating wall (Tire) + Sliding Mesh (Spokes)
Table 2. CD and CL of different meshes (MGRW).
Grid NumberCDCL
Baseline38.3 M--
Refined-150.5 M+0.002−0.003
Refined-291.9 M0−0.001
Table 3. CD comparisons with experiments.
CDΔCDPercentage
MGRW0.248--
TUM, exp, 2012. [19]0.246+0.002+0.81%
Audi, exp, 2014. [26]0.254−0.006−2.36%
Table 4. CD and CL of SGSW and MGRW.
CDCD BodyCLCL Body
SGSW0.259 0.189 0.027 0.005
MGRW0.2480.185−0.076−0.062
Table 5. Average CP on four sub-regions in SGSW and MGRW.
Region A + BRegion CRegion D
SGSW−0.0798−0.0350−0.0268
MGRW−0.07210.0007−0.0316
Table 6. CD and CL of SGSW and MGSW.
Case NameCDCLCD BodyCL Body
SGSW0.2590.0270.1890.005
MGSW0.265−0.0800.194−0.075
Table 7. Average CP on four sub-regions in SGSW and MGSW.
Case NameRegion A + BRegion CRegion D
SGSW−0.0798−0.0350−0.0268
MGSW−0.0900−0.0354−0.0324
Table 8. CD and CL of SGRW and MGRW.
Case NameCDCLCD BodyCL Body
SGRW0.253−0.0030.1870.006
MGRW0.248−0.0760.185−0.062
Table 9. Average CP on four sub-regions in SGRW&MGRW.
Case NameRegion A + BRegion CRegion D
SGRW−0.0643−0.0328−0.0257
MGRW−0.07210.0007−0.0316
Table 10. CD and CL of SGSW and SGRW.
Case NameCDCLCD BodyCL Body
SGSW0.2590.0270.1890.005
SGRW0.253 −0.003 0.1870.006
Table 11. Average CP on four sub-regions in SGSW and SGRW.
Region A + BRegion CRegion D
SGSW−0.0798−0.0350−0.0268
SGRW−0.0643−0.0328−0.0257
Table 12. CD and CL of MGSW and MGRW.
Case NameCDCLCD bodyCL body
MGSW0.265−0.0800.194−0.075
MGRW0.248−0.0760.185−0.062
Table 13. Average CP on four sub-regions in SGSW and SGRW.
Region A + BRegion CRegion D
MGSW−0.0900−0.0354−0.0324
MGRW−0.07210.0007−0.0316
Table 14. The averaged velocity on Planes A1 to B2 (m/s).
Case NameA1A2B1B2CD BodyCD
SGSW42.3639.7141.8939.620.1890.259
SGRW42.1039.0941.3338.820.1870.253
MGSW45.9141.2045.5240.660.1940.265
MGRW45.7941.0144.9940.160.1850.248
Table 15. The averaged velocity on Plane C1 to D2 (m/s).
Case NameC1C2D1D2CD BodyCD
SGSW35.5935.2132.1134.240.1890.259
SGRW35.8835.7132.0133.770.1870.253
MGSW40.0534.8936.5033.290.1940.265
MGRW41.0836.3437.1734.060.1850.248
Publisher’s Note: MDPI stays neutral with regard to jurisdictional claims in published maps and institutional affiliations.

