Article

An Intelligent Site Selection Model for Hydrogen Refueling Stations Based on Fuzzy Comprehensive Evaluation and Artificial Neural Network—A Case Study of Shanghai

1
Hubei Collaborative Innovation Center for Automotive Components Technology, Hubei Key Laboratory of Advanced Technology for Automotive Components, School of Automotive Engineering, Wuhan University of Technology, Wuhan 430070, China
2
School of Mechanical and Electrical Engineering, Wuhan Business University, Wuhan 430056, China
3
Automobile Technology and Service College, Wuhan City Polytechnic, Wuhan, 430064, China
4
China Automotive Technology and Research Center (Wuhan), Wuhan 430056, China
*
Author to whom correspondence should be addressed.
Energies 2022, 15(3), 1098; https://doi.org/10.3390/en15031098
Submission received: 21 November 2021 / Revised: 27 January 2022 / Accepted: 28 January 2022 / Published: 1 February 2022
(This article belongs to the Topic Hydrogen Energy Technologies)

Abstract

:
With the gradual popularization of hydrogen fuel cell vehicles (HFCVs), the construction and planning of hydrogen refueling stations (HRSs) are increasingly important. Taking operational HRSs in China’s coastal and major cities as examples, we consider the main factors affecting the site selection of HRSs in China from the three aspects of economy, technology and society to establish a site selection evaluation system for hydrogen refueling stations and determine the weight of each index through the analytic hierarchy process (AHP). Then, combined with fuzzy comprehensive evaluation (FCE) method and artificial neural network model (ANN), FCE method is used to evaluate HRS in operation in China’s coastal areas and major cities, and we used the resulting data obtained from the comprehensive evaluation as the training data to train the neural network. So, an intelligent site selection model for HRSs based on fuzzy comprehensive evaluation and artificial neural network model (FCE-ANN) is proposed. The planned HRSs in Shanghai are evaluated, and an optimal site selection of the HRS is obtained. The results show that the optimal HRSs site selected by the FCE-ANN model is consistent with the site selection obtained by the FCE method, and the accuracy of the FCE-ANN model is verified. The findings of this study may provide some guidelines for policy makers in planning the hydrogen refueling stations.

1. Introduction

Hydrogen energy is known as the cleanest secondary energy, and hydrogen fuel cell vehicles (HFCVs) have attracted much attention due to their near-zero emission and pollution-free advantages [1,2]. Hydrogen fuel cell vehicles can be used efficiently and conveniently, and rationally set HRSs play a key role [3,4]. The site selection of HRSs involves the influence of various factors such as technology, economy and society. For a long time, establishing scientific and reasonable site selection criteria has been a problem academic circles are striving to solve [5,6]. In the past five years, various countries have begun to build HRSs on a large scale to promote the development of the HFCVs industry [1,7,8,9]. According to statistics, the number of HRSs in the world has exceeded 900, of which more than 300 are in China. Also, there were more than 500 HRSs in operation in the world by the end of 2021 [10,11]. 
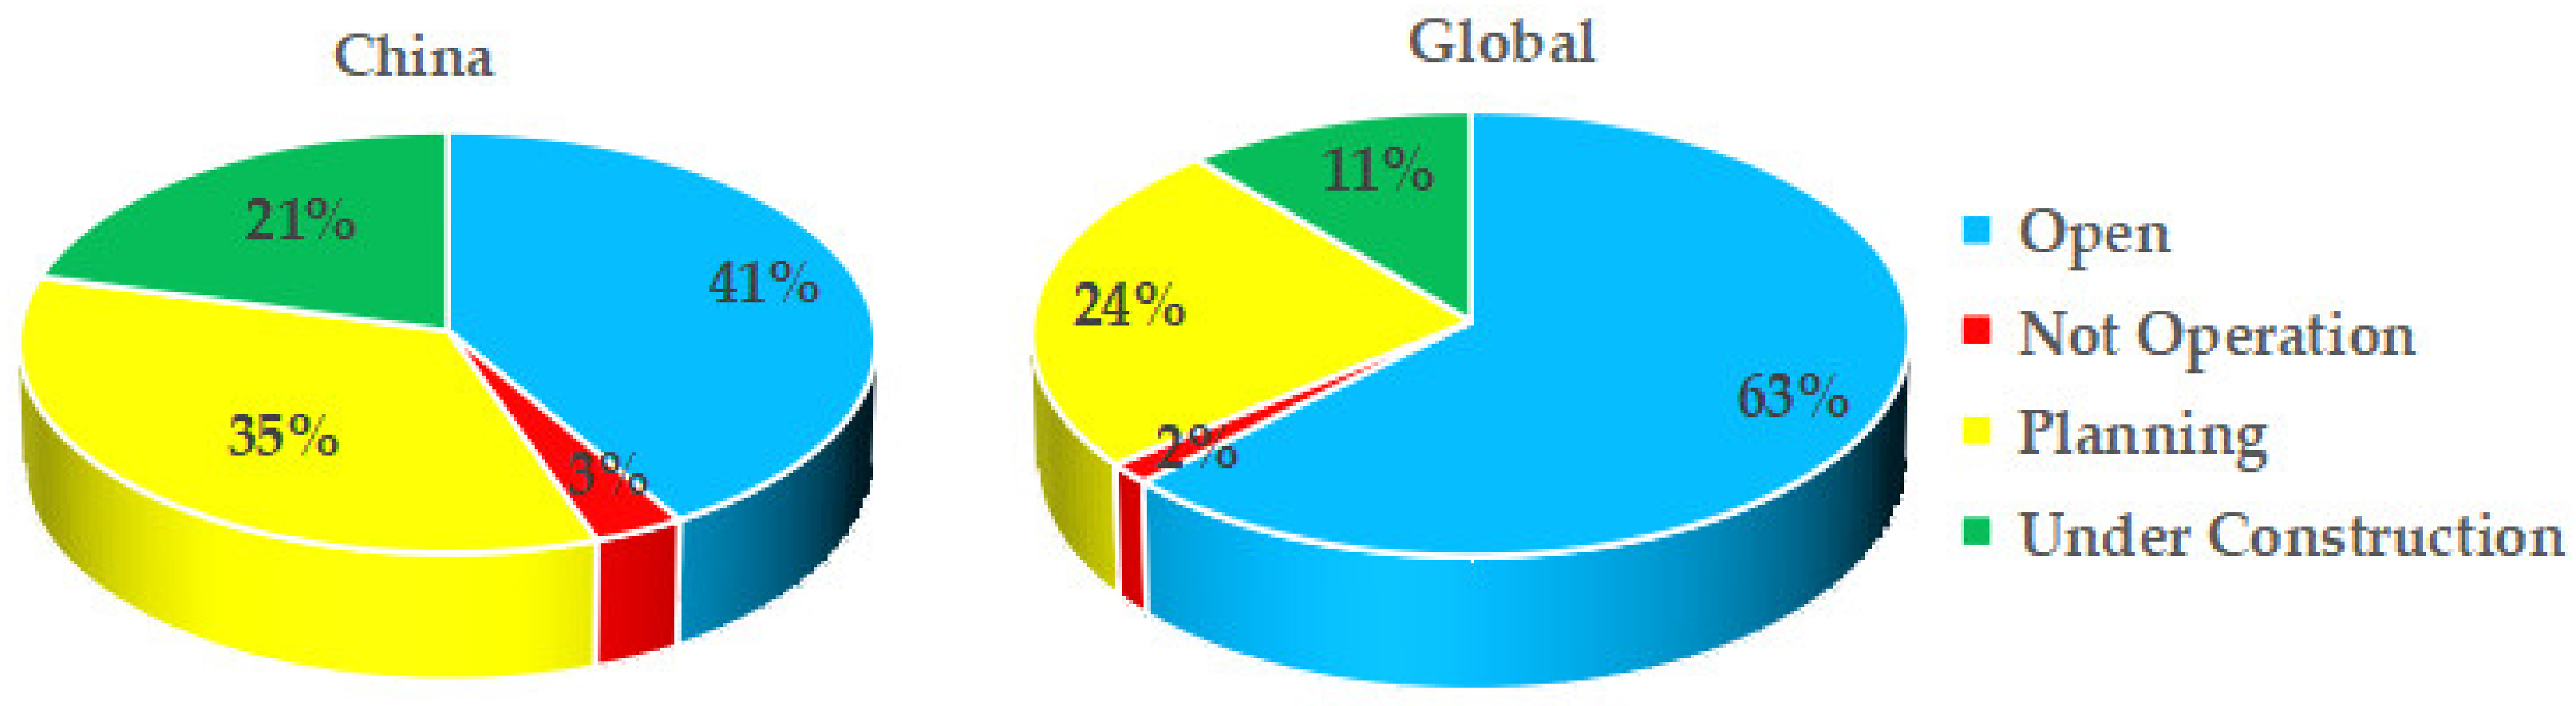
Figure 1 shows the operation, construction and planning of HRSs in China and around the world. As can be seen from Figure 1, compared with the world, China has a relatively small proportion in normal operation and a large proportion in planning. As the largest country in the production and sales of new energy vehicles, relevant institutions and enterprises highly value site selection [12]. However, the HRS layout and planning are not simple. There are many factors and obstacles to consider, such as high construction costs, immature hydrogen transportation technology, long payback periods, and a shortage of HFCVs [5,13,14,15]. These obstacles lead to the actual operation of HRSs not being positive. Compared with gas stations, HRSs have greater safety risks; the recent HRS explosion in Norway confirmed this [16]. Especially in a city, and faced with a relatively dense population and complex and specific road environments, factories, and other building facilities, the construction of hydrogen refueling stations is more difficult [17,18]. The motivation of this research is to seek to establish an intelligent decision-making model for the site selection of HRSs, which specifically guides the location and construction of HRSs, so as to promote the rapid development of the hydrogen fuel cell vehicle industry. The relevant results are verified in Shanghai, China.
It has been found according to previous studies that many scholars have begun to carry out related research on HRSs. In order to solve different problems, the research themes are also different. For example, on the issue of factors affecting the construction of HRSs, Xu, C. et al, focusing on the obstacles in the development of hydrogen refueling stations, a modified fuzzy DEMATEL approach was adopted to establish a comprehensive barrier list for the construction of HRSs from four perspectives: technology, economy, society and politics [5]. Bai, W. et al. aimed at how to choose an appropriate financing model in the stage of investment and construction of a HRS, established a financing model decision-making index system, and determined the priority of each factor based on Fuzzy AHP [13]. The above research results provide a reference for the sustainable development of HRSs. In the study of the HRS site selection model, Zhou, J. et al. established a two-stage site selection optimization model based on geographic information big data to provide technical support for the layout of HRSs. In this study, ten types of geographic information were selected. The layout of the HRS is planned based on the elements and six evaluation indicators, and Shandong, China is selected as a case to demonstrate the model, which provides a reference and basis for the development of hydrogen energy strategy in Shandong Province [1]. Sun et al. proposed a HRS location model based on hydrogen life cycle cost and consumer hydrogen cost. The optimization goal is to minimize the total cost of HRS construction and operation [19], and establish a city HRS location and capacity calculation. Using the multi-dimensional particle swarm algorithm to solve the model [6,20,21], there are still a large number of studies focusing on the development of hydrogen energy vehicles and the construction of HRSs under the background of reducing energy consumption and carbon emissions, And the hydrogen safety research for risk assessment, etc. [22,23,24,25,26]. From the above research questions, it can be found that there are few studies on the evaluation and prediction of the location of HRSs. The cost and location of the HRSs are important in the process of site selection and planning. The sustainable development of HRSs plays an important role, so it must be meaningful to use the comprehensive evaluation results of the already operating HRSs as a reference in the planning process of the site selection of HRSs.
Artificial neural network (ANN) has the ability to learn to predict behaviors and patterns from a limited set of correct data to make statistics and predict future developments [27,28]. There are many types of ANN algorithms, such as BP, RBF, MLP, GMDH, GA etc. Among them, the BP algorithm has high self-learning and adaptive capabilities, and can automatically extract "reasonable rules" between input and output data through learning [29]. The generalization ability of RBF is better than that of BP in many aspects; however, when solving problems with the same accuracy requirements, the structure of BP network is simpler than that of RBF network [30,31]. The biggest feature of the GMDH network is that the input quantity taken is automatically determined during the training process, while neural networks such as BP require a lot of prior knowledge to determine the network structure, but the problem of time-consuming nonlinear modeling of the GMDH algorithm is unavoidable [32,33]. MLP is a generalization of single-layer perceptron, which can solve nonlinear problems that single-layer perceptron cannot solve [34]. Roshani, G. H. et al. using an ANN model, the volume fraction of gas, oil and water in three-phase flow independent of flow regime was predicted with high accuracy. The ANN model was developed in MATLAB software using a multilayer perceptron (MLP) neural network [35].
Amir Sattari, M. et al. used the ANN method in the prediction of flow pattern type and gas volume percentage to realize the identification of the flow state and high-precision prediction of the porosity of each flow state [36]. The above research shows that ANN model has obvious advantages in statistics and prediction. At the same time, the training and learning process of neural network requires a large amount of data. For more accurate planning of HRSs, it is undoubtedly a very effective learning data to select the evaluation data of the operational HRSs as the learning and training data of the neural network. The evaluation of the completed HRSs is a complex multi-criteria decision-making process, "AHP, FCE, Expert System, and fuzzy multi-criteria decision-making (FMCDM)" have become the preferred method for solving this type of problems [37,38,39,40,41,42]. The AHP can classify and deal with many influential indicators, it has the characteristics of systematization and modeling, and it can determine the weight of each indicator in the evaluation system [43,44]. Some factors are difficult to quantify or quantitative cost is higher, and the quantitative value is subject to subjective factors of evaluators. Factors such as policies can only be described by fuzzy qualitative language, and it is difficult to use classical mathematical models to accurately calculate and determine the optimal scheme from selected schemes. The FCE method can solve these problems well [45,46,47]. However, the calculation process of FCE is more complicated, and implementation is easily influenced by subjective factors [48]. Using fuzzy control theory to quantify unquantifiable factors, and using ANN to analyze experimental data, error is small, there is high precision, and complex forecasting problems have good generalization ability [35,36]. Therefore, in order to supplement the previous research on the site selection and planning of HRSs, there is a lack of research on the comprehensive evaluation of the already built hydrogen refueling stations as a reference decision-making standard. This paper will establish an evaluation system for HRSs planning through AHP, and use fuzzy comprehensive evaluation and artificial neural network model (FCE-ANN) to evaluate and predict the site selection of HRSs under planning.
Based on the overview and analysis of the above researches, the main findings are as follows:
1. At present, there are few studies on the evaluation of the site selection of HRSs. The existing studies tend to be macro-development plans, and the evaluation results of specific HRSs cannot be given.
2. The existing HRSs site selection planning model lacks the comprehensive evaluation of the operational HRSs as a reference decision-making standard.
3. The layout of HRSs is affected by many factors, most of which are complex and not easy to be measured specifically. According to the literature survey, few people have specialized in training neural networks based on the evaluation data of operational HRSs.
On the basis of the above analysis, we can position and clarify this paper’s contribution:
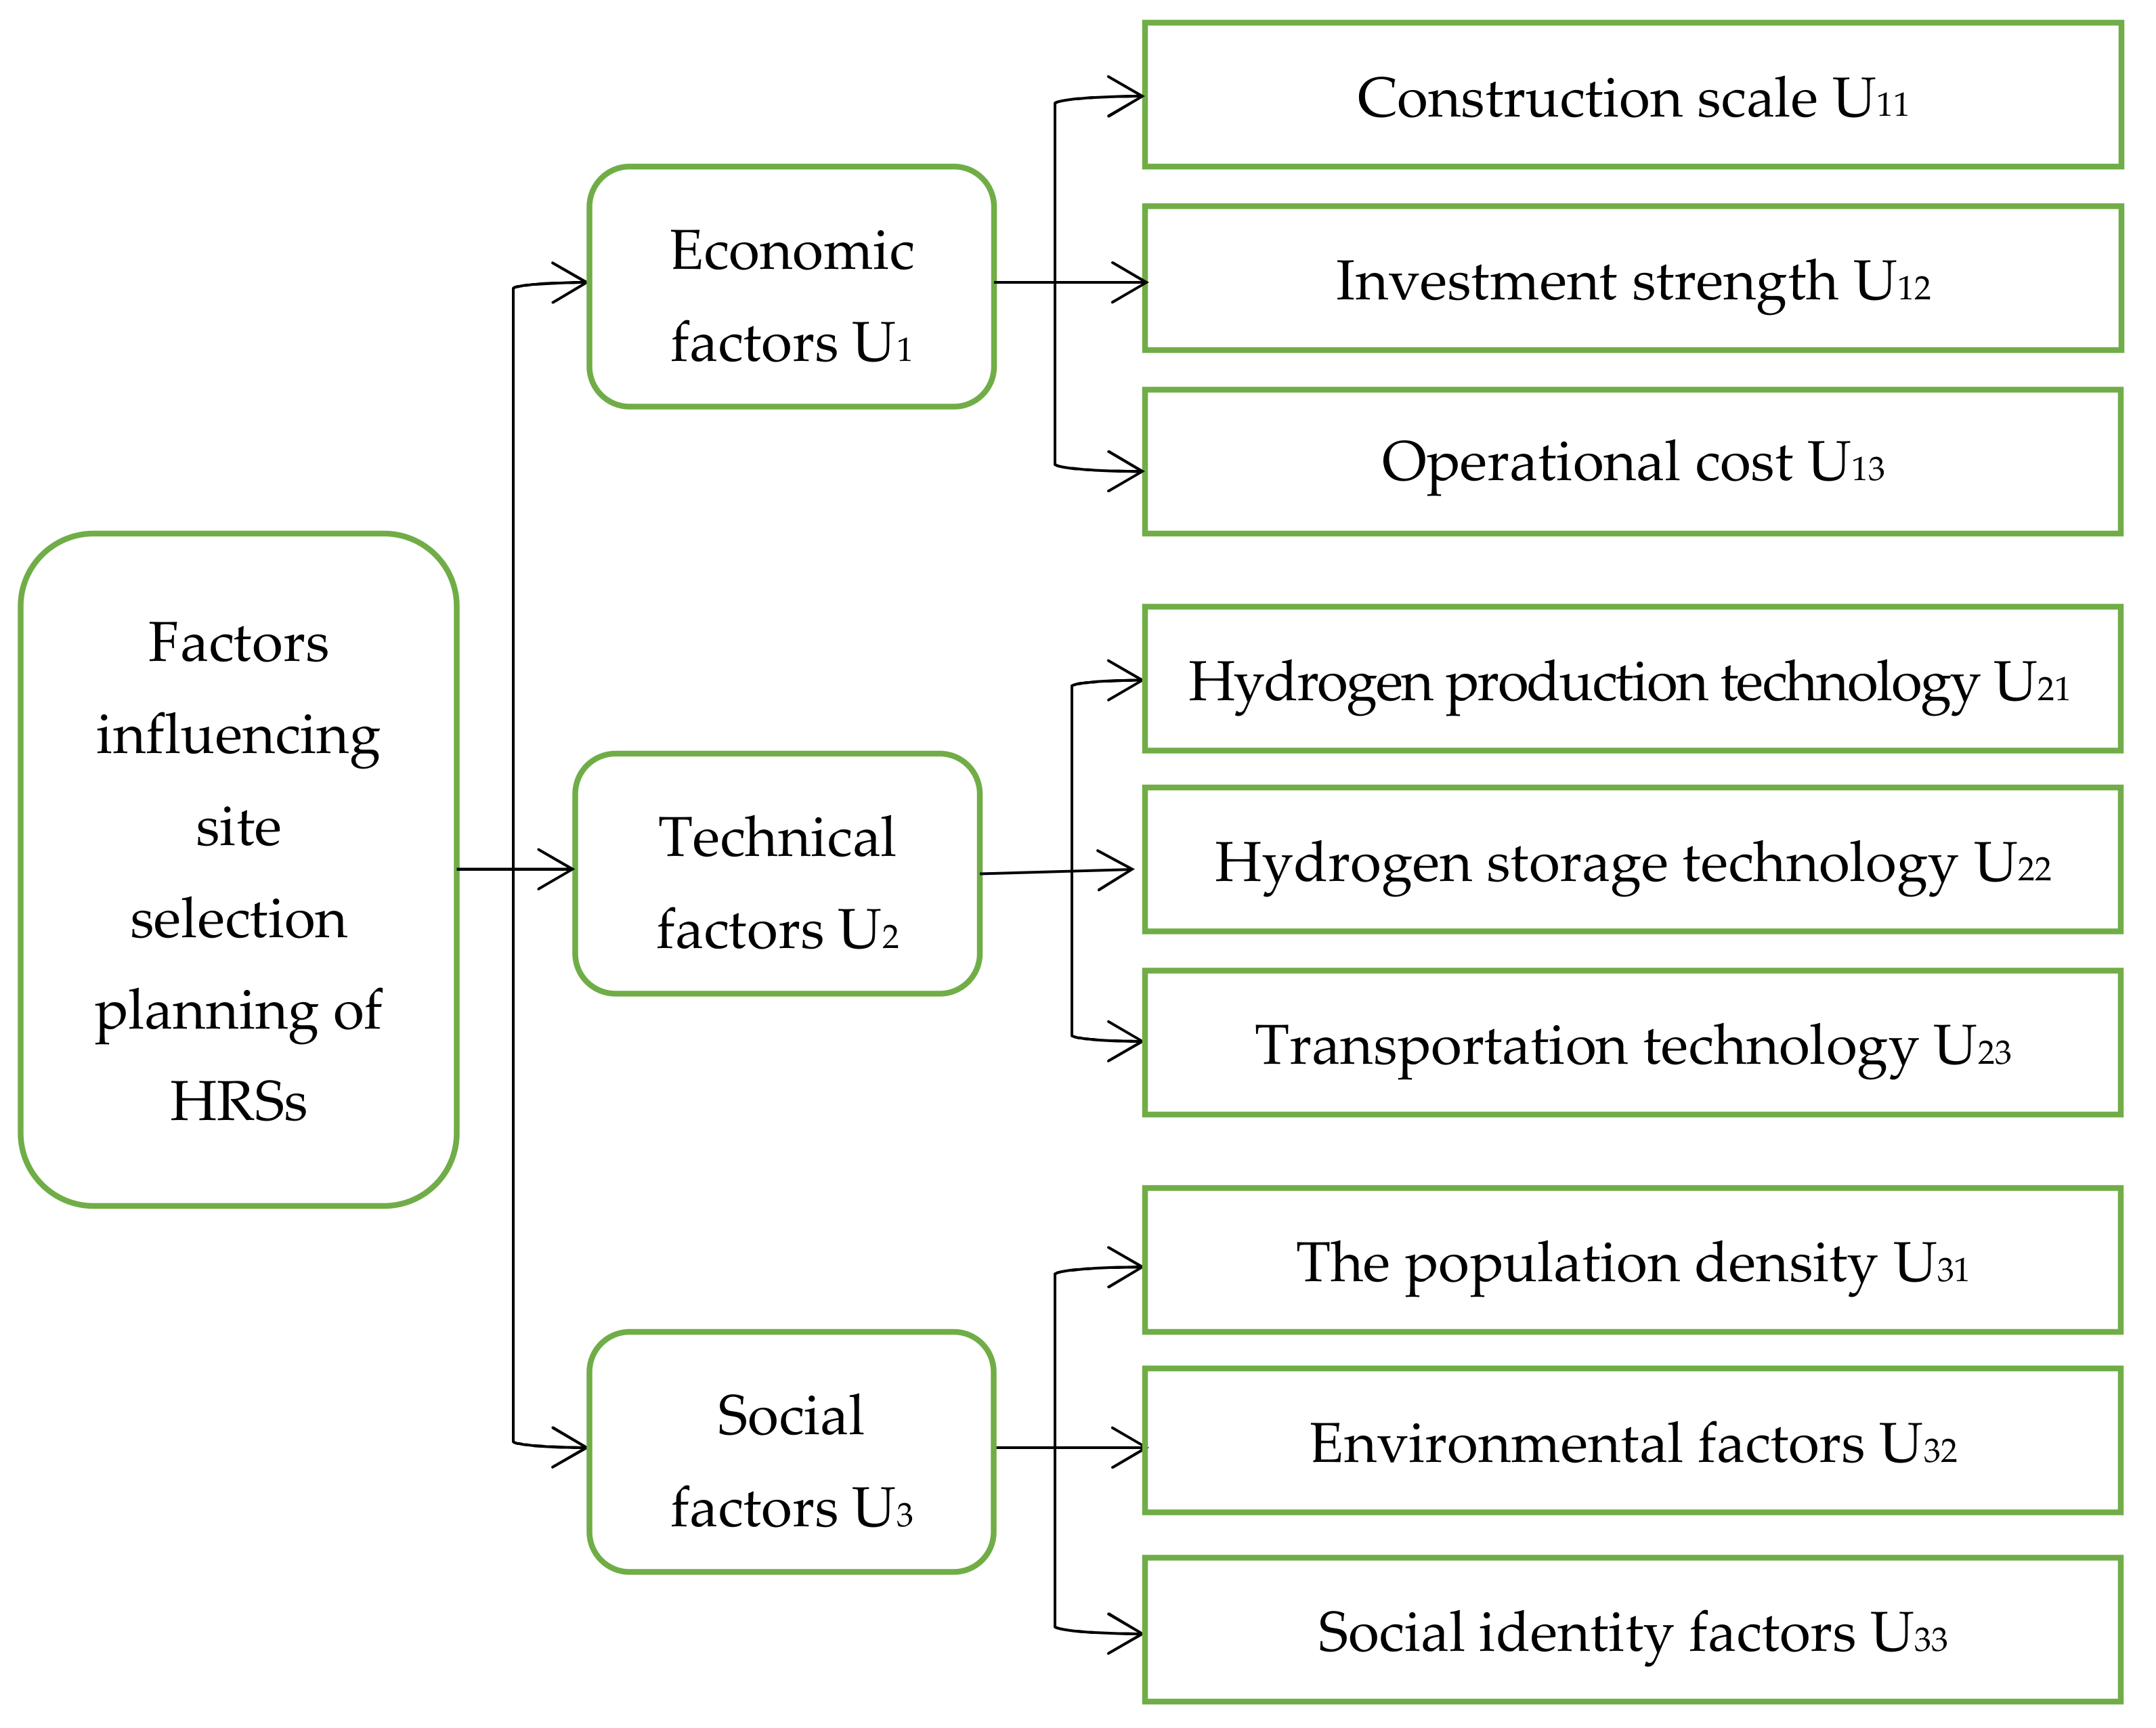
1. According to the existing literature and expert consultation, determine the evaluation factors of China’s HRS site selection planning, and establish a FCE index system. Use AHP to determine the weight of each evaluation index. Establish an expert decision-making committee to conduct a comprehensive evaluation of the operational HRSs in China, and obtain FCE results.
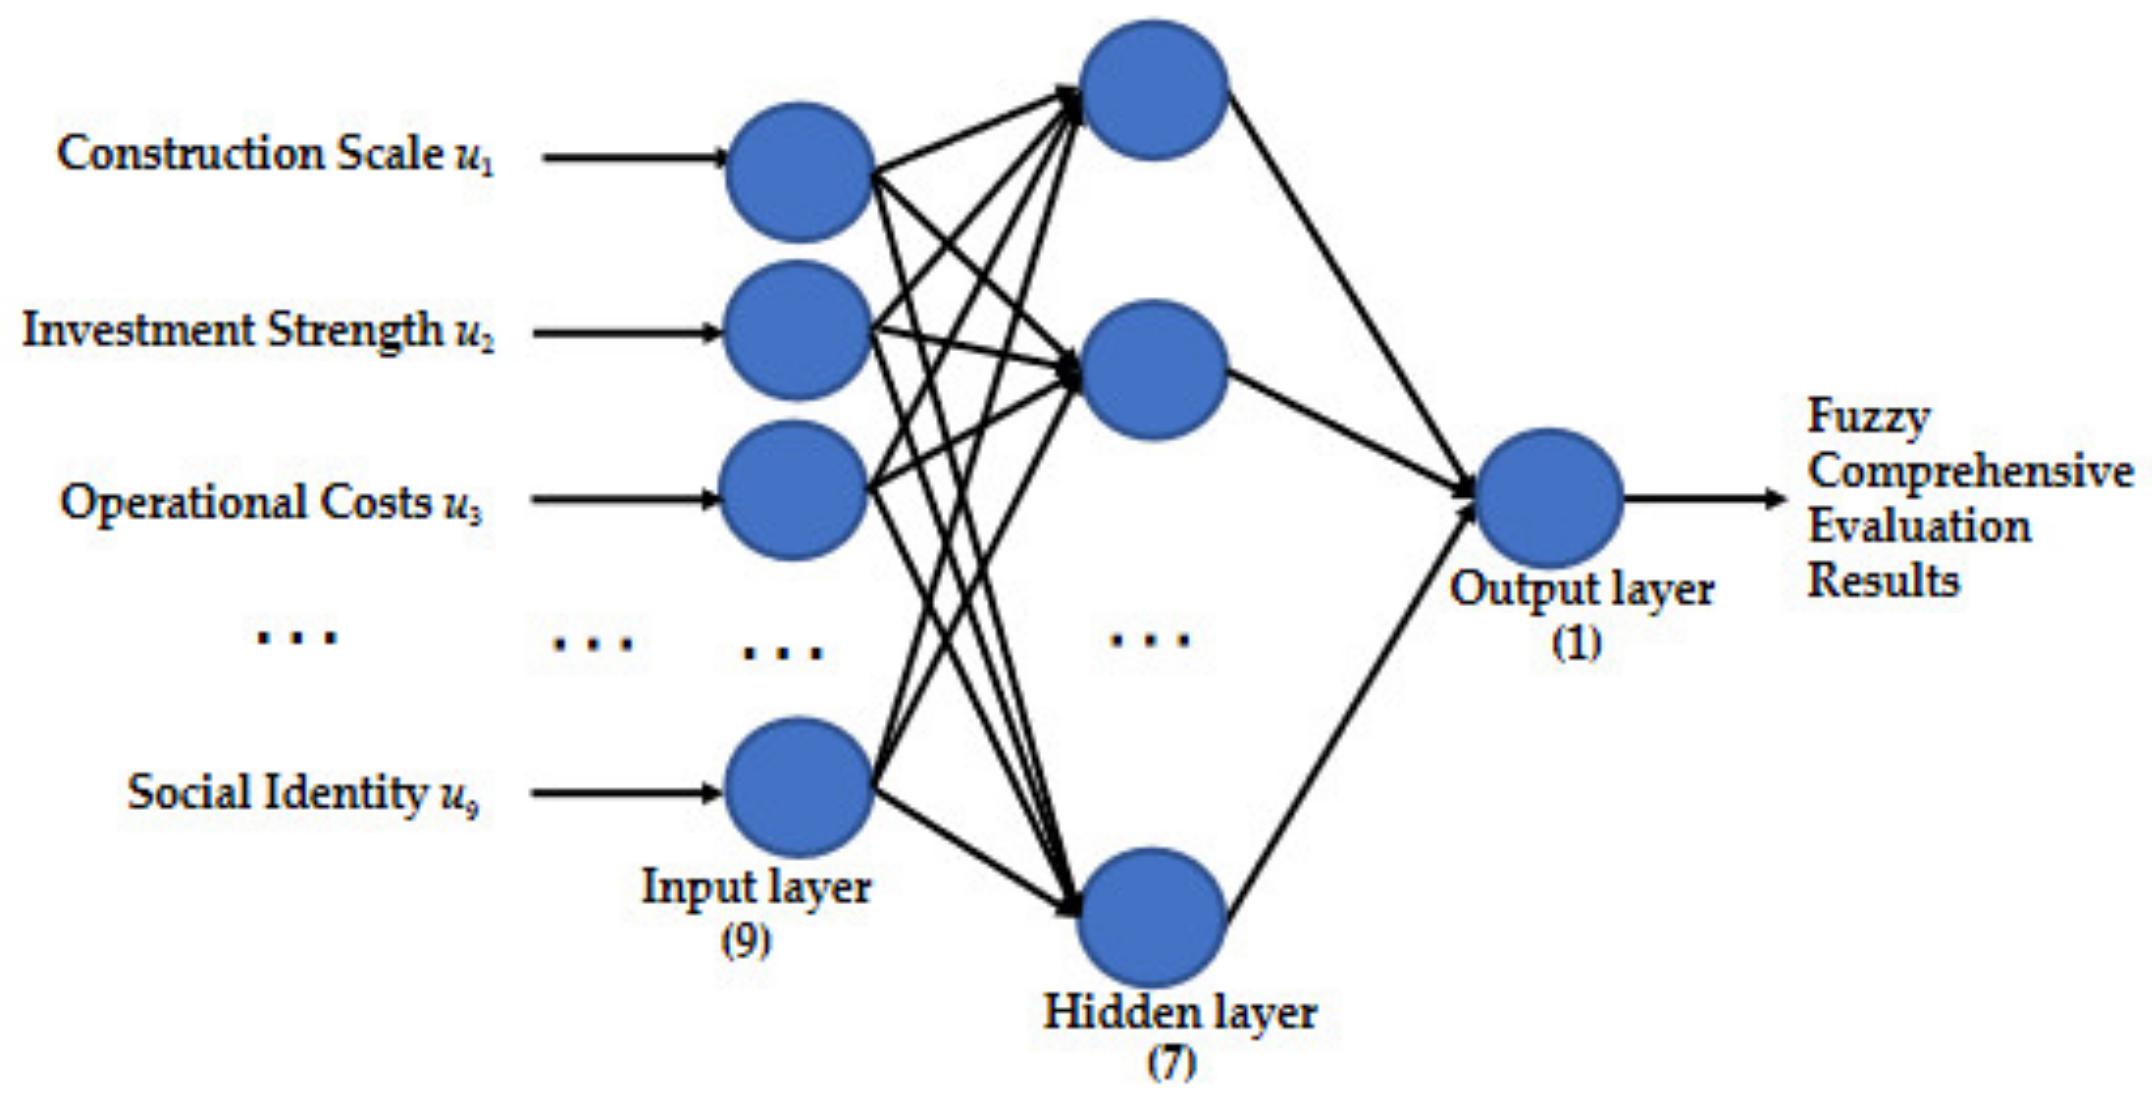
2. An intelligent site selection model based on FCE-ANN model is proposed. The ANN has good adaptive ability and can give an objective evaluation to the multi-index comprehensive evaluation problem, which is very beneficial for weakening the human factors in the weights.
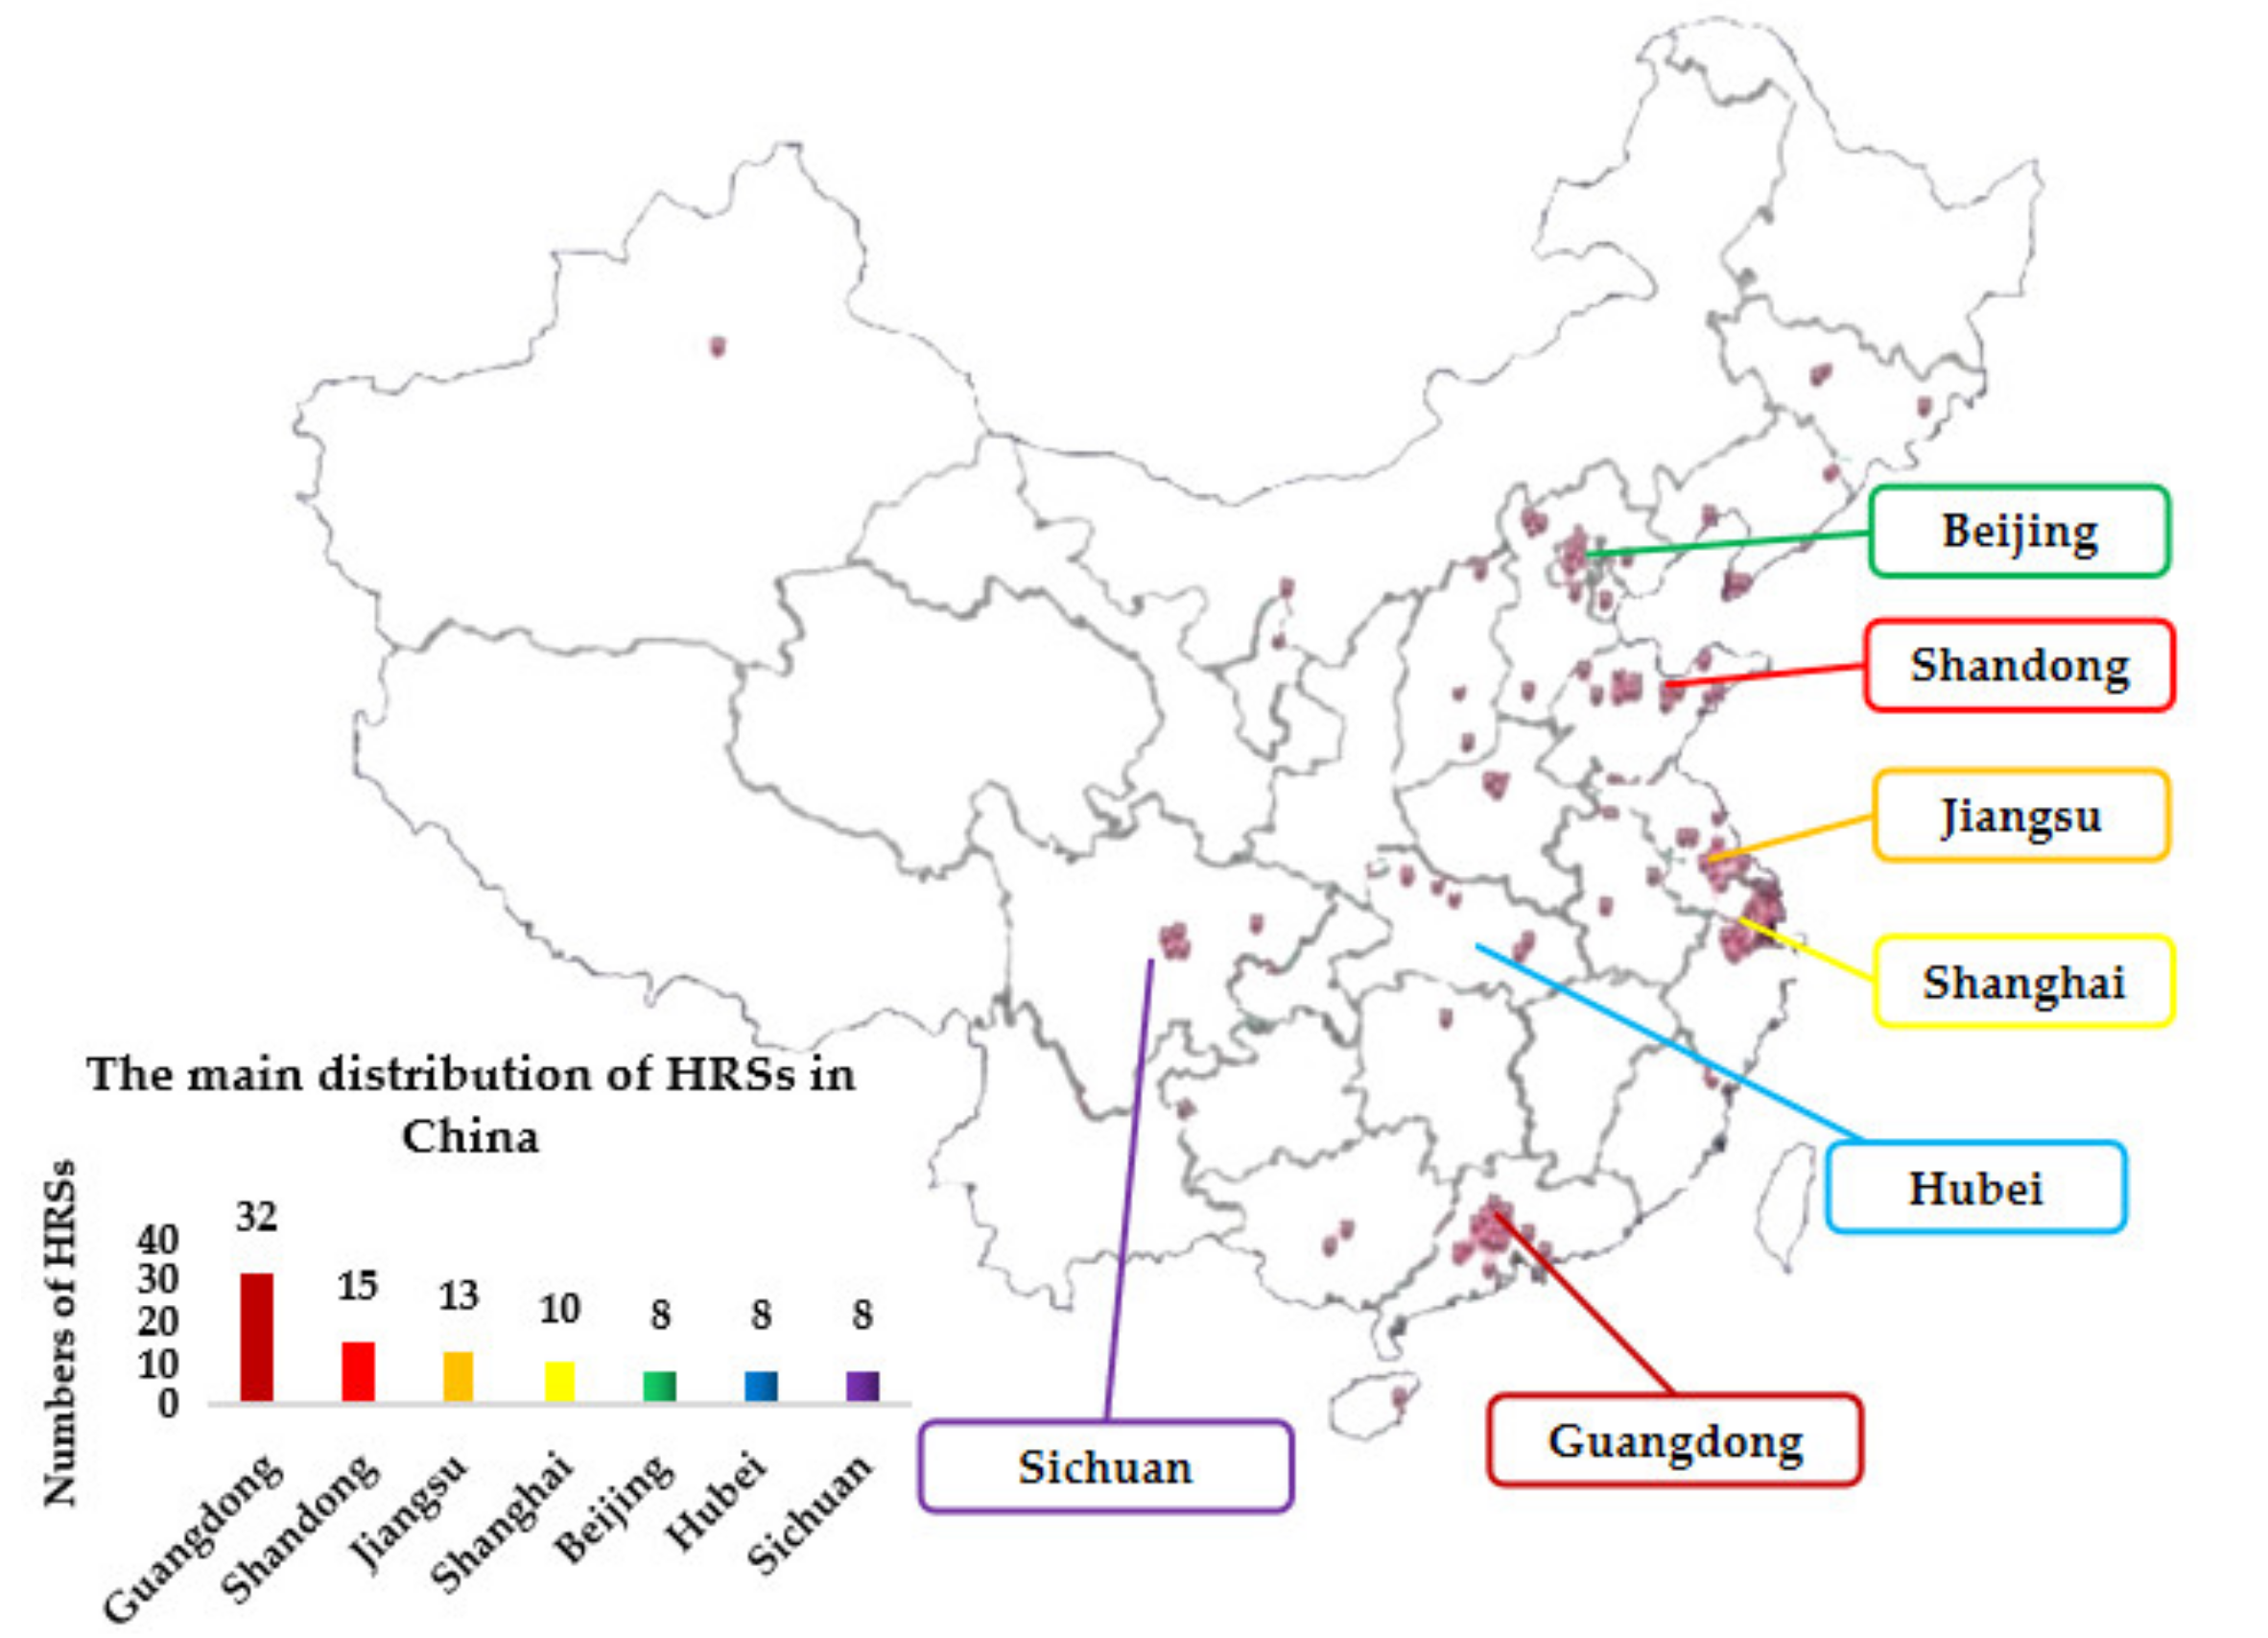
3. Selected the evaluation result data of 50 operational HRSs in coastal and major cities in China as the training data of the neural network. 8 HRSs under planning in Shanghai were selected for site selection and model validation.
4. The results of this study are intended to provide some guidance and suggestions for policy makers of HRS planning; at the same time, the method of this study is intended to provide some reference and thinking for relevant researchers in conducting complex site selection decision-making research.
The rest of the paper is organized as follows: Section 2 introduces the basis for the selection of elements and indices in the evaluation system of HRSs, and establishes a comprehensive evaluation index system for HRSs. 
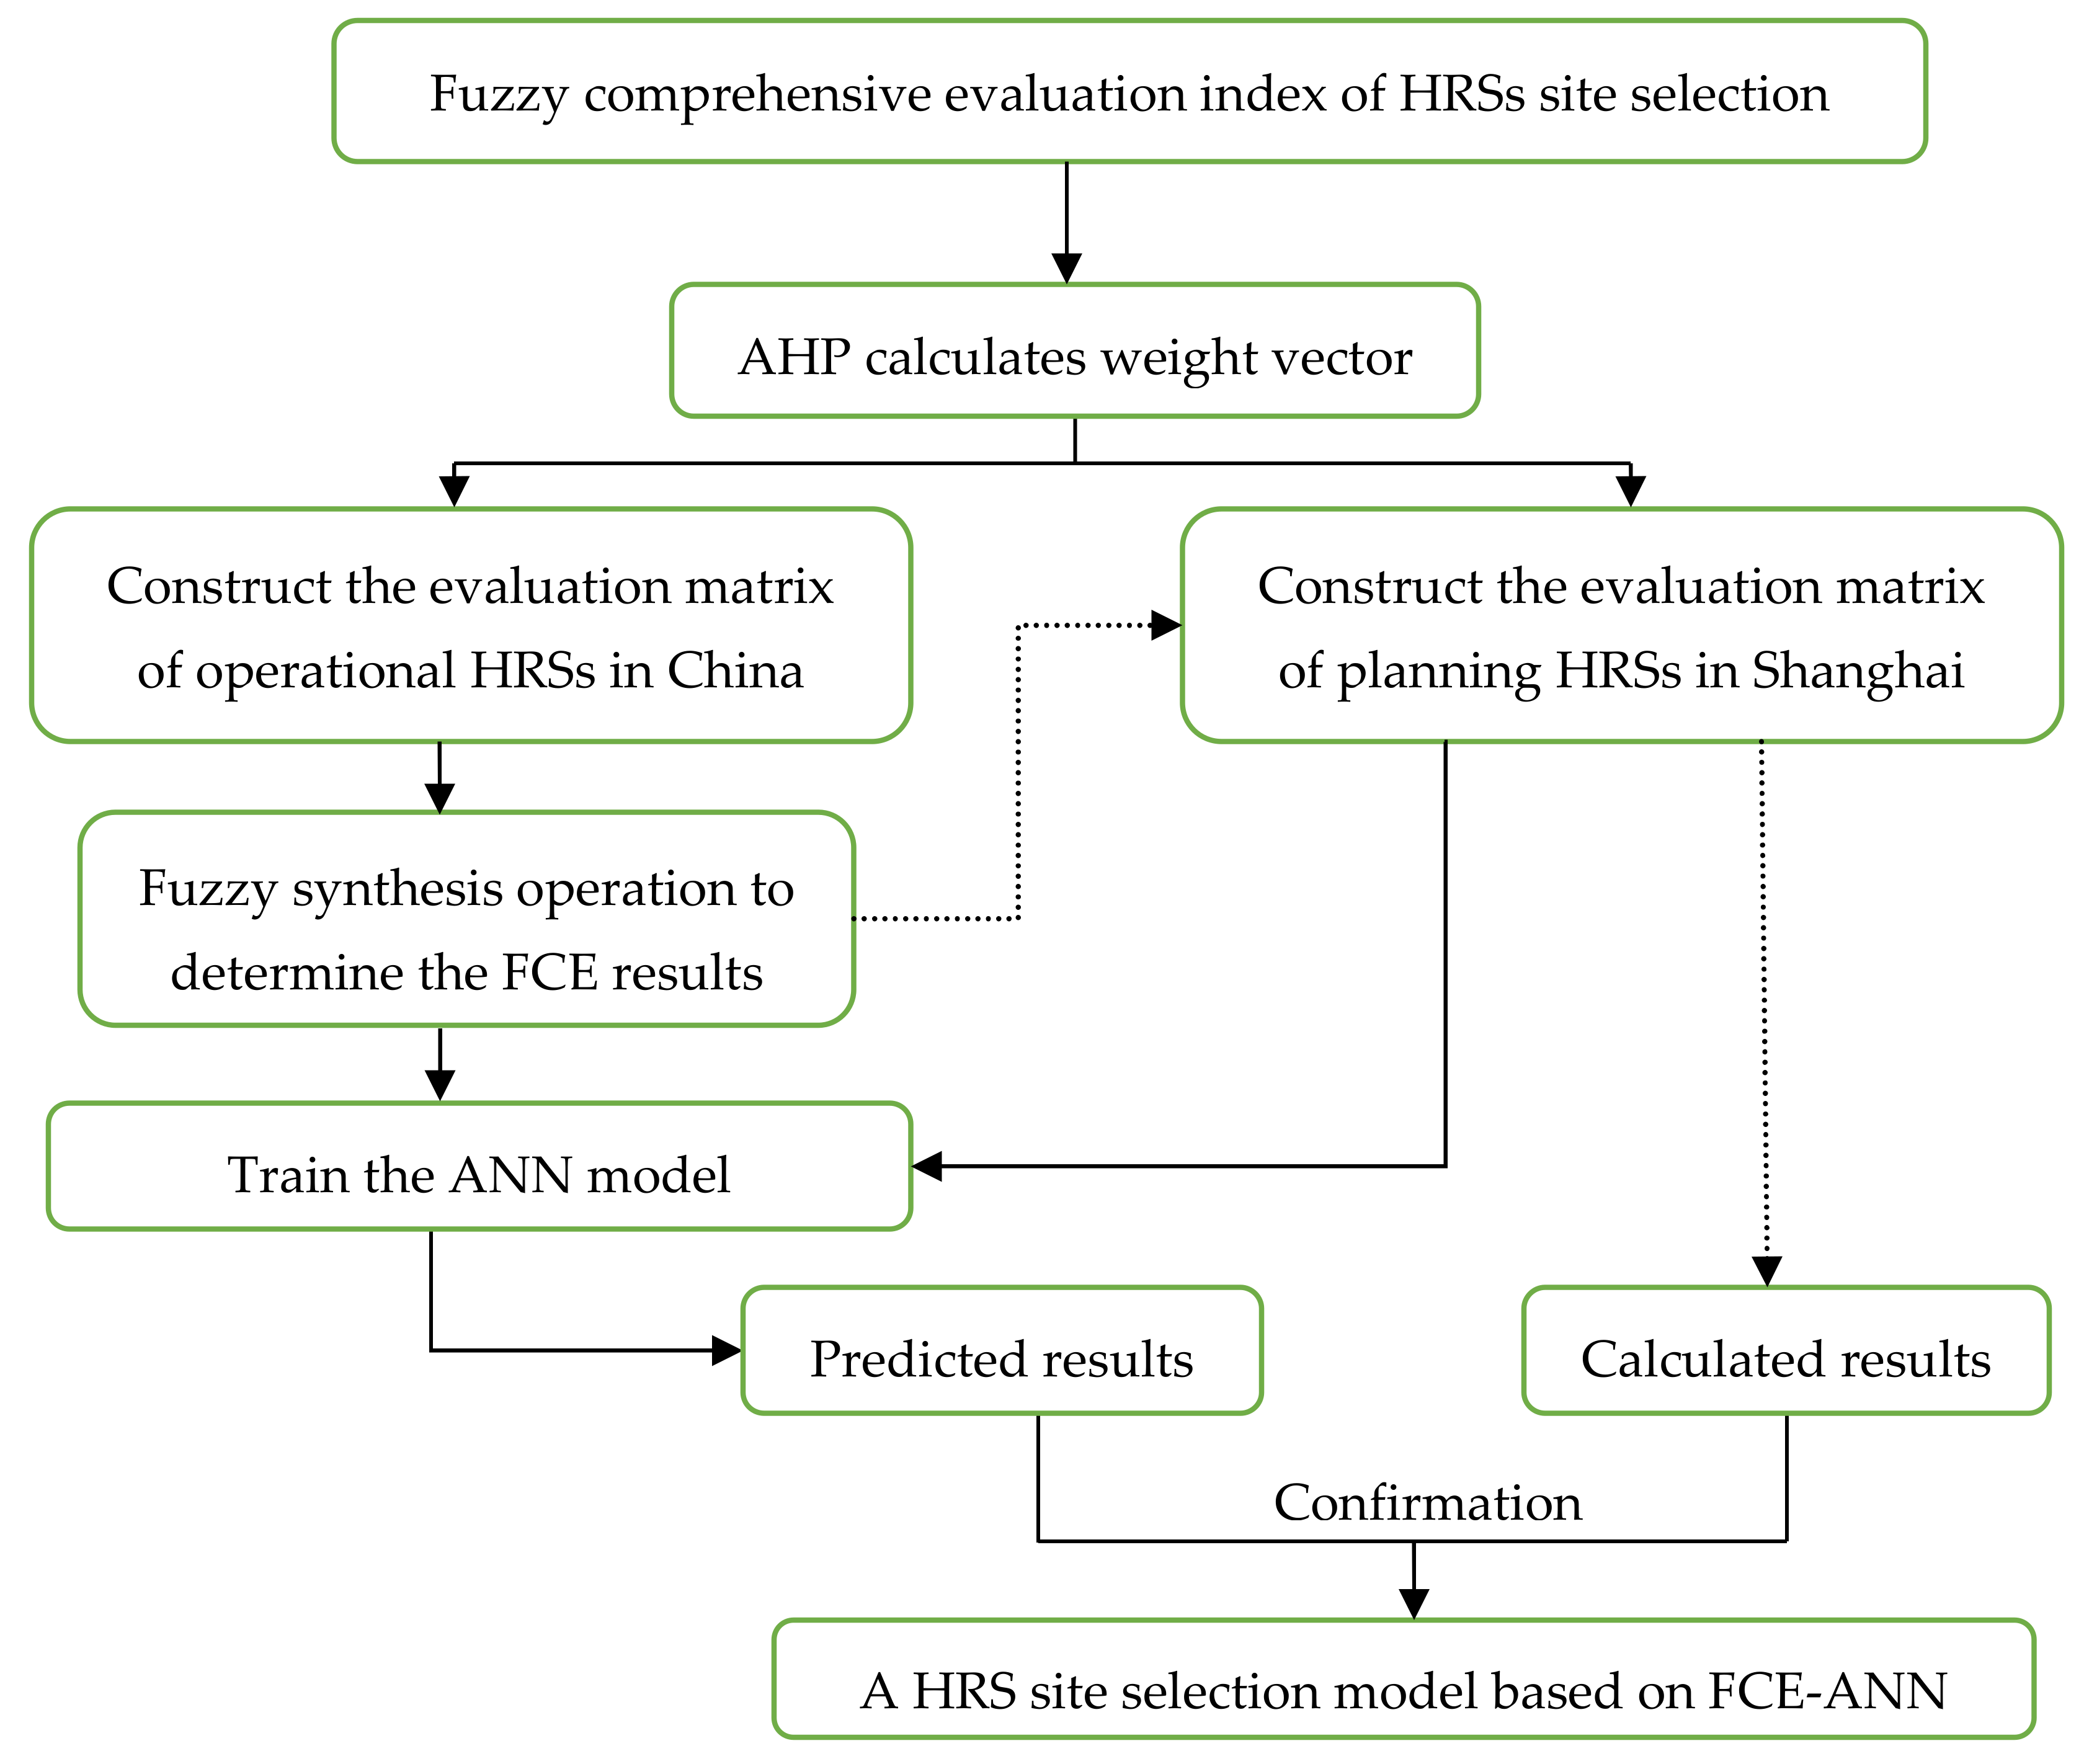
Section 3 describes the three-stage key steps and core algorithms of the FCE-ANN model for HRSs in detail, and gives the research framework of this study. Section 4 takes China’s coastal and major cities as the research area to conduct an empirical study to verify the FCE-ANN model. In addition, a discussion and in-depth analysis of the results; Section 5 summarizes and prospects this study.

2. Evaluation Index System for Site Selection of HRSs

HRSs construction and planning are affected by many factors. Although few people directly study the influencing factors of HRSs location planning, potential influencing factors can be found from other aspects. On the basis of the existing literature and research, and our expert consulting and workshop discussion, we further subdivided influence factors of HRSs planning. The influencing factors selected in the study are divided into three categories: economic, technical, and social factors. Under each factor, there are three specific sub-factors, as shown in Table 1.

2.1. Factors Affecting HRSs Planning

2.1.1. Economic Factors U1

(1)
Construction scale U11
HRSs planning and construction are generally approved and managed by national governmental departments; the construction party needs to submit a series of qualification documents before construction and operation qualification can be obtained [5]. Fixed HRSs also need to apply for planning and construction permits, but skid-mounted stations do not need this procedure [59]. Therefore, the construction scale is also a factor affecting HRSs planning. The larger the construction scale is, the more complicated the approval procedure is, and the corresponding cost would far exceed the infrastructure construction cost [50].
(2)
Investment strength U12
The main difficulty affecting HRS development is the high construction cost. Although local governments pay increasing attention to the construction of HRSs, and planning and supporting policies are issued one after another, the high construction cost requires investors to have certain financial strength. All HRSs in China are in the form of external high-pressure hydrogen storage. The initial cost of constructing an HRS larger than 200 kg in China exceeds CNY 10 million [5]. In addition, if debugging, engineering-design, and management costs, and other factors are taken into account, the superposition of these factors directly leads to almost all completed HRSs in China hardly being profitable [13].
(3)
Operational costs U13
The cost of operation and maintenance is an important part of the life-cycle cost of a HRS [51]. On the one hand, the construction and development of HRSs in China is still in the initial stage. Compared with the mature operation and maintenance technologies of HRSs in the United States and Japan, China lacks maintenance experience, resulting in relatively high maintenance costs of HRSs [59]. Besides the initial equipment investment of HRSs construction, the amount of the continuous daily fault-free hydrogenation of hydrogenation power consumption, and the cost of employing personnel should also be considered as influencing factors of operating HRSs costs [49]. In other words, operation and maintenance costs are an important factor to be considered in the planning and construction of HRSs.

2.1.2. Technological Factors U2

(1)
Hydrogen production technology U21
Hydrogen production from natural gas, coal gasification, industrial byproducts, oil refineries, and water electrolysis are the main sources of industrial hydrogen [13,16,50]. However, because of technical barriers, China still relies on imports for key components in most hydrogen production facilities [15]. Expensive equipment makes it difficult to reduce the cost, and the incomplete domestic hydrogen production technology is the main factor affecting the construction of HRSs.
(2)
Hydrogen storage technology U22
Mature hydrogen storage technology and unbreakable key links are key factors affecting the construction of HRSs in China [13,16]. Hydrogen can be stored in three ways: high-pressure gaseous hydrogen storage, low-temperature liquid hydrogen storage, and metal alloy hydrogen storage [51]. High-pressure gaseous hydrogen storage and low-temperature liquid hydrogen storage are widely used at present. Low-temperature liquid hydrogen storage has a high density, but it is difficult to liquefy hydrogen, which leads to high cost and the requirement for container heat insulation [51,60]. The advantages and disadvantages of different hydrogen storage technologies are compared in Table 2, which reflects the immature hydrogen storage technology in China [60].
(3)
Transportation technology U23
There are three common hydrogen transport modes: tube trailers, pipeline, and liquid trucks [5]. China mainly uses long-tube trailer transport, and its long tube trailer transport equipment industry is mature. According to transport industry standard JT/T 617.1-2018 Dangerous Goods Road Transport Rules of the People’s Republic of China, long-tube trailers are used for transport, and transport and storage pressure is 20 MPa. Due to cost limitations, this method is suitable for short-distance hydrogen transportation—the economic transportation radius is about 200 km. Low-pressure pipeline transportation is suitable for large-scale point-to-point transportation [54]. Due to the existence of hydrogen embrittlement between hydrogen and some metals, pipe materials have special requirements, so the investment cost is high [53]. In China, large-scale low-pressure pipeline transportation does not exist. The cost of a hydrogen pipeline is more than twice that of a natural-gas pipeline, and hydrogen density is much less than that of natural gas, resulting in a higher transportation cost of hydrogen than that of natural gas. Liquid hydrogen tank transport is widely used in other countries, but it is only used in the aerospace and military fields in China, and is not yet commercialized [5]. To sum up, the current mainstream hydrogen transportation technology needs to be improved, and hydrogen transportation technology is the main factor affecting the construction of HRSs in China [59]. Table 3 summarizes and analyzes current mainstream modes of transportation.

2.1.3. Social Factors U3

(1)
The population density U31
HRSs built in urban areas are located in densely populated areas, and are far more dangerous than conventional gas stations are because of the energy produced by hydrogen explosions. Hydrogen as an energy source is widely used in transportation, and safety is greatly important, which is one of the reasons why the hydrogen industry is developing relatively slowly [25,55] In June 2019, the explosion of a hydrogenation station in Sanvika, Norway, also impacted China’s hydrogen and fuel-cell vehicle industry, with negative market sentiment [55].
(2)
Environmental factors U32
Hydrogen is lighter than natural gas, has a wider explosive limit, spreads faster, and is likely to cause more dangerous accidents [45]. High-pressure hydrogen embrittlement is common, and high pressure demands more stringent safety spaces in the surrounding environment [51]. Hydrogenation station construction must consider whether there are dangerous sources or crowded places around, such as schools and hospitals [5,52]. Therefore, in the process of the expert evaluation of built hydrogenation stations in China, the surrounding environment of all hydrogenation stations is first objectively evaluated by experts.
(3)
Social identity factors U33
New-energy vehicles are the future development trend of automobiles and are strongly supported by the state [57]. The performance of the car is similar to that of traditional fuel cars, but battery life and the cost of late replacement make most people balk. Due to a lack of an adequate understanding of hydrogen energy, it has been regarded as a dangerous source by the public for a long time, so the public’s recognition of hydrogen fuel vehicles and hydrogenation stations affects its development [46,59].
To summarize, a dual hierarchical evaluation index system for the site selection of HRSs was constructed, as shown in Figure 2.

3. Model

On the basis of the above evaluation index system of HRSs site selection, the process of the intelligent location model of HRSs based on FCE-ANN will be introduced in detail. The proposed FCE-ANN intelligent site selection decision-making process was divided into three stages. The first is described in detail using the AHP method, namely, a questionnaire survey to invite expert consultation to determine the HRSs site selection evaluation index system of the weight of each index value of the calculation process. Second, Experts and scholars in the hydrogen energy industry are invited to form an expert evaluation group to conduct a FCE of HRSs. Lastly, expert evaluation levels and evaluation results were taken as the data of the training ANN, the ANN model was used for comparative decisions, and the feasibility of the intelligent site selection decision method was obtained. The details for each phase are described in the following sections. This study thus includes three modules: AHP method, FCE method, and ANN model. The research framework is shown in Figure 3.

3.1. Analytic Hierarchy Process (AHP)

The evaluation process of HRS site selection is a multi-index decision-making process, and different indices have different influences, so they should be accordingly weighed [13]. Methods to determine the weight value are usually AHP, the entropy weight method (EWM) and the Criteria Importance Though Intercrieria Correlation (CRITIC)method [37,42,57]. Researching the literature showed that AHP is usually used for criteria weighting [61]. It is rated, and the weight is calculated by using the relative size information of the value between two pairs of comparison. The entropy method calculates the weight of the amount of information of the data entropy value. The CRITIC method mainly uses data fluctuations or the correlation between data to calculate a weight [13,42,44,62].
Because the site selection of HRSs involves many indices, these indices lack accurate data descriptions. Through hierarchical analysis, the importance of the two indices in a multilevel system can be compared. Therefore, an expert questionnaire was designed in this study; 20 respondents from the hydrogen energy industry, scientific research institutions, and doctoral students in universities were selected to fill in the questionnaire and conduct detailed consultations to conduct a graded evaluation of our evaluation indicators, using AHP method to determine the most practical and reliable coefficients of each index.
The specific steps of AHP are as follows:
(1)
Project weight calculation
An evaluation index for classification was set up for the calculation of the average values of experts for indices at all levels; it was used as the initial weight, and Table 4 Saaty 1–9 scale method was referenced to quantify [42]; the judgment matrix was constructed.
The product root method is used to calculate the geometric mean value of each row of judgment matrix w i ¯ :
w i ¯ = ( j = 1 n a i j ) 1 n
Among them, a i j is the relative importance of the index i and the index j compared in pairs, and n is the number of indices. Feature vectors w i , namely, the weight coefficients of each index, are obtained by normalizing the geometric mean values of each line [42,61].
(2)
Consistency test of the judgment matrix
Calculate the maximal eigenvalue of the judgment matrix:
λ max = 1 n i = 1 n ( j = 1 n a i j w j ) w i
Calculating consistency indicators (CI). The specific formula is:
C I = λ max 1 n 1
Calculating consistency ratio ( C R , where R I is the average random consistency index [47]:
C R = C I R I
When C R < 0.10 , the consistency of the judgment matrix is considered to be acceptable; otherwise, the judgment matrix should be appropriately modified [63,64]. The consistency of the judgment matrix in this paper was tested in MATLAB R2018a, and the consistency of the judgment matrix was less than 0.1, which was acceptable.
On the basis of expert judgments and statistical data, the constructed judgment matrices are shown in Table 5, Table 6, Table 7 and Table 8.
(3)
Calculate the combined weight of each index
The combined weight of each index is calculated according to the weights of the criterion layer and the sub-criteria layer [63]. Taking the combined weight as an example, A 11 = w 1 w 11 , and other combined weights are analogous, so the combined weight A of the evaluation index system is:
A = ( 0.2255 , 0.0883 , 0.1152 , 0.1280 , 0.1491 , 0.0977 , 0.0393 , 0.0589 , 0.0982 )
The combined weight not only takes into account the weight distribution of the secondary indicators in the indicators of this level, but also takes into account its overall evaluation. The weight distribution in the index system, the larger the combined weight, the more important the secondary index is in the whole evaluation index system [61].

3.2. Principle of Fuzzy Comprehensive Evaluation(FCE) Method

Fuzzy comprehensive evaluation (FCE) can reasonably combine these attributes and factors with items affected by multiple attributes or their overall strengths or weaknesses [43,48]. Therefore, the FCE method based on a fuzzy set evaluates subordinate-level status evaluation from multiple indicators [41]. The evaluation interval is, on the one hand, divided into changes, so that the evaluation criteria and the fuzziness of the influencing factors can reflect the level of the considered objects; on the other hand, the experience of people can be given full play in the evaluation, so that evaluation results are more objective and in line with the actual situation [46,63], FCE can achieve the combination of qualitative and quantitative aspects, expand the amount of information, thereby improving the amount of credible evaluation conclusions [43].
The steps of establishing the FCE model of HRSs site selection are as follows:
(1)
A set of indices affecting the site selection of HRSs was established:
U = { u 1 , u 2 , u n }
There are 9 indices in U : In order to facilitate the following calculations, redefine u 1 construction scale; u 2 investment strength, u 3 operational costs, u 4 hydrogen production technology, u 5 hydrogen storage technology, u 6 transportation technology, u 7 the population density, u 8 environmental factors, and u 9 social identity.
(2)
The evaluation set of influencing factors of hydrogenation station siting was established:
V = { v 1 , v 2 , , v m }
Correctly determining the membership function is the basis of applying fuzzy theory to properly and quantitatively describe a fuzzy concept, and the key to solving various practical problems by using the fuzzy method. The corresponding membership function is selected according to different evaluation factors. Determine the weight of each evaluation factor:
A = { a 1 , a 2 , , a i }
a i is the weight of the first factor, i = 1 n a i = 1 .
(3)
Evaluate each factor ui to determine the degree to which it belongs to comment, and the evaluation result is written as r i :
r i = { r i 1 , r i 2 , , r i m }
In this paper, 10 relatively authoritative experts were selected to evaluate all indices, and the expert evaluation level was converted into the specific quantitative value of each index of each HRS according to the assigned value. Due to the large number of experts, the average value was taken as the final evaluation result of a factor. Thus, fuzzy relation R from U to V could be determined by all single factor evaluation results [44,48].
R is the fuzzy comprehensive evaluation matrix.
R = r 11 r 12 r 1 m r 21 r 22 r 2 m r n 1 r n 2 r n m
(4)
Calculate the value of B :
B = A R
This can be used as fuzzy comprehensive evaluation vector after the normalization of B obtained by the operation, where A is the index weight. The FCE result of HRSs is then obtained [44,48].
(5)
Composition operator selection:
A basic step of the FCE of HRSs site selection is to determine the evaluation grade.
V = { v 1 , v 2 , , v m } = { v e r y   g o o d , g o o d , g e n e r a l , p o o r , v e r y   p o o r } .
The FCE can synthesize and average the functions of various influencing factors according to the weight, which has obvious advantages in the comprehensive evaluation treatment of various influencing factors. In the calculation process, two types of fuzzy operators are often used, namely, principal factor prominence and weighted average [45]. The salient feature of the main factor operator is to reduce the interference of other data, while the salient feature of the weighted average operator is to avoid information loss. This can take into account the functions of various influencing factors as a whole. In view of the large number of factor sets in this study, in order to avoid information loss and make the collected data information play its role to the maximum, the weighted average fuzzy operator synthesis model is adopted [48,63].

3.3. Artificial Neural Networks (ANN) Theory

An artificial neural network (ANN) is an empirical model that mimics the function of a human neural network. There is often a highly nonlinear mapping relationship between its input and output, and it is generally difficult to write its expression, so it is called "black box" [28].The characteristic of ANN is that it can store information or knowledge distribution in a large number of neurons or the whole system. It has the potential of self-learning and self-organization [65]. In addition, it has strong fault tolerance and can deal with noisy or incomplete data [27,66]. Therefore, ANN provides a powerful tool in solving complex nonlinear multi-index comprehensive evaluation problems. The BP (Back propagation) neural network model is a multi-layer feedforward neural network trained according to the error back propagation algorithm, which is the most widely used neural network. So in this study, the back propagation algorithm (BP algorithm) is used, and the BP neural network model has the advantages of fast calculation speed and efficient solution. It can better simulate the process of comprehensive evaluation by evaluation experts [28,37]. In order to simulate the process of comprehensive evaluation by experts, considering the input, hidden and output layers, a BP neural network is designed. The comprehensive evaluation results of the 9 evaluation indices of 50 HRSs in coastal and major cities in China were taken as the input of the ANN, and the FCE results was obtained by fuzzy logic calculation are used as the output to train the neural network. The architecture is shown in Figure 4.
ANN is an intelligence-based processing structure consisting of interconnected processing units called neurons. It includes input nodes, output nodes and one or more layers of hidden node. The input layer to the output layer needs to be processed by the hidden layer. The neurons of each hidden layer basically perform two tasks: (1) the weighted sum of all process inputs, and (2) the weighted sum of the nonlinear transformation of the neuron transfer function produces the output of each neuron. Common transfer functions include hyperbolic tangent S-type (Tansig), S-type (Logsig), positive linear (Poslin), and purelin linear (Purelin) transfer functions, as shown in Formulas (11)–(14) [28,67]. The output layer is used for use error estimates to predict outcomes. Initially in the backpropagation algorithm, the input is propagated to the hidden layer, which propagates the sensitivity back to reduce errors. At the end of the process, it updates the weights and biases. The performance index of the neural network is generally expressed by mean square error (MSE), mean relative error (MRE) and mean absolute error (MAE), which are used to judge the errors between network output values and target values, as shown in Formulas (15)–(17) [35,36].
tan s i g ( n ) = e n e n e n + e n
log s i g ( n ) = 1 1 + e n
p o s l i n ( n ) = n , n > 0 0 , n 0
p u r e l i n ( n ) = n
M S E = 1 n t = 1 n ( y y ) 2
M A E = 1 n t = 1 n ( y y )
M R E % = 100 n t = 1 n y y y
where n represents the number of training sets, y represents the output result of the target, and y′ represents the output result of the neural network.
The basic idea of establishing an intelligent location decision model of HRSs was as follows.
Determine the evaluation index set, and the number of indices determines the input node of the neural network. If the number of specific evaluation indices is 9, the number of input nodes of neural network is 9.
Each index in the index set is the input factor of the neural network. According to the characteristics of each index, the input factor is graded, the input value of the neural network is determined by the expert evaluation method, and the expected output value of the artificial neural network is obtained by the FCE method. After grading each factor, each score value is normalized into the score value in the (0,1) domain to meet the requirements of the BP neural network range [28,66].

4. Prediction of HRSs Site Selection Based on FCE-ANN

In this study, 50 HRSs already in operation in coastal and major cities of China and 8 HRSs that are being planned in Shanghai were selected as analytical examples. According to the established evaluation index system for site selection of HRSs, the FCE-ANN model is verified by an example through the steps of model establishment, data analysis and calculation, and result comparison and analysis.

4.1. Overview of HRSs in Operation in China

At present, coastal and major cities are the main developed areas for HRSs construction in China. The specific distribution is shown in Figure 5 [10], highlighted by the red dots. It can be seen that Guangdong is the province with the largest number of HRSs currently in operation. In order to better reflect the construction of HRSs in China, this paper selects 50 HRS from the provinces marked in the figure as research objects.
The collected information showed that the hydrogen storage, transportation, and hydrogenation of operational HRSs in China are mostly the same, and they were all constructed and are maintained at a relatively low cost. However, there are relatively few HRSs built with high costs and relatively advanced technologies such as hydrogen production and pipeline transportation. Among the 50 selected HRSs, only Shanghai YiLanShunGong has adopted hydrogen production and pipeline transportation in the industrial zone.

4.2. Fuzzy Comprehensive Evaluation of Site Selection of HRSs

In this study, 10 experts were invited to form an expert evaluation group, of which 3 were from the hydrogen energy industry with technical backgrounds such as hydrogen production and hydrogen storage for more than 5 years; 5 were from Chinese universities and other research institutions (including 2 doctoral students), specializing in HRSs research, and very concerned about the construction and planning of HRSs in China; the other two are government officials, familiar with the planning policies, population density and economic level of HRSs in various regions. With our organization, the expert evaluation group received as much research information as possible from 50 HRSs in China one week in advance. The formal evaluation is in a conference room. First, 10 experts interpret and discuss the information of 50 HRSs according to their respective areas of expertise. Secondly, experts conduct single-index evaluation of the 9 evaluation indices of each HRS. Finally, collect the evaluation grades of various evaluation indices of all HRSs by experts, and assign the quantitative results to each index of each HRS according to the membership function, and finally take the average value as the final evaluation result of a certain index, and the evaluation levels and corresponding assignments are shown in Table 9.
Among these indices, the evaluation requirements of each index are different. For example, when the cost of hydrogen is relatively low, the hydrogen cost level of the hydrogenation station is relatively high, both in construction cost and operation and maintenance cost. Among technical factors, the more advanced the technology of each index is, the higher the corresponding evaluation level is. For example, when the hydrogen production technology is more advanced, the hydrogen production technology of the HRS has a relatively high level, and the level of hydrogen storage technology is the same as that of transportation technology. Among the social influencing factors, the higher the population density, the more target users for the hydrogenation station, so the level of the population density index of the hydrogenation station is relatively high. However, for environmental factors, the less environmental damage caused, the higher the level. The higher the safety index is, the higher the corresponding evaluation level.
The values of 50 HRSs based on the evaluation levels of various indices of operating HRSs were collected and sorted here. The comprehensive evaluation results and neural network training data of HRSs are shown in Appendix A (Table A1) after the results had been arranged in order.
The above AHP calculation confirms that the combined weight A of each index in the sub-criteria layer to the target layer in the evaluation system is:
A = ( A 1 , A 2 , A 3 ) = ( 0.2255 , 0.0883 , 0.1152 ; 0.128 , 0.1491 , 0.0977 ; 0.0393 , 0.0589 , 0.0982 )
The 50 HRSs were divided into 5 groups with 10 HRSs in each group. The 10 former HRSs were taken as examples.
The comprehensive results of economic factors are:
B 1 = A 1 · R 1 = ( 0.2255 , 0.0883 , 0.1152 ) · 0.98 0.98 0.98 0.93 0.98 0.93 0.91 0.91 0.94 0.93 0.96 0.96 0.98 0.98 0.97 0.98 0.93 0.96 0.80 0.98 0.98 0.98 0.88 0.91 0.97 0.93 0.93 0.96 0.96 0.93 = ( 0.4187 , 0.4187 , 0.4089 , 0.4011 , 0.4184 , 0.4034 , 0.3945 , 0.4006 , 0.3932 , 0.4034 )
The comprehensive results of technical factors are:
B 2 = A 2 · R 2 = ( 0.128 , 0.1491 , 0.0977 ) · 0.93 0.93 0.93 0.93 0.93 0.93 0.91 0.96 0.93 0.91 0.98 0.93 0.98 0.98 0.91 0.93 0.93 0.91 0.92 0.93 1.00 0.93 0.93 0.93 0.88 0.88 0.88 0.88 0.96 0.88 = ( 0.3629 , 0.3486 , 0.3560 , 0.3560 , 0.3407 , 0.343437 , 0.3411 , 0.3445 , 0.3500 , 0.3411 )
The comprehensive results of social factors are:
B 3 = A 3 · R 3 = ( 0.0393 , 0.0589 , 0.0982 ) · 0.71 0.93 0.88 0.98 0.83 0.94 0.76 0.94 0.89 0.96 0.91 0.91 0.91 0.88 0.87 0.88 0.88 0.91 0.86 0.88 0.91 0.91 0.88 0.88 0.90 0.88 0.88 0.88 0.90 0.88 = ( 0.1709 , 0.1795 , 0.1746 , 0.1768 , 0.1722 , 0.1752 , 0.1681 , 0.1770 , 0.1740 , 0.1760 )
So, the overall results of the top 10 are:
B = A · R = A 1 , A 2 , A 3 · R 1 R 2 R 3 = ( 0.9524 , 0.9467 , 0.9395 , 0.9339 , 0.9313 , 0.9223 , 0.9037 , 0.9221 , 0.9172 , 0.9205 )
Similarly, the fuzzy comprehensive evaluation results of the other 40 HRSs are calculated in the same way. Please refer to Appendix A (Table A1) for the specific results.
Comprehensive evaluation results of the above 50 HRSs were carried out in accordance with the comprehensive evaluation results reorder in Appendix A (Table A1). The last column sorting result shows that YiLanShunGong had the highest evaluation levels in the 50 HRSs, and the site of the construction scale, operational cost, hydrogen source, and the impact on the society were the most reasonable.

4.3. ANN Training and Prediction

4.3.1. ANN Construction and Training

In this study, a BP neural network was modeled and simulated in the MATLAB software. The BP (Back propagation) neural network model is a multi-layer feedforward neural network trained according to the error back propagation algorithm, which is the most widely used neural network. The backpropagation algorithm is slow to converge and sometimes leads to overfitting. To address these issues, Levenberg–Marquardt (LM) backpropagation was developed to achieve fast convergence without overfitting [35]. By reduction in error response of the network became more smother and it also reduces the problem of overfitting. LM back propagation algorithm uses the conjugate gradient technique to reduce the sum of squares at each titration. The FCE results of the 9 evaluation indices of 50 HRSs in major cities in China were taken as the input of the ANN, and the ranking of FCE results was obtained by fuzzy logic calculation are used as expected output layer for constructing and training the neural network [27].
The number of hidden-layer neurons affects the performance and accuracy of a neural network. If the number of hidden layer neurons is too small, the data fitting of the neural network may not be carried out well. If the number of neurons is too large, the neural network may perform well in training, but poorly in the prediction results of unknown samples. Therefore, it is very important to determine the appropriate number of neurons. In order to ensure the best model performance, different neural networks with from 3 to 10 neurons using Tansig transfer function were tested, and the neural network model with the minimal MAE, MRE, MSE was selected [35,36]. Test results are shown in Table 10.
As shown in Table 10, when the number of neurons is 7, the MAE, MRE, MSE reach the minimums, and the results are 0.0289, 0.1129 and 0.463×10⁻⁷ espectively. Therefore, the number of neurons in this case model is 7. In addition to the number of neurons in the hidden layer affecting the performance of the neural network, different transfer functions in the hidden layer also affect the performance of the neural network. Figure 6 shows the MAE, MRE, MSE of different transfer functions in the hidden layer. It can be seen that the Purelin transfer function of this neural network structure has the best effect. The number of epochs is set 2000 so that the neural network can fully iterate. The three-layer BP neural network can approximate any nonlinear continuous function with arbitrary precision. For the small amount of data in this paper, the number of hidden layers is set to 1. The finally relevant parameters of this ANN model are shown in Table 11.
The neural network code was constructed in MATLAB R2018a, and the data in Appendix A (Table A1) were substituted into the neural network for training. The results of expert evaluation were taken as the output to obtain the structure of the neural network. The correlation coefficient of neural network is shown in Figure 7. The samples number for training, validation, and testing data are 34 (about 70%), 8 (about 15%), and 8 (about 15%), respectively. The training set of a neural network learns the dataset of samples and constructs the required model by training the sample data. The function of the validation set is to stop the training of the neural network model in time when the performance of the model fails to continue to improve or change during training. Using ANN, the process of training is prone to overfitting and underfitting. The test set does not participate in the training and mainly tests the accuracy of the training model and can detect whether the model produces overfitting. If the results of the test set are too large, an overfitting may occur. The Figure 7 shows that the regression coefficients of the training, validation, and test sets of the model were all close to 1, indicating that the ANN model was well-trained and there is no phenomenon of underfitting and overfitting. So the ANN model could be used for the site selection prediction of HRSs.

4.3.2. Location Prediction of HRSs

After training the ANN model, 8 HRSs that are being planned in Shanghai are selected for prediction, and the accuracy of the model is evaluated. The FCE results and ranking of the 8 HRSs are shown in Appendix A (Table A2). The scores of each index of {D1,D2,D3,D4,D5,D6,D7,D8} of the 8 HRSs were input into the ANN model for prediction and evaluation. The result of its operation is as follows:
Y P = ( 0 . 9682 , 0 . 9493 , 0 . 9473 , 0 . 94516 , 0 . 9319 , 0 . 8767 , 0 . 8322 , 0 . 8138 )
A comparison of the predicted and evaluation results is shown in Table 12.
Table 12 shows that the expert evaluation results obtained by FCE were very close to the prediction result of the ANN model, the ANN prediction results are the same as the comprehensive evaluation. The comprehensive ranking of the eight HRSs was consistent. It shows that the ANN model we constructed can predict the location of the HRS well, and further shows that there is no underfitting and overfitting phenomenon. Among the two evaluation methods, the ShuiChan Road HRS was the best site selection result, which shows that HRSs site selection can be decided quickly and accurately through ANN model. According to the comprehensive evaluation results of experts, the values of the top four HRSs are relatively close, and the results were discussed and analyzed. According to the actual survey data, the planned daily hydrogen refueling capacity of these four HRSs is 500kg and the refueling pressure is 35Mpa. Except for ShangChai HRS, which is a fixed station, the other three HRSs are Skid-mounted stations. The skid-mounted station has a certain advantage in terms of construction scale and operation and maintenance cost, while the fixed station invests heavily. Therefore, the four HRSs have little difference in economic factors. Similarly, in terms of technical factors, experts generally believe that the ShuiChan Road HRS is located on the main road in BaoShan District, and the transportation is more convenient, which makes the cost of hydrogen relatively low. At the same time, the surrounding population density is relatively large, the demand for HRSs is relatively large, and the public acceptance is relatively high. The two HRSs planned in the lower-ranked JiaDing District are oil-hydrogen joint construction stations, which are far inferior to other HRSs in terms of major economic factors. Moreover, Jiading District has a low population density and is far from the core area [68]. The transportation cost is high, and the hydrogen storage technology in the station is far less than that of the independent HRS, so they rank low. After the above discussion and actual investigation, it is worthy of affirmation that the comprehensive score of the HRS of the ShuiChan road is the highest, which also proves the objectivity of the expert evaluation and the accuracy of the ANN.

5. Conclusions

The evaluation index system of HRSs site selection is a complex nonlinear system, which needs to comprehensively consider economic, technical, and social factors. Therefore, it is particularly important to establish an efficient and accurate mathematical model to select the construction sites of hydrogen stations. Therefore, this paper provides a new site selection model for HRSs based on FCE-ANN, which evaluates the operational HRSs in China through the AHP and the FCE method, and uses the obtained data to train the ANN model. The input of the ANN model is the evaluation index results for site selection of HRSs, and the output is the FCE results of the site selection of HRSs. The trained ANN model is used to predict the site selection planning of Shanghai HRSs, and it is concluded that the ShuiChan Road HRS is the best site selection in Shanghai planning. The FCE-ANN model prediction results were compared with the results obtained by the FCE method. The results of the two methods were consistent, clearly showing that a FCE-ANN can objectively and accurately evaluate alternatives to reduce the influence of human factors, and that a FCE- ANN model can quickly and accurately solve HRSs site selection decision-making problems. It can also provide reference for scholars to study other site selection decision-making issues. According to the evaluation system of HRSs site selection established in this paper, a comprehensive understanding of HRSs can be obtained, and on the basis of the evaluation results, it can provide reference for government decision-makers in formulating macro-control policies. In the evaluation system, economic factors have the largest weight, which also reflects that in the process of investment and construction of hydrogen refueling stations, it is very important to evaluate the economic strength of the investor and constructor. Currently, for China, the hydrogen energy industry is in its infancy, and investment in construction a HRS has a relatively long return on investment period, so the government should also give maximum policy and financial support, so as to promote the healthy and sustainable development of the hydrogen energy supply chain industry. This study uses the FCE-ANN model to solve the complex multi-factor evaluation problem, but requires sufficient historical data for model training. However, there are not many hydrogen refueling stations in China, and the historical data and evaluation indicators available for reference are limited. The problem can be better solved in the future. The HRSs evaluation index system established in this paper is based on the current development stage of the hydrogen energy industry. In the future, with the development of the hydrogen energy industry, the evaluation index system of the HRS should be continuously improved and supplemented. It is suggested to explore the deep influencing factors from the perspective of the public’s recognition and satisfaction of HRSs. At the same time, the influence of uncertain factors on HRSs in the future should be considered, and fuzzy mathematics and mathematical logic should be combined with ANN to solve problems such as uncertainty and fuzziness, so as to consider the development strategy of HRSs in the long run.

Author Contributions

Conceptualization, X.Q. and Y.Z.; methodology, Y.Z.; software, C.L.; validation, Y.Z., C.L. and J.Z.; formal analysis, Y.Z.; investigation, J.Z.; resources, J.Z.; data curation, Y.Z.; writing—original draft preparation, Y.Z.; writing—review and editing, X.Q.; visualization, Y.Z.; supervision, X.Q.; project administration, X.Q.; funding acquisition, X.Q. All authors have read and agreed to the published version of the manuscript.

Funding

This research was funded by Major Project of Technological Innovation in Hubei Province, grant number 2020BED010 and 2019AAA075.

Acknowledgments

Gratitude is expressed to all the experts and scholars who participated in the establishment of the evaluation system of this study through interviews and questionnaires; and gratitude is expressed to 10 experts and scholars who participated in the comprehensive evaluation of hydrogen refueling stations in this study. Sincere thanks also to Orange Group Database for providing the information of HRSs.

Conflicts of Interest

The authors declare no conflict of interest.

Appendix A

Table A1. Evaluation results of indices and ranking of 50 operational HRSs in China.
Operational HRSs u 1 u 2 u 3 u 4 u 5 u 6 u 7 u 8 u 9 ResultsRank
YiLan Shun Gong HRS0.980.960.980.930.981.000.710.910.910.95241
Nan Tong Bai Ying HRS0.980.960.980.930.930.930.930.910.910.94672
Changshu Changjia HRS0.980.980.880.930.980.930.880.910.880.93953
Yancheng Chuang Yong HRS0.930.980.910.930.980.930.980.880.880.93394
Nanhai Songgang HRS0.980.970.970.930.910.880.830.870.900.93135
Meijin Qingdao bridgehead HRS0.930.980.930.930.930.880.940.880.880.92236
Zhongshan Sha Lang HRS0.910.930.930.910.930.880.760.880.880.92217
Frodo Road HRS0.910.960.960.960.910.880.940.910.880.92058
Yunfu Xinxing West Second Ring Road HRS *0.940.80.960.930.920.960.890.860.900.91729
Shenhua RuGao HRS0.930.980.930.910.930.880.960.880.880.913310
Jinhong Yunan HRS0.920.830.930.930.920.960.890.880.900.913111
Shunde Shunfeng HRS0.930.930.930.870.900.920.810.880.910.907412
Lianxin Guangzhou Development Zone HRS0.920.920.940.930.920.930.730.800.880.906313
Venus in the region of Pidu HRS0.930.930.930.910.930.880.890.880.880.903714
Jiading River bridge HRS0.910.930.910.910.880.910.710.880.880.900715
Beijing yongfeng HRS0.910.940.910.910.880.940.760.880.880.894916
Pujiang gas HRS 0.910.930.910.910.880.860.710.880.880.890017
Shanghai electric drive HRS (JiaDing)0.860.910.910.910.880.860.960.880.880.886818
Shiyan Dongfeng HRS0.860.880.880.910.880.860.930.880.840.885819
Dongguan Energy Shatian HRS0.900.950.960.820.890.840.720.880.860.881720
Tongji—New Source Dalian HRS0.920.890.780.920.860.840.910.930.780.881321
Wuhan Development Zone Xiongzhong HRS0.840.860.860.910.910.860.860.880.870.877422
Shanghai power HRS (FengXian)0.840.910.910.910.860.860.910.880.920.875623
DongHui HRS0.860.910.910.910.860.860.910.880.920.872824
Huangpu Knowledge City, Guangzhou HRS0.860.880.880.910.880.860.810.880.860.871925
Yunfu Silao HRS0.870.940.860.840.840.860.880.860.900.871726
Zhongshan Dayang motor HRS0.830.880.880.910.880.860.820.880.840.871127
Shanghai Anting HRS0.870.860.860.840.840.860.780.780.900.870828
Shenzhen Kaihaoda HRS0.870.840.860.840.840.860.830.780.900.868729
Donghua harbor city HRS0.860.860.880.910.880.860.880.880.840.868530
Nanhai Taoyuan HRS0.80.810.880.930.910.880.830.870.900.866231
Changshu Toyota HRS0.840.860.910.910.910.860.860.880.870.864532
Foshan Chancheng, Longsha Road HRS0.780.770.860.930.900.880.870.870.880.854033
Yunfu Zhongtong HRS0.920.610.810.930.860.840.910.880.780.853234
MingTian hydrogen HRS0.870.610.910.930.860.840.910.880.810.853035
Geely Commercial Vehicles HRS0.890.910.800.860.840.840.860.880.780.852836
Sanshui Guanghai Avenue West HRS0.770.810.850.930.920.930.740.880.880.852837
Yunfu Luo Ding 1 HRS0.840.860.880.910.880.860.910.880.840.851438
Jiashan Edelman HRS0.870.840.860.860.890.840.980.910.860.848239
Guangzhou Huangpu East District, HRS0.780.760.870.930.860.850.720.790.860.832840
Foshan, Gaoming District, Genghe Town HRS0.780.730.780.930.900.790.900.880.840.830341
Foshan, Gaoming District, Tram HRS0.750.810.840.880.830.780.900.880.840.819742
Nanhai Hanlan Jiujiang Longgao HRS 0.740.800.840.930.780.800.840.830.820.810243
Foshan Nanhai Guicheng HRS0.740.800.830.900.780.800.820.830.820.804444
Foshan Foqi Foluo Road HRS0.740.800.840.880.780.800.820.830.810.802045
Nanhai Ruihui HRS0.710.720.780.880.860.800.840.830.820.795046
Guangdong Southwest Hekou HRS0.730.710.750.870.820.780.840.830.760.780147
Foshan Hejiao HRS *0.730.720.700.750.780.800.850.830.800.760148
Foshan Nanhai Zhangkeng HRS *0.730.720.700.750.780.800.850.830.800.760149
Yunfu Zhaotong HRS *0.630.610.650.800.600.500.890.860.700.665950
* Oil-hydrogen joint construction station.
Table A2. Evaluation results of indices and ranking of planning HRSs in Shanghai.
Planning HRSs u 1 u 2 u 3 u 4 u 5 u 6 u 7 u 8 u 9 ResultsRank
Shui Chan Road HRS (Bao Shan) D10.960.960.960.960.960.960.930.960.960.95901
Shang Chai HRS (Yang Pu) D20.960.980.940.930.960.960.960.940.910.94972
Baoshan Northern Suburb HRS D30.930.980.960.930.960.960.900.960.950.94803
Military Road HRS (YangPu) D40.930.960.940.960.960.930.960.940.910.94214
Wen Xiang Road HRS (SongJiang) D50.930.930.930.930.930.930.850.980.960.93295
ShangHai LinGang HRS D60.900.900.780.930.860.800.800.930.960.87826
GaoJia HRS(JiaDing) D70.850.830.930.780.760.800.830.780.920.83237
BaoPan HRS(JiaDing) D80.830.800.920.730.750.790.830.760.920.81408

References

  1. Zhou, J.; Wu, Y.; Tao, Y.; Gao, J.; Zhong, Z.; Xu, C. Geographic information big data-driven two-stage optimization model for location decision of hydrogen refueling stations: An empirical study in China. Energy 2021, 225, 120330. [Google Scholar] [CrossRef]
  2. Bansal, S.; Zong, Y.; You, S.; Mihet-Popa, L.; Xiao, J. Technical and economic analysis of one-stop charging stations for battery and fuel cell EV with renewable energy sources. Energies 2020, 13, 2855. [Google Scholar] [CrossRef]
  3. Apostolou, D.; Xydis, G. A literature review on hydrogen refuelling stations and infrastructure. Current status and future prospects. Renew. Sustain. Energy Rev. 2019, 113, 109292. [Google Scholar] [CrossRef]
  4. Viktorsson, L.; Heinonen, J.; Skulason, J.; Unnthorsson, R. A Step towards the hydrogen economy—A life cycle cost analysis of a hydrogen refueling station. Energies 2017, 10, 763. [Google Scholar] [CrossRef]
  5. Xu, C.; Wu, Y.; Dai, S. What are the critical barriers to the development of hydrogen refueling stations in China? A modified fuzzy DEMATEL approach. Energy Policy 2020, 142, 111495. [Google Scholar] [CrossRef]
  6. Lopez Jaramillo, O.; Rinebold, J.; Kuby, M.; Kelley, S.; Ruddell, D.; Stotts, R.; Krafft, A.; Wentz, E. Hydrogen station location planning via geodesign in connecticut: Comparing optimization models and structured stakeholder collaboration. Energies 2021, 14, 7747. [Google Scholar] [CrossRef]
  7. Khan, U.; Yamamoto, T.; Sato, H. Consumer preferences for hydrogen fuel cell vehicles in Japan. Transp. Res. Part D Transp. Environ. 2020, 87, 102542. [Google Scholar] [CrossRef]
  8. Sandri, O.; Holdsworth, S.; Hayes, J.; Willand, N.; Moore, T. Hydrogen for all? Household energy vulnerability and the transition to hydrogen in Australia. Energy Res. Soc. Sci. 2021, 79, 102179. [Google Scholar] [CrossRef]
  9. Lee, D.-Y.; Elgowainy, A.; Vijayagopal, R. Well-to-wheel environmental implications of fuel economy targets for hydrogen fuel cell electric buses in the United States. Energy Policy 2019, 128, 565–583. [Google Scholar] [CrossRef]
  10. OrangGroup. Available online: http://www.china-orangegroup.com/ (accessed on 25 October 2021).
  11. H2stations.org. Available online: https://www.h2stations.org/ (accessed on 25 October 2021).
  12. Meng, X.; Gu, A.; Wu, X.; Zhou, L.; Zhou, J.; Liu, B.; Mao, Z. Status quo of China hydrogen strategy in the field of transportation and international comparisons. Int. J. Hydrogen Energy 2020, 46, 28887–28899. [Google Scholar] [CrossRef]
  13. Bai, W.; Zhang, L. How to finance for establishing hydrogen refueling stations in China? An analysis based on Fuzzy AHP and PROMETHEE. Int. J. Hydrogen Energy 2020, 45, 34354–34370. [Google Scholar] [CrossRef]
  14. Ren, X.; Dong, L.; Xu, D.; Hu, B. Challenges towards hydrogen economy in China. Int. J. Hydrogen Energy 2020, 45, 34326–34345. [Google Scholar] [CrossRef]
  15. Song, P.; Sui, Y.; Shan, T.; Hou, J.; Wang, X. Assessment of hydrogen supply solutions for hydrogen fueling station: A Shanghai case study. Int. J. Hydrogen Energy 2020, 45, 32884–32898. [Google Scholar] [CrossRef]
  16. Gye, H.-R.; Seo, S.-K.; Bach, Q.-V.; Ha, D.; Lee, C.-J. Quantitative risk assessment of an urban hydrogen refueling station. Int. J. Hydrogen Energy 2019, 44, 1288–1298. [Google Scholar] [CrossRef]
  17. Li, Y.; Cui, F.; Li, L. An integrated optimization model for the location of hydrogen refueling stations. Int. J. Hydrogen Energy 2018, 43, 19636–19649. [Google Scholar] [CrossRef]
  18. Cho, S.; Kim, J. Multi-site and multi-period optimization model for strategic planning of a renewable hydrogen energy network from biomass waste and energy crops. Energy 2019, 185, 527–540. [Google Scholar] [CrossRef]
  19. He, C.; Sun, H.; Xu, Y.; Lv, S. Hydrogen refueling station siting of expressway based on the optimization of hydrogen life cycle cost. Int. J. Hydrogen Energy 2017, 42, 16313–16324. [Google Scholar] [CrossRef]
  20. Sun, H.; He, C.; Wang, H.; Zhang, Y.; Lv, S.; Xu, Y. Hydrogen station siting optimization based on multi-source hydrogen supply and life cycle cost. Int. J. Hydrogen Energy 2017, 42, 23952–23965. [Google Scholar] [CrossRef]
  21. Zheng, Q.; Lv, H.; Zhou, W.; Zhang, C. Research on multi-period hydrogen refueling station location model in Jiading district. World Electr. Veh. J. 2021, 12, 146. [Google Scholar] [CrossRef]
  22. Lin, R.-H.; Ye, Z.-Z.; Wu, B.-D. A review of hydrogen station location models. Int. J. Hydrogen Energy 2020, 45, 20176–20183. [Google Scholar] [CrossRef]
  23. Kurtz, J.; Bradley, T.; Winkler, E.; Gearhart, C. Predicting demand for hydrogen station fueling. Int. J. Hydrogen Energy 2020, 45, 32298–32310. [Google Scholar] [CrossRef]
  24. Kim, H.; Eom, M.; Kim, B.-I. Development of strategic hydrogen refueling station deployment plan for Korea. Int. J. Hydrogen Energy 2020, 45, 19900–19911. [Google Scholar] [CrossRef]
  25. Chang, X.; Ma, T.; Wu, R. Impact of urban development on residents’ public transportation travel energy consumption in China: An analysis of hydrogen fuel cell vehicles alternatives. Int. J. Hydrogen Energy 2019, 44, 16015–16027. [Google Scholar] [CrossRef]
  26. Liang, Y.; Pan, X.; Zhang, C.; Xie, B.; Liu, S. The simulation and analysis of leakage and explosion at a renewable hydrogen refuelling station. Int. J. Hydrogen Energy 2019, 44, 22608–22619. [Google Scholar] [CrossRef]
  27. Xu, A.; Li, R.; Chang, H.; Xu, Y.; Li, X.; Lin, G.; Zhao, Y. Artificial neural network (ANN) modeling for the prediction of odor emission rates from landfill working surface. Waste Manag. 2022, 138, 158–171. [Google Scholar] [CrossRef] [PubMed]
  28. Geetha, A.; Santhakumar, J.; Sundaram, K.M.; Usha, S.; Thentral, T.M.T.; Boopathi, C.S.; Ramya, R.; Sathyamurthy, R. Prediction of hourly solar radiation in Tamil Nadu using ANN model with different learning algorithms. Energy Rep. 2022, 8, 664–671. [Google Scholar] [CrossRef]
  29. Sang, B. Application of genetic algorithm and BP neural network in supply chain finance under information sharing. J. Comput. Appl. Math. 2021, 384, 113170. [Google Scholar] [CrossRef]
  30. Liu, Q.; Sun, P.; Fu, X.; Zhang, J.; Yang, H.; Gao, H.; Li, Y. Comparative analysis of BP neural network and RBF neural network in seismic performance evaluation of pier columns. Mech. Syst. Signal Processing 2020, 141, 106707. [Google Scholar] [CrossRef]
  31. Liu, J.; Zhang, J.; Zhang, X. Semi-discretized numerical solution for time fractional convection–diffusion equation by RBF-FD. Appl. Math. Lett. 2022, 128, 107880. [Google Scholar] [CrossRef]
  32. He, Y.; Meng, Z.; Xu, H.; Zou, Y. A dynamic model of evaluating differential automatic method for solving plane problems based on BP neural network algorithm. Phys. A Stat. Mech. Its Appl. 2020, 556, 124845. [Google Scholar] [CrossRef]
  33. Mulashani, A.K.; Shen, C.; Nkurlu, B.M.; Mkono, C.N.; Kawamala, M. Enhanced group method of data handling (GMDH) for permeability prediction based on the modified Levenberg Marquardt technique from well log data. Energy 2022, 239, 121915. [Google Scholar] [CrossRef]
  34. Huang, B.; Chen, W.; Lin, C.-L.; Juang, C.-F.; Wang, J. MLP-BP: A novel framework for cuffless blood pressure measurement with PPG and ECG signals based on MLP-Mixer neural networks. Biomed. Signal Processing Control. 2022, 73, 103404. [Google Scholar] [CrossRef]
  35. Roshani, G.H.; Nazemi, E.; Roshani, M.M. Flow regime independent volume fraction estimation in three-phase flows using dual-energy broad beam technique and artificial neural network. Neural Comput. Appl. 2016, 28, 1265–1274. [Google Scholar] [CrossRef]
  36. Amir Sattari, M.; Hossein Roshani, G.; Hanus, R.; Nazemi, E. Applicability of time-domain feature extraction methods and artificial intelligence in two-phase flow meters based on gamma-ray absorption technique. Measurement 2021, 168, 108474. [Google Scholar] [CrossRef]
  37. Yariyan, P.; Zabihi, H.; Wolf, I.D.; Karami, M.; Amiriyan, S. Earthquake risk assessment using an integrated fuzzy analytic hierarchy process with artificial neural networks based on GIS: A case study of Sanandaj in Iran. Int. J. Disaster Risk Reduct. 2020, 50, 101705. [Google Scholar] [CrossRef]
  38. De Campos Souza, P.V. Fuzzy neural networks and neuro-fuzzy networks: A review the main techniques and applications used in the literature. Appl. Soft Comput. 2020, 92, 106275. [Google Scholar] [CrossRef]
  39. Rahmati, O.; Panahi, M.; Ghiasi, S.S.; Deo, R.C.; Tiefenbacher, J.P.; Pradhan, B.; Jahani, A.; Goshtasb, H.; Kornejady, A.; Shahabi, H.; et al. Hybridized neural fuzzy ensembles for dust source modeling and prediction. Atmos. Environ. 2020, 224, 117320. [Google Scholar] [CrossRef]
  40. Wang, M.; Niu, D. Research on project post-evaluation of wind power based on improved ANP and fuzzy comprehensive evaluation model of trapezoid subordinate function improved by interval number. Renew. Energy 2019, 132, 255–265. [Google Scholar] [CrossRef]
  41. Liang, D.; Dai, Z.; Wang, M. Assessing customer satisfaction of O2O takeaway based on online reviews by integrating fuzzy comprehensive evaluation with AHP and probabilistic linguistic term sets. Appl. Soft Comput. 2021, 98, 106847. [Google Scholar] [CrossRef]
  42. Wang, H.; Cheng, M.; Zhang, S.; Fan, J.; Feng, H.; Zhang, F.; Wang, X.; Sun, L.; Xiang, Y. Optimization of irrigation amount and fertilization rate of drip-fertigated potato based on analytic hierarchy process and fuzzy comprehensive evaluation methods. Agric. Water Manag. 2021, 256, 107130. [Google Scholar] [CrossRef]
  43. Zhang, H.; He, X.; Mitri, H. Fuzzy comprehensive evaluation of virtual reality mine safety training system. Saf. Sci. 2019, 120, 341–351. [Google Scholar] [CrossRef]
  44. Qin, G.; Zhang, M.; Yan, Q.; Xu, C.; Kammen, D.M. Comprehensive evaluation of regional energy internet using a fuzzy analytic hierarchy process based on cloud model: A case in China. Energy 2021, 228, 120569. [Google Scholar] [CrossRef]
  45. Zhou, Z.; Zhang, X.; Dong, W. Fuzzy comprehensive evaluation for safety guarantee system of reclaimed water quality. Procedia Environ. Sci. 2013, 18, 227–235. [Google Scholar] [CrossRef] [Green Version]
  46. Nie, B.-S.; Zhao, P.-F.; Guo, J.-H.; Niu, P.-P.; Wang, G. Fuzzy comprehensive evaluation of coal mine safety investment structure based on the M(1,2,3) model. Energy Procedia 2012, 16, 592–597. [Google Scholar] [CrossRef] [Green Version]
  47. He, Z.; Li, M.; Cai, Z.; Zhao, R.; Hong, T.; Yang, Z.; Zhang, Z. Optimal irrigation and fertilizer amounts based on multi-level fuzzy comprehensive evaluation of yield, growth and fruit quality on cherry tomato. Agric. Water Manag. 2021, 243, 106360. [Google Scholar] [CrossRef]
  48. Su, X.; Tao, L.; Liu, H.; Wang, L.; Suo, M. Real-time hierarchical risk assessment for UAVs based on recurrent fusion autoencoder and dynamic FCE: A hybrid framework. Appl. Soft Comput. 2021, 106, 107286. [Google Scholar] [CrossRef]
  49. Ajanovic, A.; Haas, R. Economic prospects and policy framework for hydrogen as fuel in the transport sector. Energy Policy 2018, 123, 280–288. [Google Scholar] [CrossRef]
  50. Gökçek, M.; Kale, C. Techno-economical evaluation of a hydrogen refuelling station powered by Wind-PV hybrid power system: A case study for İzmir-Çeşme. Int. J. Hydrogen Energy 2018, 43, 10615–10625. [Google Scholar] [CrossRef]
  51. Moradi, R.; Groth, K.M. Hydrogen storage and delivery: Review of the state of the art technologies and risk and reliability analysis. Int. J. Hydrogen Energy 2019, 44, 12254–12269. [Google Scholar] [CrossRef]
  52. Blazquez-Diaz, C. Techno-economic modelling and analysis of hydrogen fuelling stations. Int. J. Hydrogen Energy 2019, 44, 495–510. [Google Scholar] [CrossRef]
  53. Stehlík, K.; Tkáč, M.; Bouzek, K. Recent advances in hydrogen technologies in the Czech Republic. Int. J. Hydrogen Energy 2019, 44, 19055–19060. [Google Scholar] [CrossRef]
  54. Minutillo, M.; Perna, A.; Forcina, A.; di Micco, S.; Jannelli, E. Analyzing the levelized cost of hydrogen in refueling stations with on-site hydrogen production via water electrolysis in the Italian scenario. Int. J. Hydrogen Energy 2021, 46, 13667–13677. [Google Scholar] [CrossRef]
  55. Tsunemi, K.; Kihara, T.; Kato, E.; Kawamoto, A.; Saburi, T. Quantitative risk assessment of the interior of a hydrogen refueling station considering safety barrier systems. Int. J. Hydrogen Energy 2019, 44, 23522–23531. [Google Scholar] [CrossRef]
  56. Yoo, B.-H.; Wilailak, S.; Bae, S.-H.; Gye, H.-R.; Lee, C.-J. Comparative risk assessment of liquefied and gaseous hydrogen refueling stations. Int. J. Hydrogen Energy 2021, 46, 35511–35524. [Google Scholar] [CrossRef]
  57. Mayer, T.; Semmel, M.; Guerrero Morales, M.A.; Schmidt, K.M.; Bauer, A.; Wind, J. Techno-economic evaluation of hydrogen refueling stations with liquid or gaseous stored hydrogen. Int. J. Hydrogen Energy 2019, 44, 25809–25833. [Google Scholar] [CrossRef]
  58. Nie, X.; Wei, X.; Xia, Q.; Zhou, M. Customers’ purchase intention for hydrogen vehicle and industrial agglomeration: Evidence from Jiangsu Province, China. Int. J. Hydrogen Energy 2021, 46, 18011–18019. [Google Scholar] [CrossRef]
  59. Li, Z.; Wang, W.; Ye, M.; Liang, X. The impact of hydrogen refueling station subsidy strategy on China’s hydrogen fuel cell vehicle market diffusion. Int. J. Hydrogen Energy 2021, 46, 18453–18465. [Google Scholar] [CrossRef]
  60. Hassan, I.A.; Ramadan, H.S.; Saleh, M.A.; Hissel, D. Hydrogen storage technologies for stationary and mobile applications: Review, analysis and perspectives. Renew. Sustain. Energy Rev. 2021, 149, 111311. [Google Scholar] [CrossRef]
  61. Coffey, L.; Claudio, D. In defense of group fuzzy AHP: A comparison of group fuzzy AHP and group AHP with confidence intervals. Expert Syst. Appl. 2021, 178, 114970. [Google Scholar] [CrossRef]
  62. Ghosh, A.; Ghorui, N.; Mondal, S.P.; Kumari, S.; Mondal, B.K.; Das, A.; Gupta, M.S. Application of hexagonal fuzzy MCDM methodology for site selection of electric vehicle charging station. Mathematics 2021, 9, 393. [Google Scholar] [CrossRef]
  63. Pu, H.; Luo, K.; Zhang, S. Risk assessment model for different foodstuff drying methods via AHP-FCE method: A case study of “coal-burning” fluorosis area of Yunan and Guizhou Province, China. Food Chem. 2018, 263, 74–80. [Google Scholar] [CrossRef] [PubMed]
  64. Zhong, C.; Yang, Q.; Liang, J.; Ma, H. Fuzzy comprehensive evaluation with AHP and entropy methods and health risk assessment of groundwater in Yinchuan Basin, northwest China. Environ. Res. 2022, 204, 111956. [Google Scholar] [CrossRef]
  65. Asghar, A.B.; Farooq, S.; Khurram, M.S.; Jaffery, M.H.; Ejsmont, K. Estimation of the solid circulation rate in circulating fluidized bed system using adaptive neuro-fuzzy algorithm. Energies 2021, 15, 211. [Google Scholar] [CrossRef]
  66. Li, R.; Xu, A.; Zhao, Y.; Chang, H.; Li, X.; Lin, G. Genetic algorithm (GA)—Artificial neural network (ANN) modeling for the emission rates of toxic volatile organic compounds (VOCs) emitted from landfill working surface. J. Environ. Manag. 2022, 305, 114433. [Google Scholar] [CrossRef]
  67. Hui, L.; Yunfei, H.; En, Z.; Kai, S. Prediction of safety objective of an enterprise using fuzzy neural network. Procedia Eng. 2012, 43, 162–167. [Google Scholar] [CrossRef] [Green Version]
  68. Chen, Q.; Gu, Y.; Tang, Z.; Wang, D.; Wu, Q. Optimal design and techno-economic assessment of low-carbon hydrogen supply pathways for a refueling station located in Shanghai. Energy 2021, 237, 121584. [Google Scholar] [CrossRef]
Figure 1. Structure diagram of HRSs in China and Global by the end of 2021 [10,11].
Energies 15 01098 g001
Figure 2. Evaluation index system of HRSs site selection.
Energies 15 01098 g002
Figure 3. Research framework proposed in this study.
Energies 15 01098 g003
Figure 4. Architecture of artificial neural network for HRSs site selection.
Energies 15 01098 g004
Figure 5. The Main Distribution of HRSs in China [10].
Energies 15 01098 g005
Figure 6. The MAE, MRE, MSE of different transfer functions in the hidden layer.
Energies 15 01098 g006
Figure 7. Correlation coefficients between model objectives and ANN prediction based on training, validation, and test sets, and the whole dataset.
Energies 15 01098 g007
Table 1. Factors affecting HRSs planning in China.
CategoriesFactorsReferences
Economic factorsConstruction scale[5,49,50]
Investment strength[5,13,51]
Operational costs[13,16,49,52]
Technological factorsHydrogen production technology[16,17,50]
Hydrogen storage technology[16,51]
Transportation technology[5,16,53,54]
Social factorsThe population density[25,55,56]
Environmental factors[14,52,57]
Social identity[58] and EC
EC: expert consultation.
Table 2. Advantages and disadvantages of hydrogen storage technologies [60].
Hydrogen Storage TechnologyTheoretical
Hydrogen Storage
AdvantagesDisadvantages
High-pressure gaseous hydrogen storage1–2 wt %Low cost, fast charging and discharging speed, can be carried out at room temperatureLow hydrogen storage capacity, needs high-pressure vessels, high energy consumption, high transportation costs, poor safety
Low-temperature liquid hydrogen storage>10 wt %High volume energy density, high liquid purityLiquefaction has high energy consumption, and demanding storage and maintenance requirements
Metal alloy storage hydrogen1–8 wt %Large hydrogen storage capacity, high safety, good stability, good operabilityHydrogen storage performance is poor, easy to powder, transportation is not convenient
Organic liquid hydrogen storage5–10 wt %Large amount of hydrogen storage, safe and convenient transportation, can be recycled, low energy consumptionHigh cost of catalytic hydrogenation and dehydrogenation unit, complex technical operation, and low efficiency in dehydrogenation
Transportation technology U23.
Table 3. Comparison of scale, cost, and energy consumption of three modes of hydrogen transport [59].
Hydrogen Transport ModeTube TrailerPipelineLiquid Truck
CostScaleCost not affected by scaleLarge scale, low costScale is large, and cost is greatly reduced
DistanceShort distance, low costShort distance, low costDistance is long, cost rises slightly
Energy consumptionScaleUnit energy consumption of the three methods has nothing to do with hydrogen transport scale
DistanceLong distance, high costMinimal energy consumptionMinimal impact
Table 4. Scales and meanings of the judgment matrix [42].
NumberImportance Level a i j
1i and j are equally important1
2i is slightly more important than j3
3i is obviously more important than j5
4i is more strongly important than j7
5i is much more important than j9
6i is a little less important than j1/3
7i is significantly less important than j1/5
8i is strongly less than j1/7
9i is much less than j1/9
Table 5. Judgment matrix U–Ui.
UU1U2U3 Weights   w i
U113/25/30.4289
U>22/315/20.3747
U33/52/510.1964
Note: CI = 0.0368, CR = 0.0634, r = 3.0735.
Table 6. Judgment matrix U1–U1j.
U1U11U12U13 Weights   w 1 j
U1115/220.5257
U122/513/40.2058
U131/24/310.2685
Note: CI = 0.0231, CR = 0.0398, λ = 3.0005.
Table 7. Judgment matrix U2–U2j.
U2U21U22U23 Weights   w 2 j
U2113/43/20.3415
U224/314/30.3978
U232/33/410.2607
Note: CI = 0.0091, CR = 0.0158, λ = 3.0183.
Table 8. Judgment matrix U3–U3j.
U3U31U32U33 Weights   w 3 j
U3112/32/50.2000
U323/213/50.3000
U335/25/310.5000
Note: CI = 0.0024, CR = 0.0381, λ = 3.0000.
Table 9. Corresponding values of evaluation levels.
Evaluation LevelsVery GoodGoodGeneralPoorVery Poor
Corresponding values10.80.50.20
Table 10. Influence of number of hidden-layer neurons on neural network using Tansig transfer function.
Number of Neurons345678910
MAE0.20980.04280.05220.0650.02890.05220.08360.0835
MRE0.83520.16570.22460.25290.11290.22660.31760.3283
MSE (1 × 10⁻⁷) 242.423.655.070.4639.955.679.11
Table 11. Parameters of ANN model.
Neuron Transfer FunctionAlgorithm EpochsTraining Target Error
PurelinLM2000 1 × 10⁻¹²
Input nodesOutput nodesNumber of hidden neuronsNumber of hidden
layers
9171
Table 12. Comparison table of predicted sample results.
Planned HRSs FCE ResultsANN Results
ShuiChan Road HRS D10.95900.9682
ShangChai HRS D20.94970.9493
BaoShan Northern Suburb HRS D30.94800.9473
Military road HRSD40.94210.9416
WenXiang Road HRS D50.93290.9319
BaoPan HRS(JiaDing) D60.87820.8767
GaoJia HRS(JiaDing) D70.83230.8322
ShangHai LinGang HRS D80.81400.8138
Publisher’s Note: MDPI stays neutral with regard to jurisdictional claims in published maps and institutional affiliations.

