Article

Numerical Analysis of VPSA Technology Retrofitted to Steam Reforming Hydrogen Plants to Capture CO2 and Produce Blue H2

1
Institute for Materials and Processes, School of Engineering, The University of Edinburgh, Robert Stevenson Road, Edinburgh EH9 3FB, UK
2
Dipartimento di Scienze Chimiche, Università degli Studi di Napoli Federico II, Complesso Universitario di Monte Sant’Angelo, 80126 Napoli, Italy
3
Research Unit of Process Engineering, Faculty of Engineering, University of Rome “Campus Bio-Medico”, Via Alvaro del Portillo 21, 00128 Rome, Italy
*
Author to whom correspondence should be addressed.
Energies 2022, 15(3), 1091; https://doi.org/10.3390/en15031091
Submission received: 4 January 2022 / Revised: 27 January 2022 / Accepted: 28 January 2022 / Published: 1 February 2022

Abstract

:
The increasing demand for energy and commodities has led to escalating greenhouse gas emissions, the chief of which is represented by carbon dioxide (CO2). Blue hydrogen (H2), a low-carbon hydrogen produced from natural gas with carbon capture technologies applied, has been suggested as a possible alternative to fossil fuels in processes with hard-to-abate emission sources, including refining, chemical, petrochemical and transport sectors. Due to the recent international directives aimed to combat climate change, even existing hydrogen plants should be retrofitted with carbon capture units. To optimize the process economics of such retrofit, it has been proposed to remove CO2 from the pressure swing adsorption (PSA) tail gas to exploit the relatively high CO2 concentration. This study aimed to design and numerically investigate a vacuum pressure swing adsorption (VPSA) process capable of capturing CO2 from the PSA tail gas of an industrial steam methane reforming (SMR)-based hydrogen plant using NaX zeolite adsorbent. The effect of operating conditions, such as purge-to-feed ratio and desorption pressure, were evaluated in relation to CO2 purity, CO2 recovery, bed productivity and specific energy consumption. We found that conventional cycle configurations, namely a 2-bed, 4-step Skarstrom cycle and a 2-bed, 6-step modified Skarstrom cycle with pressure equalization, were able to concentrate CO2 to a purity greater than 95% with a CO2 recovery of around 77% and 90%, respectively. Therefore, the latter configuration could serve as an efficient process to decarbonize existing hydrogen plants and produce blue H2.

1. Introduction

Because of the constantly rising and unabated greenhouse gas emissions, of which the main constituent is carbon dioxide, the world is experiencing the detrimental effects of climate change. Driven by higher energy and commodity demand, global energy-related CO2 emissions, led by the power sector, reached a record high of 33.4 Gt in 2019 [1]. To combat climate change, a great deal of research and development has been carried out into low-carbon alternatives to fossil fuels, one of which is represented by hydrogen [2]. As set out in the recently published UK Hydrogen Strategy [3], low-carbon hydrogen will be essential for achieving net zero emissions and meeting a sustainable carbon budget target. Low-carbon hydrogen is particularly useful in decarbonizing sectors with hard-to-abate emission sources, such as the refining, chemical and petrochemical industries, and in providing flexible energy across power, heating and transport sectors. However, despite its great potential, several challenges need to be solved before hydrogen can be adopted as a common low-carbon energy carrier such as a well-planned synergy among production, transmission, storage and distribution.
The global demand for hydrogen in its pure form is currently around 72 million tonnes per year, with the ammonia and refining industries consuming over 90% of the production capacity [2]. The methanol and steel industries consume an additional 16 million tonnes per year of hydrogen as a mixture of gases [2]. The production of hydrogen is carried out using around 90% of feedstock as fossil fuels, including natural gas as the largest share, fuel oil and coal [2]. At present, steam methane reforming (SMR) is the most widespread process to produce hydrogen from natural gas and light hydrocarbons. The majority of SMR-based hydrogen plants are fully optimized in order to achieve CO2 emissions close to the theoretical minimum [4]. However, the further reduction of 830 million tonnes of CO2 emitted from hydrogen plants worldwide [2] could only be obtained by integrating carbon capture and storage (CCS) technologies in the hydrogen plant, thus allowing the production of low-carbon hydrogen known as blue H2.
The block flow diagram for a typical SMR-based hydrogen plant is shown in Figure 1. From the battery limits, the natural gas feed is purified, pre-reformed and reformed to produce a syngas stream. The process is generally followed by a single stage of high temperature water gas shift (WGS) reactor, since a very low CO residual is not required. Any CO remaining in the raw hydrogen is recovered as reformer fuel. After cooling, the shifted syngas is purified in a pressure swing adsorption (PSA) unit to achieve ultrapure H2 (99.99+%). Depending on the operating conditions, the typical PSA tail gas comprises 45–55 mol% CO2, 20–25 mol% H2, 10–15 mol% CH4, 10–15 mol% CO and 1–5 mol% N2 [4]. Given its high lower heating value, the PSA tail gas is sent back to the reformer burners along with a fraction of the natural gas feed as a fuel. From the block flow diagram of Figure 1, three distinct CO2 capture locations can be identified: the shifted syngas (location 1) having the highest CO2 partial pressure, the PSA tail gas (location 2) having the highest CO2 concentration and the flue gas (location 3) having the highest CO2 flowrate. The three capture locations have been extensively assessed in the literature [5,6,7].
To date, several pilot plants have demonstrated the viability of low-carbon hydrogen production using the SMR process coupled with CCS based on chemical absorption, adsorption, membranes and cryogenic distillation. The Shell Quest Project in Canada demonstrated the feasibility of aqueous amine solutions-based absorption technology, with the capacity to capture approximately 1.1 million tonnes of CO2 per annum (Mtpa) [8]. The Port Arthur Project in USA used vacuum swing adsorption technology having a CO2 capture capacity of around 1.0 Mtpa [9]. In France, the Port Jerome Project demonstrated the viability of cryogenic and membrane separation through the Air Liquide CryocapTM system, resulting in a CO2 capture capacity of around 0.1 Mtpa [10].
Among the proposed carbon capture technologies, adsorption processes have proven to be less energy intensive [11,12,13] with higher operating flexibility and lower maintenance costs when compared to other purification pathways [4,14,15]. In the SMR-based hydrogen plant, only the flue gas capture location has the potential to fully decarbonize the plant by removing all the CO2 emissions but is characterized by the lowest CO2 partial pressure and concentration, thus requiring several large vacuum pressure swing adsorption (VPSA) units to operate in parallel. To partly alleviate the resulting high CAPEX and OPEX, the use of rapid cycles has been proposed in the literature [13,16]. The shifted syngas capture location features the highest CO2 partial pressure. However, it is well known that, in order to obtain a high-purity CO2 product, PSA cycles must be operated under vacuum desorption pressure to fully regenerate the adsorption beds packed with zeolitic adsorbents, thus incurring large pressure swing energy penalties [17,18]. In addition, depending on the pressure drops, the CO2-depleted syngas stream may need to be recompressed prior to the H2 PSA unit and/or the H2 PSA unit may have to be reconfigured to take into account the substantial change in feed flowrate and composition. For instance, Liu et al. [18] demonstrated that, with very similar CO2 purities and recoveries, a CO2 VPSA process first followed by a H2 PSA process underperformed a H2 PSA process first followed by a CO2 VPSA process since the specific energy consumption was around 14% higher while the H2 recovery was around 16% lower. To overcome these economic limitations, some authors have investigated the integration of hydrogen purification and CO2 capture in a single adsorption cycle [19,20,21]. However, this novel adsorption process would be suitable only for greenfield hydrogen plants potentially equipped with a second-stage low temperature WGS reactor, leading to a higher CO conversion prior to the integrated VPSA unit. Therefore, the PSA tail gas, having the highest CO2 concentration, is expected to be the most economically efficient carbon capture location to retrofit existing hydrogen plants via VPSA technology.
In the literature, only a few studies have been carried out tackling this kind of separation. Golmakani et al. [22] designed and simulated a 4-bed, 7-step VPSA process comparing three adsorbents, namely activated carbon, 5A zeolite and SAPO-34 zeolite, and assessing the effect of several operating conditions such as weight-hourly space velocity, feed pressure, vacuum pressure and purge-to-feed ratio on the process performances. After a detailed sensitivity analysis, it was concluded that the VPSA process using SAPO-34 could enrich CO2 to purity levels greater than 90% with a recovery of around 73%. Shi et al. [23] investigated the performance of a 3-bed, 5-step VPSA process using silica gel as an adsorbent. They found that the adsorption pressure exhibited the highest influence on both CO2 purity and specific energy consumption, while the bed diameter was the dominant parameter in regulating the CO2 recovery. The best simulation runs achieved a CO2 purity of 97.1% with a recovery of 82.6%, or a CO2 purity of 88.6% with a recovery of 97.8%.
It should be noted that both the abovementioned scientific works considered a lab-scale feed flowrate for the VPSA process, which is 3–5 orders of magnitude lower than that of industrial hydrogen plants. Industrial fixed-bed adsorbers are characterized by higher superficial velocities, higher pressure drops, higher mass and heat transfer coefficients, and quasi-adiabatic operation, all of which will affect the separation performance [13,24]. Moreover, in both cited papers the CO concentration in the VPSA feed was in the range of only 1.0–1.5 mol%, assuming a two-stage WGS reaction (in contrast with 10–15 mol% of a single stage) that is unconventional in hydrogen plants. Accordingly, the separation performance of the VPSA process would be overestimated since for most adsorbents the selectivity of CO2 over CO is the lowest compared to the other feed components (CH4, N2, H2).
Therefore, in this study we overcame for the first time the above limitations by designing and numerically investigating a VPSA process capable of capturing CO2 from the PSA tail gas of an industrial SMR-based hydrogen plant equipped with a conventional single stage high temperature WGS reactor. The separation performance targets were 95+% CO2 purity and 90+% CO2 recovery. To this end, conventional cycle configurations, namely 2-bed, 4-step Skarstrom cycle (composed of adsorption, blowdown, purge and feed pressurization steps) and 2-bed, 6-step modified Skarstrom cycle with pressure equalization, were assessed by means of a rigorous mathematical model accounting for mass, energy and momentum balance equations along with various operating parameters such as the purge-to-feed ratio and the desorption pressure. The selected adsorbent was NaX zeolite from Union Carbide, which has been recently tested by Brea et al. [25] in PSA cycles for hydrogen purification. NaX zeolite also exhibits excellent adsorption properties for CO2 capture in terms of saturation capacity, working capacity and CO2 selectivity over the other components in the PSA tail gas, as extensively reported in the literature [11,12,13,26,27].

2. VPSA Mathematical Model

To accurately simulate a VPSA system, a rigorous mathematical model was used to integrate mass, momentum and energy balances along an adsorption packed bed [28,29].
Since the gas flow was assumed as an axially dispersed plug flow, Equation (1) gives the component mass balance:
c i t + J i z + u c i z + 1 ε ε ρ s q ¯ i t = 0
where
J i = D z c T y i z
To estimate the gas velocity along the bed the following overall mass balance needs to be solved:
c T t + ( u c T ) z + 1 ε ε ρ s i = 1 n q ¯ i t = 0
Since the bed undergoes significant variations in temperature due to the heats of adsorption, the energy balance is expressed as:
U g t + 1 ε ε U s t + J T z + u H g z 1 ε ε ρ s i = 1 n ( Δ H ¯ i ) q ¯ i t + 4 h w D b T T w = 0
where
J T = k z T z
In this study, the effect of kinetic energy in the energy balance was neglected as the VPSA cycles were not rapid [30]. In addition, the bed wall temperature was assumed to be 301.15 K.
The momentum balance was described by the Ergun equation [31], for which the pressure drop along the bed can be evaluated as follows:
d P d z = 150 μ ( 1 ε ) 2 u d P 2 ε 2 + 1.75 ( 1 ε ) ρ g u | u | d P ε
The Danckwerts boundary conditions were taken for the gas phase concentrations and the enthalpies. Considering as a positive the flow direction from 0 (feed end) to L (product end), they can be expressed in general terms as:
J i z = 0 = u + u 2 c i , 0 c i , 0
J i z = L b = u u 2 c i , L b + c i , L b
J T z = 0 = u + u 2 H g , 0 H g , 0
J T z = L b = u u 2 H g , L b + H g , L b
Experimental adsorption equilibrium of H2, CH4, CO and CO2 on NaX zeolite were reported by Brea et al. [25] at three temperatures (298, 313 and 338 K) and in the pressure range of 0–3 bar, which is sufficient to characterize the operating pressure ranges of the analyzed VPSA systems. The ideal adsorbed solution theory (IAST) was used to predict multicomponent adsorption equilibria. The resulting system of algebraic-integral equations that needs to be solved is as follows [32,33]:
P y i = P i 0 x i
ψ i = 0 P i 0 q i d ln P i
ψ i = ψ e q
1 q T = i = 1 n x i q i
Following the fitting reported by Brea et al. [25], the dual-site Langmuir model was used to describe the pure component adsorption isotherms:
q i * = q s 1 , i b 1 , i P i 1 + b 1 , i P i + q s 2 , i b 2 , i P i 1 + b 2 , i P i
where
b n , i = b n , i , 0 exp Δ H n , i R T n = 1 , 2
The dual-site Langmuir isotherm parameters were attained by regressing the experimental data in the operating condition ranges using Origin software [34]. Given the heterogeneity of the isotherm model, the heat of adsorption in the energy balance (Equation(4)) was averaged on the two adsorption sites.
Mass transfer in the adsorbent particle was described by the Linear Driving Force (LDF) model following the approach by Brea et al. [25]:
q ¯ i t = k L D F , i q i * q ¯ i
where
k L D F , i = k 1 , i T + k 2 , i
From the experimental data, the reciprocal time constants, and hence the LDF coefficients, were linearly regressed in the reported temperature range for CH4, CO and CO2 while H2 LDF coefficient was set to a very high value to represent that H2 does not exhibit diffusional limitations during adsorption [25]. All equilibrium and kinetic parameters of this study for NaX zeolite can be found in Table 1.
The correlations proposed by Wakao and Funazkri [35] were used to estimate the axial mass dispersion coefficient Dz and the axial thermal dispersion coefficient kz:
ε D z D m = 20 + 0.5 S c R e
k z k g = 7 + 0.5 P r R e
The correlation by Specchia et al. [36] was used to calculate the internal heat transfer coefficient between the gas and the bed wall:
h w = k g d P 0.0835 R e 0.91
Eventually, Multiflash coupled with the ideal gas law [37] was used to evaluate the remaining gas mixture physical properties such as density, thermal conductivity, viscosity and molar specific heat.
To complete the mathematical model of a VPSA system, the adsorption beds have to be integrated in a realistic flowsheet by means of ancillary equipment, including valves, headers, sources and sinks [38]. In particular, two valve models were considered, either mass flow controller (MFC) or pressure-driven mode (PDM):
F = F i   ( MFC )
F = V S P C v Δ P   ( PDM )
Full details of the mathematical model of ancillary units can be found elsewhere [29].
In a carbon capture application by VPSA technology CO2 is usually the most strongly adsorbent component so that it is recovered during the blowdown step and the purge step. Thus, the key performance indicators (KPIs) for this separation are the following:
C O 2 P u r i t y = 0 t B D c C O 2 u z = 0 d t + 0 t P U c C O 2 u z = 0 d t i = 1 n 0 t B D c i u z = 0 d t + i = 1 n 0 t P U c i u z = 0 d t
C O 2 R e c o v e r y = 0 t B D c C O 2 u z = 0 d t + 0 t P U c C O 2 u z = 0 d t 0 t A D c C O 2 u z = 0 d t + 0 t P R c C O 2 u z = 0 d t
B e d   P r o d u c t i v i t y = 0 t B D c C O 2 u z = 0 d t + 0 t P U c C O 2 u z = 0 d t A b t c y c l e m a d s
S p e c i f i c E n e r g y = 0 t B D + t P U P o w e r v a c u u m d t 0 t B D c C O 2 u z = 0 d t + 0 t P U c C O 2 u z = 0 d t M W C O 2 A b
P o w e r v a c u u m = 1 η F γ γ 1 P d e s ρ g P a t m P d e s γ 1 γ 1
where Equations (27) and (28) were used to calculate the specific energy required for the process. This was obtained as the ratio of the power consumption of the vacuum pump and the mass flowrate of CO2 at the cyclic steady state (CSS). For all the VPSA configurations of this study, the cyclic steady state was reached after 50–60 cycles when the difference of CO2 purity and recovery with respect to the previous cycle were both less than 10−5.
The VPSA mathematical model was solved using gPROMS software [37]. Second order centered finite difference method (CFDM) with 100 elements along the bed length was chosen as discretization method. Both absolute and relative numerical tolerances were set to 10−6.

3. Design Basis and Cycle Configurations

This study was based on the SMR plant outlined in the technical report by the International Energy Agency Greenhouse Gas R&D Programme [39]. The report provides a techno-economic assessment of an industrial SMR-based hydrogen plant without and with CCS having a nominal capacity of 100,000 Nm3 h−1 of H2 and operating as a standalone plant. The base case plant without CCS comprises a feedstock pre-treatment, a pre-reformer, a primary reformer, a high temperature WGS reactor, a H2 PSA in single train arrangement and a multi-stage hydrogen compression. The plant consumes around 14.2 MJth of natural gas, emits around 0.81 kg of CO2 per Nm3 of H2 produced and has a surplus of around 9.9 MWe electricity exported to the grid. The PSA tail gas, regarded as the feed stream of the CO2 VPSA unit, is extracted at 1.3 bar and 301.15 K and has a molar composition of 23.69% H2, 0.62% N2, 9.45% CH4, 14.54% CO, 50.95% CO2 and 0.76% H2O. The associated flowrate is 60,658 kg h−1 that corresponds to 585.1 mol s−1. The detailed process flow diagram of the plant along with full material and energy balances can be found in the IEA report [39].
For simplicity, the PSA tail gas was assumed to be dehydrated in a pre-treatment drying process where the water amount was reduced down to ppm levels. Due to the unavailability of nitrogen isotherms on NaX adsorbent [25], nitrogen was lumped into methane, which makes the simulations conservative in terms of CO2 capture as methane is more strongly adsorbed than nitrogen in zeolites [14,40]. Therefore, the resulting VPSA feed molar composition was 23.87% H2, 10.15% CH4, 14.65% CO and 51.34% CO2. Physical properties of NaX zeolite were taken from Brea et al. [25], however a typical industrial pellet diameter of 2.5 mm was considered from the literature. We also assumed that the specific heat capacity of the adsorbent was 920 J kg−1 K−1, similar to other 13X zeolite pellets [13].
Industrial VPSA beds exhibit superficial velocities in the range 0.1–0.5 m s−1 and are designed with diameters up to 3.0 m in order to minimize pressure drops while ensuring even distribution of the gas flow along the bed [24]. Given the very large volumetric flowrate of the PSA tail gas, four VPSA trains with a bed diameter of 3.0 m were designed to operate in parallel. The resulting volumetric feed flowrate per PSA train was 2.82 m3 s−1 corresponding to a molar flowrate of 146.27 mol s−1 while the superficial velocity was approximately 0.4 m s−1. The Lb/Db ratio was selected in the range 1.5–2.0 in order to have a cycle time of around 10 min along with bed pressure drops less than 0.1 bar. A full list of adsorbent parameters, bed parameters and operating conditions for the VPSA process is reported in Table 2.
In this study, a first 2-bed, 4-step Skarstrom cycle with vacuum desorption pressure was assessed, as depicted in Figure 2. After the adsorption step, the first bed is depressurized to the desorption pressure during the blowdown step. At the same time, the feed mixture is switched to the second bed to repressurize it, followed by the adsorption step at the feed pressure. A fraction of the raffinate effluent from the second bed is passed through the first bed, countercurrently, to purge the bed at the desorption pressure. This minimizes the amount of residual carbon dioxide in the bed, returning it to a clean state. After the purge, the VPSA unit is ready for the next cycle so that each bed undergoes two half-cycles, the times of which are equal [14,40].
In a vacuum swing cycle using the same adsorption pressure of a cycle having an atmospheric desorption pressure, for the same CO2 purity, the CO2 recovery is increased at the expense of additional energy required to run the vacuum pump. To partly compensate the increase in energy consumption, a second 2-bed, 6-step modified Skarstrom cycle with pressure equalization and vacuum desorption pressure was considered, which is shown in Figure 3. After the first bed has finalized the adsorption step and the second bed has been purged, the two beds are connected in order to equalize their pressure. This step conserves energy because the compressed gas from a high-pressure bed is used to partially pressurize a low-pressure bed. As a result, the CO2 purity can be improved with the same CO2 recovery [14,40].
For the 2-bed, 4-step configuration the total cycle time was fixed at 600 s with tAD = tPU = 250 s and tBD = tPR = 50 s (Figure 2). The adsorption/purge step time was set sufficiently below the CO2 breakthrough time observed in breakthrough simulations while the blowdown/pressurization step time was set to allow sufficient time for the pressure change. The 2-bed, 6-step cycle time was fixed at 650 s with tAD = tPU = 250 s, tBD = tPR = 50 s and tDPE = tPPE = 25 s (Figure 3). At the beginning of each simulation, the beds were assumed to be filled with pure hydrogen at the adsorption or desorption pressure depending on the cycle step and at 301.15 K. The valve flow coefficients were correctly calibrated in function of the cycle step(s) in which the valves were open, with the values reported in Table 2.

4. Results and Discussion

Once the industrial fixed-bed adsorbers were sized and the cycle step times selected, the separation KPIs were assessed for both configurations by varying operating conditions such as the purge-to-feed ratio (P/F ratio) and the vacuum desorption pressure. These operating parameters have been extensively evaluated in the literature for CO2 capture processes by VPSA technology [11,12,13,22]. In particular, the power consumption of the VPSA unit would be highly dependent on the selected desorption pressure as long as the P/F ratio was low enough to achieve high CO2 product purities. To meet the separation targets of this study, i.e., 95+% CO2 purity and 90+% CO2 recovery, the investigated desorption pressure was in the range 0.05–0.2 bar while the P/F ratio was varied between 0 and 0.05 (Table 2). Given the industrial feed flowrate and the relatively low vacuum desorption pressures, the vacuum pump was assumed a liquid-ring pump and its efficiency (η) was evaluated at 40%, in line with VPSA experimental and modelling studies reported in the literature [27,29].

4.1. 2-Bed, 4-Step Simulations

For the 2-bed, 4-step VPSA configuration, 12 simulation runs were carried out until a cyclic steady state was achieved. All performance results are summarized in Table 3 in terms of CO2 purity, CO2 recovery, specific energy consumption and bed productivity. The unit KPIs are also shown in Figure 4 in terms of P/F ratio with variable desorption pressure. As expected, higher P/F ratios increase the CO2 recovery (Figure 4b) because the adsorption beds will be regenerated to a higher extent, thus reducing the CO2 loss during the subsequent adsorption step. On the contrary, the CO2 purity is decreased (Figure 4a) as more purge light gases will be extracted along with the CO2 in the purge vent. The bed productivity also increases with the P/F ratio following the CO2 recovery trend (Figure 4d). Even if CO2 recovery raises with the P/F ratio, the CO2 purity reduces, resulting in an increase of the purge light gases recovery, which ultimately leads to a moderate increase of the specific power consumption (Figure 4c). For instance, at the desorption pressure of 0.05 bar the specific energy consumption is 691.3 kJ kgCO2−1 with P/F = 0.05, a value that is 6.5% greater than the outcome obtained with P/F = 0. As anticipated, the effect of desorption pressure is more significant on the KPIs. Shifting the desorption pressure from 0.2 to 0.05 bar, CO2 purities and recoveries are improved by 3–5% and 30–40%, respectively, at the expense of the specific energy consumption that approximately doubled (Figure 4).
Run 1 in Table 3, having a desorption pressure of 0.05 bar and a P/F ratio equal to 0, achieved the best CO2 capture targets, i.e., CO2 purity of 95.3% and CO2 recovery of 77.4% with a bed productivity of 5.57 molCO2 h−1 kgads−1 and a specific energy consumption of 649.1 kJ kgCO2−1. However, the CO2 recovery rate was deemed too low to effectively decarbonize existing hydrogen plants, so a more complex VPSA configuration incorporating a pressure equalization step was investigated.

4.2. 2-Bed, 6-Step Simulations

Given the unsatisfactory performance results of the 2-bed, 4-step configuration, 12 additional simulations runs were carried out assessing the 2-bed, 6-step configuration, with performance results reported in Table 4 and graphically displayed in Figure 5. Generally, the KPIs exhibited the same trends as the previous cycle configuration but it should be noted that, with a CO2 purity above 96%, the CO2 recovery reached a value close to 90% in Run 15. The enhanced CO2 recovery of about 13% points with respect to the previously analysed configuration came as the result of incorporating the pressure equalization step in the cycle. The specific energy consumption (639.7 kJ kgCO2−1) was very similar to that of the previous cycle configuration while the bed productivity was decreased from 5.57 to 4.47 molCO2 h−1 kgads−1, which was mainly due to the increased adsorption bed length. In summary, it is expected that a 2-bed, 6-step VPSA system with a desorption pressure of 0.05 bar and a P/F ratio slightly higher than 0.03 would be able to successfully meet the required capture targets of CO2 purity and CO2 recovery greater than 95% and 90%, respectively.

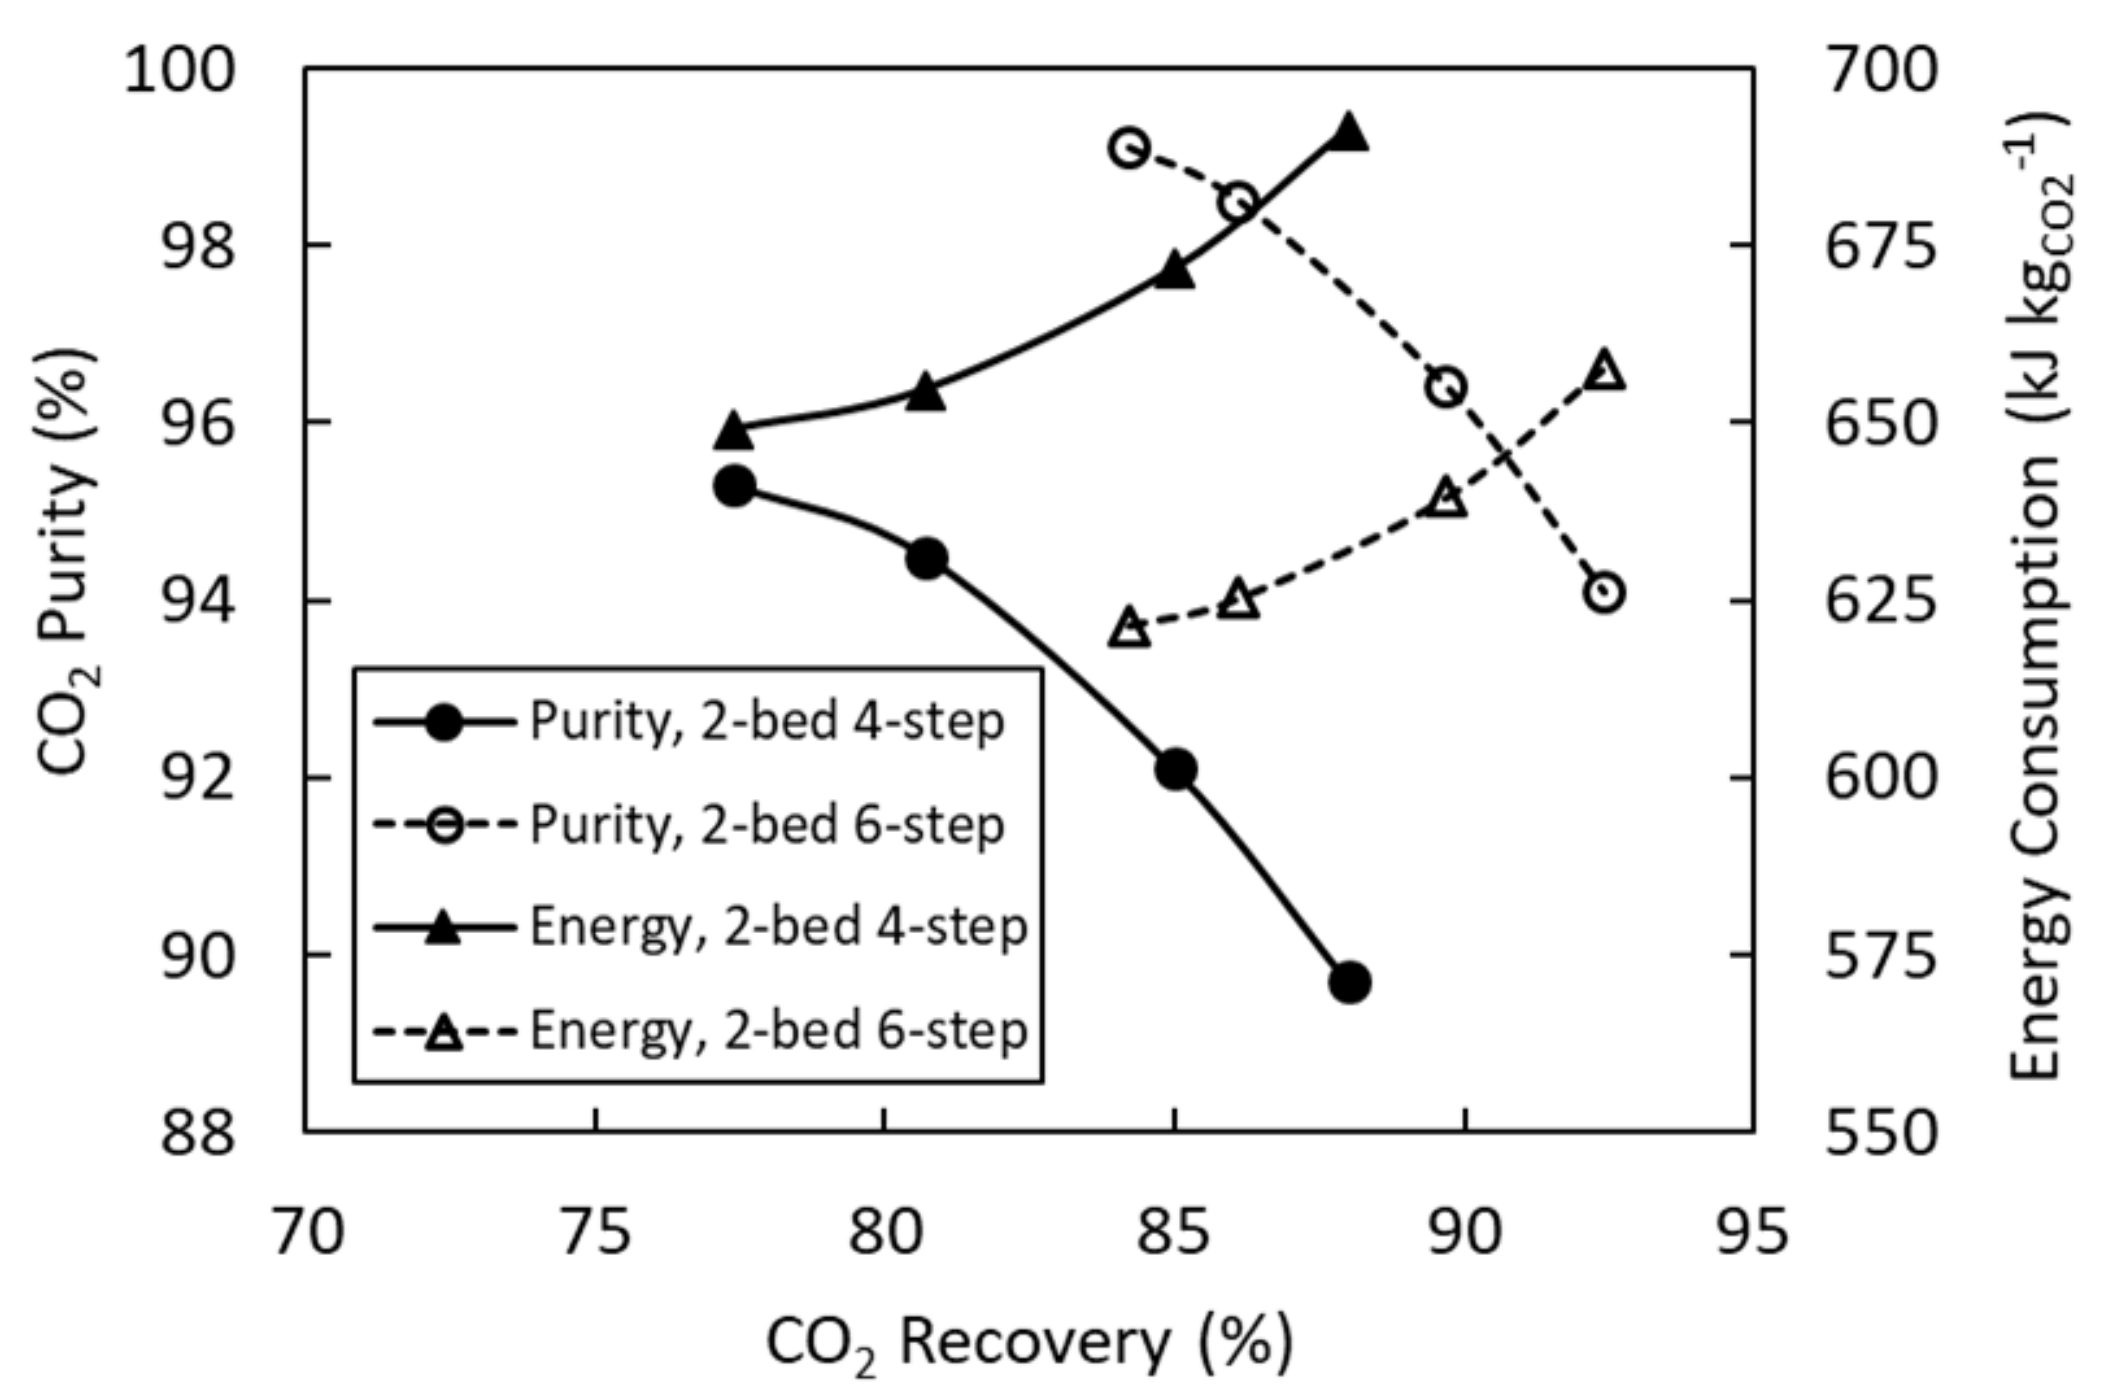
4.3. Cycle Configuration Comparison

Runs 6 and 18 are compared in terms of pressure and temperature profiles averaged over the bed length for a cycle in Figure 6 and Figure 7, respectively. Both runs have a desorption pressure of 0.1 bar and a P/F ratio of 0.01. In the 2-bed, 6-step configuration (Run 18) the pressure equalizes in the bed at around 0.5 bar (Figure 7a). The largest temperature swing in a cycle is in the range 30–35 °C for both configurations, which is expected given the high CO2 content in the feed and the partial CO2 breakthrough in the bed at cyclic steady state.
Focusing on the best simulation runs in Table 3 and Table 4, CO2 purity and specific energy consumption against CO2 recovery trade-offs are shown in Figure 8 where the P/F ratio varied while the desorption pressure was fixed at 0.05 bar. The superiority of the 2-bed, 6-step configuration over the 2-bed, 4-step configuration is clearly visible. With a fixed CO2 recovery on the X-axis, the CO2 purity is 4.1% higher on average while the specific energy consumption is 4.8% lower on average.
This outcome is also confirmed by analysing the gas phase composition in the fixed beds at cyclic steady state. Figure 9 shows the profiles of CO2 and the other component mole fractions with respect to the dimensionless axial distance along the bed (z/Lb) at the end of the adsorption step for both VPSA configurations. In particular, the figure shows Run 1 as the optimal simulation for the 2-bed, 4-step cycle configuration and Run 15 as the optimal simulation for the 2-bed, 6-step cycle configuration, both of which have a CO2 purity greater than 95%. However, due to the pressure equalization step and the higher P/F ratio, Run 15 clearly exhibits sharper mass transfer zones (MTZ) than Run 1 so that the CO2 concentration front progresses less towards the product end at the end of the adsorption step (Figure 9a). This results in less CO2 being lost during the adsorption step, leading to a higher CO2 recovery during the blowdown step and the purge step (89.7% against 77.4%).
As already mentioned, a few studies in the literature designed and simulated VPSA CO2 capture processes applied to SMR-based hydrogen plant tail gas. Table 5 shows the performance comparison between such works and the VPSA systems designed in this study. For a fair comparison, all specific energy consumptions were evaluated considering 100% efficiency for the vacuum pump. The operating conditions reported in Golmakani et al. [22] are quite similar to those of the current study. Therefore, the lower CO2 purities and recoveries can be mainly explained by the poorer CO2 adsorption capacities and selectivities of the selected adsorbents, namely SAPO-34 zeolite, activated carbon and 5A zeolite, compared to NaX zeolite. The simulation runs reported by Shi et al. [23] achieved either a CO2 purity or a CO2 recovery greater than 95% and 90%, respectively, using silica gel and fixing the desorption pressure at 0.2 bar. Accordingly, the specific energy consumption was around half of the current study. The separation performance could be further improved by reducing the desorption pressure, but it should be noted that the authors considered a PSA tail gas feed with a CO mole fraction of only 1.5%, which is substantially lower than 14.7% used in this study. This large difference in impurity content in the feed would heavily affect the separation performance. In conclusion, the NaX zeolite-based 2-bed, 6-step configuration proposed in this study is so far one of the most promising VPSA processes able to achieve 95+% CO2 purity and 90+% CO2 recovery simultaneously, therefore serving as an efficient technology to decarbonize existing hydrogen plants and produce blue H2.

5. Conclusions

In this work, we designed and numerically investigated for the first time a VPSA process capable of capturing CO2 from the PSA tail gas of an industrial SMR-based hydrogen plant equipped with a conventional single stage high temperature WGS reactor. The PSA tail gas, having a CO2 concentration of 50+ mol%, is expected to be the most economically efficient carbon capture location to retrofit existing hydrogen plants via VPSA technology, thus allowing the production of blue H2. The VPSA systems were rigorously simulated by a mathematical model integrating mass, momentum and energy balances. The separation on NaX zeolite was assessed using the IAS theory coupled with the dual-site Langmuir model as well as a temperature-dependent LDF model.
Two different cycle configurations were investigated, namely a 2-bed, 4-step Skarstrom cycle and 2-bed, 6-step modified Skarstrom cycle with pressure equalization, as well as various operating conditions including the purge-to-feed ratio ranging 0–0.05 and the desorption pressure ranging 0.05–0.2 bar. We found that, with a desorption pressure of 0.05 bar, the 2-bed, 4-step configuration achieved 95.3% CO2 purity and 77.4% CO2 recovery while the 2-bed, 6-step configuration managed to reach 96.4% CO2 purity and 89.7% CO2 recovery. The bed productivity and the specific energy consumption of the latter configuration were 4.47 molCO2 h−1 kgads−1 and 639.7 kJ kgCO2−1, respectively. The benefit of incorporating the pressure equalization step in the adsorption cycle was also confirmed by analyzing the gas phase composition in the adsorption beds at cyclic steady state. Compared to similar works reported in the literature, the 2-bed, 6-step VPSA process proposed in this study showed superior separation performances, therefore serving as an efficient technology to decarbonize existing hydrogen plants and produce blue H2.
Future research will entail carrying out a rigorous economic analysis of the designed industrial VPSA unit to estimate CAPEX and OPEX other than the electric power consumption of the vacuum pumps. A techno-economic comparison with a VPSA unit designed to capture CO2 from the flue gas of the SMR-based hydrogen plant [16] would also be pivotal to quantify the extra cost associated with an increased CO2 capture rate.

Author Contributions

Conceptualization, M.L.; methodology, M.L.; software, M.L. and A.B.; investigation, M.L. and A.B.; writing—original draft preparation, M.L.; writing—review and editing, M.B. and M.C.; revised draft—review and editing, M.L., M.B. and M.C.; supervision, M.L. All authors have read and agreed to the published version of the manuscript.

Funding

This research received no external funding.

Institutional Review Board Statement

Not applicable.

Informed Consent Statement

Not applicable.

Data Availability Statement

Not applicable.

Conflicts of Interest

The authors declare no conflict of interest.

Nomenclature

AbBed surface area (m2)
b1,iEquilibrium constant of component i for site 1 (bar−1)
b2,iEquilibrium constant of component i for site 2 (bar−1)
b1,i,0Pre-exponential equilibrium constant coefficient of component i for site 1 (bar−1)
b2,i,0Pre-exponential equilibrium constant coefficient of component i for site 2 (bar−1)
ciGas phase concentration of component i (mol m−3)
cp,sAdsorbent particle specific heat capacity (J kg−1 K−1)
cT Total gas phase concentration (mol m−3)
CvValve flow coefficient (kg s−1 Pa−1/2)
DbBed diameter (m)
DmMolecular diffusivity (m2 s−1)
dP Adsorbent particle diameter (m)
DzAxial mass dispersion coefficient (m2 s−1)
FMass flowrate (kg s−1)
FiAssigned mass flowrate (kg s−1)
(–H1,i)Heat of adsorption of component i for site 1 (J mol−1)
(–H2,i)Heat of adsorption of component i for site 2 (J mol−1)
( Δ H ¯ i )Averaged heat of adsorption of component i (J mol−1)
HgGas phase enthalpy per unit volume (J m−3)
hwHeat transfer coefficient between the gas phase and the bed wall (W m−2 K−1)
JiDiffusive flux of component i (mol m−2 s−1)
JTThermal diffusive flux (W m−2)
kgGas thermal conductivity (W m−1 K−1)
kLDF,i LDF coefficient of component i (s−1)
k1,iFirst parameter of LDF coefficient linear equation of component i (s−1 K−1)
k2,iSecond parameter of LDF coefficient linear equation of component i (s−1)
kzAxial thermal dispersion coefficient (W m−1 K−1)
LbBed length (m)
madsAdsorbent mass (kg)
MWiMolecular weight of component i (kg mol−1)
PPressure (bar)
ΔPPressure difference (bar)
PadsAdsorption pressure (bar)
PatmAtmospheric pressure (bar)
PdesDesorption pressure (bar)
PiPartial pressure of component i (bar)
Pi0Surface pressure of component i (bar)
PrPrandtl number (–)
P/FPurge-to-feed ratio (–)
qi*Adsorbed phase concentration of component i at equilibrium (mol kg−1)
q ¯ i Averaged adsorbed phase concentration of component i (mol kg−1)
qs1,iSaturation capacity of component i for site 1 (mol kg−1)
qs2,iSaturation capacity of component i for site 2 (mol kg−1)
qTTotal adsorbed phase concentration (mol kg−1)
RIdeal gas constant (J mol−1 K−1)
ReReynolds number (–)
ScSchimdt number (–)
tTime (s)
tADAdsorption time (s)
tBDBlowdown time (s)
tcycleCycle time (s)
tDPEDepressurizing pressure equalization time (s)
tPPEPressurizing pressure equalization time (s)
tPRFeed pressurization time (s)
tPUPurge time (s)
TTemperature (K)
TwBed wall temperature (K)
uInterstitial gas velocity (m s−1)
UgGas phase internal energy per unit volume (J m−3)
UsAdsorbent particle internal energy per unit volume (J m−3)
VSPValve stem position (–)
xi Adsorbed phase molar fraction of component i (–)
yi Gas phase molar fraction of component i (–)
zAxial distance along the bed (m)
Greek letters
γRatio of specific heat capacities cp/cv (–)
εExternal bed void fraction (–)
εpAdsorbent particle void fraction (–)
ηVacuum pump efficiency (–)
μGas viscosity (Pa s)
ρgGas density (kg m−3)
ρsAdsorbent particle density (kg m−3)
ψeqReduced grand potential at equilibrium (mol kg−1)
ψiReduced grand potential of component i (mol kg−1)

References

  1. IEA. Global Energy Review: CO2 Emissions in 2020. 2021. Available online: https://www.iea.org/articles/global-energy-review-co2-emissions-in-2020 (accessed on 28 December 2021).
  2. IEA. The Future of Hydrogen. 2019. Available online: https://www.iea.org/reports/the-future-of-hydrogen (accessed on 28 December 2021).
  3. BEIS. UK Hydrogen Strategy. 2021. Available online: https://www.gov.uk/government/publications/uk-hydrogen-strategy (accessed on 28 December 2021).
  4. Meyers, R.A. Handbook of Petroleum Refining Processes, 3rd ed.; McGraw-Hill: New York, NY, USA, 2004. [Google Scholar]
  5. Collodi, G. Hydrogen production via steam reforming with CO2 capture. Chem. Eng. Trans. 2010, 19, 37–42. [Google Scholar]
  6. Meerman, J.C.; Hamborg, E.S.; van Keulen, T.; Ramirez, A.; Turkenburg, W.C.; Faaij, A.P.C. Techno-economic assessment of CO2 capture at steam methane reforming facilities using commercially available technology. Int. J. Greenh. Gas Control 2012, 9, 160–171. [Google Scholar] [CrossRef]
  7. Voss, C. CO2 removal by PSA: An industrial view on opportunities and challenges. Adsorption 2014, 20, 295–299. [Google Scholar] [CrossRef]
  8. IEA. The Shell Quest Carbon Capture and Storage Project. 2019. Available online: https://ieaghg.org/publications/technical-reports/reports-list/9-technical-reports/949-2019-04-the-shell-quest-carbon-capture-and-storage-project (accessed on 28 December 2021).
  9. IEA. The Carbon Capture Project at Air Products’ Port Arthur Hydrogen Production Facility. 2018. Available online: https://ieaghg.org/publications/technical-reports/reports-list/9-technical-reports/956-2018-05-the-ccs-project-at-air-products-port-arthur-hydrogen-production-facility (accessed on 28 December 2021).
  10. IEA. Reference Data and Supporting Literature Review for SMR Based Hydrogen Production with CCS. 2017. Available online: https://ieaghg.org/publications/technical-reports/reports-list/10-technical-reviews/778-2017-tr3-reference-data-supporting-literature-reviews-for-smr-based-hydrogen (accessed on 28 December 2021).
  11. Park, J.H.; Beum, H.T.; Kim, J.N.; Cho, S.H. Numerical analysis on the power consumption of the PSA process for recovering CO2 from flue gas. Ind. Eng. Chem. Res. 2002, 41, 4122–4131. [Google Scholar] [CrossRef]
  12. Xiao, P.; Zhang, J.; Webley, P.; Li, G.; Singh, R.; Todd, R. Capture of CO2 from flue gas streams with zeolite 13X by vacuum-pressure swing adsorption. Adsorption 2008, 14, 575–582. [Google Scholar] [CrossRef]
  13. Luberti, M.; Oreggioni, G.D.; Ahn, H. Design of a rapid vacuum pressure swing adsorption process for post-combustion CO2 capture from a biomass-fuelled CHP plant. J. Environ. Chem. Eng. 2017, 5, 3973–3982. [Google Scholar] [CrossRef]
  14. Ruthven, D.M.; Farooq, S.; Knaebel, K.S. Pressure Swing Adsorption; VCH Publishers: New York, NY, USA, 1994. [Google Scholar]
  15. Figueroa, J.D.; Fout, T.; Plasynski, S.; McIlvried, H.; Srivastava, R.D. Advances in CO2 capture technology—The U.S. Department of Energy’s Carbon Sequestration Program. Int. J. Greenh. Gas Control 2008, 2, 9–20. [Google Scholar] [CrossRef]
  16. Capocelli, M.; Luberti, M.; Inno, S.; D’Antonio, F.; Di Natale, F.; Lancia, A. Post-combustion CO2 capture by RVPSA in a large-scale steam reforming plant. J. CO2 Util. 2019, 32, 53–65. [Google Scholar] [CrossRef]
  17. Oreggioni, G.D.; Brandani, S.; Luberti, M.; Baykan, Y.; Friedrich, D.; Ahn, H. CO2 capture from syngas by an adsorption process at a biomass gasification CHP plant: Its comparison with amine-based CO2 capture. Int. J. Greenh. Gas Control 2015, 35, 71–81. [Google Scholar] [CrossRef] [Green Version]
  18. Liu, B.; Yu, X.; Shi, W.; Shen, Y.; Zhang, D.; Tang, Z. Two-stage VSA/PSA for capturing carbon dioxide (CO2) and producing hydrogen (H2) from steam methane reforming gas. Int. J. Hydrogen Energy 2020, 45, 24870–24882. [Google Scholar] [CrossRef]
  19. Sircar, S.; Kratz, W.C. Simultaneous production of hydrogen and carbon dioxide from steam reformer off-gas by pressure swing adsorption. Sep. Sci. Technol. 1988, 23, 2397–2415. [Google Scholar] [CrossRef]
  20. Streb, A.; Hefti, M.; Gazzani, M.; Mazzotti, M. Novel adsorption process for co-production of hydrogen and CO2 from a multicomponent stream. Ind. Eng. Chem. Res. 2019, 58, 17489–17506. [Google Scholar] [CrossRef] [Green Version]
  21. Streb, A.; Mazzotti, M. Novel adsorption process for co-production of hydrogen and CO2 from a multicomponent stream—Part 2: Application to steam methane reforming and autothermal reforming gases. Ind. Eng. Chem. Res. 2020, 59, 10093–10109. [Google Scholar] [CrossRef]
  22. Golmakani, A.; Fatemi, S.; Tamnanloo, J. CO2 capture from the tail gas of hydrogen purification unit by vacuum swing adsorption process, using SAPO-34. Ind. Eng. Chem. Res. 2016, 55, 334–350. [Google Scholar] [CrossRef]
  23. Shi, W.; Yang, H.; Shen, Y.; Fu, Q.; Zhang, D.; Fu, B. Two-stage PSA/VSA to produce H2 with CO2 capture via steam methane reforming (SMR). Int. J. Hydrogen Energy 2018, 43, 19057–19074. [Google Scholar] [CrossRef]
  24. Mhaskar, P.R.; Moharir, A.S. Heuristics for synthesis and design of pressure-swing adsorption processes. Adsorption 2012, 18, 275–295. [Google Scholar] [CrossRef]
  25. Brea, P.; Delgado, J.A.; Agueda, V.I.; Gutierrez, P.; Uguina, M.A. Multicomponent adsorption of H2, CH4, CO and CO2 in zeolites NaX, CaX and MgX. Evaluation of performance in PSA cycles for hydrogen purification. Microporous Mesoporous Mater. 2019, 286, 187–198. [Google Scholar] [CrossRef]
  26. Wang, L.; Liu, Z.; Li, P.; Wang, J.; Yu, J. CO2 capture from flue gas by two successive VPSA units using 13XAPG. Adsorption 2012, 18, 445–459. [Google Scholar] [CrossRef]
  27. Krishnamurthy, S.; Rao, V.R.; Guntuka, S.; Sharratt, P.; Haghpanah, R.; Rajendran, A.; Amanullah, M.; Karimi, I.A.; Farooq, S. CO2 capture from dry flue gas by vacuum swing adsorption: A pilot plant study. AIChE J. 2014, 60, 1830–1842. [Google Scholar] [CrossRef]
  28. Luberti, M.; Friedrich, D.; Brandani, S.; Ahn, H. Design of a H2 PSA for cogeneration of ultrapure hydrogen and power at an advanced integrated gasification combined cycle with pre-combustion capture. Adsorption 2014, 20, 511–524. [Google Scholar] [CrossRef] [Green Version]
  29. Luberti, M.; Ahn, H. Design of an industrial multi-bed (V)PSA unit for argon concentration. Sep. Purif. Technol. 2021, 261, 118254. [Google Scholar] [CrossRef]
  30. Luberti, M.; Kim, Y.-H.; Lee, C.-H.; Ferrari, M.-C.; Ahn, H. New momentum and energy balance equations considering kinetic energy effect for mathematical modelling of a fixed bed adsorption column. Adsorption 2015, 21, 353–363. [Google Scholar] [CrossRef] [Green Version]
  31. Ergun, S. Fluid flow through packed columns. Chem. Eng. Prog. 1952, 48, 89–94. [Google Scholar]
  32. Myers, A.L.; Prausnitz, J.M. Thermodynamics of mixed-gas adsorption. AIChE J. 1965, 11, 121–127. [Google Scholar] [CrossRef]
  33. Santori, G.; Luberti, M. Thermodynamics of thermally-driven adsorption compression. Sustain. Mater. Technol. 2016, 10, 1–9. [Google Scholar] [CrossRef] [Green Version]
  34. OriginLab. 2019. Available online: https://www.originlab.com/ (accessed on 28 December 2021).
  35. Wakao, N.; Funazkri, T. Effect of fluid dispersion coefficients on particle-to-fluid mass transfer coefficients in packed beds. Chem. Eng. Sci. 1978, 33, 1375–1384. [Google Scholar] [CrossRef]
  36. Specchia, V.; Baldi, G.; Sicardi, S. Heat transfer in packed bed reactors with one phase flow. Chem. Eng. Commun. 1980, 4, 361–380. [Google Scholar] [CrossRef]
  37. Process System Enterprise Ltd. 2020. Available online: https://www.psenterprise.com/ (accessed on 28 December 2021).
  38. Liu, Z.; Grande, C.A.; Li, P.; Yu, J.; Rodrigues, A.E. Multi-bed vacuum pressure swing adsorption for carbon dioxide capture from flue gas. Sep. Purif. Technol. 2011, 81, 307–317. [Google Scholar] [CrossRef]
  39. IEA. Techno-Economic Evaluation of SMR Based Standalone (Merchant) Hydrogen Plant with CSS. 2017. Available online: https://ieaghg.org/component/content/article/49-publications/technical-reports/784-2017-02-smr-based-h2-plant-with-ccs (accessed on 28 December 2021).
  40. Yang, R.T. Gas Separation by Adsorption Processes; Butterworths: Boston, MA, USA, 1987. [Google Scholar]
Figure 1. Block flow diagram for the SMR process. Carbon capture technologies can be applied at the locations marked with a red arrow.
Energies 15 01091 g001
Figure 2. Configuration of the 2-bed, 4-step Skarstrom cycle (AD: Adsorption, BD: Blowdown, PU: Purge, PR: Feed pressurization; tAD = tPU = 250 s, tBD = tPR = 50 s).
Energies 15 01091 g002
Figure 3. Configuration of the 2-bed, 6-step modified Skarstrom cycle with pressure equalization (AD: Adsorption, DPE: Depressurizing pressure equalization, BD: Blowdown, PU: Purge, PPE: Pressurizing pressure equalization, PR: Feed pressurization; tAD = tPU = 250 s, tBD = tPR = 50 s, tDPE = tPPE = 25 s).
Energies 15 01091 g003
Figure 4. Evolution of the KPIs of the 2-bed, 4-step VPSA with the purge-to-feed ratio and desorption pressure: (a) CO2 purity; (b) CO2 recovery; (c) Specific energy consumption; (d) Bed productivity.
Energies 15 01091 g004
Figure 5. Evolution of the KPIs of the 2-bed, 6-step VPSA with the purge-to-feed ratio and desorption pressure: (a) CO2 purity; (b) CO2 recovery; (c) Specific energy consumption; (d) Bed productivity.
Energies 15 01091 g005
Figure 6. Profiles of (a) pressure and (b) temperature averaged over the bed length for a cycle at the cyclic steady state of the 2-bed, 4-step VPSA (Run 6).
Energies 15 01091 g006
Figure 7. Profiles of (a) pressure and (b) temperature averaged over the bed length for a cycle at the cyclic steady state of the 2-bed, 6-step VPSA (Run 18).
Energies 15 01091 g007
Figure 8. CO2 purity and specific energy consumption against CO2 recovery for the VPSA process with varying purge-to-feed ratio and desorption pressure at 0.05 bar.
Energies 15 01091 g008
Figure 9. Profiles of (a) CO2 mole fraction and (b) other component mole fractions along the dimensionless axial bed distance at the end of the adsorption step for the 2-bed, 4-step VPSA (Run 1) and the 2-bed, 6-step VPSA (Run 15).
Energies 15 01091 g009
Table 1. Equilibrium and kinetic parameters for NaX zeolite. Data were regressed from [25].
Equilibrium Parameter
(Dual-Site Langmuir Isotherm)
qs1/qs2
(mol kg−1)
b01/b02
(bar−1)
(–ΔH1)/(–ΔH2)
(J mol−1)
H24.529/02.431 × 10−4/07018/0
CH44.529/08.313 × 10−5/016,294/0
CO4.529/09.411 × 10−5/018,182/0
CO22.500/2.0293.521 × 10−5/6.318 × 10−632,244/30,937
Kinetic Parameter
(kLDF = k1 × T + k2)
k1
(s−1 K−1)
k2
(s−1)
H20100
CH40.0115−2.8561
CO0.0137–3.6086
CO20.0099–2.8631
Table 2. Adsorbent parameters, bed parameters, valve parameters and operating conditions for the VPSA process.
Adsorbent Parameters
ρs (kg m−3)1256 [25]
εp (–)0.404 [25]
cp,s (J kg−1 K−1)920 [13]
dp (m)2.5 × 10⁻³ [13]
Bed Parameters
Lb (m)4.5 (2-bed, 4-step); 6.0 (2-bed, 6-step)
Db (m)3.0
ε (–)0.53 [25]
Dz (m2 s−1)1.5 × 10⁻³
kz (W m−1 K−1)1.4
hw (W m−2 K−1)55.1
Valve Parameters
Cv (kg s−1 Pa−1/2)1.0 × 10−3 (feed)
1.0 × 10⁻³ (product)
5.0 × 10⁻³ (blowdown)
1.5 × 10⁻³ (purge top)
5.0 × 10⁻³ (purge bottom)
3.0 × 10⁻⁴ (equalization)
Operating Conditions
Feed composition (mol%)23.87% H2; 10.15% CH4; 14.65% CO; 51.34% CO2
Adsorption pressure (bar)1.3
Desorption pressure (bar)0.05–0.2
Purge-to-feed ratio (–)0–0.05
Feed temperature (K)301.15
Molar feed flowrate (mol s−1)146.27 (per PSA train)
Volumetric feed flowrate (m3 s−1)2.82 (per PSA train)
Table 3. Performance results of the 2-bed, 4-step VPSA process.
Run
#
Pdes
(bar)
P/F Ratio
(–)
CO2 Purity (%)CO2 Recovery (%)Specific Energy Consumption (kJ kgCO2−1)Bed Productivity (molCO2 h−1 kgads−1)
Run 10.05095.377.4649.15.57
Run 20.0194.580.7654.75.81
Run 30.0392.185.0671.76.12
Run 40.0589.788.0691.36.33
Run 50.1093.860.1475.24.33
Run 60.0193.466.5477.04.79
Run 70.0391.372.8488.75.24
Run 80.0589.077.0501.75.54
Run 90.2089.937.5327.32.70
Run 100.0190.245.9324.13.30
Run 110.0389.153.7330.13.86
Run 120.0587.058.8338.14.23
Table 4. Performance results of the 2-bed, 4-step VPSA process.
Run
#
Pdes
(bar)
P/F Ratio
(–)
CO2 Purity (%)CO2 Recovery (%)Specific Energy Consumption (kJ kgCO21)Bed Productivity (molCO2 h1 kgads1)
Run 130.05099.184.2621.54.20
Run 140.0198.586.1625.44.29
Run 150.0396.489.7639.74.47
Run 160.0594.192.4657.84.60
Run 170.1098.569.1450.93.44
Run 180.0197.973.2453.53.65
Run 190.0395.879.0463.93.94
Run 200.0593.683.1476.44.14
Run 210.2096.145.3305.12.26
Run 220.0195.951.1305.72.55
Run 230.0394.159.3311.92.95
Run 240.0591.964.8319.93.23
Table 5. Performance comparison of CO2 capture processes applied to SMR-based hydrogen plant tail gas using VPSA technology.
Cycle ConfigurationAdsorbentPads
(bar)
Pdes
(bar)
P/F Ratio
(–)
CO2
Purity
(%)
CO2
Recovery
(%)
Specific Energy Consumption (kJ kgCO21) 1Bed Productivity (molCO2 h1 kgads1)Reference
2-bed, 4-stepNaX zeolite1.30.05095.377.4259.65.57This study
2-bed, 6-step0.0396.489.7255.94.47
4-bed, 7-stepSAPO-34 zeolite4.00.050.0390.573.5305.03.34[22]
Activated carbon86.256.8369.03.14
5A zeolite88.175.9284.03.61
3-bed, 5-stepSilica gel2.00.2N/A97.182.6133.3N/A[23]
88.697.8133.6
1 All values were evaluated considering 100% efficiency for the vacuum pump.
Publisher’s Note: MDPI stays neutral with regard to jurisdictional claims in published maps and institutional affiliations.

