Article

Natural Gas Scarcity Risk for Countries along the Belt and Road

1
Center of Energy Development and Environmental Protection, Jiangsu University, Zhenjiang 212013, China
2
School of Mathematical Sciences, Jiangsu University, Zhenjiang 212013, China
3
School of Mathematical Sciences, Nanjing Normal University, Nanjing 210042, China
4
Física de Materiais, Universidade de Pernambuco, Recife 50720-001, Brazil
5
Center for Polymer Studies and Department of Physics, Boston University, Boston, MA 02215, USA
6
The Physics Department, School of Arts & Sciences, Boston University, Boston, MA 02215, USA
*
Author to whom correspondence should be addressed.
Energies 2022, 15(3), 1053; https://doi.org/10.3390/en15031053
Submission received: 14 November 2021 / Revised: 31 December 2021 / Accepted: 25 January 2022 / Published: 31 January 2022

Abstract

:
The rapid development of the Belt and Road economics has generated a considerable energy demand. Under the general trend of the global energy transition, natural gas resources are becoming the main driving force. The limited natural gas resources are posing a significant risk to economies, and this risk may also be transferred to other distant regions through economic trade. The aim of this study is to explore the trans-regional (sectoral) transmission pattern of natural gas scarcity risk. The main contribution of this paper is the assessment of the local natural gas scarcity risk (LGSR) and cross-region transfer relationship of embodied natural gas scarcity risk (EGSR), which are evaluated for the BRI economies. In addition, the network amplification effect is considered when evaluating the cross-regional impact of natural gas scarcity risk. The results show that, at the national level, Turkey, Ukraine, and Bulgaria have significant EGSR related to exports activities. The natural gas scarcity risks (GSRs) originating from these countries are mainly transferred to Turkmenistan, Georgia, and Albania, with large EGSR imports. Moreover, by comparing the ranking changes of EGSR imports, EGSR exports, and LGSRs at the national and sectoral levels, countries or sectors with higher LGSRs also have higher EGSR exports. The Top EGSR import and export network consisting of top EGSR flow relationships can well reflect countries’ preferences in choosing EGSR transfer partners. The results suggest that upstream countries and sectors should strengthen cooperation to manage natural gas resources, and provide references for decision makers in highly vulnerable downstream countries and sectors to formulate strategies to avoid the large-scale spread of economic losses caused by natural gas scarcity.

1. Introduction

The world’s energy development is entering a new historical phase, and the demand for clean and low-carbon energy is inevitable [1]. As a low-carbon fossil energy source, natural gas has emerged as a widely accepted pathway for reducing global CO 2 emissions. According to IEA, global natural gas imports increased rapidly from 2.5 × 10 7 TJ in 2000 to 4.8 × 10 7 TJ in 2019 with an average annual growth rate of 3.36% [2]. By 2040, natural gas consumption is expected to account for 40% of the total energy consumption in the USA, and its consumption will increase to an astounding 65%, surpassing oil as the dominant fuel [3]. There is increasing awareness that natural gas is playing an increasingly decisive role in the global economy [4].
Since 2013, China has proposed the Belt and Road Initiative (BRI), aiming to accelerate sustainable development and provide a new paradigm for win–win cooperation at the global and regional levels [5]. Many countries along the BRI (e.g., Russia, Saudi Arabia, Qatar, Malaysia, Israel, and Indonesia) are rich in natural gas resources. In fact, by the end of 2019, the proven reserves of natural gas in the countries along the Belt and Road were approximately 159.6 trillion cubic meters, accounting for 80.3% of the global total. The production of natural gas in these countries is approximately 1.98 trillion cubic meters, accounting for 53.7% of the global total [3]. In recent decades, due to the internal and external imbalances of the supply chain caused by terrorist attacks, economic crises, and natural disasters, the supply of natural gas has been interrupted, which has brought tremendous losses to enterprises, supply chains, and society. For example, Ukraine is short of natural gas reserves, and about three-quarters of the natural gas consumed every year depends on imports from Russia. In addition, about a quarter of the natural gas in EU countries is imported from Russia, and about 80% of it is delivered through Ukraine. The dispute between Russia and Ukraine over gas prices and transit fees has lasted for many years. The Russian–Ukrainian natural gas crisis in 2009 was the most severe. During the mid-winter, all natural gas supplies from Russia to Ukraine were interrupted for three weeks, which had a serious impact on the economies of Central and Eastern Europe [6]. While an immediate issue is the security of supply in those countries where natural gas is in short supply, it is equally important to map their impact on the overall economic system.
Existing studies of natural gas transfer flows only emphasize the endowment conditions of natural gas resources, and ignore the potential loss of economic output in sectors with insufficient natural gas supply and the loss that affects various economies through the global supply chain [4,7,8]. In fact, the reduction of natural gas supply in a region that is already facing a shortage of natural gas resources may cause production losses in some energy-intensive sectors. Because of the intertwined links between the world economy, this may lead to indirect impacts on production in regions that have not directly experienced natural gas resource shortages. In other words, the limited natural gas resources are posing a significant risk to the economies, and the risk may also be transferred to other distant regions through economic trade. Therefore, it is necessary to explore the patterns of natural gas scarcity induced in the world trading system. However, to the best of our knowledge, there exist no studies on the embodied natural gas scarcity risk transmission of the Belt and Road economies. To this end, based on the current situation of economic output and consumption of natural gas in countries (sectors) along the Belt and Road, this paper studies the trans-regional (sectoral) transmission pattern of natural gas scarcity risk to fill gap in this field.
This work attempts to address the following two issues: (1) How does one evaluate the local natural gas scarcity risks in countries along the “Belt and Road”? (2) How does one address the risk of transmission path and indirect effect of natural gas scarcity in the trade of the Belt and Road countries?

2. Literature Review

To describe the interaction between different industries and sectors of the economic system, the multi-regional input–output (MRIO) analysis provides a valuable analysis tool by building a set of economic input–output equations and tables [9]. Considering regional characteristics and sectoral differences, MRIO is applied to study regional heterogeneity [10]. MRIO can track the flow footprint of water, energy, metal, other resources, and carbon emissions embodied in trade between regions [4,11,12,13,14,15,16]. For example, Kan applied the MRIO analysis to ascertain natural gas use from primary suppliers to final consumers via the relationships by producers in the world economy [4]. White used multi-regional input–output analysis to track virtual water flow in the inter-regional trade of the Haihe River Basin and its impact on the hydro system. He points out that caution is needed when importing virtual water to avoid putting significant water pressure on other regions [16]. Wang assessed the impact of water scarcity in the BRI countries based on the MRIO model and the water stress index. The results show that water scarcity changes the trade balance between China and certain countries [17].
However, it is a big challenge to quantify the role of regions and sectors in the supply chain and the contributions of the structural roles of regions and sectors to resource transfer. Emphasizing the system structure and analyzing the system function from the structural perspective is the research idea of complex network theory. So far, complex network theory has been universally applied in many scientific fields such as economics [18], finance and trading [19], energy [20,21,22], climate [23,24]. The existing literature showed that complex network method significant provides a systematic perspective and theoretical tool for understanding the basic laws and features of both theoretical and realistic networks [25]. Recently, MRIO analysis and complex network methods have been combined to reveal the structural characteristics of embodied water, energy, metals, and other resource flow networks at national, regional, and sectoral levels [26,27,28,29,30,31,32,33]. Chen combined the complex network analysis tools and MRIO to study the embodied energy flow network structure at global, regional, and national levels [28]. Liang applied the complex network model to study the structural characteristics of the global embodied metal flow network. The results show that the network has apparent small-world nature and the scope and intensity of the influence of various sectors on economic activities are different [31]. Wang built an embodied rare earth flow network model based on the MRIO analysis framework and complex network method, where the community structure and small-world phenomena were analyzed [9]. These studies show that due to the interconnectedness of the global economy, economic activities in one region (sector) can affect the use of resources in another region (sector). That is to say, the risk of resource scarcity in one region (sector) can be transmitted to distant downstream sectors through trade networks, causing economic losses. However, current literature rarely quantifies the risk of resource scarcity in reducing the economic output. In fact, the risk of scarcity of resources will cause supply chain risks in the overall economic system. Zhao identified the most prominent virtual water scarcity risk exports under two climate change scenarios [34] and quantified the water scarcity risk related to the potential loss in economic output of each province-sector [35]. Liu proposed a modeling framework based on the MRIO analysis to track the transmission of water–energy scarcity risk, where water–energy insufficiency induced economic loss to downstream industries and sectors through the reduced supply of inputs, addressing the risk propagation path and indirect effect of water–energy scarcity risk in a national trade system [36].
The above research provides a methodological basis for quantifying natural gas scarcity risk in countries along the Belt and Road. This study devised a natural gas stress index to reflect a country’s dependence on natural gas imports. The local natural gas scarcity risk in each nation/sector is then accounted, combined with the economic output and natural gas consumption of each nation/sector. The MRIO model is applied to assess the impact of natural gas scarcity risk on downstream nations/sectors through the supply chain. The leading risk importers and exporters in countries and sectors are identified and the transmission paths of natural gas scarcity risk are explored. Economic activities are affected in gas-intensive industries and in many sectors that use embodied natural gas resources. This exploration assists policymakers in understanding the impact of changes in natural gas resources on human society.

3. Materials and Methods

In this paper, natural gas scarcity risk (GSR) means the possible losses of economic output caused by natural gas scarcity, including direct output loss (local natural gas scarcity risk, LGSR) and indirect output loss (embodied natural gas scarcity risk, EGSR). We develop a method based on the framework proposed by [37] to quantify the natural gas scarcity risk LGSR and EGSR. In estimating of LGSR, the loss caused by natural gas scarcity can be evaluated by combining the probability of natural gas scarcity in a country, sectoral dependence, and the total output of each sector. The probability of natural gas scarcity (GP) indicates the proportion of the potential reduction in natural gas usage due to natural gas scarcity, which is related to the corresponding natural gas stress index (GSI) of a country. On the other side, the sectoral dependence of natural gas (GD) echoes the economic output loss of a sector, measured by its natural gas intensity (GI). The embodied natural gas scarcity risk (EGSR) transmitted through international trade can be estimated based on LSGR and MRIO. The method explores issues related to threats in the economic system, rather than precise monetary assessments.

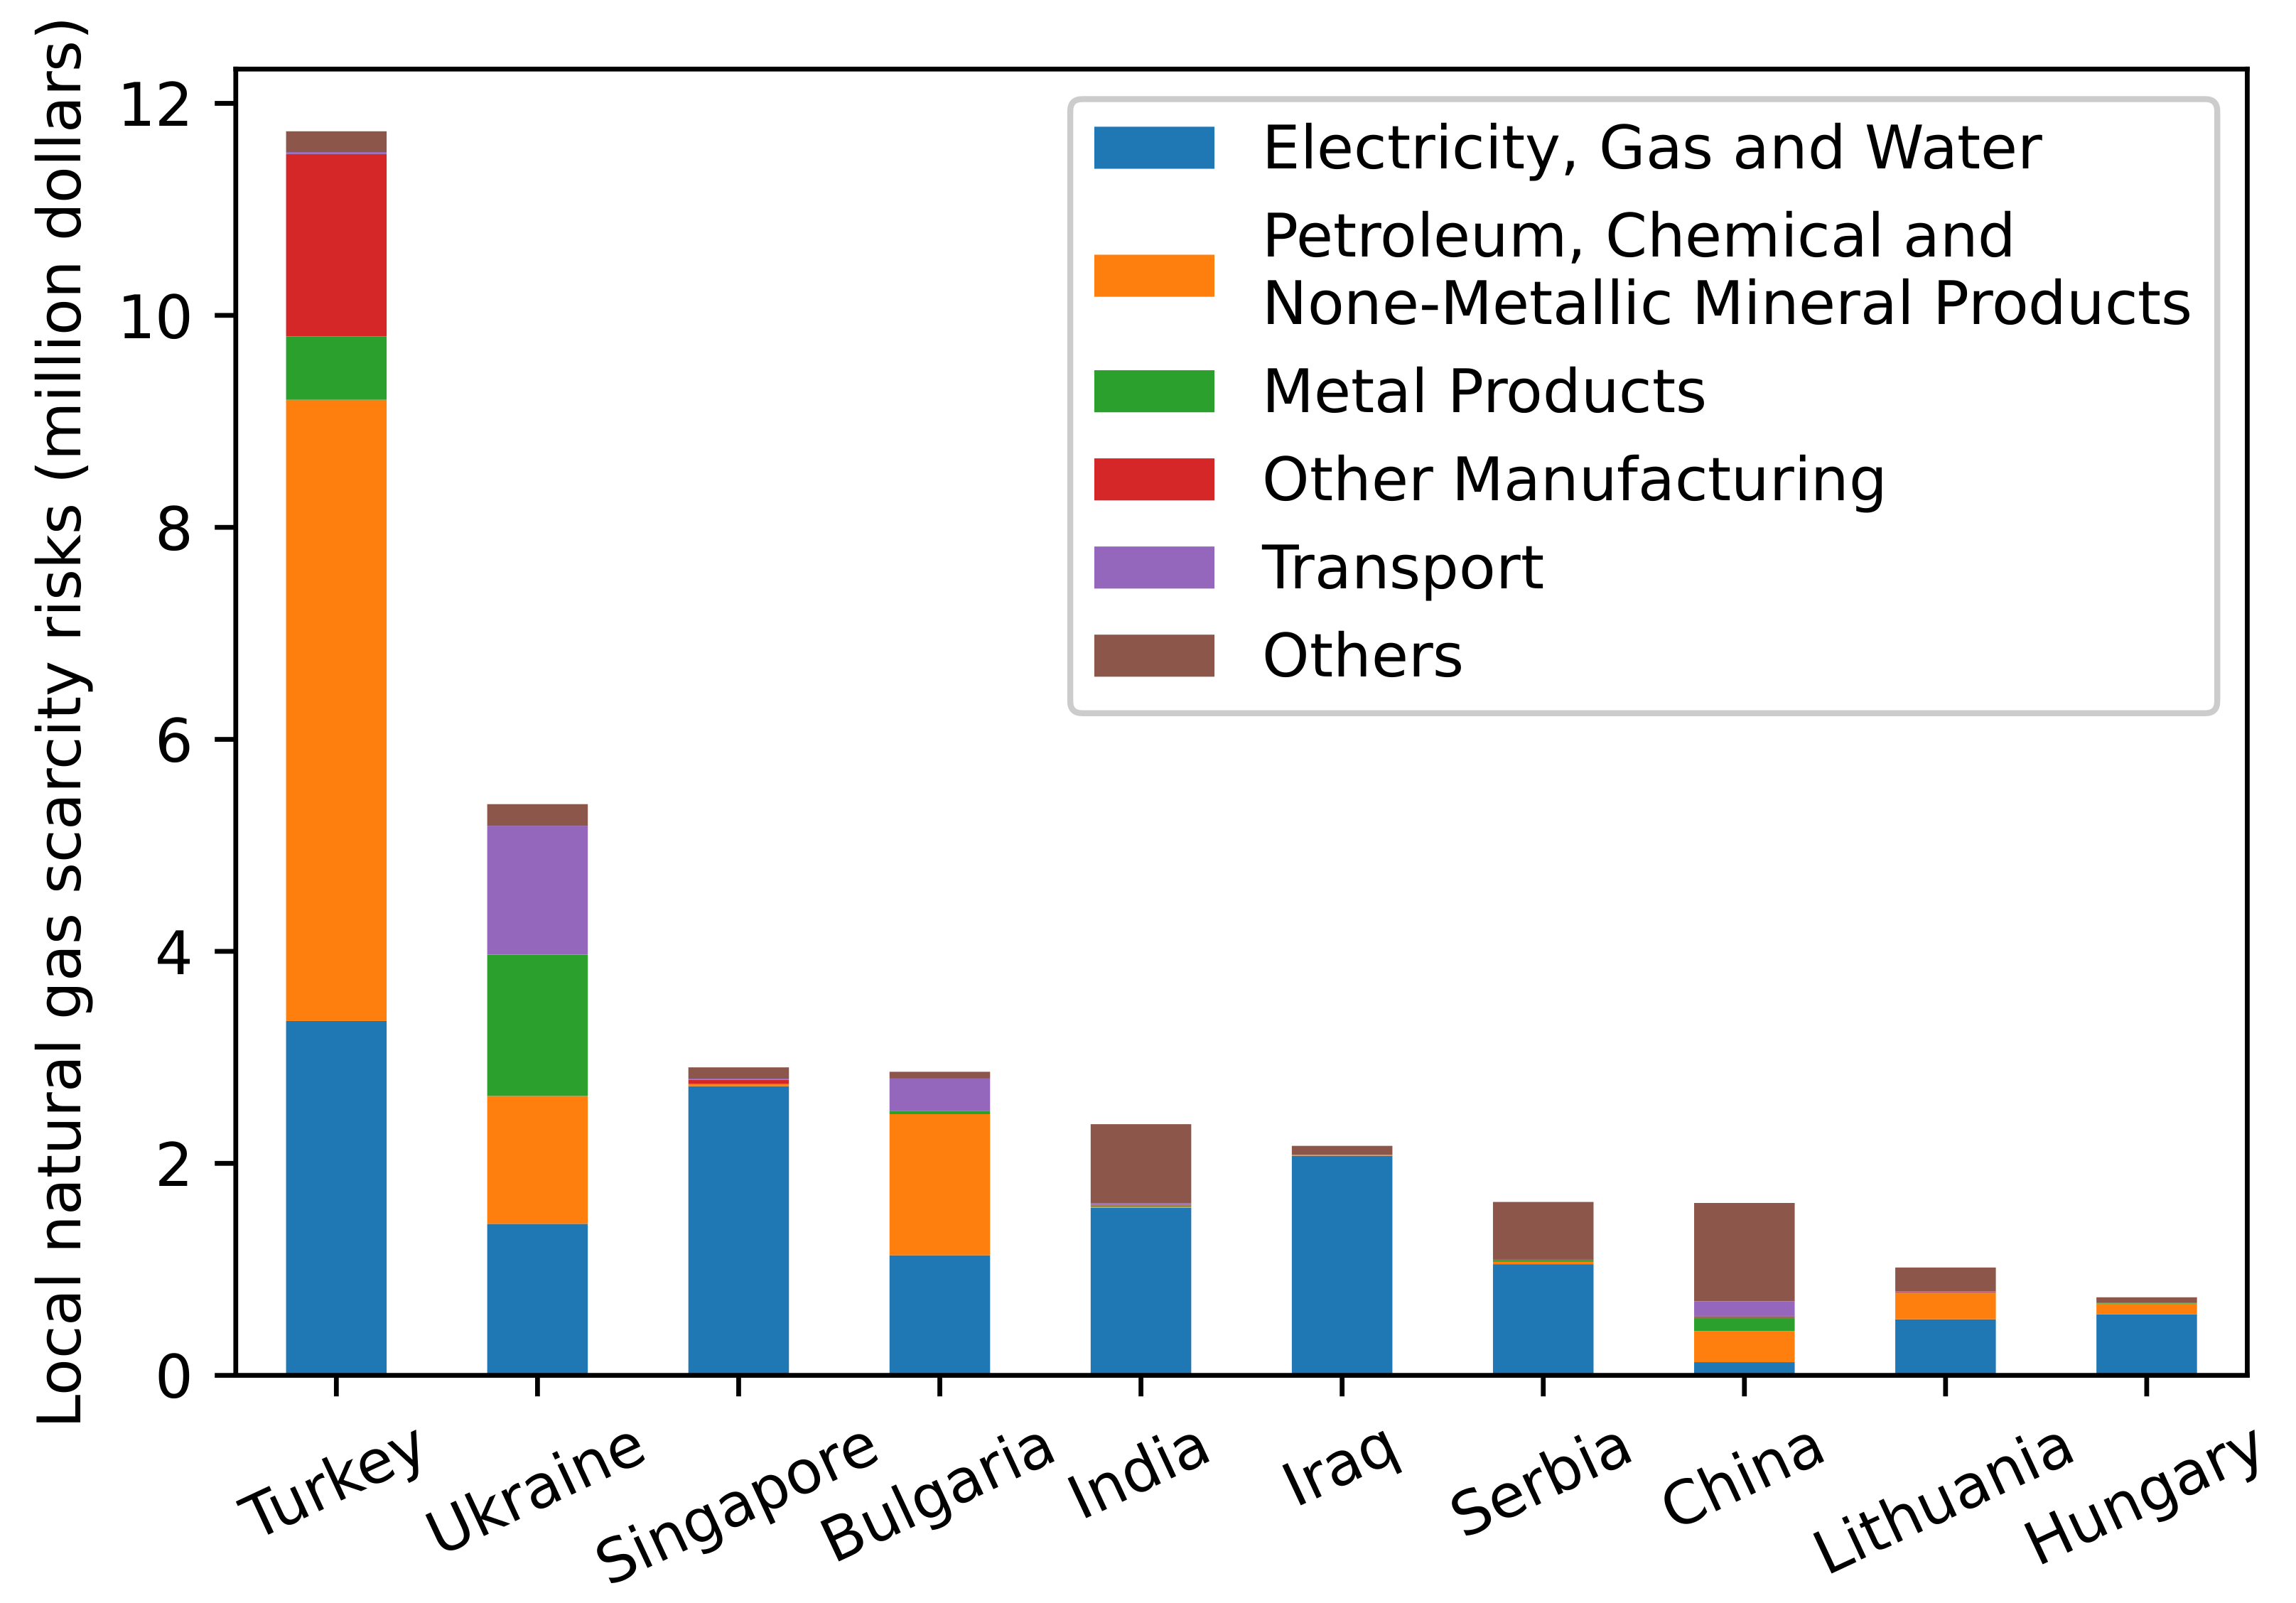
3.1. Local Natural Gas Scarcity Risk (LGSR)

In areas with strong gas consumption, the economic activities of natural gas-intensive sectors are easily affected. The resulting financial losses depend on the total output of the economic sector and its natural gas dependence. Based on this assumption, the local natural gas scarcity risk (LGSR) can be quantified by Equation (1) [37]:
L G S R s , c = G P c × G D s × x s , c ,
where L G S R s , c represents the potential economic loss of sector s in country c due to local natural gas scarcity. G P c indicates the probability of natural gas scarcity in country c, thus evaluating the possible reduction in its natural gas consumption in country c. G D s represents the dependence on natural gas of sector s. x k , c is the economic output of sector s in country c under the condition of sufficient natural gas resources. The evaluation of G P c and G D s is presented in the following sections. Within this framework, the 1 × n vector LGSR contains the local natural gas scarcity risk of each sector.

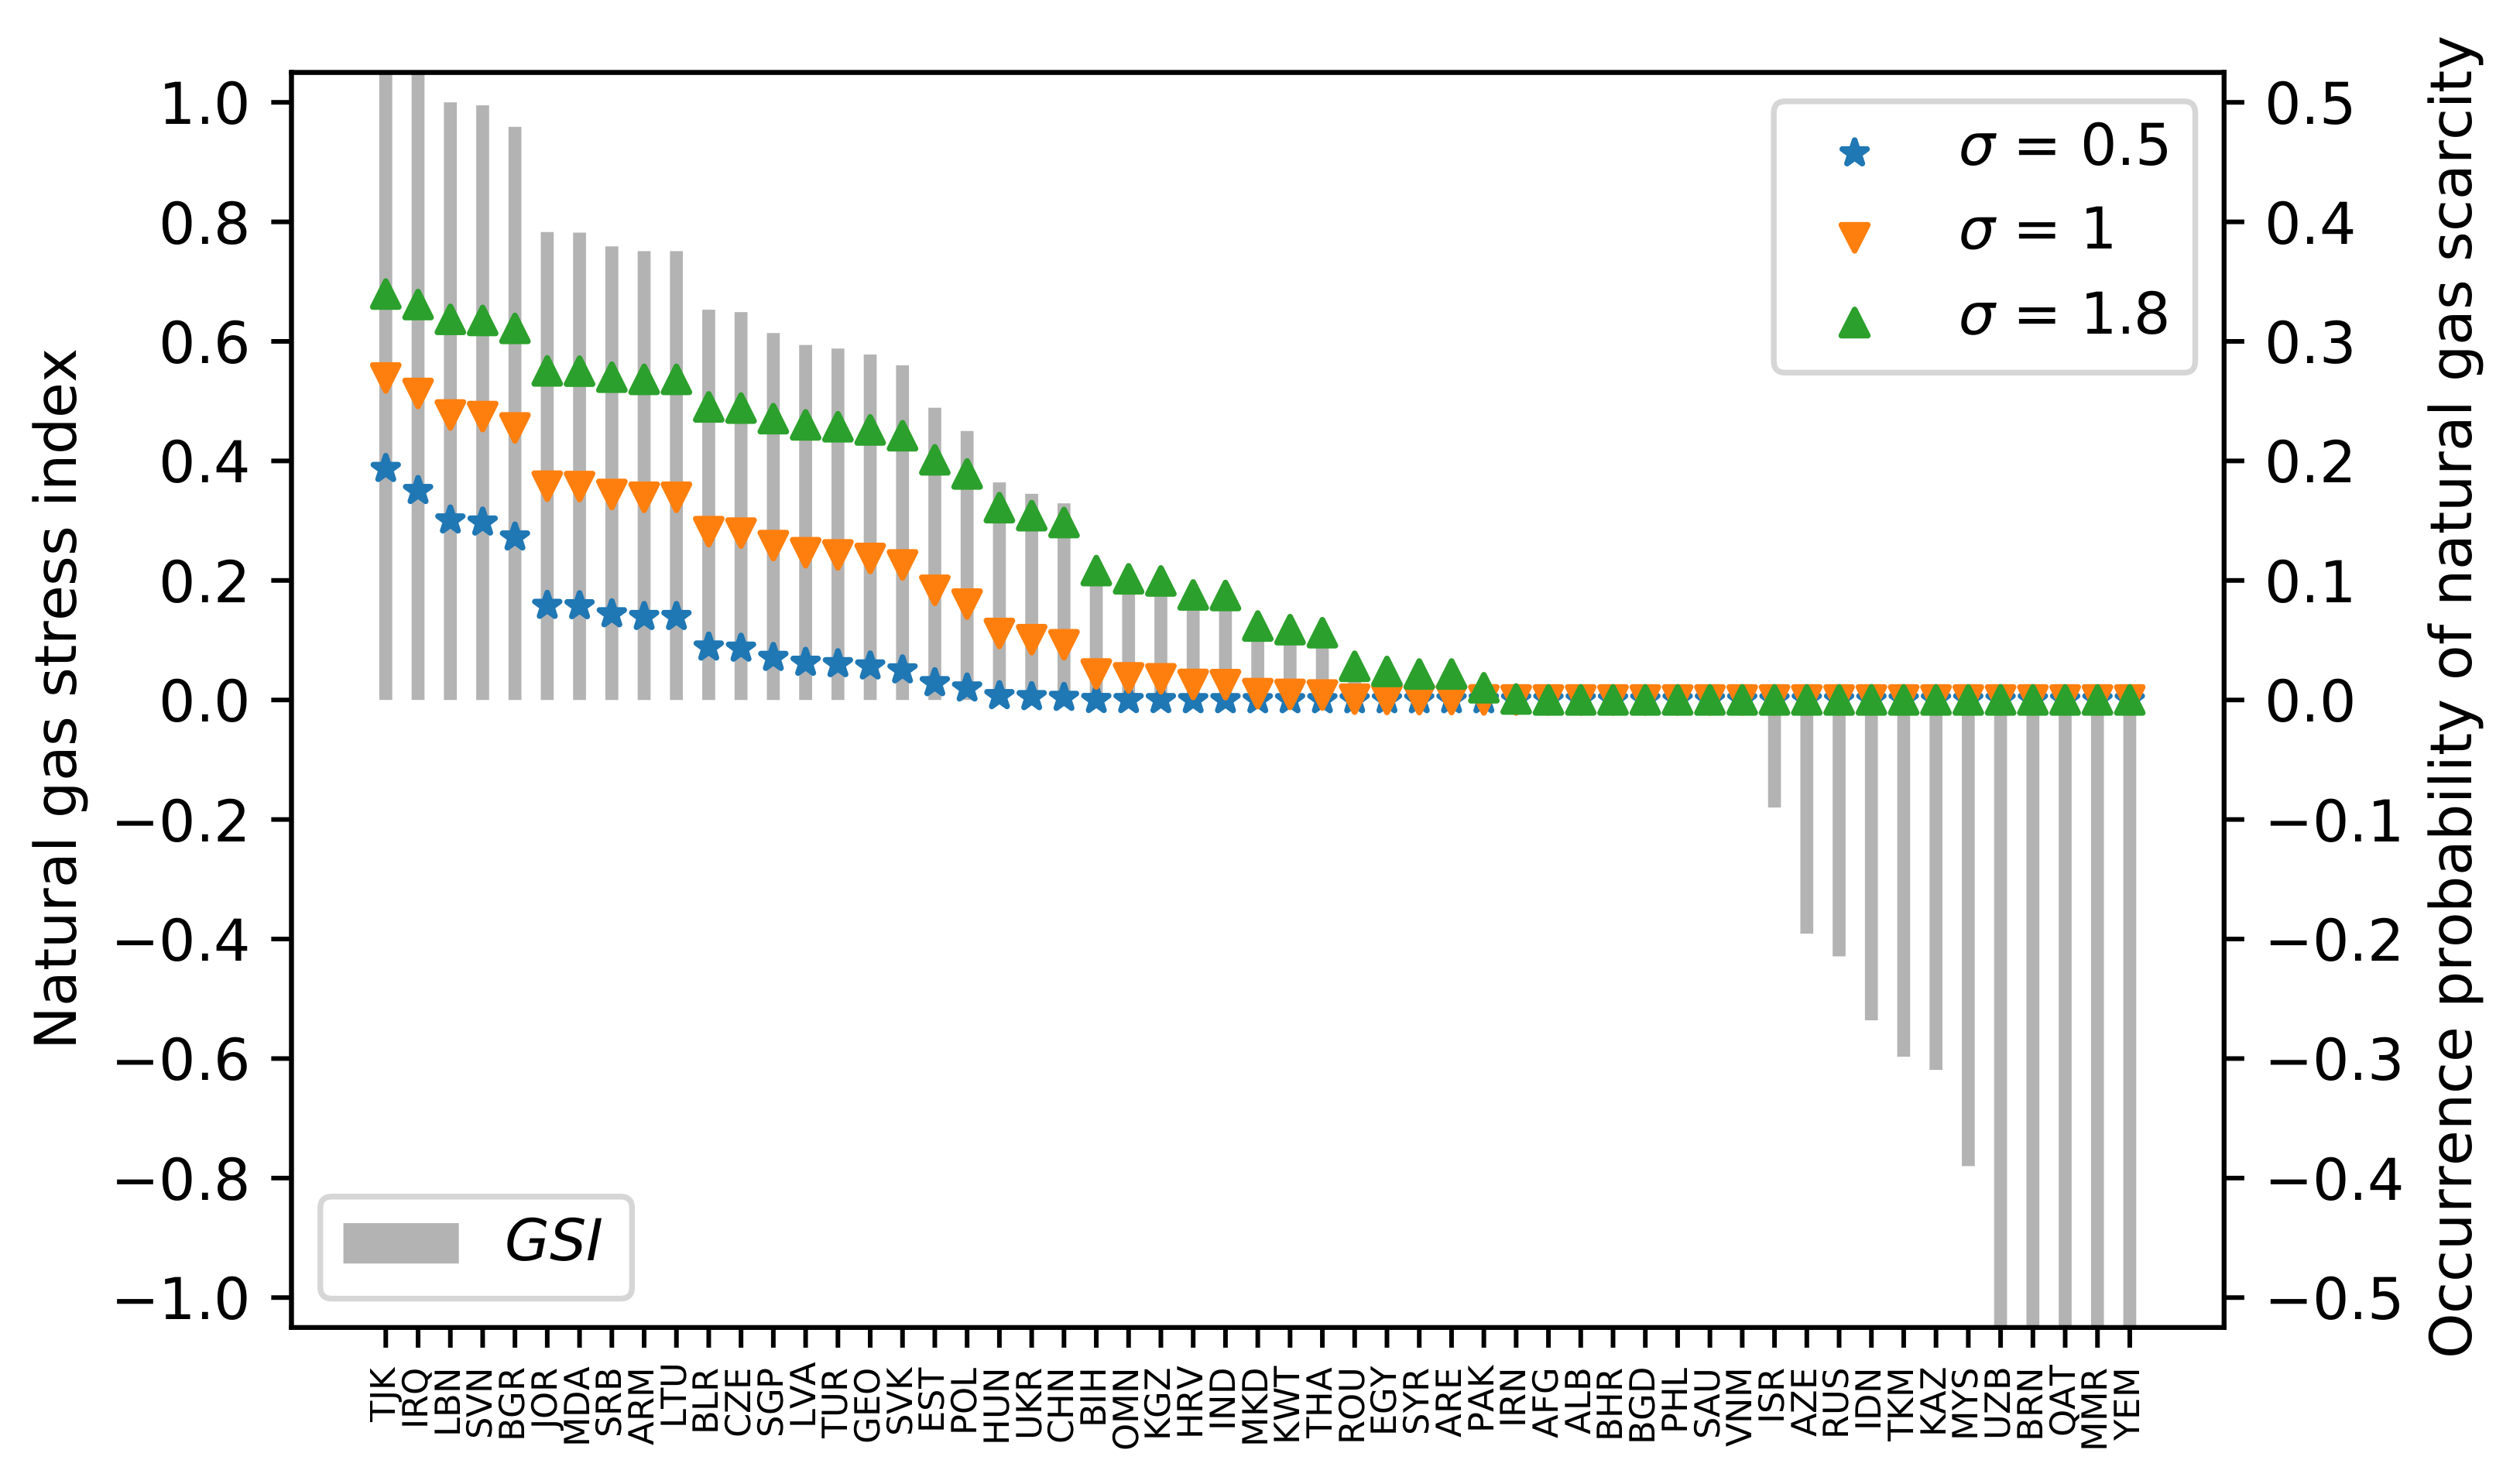
3.1.1. Probability of Natural Gas Scarcity (GP)

The probability of natural gas scarcity (GP) can be measured by natural gas stress index (GSI) based on some assumptions. The GSI is defined as the ratio of net natural gas imports to natural gas consumption, which reflects a country’s dependence on foreign natural gas resources, as shown in Equation (2):
G S I c = I G c E G c C G c ,
where I G c , E G c , and C G c represent the amount of natural gas imports, exports, and consumption of country c, respectively. A larger G S I c indicates that a country is more dependent on imported natural gas, which means that once natural gas imports are insufficient, it will affect the economic output of various domestic sectors. In particular, the closer the G S I c value is to 1, the greater the natural gas stress, increasing the probability of natural gas scarcity. On the contrary, a smaller G S I c value represents a lower natural gas dependence. When G S I c 0 , the consumption of natural gas is self-sufficient, and natural gas stress is not observed.
Based on G S I c , the log-normal distribution is adopted to evaluate the probability of natural gas scarcity for country c, which is shown in Equation (3):
G P c = f μ c ; σ = 0 1 1 x x σ 2 π exp ln x μ c 2 π σ 2 d x ,
where μ c = ln 1 G S I c , and σ controls the heterogeneity of G P c among countries. A significant σ reflects a greater difference of G P c between a high-GSI and a low-GSI country. It is worth noting that G S I c > 0 is required when calculating G P c . However, if G S I c 0 , it means that there is no natural gas scarcity in the country, and thus G P c is set to zero.

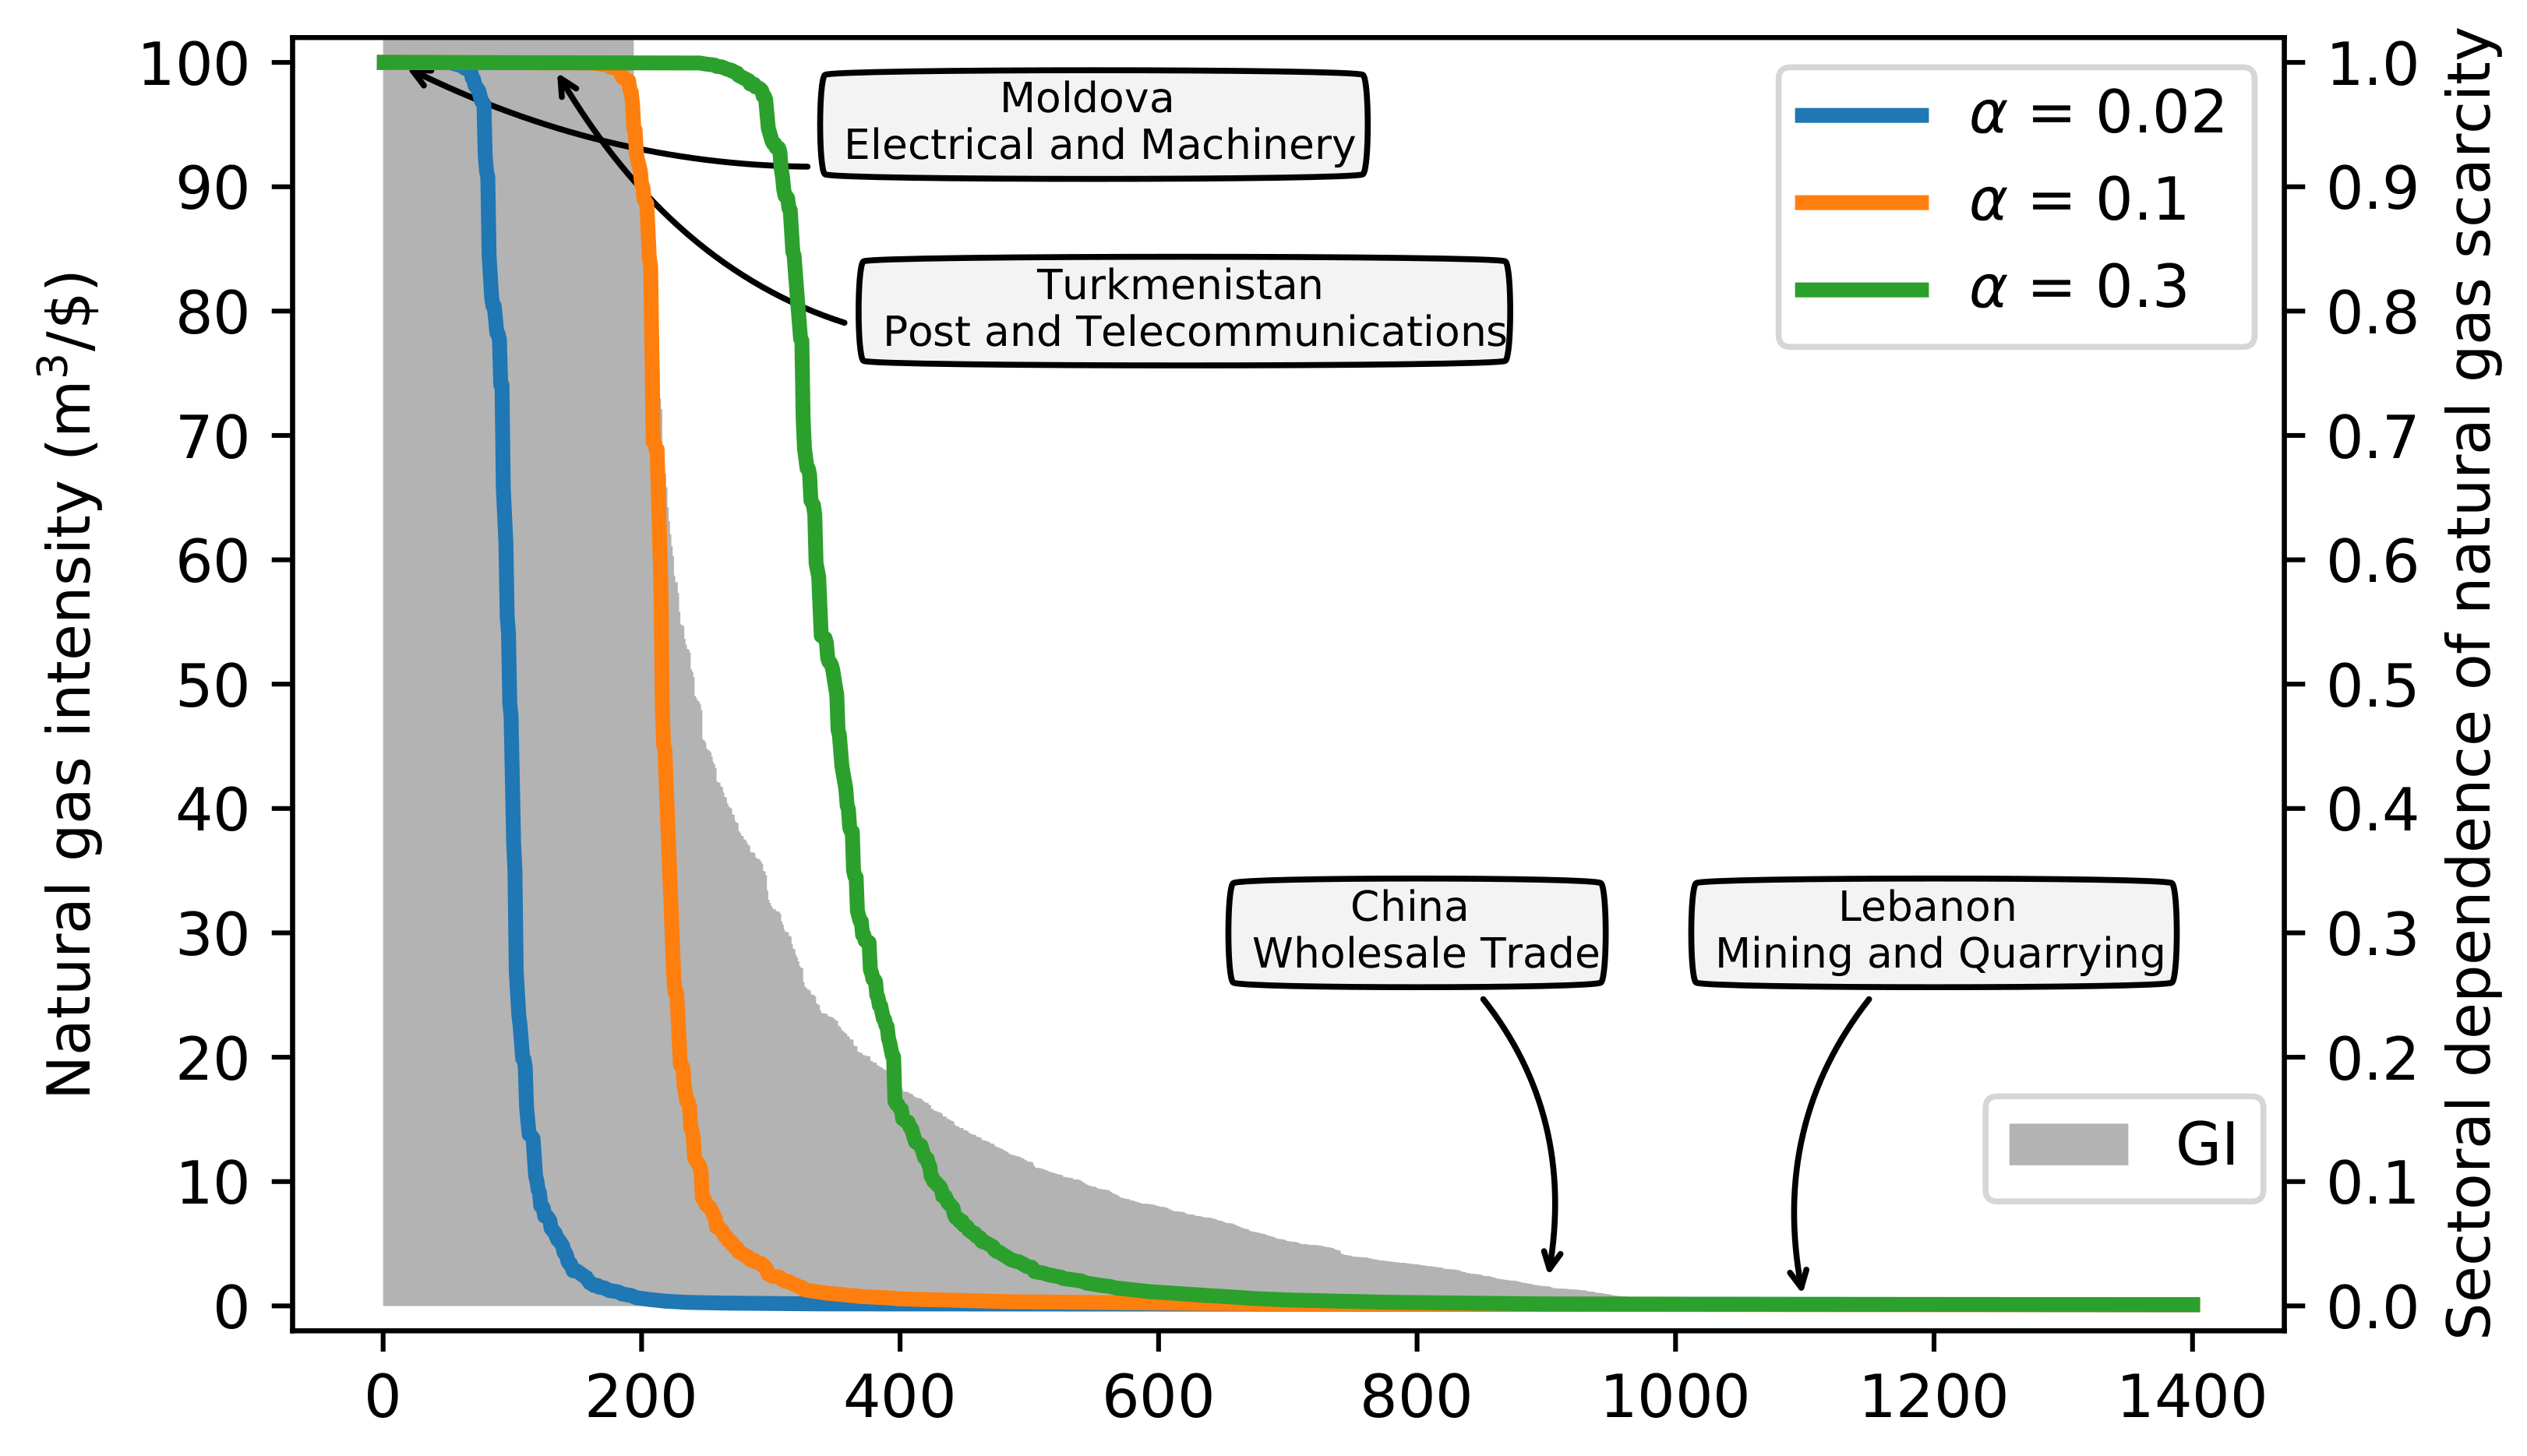
3.1.2. Sectoral Natural Gas Dependence (GD)

The sectoral natural gas dependence (GD) assesses the proportion of sectoral output reduction caused by a 1% reduction in natural gas consumption. The maximum value of GD is 1, reflecting that natural gas is entirely irreplaceable. In this work, the Logistic function is used to convert the natural gas intensity (GI) into the sectoral natural gas dependence, as shown in Equation (4):
G D s = g G I s ; α = 1 1 + e α G I s 1 0.001 1 ,
where G I s is computed from the ratio of natural gas consumption to economic output for sector s. It reflects the natural gas intensity of sector s and is utilized to evaluate the dependence of sector s on natural gas resources. The parameter α > 0 adjusts the critical value of G I s curve. Once the natural gas intensity of a sector is greater than this critical value, G D s will rapidly increase to 1. On the other hand, when the natural gas intensity is extremely small, or even zero, the G D s value reaches the minimum (i.e., 0.001). This implies that even if a sector consumes a very small amount of natural gas, the shortage of natural gas will still affect the economic activities of the sector, reflecting the general importance of natural gas resources.

3.2. Embodied Natural Gas Scarcity Risk (EGSR)

In this work, a multi-regional input–output (MRIO) model is applied to study the interdependence of inputs and outputs between various sectors in the economic system [38]. The MRIO analysis assists in tracking the energy resources or environmental impacts of economic activities to their source or to where they are utilized through a complex inter-regional supply chain [39]. Considering the input–output relationship between various sectors, the MRIO model has the following equation, Equation (5):
X = V I B 1 ,
where X is a row vector representing the total input of each sector and V is a row vector representing the value added for each sector. The matrix B contains the direct output coefficients, defined as the distribution ratio of products from one sector to another. The matrix I B 1 is the Ghosh inverse matrix, of which the elements of a row represent the total output (including direct and indirect) of sectors brought about by unitary value added to the sector demonstrated by this row [40].
As shown in Equation (6), matrix E G S R can be obtained by diagonalizing vector L G S R first, and then multiplying it by the Ghosh inverse matrix. The elements in a column reflect the output losses of the specific sector, demonstrated by this column, which is induced by the L G S R of each sector represented by the row
E G S R = diag L G S R × I B 1 .
Thus, EGSR imports and EGSR exports for country i are calculated by Equations (7) and (8):
E G S R i i m = j i E G S R j i ,
E G S R i e x = i j E G S R i j .

3.3. Top Network Analysis

In the network studies of natural gas scarcity risk for countries along the Belt and Road, countries are denoted as nodes, while the EGSR flows between countries are represented by edges with direction. The result is a directed and weighted EGSR transmission network [41]. For every country, its risk transfer ties are not equally important. The Top EGSR transfer network can capture the essential transmission relations in the EGSR transmission network.
According to the direction of EGSR flow between countries, the Top EGSR transfer network is divided into Top EGSR import network and Top EGSR export network. When each country’s top EGSR inflow relationship is retained, the Top 1 EGSR import network is formed. The in-degree of all nodes in this network is 1, and the out-degree varies across nodes. The in-degree and out-degree of a node, respectively, denote the number of import partners and export partners of the node. In other words, a country has only one country as its primary EGSR source but can be the leading source for many other countries. When a country is not the primary EGSR source for any country, its out-degree is equal to zero. The Top 1 EGSR export network is constructed by including only the top EGSR outflow relationship in each country. Similarly, if the top two EGSR risk inflow or outflow relationships of each country are retained, the network formed is called the Top 2 EGSR import or export network. Furthermore, the Top-level network of the selected standard is obtained according to the specific situation studied. A typical feature of the Top EGSR import (export) network is that the in-degree (out-degree) of all countries does not exceed the selected standard, but the out-degree (in-degree) varies with the dependence of the country.

3.4. Data

There are two types of data used in the study: the global MRIO data and the natural gas-related data. When this research was carried out, the year of the latest data available was 2015. Therefore, this work was conducted with information regarding the year of 2015.
The global MRIO data used in the study are derived from the Eora database. The Eora global MRIO database provides a series of high-resolution global MRIO tables with matching satellite accounts for 190 regions [42,43]. The Eora26 version is recommended for environmentally extended MRIO analysis, because sectors of all nations are in a common 26 sector classification (Appendix A Table A1). This work adopts the Eora26 version for 2015 to study natural gas scarcity risk issues of countries and sectors along with the Belt and Road economics.
The import, export, and consumption of natural gas in each country are provided by The World Factbook of Central Intelligence Agency [44]. The natural gas consumption data of each sector is collected from the Eora26 database.
The BRI is an open international economic cooperation network that is not restricted to a specific spatial scope. Due to missing data, 55 countries along the Belt and Road are considered in this paper, including 35 Asian countries, 19 European countries, and 1 African country, listed in Appendix A Table A2.

4. Results

4.1. Local Natural Gas Scarcity Risk

The probability of natural gas scarcity (GP) measures the reduced fraction of natural gas use by a country resulting from potential natural gas scarcity. Since there is a lack of comprehensive information on natural gas demand across all sectors, it is assumed that countries with higher GSI are more likely to face natural gas shortages. Figure 1 depicts national G S I c and the corresponding G P c estimated by different values of σ . As shown in Figure 1, when σ = 1.8 , nearly half of the countries have non-negligible GP values (over 10%). When σ = 0.5 , only about 10% of countries have GP values higher than 10%, and nearly 70% have negligible GP values. When σ = 1 , about 30% of countries have notable GP over 10%, and about 50% have GP values less than 1%. Thus, in order to be closer to the actual situation, we set σ = 1 in this work.
Figure 2 illustrates the natural gas intensity (GI) and the resulting sectoral natural gas dependence (GD) for different values of α . A larger α leads to a higher critical value of GI, meaning that fewer sectors are categorized as highly dependent on natural gas. The sector with higher GI also has the larger GD, as demonstrated in Figure 2. For instance, although the GI of Moldova’s Electrical and Machinery (S9) (12,846 m 3 /USD) sector is about sixty times that of Turkmenistan’s Post and Telecommunications (S20) (214 m 3 /USD) sector, they are the sectors essentially dependent on natural gas because their GD value is close to 1. On the other hand, sectors with relatively low or zero GI, such as Wholesale Trade (S16) (1.4 m 3 / USD) sector in China and Mining and Quarrying (S3) (0 m 3 / USD) sector in Lebanon, have the minimum GD values, which are close to 0.001. Therefore, sectors with high GI values are more dependent on natural gas. Further, the function converting GI to GD is selected by adjusting the parameter α . When α = 0.1 , nearly 10% of sectors have extremely high GD values, exceeding 0.999. About 55% of sectors have relatively low GD values, which are approaching 0.002. For α = 0.02 (0.3), fewer (more) sectors are classified as having relatively high GD values. Thus, α = 0.1 is set for the main results.
Figure 3 shows the five main sectors of the top ten countries that suffered losses due to natural gas scarcity. Among these ten countries, five Eastern European countries are included. The economic impact caused by LGSR in these top ten countries accounts for 85% of the total exerted risk of countries along the Belt and Road. Among them, Turkey and Ukraine alone account for about 45%. Turkey has the most significant local natural gas scarcity risk, reaching 11.7 million dollars, more than twice that of second-ranked Ukraine (5.4 million dollars). Therefore, Turkey would suffer a large amount of economic loss if natural gas scarcity occurs. The top five sectors with the largest LGSR include Electricity, Gas and Water (S13), Petroleum, Chemical, and Non-Metallic Mineral Products (S7), Metal Products (S8), Other Manufacturing (S11), and Transport (S19) sectors. In the top ten countries mentioned above, the economic losses in these five sectors account for 90% of the total exerted risk, inside of which S13 and S7 contribute 72.9%. The LGSR in the five sectors mentioned earlier in Turkey, Ukraine, and Singapore is above 96%. Especially in Singapore and Iraq, the proportion of LGSRs in the S13 alone exceeds 95%. The economic losses caused by natural gas scarcity in S7 sector in Turkey account for nearly 50%, and the same situation also exists in Bulgaria. Therefore, local natural gas scarcity risk faced by the S13, and S7 sectors may bring tremendous economic output losses. As depicted in Figure 3, for China, the risks from these five sectors account for about 40% of the economic impact of LGSRs. The primary risk sources are S7, S9, and S19 sectors, which account for 18%, 9.8%, and 8.7%, respectively. Note that the probability of natural gas scarcity in India and China is relatively low, but their LGSRs are high. This result comes mainly due to the substantial economic output of these two countries, which is dozens or even hundreds of times compared to other countries. Some countries, such as Lebanon, Tajikistan, and Slovenia, are deeply dependent on natural gas but have slight local risks due to their limited economic output.

4.2. Embodied Natural Gas Scarcity Risk

In 2015, the natural gas scarcity risk (GSR) embodied in the trade of the Belt and Road countries was about 88.2 million dollars, while the GSR from domestic trade consisted of approximately 44.7 million dollars, and the GSR of 43.5 million dollars was transferred through international trade. The risks in 19 countries, such as Turkmenistan, Macedonia, Albania, and Vietnam, derive from the EGSR imports. These countries have low GSI values, but import intermediate products from countries with scarce natural gas, such as Turkey, Ukraine, Bulgaria, etc. This makes the exporting countries have even fewer natural gas resources. For the remaining 36 countries, nearly half of the total EGSR has been exported abroad.

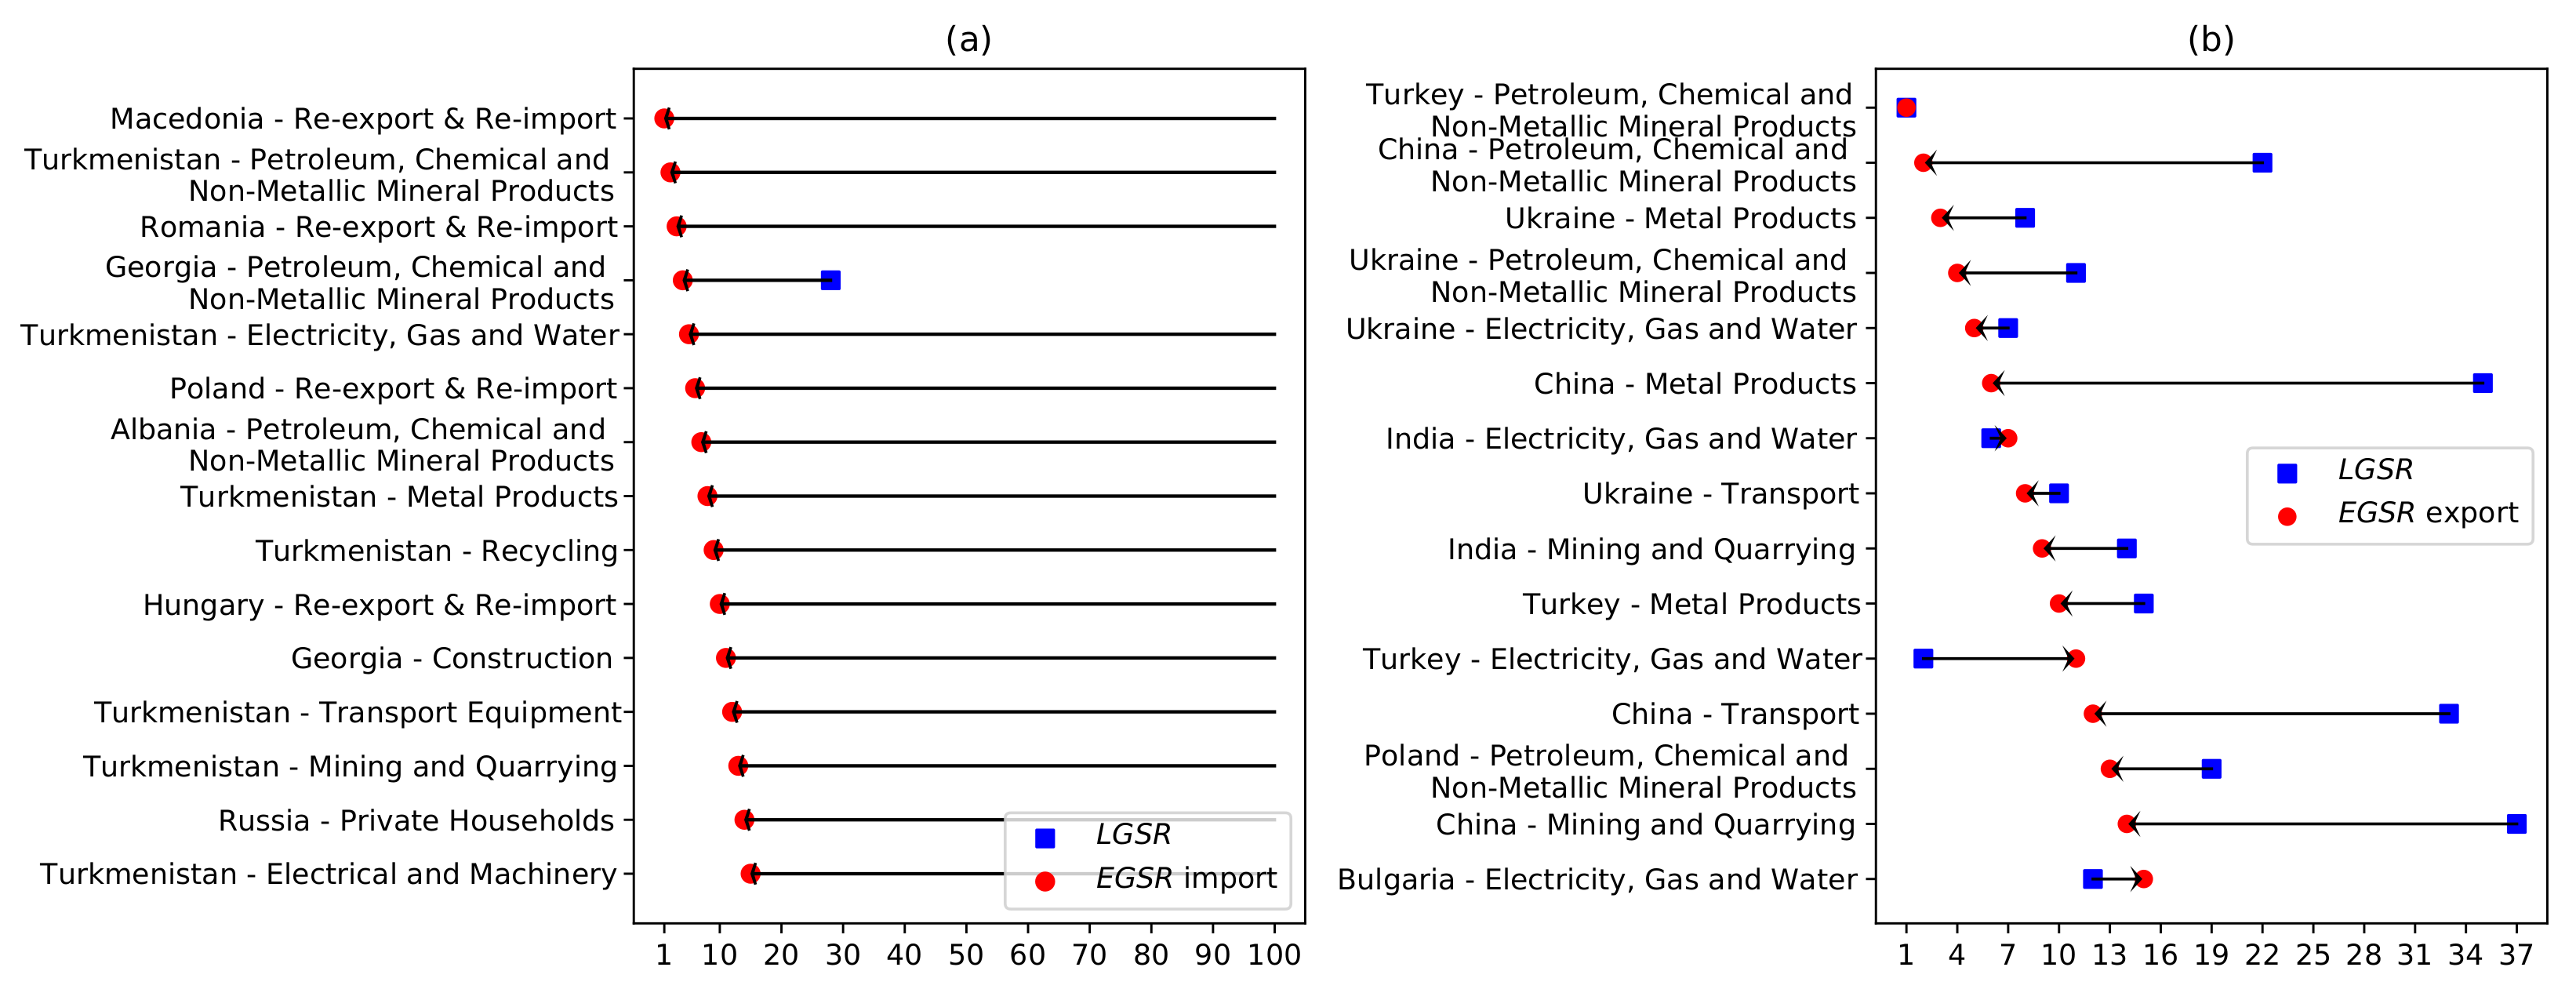
4.2.1. Country Level Results

To track the source and destination of natural gas scarcity risks, Table 1 lists the top ten countries of the EGSR imports and exports. The economic losses caused by natural gas scarcity mainly originate from Turkey, China, and Ukraine, with exports of 14.6 million dollars, 11.1 million dollars, and 8.3 million dollars, respectively. The sum is accounted for 78.4% of the total exports. These losses could have noticeable implications on other economies by exporting EGSR. Further, to evaluate the EGSR imports and exports independent of economic scales, Table 1 also lists the EGSR imports and exports per unit of economic output. Bulgaria, Turkey, and Ukraine have massive EGSR exports and are the riskiest countries, owing to the relatively high proportions of EGSR exports per unit economic output. As depicted in Figure 4, the GSRs from Bulgaria, Turkey, and Ukraine are largely transferred to Turkmenistan, Georgia, and Albania. These countries have large EGSR imports and together with Qatar and Belarus, are the most vulnerable countries when facing the shortage of natural gas resources in upstream countries.
Figure 5 compares the ranking changes of top countries in LGSR versus EGSR imports (Figure 5a) and EGSR exports (Figure 5b). Figure 5a shows that the ranking of LGSR is quite different from that of EGSR imports for most countries. For EGSR imports, countries such as Turkmenistan, Macedonia, Albania, Vietnam, and Kyrgyzstan have extremely low LGSRs while importing many GSRs from abroad. They are much less resilient to GSR in other countries than to their LGSR. For example, Turkmenistan ranks the 1st with 3.5 million dollars EGSR imports, followed by Macedonia with 2.4 million dollars, while the LGSR of Turkmenistan ranks 37th and that of Macedonia ranks 34th. This result indicates that economic sectors in these countries greatly depend on importing merchandise from countries with scarce natural gas. Therefore, these sectors should seek substitutions in domestic or other countries with sufficient natural gas supply to improve the robustness to foreign GSRs. On the contrary, as shown in Figure 5b, LGSR and EGSR exports rankings for most countries are similar, indicating that countries with scarce natural gas may also be the leading EGSR exporters. Countries such as Turkey, China, Ukraine, India, Bulgaria, and Singapore with high LGSRs also transfer many GSRs to other countries by exporting commodities. Therefore, downstream countries should reduce their imports from these countries to increase their resilience to foreign EGSRs.

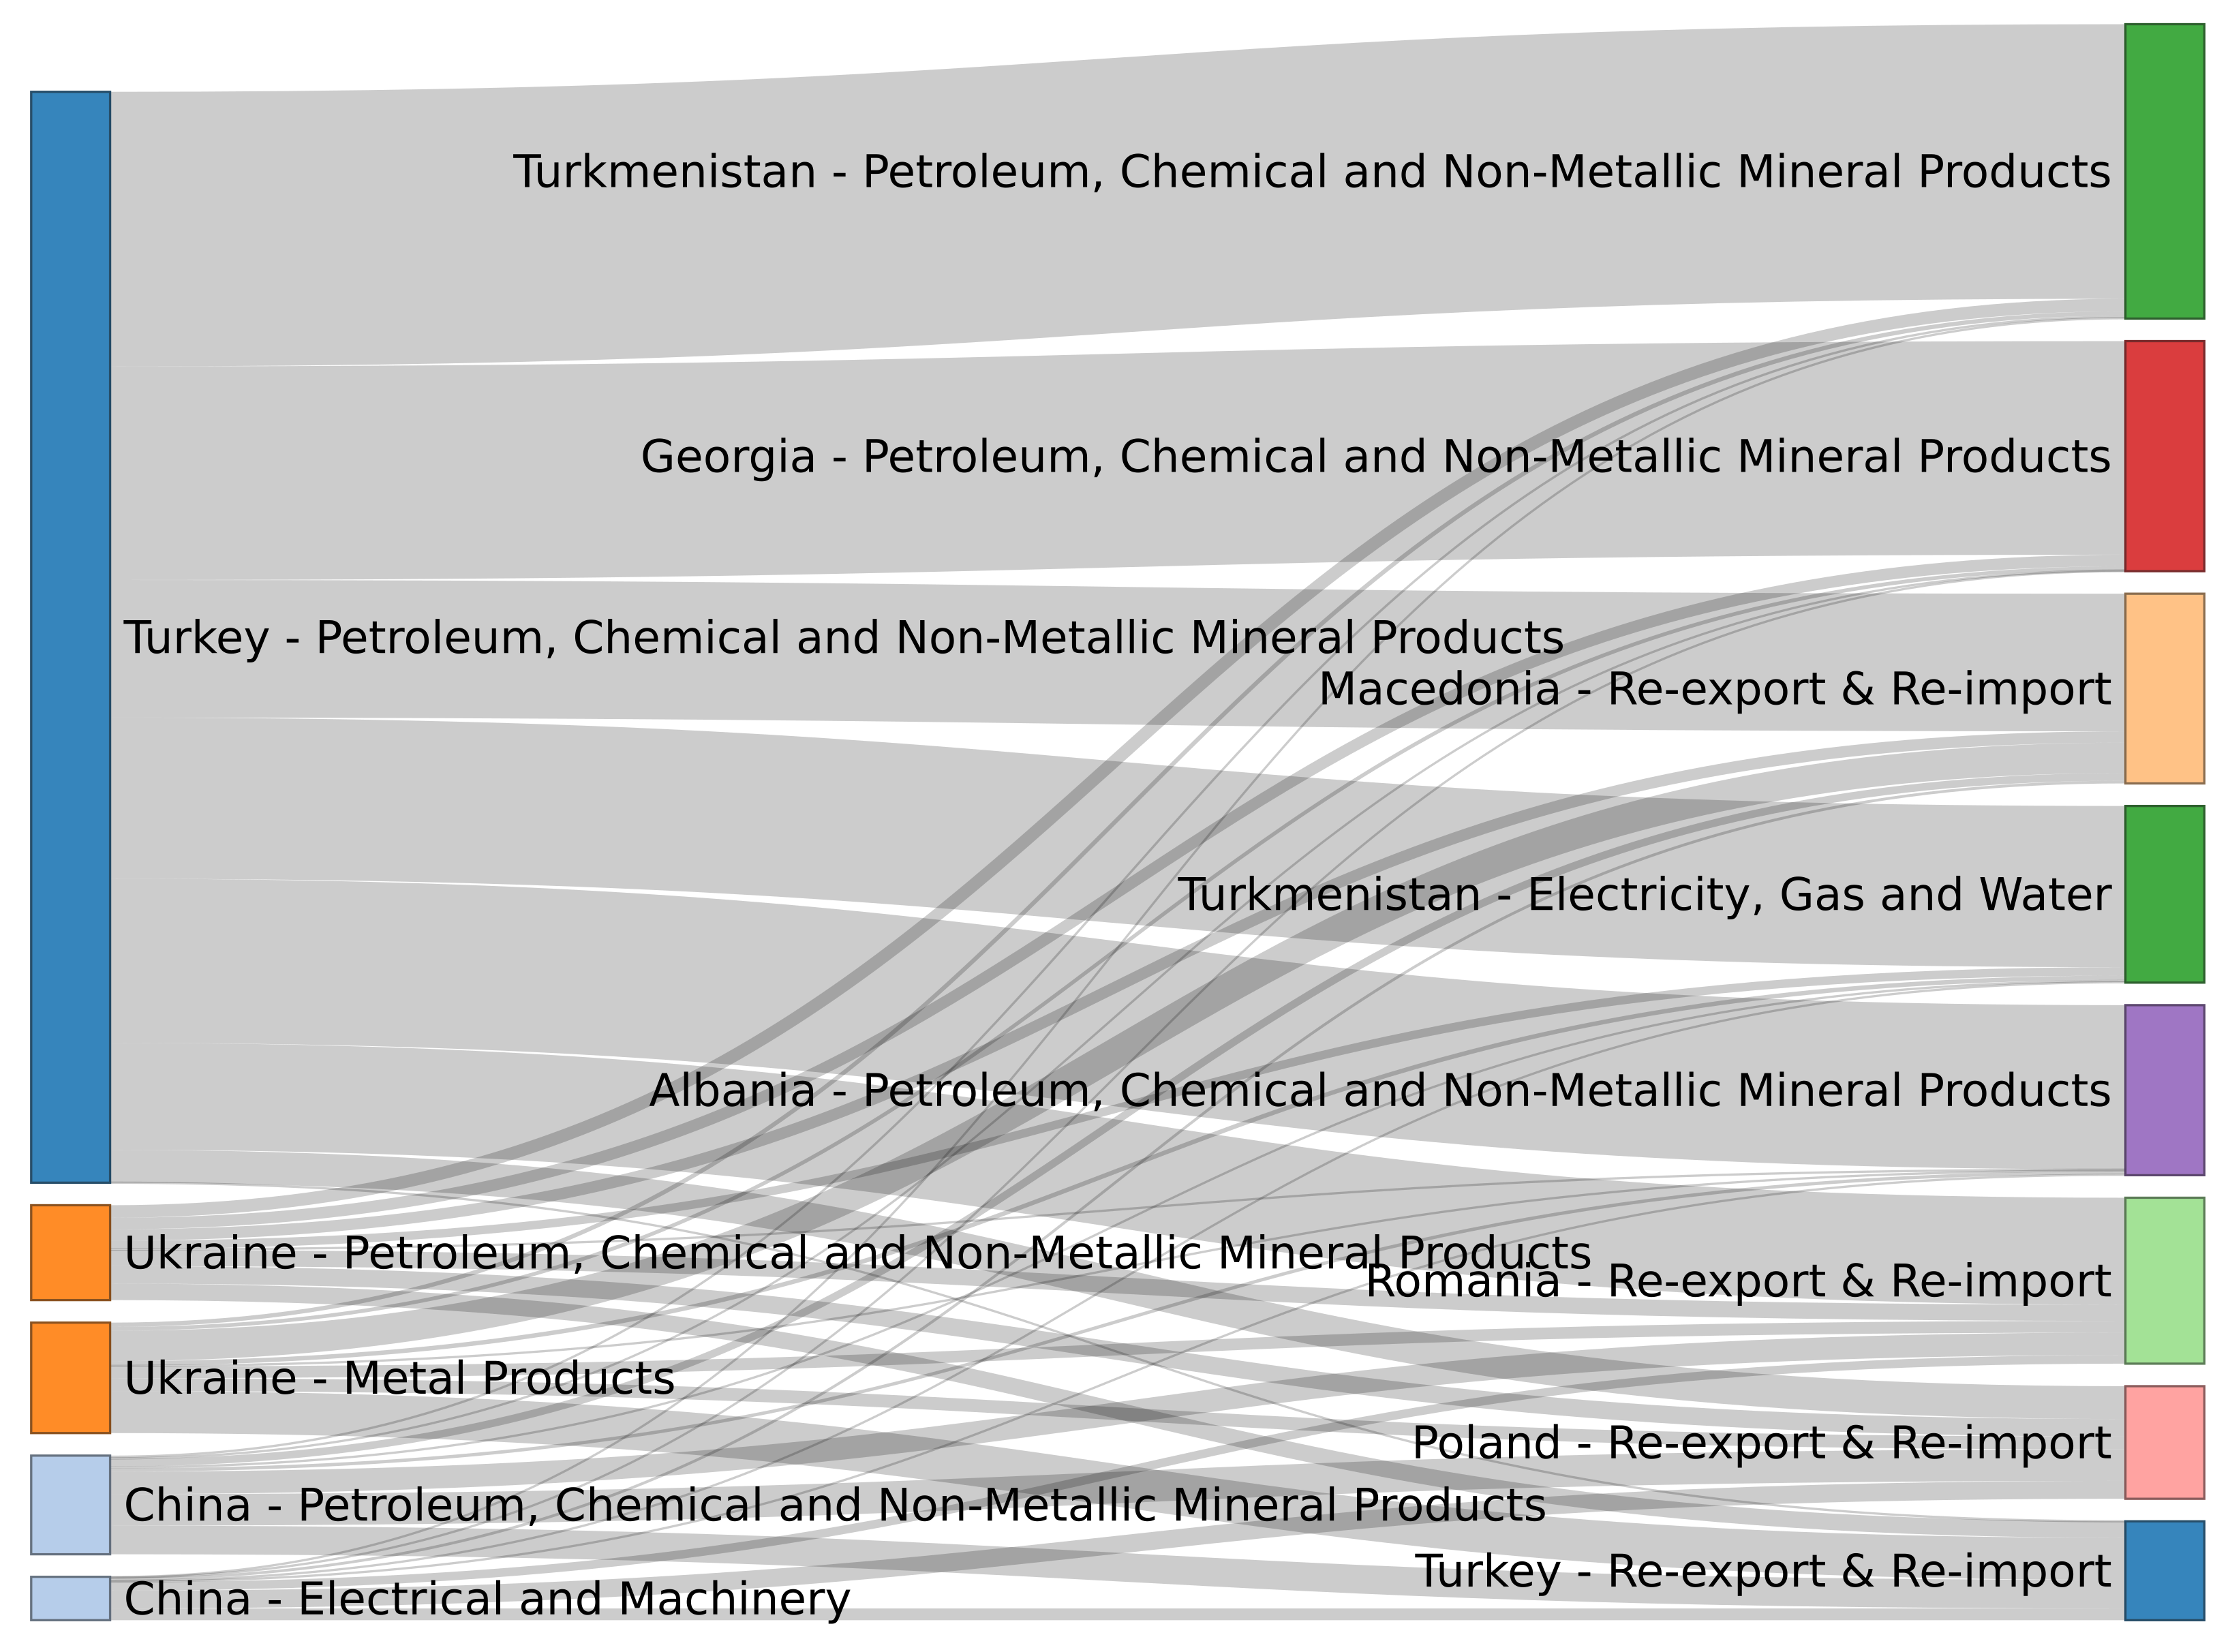
4.2.2. Sector Level Results

Table 2 lists the top ten sectors of EGSR imports and exports. The S7 sector in natural gas scarce countries, such as Turkey, Bulgaria, and Ukraine with 46.9% of the EGSR exports, cause serious risks on downstream sectors in other countries through trade. For imports, considering sectors such as S7 and Re-export & Re-import (S26) are primary importers, their economies sensitive to the GSR in upstream sectors in the supply chain. To evaluate the EGSR imports and exports independent of economic scales, Table 2 lists the EGSR imports and exports per unit output. The Private Households (S24) sector in Russia and Kyrgyzstan, and the Fishing (S2) sector in Kyrgyzstan merge as the most vulnerable sectors to GSRs in other sectors. The S7 sectors in Turkey and Bulgaria are the riskiest sectors, due to the relatively high fractions of EGSR exports per unit economic output. In particular, the S7 sector in Turkey consists of the primary upstream source, and its EGSR exports amount to 12.5 million dollars. The EGSRs from this sector mainly transfer through the trade network to S7 sectors in Turkmenistan, Georgia, and Albania, and S26 sectors of Macedonia and Romania, and S13 sector in Turkmenistan, as shown in Figure 6.
Figure 7a illustrates the ranking changes between LGSR and EGSR imports for the top 15 sectors with the largest EGSR imports. The EGSR imports of some sectors, such as the S7 sector in Turkmenistan, Construction (S14) sector in Georgia, and S26 sector in Macedonia, rank much higher than the LGSRs for these sectors because of their high dependence on imports from other sectors. For example, the S26 sector in Macedonia ranks 1st in the EGSR imports, while the LGSR of this sector ranks 906th. This implies that S26 sector of Macedonia is highly dependent on importing commodities from the upstream sectors subject to natural gas scarcity. Hence, these sectors should seek other alternatives from sectors of their own countries or other countries with lower LGSRs to reduce their vulnerability to natural gas scarcity. Figure 7b compares the ranking changes between the LGSR and EGSR exports for the top 15 sectors with the greatest EGSR exports. The ranking of EGSR exports is quite close to that of LGSR. It can be discovered that S7 sectors in Turkey, Ukraine, and China, and S8 sector in Ukraine, etc., with high LGSRs also transmit large amounts of GSRs to other sectors through their exports of commodities. For S7 sector of Turkey, both the LGSR and EGSR exports rank first. For S7 sectors in Turkey, S8, S13, and Transport Equipment (S10) sectors in Ukraine, S13 sectors in India that rank in the top ten for LGSRs, their EGSR exports rankings are also in the top ten. Therefore, to reduce the EGSR exports of these sectors, the downstream sectors are required to explore substitutions in other sectors with abundant natural gas supplies and improve the resilience of their entire economy to GSRs.

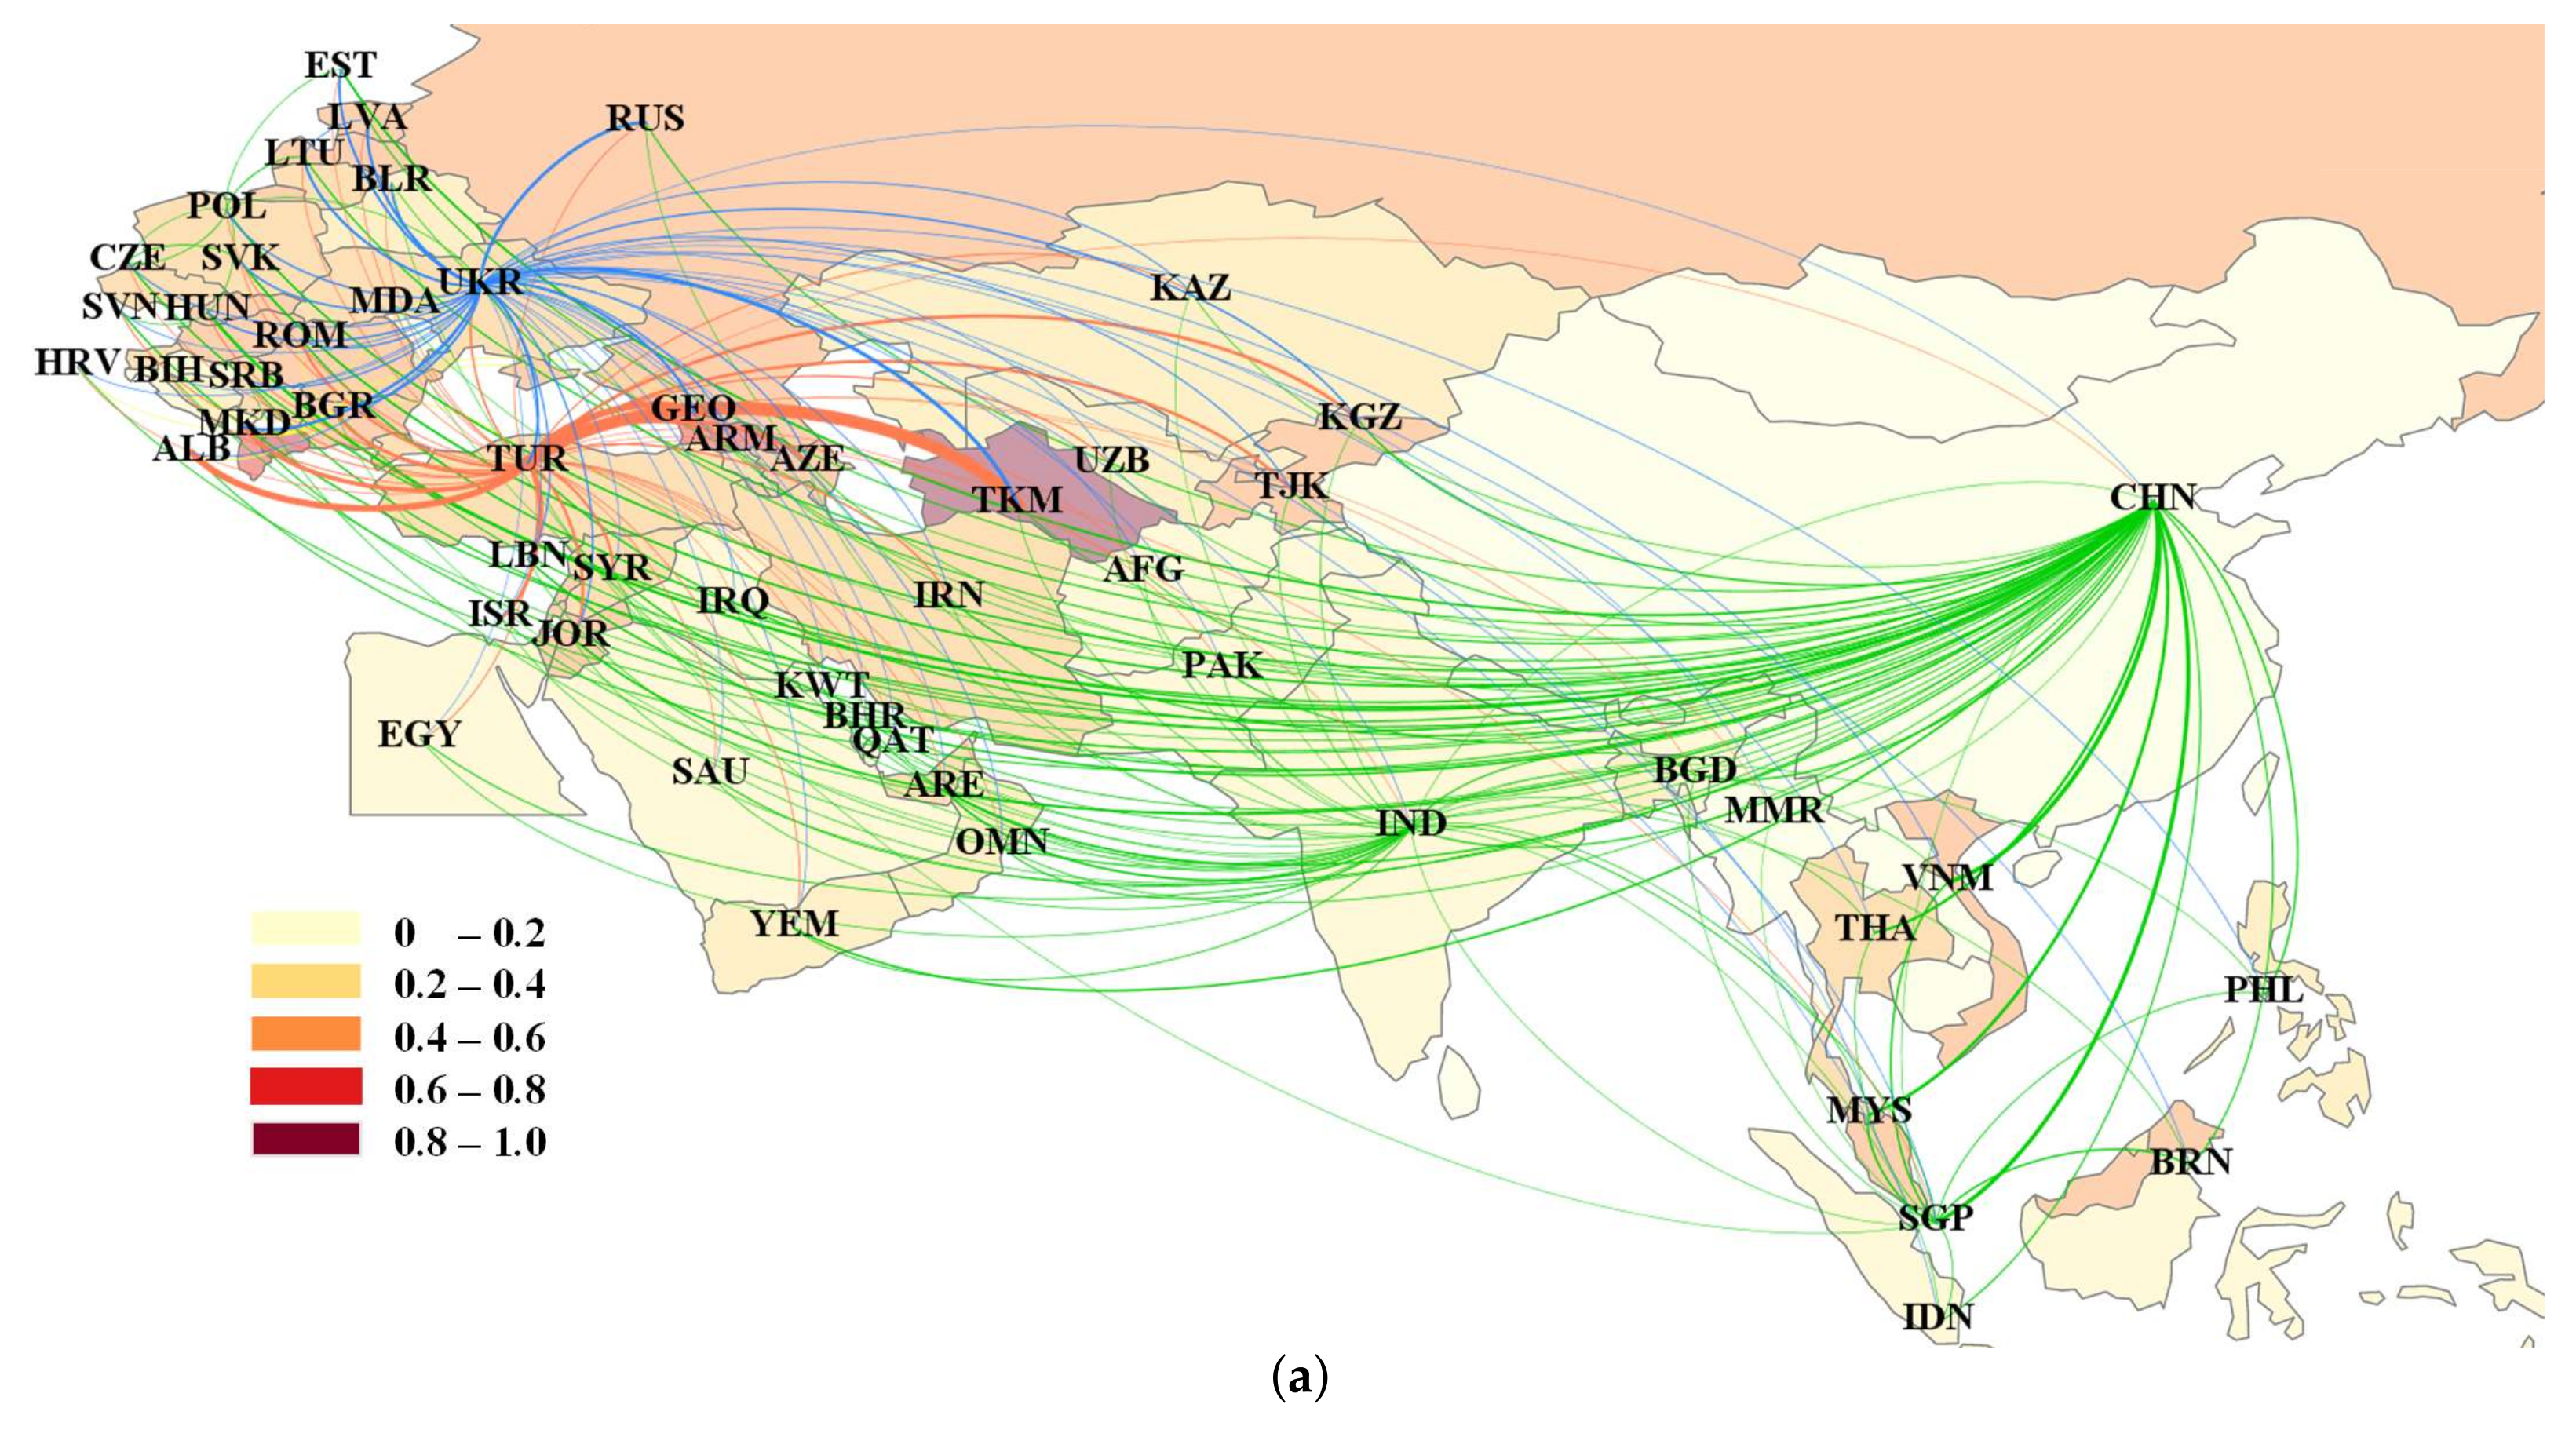
4.3. Top Network Analysis

For each country, the EGSR transferred to trading partners is not evenly distributed, and the concentration of EGSR transfer exists. The main EGSR transmission partners have an essential influence on shaping the risk transfer paths between countries. Therefore, it is necessary to pay explicit attention to the main EGSR transfer partners of one country and to study the framework based on the top EGSR transfer relations.
The Top EGSR transfer network provides a valuable tool for simplifying the EGSR flow information and reveals the main framework of EGSR transfer for countries incorporated on the Belt and Road economics. Figure 8 shows the relationship between the level of the top network in 2015 and its percentage in the total EGSRs. The curve shows an upward trend as more EGSR transfer relationships are included in the Top network. It can be found that the EGSR flows in the Top 4 EGSR import network and the Top 9 EGSR export network account for more than 90% and 50% of the total EGSRs transferred, respectively. The top EGSR transmission relationships shape the backbone of the entire EGSR transfer network. Figure 9a,b visualize the Top 4 EGSR import network and the Top 9 EGSR export network separately.
Figure 9a suggests that the Top 4 EGSR import network is divided into three main clusters, centered around Turkey, China and Ukraine. These three countries have the largest out-degrees, which means they are the top sources of EGSR imports. They are also the top three countries with the highest EGSR exports, of which Turkey and Ukraine rank in the top three among the riskiest countries. This information is consistent with the results shown in Table 1. Figure 9a also indicates that EGSR transmission has noticeable geographical characteristics, and most of the countries in the same cluster are from the same continent. The EGSRs from Ukraine are mainly transmitted to Eastern Europe. Southeast Asia and Central Europe essentially face the EGSRs from China. Turkey primarily transmits EGSRs to Central Asia, Western Asia, and Eastern Europe. In Asia, the EGSR from Turkey is about 1.3 times that of China and 2.5 times that of Ukraine. The EGSRs of being imported into Europe from these three countries are roughly the same. Figure 9b shows that the Top EGSR export network structure is quite fragmented. Turkmenistan, Belarus, Macedonia, and Russia have relatively large in-degrees, indicating that they are the main EGSR export destinations. These four countries are among the top five countries with the highest EGSR imports, of which Belarus and Turkmenistan rank in the top five among the most vulnerable countries, as expressed in Table 1.

5. Discussion

The international natural gas trade is a giant, complex system. The local risk of natural gas scarcity (LGSR) for different sectors in each country is estimated first by combining the natural gas stress index, natural gas consumption intensity, and economic output. Then, the embodied natural gas scarcity risk (EGSR) transmission matrix is obtained based on the local risk of natural gas scarcity and the Ghosh inverse matrix. Top network analysis method is used to reveal the main transmission paths and structural characteristics of natural gas scarcity risks in the Belt and Road economies. This study considers 55 countries with 26 sectors along the Belt and Road. It proposes a modeling framework to measure and track the embodied natural gas scarcity risk transmitted to downstream sectors through global supply chains, which is favorable to the development of risk analysis and the extended application of multi-regional input–output analysis.
We first analyzed the local risks of natural gas scarcity (LGSR) in each country and sector. Turkey and Ukraine have the most significant economic losses, accounting for 45% of the total exerted risk of countries along the Belt and Road. The top five sectors with the largest LGSR include S13, S7, S8, S11, and S19 sectors. The LGSRs in the above five sectors in Turkey account for about 98.3% of the country and 30.6% of the Belt and Road economies. This work also identifies the significant nations and sectors of which local natural gas scarcity may critically affect other countries and sectors through international trade. Turkey, Ukraine, and China have the greatest EGSR exports at the national level, and Turkey and Ukraine rank in the top three among the riskiest countries. The GSRs originating from Turkey, Ukraine, and China are mainly transferred to Turkmenistan, Georgia, and Albania, which together with Qatar and Belarus are regarded as the most vulnerable countries facing the reduction of natural gas resources in their upstream countries. Moreover, it can be found that due to the indirect effects in the network, the risk of a country’s production reduction due to natural gas scarcity will be transferred to remote countries and sectors through the global supply chain, which will have a serious impact on other countries and sectors involved in international trade. For example, EGSRs from China and Turkey were transferred to distant Hungary and Kyrgyzstan, respectively through trade. This result is consistent with previous studies on resource scarcity. For example, Liu et al. emphasized that economic trade can transfer local water/energy shortages to remote areas by studying the case of China [36]. Qu et al. observed that the geographical separation between physical water scarcity and production losses caused by water scarcity is increasing [37]. At the sectoral level, S7 sectors in Turkey, China, Ukraine, and Bulgaria, S8 sectors in Ukraine, China, and Turkey, and S13 sectors in Singapore, India, and Turkey are the leading EGSR exporters. These sectors are critical to improving the resilience of the international trading system to GSRs. Hence, decision makers should focus on these sectors to mitigate the transmission of EGSRs. Sectors with high vulnerability to foreign natural gas scarcity are also identified, including S26 sectors in Macedonia, Romania, Poland, and Hungary, S7 sectors in Turkmenistan, Georgia, and Albania, and S8 sector in Turkmenistan. These sectors are relatively small in economic size but have substantial EGSR imports, making them highly vulnerable to natural gas scarcity in the upstream supply chain. Hence, sector managers should diversify their upstream suppliers in the supply chain to moderate potential risks.
Not all relations in a network are created equal. The main EGSR transferred ties shape the Top EGSR transfer network. A country’s position in the Top EGSR transfer network reflects how many other countries have the largest share of its external transfer risk. This analysis provides a reasonable and straightforward way to identify the different structural positions of the countries along the Belt and Road in the EGSR transfer system. The EGSR flows in the Top EGSR import network and Top 9 export network add up to 90.7% and 53.0% of total EGSR imports and EGSR exports separately. The Top 1 EGSR import network is mainly divided into three great clusters, centered around the major EGSR exporters, such as Turkey, China, and Ukraine. These three countries have the highest EGSR exports, and Turkey and Ukraine also rank in the top three most risky countries. This results from the share of natural gas in primary energy consumption and imports in Turkey and Ukraine, configured as a dominant factor. As long as natural gas remains the primary source in the energy structure of these countries, the EGSR transferred by them will continue high. Therefore, they should formulate long-term strategies to reduce the consumption of imported natural gas resources. In addition, the EGSRs originating from these three countries located in the cluster are mainly transferred to Europe and Asia. In Europe, the EGSR exports from these three countries are relatively similar. However, their EGSR exports transferred to Asia are quite different. The EGSR from Turkey is about 1.3 times that of China and 2.5 times that of Ukraine. The Top 9 EGSR export network shows that Turkmenistan, Belarus, Macedonia, and Russia are the main export destinations, where Belarus and Turkmenistan rank in the top five among the most vulnerable countries. It is precisely because of the structural centrality of these countries in the EGSR transmission network that they have great potential to alleviate the losses caused by the scarcity of natural gas in the "Belt and Road" economies. Tang et al. also described the structural characteristics of complex system when exploring the energy flow embodied in China’s economy. They found that Beijing has immense potential in determining national energy reduction given its structural priority in energy flow network [45].

6. Conclusions

In this study, the economic losses caused by the scarcity of natural gas in the countries along the Belt and Road are estimated. This work can provide a meaningful reference for governments, enterprises, and decision makers in vulnerable countries and sectors, enabling them to understand better the EGSRs they may face, helping them develop strategies to mitigate such risks.
Compared with previous studies, the potential interaction between the risk source and destination and the indirect effects of the network have been explored to fill the gap in the study of natural gas scarcity risk from a systematic perspective. This is reflected in the disparities between LGSRs and EGSRs in some countries. As empirical analysis shows, countries such as Turkmenistan, Macedonia, Albania, Vietnam, and Kyrgyzstan have extremely low LGSRs, but they are highly vulnerable to the shortage of natural gas in the upstream supply chain due to excessive EGSR imports. Therefore, the government should fully consider the local natural gas resource endowment when formulating trade policies. The demand-side management of natural gas is an effective way to reduce GSRs. The government can encourage consumers to change their consumption patterns to alleviate natural gas shortages, such as publicity and education, special lectures, etc., to raise awareness of natural gas conservation. On the other hand, countries such as Turkey, China and Ukraine with high LGSRs are the sources of EGSRs, and their EGSR exports have had a significant impact on other regions. The natural gas scarcity in one region not only causes economic losses to the neighboring regions, but also spreads to distant regions. That is to say, the economic losses caused by natural gas scarcity have long-distance transmission. This result is consistent with previous studies [36,37]. Moreover, this has been revealed from the top network analysis. Turkey, China and Ukraine are centered by three main clusters. Given their structural priority in the EGSR transmission network, they have immense potential in reducing the risk of natural gas scarcity. The above results would clearly support the Belt and Road authorities and policy makers to conduct transboundary natural gas resource management to weaken the spread of natural gas scarcity risks in the supply chain. For China, it is essential to make full use of the development opportunities brought by the Belt and Road initiative to strengthen extensive cooperation with countries or regions rich in natural gas resources, such as Southeast Asia and Central Asia, to form a mutually beneficial and win–win development pattern.
At present, more and more countries are committed to achieving carbon neutrality or net zero emissions in the next few decades, and the world is moving towards a low-carbon future. Because climate restrictions have accelerated the global energy transition, many countries cannot directly switch from fossil energy to renewable energy. As the most environmentally friendly resource among fossil energy sources, natural gas has become a transitional solution for countries to achieve net zero emissions targets, but will eventually be replaced by renewable energy sources. In view of this, from a long-term perspective, countries and sectors, especially those sensitive to natural gas shortages, must increase the proportion of renewable energy when adjusting their energy structure to properly solve the problem of natural gas scarcity.

Author Contributions

R.D.: Conceptualization, Methodology, Writing—original draft. Q.W.: Software, Writing—original draft. G.D.: Conceptualization, Methodology, Writing—review and editing. L.T.: Supervision, Writing—review and editing. A.L.M.V.: Validation, Writing—review and editing. L.Z.: Investigation, Data curation. X.Z.: Visualization, Writing—review and editing. All authors have read and agreed to the published version of the manuscript.

Funding

This research was financially supported by the National Natural Science Foundation of China (Grant Nos. 71974080, 61973143, 11731014, 51876081, 11572343, and 51622404), the Major Program of National Natural Science Foundation of China (Grant No. 71690242), National Key Research and Development Program of China (Grant No. 2020YFA0608601), and from the Brazilian Funding Agencies FACEPE (APQ- 0565-1.05/14, APQ-0707-1.05/14), CAPES and CNPq (167597/2017, 309961/2017, 436859/2018).

Institutional Review Board Statement

Not applicable.

Informed Consent Statement

Not applicable.

Data Availability Statement

Not applicable.

Acknowledgments

This research was financially supported by the National Natural Science Foundation of China, the Major Program of National Natural Science Foundation of China, National Key Research and Development Program of China, and from the Brazilian Funding Agencies FACEPE, CAPES and CNPq. G.D. thanks Young backbone teachers of Jiangsu Province.

Conflicts of Interest

The authors declare no conflict of interest.

Appendix A

Table A1. Codes and sectors.
CodeSector
S1Agriculture
S2Fishing
S3Mining and Quarrying
S4Food & Beverages
S5Textiles and Wearing Apparel
S6Wood and Paper
S7Petroleum, Chemical and Non-Metallic Mineral Products
S8Metal Products
S9Electrical and Machinery
S10Transport Equipment
S11Other Manufacturing
S12Recycling
S13Electricity, Gas and Water
S14Construction
S15Maintenance and Repair
S16Wholesale Trade
S17Retail Trade
S18Hotels and Restraurants
S19Transport
S20Post and Telecommunications
S21Finacial Intermediation and Business Activities
S22Public Administration
S23Education, Health and Other Services
S24Private Households
S25Others
S26Re-export & Re-import
Table A2. Countries, codes, and continents.
CountryCodeContinentCountryCodeContinent
AfghanistanAFGAsiaLithuaniaLTUEurope
AlbaniaALBEuropeMalaysiaMYSAsia
ArmeniaARMAsiaMoldovaMDAEurope
AzerbaijanAZEAsiaMyanmarMMRAsia
BahrainBHRAsiaOmanOMNAsia
BangladeshBGDAsiaPakistanPAKAsia
BelarusBLREuropePhilippinesPHLAsia
Bosnia and HerzegovinaBIHEuropePolandPOLEurope
BruneiBRNAsiaQatarQATAsia
BulgariaBGREuropeRomaniaROUEurope
ChinaCHNAsiaRussiaRUSEurope
CroatiaHRVEuropeSaudi ArabiaSAUAsia
Czech RepublicCZEEuropeSerbiaSRBEurope
EgyptEGYAricaSingaporeSGPAsia
EstoniaESTEuropeSlovakiaSVKEurope
GeorgiaGEOAsiaSloveniaSVNEurope
HungaryHUNEuropeSyriaSYRAsia
IndiaINDAsiaTajikistanTJKAsia
IndonesiaIDNAsiaTFYR MacedoniaMKDEurope
IranIRNAsiaThailandTHAAsia
IraqIRQAsiaTurkeyTURAsia
IsraelISRAsiaTurkmenistanTKMAsia
JordanJORAsiaUAEAREAsia
KazakhstanKAZAsiaUkraineUKREurope
KuwaitKWTAsiaUzbekistanUZBAsia
KyrgyzstanKGZAsiaVietnamVNMAsia
LatviaLVAEuropeYemenYEMAsia
LebanonLBNAsia

References

  1. Zou, C.; Zhao, Q.; Zhang, G.; Xiong, B. Energy revolution: From a fossil energy era to a new energy era. Nat. Gas Ind. B 2016, 3, 1–11. [Google Scholar] [CrossRef] [Green Version]
  2. International Energy Agency. 2020. Available online: https://www.iea.org/data-and-statistics (accessed on 26 September 2021).
  3. BP Statistical Review World Energy. 2020. Available online: https://www.bp.com/en/global/corporate/energy-economics/statistical-review-of-world-energy/natural-gas.html (accessed on 28 September 2021).
  4. Kan, S.; Chen, B.; Wu, X.; Chen, Z.; Chen, G. Natural gas overview for world economy: From primary supply to final demand via global supply chains. Energy Policy 2019, 124, 215–225. [Google Scholar] [CrossRef]
  5. Zhang, C.; Fu, J.; Pu, Z. A study of the petroleum trade network of countries along “The Belt and Road Initiative”. J. Clean. Prod. 2019, 222, 593–605. [Google Scholar] [CrossRef]
  6. Van de Graaf, T.; Colgan, J.D. Russian gas games or well-oiled conflict? Energy security and the 2014 Ukraine crisis. Energy Res. Soc. Sci. 2017, 24, 59–64. [Google Scholar] [CrossRef] [Green Version]
  7. Geng, J.B.; Ji, Q.; Fan, Y. A dynamic analysis on global natural gas trade network. Appl. Energy 2014, 132, 23–33. [Google Scholar] [CrossRef]
  8. Li, J.; Dong, X.; Jiang, Q.; Dong, K.; Liu, G. Natural gas trade network of countries and regions along the belt and road: Where to go in the future? Resour. Policy 2021, 71, 101981. [Google Scholar] [CrossRef]
  9. Wang, X.; Yao, M.; Li, J.; Ge, J.; Wei, W.; Wu, B.; Zhang, M. Global embodied rare earths flows and the outflow paths of China’s embodied rare earths: Combining multi-regional input-output analysis with the complex network approach. J. Clean. Prod. 2019, 216, 435–445. [Google Scholar] [CrossRef]
  10. Hewings, G.J.; Jensen, R.C. Regional, interregional and multiregional input-output analysis. In Handbook of Regional and Urban Economics; Elsevier: Amsterdam, The Netherlands, 1987; Volume 1, pp. 295–355. [Google Scholar]
  11. Wang, Z.; Yang, Y.; Wang, B. Carbon footprints and embodied CO2 transfers among provinces in China. Renew. Sustain. Energy Rev. 2018, 82, 1068–1078. [Google Scholar] [CrossRef]
  12. Zhang, C.; Anadon, L.D. A multi-regional input–output analysis of domestic virtual water trade and provincial water footprint in China. Ecol. Econ. 2014, 100, 159–172. [Google Scholar] [CrossRef]
  13. Zhang, C.; Zhong, L.; Liang, S.; Sanders, K.T.; Wang, J.; Xu, M. Virtual scarce water embodied in inter-provincial electricity transmission in China. Appl. Energy 2017, 187, 438–448. [Google Scholar] [CrossRef] [Green Version]
  14. Zhang, Y.; Zhang, J.H.; Tian, Q.; Liu, Z.H.; Zhang, H.L. Virtual water trade of agricultural products: A new perspective to explore the Belt and Road. Sci. Total Environ. 2018, 622, 988–996. [Google Scholar] [CrossRef]
  15. Chen, G.; Li, J.; Chen, B.; Wen, C.; Yang, Q.; Alsaedi, A.; Hayat, T. An overview of mercury emissions by global fuel combustion: The impact of international trade. Renew. Sustain. Energy Rev. 2016, 65, 345–355. [Google Scholar] [CrossRef]
  16. White, D.J.; Feng, K.; Sun, L.; Hubacek, K. A hydro-economic MRIO analysis of the Haihe River Basin’s water footprint and water stress. Ecol. Model. 2015, 318, 157–167. [Google Scholar] [CrossRef]
  17. Wang, L.; Zou, Z.; Liang, S.; Xu, M. Virtual scarce water flows and economic benefits of the Belt and Road Initiative. J. Clean. Prod. 2020, 253, 119936. [Google Scholar] [CrossRef]
  18. Chen, K.; Luo, P.; Sun, B.; Wang, H. Which stocks are profitable? A network method to investigate the effects of network structure on stock returns. Phys. A Stat. Mech. Appl. 2015, 436, 224–235. [Google Scholar] [CrossRef]
  19. Gao, X.; Fang, W.; An, F.; Wang, Y. Detecting method for crude oil price fluctuation mechanism under different periodic time series. Appl. Energy 2017, 192, 201–212. [Google Scholar] [CrossRef]
  20. Du, R.; Dong, G.; Tian, L.; Wang, Y.; Zhao, L.; Zhang, X.; Vilela, A.L.; Stanley, H.E. Identifying the peak point of systemic risk in international crude oil importing trade. Energy 2019, 176, 281–291. [Google Scholar] [CrossRef]
  21. Du, R.; Wang, Y.; Dong, G.; Tian, L.; Liu, Y.; Wang, M.; Fang, G. A complex network perspective on interrelations and evolution features of international oil trade, 2002–2013. Appl. Energy 2017, 196, 142–151. [Google Scholar] [CrossRef]
  22. Sun, X.; Li, J.; Qiao, H.; Zhang, B. Energy implications of China’s regional development: New insights from multi-regional input-output analysis. Appl. Energy 2017, 196, 118–131. [Google Scholar] [CrossRef]
  23. Fan, J.; Meng, J.; Ashkenazy, Y.; Havlin, S.; Schellnhuber, H.J. Network analysis reveals strongly localized impacts of El Niño. Proc. Natl. Acad. Sci. USA 2017, 114, 7543–7548. [Google Scholar] [CrossRef] [Green Version]
  24. Meng, J.; Fan, J.; Ashkenazy, Y.; Havlin, S. Percolation framework to describe El Niño conditions. Chaos Interdiscip. J. Nonlinear Sci. 2017, 27, 035807. [Google Scholar] [CrossRef]
  25. Schweitzer, F.; Fagiolo, G.; Sornette, D.; Vega-Redondo, F.; Vespignani, A.; White, D.R. Economic networks: The new challenges. Science 2009, 325, 422–425. [Google Scholar] [CrossRef]
  26. Chen, B.; Wang, X.; Li, Y.; Yang, Q.; Li, J. Energy-induced mercury emissions in global supply chain networks: Structural characteristics and policy implications. Sci. Total Environ. 2019, 670, 87–97. [Google Scholar] [CrossRef]
  27. Chen, B.; Li, J.; Chen, G.; Wei, W.; Yang, Q.; Yao, M.; Shao, J.; Zhou, M.; Xia, X.; Dong, K.; et al. China’s energy-related mercury emissions: Characteristics, impact of trade and mitigation policies. J. Clean. Prod. 2017, 141, 1259–1266. [Google Scholar] [CrossRef]
  28. Chen, B.; Li, J.; Wu, X.; Han, M.; Zeng, L.; Li, Z.; Chen, G. Global energy flows embodied in international trade: A combination of environmentally extended input–output analysis and complex network analysis. Appl. Energy 2018, 210, 98–107. [Google Scholar] [CrossRef]
  29. Gao, C.; Su, B.; Sun, M.; Zhang, X.; Zhang, Z. Interprovincial transfer of embodied primary energy in China: A complex network approach. Appl. Energy 2018, 215, 792–807. [Google Scholar] [CrossRef]
  30. Sun, X.; An, H.; Gao, X.; Jia, X.; Liu, X. Indirect energy flow between industrial sectors in China: A complex network approach. Energy 2016, 94, 195–205. [Google Scholar] [CrossRef]
  31. Liang, X.; Yang, X.; Yan, F.; Li, Z. Exploring global embodied metal flows in international trade based combination of multi-regional input-output analysis and complex network analysis. Resour. Policy 2020, 67, 101661. [Google Scholar] [CrossRef]
  32. Li, H.; Qin, W.; Li, J.; Tian, Z.; Jiao, F.; Yang, C. Tracing the global tin flow network: Highly concentrated production and consumption. Resour. Conserv. Recycl. 2021, 169, 105495. [Google Scholar] [CrossRef]
  33. Deng, G.; Lu, F.; Wu, L.; Xu, C. Social network analysis of virtual water trade among major countries in the world. Sci. Total Environ. 2021, 753, 142043. [Google Scholar] [CrossRef] [PubMed]
  34. Zhao, H.; Qu, S.; Guo, S.; Zhao, H.; Liang, S.; Xu, M. Virtual water scarcity risk to global trade under climate change. J. Clean. Prod. 2019, 230, 1013–1026. [Google Scholar] [CrossRef]
  35. Zhao, H.; Qu, S.; Liu, Y.; Guo, S.; Zhao, H.; Chiu, A.C.; Liang, S.; Zou, J.P.; Xu, M. Virtual water scarcity risk in China. Resour. Conserv. Recycl. 2020, 160, 104886. [Google Scholar] [CrossRef]
  36. Liu, Y.; Chen, B. Water-energy scarcity nexus risk in the national trade system based on multiregional input-output and network environ analyses. Appl. Energy 2020, 268, 114974. [Google Scholar] [CrossRef]
  37. Qu, S.; Liang, S.; Konar, M.; Zhu, Z.; Chiu, A.S.; Jia, X.; Xu, M. Virtual water scarcity risk to the global trade system. Environ. Sci. Technol. 2018, 52, 673–683. [Google Scholar] [CrossRef]
  38. Miller, R.E.; Blair, P.D. Input-Output Analysis: Foundations and Extensions; Cambridge University Press: Cambridge, UK, 2009. [Google Scholar]
  39. Zhang, W.; Fan, X.; Liu, Y.; Wang, S.; Chen, B. Spillover risk analysis of virtual water trade based on multi-regional input-output model-A case study. J. Environ. Manag. 2020, 275, 111242. [Google Scholar] [CrossRef]
  40. Dietzenbacher, E. In vindication of the Ghosh model: A reinterpretation as a price model. J. Reg. Sci. 1997, 37, 629–651. [Google Scholar] [CrossRef]
  41. Zhou, M.; Wu, G.; Xu, H. Structure and formation of top networks in international trade, 2001–2010. Soc. Netw. 2016, 44, 9–21. [Google Scholar] [CrossRef]
  42. Lenzen, M.; Kanemoto, K.; Moran, D.; Geschke, A. Mapping the structure of the world economy. Environ. Sci. Technol. 2012, 46, 8374–8381. [Google Scholar] [CrossRef]
  43. Lenzen, M.; Moran, D.; Kanemoto, K.; Geschke, A. Building Eora: A global multi-region input–output database at high country and sector resolution. Econ. Syst. Res. 2013, 25, 20–49. [Google Scholar] [CrossRef]
  44. Central Intelligence Agency. 2020. Available online: https://www.cia.gov/the-world-factbook/ (accessed on 1 October 2021).
  45. Tang, M.; Hong, J.; Liu, G.; Shen, G.Q. Exploring energy flows embodied in China’s economy from the regional and sectoral perspectives via combination of multi-regional input–output analysis and a complex network approach. Energy 2019, 170, 1191–1201. [Google Scholar] [CrossRef]
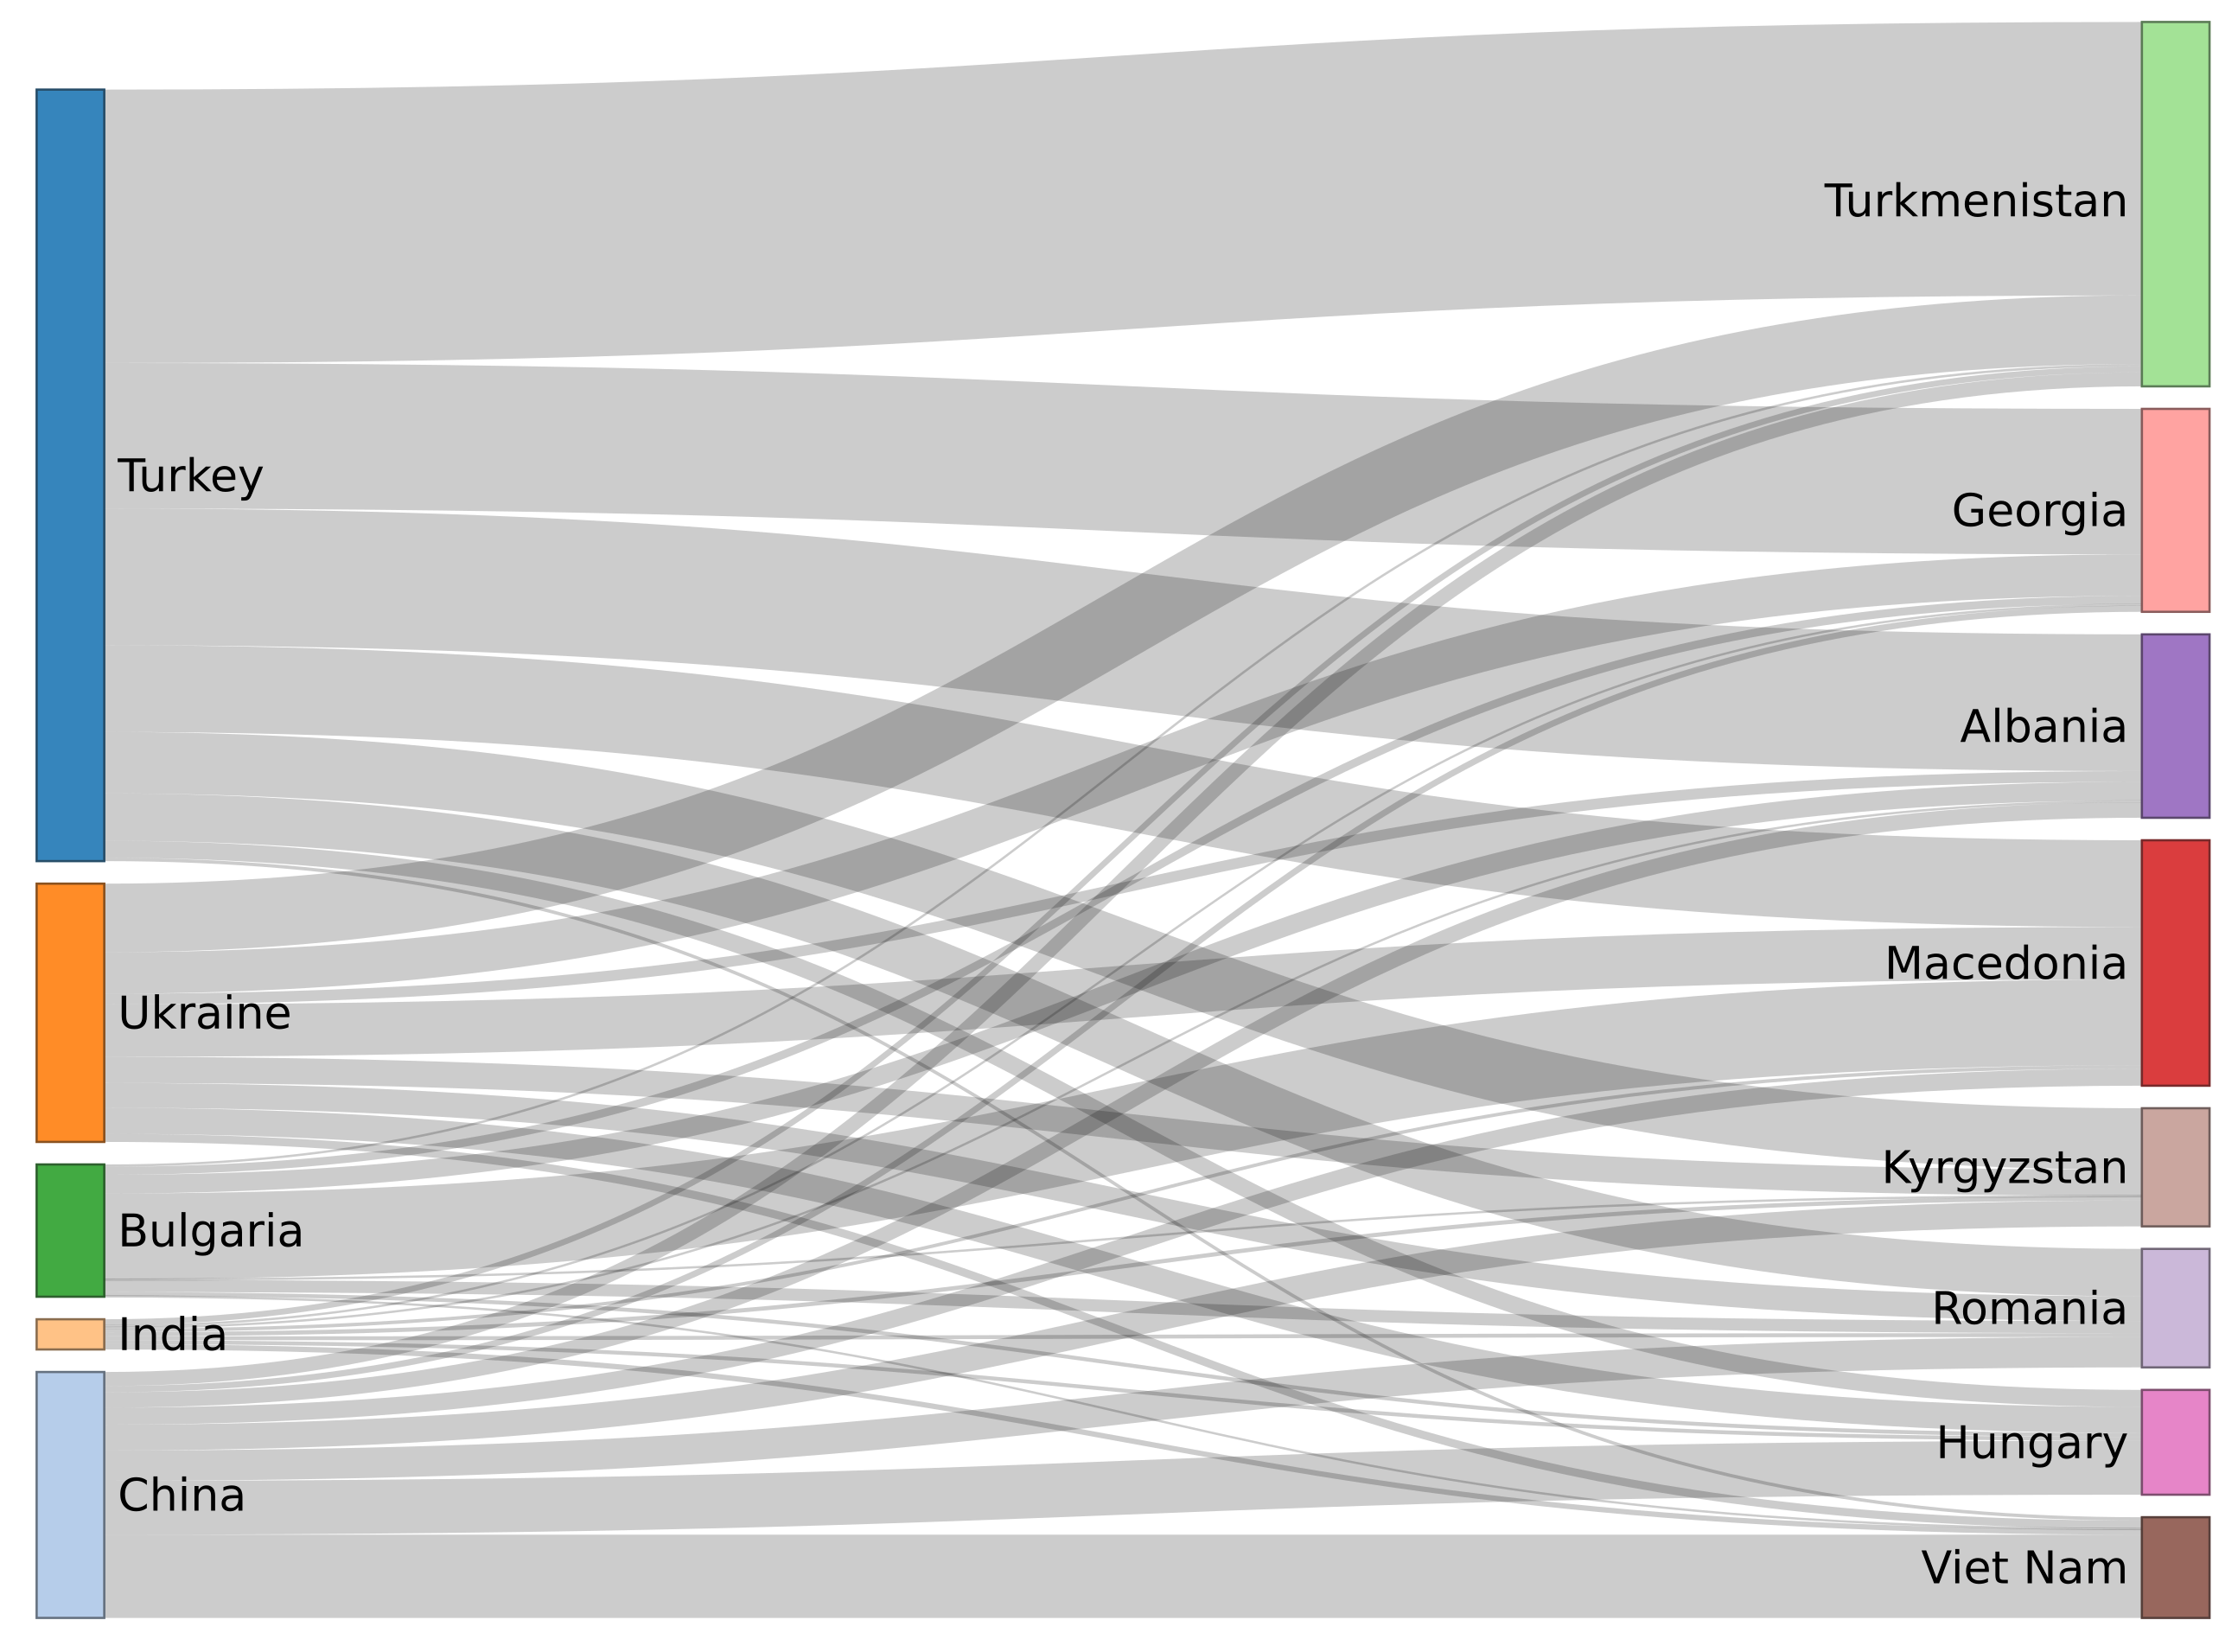
Figure 1. Natural gas stress index GSI and the inferred probability of natural gas scarcity under different σ values. The nation-sectors are sorted with decreasing GSI.
Energies 15 01053 g001
Figure 2. Sectoral natural gas intensity and the corresponding natural gas dependence sorted with decreasing GI.
Energies 15 01053 g002
Figure 3. Local natural gas scarcity risks. Five main sectors in top ten countries suffered natural gas scarcity-induced economic risk are demonstrated.
Energies 15 01053 g003
Figure 4. Main EGSR flow relationships at the country level.
Energies 15 01053 g004
Figure 5. Change of rankings from LGSRs to EGSR for the top 15 countries with the highest EGSR. (a) from LGSRs to EGSR imports; (b) from LGSRs to EGSR exports.
Energies 15 01053 g005
Figure 6. The main EGSR flow relationships at the sector level.
Energies 15 01053 g006
Figure 7. Change of rankings from the LGSRs to EGSR for the top 15 sectors with the highest EGSR. (a) from LGSRs to EGSR imports; (b) from LGSRs to EGSR exports.
Energies 15 01053 g007
Figure 8. The relationship between the percentage of EGSRs in the Top-level network to the overall EGSRs of the Belt and Road economies and the level selected by the Top network.
Energies 15 01053 g008
Figure 9. Top EGSR network. The color shades imply the values of EGSR normalized by the total EGSRs. The edges of the same color are members of the same cluster. The clockwise bending direction of the edge represents the direction of EGSR transfer. (a) Top 4 EGSR import network; (b) Top 9 EGSR import network.
Energies 15 01053 g009aEnergies 15 01053 g009b
Table 1. Top 10 countries of EGSR imports/exports, EGSR imports/exports per unit output. Unit of EGSR imports/exports: million dollars.
CountryEGSR
Imports
CountryEGSR Imports
per Unit Output
CountryEGSR
Exports
CountryEGSR Exports
per Unit Output
Turkmenistan3.474Qatar0.805Turkey14.617Bulgaria0.015
Macedonia2.411Belarus0.109China11.131Turkey0.014
Georgia1.934Kyrgyzstan0.089Ukraine8.345Ukraine0.011
Albania1.757Georgia0.078India2.704Thailand0.007
Romania1.250Turkmenistan0.064Bulgaria1.934Lithuania0.004
Vietnam1.230Albania0.063Singapore1.798Poland0.004
Kyrgyzstan1.204Tajikistan0.058Poland0.781Belarus0.003
Bulgaria1.198Armenia0.052Czech0.397Georgia0.003
Hungary1.161Thailand0.025Lithuania0.302Singapore0.002
Jordan1.079Estonia0.021Hungary0.297Serbia0.002
Table 2. The top 10 sectors of EGSR imports/exports, and imports/exports per unit output. Unit of EGSR imports/exports: million dollars.
SectorEGSR ImportsSectorEGSR Imports per Unit Output
Macedonia-S260.484Russia-S241349.738
Turkmenistan-S70.390Kyrgyzstan-S2205.742
Romania-S260.320Kyrgyzstan-S24203.642
Georgia-S70.299Romania-S25176.951
Turkmenistan-S130.259Hungary-S24145.022
Poland-S260.245Slovakia-S24114.939
Turkey-S260.238Romania-S2489.722
Albania-S70.236Myanmar-S2643.331
Turkmenistan-S80.225Vietnam-S2642.837
Turkmenistan-S120.224Jordan-S2639.649
SectorEGSRExportsSectorEGSRExports per Unit Output
Turkey-S712.453Turkey-S70.237
China-S74.448Bulgaria-S70.159
Ukraine-S82.856Ukraine-S80.108
Ukraine-S72.168Bulgaria-S130.083
China-S92.065Ukraine-S70.082
Ukraine-S131.830Singapore-S130.073
China-S81.557Ukraine-S130.065
Singapore-S131.532Ukraine-S190.049
India-S131.514Turkey-S80.039
Bulgaria-S71.317Lithuania-S70.030
Publisher’s Note: MDPI stays neutral with regard to jurisdictional claims in published maps and institutional affiliations.

