Abstract
With the rapid expansion of new energy in China, the large-scale grid connection of new energy is increasing, and the operating safety of the new energy power system is being put to the test. The static security and stability region (SSSR) with hyper-plane expression is an effective instrument for situational awareness and the stability-constrained operation of power systems. This paper proposes a hybrid improved particle swarm optimization (IPSO) and recursive least square (RLS) approach for rapidly approximating the SSSR boundary. Initially, the operating point data in the high-dimensional nodal injection space is examined using the IPSO algorithm to find the key generators, equivalent search space, and crucial points, which have a relatively large impact on static stability. The RLS method is ultimately utilized to fit the SSSR border that best suits the crucial spots. Consequently, the adopted algorithm technique was used to rapidly approximate the SSSR border in power injection spaces. Finally, the suggested algorithm is confirmed by simulating three kinds of generators of the new energy 118 bus system using the DIgSILENT/Power Factory. As a result, this method accurately characterized the stability border of the new energy power system and created the visualization space of the SSSR. Using the SSSR, a rapid state analysis could be undertaken on a variety of parameters, such as security evaluation with diverse energy supply capacities. This study’s findings confirmed the accuracy and efficacy of the suggested modeling for the considered system and may thus give technical support for the new energy power system’s stability.
1. Introduction
China’s dual carbon objective can only be achieved via the transformation of low-carbon energy and the creation of a new power system [1,2]. To accomplish the objective of zero net emissions by 2060, the transition from fossil fuels to new, low-carbon energy sources is essential [3]. Wind energy, being a pure and pollution-free source of energy, stands apart from other clean energy sources [4]. As the percentage of wind turbines linked to the grid rises, their unpredictability and volatility pose new problems to the system’s stability and security [5]. Modern power systems employ transmission lines with high voltage levels and big transmission capacities to link the power grids of two areas to reduce the system’s operating expenses and increase its operational security. Interconnection systems may increase the transmission efficiency of the system, allow for more centralized frequency modulation when variations occur, and allow for cooperation amongst linked systems [6]. Concurrently, regional electricity systems are becoming increasingly interdependent. Once a defect develops in a particular location, the strong connectivity to neighboring power systems will result in widespread cascade failures of interconnected power networks. New power systems with guaranteed security are becoming more essential [7]. In addition, the safe functioning of the system has a certain bearing on the wind turbine itself. Too low a voltage will result in a low voltage crossover of the wind turbine, and too high a voltage will result in a wind turbine fault, even during off-grid operation [8]. Analyzing the security of large-scale modern energy generation systems is of enormous practical value [9].
Due to the strong wind electrode’s unpredictability, the electrical grid’s operating circumstances become more dynamic, making it harder to perform a comprehensive security study [10]. Because the accident set is predetermined, the quantity of data that can be calculated and the breadth of the analysis of the system’s operating condition are constrained, making them insufficient for online real-time analysis. Given the severe constraints and conservatism of the standard approach to analyzing power system security, the investigation of alternative approaches that can accommodate the modern, intricate power grid is of paramount importance. At this juncture in history, the notion of a “security domain” emerges. It is more progressive than the legislation of old and can learn everything about the current condition of a system’s operations. Analyzing the operation characteristics of a wind power system from a “domain” perspective can effectively deal with the uncertainty and volatility of wind power; after studying the boundary property of the “security domain” and forming the domain, the dispatcher can analyze the security of the system more directly and simply by judging the relative position information of the system’s operating point and the boundary of the “security domain”. Power system security zone analysis was first suggested by E. Hnyilicza and Galiana et al. in 1975 [11,12]. To put it geographically, the security domain is the area within which the complete system may be run without risk [13]. Calculating the distance between the operation point and the boundary of the security domain, determining the current operating state of the system, and providing reliable control information for the operating system yields an approximation of the system security margin, which is useful for providing online monitoring information, mitigation, and optimization measures to dispatchers [14].
Thus, the notion of a “security stability region, SSR” was put out by academics. SSR, which was originally presented in the electrical network and is described as a collection of operating points to fulfill the power flow equation and security and stability criteria, is regarded as a powerful instrument. The key challenge in building the SSR is figuring out how to rapidly locate the essential point of steady functioning and shape the border of the SSR [15]. On the other hand, it specifies the biggest safe operating zone of the whole system, which has found widespread use in power systems. Using the relationship between the operating point and the security border, we have given the operators useful information, such as the security margin and the best control choice. In addition, the static security stability region (SSSR) and the dynamic security stability region (DSSR) are derived for the particular security and stability problem.
To avoid any undesirable events, such as voltage collapse, it is essential to maintain the SSSR of a power system. Therefore, voltage instability problems have been of utmost concern for electric utilities, which is closely related to reactive power distribution and heavy load in the wind power transmission system [1,2,3,4,5,6]. Various strategies, including variational sensitivity [16], incorporative dynamic modeling [17], integrated constant power flow [18], optimal power flow [19], Lyapunov–Krasovskiĭ functional method [20], and modified Lyapunov–Razumikhin method [21], have been presented thus far to solve the security difficulties of the new energy power system. The authors of [22] performed an extensive study based on the DC power flow model in an attempt to identify the SSSR, which is composed of the security constraint plane. Reference [23] expanded on the DC model and introduced a decoupling model that takes active and reactive power into account. This model may simultaneously explore active and reactive power challenges. The paper [24] proposes a maximum embedding approach that uses the size of the SSSR as an indicator for measuring the grid margin. The computation procedure is tedious, and the resulting SSR is conservative [25]. To avoid the aforementioned flaws, C. C. Liu employs the expansion approach to determine the maximum security region. Nevertheless, the step size does not vary, while the calculation procedure changes, resulting in a slow calculation time. Moreover, the needed SSR will vary according to the growth order [26]. Literature [27] advocated tracking the border of SSSR using the Lagrangian multiplier approach to construct SSR. Literature [28] increased the efficiency of SSR production by optimizing the search model according to the nature of the grid boundary. Reference [29] demonstrated that the boundary of the security region in engineering applications can be represented by a set of one or more hyperplanes. Literature [30], based on the relationship between the space angle of the space tangent vector at the critical point and the maximum space angle threshold, performs a piecewise approximation of the boundary of the SSSR. Reference [31] utilized the Taylor series trajectory sensitivity method to solve the security region. The reference [32] examines the usage of a combined model-based superconducting fault current limiter and shunt FACTS Controller (STATCOM) for evaluating the transient stability of a power system with an automated voltage regulator. The FACTS controller aids in increasing the dynamic stability limit, improves power flow regulation, and increases asset utilization, system flexibility, and system performance [33].
With the rapid development of artificial intelligence techniques [34,35] and the widespread deployment of new energy power systems, data-driven machine learning methods, such as decision trees [36,37], support vector machines [38,39], K nearest neighbors [40], extreme learning machines [41,42], a differential evolution algorithm [43], the least square support vector machine method [44], a genetic algorithm [45], gravitational search algorithm [46], particle swarm optimization algorithm [47], recursive least square algorithms [14], and recurrent neural networks [48]; all of which are becoming increasingly prevalent. In addition, some intelligent optimization algorithms are also used to analyze power systems. For example, reference [49] gives the “boundary” command in MATLAB to the particle optimal value found by the PSO algorithm and connects them to form the boundary of the security domain. Reference [50] describes an improved ant colony algorithm, which establishes a more intuitive stability criterion by adjusting the participation factors and refining the search rules, and more accurately analyzes the power system’s stability to make the SSSR searched the most comprehensive. Literature [51] uses a neural network algorithm to solve a problem based on the DC power flow model, with the volume of the inner hypercube as the objective function, but still cannot avoid the problem of low calculation efficiency. Reference [52] focuses on incorporating a voltage collapse proximity index in the traditional optimal power flow problem for multi-objective particle swarm optimization (MOPSO). Reference [53] uses the limit gradient lifting tree algorithm to assess power system voltage stability. This algorithm can meet the needs of online assessment but cannot guarantee the global tracking accuracy of SSR critical points. To solve the problems above, many scholars put forward their own opinions. Using intelligent optimization algorithms is one of the effective ways to solve the problems above, many intelligent algorithms have been proposed for the static stability problems of power systems such as PSO, RLS, GA, DEA, GSA algorithm, and so on. The effectiveness of these optimization techniques in the static stability problem of the system has been demonstrated and is widely used. Among them, PSO and RLS are considered the most mature optimization algorithms and are considered benchmarks for optimization techniques [14]. However, the inherent defects of these two algorithms limit their development to a certain extent. The convergence speed of PSO algorithm is slow in the later period, and it is difficult to deal with discrete optimization problems and easy to fall into local optimization; RLS has an insufficient memory ability, the group matures early, and the efficiency is low. Various hybrid IPSO-RLS algorithms have been proposed to overcome the inherent shortcomings of the above two algorithms, However, their application in the static stability problems of power systems is still relatively rare. Because of this, we have created a generic meta-heuristic method for constructing the SSSR in a power system operating on renewable sources of energy. Recently developed alternatives to the model-based approach, such as the improved particle swarm optimization (IPSO) algorithm and the recursive least square (RLS) method [14], have demonstrated significantly increased speed, greater accuracy, and broader applicability. To efficiently identify key generators, this research presented a novel IPSO-RLS algorithm. The following is a brief overview of the main findings of this research.
- A unique mathematical notion and formulations of the proposed grid and its SSR were presented to improve the proposed new energy power system’s reliability through the study of static security and stability.
- This research developed and integrated the benefits of the IPSO algorithm and the RLS method to determine the crucial security stability operation region of the new energy power system more rapidly and precisely. In addition, a unique hybrid IPSO-RLS algorithm for finding the region of greatest static security and stability was developed.
- The SSSR of the system was fitted and examined by IPSO-RLS, all by different energy in the new energy 118 bus system with varying power output.
The remaining part of this work is structured as follows: In Section II, we examine the concept and definition of the power grid, as well as the new energy power system model and solution, and a full overview of the SSSR model, security, and stability restrictions. Section III proposes an innovative IPSO-RLS hybrid algorithm, which combines the strengths of both algorithms. The New England 118 bus system is simulated in Section IV with multiple amounts of new energies, and the findings, together with a security stability study, are presented. Section V provides the conclusions and outlooks.
2. Static Security and Stability Analysis
2.1. Static Security and Stability Analysis
A straightforward approach is presented for evaluating the static security and stability of an electrical system. The SSSR surface depicts the active power, reactive power, and voltage at the stable region point. Figure 1 depicts the circuit diagram used to describe the static security and stability method.
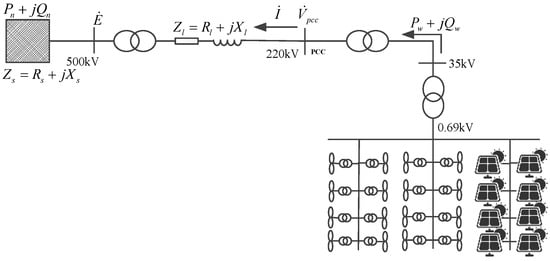
Figure 1.
New energy grid connection system.
is the system balancing point of voltage, is the voltage of new energy farms at PCC, is the equivalent impedance between new energy farms and the grid, is the output apparent power of the new energy farms, and is the current injected by the new energy farms, as illustrated in Figure 1. Using Figure 1 as an example, the following equations may be derived from a basic communication system:
PCC is supplied with the following types of energy by the new energy farms (for example, , ):
By grouping genuine and fictitious concepts, the following may be derived:
Equation (3) may be organized as follows:
Equation (4) may be rearranged to remove, as follows, θ:
When the left and right sides of Equation (5) are multiplied by , the following equation is obtained:
At PCC, the voltage of new energy farms is .
where
Ignoring the transmission line resistance , the voltage at PCC is simplified as:
where , , represent the voltage at grid connection (PCC), the active power output of the new energy farms, and the reactive power output of the new energy farms, respectively.
2.2. SSSR-Surface
Figure 1 depicts the communication system and the notations for system variables used in the subsequent derivations. The relationship between receiving end and transmitting end voltages (E and V), active power (P), and reactive power (Q) may be expressed mathematically as follows:
To plot the SSSR surfaces, a solution must be developed for active and reactive powers and voltage. Four voltage solutions are derived by rearranging and solving for active and reactive powers:
In the formula, the entire SSSR surface is described by the two solutions for P, Q, and four solutions for V.
- (1)
- Equality constraint
The active power and reactive power balancing constraint at each node in the system constitute the power flow constraint equation, which is a requirement of reactive power optimization management of new energies. It is expressed as:
where i,, represents the total node set of the system; and the active power and reactive power injection amount of the node, respectively; and the real and imaginary parts corresponding to the ij branch admittance, respectively; the phase angle difference of the nodes at both ends of the branch ij.
- (2)
- Inequality constraint
For new energies to take part in voltage management in their access region, reactive power optimization control must be in place. The major function of this device is to act as a voltage regulator for the newly installed energy grid connection. Voltage fluctuations occur as a result of system disturbances or when the voltage command is altered by dispatch at a higher level. Maintaining the grid point voltage requires the new energy farms to use a wide range of reactive power devices, which are constantly adjusted. New energy farms must adhere to the following voltage deviation limits from the grid point:
where is the current voltage at the grid-connected point for the new energy farms, is the voltage control instruction from above, and is the margin for error in the control system.
New energy farms are limited in their reactive power regulation capabilities by the following factors:
where represents the voltage control dead zone of the PCC bus for new energy farms.
Then, the variable inequality constraint of the reactive power optimization control of the wind farm also includes the upper and lower bounds of the voltage amplitude of each node and the capacity constraint of the dynamic reactive power regulating device. The expression is:
where and are, respectively, the upper and lower limits of the voltage of node i in the new energy farms.
3. Methodology
3.1. Overview of IPSO
PSO was created by Kennedy and Eberhart in 1995 to replicate social behavior, as a stylized portrayal of the movement of creatures in a flock of birds or a school of fish [54]. It solves a problem by having a population of possible solutions, referred to as particles, and by moving these particles about in the search space based on a simple mathematical formula for each particle’s location and velocity. Furthermore, each particle’s motion is controlled by its local best-known position (Pbest) but is also directed toward the best-known locations in the search space, which are discovered by other particles as the global best position (Gbest). In conclusion, the objective of the search procedure is to accelerate each particle toward its (Pbest) and the swarm’s global best (Gbest) shown in Figure 2.
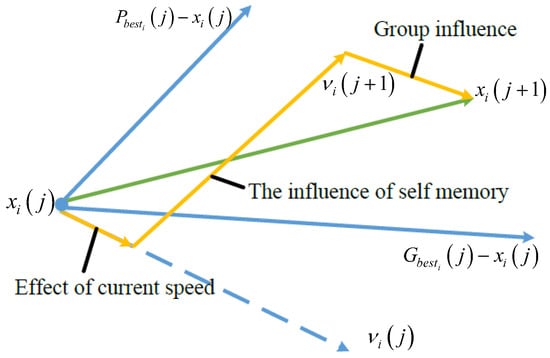
Figure 2.
Searching criteria in the standard PSO algorithm.
The particle velocity and update equations are stated as:
where is the inertia weight factor, and ; i = 1, 2, …, n; j = 1, 2, …, m, j + 1 is the current iteration number, j is the previous iteration number, c1 and c2 are the acceleration constants for thinking and interacting, which are usually between [0, 2], and r1 and r2 are two independent random variables drawn from a uniform distribution throughout the interval in the range of [0, 1]. The trajectory of the particles in the range of c2 is shown in Figure 3.
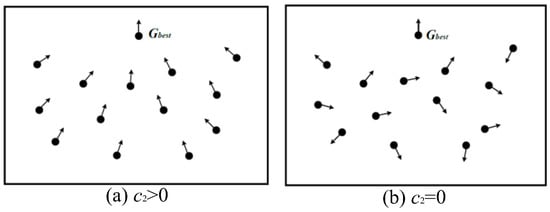
Figure 3.
Convergence speed of IPSO algorithm.
3.2. RLS Method
The least square (LS) technique, initially presented by Gauss (k. f. Gauss) in his study of the prediction of orbital motion, is the simplest and most used approach [55]. Based on the LS, the RLS is a new approach that fixes its memory consumption issues and allows for an online identification to be performed. It is commonly utilized because of its ability to achieve numerical forecasts [56,57]. Every time fresh observation data is collected, the RLS updates its parameter estimations, ensuring a consistently good identification outcome.
For an observable system, its L-group input and output observations can be expressed as the LS estimate of the system parameters can be obtained:
where Φ is the data vector matrix and Y is the system output matrix.
The idea of the recursive least squares method is:
The recursive idea is introduced into Equation (20); that is, the least squares method is developed into a batch RLS. From this, at the time k, the least squares estimate can be obtained.
where ; .
Cause
Therefore
From Equations (22) and (23), the estimated value at the time k − 1 can be derived:
Available from Equations. (24) and (25):
Then, the least squares estimate at the time k can be expressed as:
where K(k) is the gain vector and K(k) = P(k) φ(k).
The RLS iterative formula may be derived using the matrix inversion lemma as follows:
3.3. The Parameter Identification Basis on IPSO-RLS
Although it is challenging to assure the accuracy of the IPSO algorithm’s range estimation, its global optimization capability assists in reducing the solution range and approximating the ideal solution. The RLS’s sensitivity to the beginning value of the iteration is its primary downside. However, when the beginning value of the iteration is closer to the actual solution, RLS converges quickly and with great precision. To obtain the required results, it is necessary to combine the global optimization capability of IPSO with the rapid convergence capability of the RLS in the neighborhood of the global optimum solution. Figure 4 depicts the block diagram for locating the global optimum SSSR-surface process using the hybrid IPSO-RLS method.
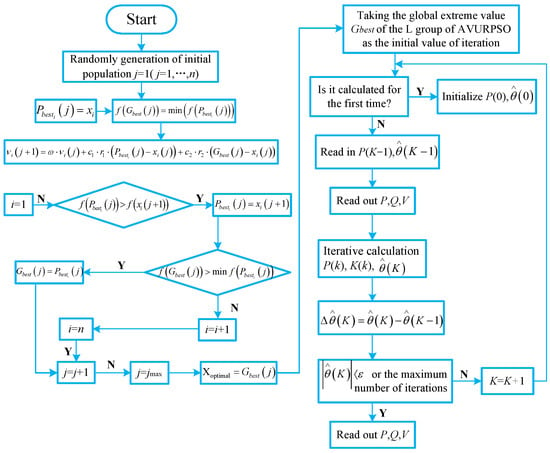
Figure 4.
The flow chart of the IPSO-RLS optimization method.
The step-by-step procedure of the proposed algorithm is explained below.
Step 1: Input the original data and necessary parameters;
Input all the relevant electrical data of the system, including the system’s node, branch information, control parameters, and all kinds of constraint conditions. Further, the operating parameters of the optimization algorithm are set.
Step 2: With the specifications from step 1, perform the power flow calculations for the given network;
Step 3: Initialize a group of particles (group size N), including their random positions and velocity vectors;
Step 4: Evaluate the fitness value of each particle;
Step 5: For each particle, its fitness value (P) is compared with its best position (Pbest). If the obtained fitness is better than Pbest, then the current best position (Pbest) is updated with the obtained fitness;
Step 6: Update the particle velocity and position based on Equations (17) and (18);
The velocity updating was calculated based on Equation (17) while the upper and lower limits were considered as follows:
Besides, the position updating was calculated based on (18), whereas the upper and lower limits were decided as follows:
This procedure is followed to obtain Gbest;
Step 7: Taking the global extreme value, Gbest from the L-group of IPSO as the initial value for RLS iterations;
Step 8: If it is the first iteration of the calculation, initialize P(0), and proceed with the iterations; otherwise, read P(k−1), .
Step 9: If either the condition is satisfied or the maximum number of iterations is reached, read the global optimum and end the process; otherwise continue with the next iteration.
Finally, based on the parameter identification result from Equation (10), one can plot the SSSR-surface map for the new energy farms.
In the new energy power system, the connection between active power, reactive power, and voltage is well-defined for every given system configuration. The SSSR surface may be used to estimate the available margin of a grid-connected new energy power system and to develop a wind and PV power scheduling strategy. When system disruptions occur, the power margin needs to be satisfied and may be estimated based on the SSSR surface, and efforts should be made to improve the margin.
4. Test System Simulation Results and Discussions
4.1. Introduction of New England 118 Bus System
The New England 118 bus system has 54 generators, 91 load nodes, and 186 lines, and the installed capacity of the generators ranges from 20 to 650 MW. Its topology is shown in Figure 5. The modeling and simulation of the SSSR of the IEEE 118 bus system with new energy are carried out, in which the doubly fed asynchronous wind turbine (DFIG) with a single unit capacity of 5 MW is connected at Bus 25. When a 3 PH, 5 MW photovoltaic unit is connected to Bus 59, the active power ratio of the wind power plant is about twice that of the photovoltaic power plant.
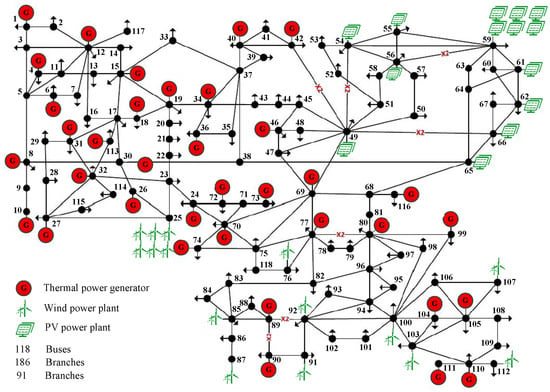
Figure 5.
New England 118 bus system.
4.2. SSSR-Surface Calculation
According to the time domain simulation results of the DIgSILENT/Power Factory power system simulation software, the operating point parameters of all nodes can be obtained, and the power flow calculation result sample data of the system can be obtained. The three-dimensional SSSR of the system is fitted through the identification of IPSO-RLS algorithm parameters in Figure 4. The IPSO-RLS hybrid algorithm is implemented by using MATLAB language. The parameters set in the algorithm are: the population size is 30, and the maximum number of iterations is 100. In the two-dimensional SSR plane obtained by using the IPSO-RLS hybrid algorithm in the Figure 6, the dark purple area is the safe operation area.
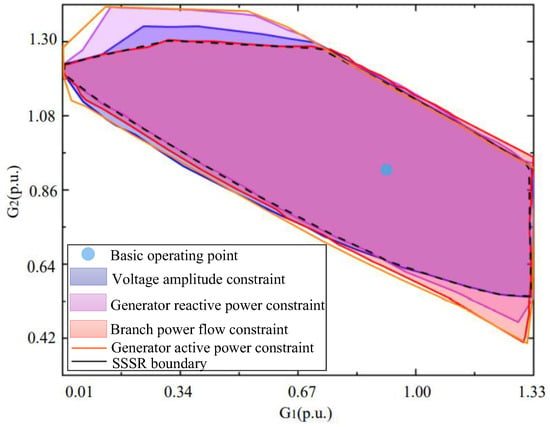
Figure 6.
Two-dimensional SSR constructed by IPSO-RLS hybrid algorithm.
For parameter identification, take synchronous unit G89, wind turbine DFIG (GDFIG25), and the PV unit (GPV59) of IEEE 118 bus system as examples to obtain the three-dimensional SSSR, as shown in Figure 7, Figure 8 and Figure 9.
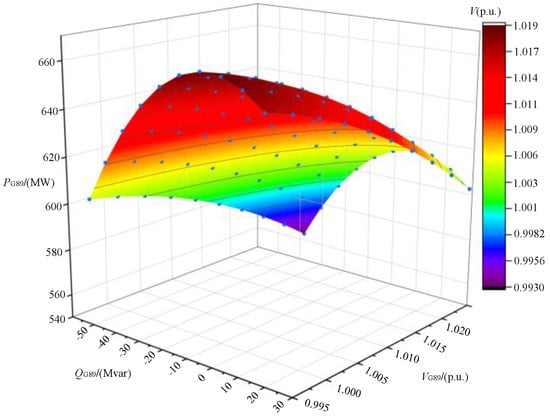
Figure 7.
SSSR of G89 synchronous unit.
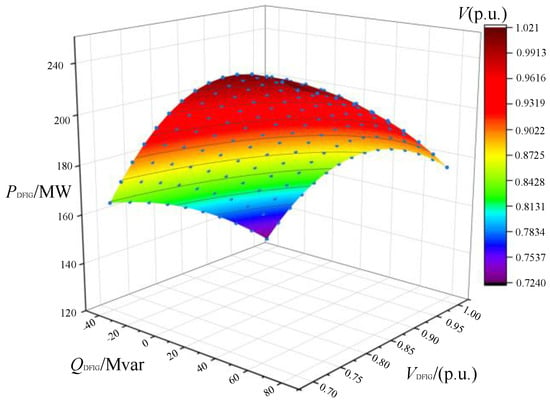
Figure 8.
SSSR of GDFIG25 wind power unit.
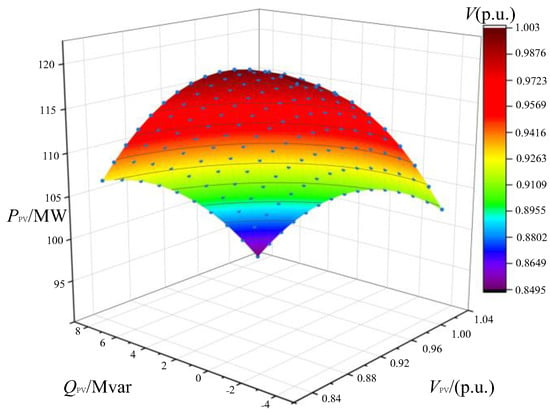
Figure 9.
SSSR of GPV59 PV power unit.
The static security and stability operation point values of G89, GDFIG25, and GPV59 are obtained from the visual SSSR in Figure 7, Figure 8 and Figure 9. After the new energy is connected to the system, due to its strong uncertainty, it harms the security and stability of the system. Therefore, the security and stability of the new energy power system are improved through the security and stability region, and the instability and collapse of the system are prevented through the safe and stable operation point to ensure the security and stability of the system. With the increase of the new energy penetration rate of the system, the area of the fitted safe and stable region will become smaller and smaller, and the points that can make the system operate safely and stably will also change. Therefore, a reasonable and scientific grid connection ratio of new energy plays an important role in improving the security and stability of the power system. The SSSR studied in this paper can provide important information, such as the set of safe and stable operating points of the system and the weak links of the operating points. The static safety and stability distance (SSSD) of the system can be obtained from Figure 7, Figure 8 and Figure 9, to judge whether the operation point is safe and stable and to find out the weak links of the system.
It can be seen from Table 1, Table 2 and Table 3 that the active power, reactive power, and voltage boundary values of the operating points on the surface of the SSSR are the per unit values taken from the three-dimensional visualization surface, which means that all the operating points of the system are within the boundary value range, which is safe and stable, and vice versa. The fitting error of the SSSR used in engineering is within 5%, so the results obtained are feasible. For the SSSR studied, the operating point with a large SSSD makes the system more secure and stable, has better elasticity, and can better contain the uncertainty of new energy. For traditional synchronous generator sets, operation point 15 is a relatively weak link. For wind turbines, operation points 4 and 6 are relatively weak compared with operation points 8, 10, and 15. For PV units, operation points 4 and 14 are weak links. As a new means of power system security and stability assessment and control of the grid security and stability margin, SSSR is more directly and closely related to the uncertainty in the new energy power system, so it is more scientific and effective to identify the weak links of the grid. With the rapid development of new energy and the increasing uncertainty of power systems, the SSSR has important research value and engineering use value.

Table 1.
Time domain simulation SSSR parameters of synchronous unit G89.

Table 2.
Time domain simulation SSSR parameters of wind power unit GDFIG25.

Table 3.
Time domain simulation SSSR parameters of PV power unit GPV59.
4.3. Comparison and Analysis for Conclusions
In this paper, the hybrid IPSO-RLS is applied for SSSR-surface parameter identification, and the obtained simulation results are compared with that of the basic PSO and IPSO algorithms. To verify the feasibility of the proposed algorithm, the error and convergence accuracy of the three algorithms are compared and analyzed using the simulation results. Therefore, it can be seen from Table 4 that with different optimization algorithms, when the distance of SSSD becomes longer, the system stability boundary value will become larger. In this way, not only the SSSR domain can be obtained more accurately in the iteration process, but also, the stability of the system’s operation can be guaranteed.

Table 4.
Comparison of SSSR surface parameters of different algorithms for three units.
It can be seen from Figure 10 that the results of the PSO and IPSO algorithms are very different from the results of the IPSO-RLS hybrid algorithm in the three cases considered. With the increase of iteration times, the convergence accuracy of the three algorithms is slightly improved. However, it should be noted that the convergence accuracy of the IPSO-RLS algorithm is always higher than that of the PSO and IPSO algorithms. Considering the small fitting error of the IPSO-RLS hybrid algorithm, it can be concluded that the IPSO-RLS hybrid algorithm has the highest convergence speed and accuracy compared with the other two algorithms.
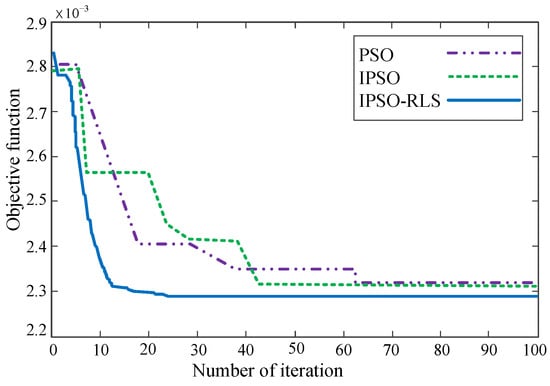
Figure 10.
Convergences of the objective function for Gbest.
5. Conclusions
Taking the IEEE 118 bus system as an example, this paper studies the SSSR of the new energy power system. Through the simulation study, the SSSR of the new energy power system can be effectively fitted to ensure safe and stable operation. The following conclusions are drawn:
- The new energy power system’s IPSO-RLS static security and stability region critical point search optimization model constructed can greatly reduce the optimization space of the critical point search, while ensuring the accuracy and precision of the searched critical point, achieve an effective dimensionality reduction of the high-dimensional space security and stability region critical point search, and improve the search efficiency of the critical point.
- The critical value, fitting error, and safety distance of different generator operation points are obtained by comparing the static safety and stability regions of three different generator sets. According to the safe distance from the critical value to the operating point, it can be judged whether the point is in the safe and stable region and whether it is a weak link. For traditional generator sets, operation point 15 is a relatively weak link. For wind turbines, operation points 4 and 6 are relatively weak compared with operation points 8, 10, and 15. For photovoltaic units, operation points 4 and 14 are weak links. The fitting error in engineering is less than 5%. The error verification results obtained in this paper are reasonable, which proves that this method can be applied in engineering practice.
- The proposed static security stability region boundary search method based on the IPSO-RLS algorithm effectively avoids the complex optimization process of the traditional “point-by-point method”. While ensuring the error, convergence accuracy, and convergence speed, the effectiveness of the proposed method in obtaining the static security and stability region of the new energy power system is verified, which also lays a foundation for practical research.
Author Contributions
S.M.: conceptualization, methodology, data curation, formal analysis, validation, writing-original draft, writing-review, and editing. W.W. and H.W.: supervision, and funding acquisition. J.W.: resources and validation. M.M.: writing—review and editing. All authors have read and agreed to the published version of the manuscript.
Funding
This research was funded by the National Key Research and Development project, sub-project (2020YFC0827000); the National Natural Science Foundation project (52067020); and in part, the National Natural Science Foundation project (52267005), the Autonomous Region Natural Science Foundation (2020D01C068), and the National Natural Science Foundation of China (52167016).
Institutional Review Board Statement
Not applicable.
Informed Consent Statement
Not applicable.
Data Availability Statement
All data generated or analyzed during this study are included in this published article.
Acknowledgments
The authors would like to express their sincere gratitude to the experts for their unlimited support in the validation of the framework and suggestions as well as for providing some data. The authors want to thank the editor and anonymous reviewers for their valuable comments and suggestions to improve the version of this article.
Conflicts of Interest
The authors declare that they have no known competing financial interests or personal relationships that could have appeared to influence the work reported in this paper.
References
- Zhu, H.; Goh, H.H.; Zhang, D.; Ahmad, T.; Liu, H.; Wang, S.; Li, S.; Liu, T.; Dai, H.; Wu, T. Key technologies for smart energy systems: Recent developments, challenges, and research opportunities in the context of carbon neutrality. J. Clean. Prod. 2022, 331, 129809. [Google Scholar] [CrossRef]
- You, Y.; Yi, L. Energy industry Carbon neutrality transition path: Corpus-based AHP-DEMATEL system modelling. Energy Rep. 2022, 8, 25–39. [Google Scholar] [CrossRef]
- Shabani, H.R.; Kalantar, M. Real-time transient stability detection in the power system with high penetration of DFIG-based wind farms using transient energy function. Int. J. Electr. Power Energy Syst. 2021, 133, 107319. [Google Scholar] [CrossRef]
- Boričić, A.; Torres, J.L.R.; Popov, M. Fundamental study on the influence of dynamic load and distributed energy resources on power system short-term voltage stability. Int. J. Electr. Power Energy Syst. 2021, 131, 107141. [Google Scholar] [CrossRef]
- Adetokun, B.B.; Muriithi, C.M.; Ojo, J.O. Voltage stability assessment and enhancement of power grid with increasing wind energy penetration. Int. J. Electr. Power Energy Syst. 2020, 120, 105988. [Google Scholar] [CrossRef]
- Wang, J.; Xu, J.; Liao, S.; Sima, L. Coordinated Optimization of Integrated Electricity-Gas Energy System Considering Uncertainty of Renewable Energy Output. Auto. Elect. Power Syst. 2019, 43, 2–9. [Google Scholar]
- Dong, X.; Tang, Y.; Bu, G.; Shen, C.; Song, G.; Wang, Z.; Gan, D.; Hou, J.; Wang, B.; Zhao, B.; et al. Confronting problem and challenge of large-scale AC-DC hybrid power grid operation. Proc. Chin. Soc. Electr. Eng. 2019, 39, 3107–3119. [Google Scholar]
- Li, B.; Chao, P.; Li, W.; Xu, S.; Liu, X.; Li, Z. Transient overvoltage calculation method of wind power transmission system via UHVDC. Electr. Mach. Control 2021, 25, 11–18. [Google Scholar]
- Tu, J.; Zhang, J.; Liu, M.; Yi, J. Study on Wind Turbine Generators Tripping Caused by HVDC Contingencies of Wind-Thermal-Bundled HVDC Transmission Systems. Power Syst. Technol. 2015, 39, 3333–3338. [Google Scholar]
- Wu, Y.; Hu, M.; Liao, M.; Liu, F.; Xu, C. Risk assessment of renewable energy-based island microgrid using the HFLTS-cloud model method. J. Clean. Prod. 2021, 284, 125362. [Google Scholar] [CrossRef]
- Hnyilicza, E.; Lee, S.; Schweppe, F.C. Steady-State Security Regions: Set-the Oretic Approach. In Proceedings of the Conference of Power Industry Computer Application, New Orleans, LA, USA, 2–4 June 1975; pp. 347–355. [Google Scholar]
- Galiana, J.J.F.D. Quantitative Analysis of Steady State Stability in Power Networks. IEEE Trans. Power Appar. Syst. 1981, 1, 318–326. [Google Scholar]
- Phillipe, V.G.; Saraiva, J.T. State-of-the-art of transmission expansion planning: A survey from restructuring to renewable and distributed electricity markets. Int. J. Elect. Power Energy Syst. 2019, 111, 411–424. [Google Scholar]
- Maihemuti, S.; Wang, W.; Wang, H.; Wu, J. Voltage Security Operation Region Calculation Based on Improved Particle Swarm Optimization and Recursive Least Square Hybrid Algorithm. J. Mod. Power Syst. Clean Energy 2021, 9, 138–147. [Google Scholar] [CrossRef]
- Lin, W.; Jiang, H.; Yang, Z. Time-line security regions in high dimension for renewable accommodations. arXiv 2022, arXiv:10.48550/arXiv.2201.01019. [Google Scholar]
- Chertkov, M.; Backhaus, S.; Lebedev, V. Cascading of fluctuations in interdependent energy infrastructures: Gas-grid coupling. Appl. Energy 2015, 160, 541–551. [Google Scholar] [CrossRef]
- Xu, X.; Jia, H.; Chiang, H.-D.; Yu, D.C.; Wang, D. Dynamic Modeling and Interaction of Hybrid Natural Gas and Electricity Supply System in Microgrid. IEEE Trans. Power Syst. 2015, 30, 1212–1221. [Google Scholar] [CrossRef]
- Martinez-Mares, A.; Fuerte-Esquivel, C.R. A Unified Gas and Power Flow Analysis in Natural Gas and Electricity Coupled Networks. IEEE Trans. Power Syst. 2012, 27, 2156–2166. [Google Scholar] [CrossRef]
- Kumari, B.A.; Vaisakh, K. Ensuring expected security cost with flexible resources using modified DE algorithm based dynamic optimal power flow. Appl. Soft Comput. 2022, 124, 124–136. [Google Scholar] [CrossRef]
- Tunç, C.; Tunç, O. On the stability, integrability and boundedness analyses of systems of integro-differential equations with time-delay retardation. Rev. Real Acad. Cienc. Exactas Físicas Y Naturales. Ser. A Math. 2021, 115, 1–17. [Google Scholar] [CrossRef]
- Tunç, O.; Tunç, C. Solution estimates to Caputo proportional fractional derivative delay integro-differential equations. Rev. Real Acad. Cienc. Exactas Físicas Y Naturales. Ser. A Math. 2023, 117, 1–13. [Google Scholar] [CrossRef]
- Zeng, X.; Yu, Y.; Huang, C. Steady-state security region (SSR) and its visualization of bulk high voltage power system. In Proceedings of the International Conference on Power System Technology, Kunming, China, 13–17 October 2002; Volume 2, pp. 1259–1263. [Google Scholar] [CrossRef]
- Jun, X.; Yan, C.; Baoqiang, Z. Concavity and convexity of distribution system security region: Theorem proof and determination algorithm. Proc. Chin. Soc. Electr. Eng. 2021, 41, 5153–5167. [Google Scholar]
- Robert, F.; Guvenis, A.; Halpin, T. Statistical power transmission network design. IEEE Trans. Circuits Syst. 1982, 29. [Google Scholar]
- Wu, F.; Kumagai, S. Steady-State Security Regions of Power Systems. IEEE Trans. Circuits Syst. 1982, 29, 703–711. [Google Scholar] [CrossRef]
- Liu, C. A new method for the construction of maximal steady-state security regions of power systems. IEEE Trans. Power Syst. 1986, 1, 19–26. [Google Scholar] [CrossRef]
- Xue, L.; Linwei, Z.; Tao, J. General algorithm for exploring security region boundary in power systems using lagrange multiplier. Proc. Chin. Soc. Electr. Eng. 2021, 41, 5139–5153. [Google Scholar]
- Tao, J.; Zhang, M.; Cui, X.; Li, Y.; Shi, Q. A novel optimization model to explore static voltage stability region boundary in bulk power systems. Trans. China Electrotech. Soc. 2018, 33, 4167–4179. [Google Scholar]
- Yu, Y.; Liu, Y.; Qin, C.; Yang, T. Theory and Method of Power System Integrated Security Region Irrelevant to Operation States: An Introduction. Engineering 2020, 6, 754–777. [Google Scholar] [CrossRef]
- Zhang, Q.; Zheng, H.; Wang, J. A method for calculating static voltage stability margin of power system based on aq bus. Power Syst. Technol. 2019, 43, 714–721. [Google Scholar]
- Xia, S.; Bai, X.; Chen, S.; Guo, Z. Solving for dynamic security region based on Taylor series trajectory sensitivity. Electr. Power Autom. Equip. 2018, 38, 157–164. [Google Scholar]
- Tinoco, R.A.G.; Passos Filho, J.A.; Peres, W.; Henriques, R. A new particle swarm optimization-based methodology for determining online static security regions. Int. Trans. Electr. Energy Syst. 2021, 31, e12790. [Google Scholar] [CrossRef]
- Zhang, X.; Lin, G.; Wang, T. Kernel feature identification based on improved ant colony optimization algorithm for transient stability assessment. Trans. China Electrotech. Soc. 2010, 25, 154–160. [Google Scholar]
- Russell, S.J.; Norvig, P. Artificial Intelligence: A Modern Approach; Pearson Education Limited: London, UK, 2016. [Google Scholar]
- Shuai, H.; Fang, J.; Ai, X.; Wen, J.; He, H. Optimal Real-Time Operation Strategy for Microgrid: An ADP-Based Stochastic Nonlinear Optimization Approach. IEEE Trans. Sustain. Energy 2019, 10, 931–942. [Google Scholar] [CrossRef]
- Sun, M.; Konstantelos, I.; Strbac, G. A deep learning-based feature extraction frame-work for system security assessment. IEEE Trans Smart Grid 2018, 10, 5007–5020. [Google Scholar] [CrossRef]
- Zhang, Y.; Xu, Y.; Bu, S.; Dong, Z.Y.; Zhang, R. Online power system dynamic security assessment with incomplete PMU measurements: A robust white-box model. IET Gener. Transm. Distrib. 2019, 13, 662–668. [Google Scholar] [CrossRef]
- Gomez, F.R.; Rajapakse, A.D.; Annakkage, U.D.; Fernando, I.T. Support Vector Machine-Based Algorithm for Post-Fault Transient Stability Status Prediction Using Synchronized Measurements. IEEE Trans. Power Syst. 2011, 26, 1474–1483. [Google Scholar] [CrossRef]
- Hou, K.; Shao, G.; Wang, H.; Le Zheng, L.; Zhang, Q.; Wu, S.; Hu, W. Research on practical power system stability analysis algorithm based on modified SVM. Prot. Control. Mod. Power Syst. 2018, 3, 1–7. [Google Scholar] [CrossRef]
- Wang, T.; Guan, L. A data mining technique based on pattern discovery and k-Nearest Neighbor classifier for transient stability assessment. Int. Power Eng. Conf. 2007, 118–123. [Google Scholar]
- Zhang, Y.; Xu, Y.; Dong, Z.Y.; Xu, Z.; Wong, K.P. Intelligent Early Warning of Power System Dynamic Insecurity Risk: Toward Optimal Accuracy-Earliness Tradeoff. IEEE Trans. Ind. Inform. 2017, 13, 2544–2554. [Google Scholar] [CrossRef]
- Ren, C.; Xu, Y.; Zhang, Y. Post-disturbance transient stability assessment of power systems towards optimal accuracy-speed tradeoff. Prot. Control. Mod. Power Syst. 2018, 3, 19. [Google Scholar] [CrossRef]
- Acharjee, P. Optimal power flow with UPFC using security constrained self-adaptive differential evolutionary algorithm for restructured power system. Int. J. Electr. Power Energy Syst. 2016, 76, 69–81. [Google Scholar] [CrossRef]
- Maihemuti, S.; Wang, W.; Wang, H.; Wu, J.; Zhang, X. Dynamic Security and Stability Region Under Different Renewable Energy Permeability in IENGS System. IEEE Access 2021, 9, 19800–19817. [Google Scholar] [CrossRef]
- Abdulkhader, H.K.; Jacob, J.; Mathew, A.T. Robust type-2 fuzzy fractional order PID controller for dynamic stability enhancement of power system having RES based microgrid penetration. Int. J. Electr. Power Energy Syst. 2019, 110, 357–371. [Google Scholar] [CrossRef]
- Veerasamy, V.; Wahab, N.I.A.; Ramachandran, R.; Othman, M.L.; Hizam, H.; Devendran, V.S.; Irudayaraj, A.X.R.; Vinayagam, A. Recurrent network based power flow solution for voltage stability assessment and improvement with distributed energy sources. Appl. Energy 2021, 302, 117524. [Google Scholar] [CrossRef]
- Honghai, K.; Fuqing, S.; Yurui, C.; Kai, W.; Zhiyi, H. Reactive power optimization for distribution network system with wind power based on improved multi-objective particle swarm optimization algorithm. Electr. Power Syst. Res. 2022, 213, 108731. [Google Scholar] [CrossRef]
- Haidar, A.M.; Mustafa, M.; Ibrahim, F.A.; Ahmed, I.A. Transient stability evaluation of electrical power system using generalized regression neural networks. Appl. Soft Comput. 2011, 11, 3558–3570. [Google Scholar] [CrossRef]
- Belkacem Mahdad, K. Srairi. Application of a combined superconducting fault current limiter and STATCOM to enhancement of power system transient stability. Phys. C Supercond. 2013, 495, 160–168. [Google Scholar] [CrossRef]
- Rautray, S.; Choudhury, S.; Mishra, S.; Rout, P. A Particle Swarm Optimization based Approach for Power System Transient Stability Enhancement with TCSC. Procedia Technol. 2012, 6, 31–38. [Google Scholar] [CrossRef]
- Wang, C.; Ju, P.; Wu, F.; Lei, S.; Pan, X. Sequential steady-state security region-based transmission power system resilience enhancement. Renew. Sustain. Energy Rev. 2021, 151, 111533. [Google Scholar] [CrossRef]
- Kyomugisha, R.; Muriithi, C.M.; Edimu, M. Multiobjective optimal power flow for static voltage stability margin improvement. Heliyon 2021, 7, e08631. [Google Scholar] [CrossRef]
- Yang, Y.; Huang, Q.; Li, P. Online prediction and correction control of static voltage stability index based on Broad Learning System. Expert Syst. Appl. 2022, 199, 117184. [Google Scholar] [CrossRef]
- Kenned, Y. Particle swarm optimization. Proc. IEEE Int. Conf. Neural Netw. 1995, 4, 1942–1948. [Google Scholar]
- Jing, X.C.; Bing, L.C. Parameter Identification of Permanent Magnet Synchronous Motor Based on RLS. Small Spec. Electr. Mach. 2012, 40, 30–33. [Google Scholar]
- Singh, S.K.; Sinha, N.; Goswami, A.K.; Nidul, S. Robust estimation of power system harmonics using a hybrid firefly based recursive least square algorithm. Int. J. Electr. Power Energy Syst. 2016, 80, 287–296. [Google Scholar] [CrossRef]
- Reichbach, N.; Kuperman, A. Recursive-least-squares-based real-time estimation of supercapacitor parameters. IEEE Trans. Energy Convers. 2016, 31, 1–3. [Google Scholar] [CrossRef]
Publisher’s Note: MDPI stays neutral with regard to jurisdictional claims in published maps and institutional affiliations. |
© 2022 by the authors. Licensee MDPI, Basel, Switzerland. This article is an open access article distributed under the terms and conditions of the Creative Commons Attribution (CC BY) license (https://creativecommons.org/licenses/by/4.0/).