Article

Generator Fault Classification Method Based on Multi-Source Information Fusion Naive Bayes Classification Algorithm

School of Electrical and Electronic Engineering, Huazhong University of Science and Technology, Wuhan 430074, China
*
Authors to whom correspondence should be addressed.
Energies 2022, 15(24), 9635; https://doi.org/10.3390/en15249635
Submission received: 31 October 2022 / Revised: 29 November 2022 / Accepted: 13 December 2022 / Published: 19 December 2022

Abstract

:
The existing motor fault classification methods mostly use sensors to detect a single fault feature, which makes it difficult to ensure high diagnostic accuracy. In this paper, a motor fault classification method based on multi-source information fusion Naive Bayes classification algorithm is proposed. Firstly, this paper introduces the concept and advantages of multi-source information fusion, as well as its problems of miscellaneous information and inconsistent data magnitude. For example, as this paper classifies the fault of generators, there are many physical quantities, such as voltage, current and temperature, which are not in the same dimension, therefore it is difficult to fuse. Then, aiming at the corresponding problems, this paper uses a PCA dimension reduction method to remove redundant information and reduce the dimension of multi-dimensional complex information. Aiming at the problem of unequal data magnitude, the interval mapping method is adopted to effectively solve the misjudgment caused by unequal data magnitude. After the initial multi-source information processing, the classical Naive Bayes classification algorithm is used for fault classification, and the algorithm diagnosis and verification are carried out according to the statistical fault data. Use of the algorithm increases accuracy to more than 97%.

1. Introduction

For the power systems of offshore platforms, large generators are the core component, and their reliability is of great significance to the whole system. The failure of the generator will not only affect the platform, but also affect the stability of the entire power system, which often leads to greater losses, and even threatens the safety of personnel in severe cases. Therefore, the importance and necessity of motor fault detection is obvious. At the initial stage of faults, fast and accurate fault diagnosis prevents deterioration of faults, which has a significant impact on reliability. Fault diagnosis technology is increasingly important nowadays [1,2].
Large generators usually use a rotor winding synchronous motor, which has the advantages of adjustable excitation and stable frequency. However, the environment of the offshore platform has great influence on the generator. An offshore platform power system belongs to an isolated network system, and a single load accounts for a large proportion of the total power generation. At the same time, the sea salt, fog and humid air can also affect the motor insulation, resulting in a generator prone to short-circuit fault. Due to the heavy rotor of large motors, eccentric fault is inevitable during installation and operation.
Most of the existing fault diagnosis algorithms use a single physical quantity for identification. In [3], a diagnosis technology based on the time-varying frequency component of the stator current was developed when a rotor dynamic eccentricity fault occurs. In [4], different faults were judged by the characteristics of the dq axis component of the stator current. In [5], faults were diagnosed by detecting steady-state signals and analyzing frequency components with fast Fourier transform. In [6], the stator current of PMSM was studied by wavelet and wavelet packet transform to analyze the influence of a demagnetization fault. In fact, by establishing an accurate motor model, the parameters of normal generators can be obtained to compare and diagnose the fault. In [7], a highly accurate mathematical model and ‘fault observer’ were established by calculating the theoretical current and the actual current residual as fault features to achieve real-time monitoring of inter-turn faults.
Both signal processing and analytical models require a lot of calculations and complex algorithms, which is suitable for an artificial intelligence algorithm. The artificial intelligence algorithm is an important development direction of fault diagnosis technologies [8,9,10]. The commonly used methods are support vector machine (SVM), neural network, fuzzy control, genetic algorithm, etc. In [11], a BP neural network trained by error back propagation algorithm was created. In [12], a method based on three-layer feedforward ANN and L-M Algorithm was developed to realize a PMSM stator inter-turn short circuit fault. In [13], a negative sequence current and impedance were used as input vectors of fuzzy logic, a stator winding fault of PMSM was diagnosed by the established fuzzy relation matrix, and the severity of the fault was qualitatively analyzed. In [14], the parameters of PMSM were identified based on particle swarm optimization, and stator winding resistance and torque variables achieved good identification results. Naive Bayes is a mature and fast algorithm, which is widely used in fault diagnosis. In [15], a method was stated that used the Naive Bayes classification theorem (NBC) for diagnosis of an abnormal vibration by analysis of the stator current under load.
In the early stage of motor fault, many physical characteristics do not obviously change, and it is difficult to ensure the accuracy and reliability of the sensor in the actual scene, which means using a single physical quantity to classify the fault cannot result in high accuracy. About 70% of generator failures on an offshore platform result from sensor failure. From another point of view, the motor is nonlinear and has strong coupling. When the motor works in an abnormal or fault state, it will lead to a variety of physical quantities changing at the same time. The single physical characteristic information such as electromagnetism, temperature and force, is not linearly related to a specific fault. Therefore, it is necessary to use the method of multi-source information fusion, which considers multiple feature signals at the same time, to accurately diagnose the fault. It is generally realized by feature extraction of data acquisition, motor current, vibration, rotor speed, axial flux and radial flux [16,17,18]. However, multi-source information will bring bulk calculation, which seriously influences the efficiency of diagnosing.
The accuracy and calculation speed of the Naive Bayes algorithm are very suitable for real-time fault detection and diagnosis of a generator. This paper proposes a generator fault classification method based on multi-source information fusion Naive Bayes, which can accurately and quickly identify a variety of fault types, so as to improve the reliability of the generator and even the whole power system.

2. Materials and Methods

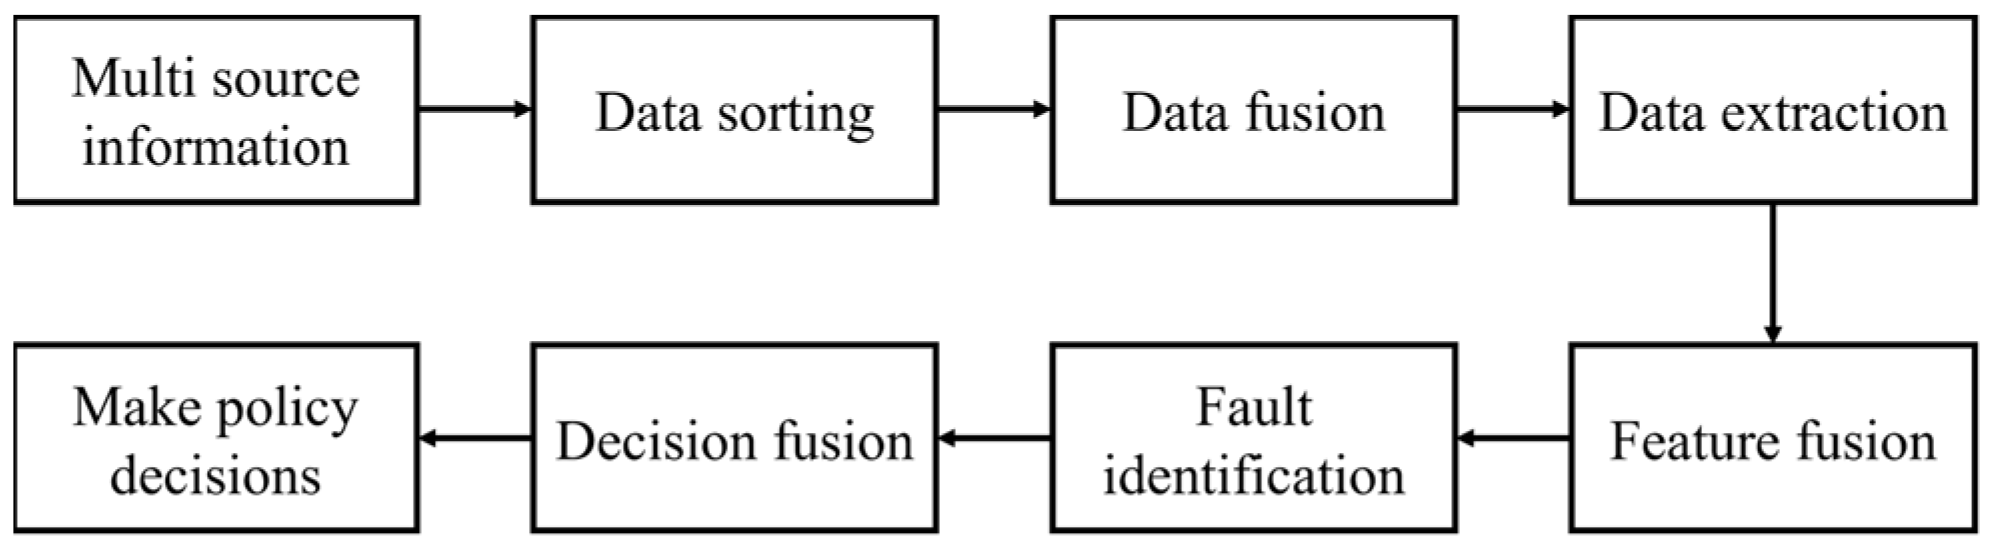
2.1. Multi-Source Information Fusion Process

The process of multi-source information fusion can be compared to the process of the human brain comprehensively dealing with complex problems. Its essence is a multi-level and multifaceted processing, including detection, correlation, combination and estimation of multi-source data, so as to improve the accuracy of state and identity estimation. The multi-source information fusion process makes full use of the characteristics of each signal, reasonably dominates and optimizes the complementary and redundant information, and produces a consistent interpretation and description of the monitoring state. Figure 1 is the flow chart of multi-source information fusion.
The voltage, current, vibration and temperature signals measured by multiple sensors contain a large amount of characteristic information, resulting in the following problems in the information fusion process:
(1)
In addition to the fault diagnosis process, many state and type evaluation processes often need to use thousands or even millions of features in order to improve the accuracy of classification and evaluation, which will not only slow the training, but also make it difficult to find the optimal solution. This problem is called dimensional disaster;
(2)
Data processing takes up a lot of memory. The dimension of data is too high, and the space for storing data is very large, which makes the data processing process very slow;
(3)
Unable to visualize decision results.

2.1.1. Characteristic Signals

In order to obtain an ideal treatment effect, the selection of signals should be prioritized. For different generator faults, there are often different combinations of characteristic signals. This paper mainly studies three common faults of generator, which are stator turn to turn short circuit, rotor turn to turn short circuit and air gap static eccentricity. For large generators, there is almost no comprehensive fault characteristic information or signal record. In this study, the fault was simulated by multi physical field FEA. The generator model was based on AMS900LH produced by ABB, which is a rotor winding synchronous motor with 4 poles and 48 slots. The model has high accuracy that has less than 5% error when compared to the real one under the rated condition. Figure 2 shows the FEA model of the generator, and Table 1 provides additional information about the generator.
Firstly, the characteristic signals that could be detected were selected. On this basis, the health state was compared with the fault state, mainly including voltage, current, temperature, vibration, etc., and then the characteristic signals that could distinguish three kinds of faults were selected. It is necessary to extract the running signals of motor health and fault status to measure the collected signals. Figure 3 shows the component of the vibration spectrum. Table 2 concludes the differences of the voltage THD and its effective value, winding temperature of stators and rotors, and the average of the radial unbalance force and variation period of radial unbalance force direction.
There are some unconventional treatments for fault simulating, which lead to different results in real-world experience. For example, when simulating a rotor turn to turn short circuit fault, the generator is under a control system that keeps output voltage against the reduction of the air gap magnetic field caused by the fault by raising the excitation current, which raises the rotor temperature at the same time.
The results indicate that each combination of all these signals matches a status of a motor. The difficulty is their relationship and the accuracy of diagnosis if not every sensor works well.

2.1.2. Fuzzy Process

Due to the inconsistent magnitude of voltage, current, temperature and other signals, some characteristic signals with large changes tend to become dominant in the process of multi-source information fusion and discrimination, which affects the accuracy of diagnosis. In order to make every characteristic signal work, it is necessary to perform a fuzzy process on the original information. The trapezoidal membership function is proposed as Equation (1) by setting a proper range and relationship to obtain the best classification effect.
μ A ( x ) { 0 x < X 1 x X 1 X 2 X 1 X 1 x < X 2 1 X 2 x < X 3 1 + x X 3 X 4 X 3 X 3 x < X 4 2 x X 4
where μ A ( x ) is the fuzzy value of the original information, x is the original information and X1, X2, X3 and X4 are the segmentation points of the trapezoidal membership function.
For example, a normal stator temperature changes from 40 °C to 60 °C, a slightly abnormal temperature changes from 30 °C to 40 °C and 60 °C to 70 °C, and an absolute fault temperature falls below 30 °C or exceeds 70 °C; therefore, X1, X2, X3 and X4 are 30 °C, 40 °C, 60 °C and 70 °C, respectively. The advantages of the fuzzy process are explained in the next section.

2.1.3. Dimensionality Reduction Process of Characteristic Signal Using PCA

In order to solve the dimension disaster of multi-source information, it is necessary to reduce the dimension of multi-source information. Principal component analysis (PCA) is a general dimensionality reduction method. The PCA method is used to map the high-dimensional original information into the low-dimensional space by a set of low-dimensional orthogonal bases, so as to reduce the dimension of the original information. In order to maintain the accuracy of the diagnosis, it is necessary to scatter the mapped projection values as much as possible because some samples will not work if there is overlap. Therefore, in the process of dimension reduction, it is also necessary to ensure that the signal variance is the largest, and there is no linear relationship between different signals, that is, the covariance between signals is 0.
It is assumed that the initial multi-source information X contains n samples x1, x2,…,xn, which is:
X = [ x 1 T x 2 T x n T ]
For each sample Xi, the dimension reduction of the sample can be obtained by a matrix transformation of Equation (3).
Yi = WXi
where Yi is the low dimension signals and W is dimensionality-reducing matrix. The only thing to do then is to find W.
In order to derive matrix W, the variable is now defined: mean x ¯ , mean value after sample mapping μ, covariance matrix cov (X) of X, w is the eigenvector of W.
x ¯ = 1 n i n x i
μ = 1 n i n w T x i
cov ( X ) = 1 n i n ( x i x ¯ ) ( x i x ¯ ) T
Variance σ 2 can be expressed by:
σ 2 = 1 n i n ( w T x i μ ) 2 = 1 n i n ( w T x i 1 n i n w T x i ) 2 = 1 n i n ( w T x i w T ( 1 n i n x i ) ) 2 = 1 n i n ( w T ( x i x ¯ ) ) 2 = 1 n i n ( w T ( x i x ¯ ) ) ( w T ( x i x ¯ ) ) T = 1 n i n w T ( x i x ¯ ) ( x i x ¯ ) T w = w T [ 1 n i n ( x i x ¯ ) ( x i x ¯ ) T ] w = w T Σ w
Therefore, the following conditions require W to be:
w ^ = arg max w w T Σ w
Combined with the constraints on W, the Lagrange method is utilized to construct the objective function:
L ( w , λ ) = w T Σ w + λ ( 1 w T w )
If the partial derivative of Equation (9) is equal to 0, then:
Σ w = λ w
where λ is the eigenvalue of W.
PCA dimensionality reduction is used to sort the eigenvalues and select the eigenvector corresponding to the maximum eigenvalue to obtain the transformation matrix W.

2.2. Bernoulli Naive Bayes Classification Method

The Naive Bayesian algorithm is a classification method based on the Bayesian theorem and the assumption of characteristic condition independence, which has the advantages of simple, fast and efficient data prediction. It is suitable for multivariable classification tasks. The characteristic of the Naive Bayesian algorithm is to combine a priori probability and a posteriori probability, which avoids the subjective bias and the over fitting phenomenon. It shows high accuracy when the data set is large, and has three stages:
The preparation stage, which needs to pave the way for the later classification work;
The training stage, which needs to calculate the probability of each category in the training sample and the conditional probability of occurrence according to the Bayes theorem. In this stage, 1000 couples of data calculated by the FEA method have been studied to train the classification;
The automatic classification application stage, which completes the classification by the classifier. Figure 4 describes the flow of the Bayes algorithm.

3. Results

By using the FEA method, 1000 different types and degrees of faults were generated. Each datapoint corresponded to only one type, which can reduce the rank of the matrix composed of data, thus greatly reducing the data dimension. Table 2 shows four data from all signals. The test was divided into two parts: one part was 1000 groups of fault data that were not analyzed by fuzzy processing; the other part was fuzzy processing and application of the PCA method for dimension reduction transformation. A total of 800 data obtained by the dimension reduction transformation were put into the classifier for training, and another 200 were used to verify the classification effect. In order to observe the effect of classification more intuitively, the multi-dimensional data of all sample points were reduced to two dimensions and were placed in the rectangular coordinate system. Different quadrants represented different fault types. The horizontal and vertical coordinate values had no significance, only as the result of the PCA dimension reduction. The closer the sample points were to the coordinate axis, the less accurate the classification was, so the sample points on the coordinate axis are regarded as the wrong classification.

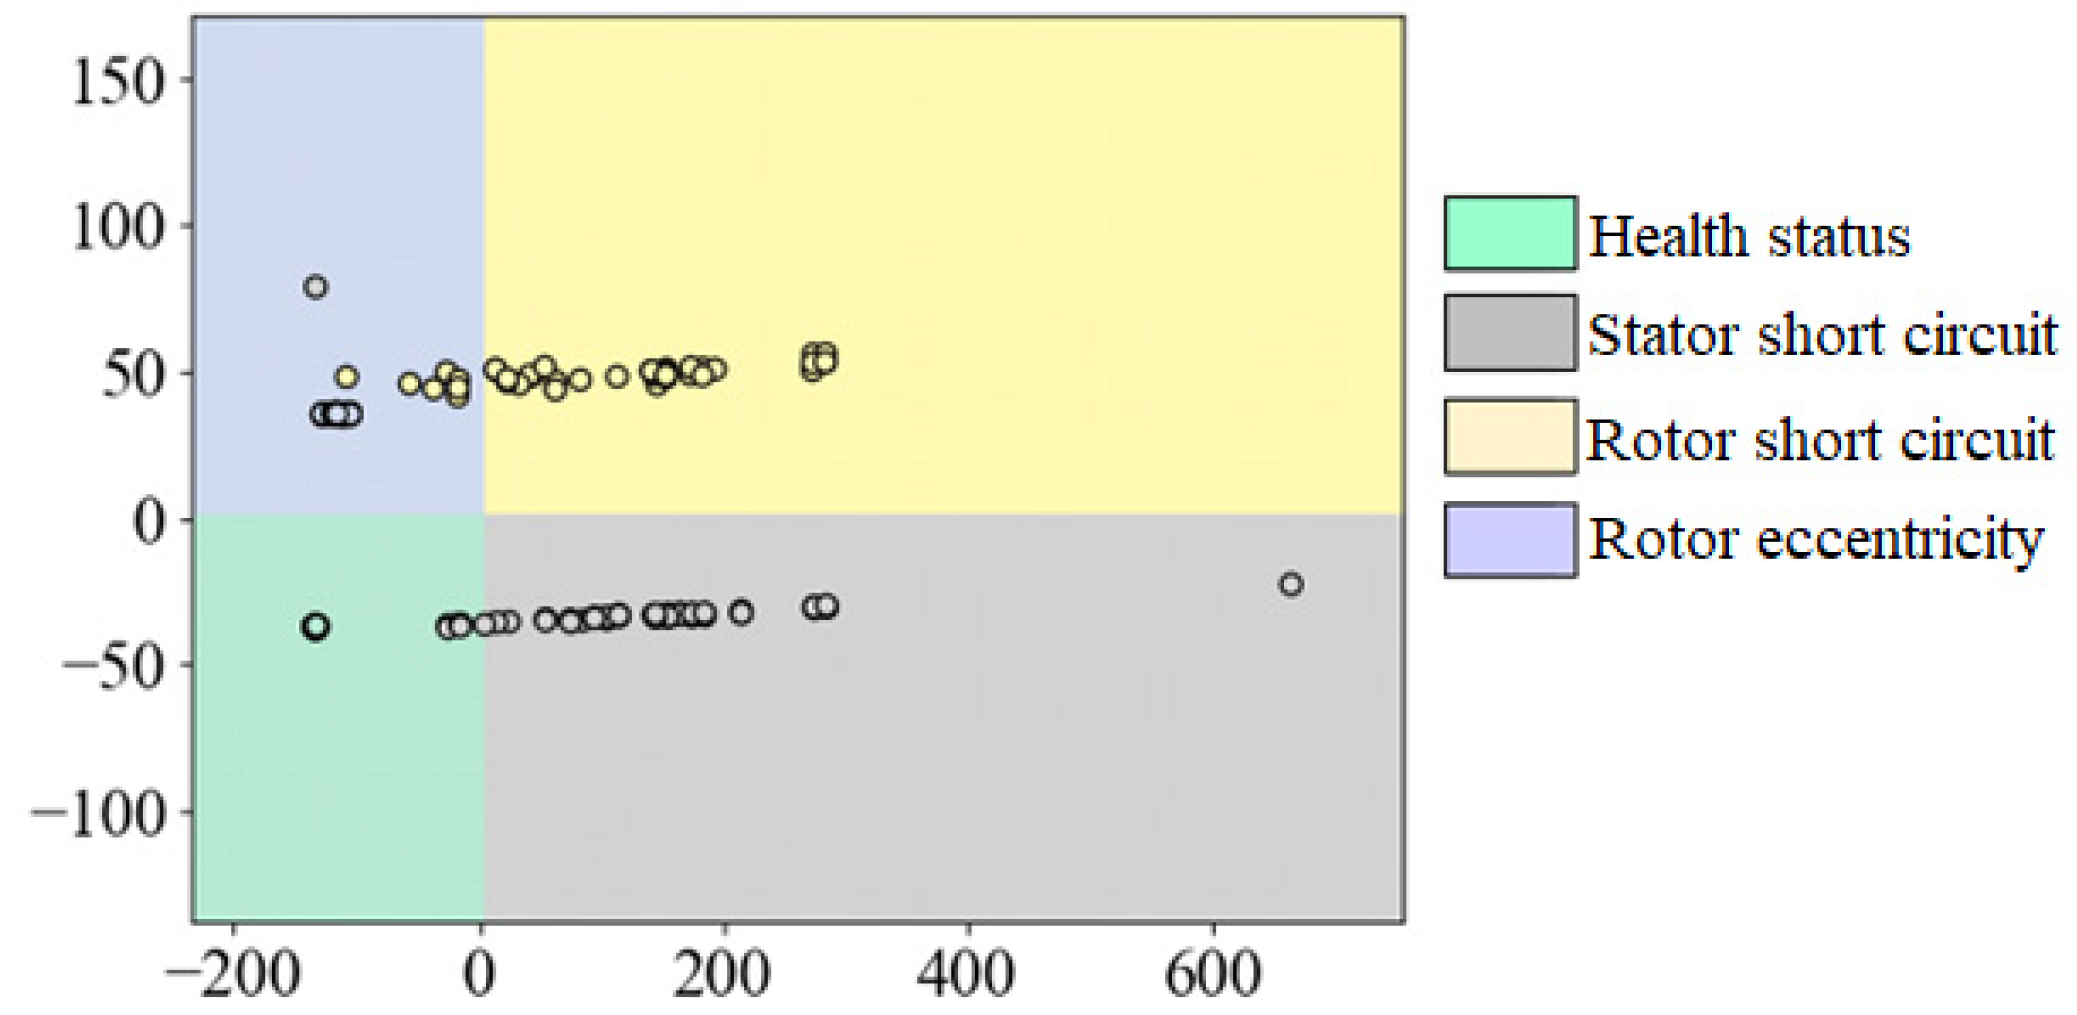
3.1. Result without the Fuzzy Process

There were 200 groups of fault data in total, and the motor state was divided into four categories: healthy state, stator turn to turn short circuit, rotor turn to turn short circuit and rotor eccentricity fault. Each type had 50 groups of data for testing. The final classification result is shown in Figure 5, and its classification accuracy is 92%.
The fault classification is determined by multiple characteristic signals, and the magnitude of different signals and the impact on fault classification are different. After using the dimensionality reduction of PCA mentioned above, the eigenvalues will be affected by some dominant signals, resulting in low fault tolerance of the classifier.
After removing the change period of the unbalanced force direction, the classification result is shown in Figure 6. It can be seen that the classifier could not distinguish between the healthy state and the air gap eccentricity fault at this time. After removing the average unbalanced force, the classification result is shown in Figure 7. It can be seen that the classifier had difficulty distinguishing between the healthy state and the stator inter-turn short-circuit fault. The classification accuracy varied greatly when different signals were removed.

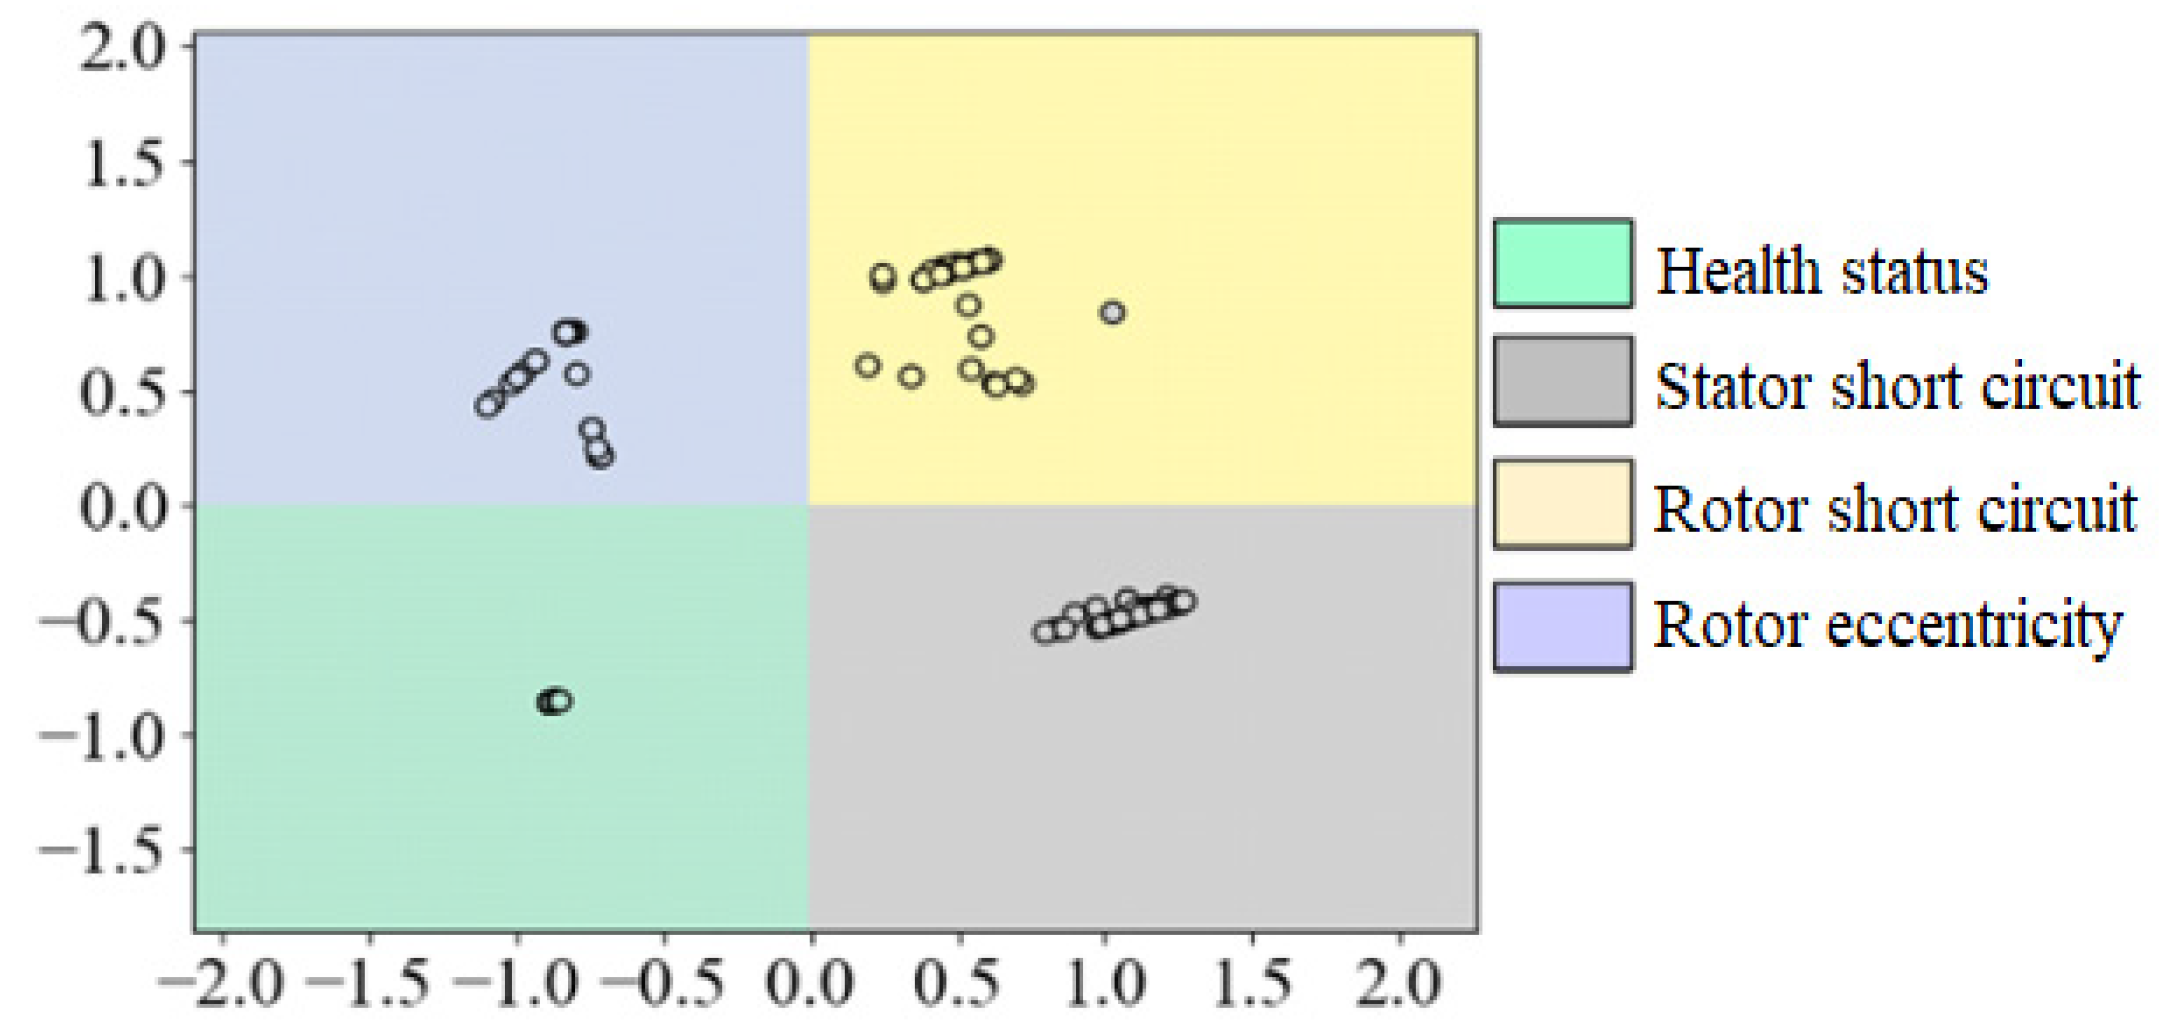
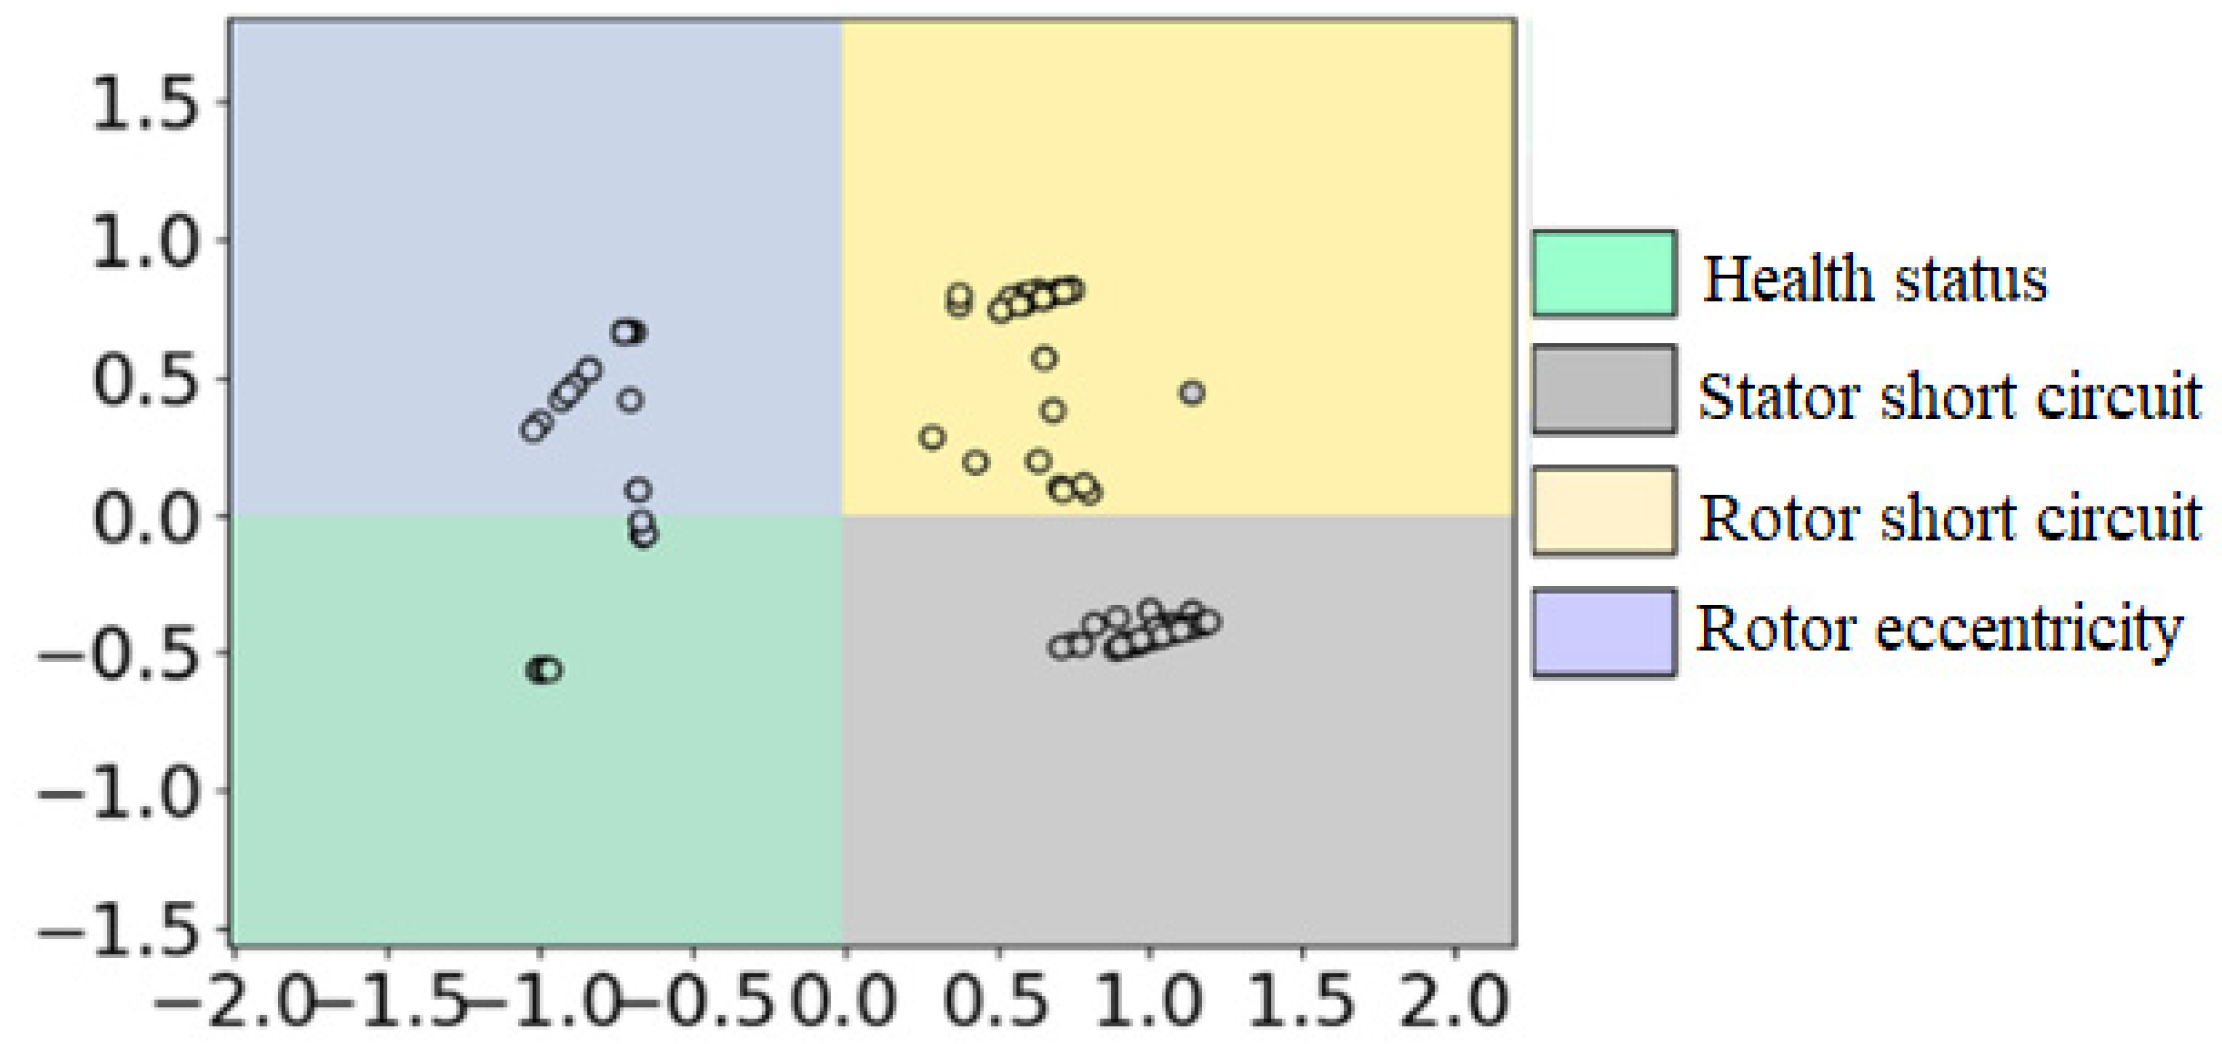
3.2. Result with the Fuzzy Process

After fuzzifying various multi-source information features, the classification test was carried out again. The test results are shown in Figure 8. It can be seen that the accuracy of classification results is significantly higher than that before fuzzy process. After 200 groups of data testing, the accuracy of the results reached 99.5%, which is significantly higher than before.
After removing the variation period of the radial unbalanced force direction and average value of the radial unbalanced force, the classification results are shown in Figure 9 and Figure 10. The classification accuracy is 98% and 97.5% respectively, which is high and stable.

4. Discussion

Due to the fuzzy process on multi-source information, various feature quantities are relatively equal. For example, the temperature change of the rotor before and after the fault changed from 90 °C to 150 °C, while the rotor unbalanced force increased from 1 kN to 30 kN. There is a great difference between the change amplitude and change value, resulting in the unsatisfactory classification result of the classifier. After the fuzzy process, each characteristic signal is between 0–2, and the value range is summarized from a large number of fault data. The final classification accuracy is greatly improved and has good robustness, which means a high reliability of the fault detection system, even at a time when some of sensors do not work well.
Compared with the traditional fault detection method based on a single signal, the method mentioned in this paper has no obvious improvement in fault accuracy, but it can avoid the failure of the whole fault diagnosis system caused by a sensor failure. When one sensor fails, it can still provide high accurate fault diagnosis, so as to avoid the occurrence of false alarms, thereby greatly improving the reliability of the generator and its system.

5. Conclusions

In this paper, the fault classification method was discussed, and a multi-source information fusion Naive Bayes classification algorithm was proposed. Before classifying the fault, the characteristic signal should be fuzzified first, and then the PCA dimension reduction method is used to reduce the dimension of the eigenvalue, so that the algorithm can handle the problem efficiently and accurately. Finally, it is brought into the Naive Bayes classifier for classification. The classification method proposed in this paper has the advantages of high accuracy and strong fault tolerance, which is very consistent with the requirements of generator fault classification.

Author Contributions

Software, Y.H.; Resources, Z.C.; Writing—original draft, Y.W.; Writing—review & editing, Y.W., K.Y. and C.L. All authors have read and agreed to the published version of the manuscript.

Funding

This research was funded by National Natural Science Foundation of China (52237002) and (52207055), in part by China Postdoctoral Science Foundation funded project (2022M721232), Key Research and Development Plan of Hubei Province (2022BAA097) and (2022BAA100).

Conflicts of Interest

The authors declare no conflict of interest.

References

  1. Wang, G. Basic Research on Machinery Fault Diagnosis—What is the Prescription. Chin. J. Mech. Eng. 2013, 49, 63–72. [Google Scholar] [CrossRef]
  2. Wang, J.F.; Li, F.-C. Signal Processing Methods in Fault Diagnosis of Machinery—Analyses in Frequency Doman. Noise Vib. Control 2013, 33, 173–180. [Google Scholar]
  3. Rodriguez, P.; Belahcen, A.; Arkkio, A. Signatures of electrical faults in the force distribution and vibration pattern of induction motors. IEE Proc.-Electr. Power Appl. 2006, 153, 523–529. [Google Scholar] [CrossRef]
  4. Filippetti, F.; Franceschini, G.; Tassoni, C.; Vas, P. AI techniques in induction machines diagnosis including the speed ripple effect. IEEE Trans. Ind. Appl. 1998, 34, 98–108. [Google Scholar] [CrossRef]
  5. Rosero, J.; Ortega, J.; Urresty, J.; Cardenas, J.; Romeral, L. Stator Short Circuits Detection in PMSM by means of Higher Order Spectral Analysis (HOSA). In Proceedings of the 2009 Twenty-Fourth Annual IEEE Applied Power Electronics Conference and Exposition, Washington, DC, USA, 15–19 February 2009; pp. 964–969. [Google Scholar]
  6. Moosavi, S.S.; Djerdir, A.; Amirat, Y.A.; Khaburi, D.A. Demagnetization fault diagnosis in permanent magnet synchronous motors: A review of the state-of-the-art. J. Magn. Magn. Mater. 2015, 391, 203–212. [Google Scholar] [CrossRef]
  7. Leboeuf, N.; Boileau, T.; Nahid-Mobarakeh, B.; Clerc, G.; Meibody-Tabar, F. Real-Time Detection of Interturn Faults in PM Drives Using Back-EMF Estimation and Residual Analysis. IEEE Trans. Ind. Appl. 2011, 47, 2402–2412. [Google Scholar] [CrossRef]
  8. Mohagheghi, S.; Harley, R.G.; Habetler, T.G.; Divan, D. Condition Monitoring of Power Electronic Circuits Using Artificial Neural Networks. IEEE Trans. Power Electron. 2009, 24, 2363–2367. [Google Scholar] [CrossRef]
  9. Riba Ruiz, J.-R.; Rosero, J.A.; Espinosa, A.G.; Romeral, L. Detection of Demagnetization Faults in Permanent-Magnet Synchronous Motors Under Nonstationary Conditions. IEEE Trans. Magn. 2009, 45, 2961–2969. [Google Scholar] [CrossRef]
  10. Wu, K.; Huang, Z.; Wang, Z.; Hu, X. A kind of fault diagnosis research based on improved SOM-BP composite neural network. In Proceedings of the 2014 IEEE 5th International Conference on Software Engineering and Service Science, Beijing, China, 27–29 June 2014; pp. 465–467. [Google Scholar]
  11. Betta, G.; Liguori, C.; Pietrosanto, A. An advanced neural-network-based instrument fault detection and isolation scheme. IEEE Trans. Instrum. Meas. 1998, 47, 507–512. [Google Scholar] [CrossRef]
  12. Moosavi, S.S.; Djerdir, A.; Ait-Amirat, Y.; Khaburi, D.A. ANN based fault diagnosis of permanent magnet synchronous motor under stator winding shorted turn. Electr. Power Syst. Res. 2015, 125, 67–82. [Google Scholar] [CrossRef]
  13. Quiroga, J.; Li, L.; Cartes, D.A. Fuzzy logic based fault detection of PMSM stator winding short under load fluctuation using negative sequence analysis. In Proceedings of the 2008 American Control Conference, Seattle, WA, USA, 11–13 June 2008; pp. 4262–4267. [Google Scholar]
  14. Liu, L.; Liu, W.; Cartes, D.A. Permanent Magnet Synchronous Motor Parameter Identification using Particle Swarm Optimization. Int. J. Comput. Intell. Res. 2008, 4, 211–218. [Google Scholar] [CrossRef]
  15. Pandarakone, S.E.; Gunasekaran, S.; Mizuno, Y.; Nakamura, H. Application of Naive Bayes Classifier Theorem in Detecting Induction Motor Bearing Failure. In Proceedings of the 2018 XIII International Conference on Electrical Machines (ICEM), Alexandroupoli, Greece, 3–6 September 2018; pp. 1761–1767. [Google Scholar] [CrossRef]
  16. Hajnayeb, A.; Ghasemloonia, A.; Khadem, S.; Moradi, M. Application and comparison of an ANN-based feature selection method and the genetic algorithm in gearbox fault diagnosis. Expert Syst. Appl. 2011, 38, 10205–10209. [Google Scholar] [CrossRef]
  17. Desheng, L.; Beibei, Y.; Yu, Z.; Jinping, S. Time-frequency analysis based on BLDC motor fault detection using Hermite S-method. In Proceedings of the 2012 IEEE International Conference on Computer Science and Automation Engineering (CSAE), Zhangjiajie, China, 25–27 May 2012; pp. 592–596. [Google Scholar] [CrossRef]
  18. Sonje, D.M.; Kundu, P.; Chowdhury, A. Detection and discrimination of simultaneous stator inter-turn and broken rotor bar faults in induction motor. In Proceedings of the 2015 International Conference on Condition Assessment Techniques in Electrical Systems (CATCON), Bangalore, India, 10–12 December 2015; pp. 133–138. [Google Scholar] [CrossRef]
Figure 1. Multi-source information fusion process.
Energies 15 09635 g001
Figure 2. FEA model of the generator.
Energies 15 09635 g002
Figure 3. Vibration spectrum.
Energies 15 09635 g003
Figure 4. Flow chart of the Naive Bayes algorithm.
Energies 15 09635 g004
Figure 5. Classification result without the fuzzy process.
Energies 15 09635 g005
Figure 6. Classification result without the fuzzy process after removing the change period of the unbalanced force direction.
Energies 15 09635 g006
Figure 7. Classification result without the fuzzy process after removing the average unbalanced force.
Energies 15 09635 g007
Figure 8. Classification result with the fuzzy process.
Energies 15 09635 g008
Figure 9. Classification result with the fuzzy process after removing the variation period of the radial unbalanced force direction.
Energies 15 09635 g009
Figure 10. Classification result with the fuzzy process after removing the average unbalanced force.
Energies 15 09635 g010
Table 1. Parameters of the generator.
Physical QualityValue
Rated capacity15.539 MVA
Rated voltage6300 V
Rated current1424 A
Rated rpm1500 rpm
Rated frequency50 Hz
Rated power factor0.8
Poles4
Slot number48
Effective length850 mm
Stator outer diameter3400 mm
Stator inner diameter2410 mm
Gap length24 mm
Table 2. Signals of different statuses.
StatusVoltage RMSVoltage THDMax Stator TemperatureMax Rotor TemperatureVibration of Shaft (25 Hz)Unbalanced Force Direction PeriodAverage Unbalance Force
NormalA:3.73 kV
B:3.73 kV
C:3.73 kV
2.8%78.7 °C94.7 °C010 ms4.8 kN
Stator turn to turn short circuitA:3.68 kV
B:3.76 kV
C:3.76 kV
3.3%360 °C95.0 °C010 ms33 kN
Rotor turn to turn short circuitA:3.73 kV
B:3.73 kV
C:3.73 kV
2.9%78.8 °C110.6 °C0.06 mm/s40 ms314 kN
Rotor static eccentricityA:3.74 kV
B:3.74 kV
C:3.74 kV
2.8%78.7 °C94.7 °C0.007 mm/s40 ms455 kN
Publisher’s Note: MDPI stays neutral with regard to jurisdictional claims in published maps and institutional affiliations.

