Article

Unmanned Electric Tugboat Formation Multi-Agent Energy-Aware Control System Concept

by
Wojciech Koznowski
and
Andrzej Łebkowski
*
Department of Ship Automation, Gdynia Maritime University, Morska 83 Str., 81-225 Gdynia, Poland
*
Author to whom correspondence should be addressed.
Energies 2022, 15(24), 9592; https://doi.org/10.3390/en15249592
Submission received: 17 November 2022 / Revised: 2 December 2022 / Accepted: 15 December 2022 / Published: 17 December 2022

Abstract

:
The topic of reducing exhaust gas emissions from internal combustion engines in the areas of port and coastal waters is in line with the assumptions of the climate policy. The publication presents a proposal to reduce the energy associated with the movement of port vessels through the use of a specific pattern (shape and size) of their movement. In addition to controlling the formation of tugboats, the authors propose the use of a multi-agent system offering elements of autonomous control of the vessels, which adjusts the parameters of the formation depending on the tasks performed. The results of tests for four tugboats with a hull length of 32 m and a maximum speed of 13 knots, moving in formations of eight different configurations, were analyzed. Studies conducted on the basis of a simulated exit and return to port scenario at a distance of 11.4 nm showed the possibility of reducing energy consumption required for movement by 5.8% to even 57.6% for tugboats moving one after another, at a certain distance. In addition, in order to completely eliminate exhaust gas emissions from the engines, it is proposed to use tugboats with electric drive together with an appropriate energy storage charging infrastructure.

1. Introduction

The assistance of tugboats in maneuvering a vessel is a common requirement in many ports, even for vessels equipped with advanced propulsion systems. Entering the port by ship requires the presence of tugs in order to ensure safety for the natural environment and property (including ships of other ship-owners and port infrastructure).
The port authority office of each port determines the number and possible requirements for tugs necessary to assist a given vessel. Due to the type and cargo of the ship, current weather (wind strength and direction, wave height), the tidal situation during the maneuver and historical data available for a given or similar ship, a decision is made to use the appropriate number and type of tugs. Often ships of a certain type, e.g., tankers, must use the assistance of tugs in the number specified by the pilot.
Machines taking over the duties previously performed by humans allows for increased efficiency, precision and safety of their performance. Maneuvering operations with the use of tugboats are one of the areas where all three of the above objectives can be achieved.
Increased productivity is possible through precise control of the available tugboats. In order to reduce energy consumption, optimization is carried out in the following areas: the route covered by the tugboats on their way to the place where the maneuver will start; positioning of the tug boats in appropriate places around the maneuvering vessel; the fastest possible connection of tugs with the maneuvering vessel, e.g., with the use of booms for feeding towing ropes [1]; and time-efficient maneuvering of the vessel thanks to accurate knowledge of the dimensions and weight of the vessel as well as of the maneuvering capabilities of individual tugboats;
In the literature, one can find concepts of autonomous tugboats using various technologies. One example is the tugboat RAmora designed by Robert Allan Ltd. (Figure 1a). The tugboat RAmora is controlled by teleoperation from a remote position manned by the operator.
In 2021, the Nellie Bly autonomous tugboat, developed by Sea Machines Robotics, sailed to demonstrate the operation of the SM300 autonomous control system [2]. The tug covered a route of over 1000 miles in German and Danish waters, mostly in autonomous mode, the rest of the time being remotely controlled from the control station in Boston.
The improvement of maneuvering precision is possible thanks to the precise knowledge of the position of each tugboat and the generated towing forces, which allows the exact position and linear and angular speed of the maneuvering vessel to be estimated [3,4].
The development of technology related to electric propulsion systems and the increasing availability of battery packs with sufficient capacities to cover the power requirements of the propulsion system make it possible to build ships with 100% electric propulsion. A ship-owner from Turkey has already received the first battery-powered tugboat [5], and in August 2022 Damen delivered a 70T bollard pull electric tugboat called Sparky [6] to the port of Auckland.
The concept of energy awareness in the context of tugboat formations has several aspects, depending on the level of the system structure. At the level of a single tug in a formation, the possibilities of influencing energy consumption are limited due to the need to comply with the movement of the entire formation. However, each of the tugs can accurately measure its energy consumption for further analysis at higher levels of the formation. At this level, it is possible to use already known methods of optimizing energy consumption, related to, e.g., the allocation of forces generated by the tug’s propulsors.
At the level of a formation composed of several tugboats, the possibilities of influencing its energy consumption related to the need to move increase. The ability to independently choose the route of the formation’s movement allows the consideration of potential paths (limited, among others, by the law of the sea) and their qualitative assessment, based on the expected energy consumption.
The second decision affecting the energy consumption of a moving formation is its formation, i.e., the mutual positioning of individual tugboats of the formation in relation to each other while moving.
In the light of the new requirements related to the EEDI (Energy Efficiency Design Index) [7] for the construction of new commercial ships, issues related to the optimization of energy consumption for the movement of surface vessels will probably be the subject of many future studies.
The subject of this publication is the analysis of the possibility of reducing the energy consumption for the movement of a formation consisting of four identical tugboats. The reduction will be possible by controlling the mutual position of the tugboats during movement, due to the influence of the distance between them on the hydrodynamic resistance experienced by the entire formation.
Typically, two to four tugs are used in port operations with tugboats. The optimal solution for maneuvering the ship with the assistance of autonomous units is the use of four tugs, two on each side of the ship, placed off its bow and stern. Such location ensures maneuvering of the assisted unit in every direction. For this reason, the publication considers a formation consisting of four tugboats.
As a result of the tests, the characteristics of the total hydrodynamic resistances for formations of four ships, sailing in formations of eight different shapes, and the characteristics of the resistances of a group of four independent ships were obtained. Following this, a network simulation environment was used to simulate the route of a tugboat leaving the port for the port roads and then returning along the same route. The calculated resistance characteristics for eight formations and a control group of four independent vessels were used to calculate the energy consumption necessary to overcome the hydrodynamic resistance during the simulated voyage. The results of the energy consumption tests were compared with the resistance of four independently moving vessels, with a reduction of energy consumption of 57.6% in the best case.

2. Multi-Agent Systems and Autonomous Vessels

2.1. Multi-Agent Systems

Multi-agent systems are one of the popular methods of implementing artificial intelligence used in the automation of tasks in systems where there are many independent elements. The idea of a multi-agent system is to use cooperating autonomous entities called agents. Each of the agents has a specific task, and often acts on behalf of another, e.g., for its home system. Agents operate in an environment where they can interact and communicate with each other, with the primary activity of agents in such systems being negotiations. They make it possible to determine a solution that is beneficial for all its participants, imitating real negotiations conducted by people in the course of doing business.
The use of a multi-agent paradigm system to control the individual components of the formation enables the flexibility offered by this type of AI, allowing it to function in a real environment where measurement uncertainties, delays or disruptions in communication, as well as unexpected failures may occur. The fact that agents are resistant to vague environmental data and unexpected damage seems to work in favor of such an approach [8]. Thanks to the use of the agent system, it is possible to precisely control the formation of tugboats while maintaining various shapes of formations, the speed of individual vessels and the distance between them
The authors would like to present the concept of a multi-agent system developed by them, which, in addition to performing navigational functions, is able to control the movement of the formation in such a way as to additionally reduce the energy used for movement. This system has the ability to control the entire formation both during its movement, as well as to use precision control when assisting larger vessels (maneuvering).

2.2. Autonomous Sea Vessels

The development of technology begins to allow for ever growing automation of marine vessels, ultimately striving to build fully autonomous ships. A description of the current scale of autonomy levels of surface vessels as understood by Lloyd’s Register and SAE is presented in [9]. This publication compares the taxonomy of autonomy levels defined by the two mentioned organizations with the taxonomy proposed by other studies. In turn, a broad overview of 60 ASV (Autonomous Surface Vessels) used in the research is presented in [10]. This article also presents historical statistics, presenting the dynamics of ASV research since the 1990s, and the levels of autonomy achieved during that time. Another review [11] includes 26 autonomous ships designed to work in ports and focuses on determining their TRL (Technology Readiness Level) on an 11-point scale.
In 2017, the first tests of autonomous tugs were carried out. In one of them, the Svitzer Hermod tug was remotely controlled by the operator using a system developed by Rolls-Royce [12]. The remote control station includes a 180° panoramic screen showing the view towards the bow of the tug from the cameras located on the superstructure, and additional smaller screens with the view of the image from the cameras aft, from the radar, and an electronic map showing the tug’s surroundings.
Similar research was carried out in 2020 by Samsung Heavy Industries using the Samsung T-8 tug controlled from a remote control station 250 km away, using LTE/5G cellular connectivity. The T-8 tug traveled 10 km in autonomous mode, under the remote supervision of the operator. Operation in autonomous mode uses signals from GPS, AIS and radar systems to identify objects and ships within a radius of 1km that may pose obstacles. In the event of a collision threat, the tug automatically maneuvers to avoid these obstacles.
In [13] the use of an artificial neural network to control the ship in order to perform an automatic berthing maneuver was presented. Automatic mooring of a ship with the use of four tugs was described in [14]; here the authors divided the approach maneuver into two phases. Similar problems related to the use of tugs or their equivalents are presented in [15,16,17,18,19].
In [20] a mathematical description of a system consisting of six autonomous tugs acting on the free hull of a large vessel is presented. Tugboats are evenly spaced around the hull of the vessel and act on it by pushing in directions inside the hull.
The development of autonomous ship technology will eventually lead to the implementation of the first production model, which will have to entail a modification of existing shipping regulations. The existing regulations do not provide for a situation where at least the captain (master) is not on board the ship [21]. The authors of the aforementioned study draw attention to the important duties of the master not only in the field of safe navigation of the ship, but also to ensure the proper condition of the ship at departure, such as: on-board stores, proper condition of the equipment and the ship’s hull.
The case of tugboats operating in the immediate vicinity of the home port seems to be a preliminary stage before introducing seagoing unmanned vessels into service, due to the limited area of operation, operation only in one country, and the small size of the tugboats themselves.

2.3. Energy Awareness

Any set of devices that performs a specific task and has an efficiency less than unity uses energy to perform this work. Modern systems can be equipped with mechanisms that will allow them to adjust their operating conditions in order to reduce energy consumption.
Autonomous vehicles, and in particular zero-emission autonomous vehicles, due to the high degree of internal automation, usually have accurate information about the amount of energy consumed, including data on instantaneous consumption, and the energy remaining at their disposal. In the case of vehicles equipped with electrochemical cells, the Battery Management System (BMS) performs the energy consumption monitoring function. The energy consumed by the vessel during its operation can be reduced by using special paint coatings on the hull, aeration of the ship’s bottom, the use of aerodynamic shapes, or a special construction of fins and foils.
The development of modern technologies of automatic vehicle control allows the use of energy-saving mechanisms that were impossible or impractical in the case of fully manual control. One example may be the formation of road convoys (platoons) [22,23] by autonomous cars moving on highways. Maintaining a constant, relatively short distance between moving vehicles reduces aerodynamic drag. From the available literature, it is known that the distances and mutual location of identical vessels flowing close to each other have a significant impact [24,25,26] on hydrodynamic resistance.

3. Tugboat Formation Multi-Agent Control System

3.1. Tugboat Formation Concept

In this publication, the authors propose the use of a multi-agent system to control a formation of unmanned port tugs equipped with an electric propulsion system. The concept of the agent control system for tugboats assumes a hierarchical structure that enables the delegation of tasks with their simultaneous division into subtasks. This makes it possible to divide the primary task, which is the execution of a maneuver, e.g., entering the port and mooring at a selected quay, into several simpler stages of performing the planned maneuver, such as: sending a formation of tugboats from their mooring points to the vicinity of the ship—the target, attaching towing ropes to the target ship, bringing the vessel to the port along a specified route, carrying out the vessel mooring operation, disconnecting the tugboats from the target vessel and returning the tugboats to the berth, or assigning further tasks.
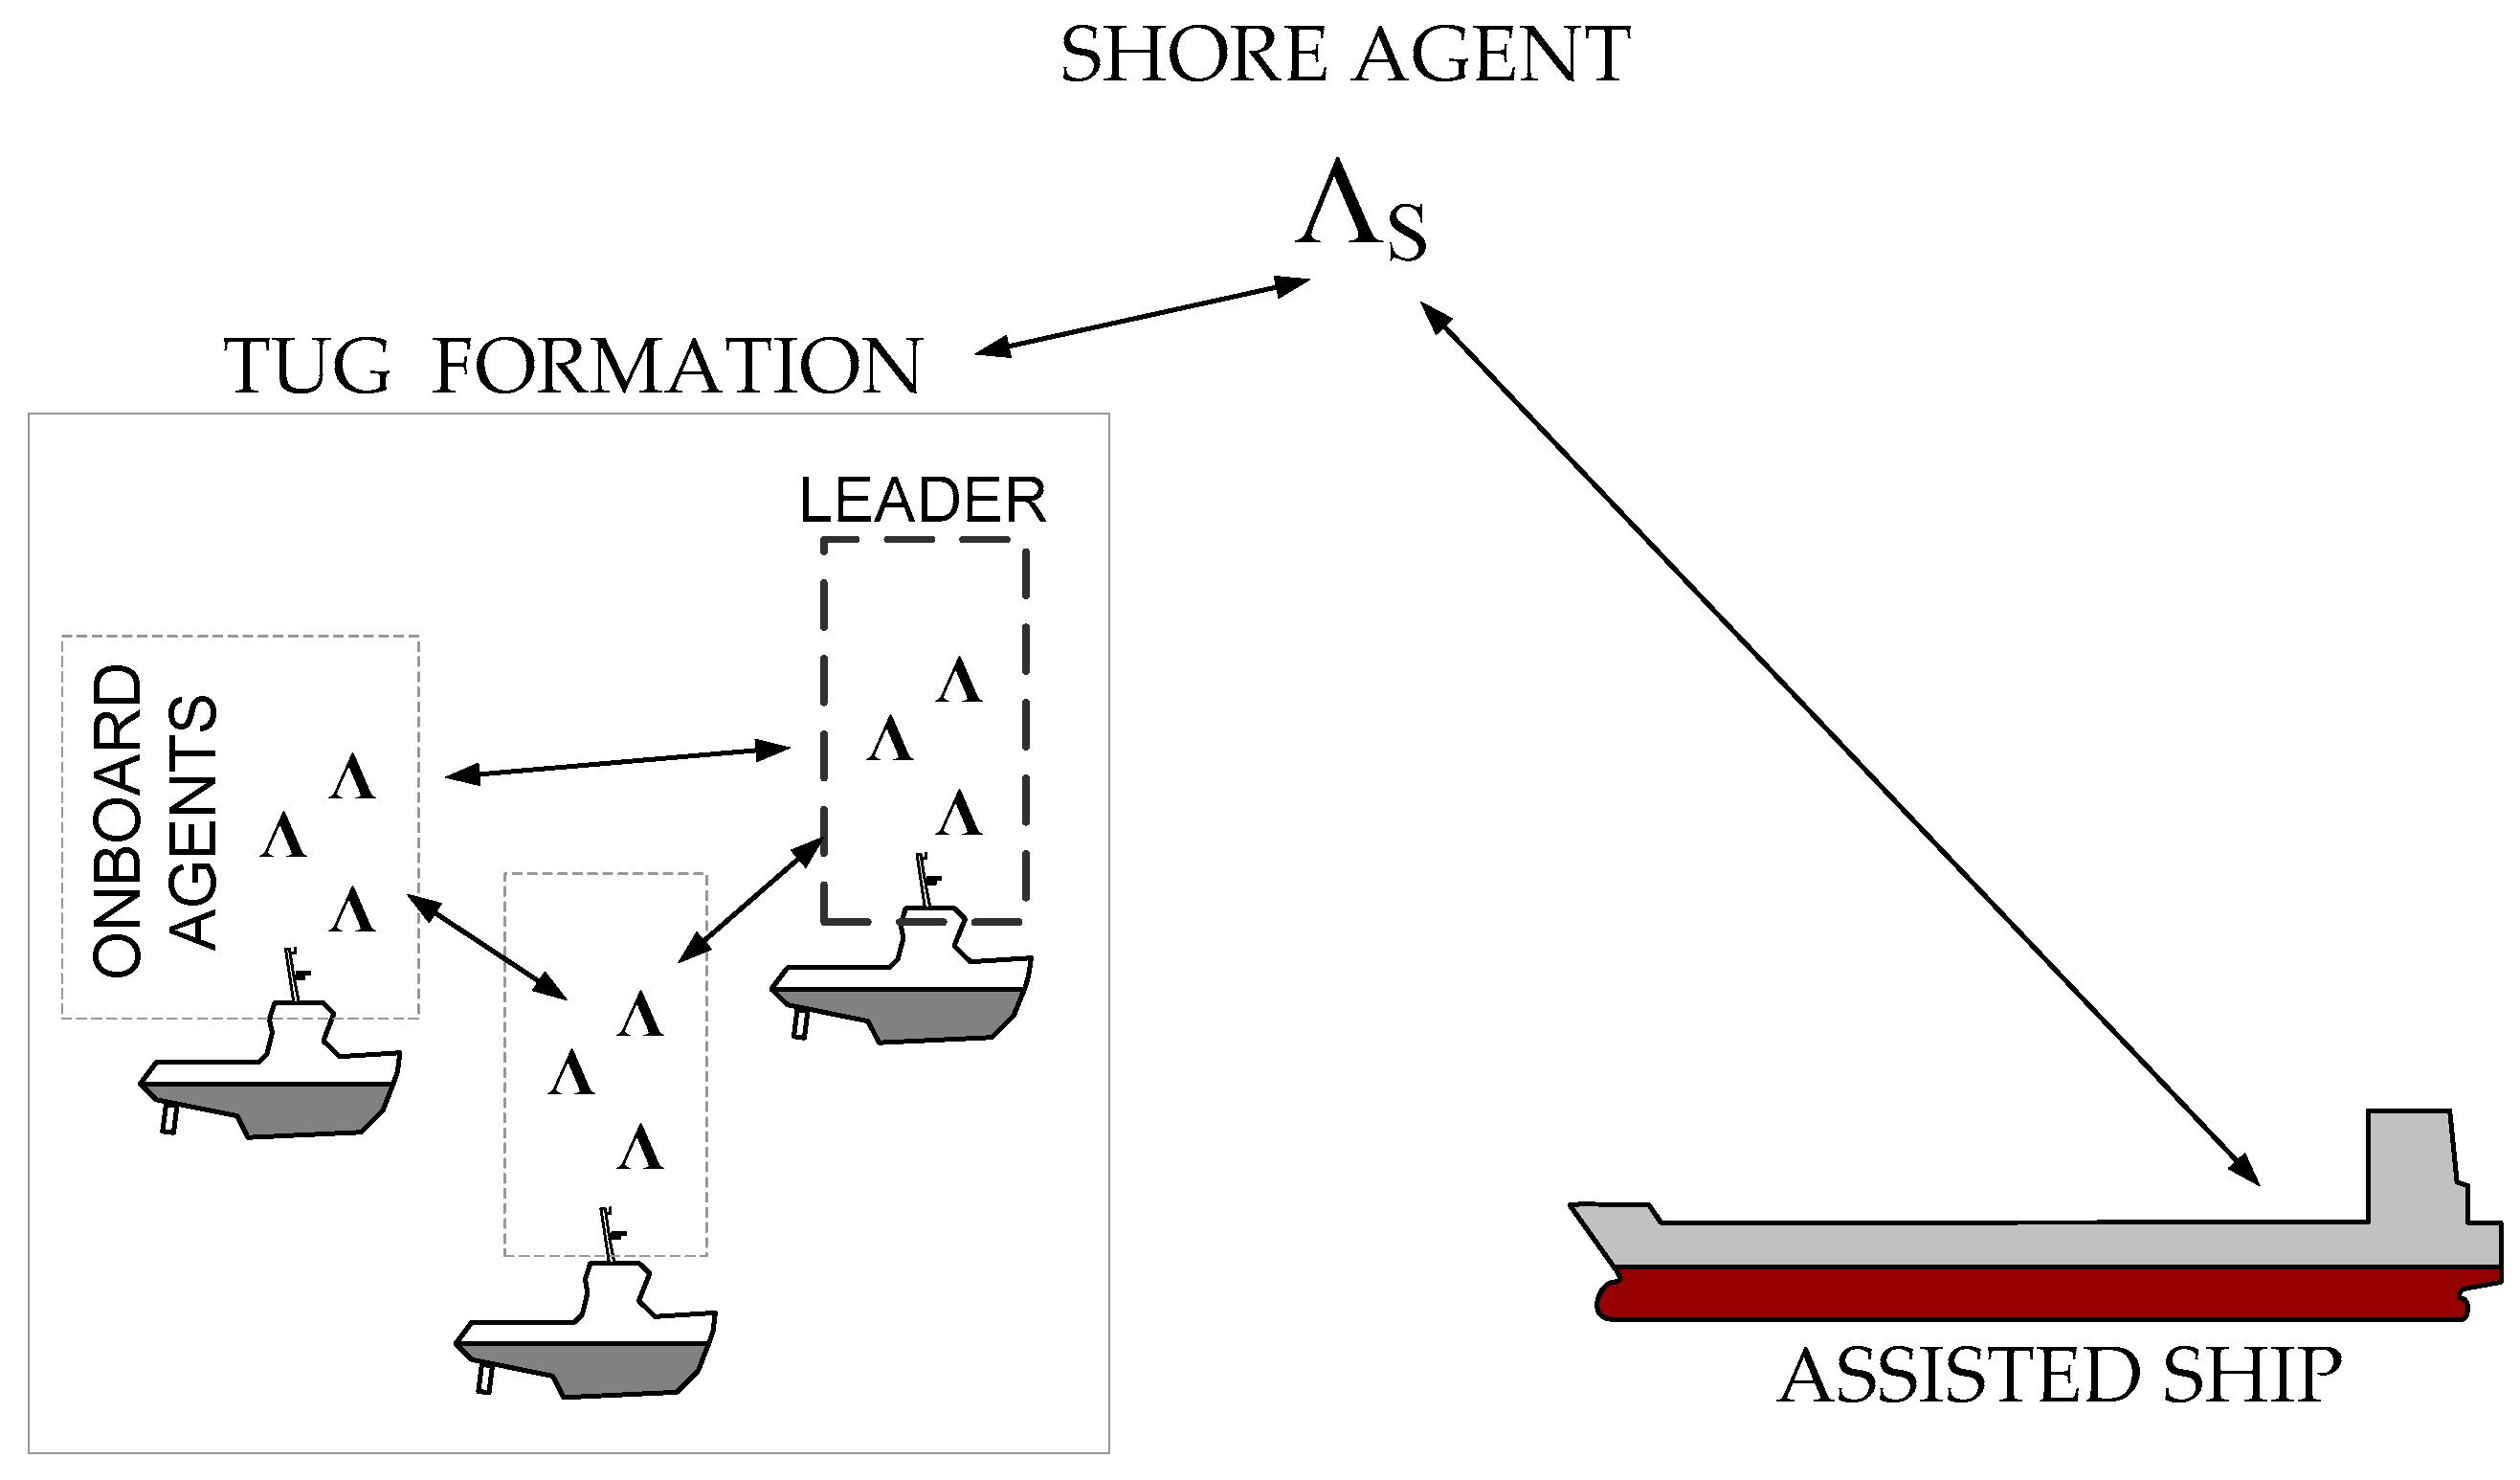
Figure 2 shows the structure of the proposed agent system. It is a hierarchical structure in which overriding control over the formation of tugboats is exercised by the shore agent who assigns specific tasks to the formation.
As part of the formation itself, each of the tugboats has a team of on-board agents whose tasks include navigation and precision control, control of energy consumption, control of propulsion devices, and communication.
One of the tugboats acts as a leader, and the tasks of its agents include performing certain functions on behalf of the entire formation. These include determining the passage route from the place of the current berth to the place of performing the current task, control over the energy consumption of all tugboats of the formation, and communication with the shore agent.
The shore agent’s tasks also include communication with ships wishing to enter or leave the port or to change their position inside the port. This agent should conduct negotiations in order to determine the conditions of assistance requested by the vessel and then commission a selected formation of tugboats to perform the task according to the negotiated scenario.

3.2. Tugboats

The tugboats included in the formation will be equipped with an electric drive, using an electrical energy storage as a source of energy. The use of an electric drive has a number of advantages, such as a quick response to control [27], no need for thermal stabilization (warm-up) after a long standstill, higher efficiency compared to conventional diesel drive [28], higher reliability and no local emissions.
The electric drive, unlike a drive using a diesel engine, can be ready to work at full power in a much shorter time than a conventional drive. Marine diesel engines require pre-heating, prelubricating with oil before starting after a long standstill, and after starting they should not be loaded with full power immediately. The typical heating process requires energy, often electrical, provided by an on-board generator that runs at all times when the tug is in operation.
The high efficiency of electric propulsion systems has been used for many years on ships in the form of diesel-electric hybrid propulsion systems [29]. The main limitation of internal combustion engines is their low efficiency at low load. A Diesel-Electric (DE) hybrid system uses electric motors to drive propellers or other marine propellers that are powered by electricity generated by a set or sets of diesel generator sets. The reason for the better efficiency of the DE type drive is the ability of the automation system to select such a configuration of the operating generating sets so that all of them are loaded in the optimal range. The DE drive system usually does not have any energy buffer, so that under variable load, frequent switching of operating generating sets may occur, which may limit the maximum efficiency.
The use of an electrical energy storage facility allows for maintaining high efficiency of the energy source [29] in the entire load range from minimum to rated. According to the results available in publication [30], for the greater part (75%) of the working time, the power consumption by the propulsion system of a typical tugboat does not exceed 20% of the rated load, and only for 4% of the working time does it exceed 60% of the rated load.
By limiting the moving parts in the electric motor to the impeller and bearings, this motor has much more predictable reliability parameters compared to a diesel engine, often consisting of several hundred moving parts, connected into many cooperating units. As well, maintenance operations of the electric motor are easier and their number is smaller, and the operation itself is safer due to the lack of contact between the service personnel and the fuel, the elimination of carbon content and the reduction of the amount of heavy metals in the lubricating oil [31].
The obvious advantage of all-electric propulsion systems is their zero emissions. However, when used on ships there is another advantage, which is a significant reduction in the amount of fuel on board. Marine fuel is classified as an oily substance and has the ability to pollute water reservoirs [32] in a way that is difficult to remove in the event of a spill on the water surface.
The use of tugboats with electric propulsion, equipped with capacious energy storage, creates new opportunities for reducing pollution by ships entering the port. An additional advantage of using electric propulsion systems of tugboats is the possibility of powering the power grid of the towed vessel from the tugboat’s energy storage. Thanks to such a solution, it would be possible to stop diesel generating sets before entering the port and meet the assumptions related to broadly understood environmental protection by reducing pollution by ships entering the port. According to the EU Directive 2005/333 [33] and EU Recommendation EC 2006/339 [34], a ship that has just moored in a port should switch from on-board power supply to shore power supply as soon as possible.
The presented possibilities of using tugs’ electrochemical energy storages would bring two benefits. Firstly, it would create circumstances conducive to the reduction of exhaust emissions by the ship, by having most of the load of the ship’s power plant taken over by the energy storage facilities of the tugboats. Secondly, the power connection between the energy storage facilities of the tugboats and the assisted vessel enables the tugboats to balance their energy consumption with the use of a common power grid. While assisting, some of the tugboats involved in maneuvers may need to expend more energy than others, for example due to asymmetry in environmental factors such as strong winds pushing the vessel off course. This will result in an uneven discharge of the energy stores after the assist operation is completed, which will limit the formation’s further ability to work until the energy stores are recharged.
In the case of the extension of the tugboat system to a system that also allows operation at a slightly longer distance than the port roads, it may be necessary to use a hybrid propulsion system in which diesel generators will be able to provide the necessary amount of energy for the tugboat’s operation. This is due to the low energy density of available energy storage solutions at the level of up to 250 Wh/kg [35], while the energy density of diesel fuel is 42.64 MJ/kg [36] i.e., 11,844 Wh/kg. Taking into account the efficiency of typical diesel gensets at the level of approx. 50%, 1 kg of diesel fuel will provide over 23 times as much energy as 1 kg of the best energy storage currently available on the market. In this case, it is possible to use alternative fuels to diesel, e.g., Liquefied Natural Gas (LNG), with an even higher energy density of 50 MJ/kg (13,889 Wh/kg), which will minimize the atmospheric emission of carbon dioxide and sulfur. The use of LNG as a fuel also eliminates the possibility of leakages polluting the water environment, because if they do occur, methane, the main component of LNG, simply evaporates into the atmosphere.
Charging the energy store is possible by means of fast chargers, installed on the wharf, that are similar to those used in currently available commercial fast charging systems for ships [37,38,39]. Such an approach requires a part of the port quay to be used as a charging terminal for tugboats, where tugboats can call to recharge their energy storage or to wait for instructions in the absence of orders to be carried out. The number of berths should be equal to the number of tugboats operating in a given port, but not all of them need to be equipped with complete charging infrastructure. Depending on the expected daily number of operations, the extent of the area of operations, the dimensions of the assisted vessels and local hydro-meteorological conditions, an appropriate number of berths must be equipped with charging facilities.
An alternative to using the public power grid is to take advantage of the opportunities offered by technologies for the use of alternative energy sources, optionally connected to a local, onshore energy storage. Where intermittent sources of energy are used, such as photovoltaic panels or tidal power plants, the size of the storage facility must be appropriately sized to ensure that it can be recharged during periods when no alternative sources are producing. In the case of sources with characteristics showing less daily variability, such as offshore wind turbines of appropriate capacity, the use of onshore energy storage may not be required.

3.3. Energy-Aware Formation Example Scenario

Figure 3 shows an example of a port with three formations of tugboats: A, B, C. Formation A consists of two tugs that are currently loading their energy storages, and their charge level is low for now. Formation B consists of three tugboats; their energy stores are high, and the formation is currently off-duty. The last of the formations, consisting of four tugs, Formation C, has just completed a container ship mooring operation, is at medium charge, and is available.
On the roads of the port there is an LNG tanker waiting to enter the port and moor at the LNG terminal. Due to the fact that it carries dangerous cargo and has specific dimensions and weight, it requires the assistance of three or four tugboats, depending on the current direction and wind strength.
For the example situation in Figure 3, the following tasks can be assigned to be performed by the tugboat formation control system.
The first step is for the Shore Agent to determine which of the formations is best suited to assist and berth the tanker. In the first place, the agent may exclude formation A, due to it having not enough tugboats and the fact that it is currently recharging its batteries, the state of charge of which does not allow for interrupting this operation.
From the remaining two formations, B and C, after analyzing the weather situation, in the case of favorable conditions, formation B consisting of three tugboats may be selected, due to the high level of charge of their on-board energy storage. A decision is made on which of the formations will be assigned the task, and then the Shore Agent issues an order to assist the LNG tanker from the port roads to the port and to perform the mooring operation to the LNG terminal. During these operations, the Shore Agent supervises their performance. After mooring is completed, the formation is ordered to leave the ship, after which, depending on the current situation, a new order is issued.
In the presented case, the likely next command would be an order for the tugboats of the formation to approach the recharging terminal, which would have just been vacated by the tugboats of formation A, or to forgo the recharging in favor of formation C, which could for example require preparation for the operation of assisting a larger ship scheduled to enter the port, or when weather conditions are expected to deteriorate.

4. Tugboat Formation Multi-Agent Control System

4.1. Single Tug Resistance

While moving at a fixed speed, the tug is subjected to hydrodynamic and aerodynamic resistance forces, as well as forces resulting from environmental influences, balanced by the driving force of its propellers.
The basic drag components acting on the tugboat can be described using the following formula:
F T R = F F + F W V + F R
where:
FTR—Total resistance force,
FF—Water friction resistance force,
FWV—Wave-making resistance force,
FR—Residual resistances force,
The total force of hydrodynamic resistance FTR consists of several factors, but it is dominated by two components: the force of water friction against the hull FF and the force associated with the waves generated during the movement of the hull relative to the water FWV. The water friction force FF against the hull depends on the viscosity of the liquid (water), the speed of the hull movement, the surface area of the hull in contact with the water, as well as the shape of the hull and its roughness.
Resistance FF related to water friction against the hull is defined by the equation:
F F = c F · ρ W · S H · v 2 2
where:
cF—Coefficient of friction,
ρW—Water density,
SHArea of submerged hull,
v—Relative velocity between hull and water.
The value of the cF coefficient depends on the shape of the hull and the properties of its surface, i.e., the roughness of the sheets and their joints, the condition of the paint coating, or the presence of parasitic marine organisms.
The wave-making drag force of the FWV has two main components: transverse and divergent
F W V = F W T + F W D
where:
FWT—Wave-making resistance from transverse waves component,
FWD—Wave-making resistance from divergent waves component,
Both transverse and divergent waves can interfere with other waves. In particular, the transverse wave caused by the bow of a sailing vessel is subject to interference with the wave generated by the stern, which causes a large variation of the resistance caused by this component as a function of the vessel’s speed. One of the many ways to influence this component of resistance is to modify the shape of the ship’s bow by adding the so-called bulbous bow, the presence of which affects the shape of the wave produced by the ship’s bow.
The second important possibility occurs in the case of multihull vessels (e.g., catamarans, trimarans, etc.) or when several vessels sail side by side in the same direction and at the same speed.
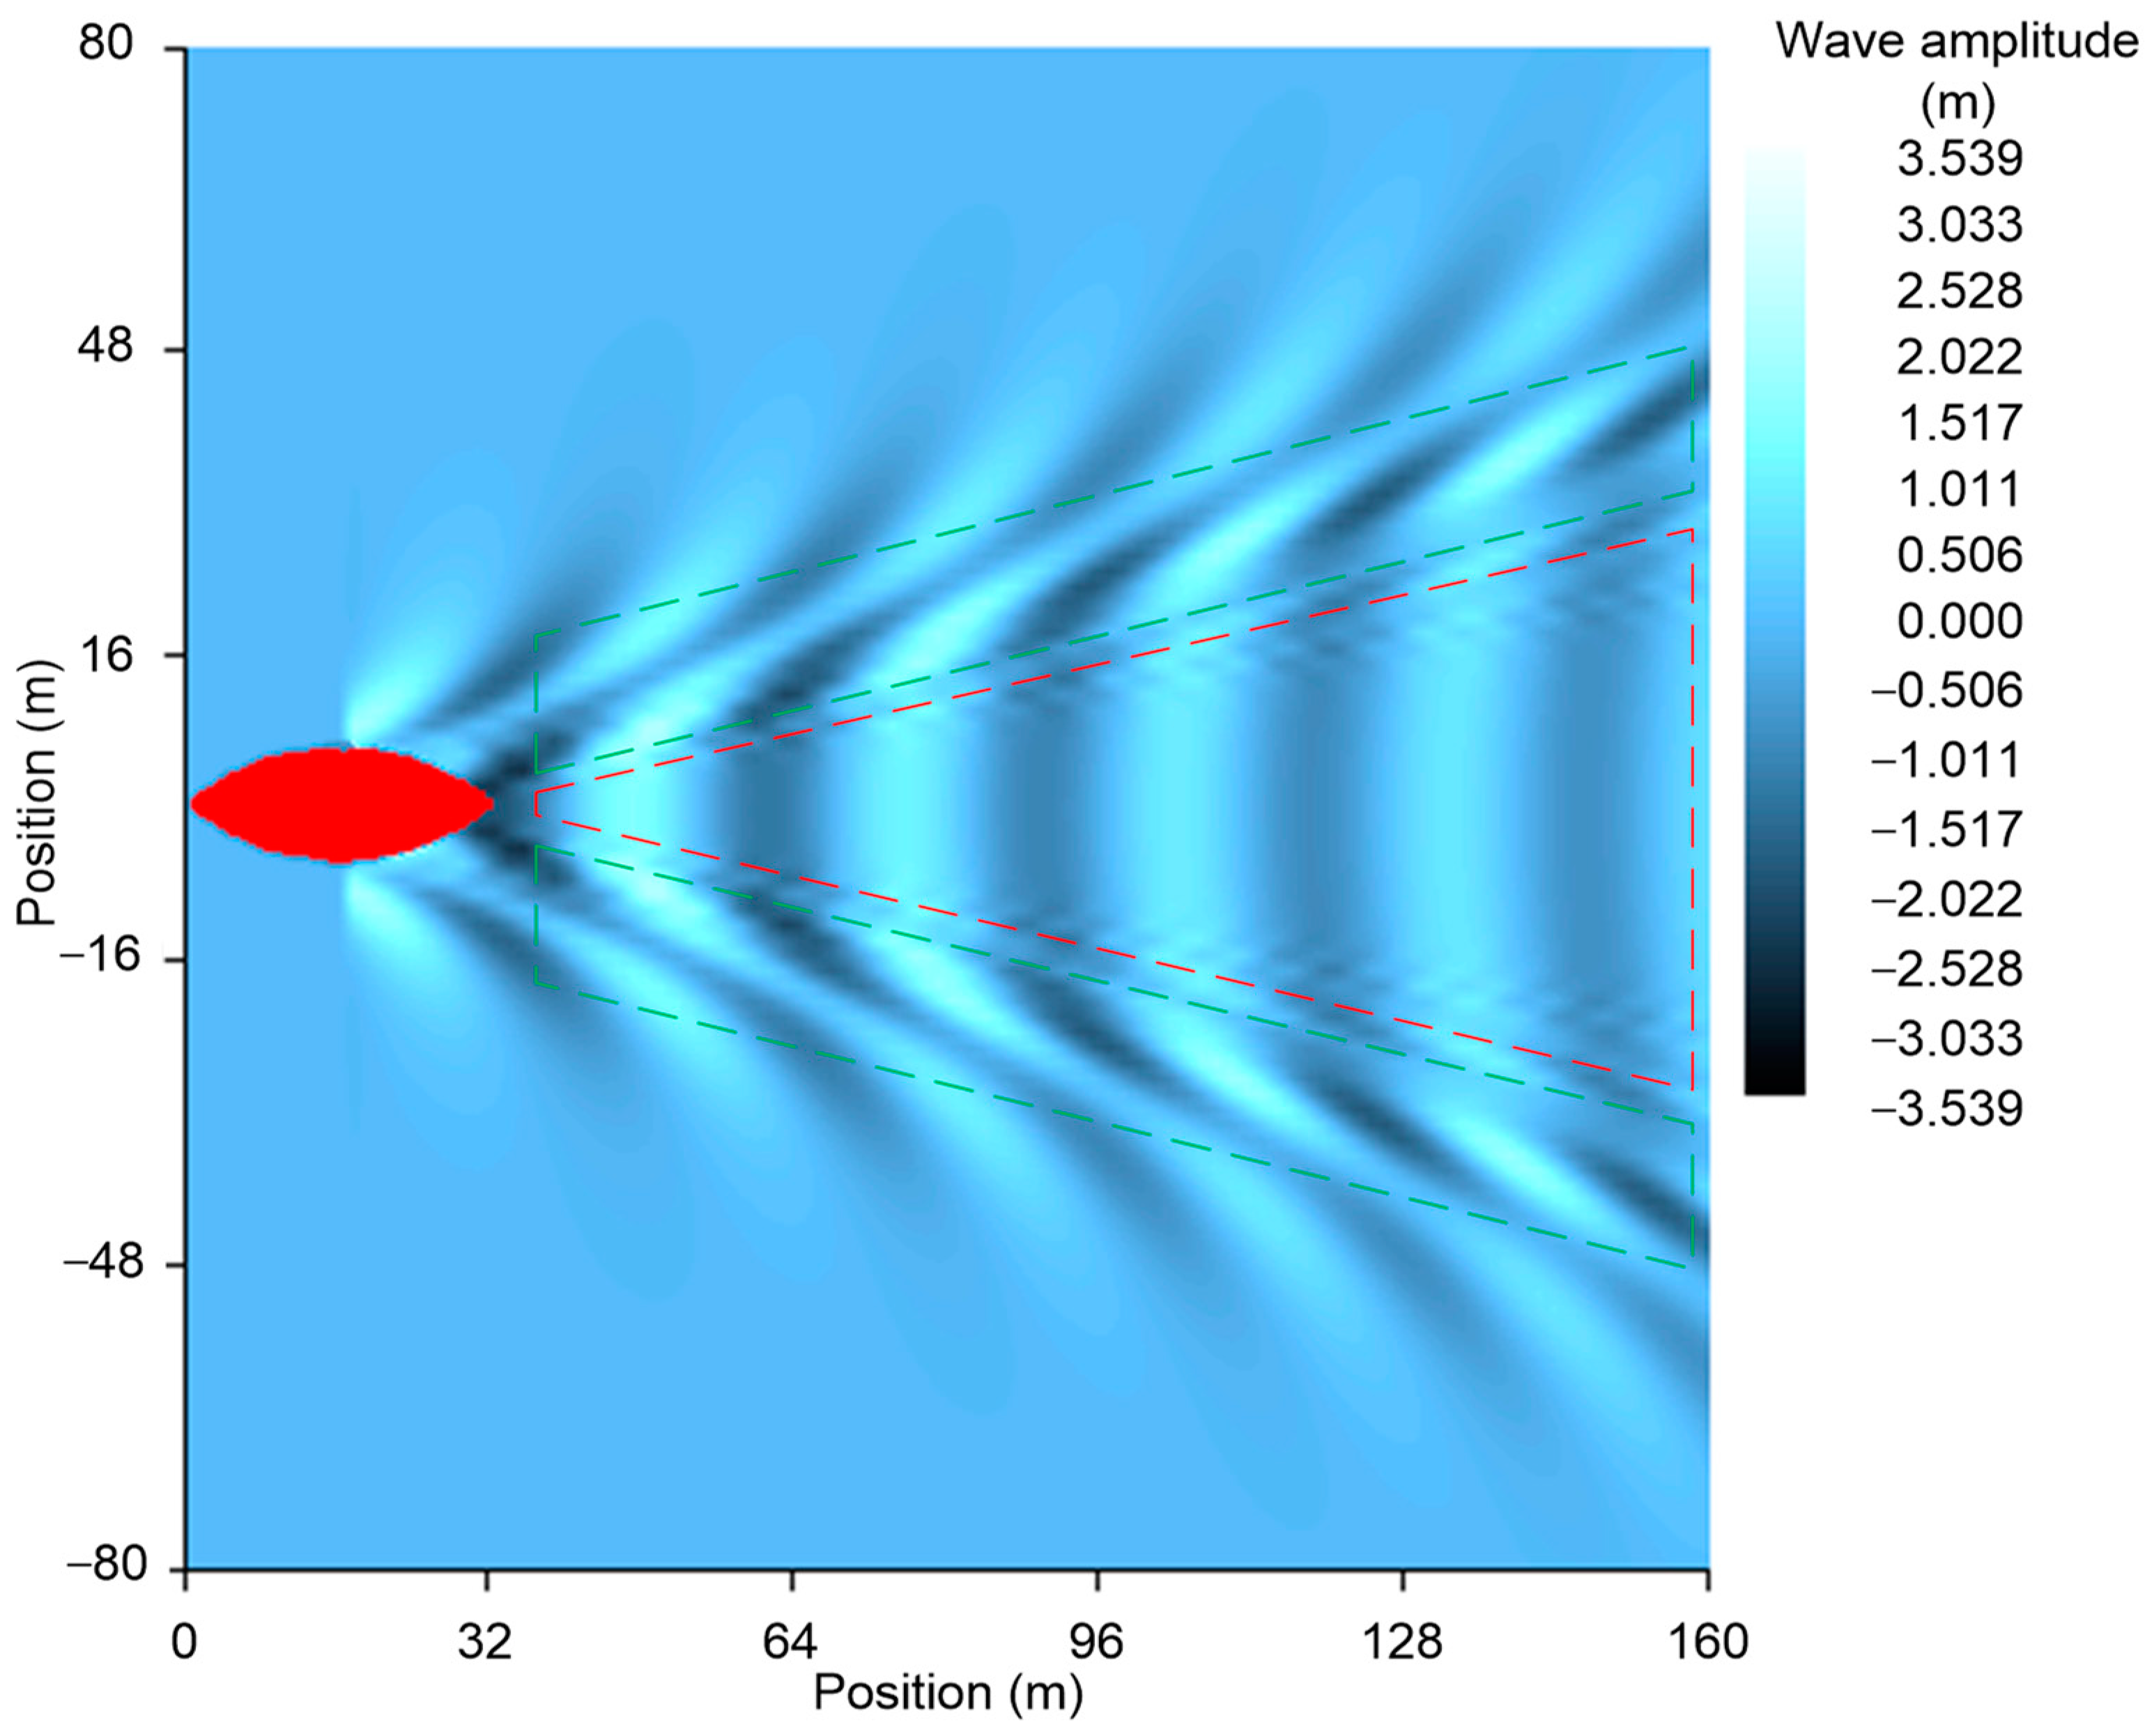
Figure 4 shows an exemplary image of the wave heights generated by the movement of a single tugboat at a speed of 13 knots, made using the Michlet program [40]. The wave height in meters was depicted using a color gradient scale. The values on the vertical and horizontal axes represent distances in meters. A system of transverse waves is visible, marked with a red frame, and two symmetrical diagonal wave systems are marked with green frames.
Residual resistance FR include forces acting on the tugboat’s hull caused by the environment.
F R = F E A + F E C
where:
FEA—Environmental aerodynamic resistance force,
FECEnvironmental sea current resistance force.
Aerodynamic resistance force FEA is given by:
F E A = ρ a · c d · A S · v a 2 2
where:
ρa—Air density,
cdDrag coefficient,
ASFrontal area of above water part of ship’s hull and superstructure,
vaRelative speed between ship and surrounding air.
The values of these forces depend on local hydro-meteorological conditions; however, it can be assumed that their magnitudes are the same for identical vessels remaining in close proximity to each other.
The FEA force is analogous to the FF force and arises from the friction of the unsubmerged part of the hull and the superstructure against the air. Due to the much lower value of the viscosity of air in relation to the viscosity of water, this force acts much more weakly compared to hydrodynamic forces.
The FEC force arises as a result of the spontaneous movement of water masses relative to the seabed, under the influence of existing surface currents. Sea currents occur in open waters and as such do not include harbor waters. An exception may be ports located in estuaries, such as the ports of Rotterdam or Guangzhou, where the river causes a water current directed towards the sea.
The final form of the equation describing the total drag force FTR acting on the tugboat’s hull takes the form:
F T R = F F + F W T + F W D + F E A + F E C
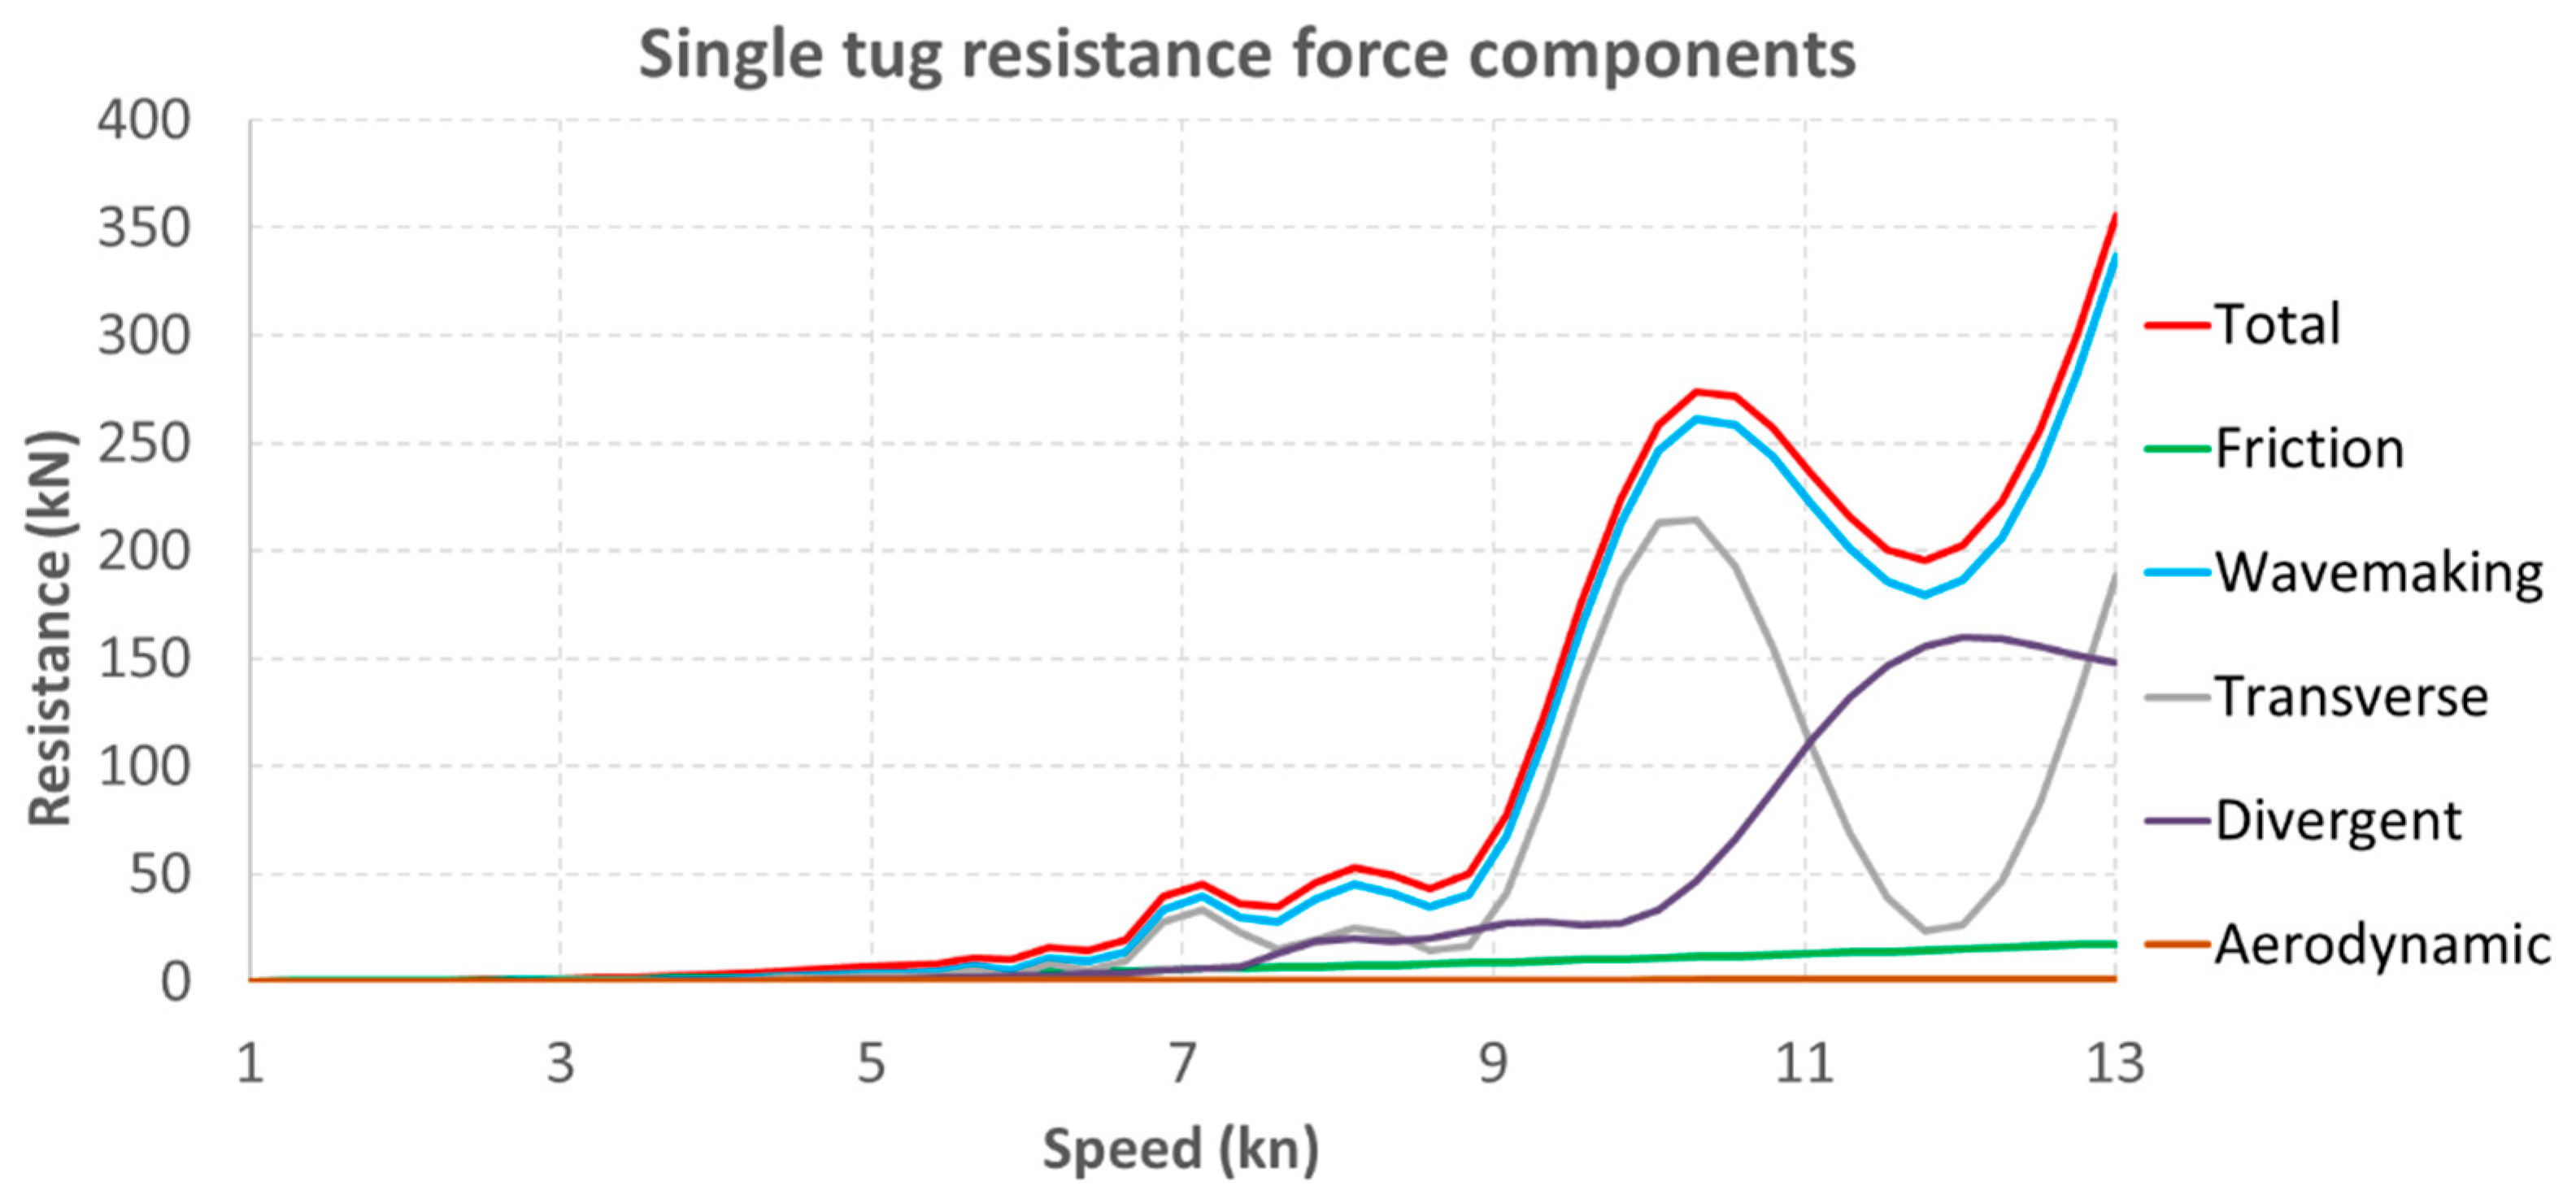
Figure 5 shows a graph showing the value of individual components of the FTR force, and Table 1 shows the percentage share of these components at speeds between 1 and 13 knots.
Up to a speed of about 6.5 knots, a state is visible in which the phenomenon of water friction against the hull is responsible for a significant part of the resistance. However, in the absolute scale, these are small values with a maximum of several kN. In the speed range from approx. 5 to approx. 7 knots, there is a significant increase in the share of resistances related to wave generation by the tugboat’s hull (from approx. 50% to approx. 85%); in the absolute scale, however, the resistances still do not exceed the value of approx. 50 kN.
After exceeding the speed of 9 knots, wave drag increases significantly and becomes the dominant source of drag (above 90%), and the drag force value begins to exceed 250 kN.
It is worth noting the decrease in the drag force in the speed range from 10 to 12 knots, associated with the disappearance of transverse waves in this speed range, caused by interference between the bow and stern waves. The local minimum of the resistance value is at the speed of 11.8 kn, and for the speed range over 10 kn it is the most economical speed for a single tug, corresponding to the towing power of 1185 kW.

4.2. Tug Formation Resistance

When moving a group of tugboats for an assist maneuver, it may be beneficial to assemble formations of a specific shape from the point of view of energy savings.
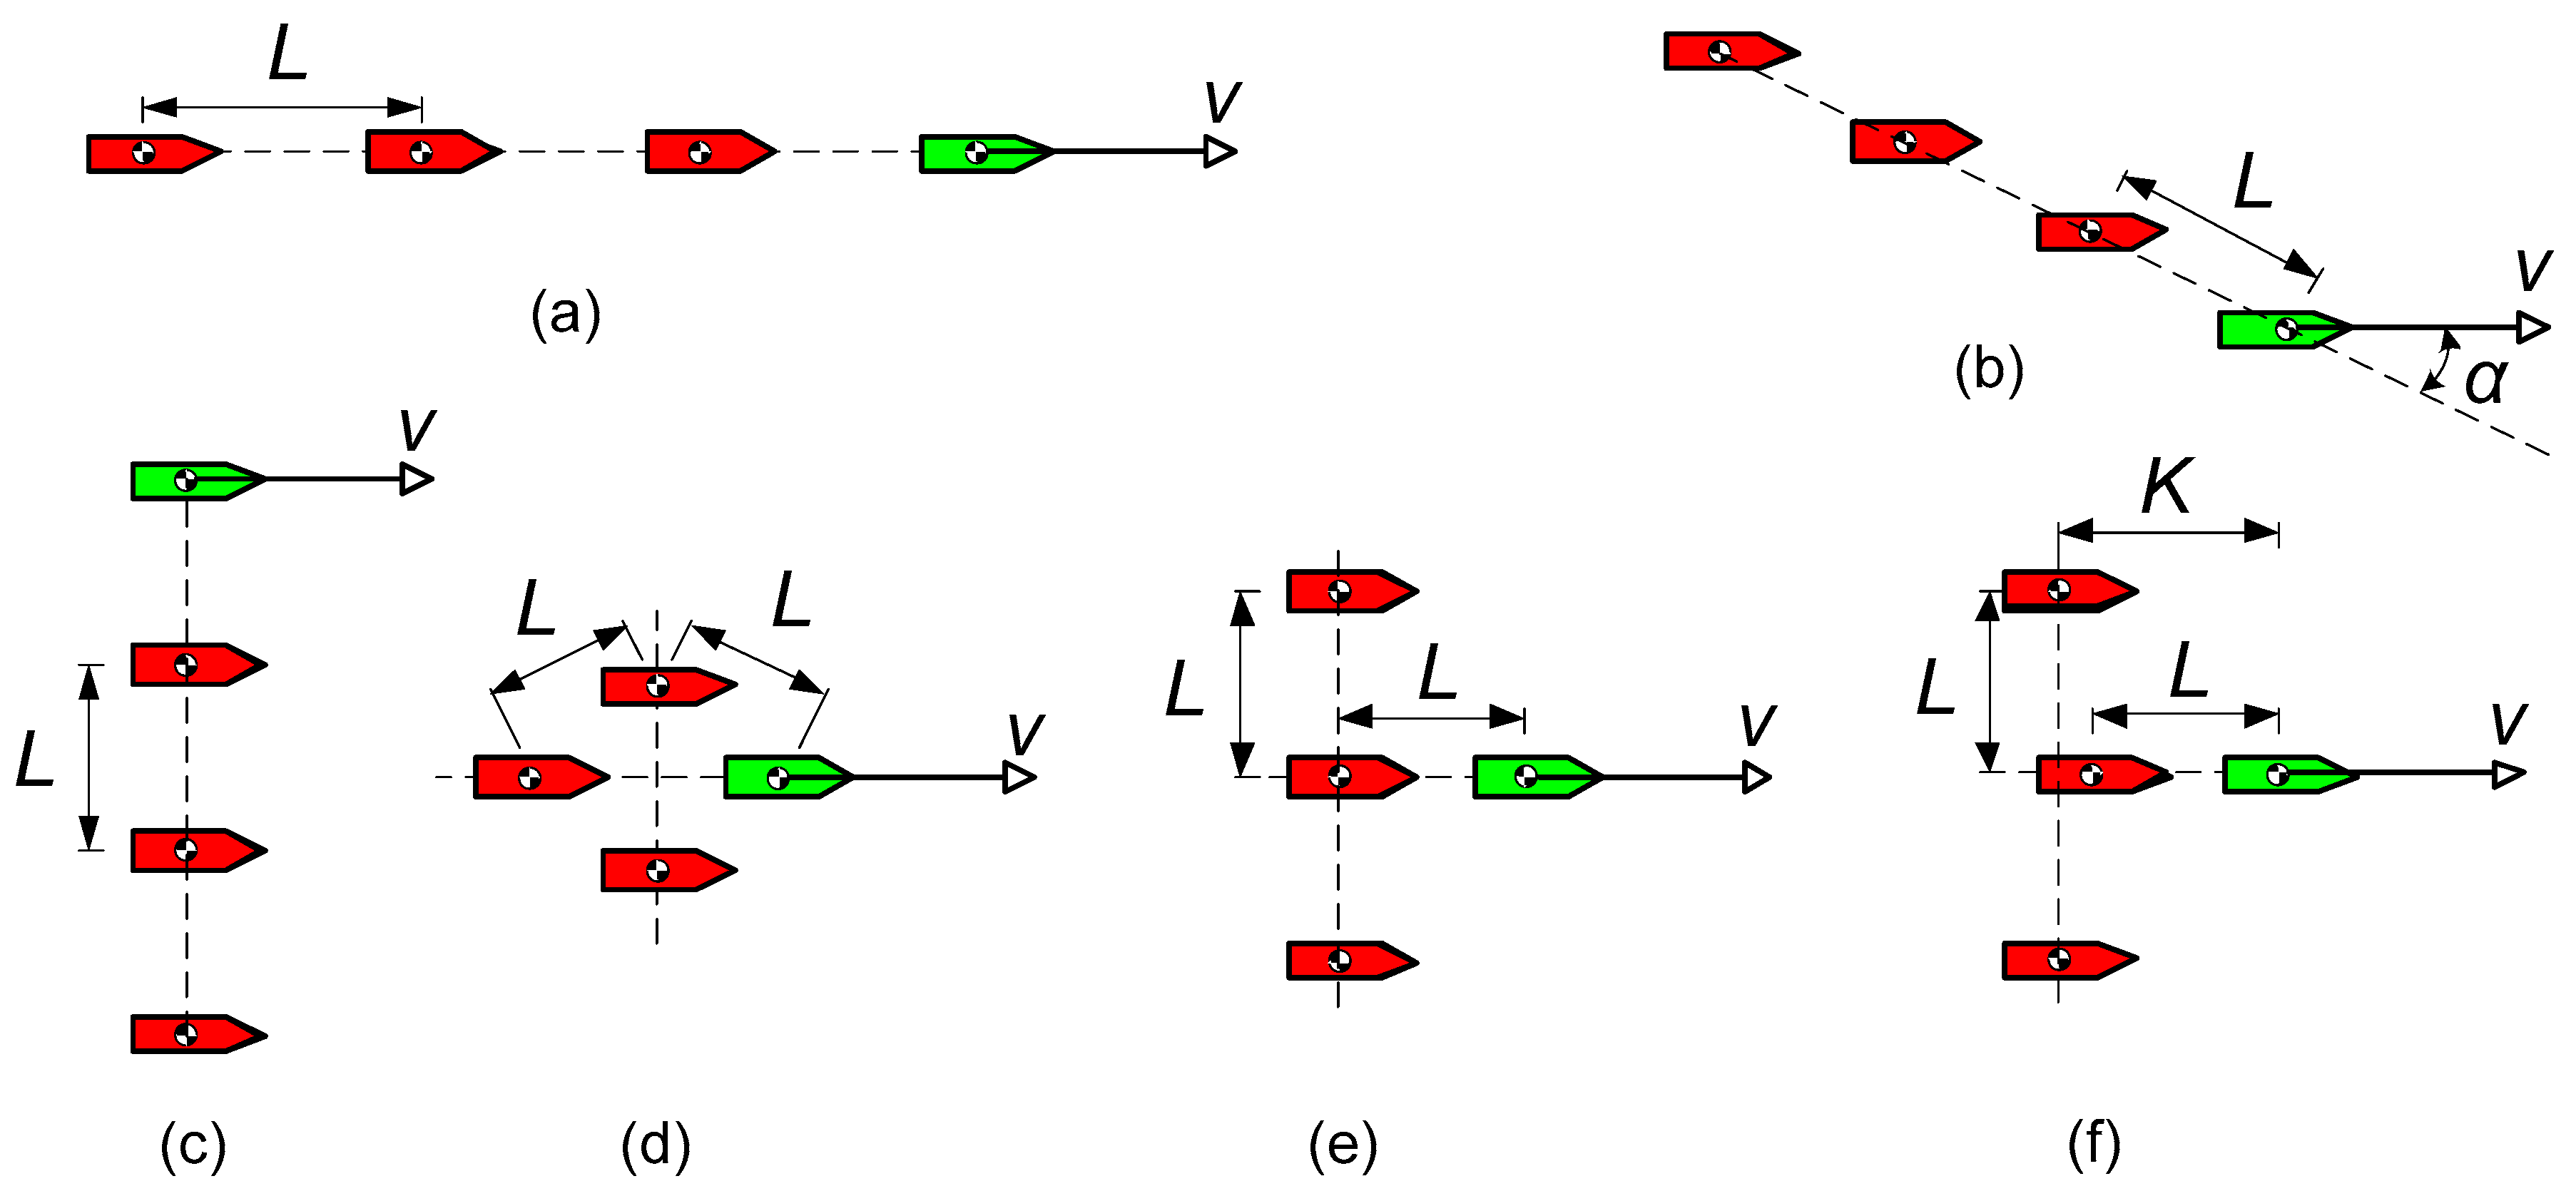
It can be assumed that if tugboats of a given formation have identical hulls and all sail in the same direction, with the same speed relative to the water, the same friction force FF will act on the hull of each of them. Example shapes of a formation consisting of four tugboats are shown in Figure 6.
The basic shape is a linear formation (a) in which the tugboats follow each other with a fixed distance between their centers of gravity equal to L, and along the velocity vector v. The echelon formation (b) is a modification of the linear formation where the distance L is maintained; however, the center of each of the tugboats is located on a line inclined by the angle α with respect to the velocity vector of the formation v. A special variant of the echelon formation is the wide formation (c), where the angle α is 90°, which makes the tugboats move side by side. The next variant is the diamond-shaped formation (d), where the tugboats are arranged on two mutually perpendicular axes, one of which coincides with the vector v. Placing three tugboats in a wide formation, with the fourth in front of them, gives the arrowhead formation (e).
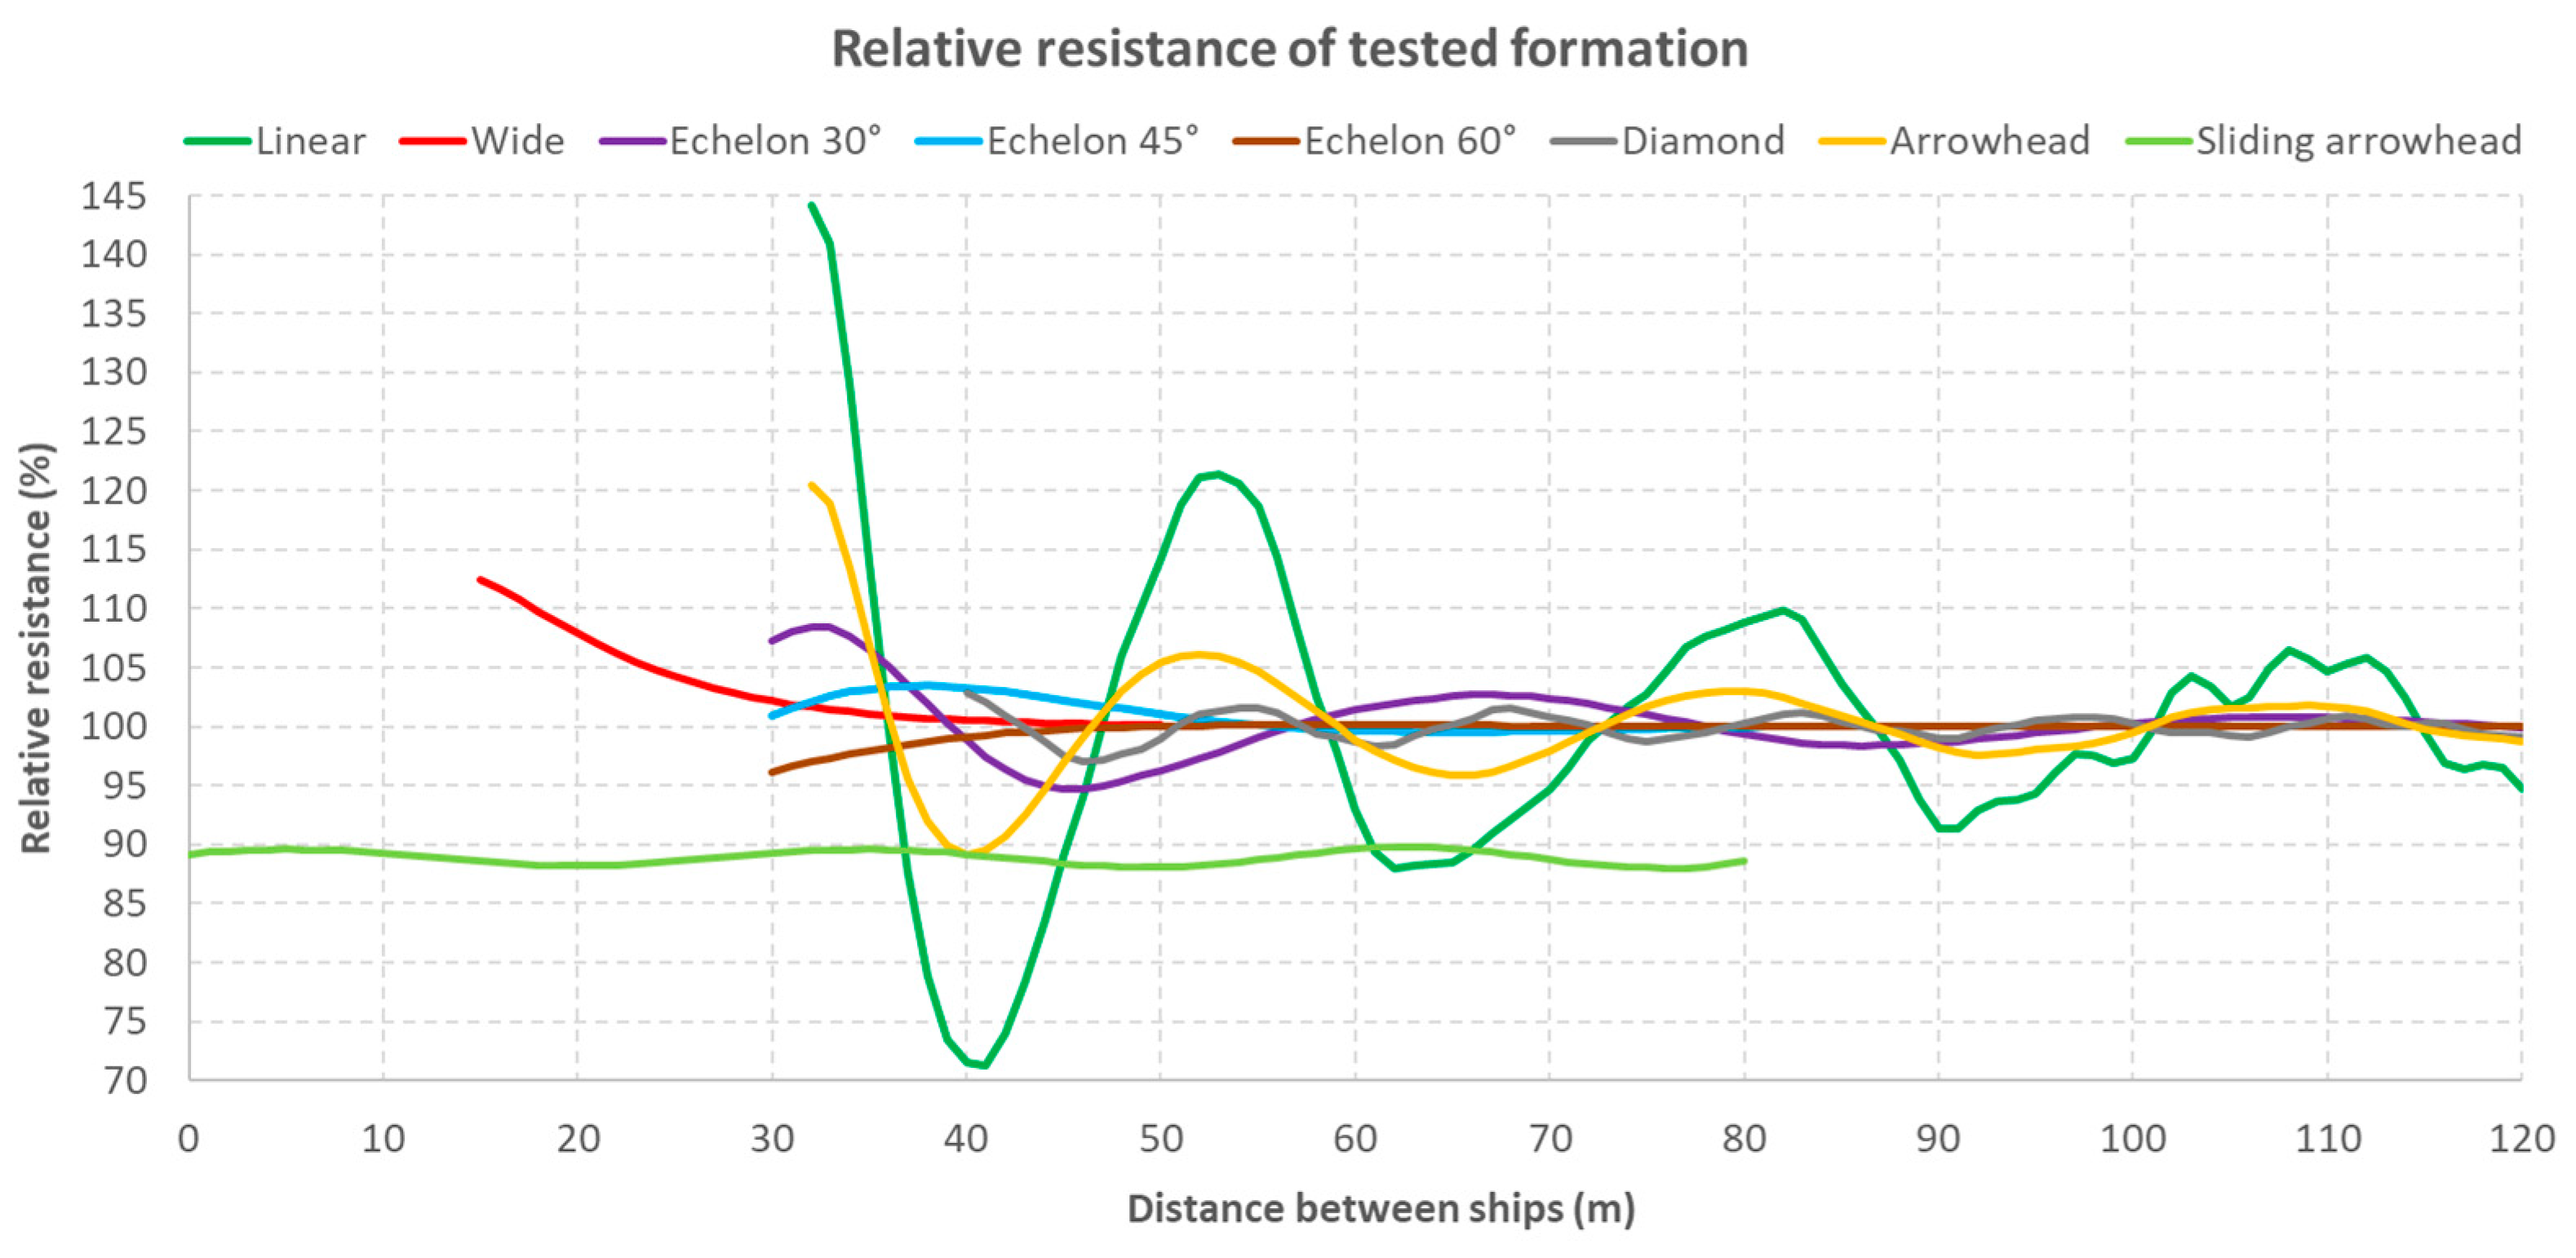
A variant of this formation (f), with additional parameter K, allows changing the position of outside formation members in relation to the leading tug. In this variant, the distance L has been fixed at 40 m, which gives the best relative resistance for the arrowhead formation (e).
Using the Michlet program version 9.13, a series of calculations was carried out for formations consisting of four identical tugboats with parameters as presented in Table 2. These parameters correspond to the parameters of the actual hull of the Damen ART 80-32 tugboat.
All calculations were performed for the speed range from 1 to 13 knots. The upper speed value was adopted on the basis of a catalog card modeled on the model of a tugboat and an analysis of data on the actual speeds of tugboats of similar dimensions (LOA approx. 32 m) available on the marinetraffic.com website.
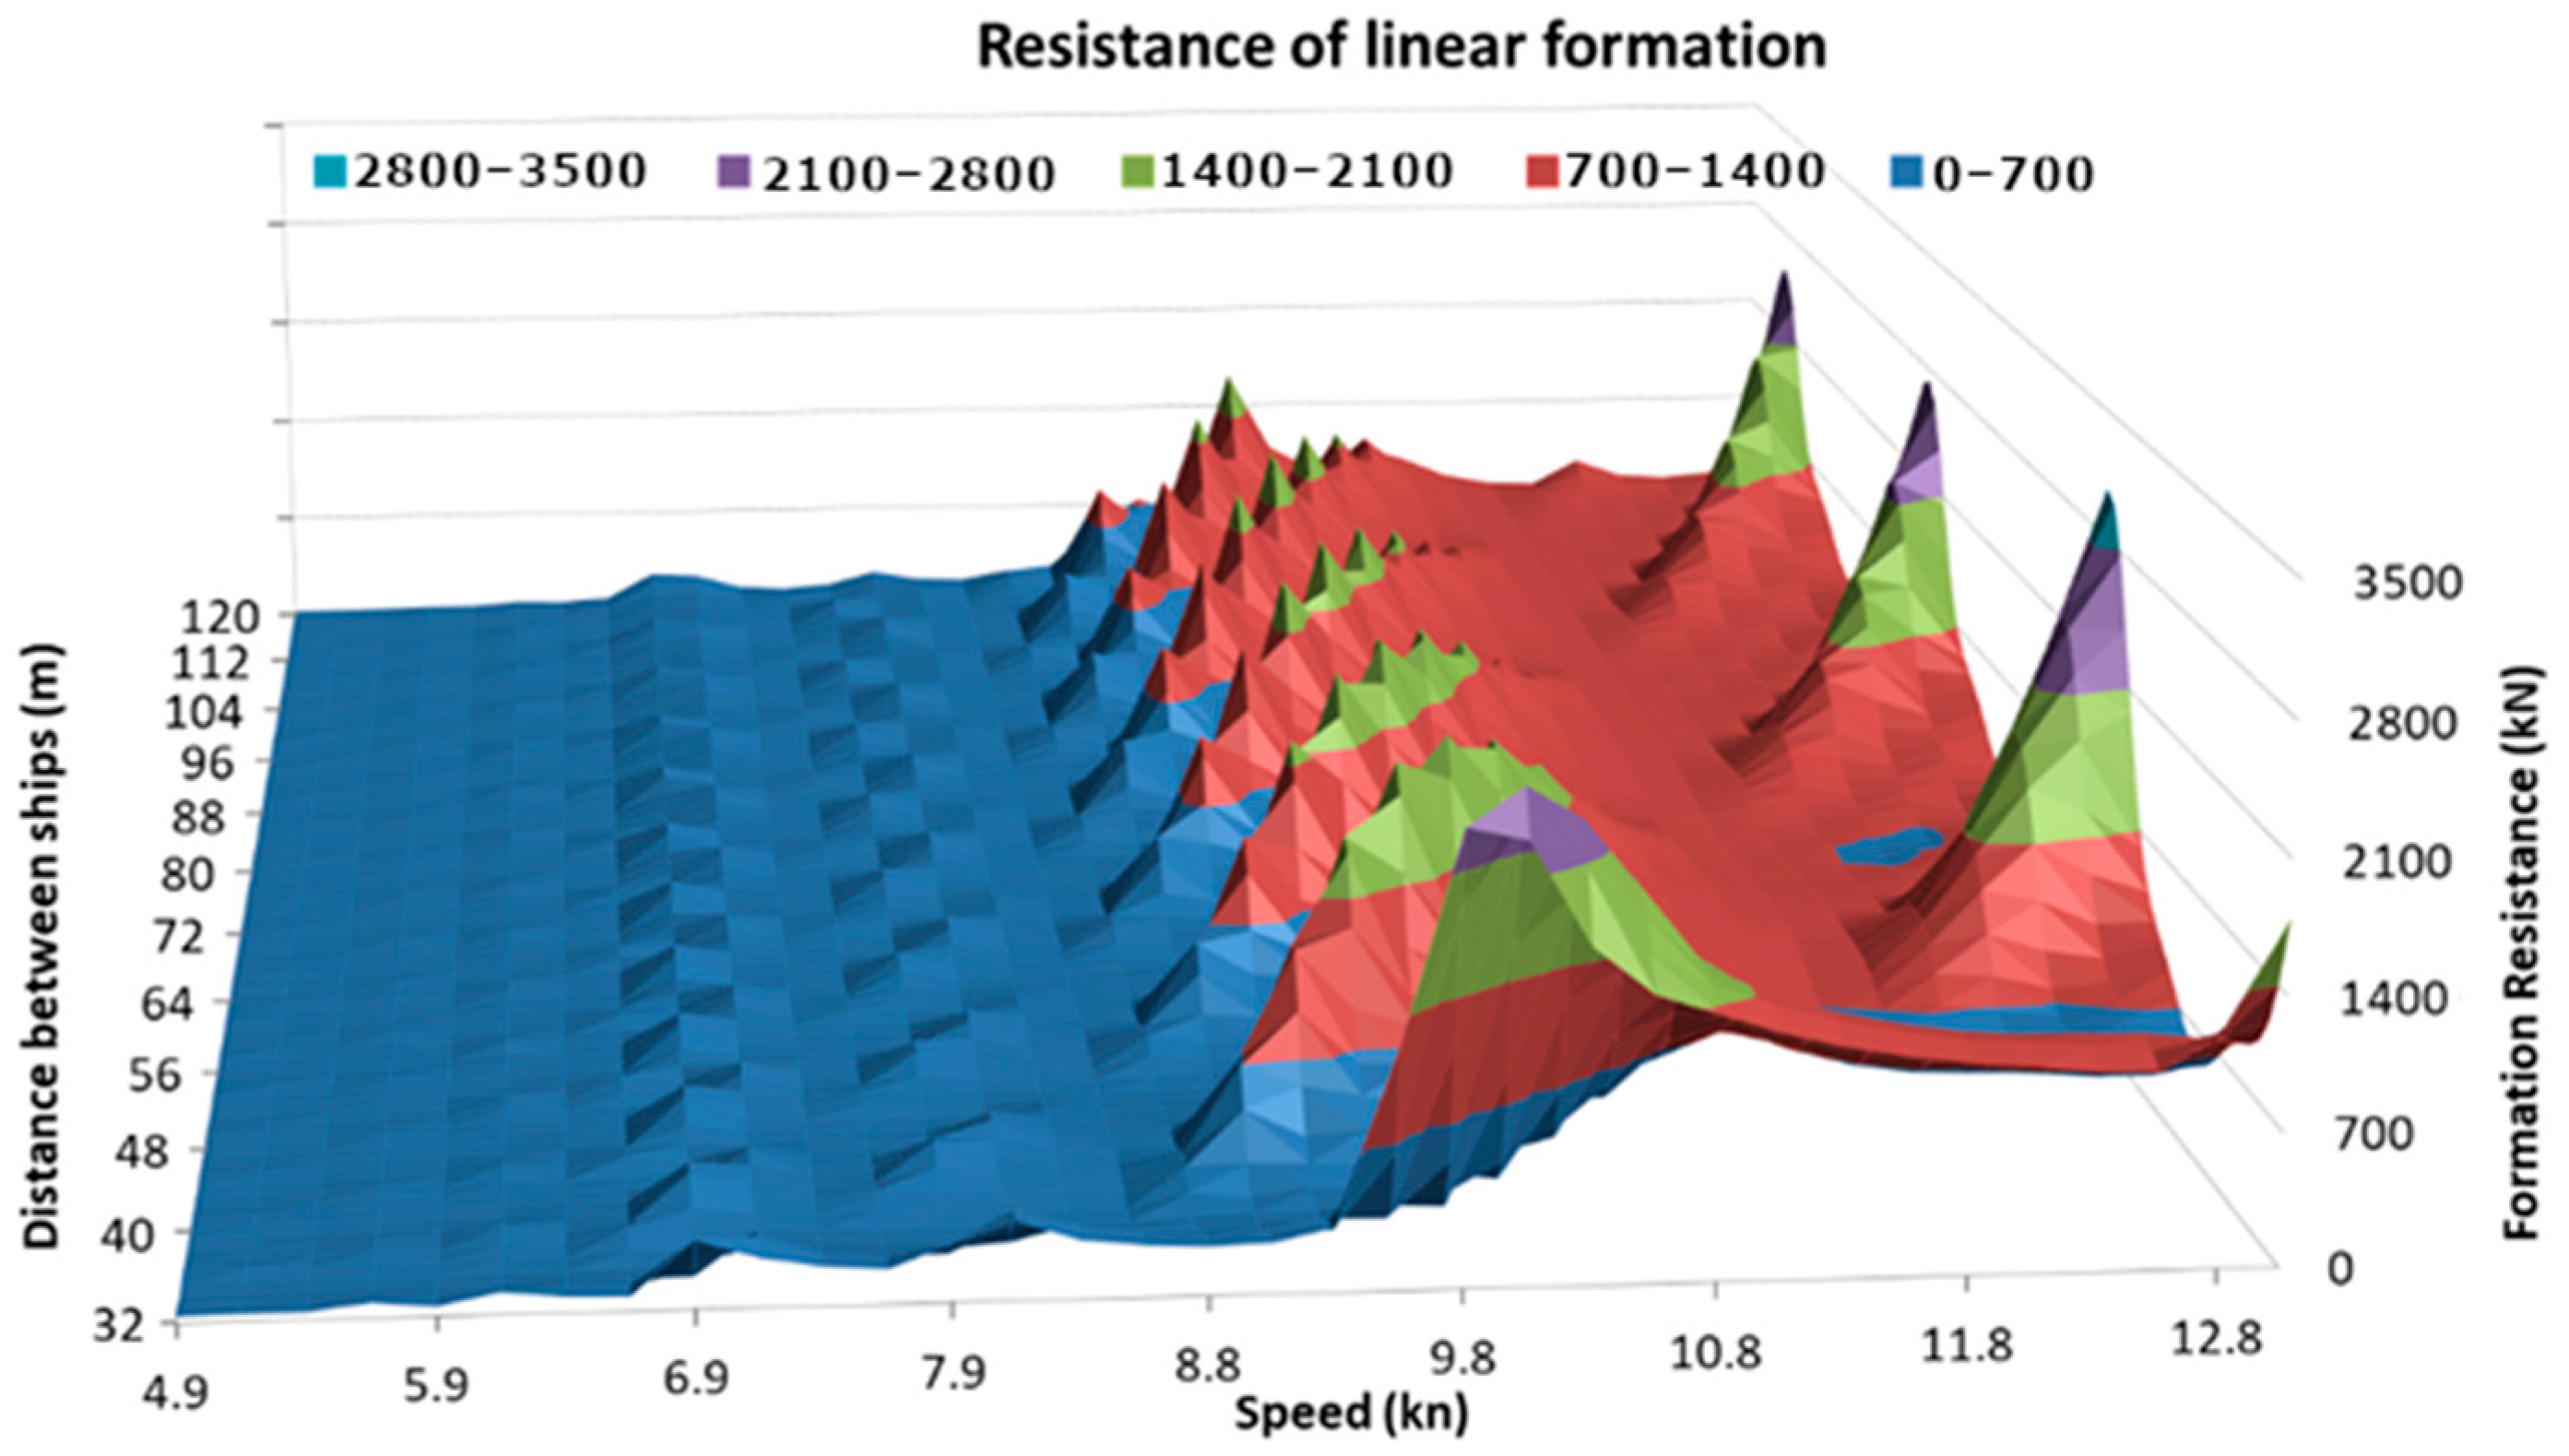
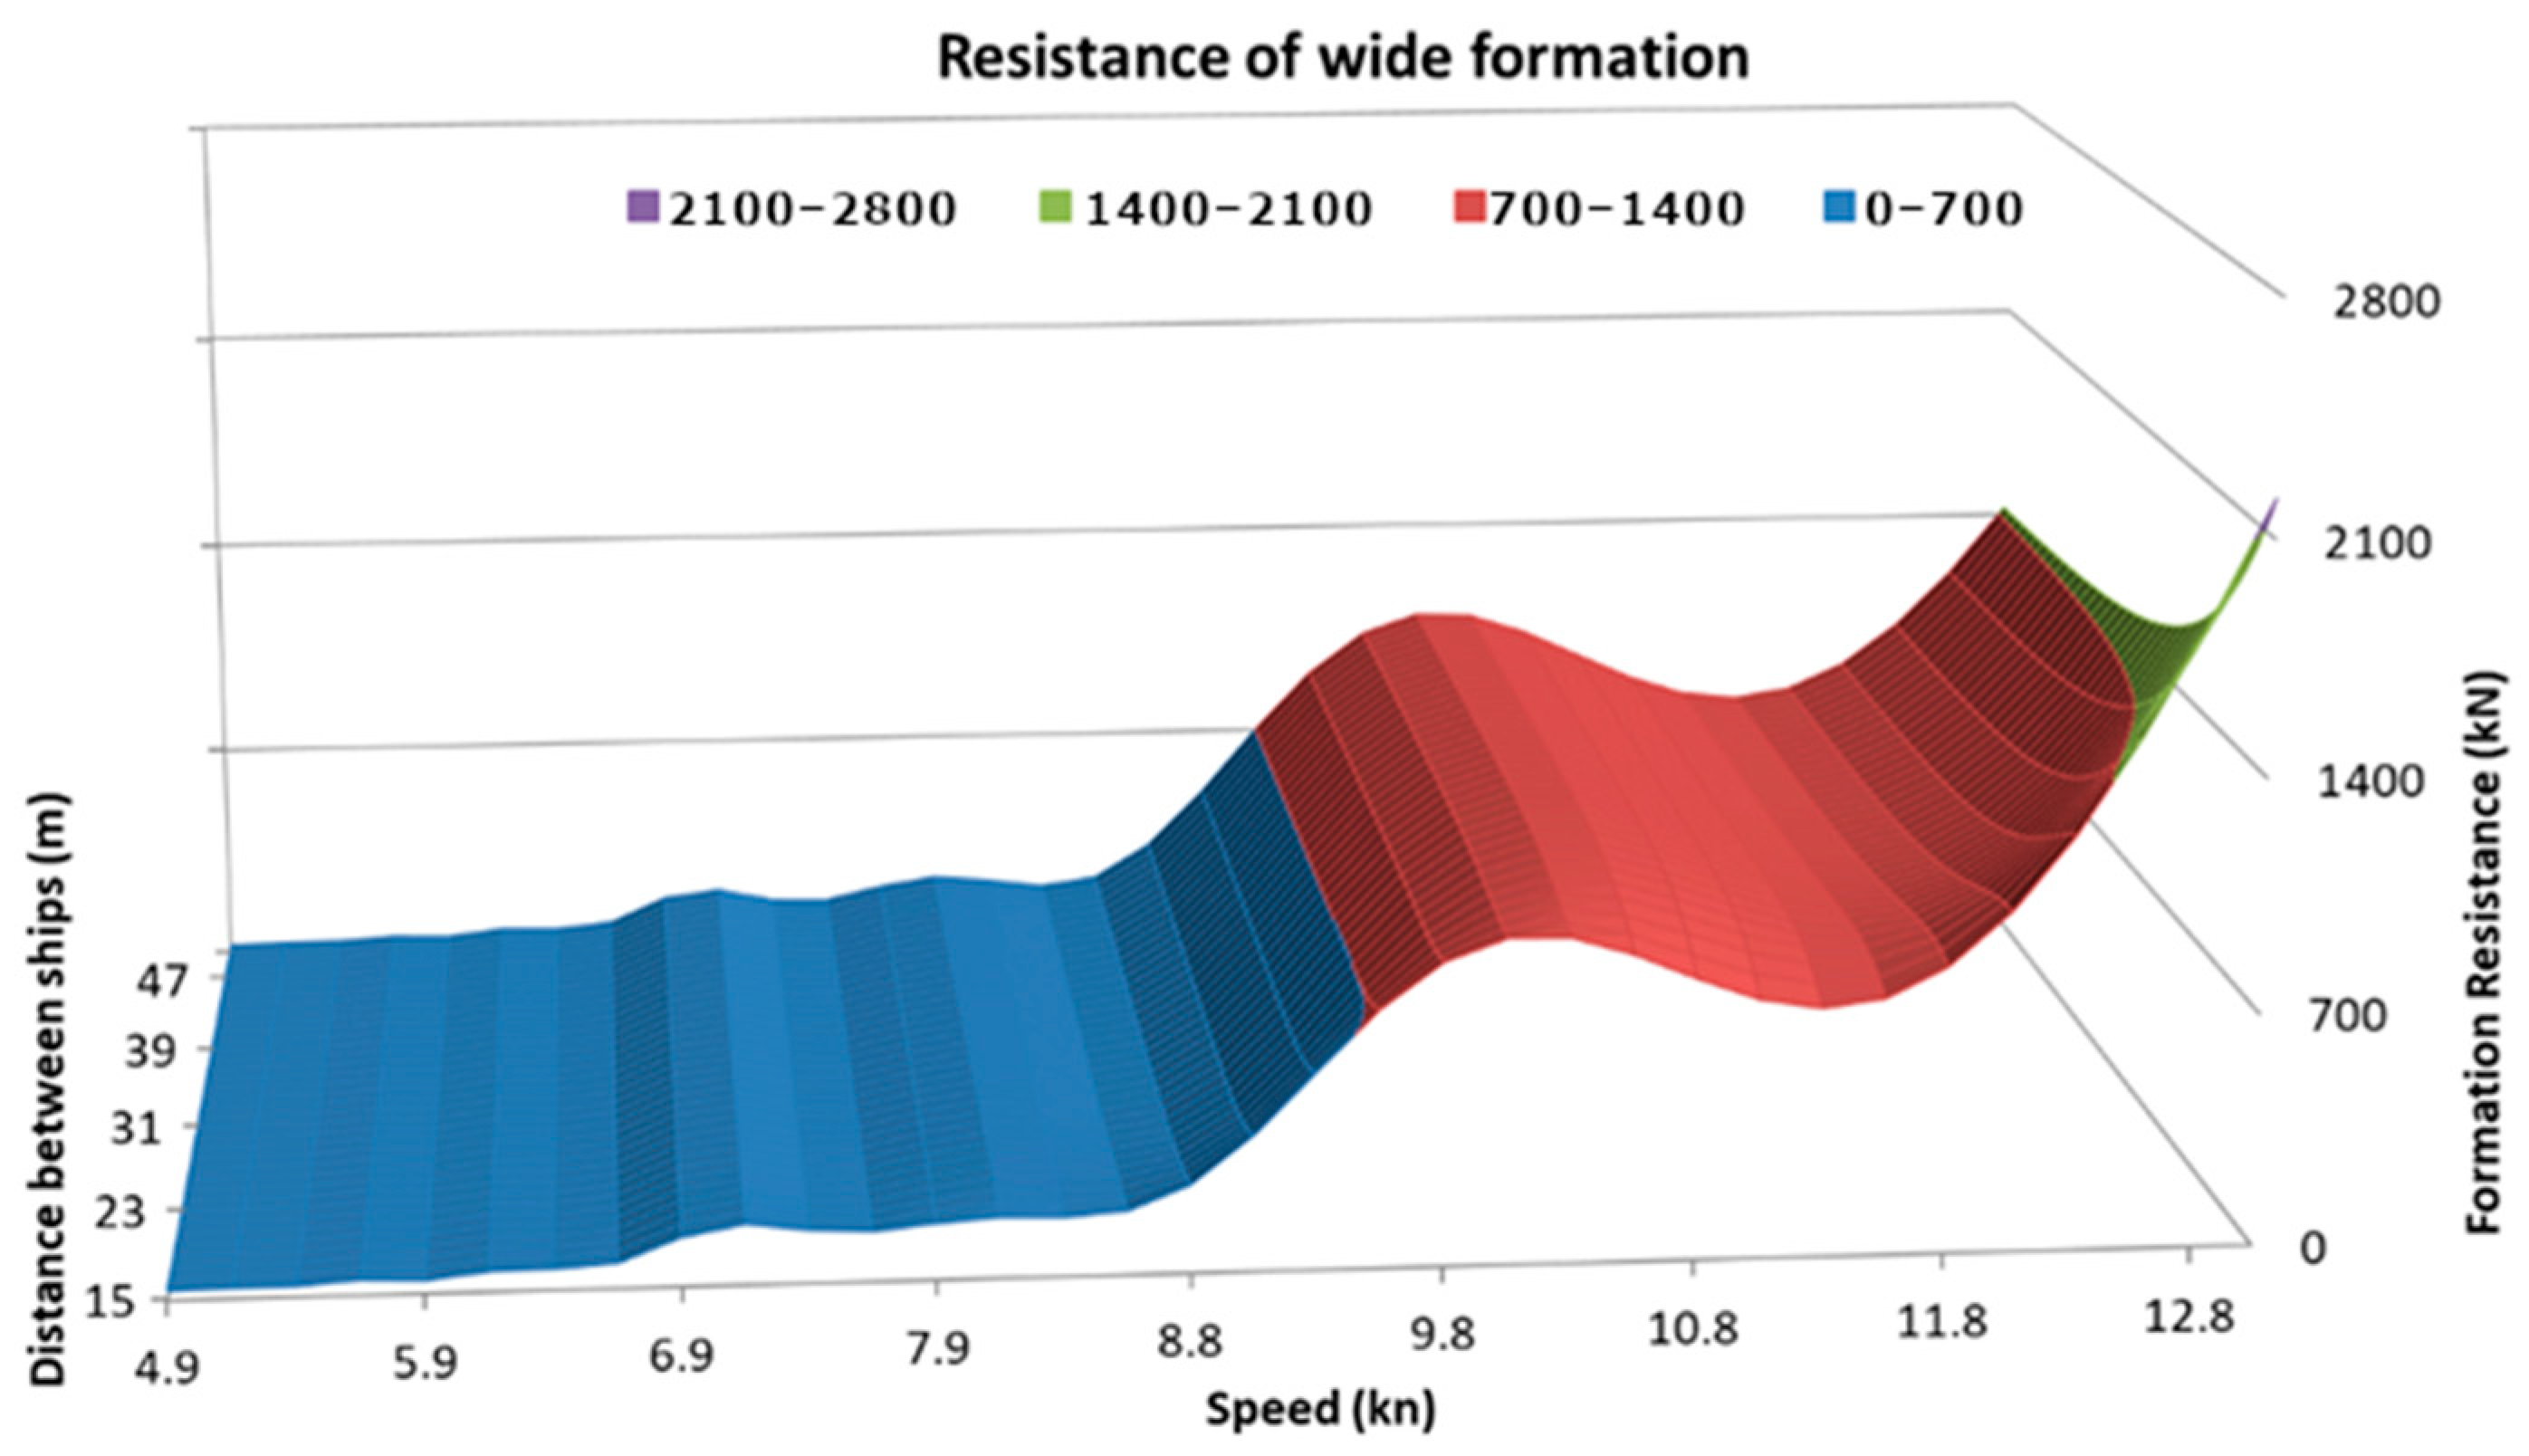
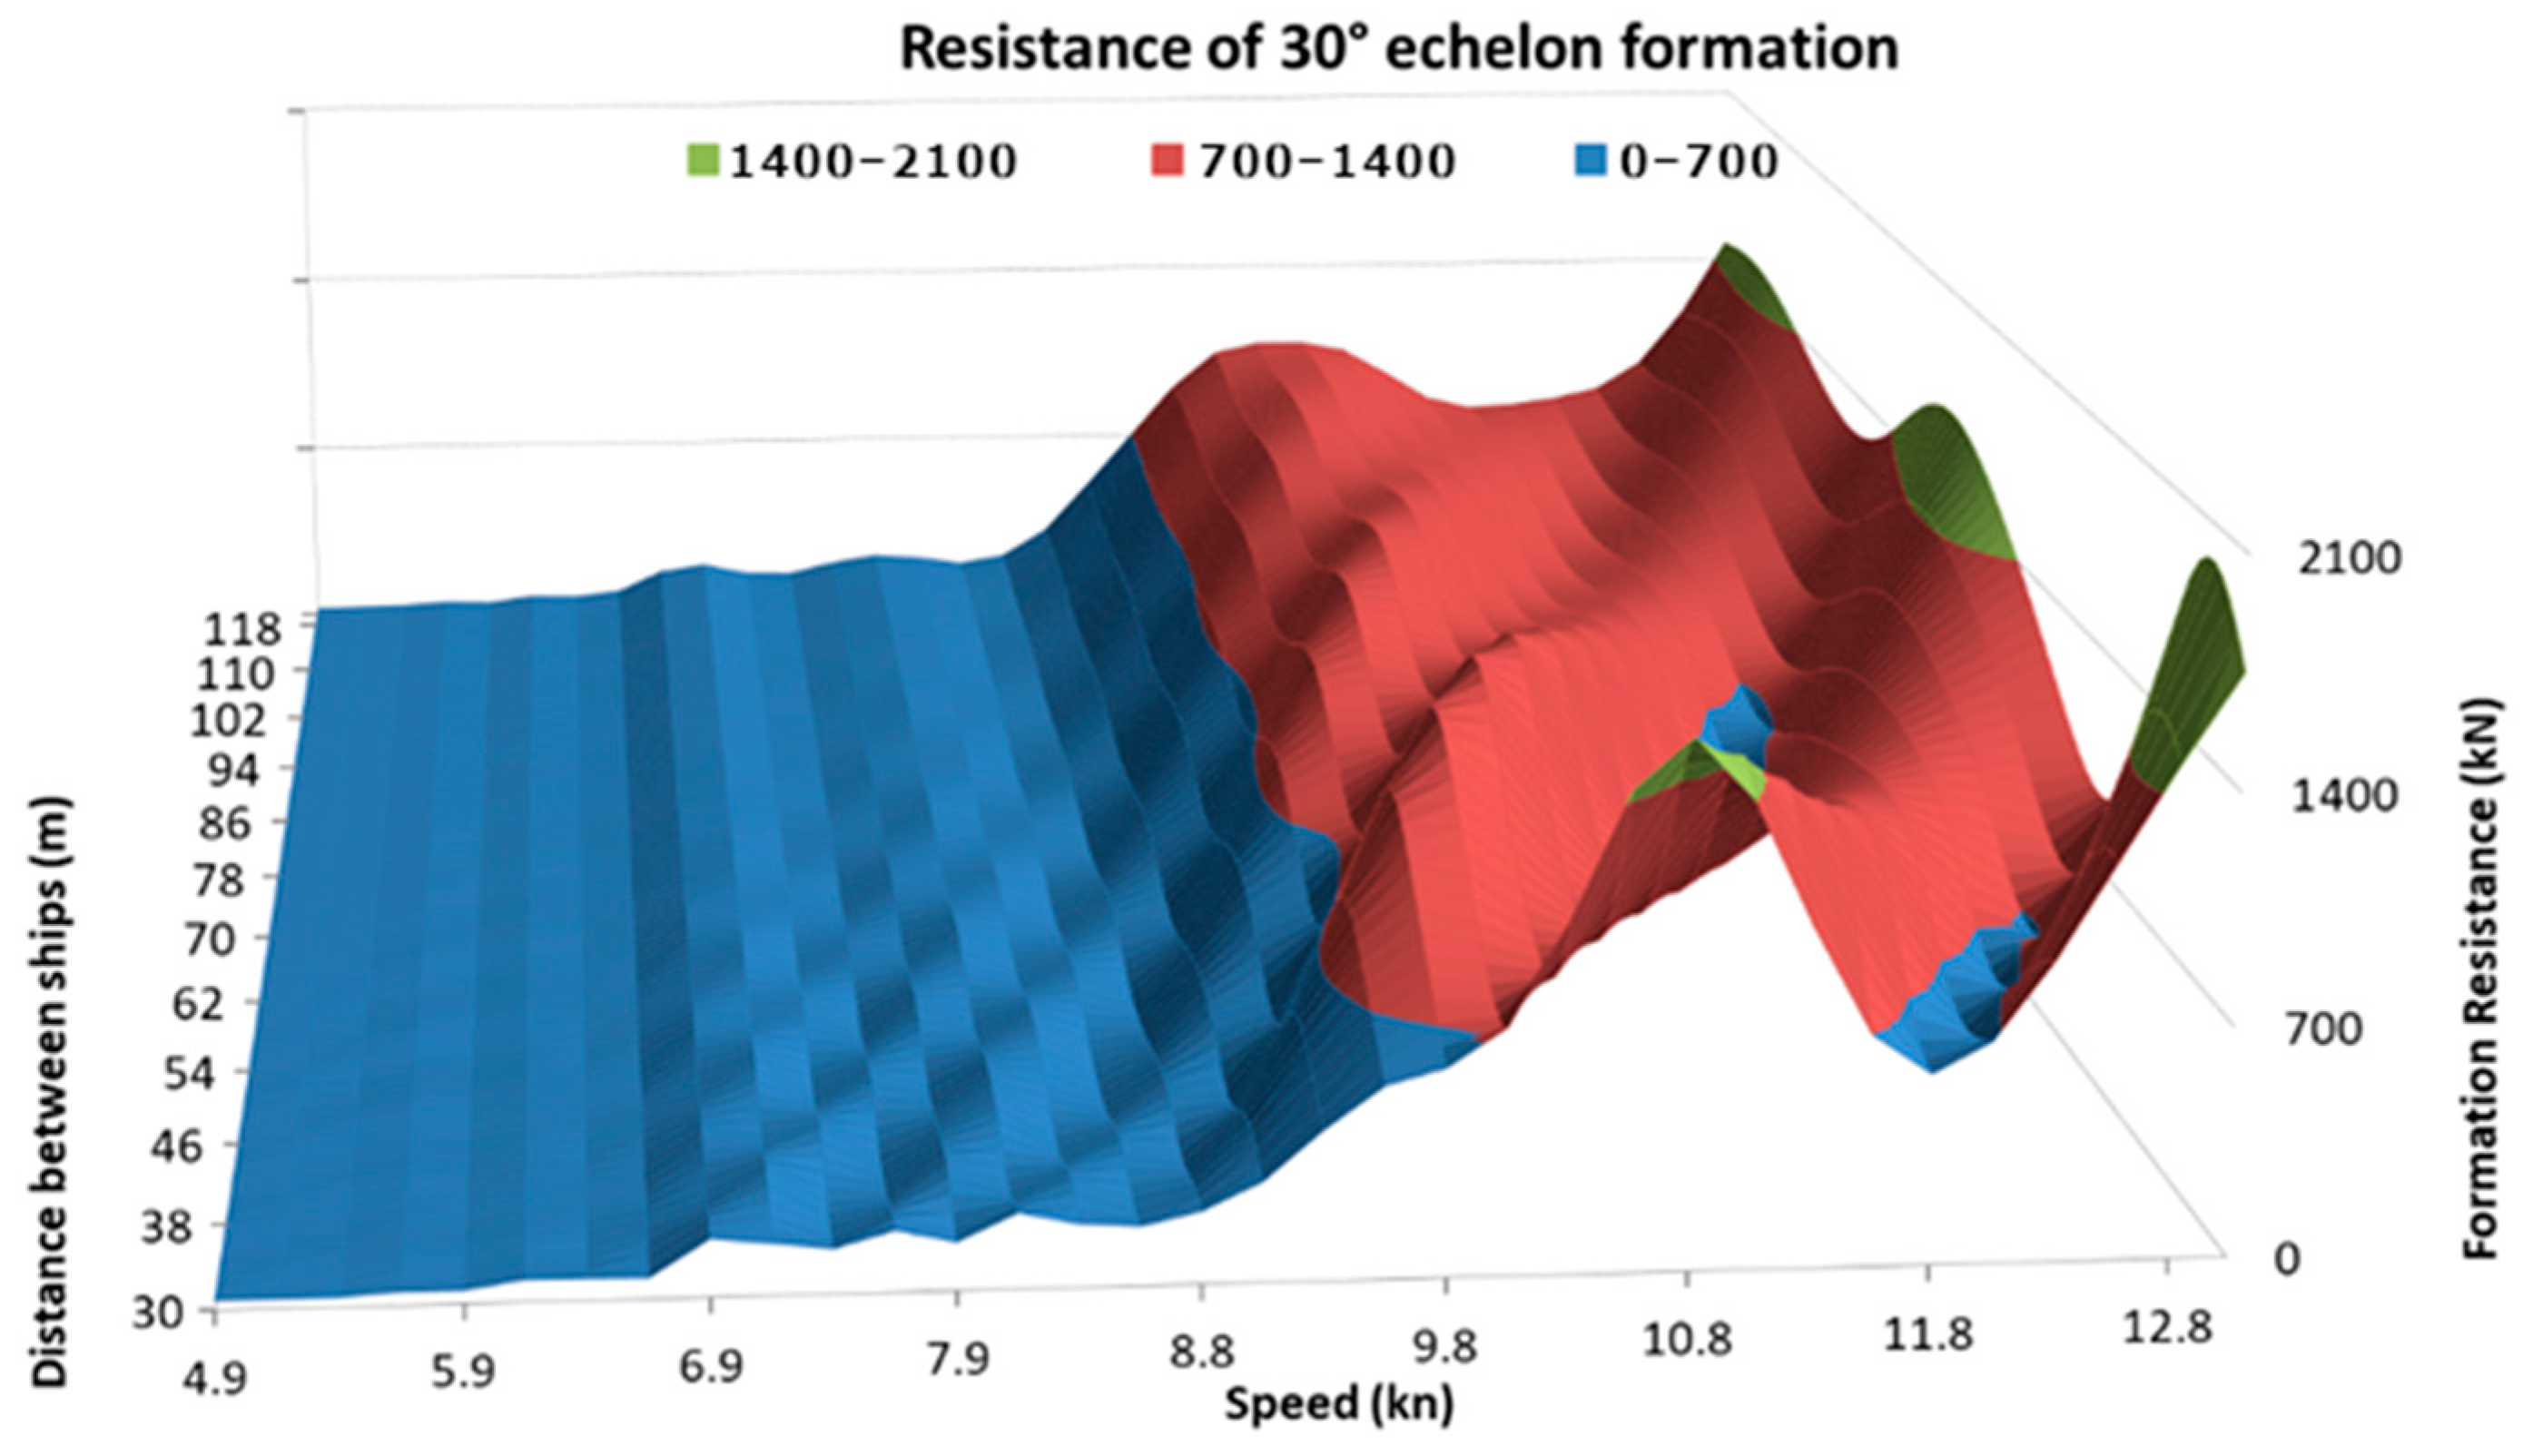
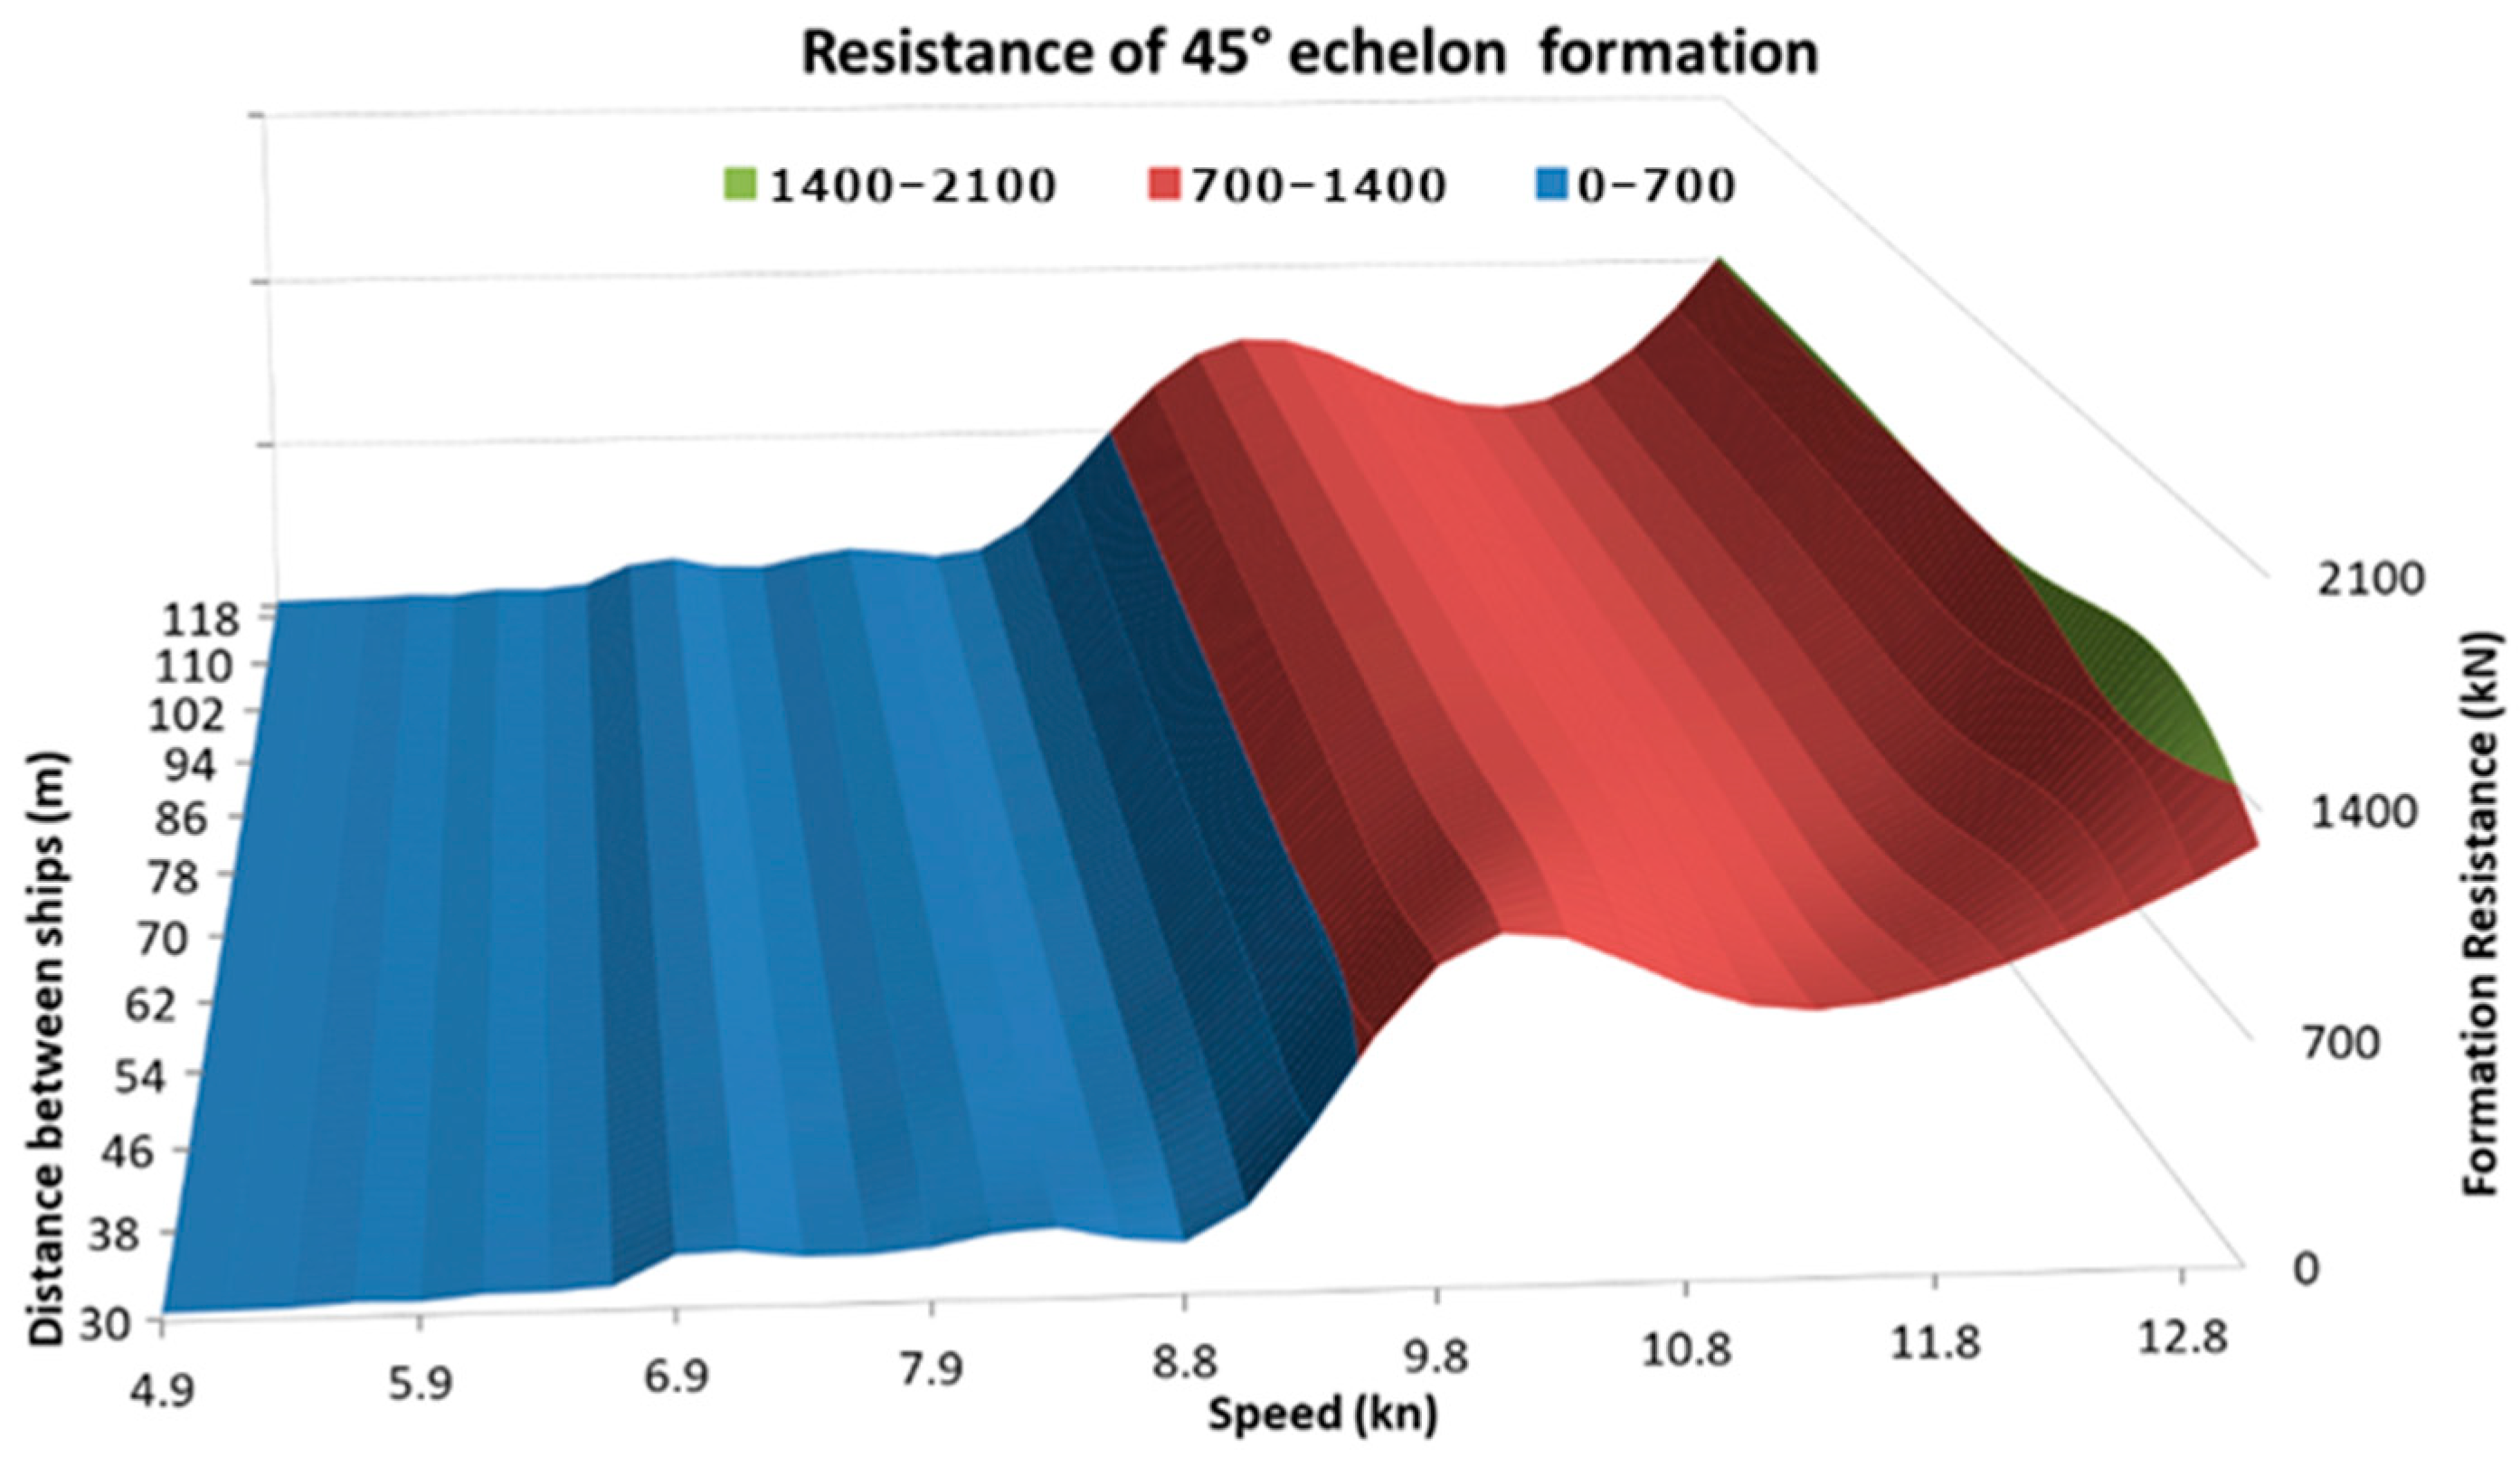
The graphs below show the surface obtained as a result of calculating the total value of resistances affecting the entire formation, for the speed ranges and the distance L as given in Table 3, with a step of 1 m.
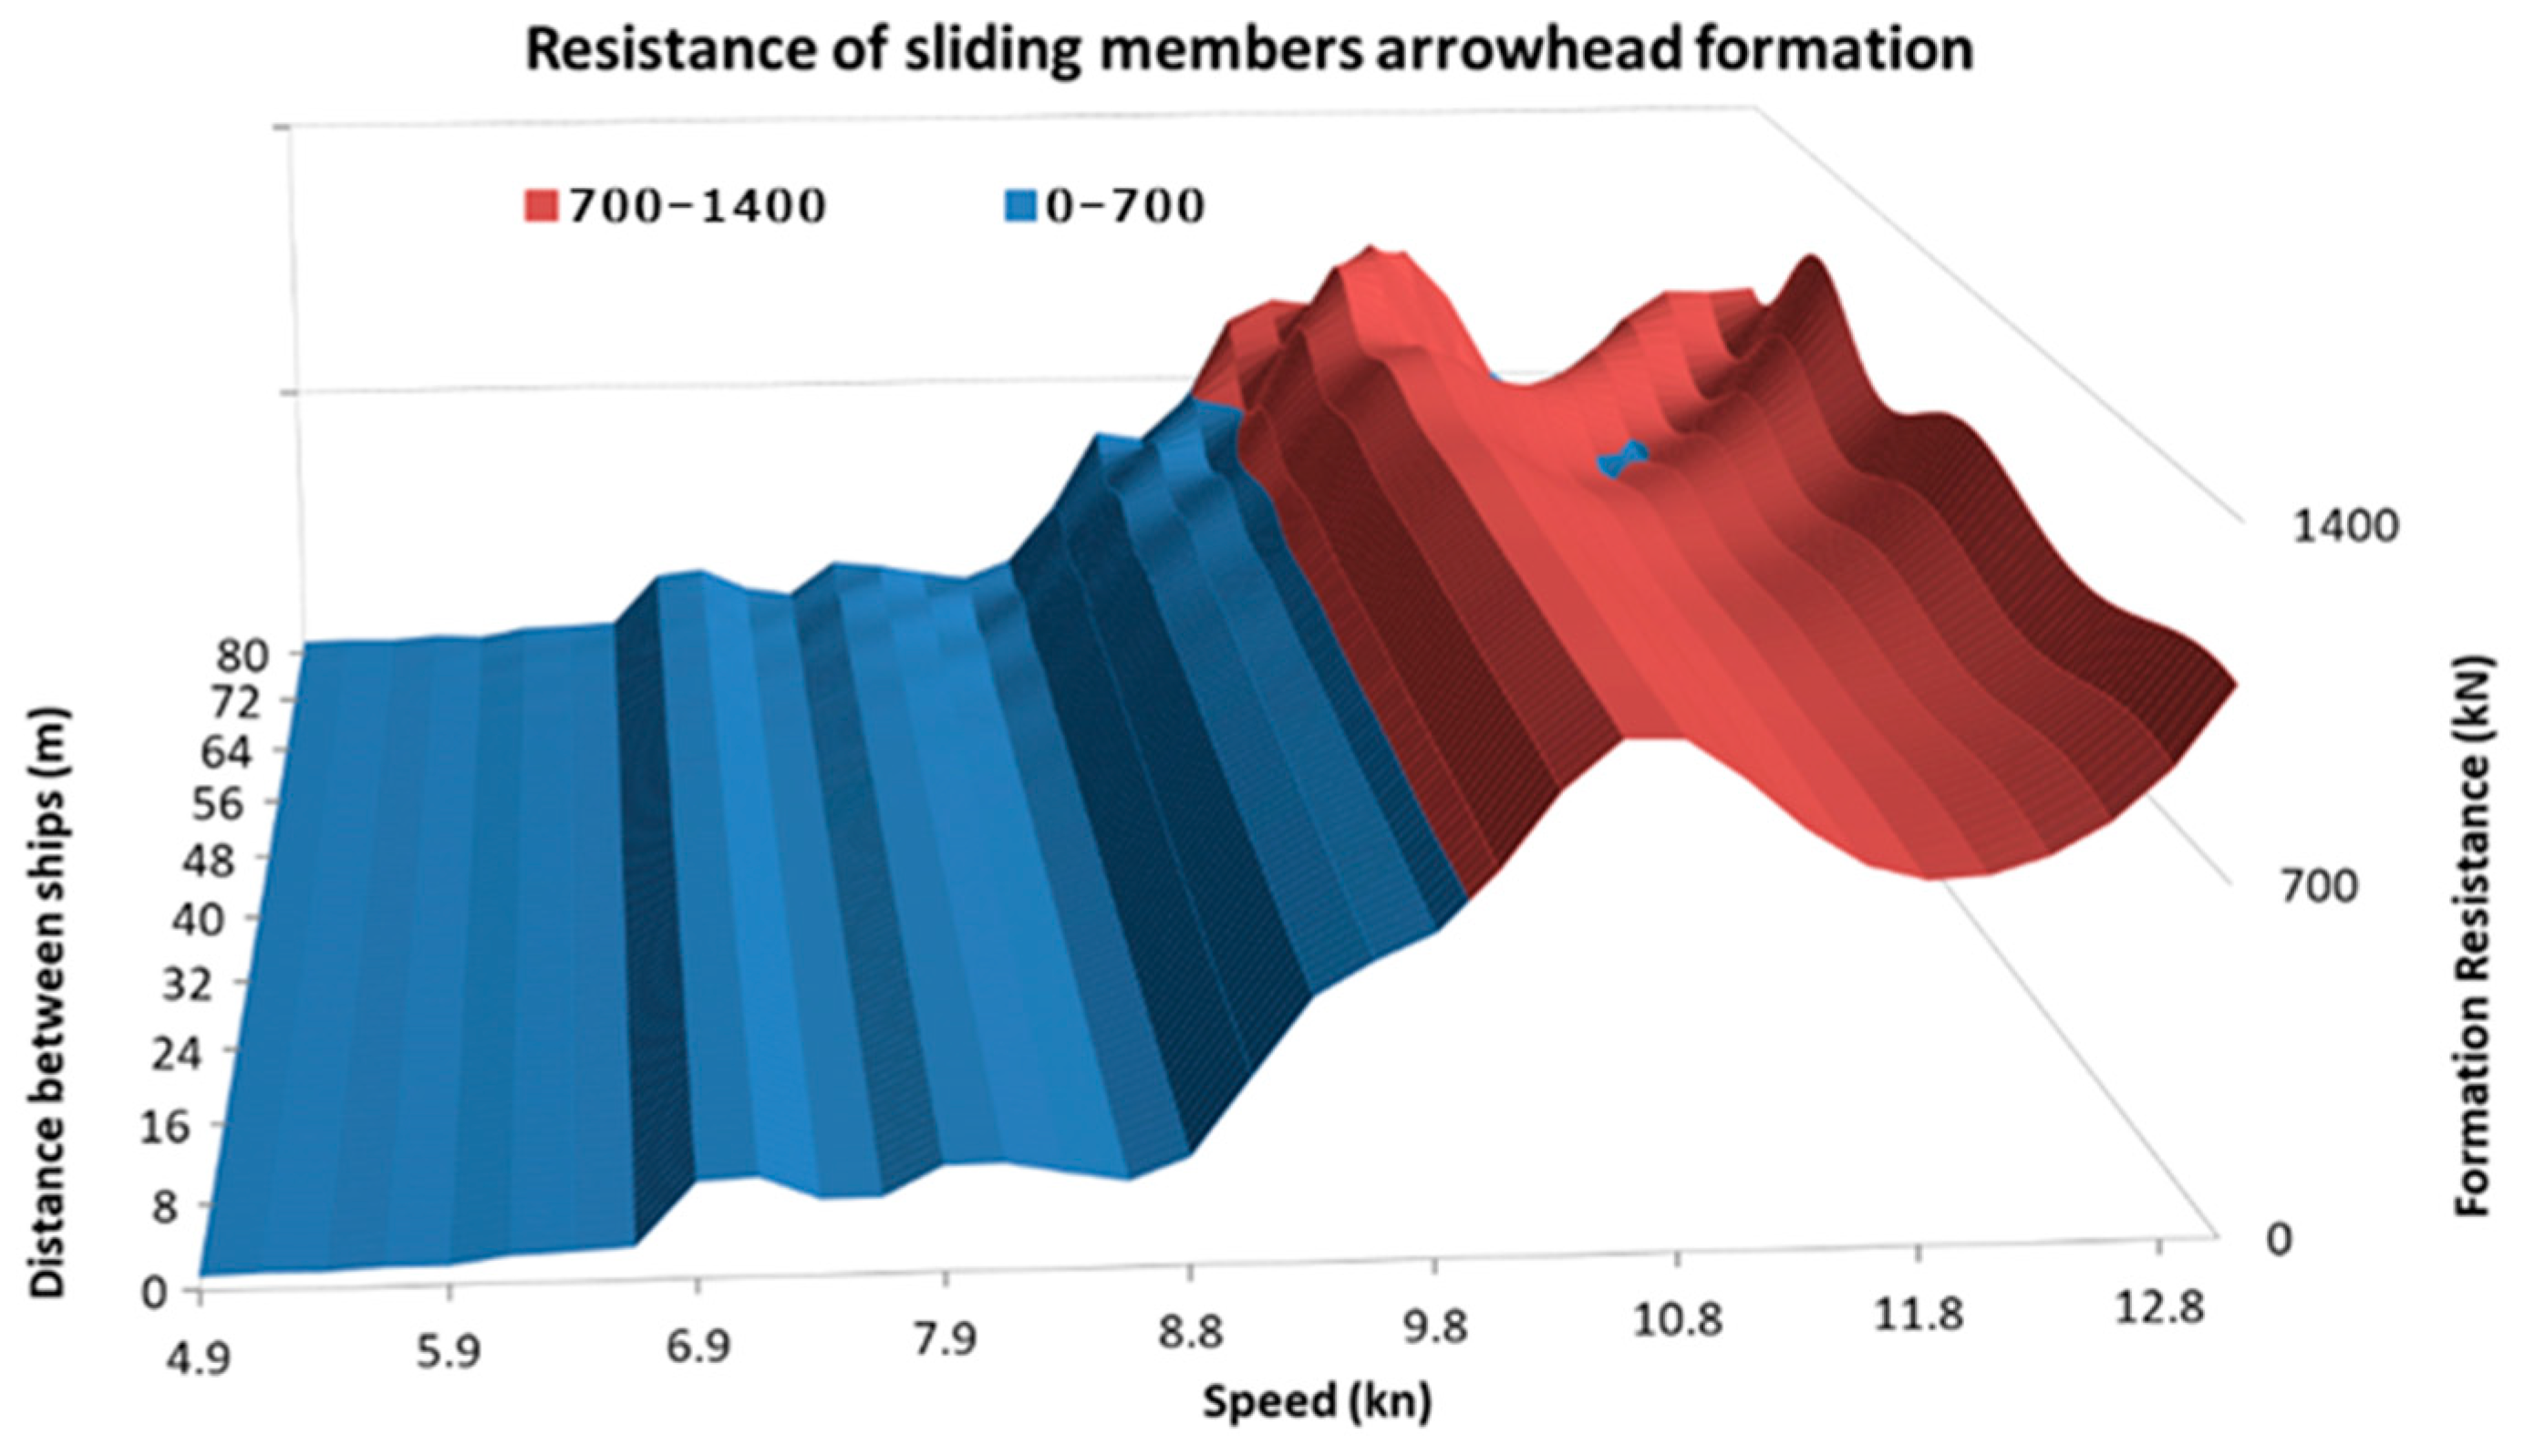
Figure 7, Figure 8, Figure 9, Figure 10, Figure 11, Figure 12, Figure 13 and Figure 14 show graphs showing the total movement resistance of a formation consisting of four tugboats, sailing in the following formation shapes: linear, wide, echelon, with the angles of 30°, 45° and 60°, as well as in a diamond-shaped formation, arrowhead, and sliding arrowhead formations.
In order to compare the performance of individual formation shapes, the R norm was introduced as the integral of the FTR drag function over the tested speed range v from 1 to 13 knots:
R = 1 13 F T R ( v ) d v
Then, the value of the norm R for a single tugboat was determined and adopted as R0. The quadruple of this value allows comparing the values of the R norm for different formations consisting of four tugboats, by determining the percentage RF index, determined for a given formation F and the function of the course of total resistances FTR:
R F = 1 13 F T R ( v ) d v 4 · R 0
Figure 15 shows a comparison of the total RF drag values for the studied formation shapes, with the drag values of four independent tugboats that are sailing at such a distance that they do not interfere with each other.
The graph shows that the wide formation, for all tested distances, has greater resistance than four independent tugboats, with the relative resistance decreasing asymptotically to 100% with increasing distance.
The greatest benefits seem to be presented by a linear formation, allowing the achieving of only 71.3% of resistance in relation to the resistance of four independent tugboats.
It is also possible to define the function FTmin(v), which describes, for a given formation shape, the smallest achievable drag force at a given velocity v. This function can be represented as:
F T m i n ( v ) = min L min     L     L max [ F T R ( L , v ) ]
Figure 16 shows the plot of the FTmin(v) function for the speed range of 1 to 13 knots. It shows that the linear formation allows significantly reducing the resistance of four tugboats, starting from a speed of approx. 5 knots, up to a maximum speed of 13 knots. Only in the speed range of 11 ÷ 11.5 knots does the 30° echelon formation give slightly lower total drag.
The values of the FTmin(v) function for all formations have been supplemented with a graph of the sum of drag forces acting on four tugboats sailing independently as a reference level.
The distance LM(v) is the distance between the ships of the formation that gives the formation the minimum resistance force FT at a given speed v.
L M ( v ) = min   [ F T R ( L M , v ) ]
Figure 17 shows the values of the LM(v) function for the tested speed range of 1 to 13 knots, for all studied formation shapes.
Figure 18 shows the course of the LM(v) function for a linear shape extracted from Figure 17. Due to the most favorable effect of reducing the total drag, in relation to the other formation shapes, this formation shape is the most promising in terms of potential reduction of energy consumption.

4.3. Tug Formation Resistance Simulation Tests

In order to verify the energy consumption of tugboats sailing independently and in formations of various shapes, a proprietary simulation environment was used—a network ship traffic simulator. This simulator allows to define a route consisting of waypoints, which is then followed by the tested ship. This tool also allows to simulate weather conditions, such as wind with variable strength and direction, as well as sea currents, also with variable strength and direction.
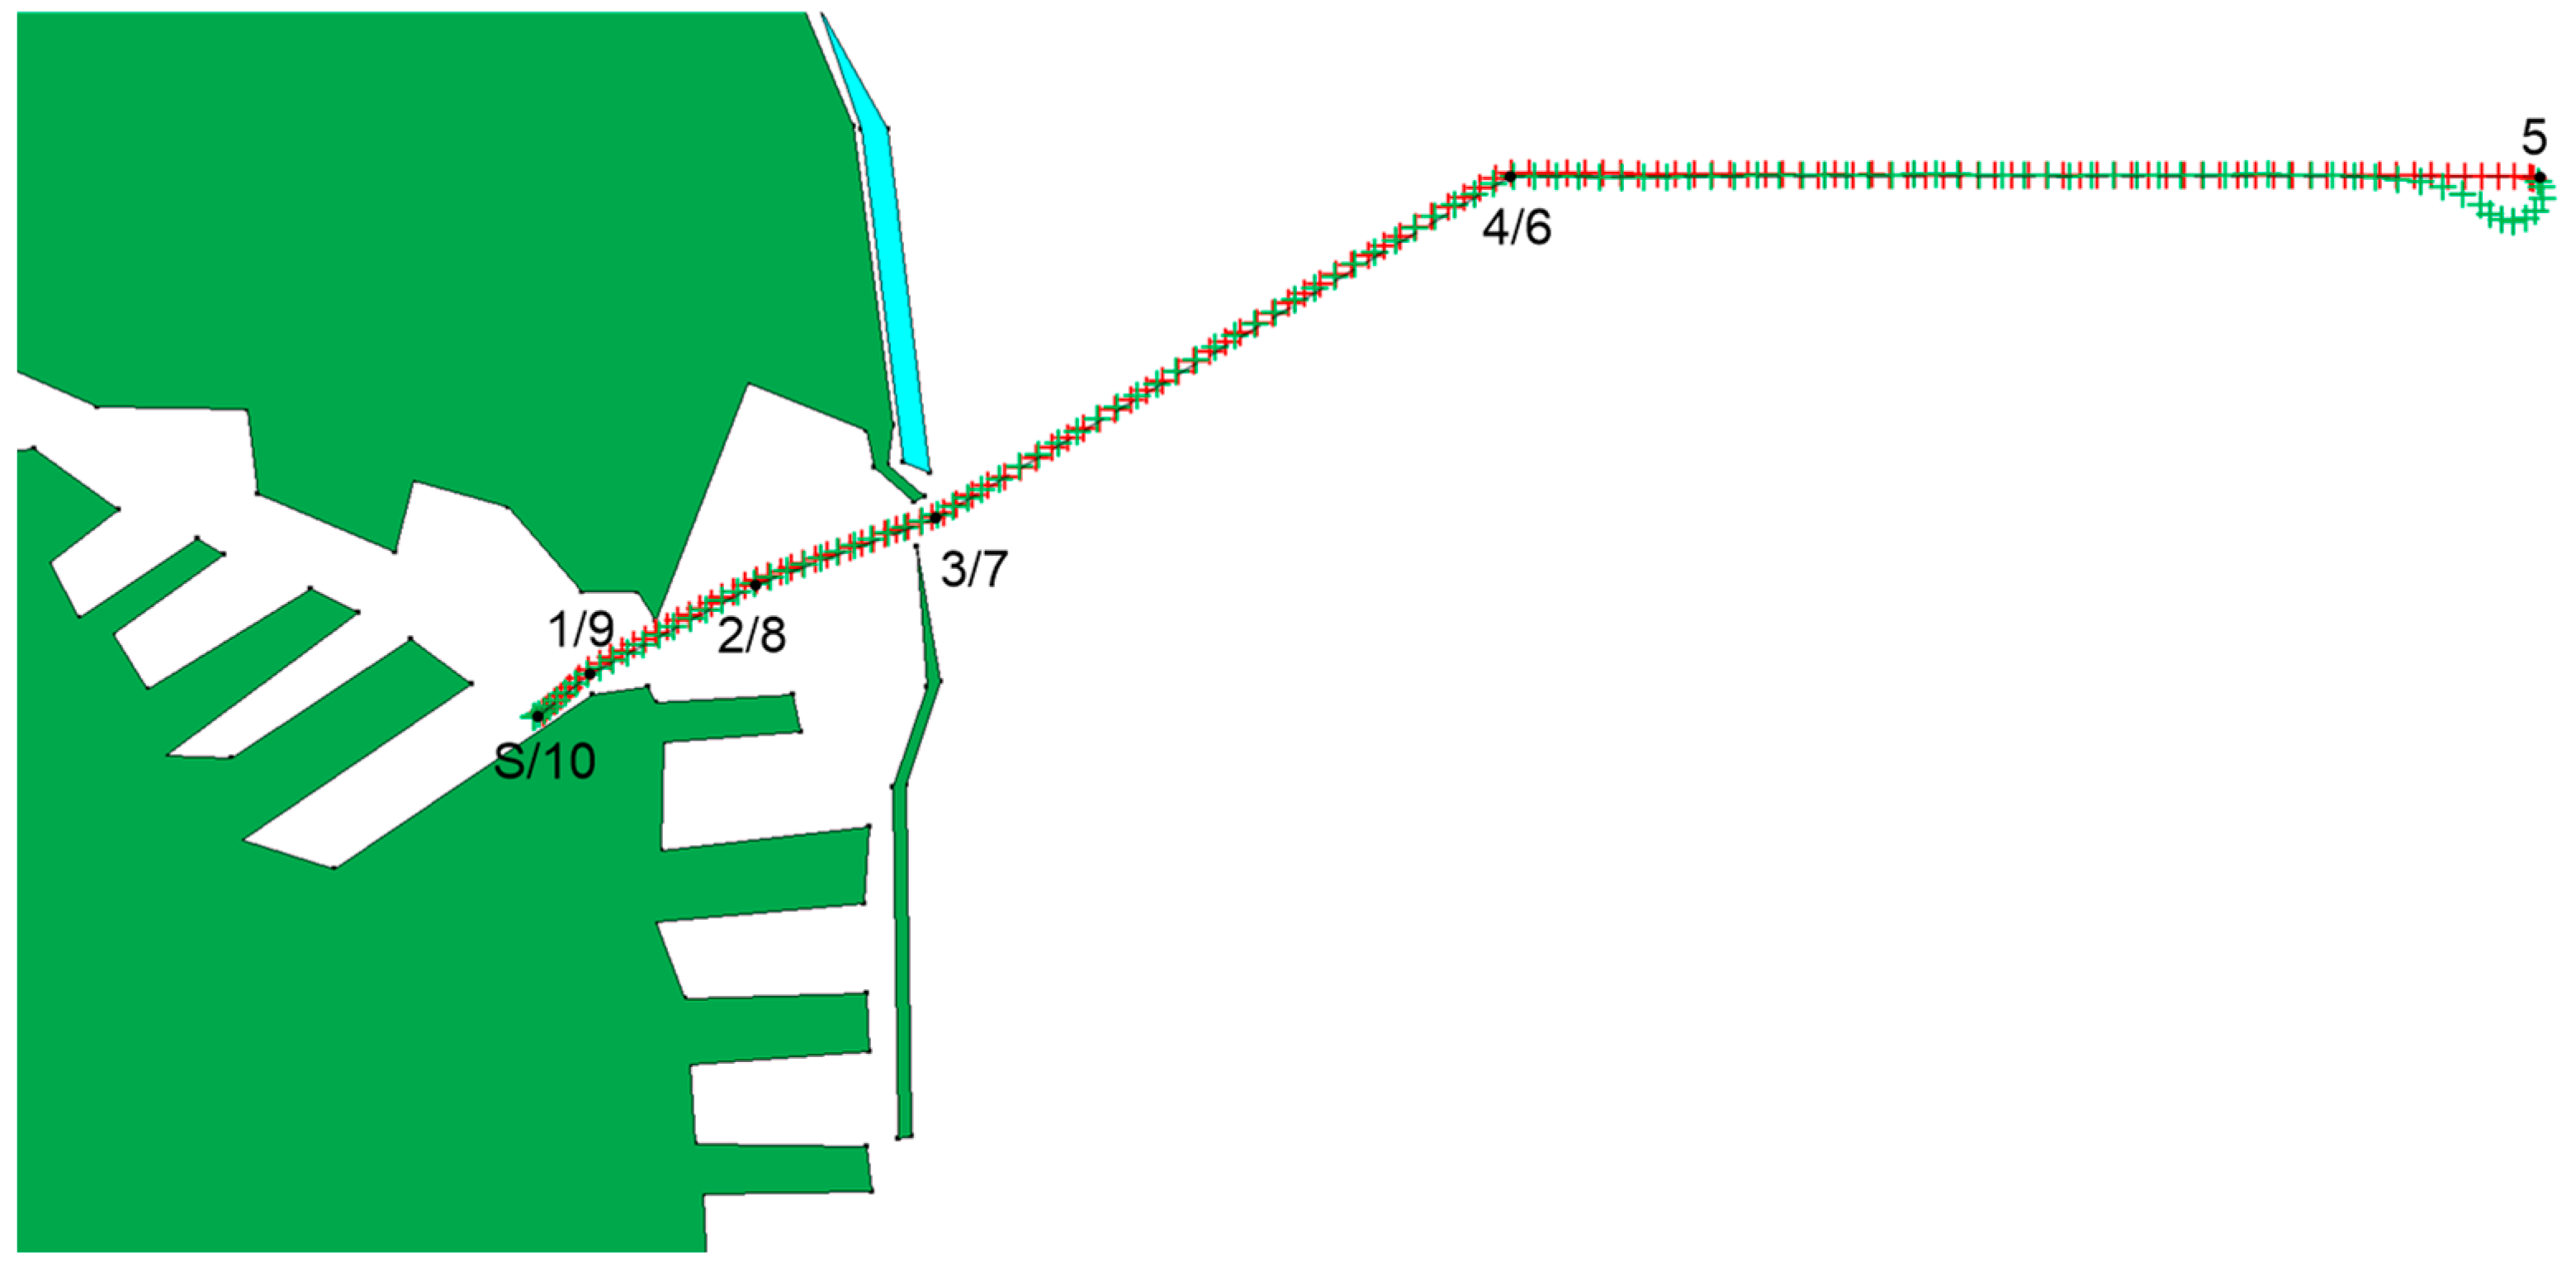
Figure 19 shows the route followed by the simulated tugboat. It consists of 10 waypoints, and after reaching waypoint 5, the tug makes a turn and returns along the same path. Therefore, some of the waypoints have the same coordinates. The preset route is shown with a dashed line, and the numbers shown correspond to the waypoint numbers. Figure 19 also shows position markers showing the trajectory of the simulated tugboat. The path shown in red represents tug movement from the starting position to waypoint 5, and in green from waypoint 5 to waypoint 10 (final position).
Due to the turning maneuver after passing waypoint 5, the actual distance traveled by the tug is 0.1 nm longer than the assumed one and amounts to 11.4 nm. The duration of the simulation was 3583 s. Table 4 shows the distances between successive waypoints and the total distance traveled by the tugboat.
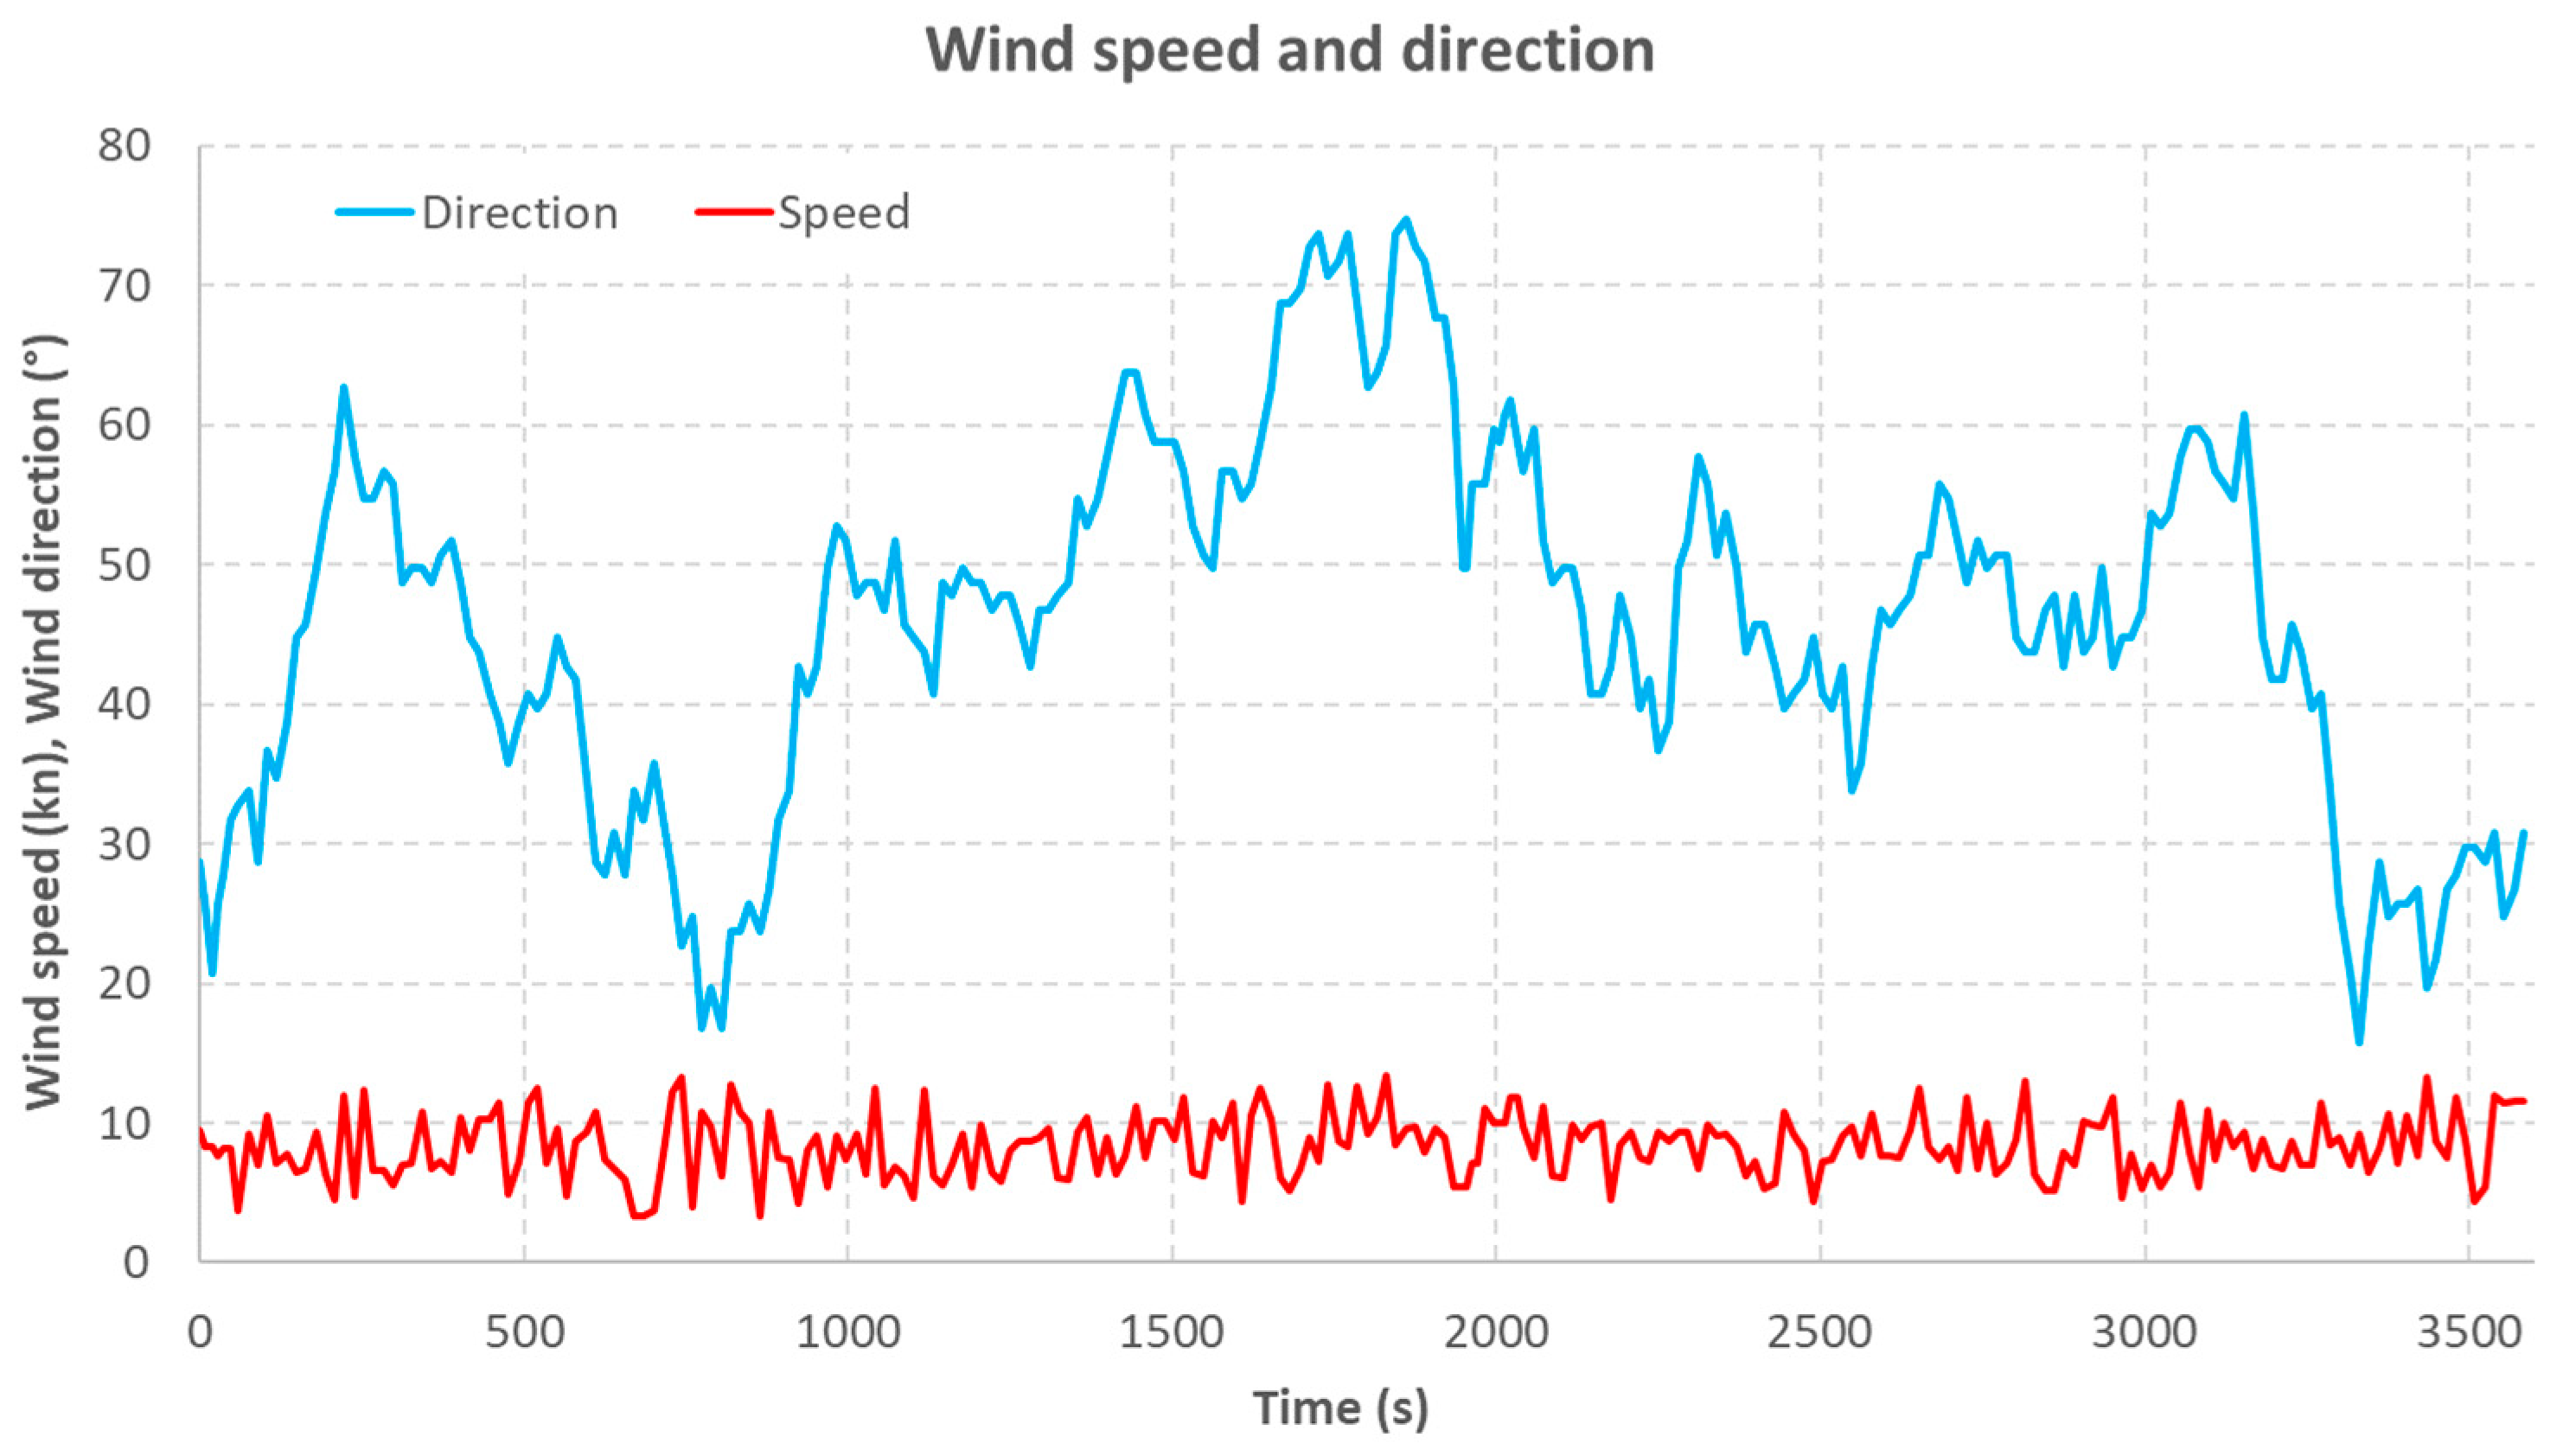
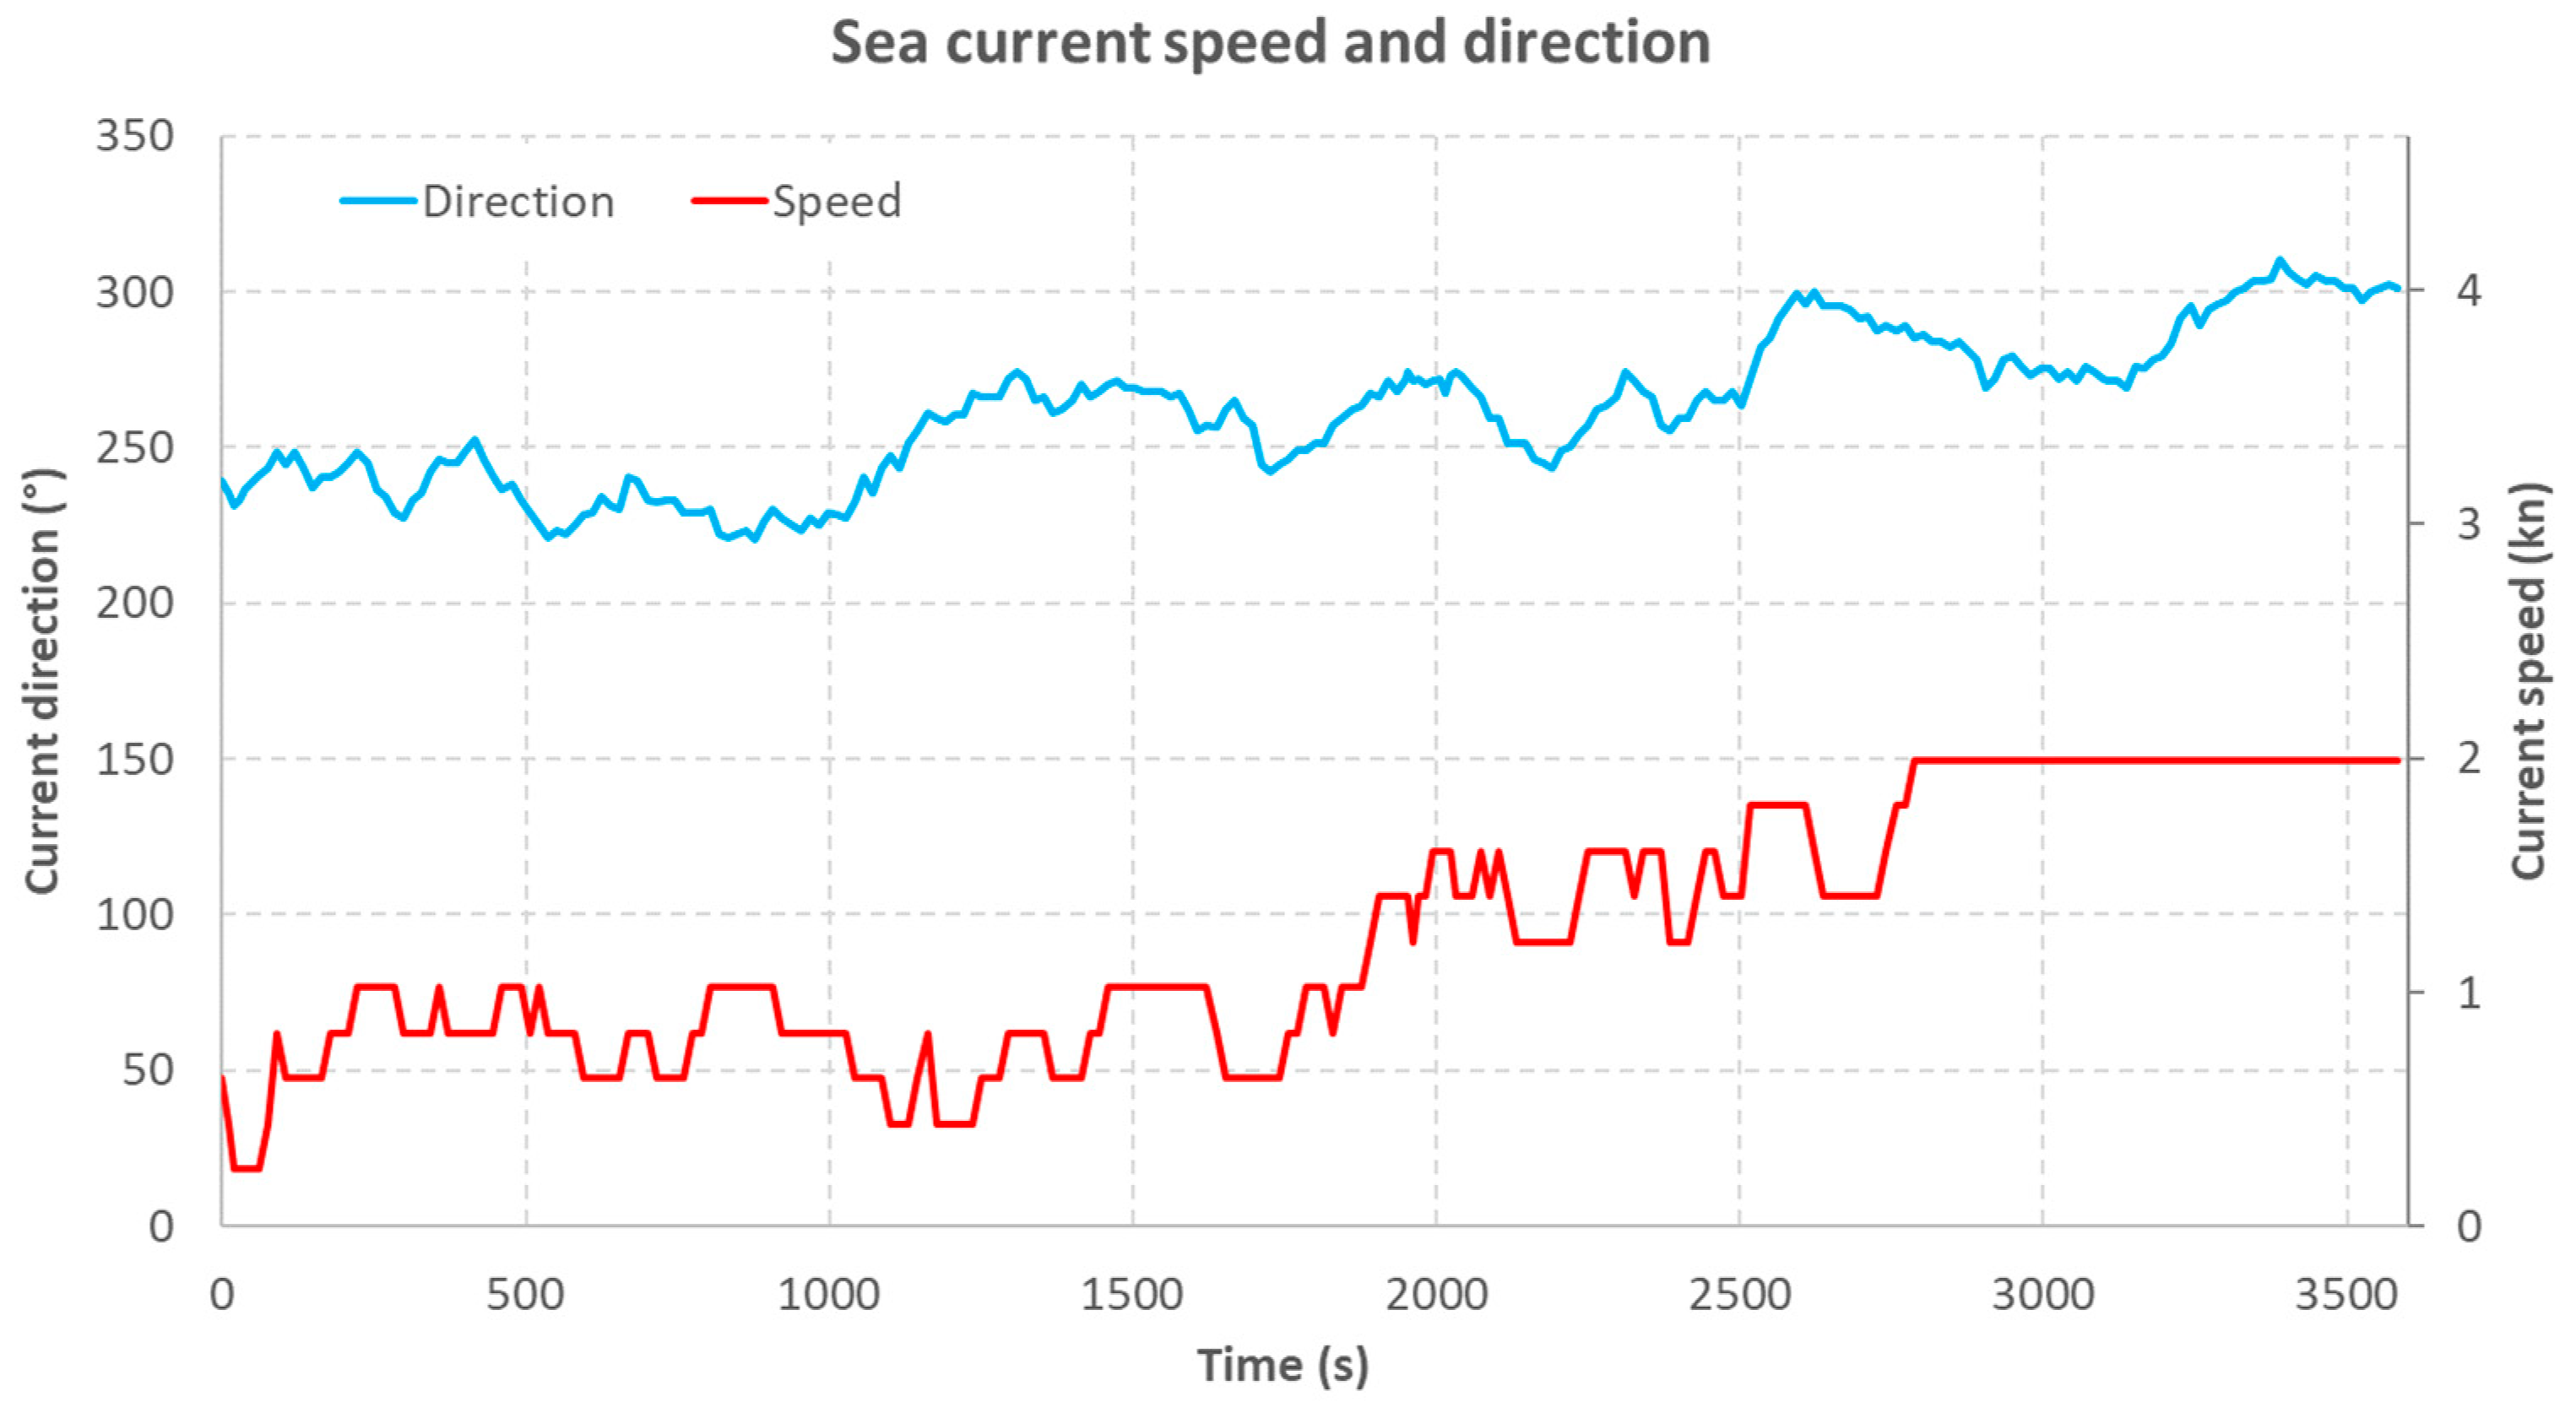
Figure 20 presents a graph of the speed of the tugboat relative to the water, obtained as a result of the simulation, and Figure 21 and Figure 22 show, respectively, the parameters of wind and sea currents acting on the tugboat during the simulated voyage.
As a result of the implementation of Equation (9) to the speed parameters of the tugboat obtained as a result of the simulation, data on the resistance to which the formation of four tugboats would be subjected was obtained. The obtained results are presented in Figure 23:
The analysis of the data obtained indicates that in connection with the presence of a strong westbound sea current, before reaching waypoint 5 the tug went upstream and then downstream. As a result, the segment related to leaving the port until reaching waypoint 5 (t = 1945 s) takes longer than the return route, despite the similar speed.
The analysis of the resistance data allowed the calculation of the energy consumption Ef by the analyzed formations, in accordance with the adopted equation:
E f = 0 t s F T R ( v ) · v · d t
where:
Ef—Ship formation energy consumption,
FTR(v)—Ship formation total resistance at speed v,
v—Ship formation speed,
tsTotal simulation time.
The share of fossil fuels in the production of electricity varies, depending on the sources used by the country and the CO2 emission equivalent; the value of 334 gCO2 eq/kWh (Europe) [41] was assumed for the calculations. The results of calculations of energy consumption and CO2 emissions for conventional diesel propulsion and electric propulsion by formations and consisting of four ships are presented in Table 5:

5. Conclusions

The results of the conducted research showed that the formation of a linear shape (Figure 6a), where the tugboats move one after the other, has a great potential to reduce energy consumption. In the presented example, for a linear formation, a reduction in energy consumption of 57.6% was obtained compared to four tugs sailing independently of each other. In second place in terms of consumption reduction is the echelon-shaped formation (Figure 6b) with a flare angle of 30°, with a result of 32.9%. The third-best formation is the arrowhead formation with sliding members (Figure 6e) with a result of 31.8%. The worst result is brought by the wide formation (Figure 6c), the use of which may result in an increase in energy consumption by 0.1% compared to independent tugboats. The 45° and 60° echelon formations, as well as the diamond-shaped formation and arrowhead formation, show a small reduction in energy consumption, on the order of between 5.8% to 24.5%.
In the case of using a zero-emission drive based on an electrochemical energy storage, such a large reduction in energy consumption will significantly increase the capabilities of the tugboats. Assuming that a certain constant part of the energy contained in the energy stores is intended for movement, the use of an agent system to control the movement of tugboats in a linear formation will increase the actual operating range. Studies have shown that the use of an electric drive in a tugboat can reduce CO2 emissions by 38% compared to a tugboat with a conventional drive.
Alternatively, by maintaining a constant operating range, the share of energy allocated to the movement of tugboats can be reduced, which will extend the time of their maneuvering or the option of powering the power system of the towed vessels.
Due to the length of the tugboats of approx. 32 m, for a linear formation of length L = 32 m, the stern of the preceding tug would touch the bow of the next tug. It would make it possible to establish flexible connections between the tugboats for the duration of the formation’s movement, which would guarantee the maintenance of a predetermined distance and would enable the sharing of energy resources via common power network. Unfortunately, the research results show that sailing in such close proximity to each other significantly increases the total resistance. The use of such links would be possible if they could have a variable length of between two and 10 m (according to the diagram in Figure 15).

Author Contributions

Conceptualization, W.K. and A.Ł.; methodology, W.K. and A.Ł.; software, W.K. and A.Ł.; validation, W.K. and A.Ł.; formal analysis, W.K. and A.Ł.; investigation, W.K. and A.Ł.; resources, W.K. and A.Ł.; data curation, W.K. and A.Ł.; writing—original draft preparation, W.K. and A.Ł.; writing—review and editing, W.K. and A.Ł.; visualization, W.K. and A.Ł.; supervision, A.Ł.; project administration, A.Ł.; funding acquisition, A.Ł. All authors have read and agreed to the published version of the manuscript.

Funding

The project is financed within the program of the Ministry of Science and Higher Education called “Regionalna Inicjatywa Doskonałości” in the years 2019–2023, under project number 006/RID/2018/19, with a sum of financing of 11 870 000 PLN.

Conflicts of Interest

The authors declare no conflict of interest.

References

  1. Robert Allan Ltd. Revolutionary RAMORA Brings Tele-Operated Capability to Ship Handling. Available online: https://ral.ca/2015/09/18/revolutionary-ramora-brings-tele-operated-capability-to-ship-handling/ (accessed on 26 November 2020).
  2. Ed Garsten. Autonomous Tug Finds Its Way Home. Available online: https://www.forbes.com/sites/edgarsten/2021/10/20/autonomous-tug-odyssey-completed/?sh=108e5c506c49 (accessed on 10 October 2022).
  3. Miller, A.; Rybczak, M.; Rak, A. Towards the Autonomy: Control Systems for the Ship in Confined and Open Waters. Sensors 2021, 21, 2286. [Google Scholar] [CrossRef] [PubMed]
  4. Mohamed-Seghir, M.; Kula, K.; Kouzou, A. Artificial Intelligence-Based Methods for Decision Support to Avoid Collisions at Sea. Electronics 2021, 10, 2360. [Google Scholar] [CrossRef]
  5. Navtek Naval Technologies. World’s First All-Electric Tugboat Delivered, Three More on the Way. Available online: https://www.maritime-executive.com/features/world-s-first-all-electric-tugboat-delivered-three-more-on-the-way-1 (accessed on 8 December 2020).
  6. Damen. Damen’s First All-Electric Tug Sparky Delivered to Ports of Auckland. Available online: https://www.damen.com/insights-center/news/damen-s-first-all-electric-tug-sparky-delivered-to-ports-of-auckland (accessed on 10 October 2022).
  7. IMO. Energy Efficiency Measures. Available online: https://www.imo.org/en/OurWork/Environment/Pages/Technical-and-Operational-Measures.aspx (accessed on 16 November 2022).
  8. Stanković, R.; Štula, M.; Maras, J. Evaluating fault tolerance approaches in multi-agent systems. Auton Agent Multi-Agent Syst. 2017, 31, 151–177. [Google Scholar] [CrossRef]
  9. Schiaretti, M.; Chen, L.; Negenborn, R.R. Survey on Autonomous Surface Vessels: Part I—A New Detailed Definition of Autonomy Levels. In Proceedings of the 8th International Conference, ICCL, Southampton, UK, 18–20 October 2017; Volume 10572, pp. 219–233. [Google Scholar] [CrossRef]
  10. Schiaretti, M.; Chen, L.; Negenborn, R.R. Survey on Autonomous Surface Vessels: Part II—Categorization of 60 Prototypes and Future Applications. In Proceedings of the Computational Logistics, 8th International Conference, ICCL 2017, Southampton, UK, 18–20 October 2017; pp. 245–263. [Google Scholar] [CrossRef]
  11. Devaraju, A.; Chen, L.; Negenborn, R.R. Autonomous Surface Vessels in Ports: Applications, Technologies and Port Infrastructures. Comput. Logist. 2018, 11184, 86–105. [Google Scholar] [CrossRef]
  12. The Engineer. Rolls-Royce and Svitzer Demonstrate World’s First Remotely Operated Commercial Vessel. Available online: https://www.theengineer.co.uk/rolls-royce-and-svitzer-demonstrate-worlds-first-remotely-operated-commercial-vessel/ (accessed on 16 November 2022).
  13. van Tran, L.; Im, N. A study on ship automatic berthing with assistance of auxiliary devices. Int. J. Nav. Archit. Ocean. Eng. 2012, 4, 199–210. [Google Scholar] [CrossRef] [Green Version]
  14. van Bui, P.; Kawai, H.; Kim, Y.B.; Lee, K.S. A ship berthing system design with four tug boats. J. Mech. Sci. Technol. 2011, 25, 1257–1264. [Google Scholar] [CrossRef]
  15. Esposito, J.; Feemster, M.; Smith, E. Cooperative manipulation on the water using a swarm of autonomous tugboats. In Proceedings of the 2008 IEEE International Conference on Robotics and Automation, Pasadena, CA, USA, 19–23 May 2008; pp. 1501–1506. [Google Scholar] [CrossRef]
  16. Sartoretti, G.; Shaw, S.; Hsieh, M.A. Distributed planar manipulation in fluidic environments. In Proceedings of the 2016 IEEE International Conference on Robotics and Automation (ICRA), Stockholm, Sweden, 16–21 May 2016; pp. 5322–5327. [Google Scholar] [CrossRef]
  17. van Bui, P.; Ji, S.W.; Jang, J.S.; Kim, Y.B. Ship Trajectory Tracking in Harbour Area by Using Autonomous Tugboats. IFAC Proc. Vol. 2012, 45, 740–745. [Google Scholar] [CrossRef]
  18. Abramowicz-Gerigk, T.; Burciu, Z. Application of Ship Motion Simulation in Reliability Assessment of Ship Entrance into the Port. TransNav 2016, 10, 613–617. [Google Scholar] [CrossRef]
  19. Przybyłowski, A.; Kałaska, A.; Przybyłowski, P. Quest for a Tool Measuring Urban Quality of Life: ISO 37120 Standard Sustainable Development Indicators. Energies 2022, 15, 2841. [Google Scholar] [CrossRef]
  20. Braganza, D.; Feemster, M.; Dawson, D. Positioning of Large Surface Vessels using Multiple Tugboats. In Proceedings of the 2007 American Control Conference, New York, NY, USA, 9–13 July 2007; pp. 912–917. [Google Scholar] [CrossRef]
  21. Vojković, G.; Milenković, M. Autonomous ships and legal authorities of the ship master. Case Stud. Transp. Policy 2020, 8, 333–340. [Google Scholar] [CrossRef]
  22. Jin, Q.; Wu, G.; Boriboonsomsin, K.; Barth, M. Platoon-based multi-agent intersection management for connected vehicle. In Proceedings of the 16th International IEEE Conference on Intelligent Transportation Systems (ITSC 2013), The Hague, The Netherlands, 6–9 October 2013; pp. 1462–1467. [Google Scholar] [CrossRef]
  23. Czech, P.; Turoń, K.; Barcik, J. Autonomous vehicles: Basic issues. SJSUT.ST 2018, 100, 15–22. [Google Scholar] [CrossRef]
  24. He, Y.; Mou, J.; Chen, L.; Zeng, Q.; Huang, Y.; Chen, P.; Zhang, S. Will sailing in formation reduce energy consumption? Numerical prediction of resistance for ships in different formation configurations. Appl. Energy 2022, 312, 118695. [Google Scholar] [CrossRef]
  25. Dong, Z.; Liang, X.; Guan, X.; Li, W. Formation optimization of various spacing configurations for a fleet of unmanned surface vehicles based on a hydrodynamic energy-saving strategy. Ocean. Eng. 2022, 266, 112824. [Google Scholar] [CrossRef]
  26. Abramowicz-Gerigk, T.; Burciu, Z.; Hapke, L. Innovative Project of Propellers and Thrusters Jet Loads during Ship Berthing Monitoring System. TransNav 2019, 13, 861–865. [Google Scholar] [CrossRef]
  27. Iwaszkiewicz, J.; Muc, A.; Bielecka, A. Polar Voltage Space Vectors of the Six-Phase Two-Level VSI. Energies 2022, 15, 2763. [Google Scholar] [CrossRef]
  28. Iwaszkiewicz, J. Sterowanie dwupoziomowego pięciofazowego falownika napięcia przy obciążeniu połączonym w gwiazdę. Electrotech. Rev. 2022, 1, 127–130. [Google Scholar] [CrossRef]
  29. Nuchturee, C.; Li, T.; Xia, H. Energy efficiency of integrated electric propulsion for ships – A review. Renew. Sustain. Energy Rev. 2020, 134, 110145. [Google Scholar] [CrossRef]
  30. Shiraishi, K.; Minami, S.; Kobayashi, K.; Kodera, M. Development of A Hybrid Tugboat Propulsion System. MTZ Ind 2013, 3, 36–43. [Google Scholar] [CrossRef]
  31. Zali, M.A.; Ahmad, W.K.W.; Retnam, A.; Catrina, N. Concentration of Heavy Metals in Virgin, Used, Recovered and Waste Oil: A Spectroscopic Study. Procedia Environ. Sci. 2015, 30, 201–204. [Google Scholar] [CrossRef] [Green Version]
  32. Baszanowska, E.; Otremba, Z. Spectral signatures of fluorescence and light absorption to identify crude oils found in the marine environment. JEOS:RP 2014, 9. [Google Scholar] [CrossRef] [Green Version]
  33. European Parliament. Directive 2005/33/EC Regarding the Sulphur Content of Marine Fuels. Available online: https://eur-lex.europa.eu/LexUriServ/LexUriServ.do?uri=OJ:L:2005:191:0059:0069:EN:PDF (accessed on 16 November 2022).
  34. European Comission. COMMISSION RECOMMENDATION on the Promotion of Shore-Side Electricity for Use by Ships at Berth in Community Ports. Available online: https://eur-lex.europa.eu/LexUriServ/LexUriServ.do?uri=OJ:L:2006:125:0038:0042:EN:PDF (accessed on 16 November 2022).
  35. Zubi, G.; Dufo-López, R.; Carvalho, M.; Pasaoglu, G. The lithium-ion battery: State of the art and future perspectives. Renew. Sustain. Energy Rev. 2018, 89, 292–308. [Google Scholar] [CrossRef]
  36. Cavalcanti, E.J.C. Energy, exergy and exergoenvironmental analyses on gas-diesel fuel marine engine used for trigeneration system. Appl. Therm. Eng. 2021, 184, 116211. [Google Scholar] [CrossRef]
  37. Deng, Q.; Lin, B. Automated machine learning structure-composition-property relationships of perovskite materials for energy conversion and storage. Energy Mater 2021, 1, 100006. [Google Scholar] [CrossRef]
  38. Stemmann-Technik. FerryCHARGER for Electric Ferries. Available online: http://www.stemmann.com/en/products/charging_systems/ferrycharger (accessed on 8 January 2021).
  39. Siemens. Siemens’ Record-Fast Charging Batteries Convert Norway’s Ferry Route to Electric Power. Available online: https://press.siemens.com/global/en/news/siemens-record-fast-charging-batteries-convert-norways-ferry-route-electric-power (accessed on 8 January 2021).
  40. Tuck, E.; Lazauskas, L. DRAG ON A SHIP AND MICHELL’S INTEGRAL. In Proceedings of the XXII International Congress of Theoretical and Applied Mechanics; XXII ICTAM, Adelaide, Australia, 25–29 August 2008. [Google Scholar]
  41. Scarlat, N.; Prussi, M.; Padella, M. Quantification of the carbon intensity of electricity produced and used in Europe. Appl. Energy 2022, 305, 117901. [Google Scholar] [CrossRef]
Figure 1. Tugboat RAmora designed by Robert Allan Ltd. [1] (a), and Tugboat Nellie Bly, demonstrator of the SM300 navigation system (b) [2].
Energies 15 09592 g001
Figure 2. Structure of the proposed agent system.
Energies 15 09592 g002
Figure 3. View of an example port using the proposed tugboat formation control system.
Energies 15 09592 g003
Figure 4. Waves forming behind the stern of a moving tugboat. Transverse waves marked with a red outline, divergent waves marked with a green outline.
Energies 15 09592 g004
Figure 5. Resistance force components acting on a single tug used in a formation.
Energies 15 09592 g005
Figure 6. Considered formation shapes. (a) a linear shape, (b) an echelon shape with an angle of α, (c) a wide shape, (d) diamond-shaped, (e) arrowhead-shaped, (f) arrowhead-shaped with variable position of outside members.
Energies 15 09592 g006
Figure 7. Total resistance of a formation composed of four tugboats sailing in a linear formation.
Energies 15 09592 g007
Figure 8. Total resistance of a formation composed of four tugboats sailing in wide formation.
Energies 15 09592 g008
Figure 9. Total resistance of a formation consisting of four tugboats sailing in an echelon formation with an angle of 30°.
Energies 15 09592 g009
Figure 10. Total resistance of a formation consisting of four tugboats sailing in an echelon formation with an angle of 45°.
Energies 15 09592 g010
Figure 11. Total resistance of a formation consisting of four tugboats sailing in an echelon formation with an angle of 60°.
Energies 15 09592 g011
Figure 12. Total resistance of a formation composed of four tugboats sailing in a diamond-shaped formation.
Energies 15 09592 g012
Figure 13. Total resistance of a formation composed of four tugboats sailing in a diamond-shaped formation.
Energies 15 09592 g013
Figure 14. Total resistance of a formation composed of four tugboats sailing in a diamond-shaped formation.
Energies 15 09592 g014
Figure 15. Relative value of total drag as a function of ship distance for a given formation in the entire speed range.
Energies 15 09592 g015
Figure 16. The distance providing the least resistance for a given formation speed in a linear formation.
Energies 15 09592 g016
Figure 17. The distance that gives the least resistance for a given speed and shape of the formation.
Energies 15 09592 g017
Figure 18. Distance providing the least resistance for a given formation speed in a linear formation.
Energies 15 09592 g018
Figure 19. Route traveled by the simulated tugboat.
Energies 15 09592 g019
Figure 20. Speed of the simulated tugboat.
Energies 15 09592 g020
Figure 21. Wind speed and direction during the simulation.
Energies 15 09592 g021
Figure 22. Sea current speed and direction during the simulation.
Energies 15 09592 g022
Figure 23. Resistance to motion of four ships moving in formations of various shapes.
Energies 15 09592 g023
Table 1. Percentage of components of the total drag force FTR acting on a single tugboat at different speeds.
Speed (kn)FF (%)
Friction
FEA (%)
Aerodynamic
FWT (%)
Wave Transverse
FWD (%)
Wave Divergent
(%)
Total wave resistance
FTR (kN)
Total
Resistance
194.35.50.20.10.30.2
376.15.213.94.718.61.5
542.83.236.917.254.06.8
713.71.170.914.385.339.5
911.70.952.534.887.477.5
115.50.546.847.294.0236.2
135.00.453.141.594.6355.5
Table 2. Parameters of tugboats included in the formation.
ParameterDesignationValue
Length overallLOA32.387 m
BreadthB12.512 m
DraftD3.01 m
Frontal areaS94.9 m2
Drag coefficientcd0.6
Top speedvmax13 kn
Table 3. Ranges of tested speeds, L values (distances between ships) and K value (position of outermost ships with respect to the leading tug in the arrowhead-shaped formation).
Formation ShapeSpeed RangeLmin to LmaxKmin to Kmax
Linear4.9 to 13.0 kn32 to 120 mn/a
Wide4.9 to 13.0 kn15 to 50 mn/a
Echelon 30°4.9 to 13.0 kn30 to 120 mn/a
Echelon 45°4.9 to 13.0 kn30 to 120 mn/a
Echelon 60°4.9 to 13.0 kn30 to 120 mn/a
Diamond4.9 to 13.0 kn40 to 120 mn/a
Arrowhead4.9 to 13.0 kn32 to 120 mn/a
Arrowhead sliding4.9 to 13.0 knfixed at 40 m0 to 80 m
Table 4. Distances between successive turning points of the simulated route.
Route SegmentDistance (kn)
Start—10.14
1—20.47
2—30.48
3—41.61
4—52.95
5—6(3.05)
6—71.61
7—80.48
8—90.47
9—100.14
TOTAL11.4
Table 5. Energy consumption and CO2 emissions by four tugboats on the tested route.
Formation ShapeEnergy (kWh), Electric PropulsionCO2 Emissions (kg), Electric PropulsionRelative Energy Consumption (%)Energy (kWh), Diesel PropulsionCO2 Emissions (kg), Diesel Propulsion
Independent ships6348.12120.3100.021,160.35586.3
Linear2688.6898.042.48961.92365.9
Wide6353.32122.0100.121,177.75590.9
Echelon 30°4256.91421.867.114,189.73746.1
Echelon 45°5982.91998.394.219,943.05264.9
Echelon 60°5564.81858.687.718,549.24897.0
Diamond5169.01726.481.417,229.94548.7
Arrowhead4789.71599.875.515,965.84215.0
Arrowhead sliding4331.71446.868.214,438.93811.9
Publisher’s Note: MDPI stays neutral with regard to jurisdictional claims in published maps and institutional affiliations.