Article

Life Cycle Assessment and Techno-Economic Analysis for Anaerobic Digestion as Cow Manure Management System

1
Malaysia-Japan International Institute of Technology, Universiti Teknologi Malaysia, Jalan Sultan Yahya Petra, Kuala Lumpur 54100, Selangor, Malaysia
2
School of Energy and Chemical Engineering, Xiamen University Malaysia, Jalan Sunsuria, Bandar Sunsuria, Sepang 43900, Selangor, Malaysia
3
Department of Chemical Engineering, Universiti Teknologi PETRONAS, Bandar Seri Iskandar 32610, Perak, Malaysia
4
Faculty of Chemical and Energy Engineering, Universiti Teknologi Malaysia, UTM, Johor Bahru 81310, Johor, Malaysia
*
Author to whom correspondence should be addressed.
Energies 2022, 15(24), 9586; https://doi.org/10.3390/en15249586
Submission received: 18 October 2022 / Revised: 28 November 2022 / Accepted: 13 December 2022 / Published: 16 December 2022
(This article belongs to the Special Issue Energy for Sustainable Development and Circular Economy)

Abstract

:
Clean electricity is generated by the anaerobic digestion of biomass waste. The environmental impacts of various biomass waste feedstocks vary, while co-digestion has been reported to improve anaerobic digestion performance. A consequential life-cycle assessment (LCA) and techno-economic analysis (TEA) are carried out for cow manure waste management for a cow farm. Three scenarios are considered in this study: (S1) mono-digestion of cow manure, (S2) co-digestion of cow manure and maize silage, and (S3) co-digestion of cow manure with cow feed waste, sewage sludge, and returned dairy products. The LCA aims to quantify the environmental impact of each MWh of electricity generated, assuming the plant is located in Malaysia, using OpenLCA software. The TEA economic parameters are quantified and compared between the three scenarios. Net present value (NPV), Internal Return Rate (IRR), and Return of Investment (ROI) are examined. Among the three scenarios, S2 with maize cultivation has a higher environmental impact due to its higher energy requirements. With the integration of closed digestate storage and renewable energy-powered electricity, S3 has the best environmental performance in global warming, eutrophication and acidification. S3 is found to be most economically viable, with MYR 1.28 million NPV, 14% IRR, and 15% ROI, and a Payback Period of 6.56 years with an OPEX of MYR 3491.82/MWh.

1. Introduction

The agricultural sector has been one of the significant contributors to environmental problems triggered by the emission of chemicals, methane (CH4), nitrous oxide (N2O), ammonia (NH3), and nitrate (NO3) to air and water [1]. The annual global production of animal manure in 2014 was 3.12 trillion kg and is estimated to climb to 3.83 trillion kg in 2030 [2]. If animal manure is not disposed of correctly, methane and carbon dioxide are produced. It is reported that within 15–30 °C, methane emissions from cow manure storage are 1–2% [3]. The methane emitted to the atmosphere becomes a greenhouse gas that contributes dramatically to global warming and causes global temperature increase, commonly accounted as the Global Warming Potential (GWP). Furthermore, when manure is put into soil in an unregulated or excessive manner, it might endanger the soil, underwater and water condition, which ultimately affects the marine ecosystem through excessive nutrient content and causes excessive plant and algal growth, known as eutrophication.
The rise of animal manure globally accelerated the research in biogas production through animal manure-based anaerobic digestion (AD). Animal manure is high in carbon sources, so has great potential to feed into AD and contribute to sustainable development [4]. Manure processing technologies could prove helpful to close nutrient cycles while reducing GHG emissions to the environment and practising appropriate manure management in intensive livestock production areas [5]. The product of anaerobic digestion is biogas, which is clean energy and ready for power generation. In response to the increase in manure generation globally, biogas production using animal manure has already been widely installed in Germany [6], India [7], and rural China [8].
Carbon reduction targets set by the Renewable Energy Directive and Kyoto Protocol can be achieved by using bioenergy as a renewable energy source as one of the measures [9]. Other than manure, various biomasses are fed into a bio-digester to produce biogas. For instance, plant biomass, such as grain, sugar beet, fodder beet, maize silage, and rye, can be used for digestion [10]. Animal slurry, such as cow and pig slurry, is commonly used to feed the bioreactor. Manure mono-digestion reportedly has trouble achieving a positive net energy output ratio [11]. Undigestible feed, such as lignin, hemicellulose, and cellulose, is common in cattle manure and is challenging to hydrolyse. Co-digestion is a common way to address this issue. Under increased organic loading rates, a mixture of manure and carbon-rich organic wastes improved nutritional balance (C/N/P ratio) and trace element supply while increasing buffer capacity and biogas output. In addition, a large-scale biogas plant has adopted sewage sludge as feed in India [12], while municipal solid waste is utilized in Italy to produce biomethane [13].
The accelerated demand for dairy products led waste generation from dairy farms to increase to 1.3 billion tons of cow dung globally. Worldwide, 22% of households in the World Health Organisation (WHO) region have cows on-site [2]. In Germany, biogas plants increased from 1050 in 2000 to 7850 in 2013. In Europe, Germany is followed by the United Kingdom, France, Italy, and the Netherlands in total biogas output [14]. Biogas generated from the AD of cow dung is not unfamiliar and is highly recognized as a waste-to-wealth approach. There is immense potential for it to be used for electricity production worldwide. Li et al. [15] examined the biogas produced from cattle dung as transportation fuel, which has a remarkable potential for reducing greenhouse gas emissions.
Many studies have been carried out to optimize and better understand different parameters that affect an anaerobic biogas plant [16,17]. In addition, studies using a different kind of feed in mono-digestion or co-digestion have also been carried out [18]. However, the environmental impact is commonly assessed using Life-cycle assessment (LCA) and most studies focused on the emission of GHG [19]. Timonen et al. [20] investigated various allocation methods for LCA study on the AD process, from the pig slurry waste collection to biogas utilization in combined heat and power systems, as well as the digestate management system. Van den Oever et al. [21] compared the environmental impacts of municipal organic waste and animal manure management through an anaerobic digestion process to produce compressed biogas.
To fully assess technology’s relevancy, economic and environmental criteria are vital [22]. Economic potential is always a significant factor affecting an industry’s decision-making process. There are plenty of helpful engineering economic assessment tools, of which techno-economic analysis (TEA) is one. TEA has been one of the most significant developments in project cost control over the last ten years. Imeni et al. [23] presented the TEA of anaerobic co-digestion of cow manure (CM) with raw and briquette straw to evaluate its feasibility. Tan et al. [24] performed TEA for an on-site biogas plant to validate its financial sustainability as a waste management system in the dairy industry.
Aui et al. [25] performed an LCA and TEA study to evaluate beef cattle farms’ on-site anaerobic digestion facility, using biomass and co-digestion with Glycerin to achieve a targeted power generation potential. Rajendran and Murthy [26] reviewed the LCA and TEA studies for anaerobic digestion processes worldwide. Tan et al. [27] followed up the review of LCA and TEA for biogas production systems focusing on the co-digestion of animal manure. There is a need to conduct LCA and TEA of a biogas energy system for the digestion of cow manure and co-digestion with its waste in the same supply chain. This kind of work is very much in need in the context of Malaysian cow farms for transforming the industry, and it is currently lacking in the literature.
This study examines the environmental and economic impacts of a cow manure AD system, which served as a waste management system for commercial dairy farms. This study explores the possibility of co-digestion in the AD system for co-digestion with other waste materials in the dairy products supply chain. The base case (Scenario 1-S1) considers a cow manure mono-digestion system. Then, to maximize the system’s yield, co-digestion is considered in this work, in which co-digestion with maize silage is considered as Scenario 2 (S2). Co-digestion with sewage sludge (SS), returned dairy products (RDP) and feed waste (FW) is considered in Scenario 3 (S3). Then, scenario analysis for improving the digestate storage system and renewable energy integration are studied for the AD system. Lastly, TEA is carried out to ensure the economic benefit of the waste management AD plant. This study is essential as a preliminary study on a cow manure management system’s environmental impacts and techno-economic potentials, through the AD process, which produces electricity from the biogas generated from the AD system. This work would benefit the cow farming community in Malaysia, which is commonly not sustainably managing cow manure.

2. Methodology

This research involves two major parts: the LCA and the TEA.

2.1. Life Cycle Assessment

LCA is carried out based on ISO 14,040 and ISO 14,044 [28,29], in the framework with the following four steps: (i) goal and scope definition; (ii) life cycle inventory; (iii) life cycle impact assessment; and (iv) life cycle interpretation. OpenLCA software version 1.10.3 is chosen because it consists of the relevant database and characterization methods that can be adopted in this study.

2.1.1. Goal and Scope Definition

The principal goal is to identify the environmental hotspot in the AD system for electricity generation, which affects the environmental burden from the biogas production plants. The consequential LCA is assumed to be located in Malaysia, where the dairy industry in Malaysia is growing, and milk production increased from 37.7 MT in 2000 to 48.3 MT in 2019 [30]. The government is putting effort into increasing local production to reduce the dependency on imported products. Three scenarios are assessed in this study:
  • Scenario 1 (S1): mono-digestion of CM;
  • Scenario 2 (S2): co-digestion of CM with maize silage;
  • Scenario 3 (S3): co-digestion of CM, SS, RDP and FW.
The main function of the biogas plant is the production of biogas from cow manure or other substrates added for power generation. Therefore, the functional unit in this study is defined as 1 MWh of electricity generated from the AD plant. The system boundary is assumed as a “cradle-to-gate” system, as shown in Figure 1, which includes feedstock collection, AD, CHP, and fertilization or storage of digestate. The study focuses on the biogas AD plants, which excluded the external treatment for the product or co-product involved, such as wastewater treatment plants and external processes.
In Scenario 1 (S1), cow manure (CM) was collected and sent to AD directly. Scenario 2 explores the possibility of including the maize farm in the life cycle for applying carbon neutrality, in which the silage is co-digested with the CM from the cow farm. In contrast, Scenario 3 (S3) began during the feedstock collection: CM, SS, FW, and RDP, which included the co-substrate in the digestion process. Biogas generated from AD was used to produce heat and electricity from CHP. The digestate could replace chemical fertilizers as a natural fertilizer. The system boundary considered digestate as a substitute for chemical fertilizers based on the literature’s available N, K, and P digestate values.

2.1.2. Life Cycle Inventory (LCI)

The LCI for all scenarios is compiled in the Supplementary Data, Tables S2 and S3. The input and emission of LCI are listed according to the process stages, including feedstock collection, cultivation of feedstock, AD, CHP, storage, and fertilization.
CM is assumed to be collected from lactating dairy cows via an on-farm pipeline for all scenarios. In addition, S3 collects leftover feed from nearby farms 2.7 km away and sludge from wastewater treatment plants 2.8 km away. The returned dairy products (RDP) are collected from wholesale and retail markets, which are located 31.6 km away. The transportation freight was assumed to be EURO 5-fueled diesel vehicles, Malaysia’s diesel grade. The background processes for the petroleum refinery’s diesel and power station’s energy production are computed using the EcoInvent database to cater to these operations in the LCA study.
Next, maize cultivation involves various agricultural activities, such as irrigation, machinery and transport (diesel used), fertilization, and herbicides [31]. The herbicides used are Lumax and Dual Magnum Herbicides.
In AD, the overall methane output was determined by the biomass feed, including cow manure, feed waste, returned dairy products, and sludge, according to their weight fraction, the volatile solids based on the total weight (%VS), and methane yield [32]. A summary of the general characteristic of biogas plant scenarios is listed in Table 1. The %VS in the digestor for S1 and S2 is 8.5% and 10.6% [31]. Meanwhile, dairy manure collected on-farm in S3 is 18% TS and 10.99% VS [33].
Methane-rich biogas can generate electricity and heat using combined heat and power (CHP). The biogas-generated electricity and thermal energy are calculated using a 35% electrical and 50% thermal conversion efficiency [33]. Every cubic metre of biogas is equivalent to 2.14 kWh of electrical energy, while a cubic meter of methane gas yields 10 kWh of electrical energy [34]. The excess generated electricity, after considering the energy consumption in the AD plant, will be supplied to the national grid. The thermal energy produced is used exclusively at the AD reactor to keep the system at a constant operating temperature, a standard setup for agricultural-based biogas plants [35].
The digestate produced by the digester is a nitrogen-rich fertilizer for the soil. The amount of digestate was calculated based on an assumption of 60% vs. removal from the total organic loading rate for S2 and S3 [31] and digestate amount is provided for S1 [32]. The digestate in S2 is used as fertilizer for maize plantation as it is fed into the same product life cycle, resulting in a circular maize cycle. The digestate is stored in open tank storage in all scenarios.

2.1.3. Life Cycle Inventory Assessment (LCIA)

CML2001 IA baseline is used as the LCIA method in this study. The method is popular among researchers for analysing the environmental performance of AD plants. For instance, Jiang et al. [36] employed CML2001 to evaluate AD plants using pig manure as feed. Other similar co-digestion studies also use CML baseline, such as Ramírez-Arpide et al. [37] and Zhang et al. [38].
In characterisation, the effects of each emission or resource are estimated. This study focuses on four impact categories, including global warming potential (GWP), acidification potential (AP), eutrophication potential (EP), and photochemical ozone creation potential (POCP). Toxicity-related impact categories are not discussed in this study. Instead, the research focuses more on guiding large-scale farm operators toward more sustainable practices and cleaner production based on the four selected impact categories. In addition, the GWP, AP, EP, and POCP categories are more comparable with other studies resulting from different LCIA methods [39].

2.1.4. Life Cycle Interpretation

The environmental hotspots of the scenarios are identified in the interpretation stage, during which improvements in digestate storage and renewable energy integration are proposed and analysed to compare their environmental impacts.
Various digestate management systems are available in the market, such as pyrolysis to produce bio-oil or biochar [40], gasification to generate syngas [41], and a closed storage tank [42]. However, a simple closed digestate storage is convenient, easy, and cheaper to install into an existing plant than considering pyrolysis or gasification, since more technology and capital would need to be invested. On the other hand, closed storage systems are more easily accomplished and are considered a more practical solution to reduce the environmental consequences in this study.
In addition, electricity is one of the significant aspects that contribute to the life cycle environmental impacts. Solar photovoltaic (PV) systems have grown tremendously in Malaysia because of the country’s climate, with massive solar radiation [43]. In addition, as a signatory to the Paris Agreement, Malaysia’s power generation plan calls for a 31% renewable energy share installed capacity by 2025 and a 40% renewable energy share by 2035 [44].
Therefore, the effects of closed digestate storage system and PV energy generation system integrations substitute the open storage system and electricity mix in baseline scenarios (S1, S2 and S3). In this scenario analysis, some new scenarios are introduced:
  • S1A: mono-digestion of CM, closed storage system, grid-powered energy supply
  • S1B: mono-digestion of CM, closed storage system, PV energy supply
  • S2B: co-digestion of CM and maize silage, PV energy supply
  • S3A: co-digestion of CM, RDP, SS and FW, closed storage system, grid-powered energy supply
  • S3B: co-digestion of CM, RDP, SS and FW, closed storage system, PV energy supply

2.2. Techno-Economic Analysis (TEA)

In this study, the currency exchange rate was assumed to be USD 0.23 to MYR 1, with the plant’s expected lifetime of 20 years. The power selling price is 0.35 MYR/kWh [45], with the dairy farm classified as a general medium-voltage agricultural farm. The dairy farm and biogas plant use commercial tariffs for their water usage, with a tariff of 2.07 MYR/m3 for the first 35 m3, and the remaining usage would be charged at the rate of 2.25 MYR/m3 [46].
The overall process is considered in the TEA, as scoped in Figure 1. Note that the PV energy supply system and the closed storage system are not considered, as there are possible improvements in the LCA study. The initial investment in designing, constructing, installing, and commissioning a plant is estimated as the Capital Expenditure (CAPEX). The CAPEX is the sum of fixed capital and working capital. The fixed capital (Equation (1)) is estimated using the factorial technique, which is determined based on the total physical plant cost (PPC–Equation (2)) grounded on the total Purchase Cost of Equipment (PCE), with the factors listed in Table 2. The site development and ancillary building factors are assumed to be zero, as they are not applicable to this project. Meanwhile, the working capital is estimated as 5% of fixed capital to cover the initial operations until the plant starts to earn money, such as raw material inventory, spare-parts inventory and solvent change expense [47].
F i x e d   c a p i t a l = P P C   ( 1 + F C o n t r a c t o r + F C o n t i n g e n c y )
P P C = P C E   x   ( 1 + F P i p i n g + F I n s t r u m e n t a t i o n + F E l e c t r i c a l + F B u i l d i n g s ,   p r o c e s s + F S t o r a g e s + F S i t e   d e v e l o p m e n t + F A n c i l l a r y   b u i l d i n g s )
The PCE is the total equipment cost in the facility, which is the highest cost in the CAPEX. US Gulf Coast basis correlations are employed to estimate the equipment cost [47] using Equation (3), where C e = purchased equipment cost on a US Gulf Coast basis, with the reference year at 2010 ;   a ,   b = equipment cost constants (Table 2 in Sinnott and Towler [47]); S = size parameter;   n = exponent for that type of equipment. Equation (4) adjusts the historical cost at reference year to the cost at the year of the study using the cost-indexes, which consider the cost inflation. In this study, the cost index for 2010 is 167, while for 2021 is 317 [48].
  C e   ( 2010 ) = a + b S n
C e   ( 2021 ) = C e   ( 2010 ) c o s t   i n d e x   2021 c o s t   i n d e x   2010
Other than that, operational expenditure (OPEX) comprises all production costs, including variable (direct) and fixed (indirect) costs, including labour and maintenance costs, such as raw materials and utilities. In this study, no cost is allocated for biomass waste, while maize cultivation costs 1325 MYR/hectare.cycle, where three production cycles are practised each year with Malaysia’s tropical weather [49].
The revenue of the biogas plants is calculated from sales of electricity generated, with maize corn and digestate as fertilizer. The price of electricity sold back to the grid is assumed to be 0.35 MYR/kWh [45], and the commercial rate is assumed to be available for the net energy metering scheme. The plant fertilizer is taken at 7 MYR/kg from the average commercial price of plant fertilizer. The sales of maize corn are obtained from the Index Mundi [50] at 1038.26 MYR/Mt, which was updated in November 2021 at the time of research.
The profitability indexes are calculated to justify the AD biogas plant’s economic feasibility: The Net Present Value (NPV), Internal Rate of Return (IRR), and simple payback period (SPP). The NPV is a subtraction result of the current value of the revenues with the current investment cost value. The NPV is estimated using Equation (5), where n is the year the cost or revenue occurs, CF is cash flow in period n, and the discount rate, k. This study uses the k of 7.398% [51], which considers both opportunity costs and risk premiums. The IRR is the discount rate at zero NPV, where k is the interest rate. Lastly, the SPP is estimated as investment cost over annual profit. Note that the subsidies were not used in the computation.
N P V = t = 0 n C F n ( 1 + k ) n

3. Result and Discussion

The results of this study are divided into two main sections, where environmental performances based on the LCA study and the economic potential based on the techno-economic analysis (TEA) are presented and discussed.

3.1. Environmental Performance

The LCA result is obtained with OpenLCA software to understand the proposed scenarios’ environmental impact. The LCI of feedstock and emissions are inputted into the software for all situations. Table 3 lists the environmental impact presented per functional unit, which is 1 MWh of electricity.

3.1.1. Global Warming Potential (GWP100a)

The emission of large amounts of GHG, such as methane gas, is the primary cause of global warming potential (GWP) in all scenarios because methane gas has an impact factor of 28 kg CO2 equivalent. S3 has the highest value of GWP at 1125.546 kg CO2 eq, followed by S1 (285.604 kg CO2 eq) and S2 (125.997 kg CO2 eq).
Figure 2a shows that the hotspot for GWP of S1 and S3 are both fertilization storage stages. The fertilization storage stage comprises 92% of the total GWP in S3. The open storage system in S1 and S3 causes methane gas to escape into the atmosphere, leading to high GWP. The high VS% in co-digestion (S3) resulted in a greater value of digestate, hence higher biogenic CH4 per MWh than S1. S2 shows a better performance due to the closed maize cycle. Therefore, when the area required for digestate land application exceeds that required for crop production, digestate management should be prioritized and agrees well with what Li et al. [52] reported. Based on the GWP impact analysis result for the AD process in all scenarios, the upstream electricity production has contributed significantly, where up to 42% of the GWP contribution comes from electricity production in AD. In 2018, 57% of Malaysia’s energy mix was coal and 35% gas [43], with a small percentage of renewable energy.

3.1.2. Acidification Potential and Eutrophication Potential

The same trend in acidification potential (AP) can be observed for eutrophication potential (EP). In Figure 2b,c, S1 shows the most significant benefit for all scenarios, while S2 is the worst. In AP, coal-fired energy contributed significantly to NOx and SOx air pollutants, two substantial acid emissions (Edwards et al., 2017). The AD stage contributed the most to EP through PO4 from coal mining. The second most relevant stage is RDP in S3 due to the transportation and energy used to crush the materials, similar to the report by Li, Qi, Zhang, Li, Wang, Li and Luo [52]. On the other hand, AP originating from the fertilization of S1 is negligible due to the low NH3 produced (0.12 kg) and was omitted by the CML method. This is also due to the lower production rate of digestate per MWh in S1 compared to S3. Comparing S2 with the rest, EP was about 38% and 62% higher. Furthermore, additional emissions occur when organic matter is applied or fertilized outdoors [32]. This agrees with Ertem et al. [53], where SO4 and NO emissions are higher during maize cultivation. Therefore, reducing resource impact or avoiding energy crops can improve the AD system’s environmental effects [54].

3.1.3. Photochemical Ozone Creation Potential

The Photochemical Ozone Creation Potential (POCP) scale measures how well different volatile organic compounds (VOCs) can create tropospheric ozone (ozone at ground level) [55]. The VOCs and NOx from fossil-powered plants, methane emissions from the digestate, and the methane losses from the AD plant, have a significant influence. Negative POCP was observed in S2. According to the CML method, nitrogen monoxide emitted during the cultivation of maize reduces POCP, hence the negative impact. The same trend was reported by Lijó et al. [56] and Fusi, Bacenetti, Fiala and Azapagic [31] when digestate is reused in maize cultivation.

3.2. Effect of Digestate Management and Fossil Energy Alternative on LCA Result

From Figure 3, the fertilization storage stage causes high POCP and GWP due to methane losses in poor digestate storage systems. Fossil power plants also lead to the hotspot of environmental impacts in AD. Thus, the effects of the closed storage system and PV system flow substitute the open storage system and electricity mix in baseline scenarios (S1, S2 and S3).
All scenarios benefited from closed storage and renewables alternatives, as shown in Figure 3. For example, in S3, a closed storage system reduces GWP by 91% and POCP by 88%, while in S1, it reduces GWP and POCP by more than half. This is because methane is captured in a closed storage system which greatly reduces methane escaping into the atmosphere. This is similarly reported in research carried out by Ramírez-Arpide, Espinosa-Solares, Gallegos-Vázquez and Santoyo-Cortés [42]. Furthermore, the recovery of digestate off-gases leads to a higher biogas utilisation rate aligned with the research carried out by Agostini, Battini, Giuntoli, Tabaglio, Padella, Baxter, Marelli and Amaducci [35]. This research estimated the amount of methane captured in closed storage, equivalent to 0.548 MWh (S1A and S1B) and 0.083 MWh (S3A and S3B).
The substitution of electricity from the grid with solar PV as alternative energy successfully brought down the total GWP, AP, EP, and POCP drastically, as seen in Figure 3. A reduction in GWP of 46%, 58%, and 47% is seen on the solar alternatives S1B, S2B, and S3B. The results agree with Tsapekos et al. [57], whereby environmental savings are achieved when renewable energy is targeted to substitute fossil-based energy. Fossil-based electrical energy is more energy-intensive, while fossil mining leads to a higher impact in AD stages, as shown in Figure 3.
The AP and EP impact for S1B, S2B, and S3B scenarios was reduced by more than half, as illustrated in Figure 3b,c. This is due to a high mix of coal-powered electricity used in AD being eliminated and replaced with solar energy. As a result, the acid emissions from coal-powered energy generation (NOx and SOx) and emissions from coal mining (PO4 and NO), are absent in these scenarios, causing the drop in AP and EP impact. Due to maize cultivation, the S2B has higher AP and EP than S1B and S3B, contributing considerably to these two effects. Next, without the VOCs and NOx from fossil-powered power plants, the POCP impact decreases significantly by 45–75%. The only emissions left for POCP are methane emissions from the digestate and methane losses from the AD plant.

3.3. Techno-Economic Analysis (TEA)

The economic performances of S1, S2, and S3 are evaluated.

3.3.1. CAPEX and OPEX

The factorial method was used to estimate the installed cost of the biogas plant [47]. The summary of all economic performances was estimated and tabulated in Table 4.
It is observed that PCE ranges across 52–55% of CAPEX. The equipment cost largely contributes to the CAPEX and the following cost estimation, which agrees with Aui, Li and Wright [25] and Li, Qi, Zhang, Li, Wang, Li and Luo [52]. S3 had the lowest CAPEX, at MYR 2.406 million, due to being a smaller plant than S2 and S1. A bigger AD reactor requires more maintenance than a relatively small one, so S1’s CAPEX is calculated to be double that of S3. Each biogas plant’s OPEX was 6%, 8%, and 5% of CAPEX. OPEX in S2 is MYR 1325.00 per season for land preparation and maize cultivation. This explains the higher operational cost per year than all the other plants.
Moreover, as a continuation study from LCA, OPEX, revenue and net profit for the scenarios are calculated per functional unit (MYR/MWh). It is worth mentioning that the OPEX per MWh energy produced indicates a different trend from the cost of annual OPEX. Due to the larger plant capacity of S1 and S2, more electricity can be produced with more waste inputted into the system, as seen in Table 4. Therefore, less cost is needed for 1 MWh electricity production in S1 (1021.59 MYR/MWh) and S2 (3064.83 MYR/MWh), compared to 3491.82 MYR/MWh in S3.
The energy production cost is reported as 566.27 MYR/MWh in a study of co-digesting pig manure and food waste [58], in which the profit from the electricity sales was sufficient to cover the plant’s operating cost. However, the production cost in this case study is higher, which might be due to the lower efficiency of the system, low electricity profit and higher operating cost used in the case study. In addition, the revenue for S2 and S3 in this case study can cover the operating cost of the biogas plant, although the electricity production cost is found to be high. However, although the S1 has a lower energy production cost, the profit still could not catch up to the high amount of investment put in by investors.

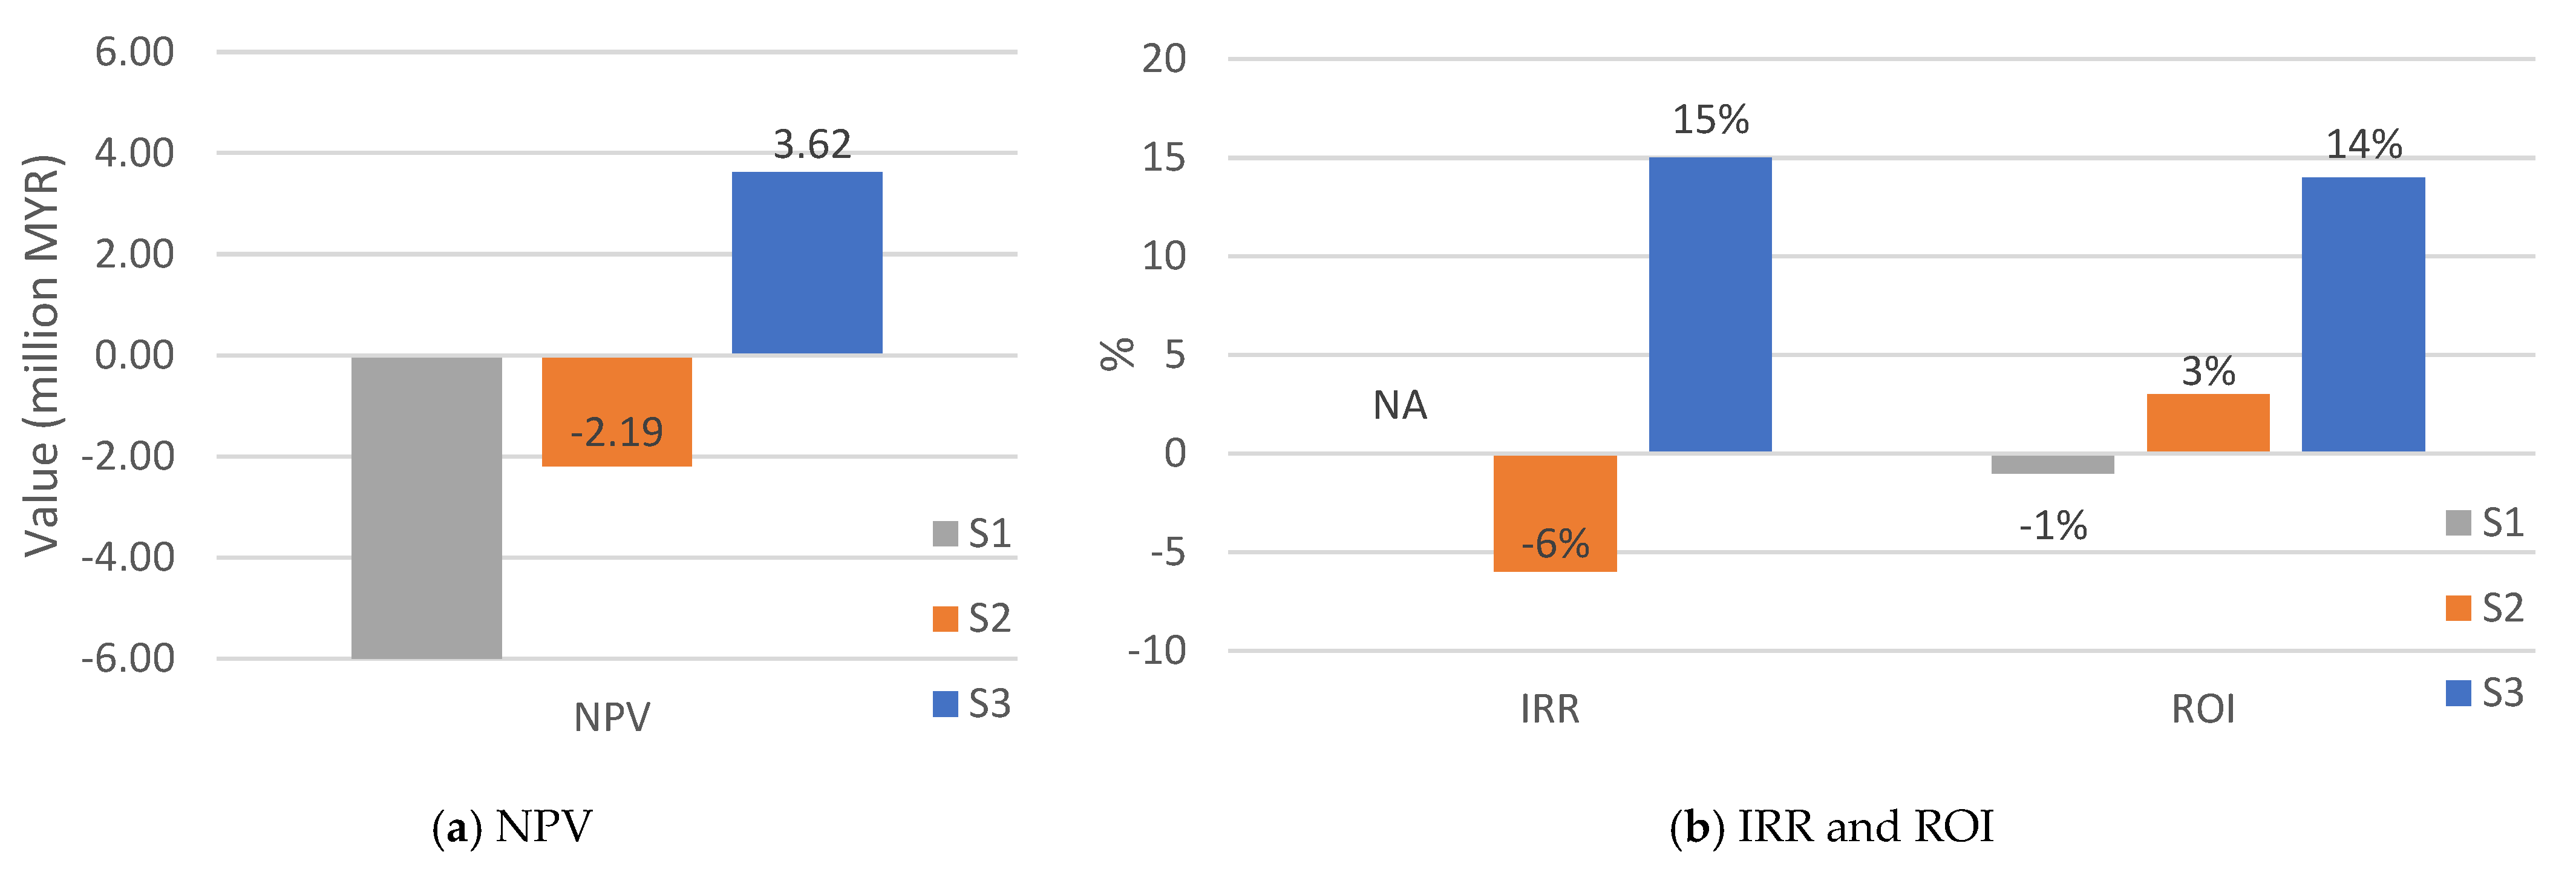
3.3.2. NPV, IRR, ROI and SPP

NPV is a favoured tool for assessing economic performance since it is a more meaningful indication for capital-budgeting decisions [25]. In addition, the NPV, IRR and ROI of each scenario are presented in Figure 4a,b.
The only positive NPV is observed for S3, worth MYR 1.28 million. The NPV and payback period in an AD of co-digestion of food waste were consistent with that exhibited for S1 [58]. S1 and S2 obtained a negative NPV, as shown in Figure 4. It is realized that the high CAPEX and OPEX of S2 lead to a negative NPV (MYR −2.90 million). High OPEX reduced the profitability of the biogas plant significantly, especially when the profit margin was very low (approximately 7.5%). MARDI further reported in 2019 that maize plantations in Malaysia only yielded 376 MYR/ha per season [49]. A negative NPV indicates investment losses if the present value of the investment is larger than the present value of revenues. Therefore, a corporation should not undertake negative net present value projects since they are expected to result in a net loss. S1 has a very high negative NPV value (MYR −5.54 million), primarily due to the large bioreactor tank that leads to high CAPEX and OPEX.
The discount rate used in this study is 7.398% [51]. It is calculated that S2 has an IRR of 6%, which is lower than the discount rate. Therefore, it leads to a negative NPV value, as illustrated in Figure 4. The IRR must exceed the project’s discount rate to attain a positive NPV value. Additionally, the only favourable NPV scenario is S3. The NPV’s trend for three scenarios is similar to the IRR. Other than that, S1 will suffer losses of MYR 72,102.25 per year from the calculation. The IRR was then unavailable (NA), and ROI was calculated to be −1%, due to higher operational costs than the revenue generated. NPV, IRR and ROI value estimated that S1 would constantly lose money, as shown in Figure 4. SPP for S1 is incomputable due to negative annual profit, while S2 is 35.99 years and S3 is 6.56 years.
Between 20,000 and 200,000 tonnes of yearly processing capacity and between MYR 25 and 165 million in CAPEX were reported in the TEA. The IRR for small-scale and industrial-scale plants varied from 20% to 7%, respectively. The SPP ranged from five to ten years [26]. Both IRR and SPP from the previous study agree well with S3.
A biogas production study suggests initiatives with a positive NPV of 20% and a high IRR can be pursued [59]. In a nutshell, S3 is the most economically viable, with a payback period of 6.24 years and the NPV value of MYR 1,391,239.14, with high IRR and ROI of 15% and 14%, respectively.

4. Conclusions

The environmental impact of the scenarios, mono-digestion and co-digestion from various feedstocks, are identified and evaluated. From a closer perspective, the feedstock utilized would influence each biogas plant’s methane content, affecting the biogas plant’s performance, where co-digestion generally shows better performance. For the production of 1 MWh of electricity, S1 requires 178.57 m3 of biogas (58% methane), S2 190.11 m3 of biogas (53% methane), and S3 166.67 m3 of biogas (60% methane). Besides that, a closed storage system of digestate plays a great responsibility in reducing methane emission to air while recovering the digestate-off methane gas, in which all scenarios achieved lower impact. Another issue is the source of power generation. In this case, the high amount of fossil-powered electricity used in the electricity mix induced all of the impacts of ADP, GWP, EP, AP, POCP and ecotoxicity potential. S2 shows an environmental impact hotspot in maize cultivation. Crops cultivation is generally more energy-intensive, leading to a higher impact on the environment. On the other hand, S3 showed a higher GWP and POCP but achieved a lower AP and EP with closed digestate management. Generally, S3 shows the best environmental performances in ecotoxicity potentials, GWP, EP and AP with closed storage and renewable energy powered electricity.
TEA is carried out to evaluate the feasibility of the anaerobic digestion of the biogas system in the mono-digestion and co-digestion feedstock from the feedstock collection to the heat production electricity and fertilizer. Economically, S1 is the worst to consider, with all economic metrics indicating massive losses. The scenarios’ economic viability is graded from S3 to S1, with S3 being the most feasible. Positive NPV (MYR 1,276,679.68), IRR (14%) and ROI (15%) are exhibited by S3, with an OPEX of 3491.82 MYR/MWh. S1 and S2 obtained the lower OPEX/MWh, and a negative NPV is estimated for S1 and S2, suggesting a loss. The shortest payback period of 6.56 is portrayed for S3, whereas S1 and S2 cannot receive payback within 20 years of cash flow projection. Anaerobic digestion of biomass is not limited to food waste and manure only. Dairy products and feed waste outperformed the other two options. However, the challenge for commercial biogas plants is to ensure the demand and quality of biomass to maintain stable production efficiency.
Anaerobic digestion can be a game-changer for the economy and the environment if policymakers and investors adequately study and understand it. LCA and TEA are emerging in sustainable research, and there is a growing need for study in a local context. Based on the results, it can be concluded that the AD system is an efficient technology for a cow manure waste management system in the cow farming industry in Malaysia, which produces electricity for self-sustaining the plant’s energy consumption. The revenue from exporting excess electricity from CHP systems for selling should not be the key focus. The fit-in tariff (biogas category) should be continued for not only promoting renewable energy, but also as a waste management solution to reduce carbon emission. The LCI database, profitability metrics, and geographical factors must be developed to generate more precise findings. It is recommended that avoided impact on the production system and the end of life of the AD construction are considered in future research. The digestate management through thermal treatment, such as pyrolysis and gasification, could be studied in the future. However, it is worth noting the governmental policies that might hinder the implementation of these solutions, in addition to the uncertainty analysis based on the waste (SS, RDP and FW) tipping fee or purchasing cost that could happen when the operation become steady.

Supplementary Materials

The following supporting information can be downloaded at: https://www.mdpi.com/article/10.3390/en15249586/s1, Figure S1: S1 Model Graph in OpenLCA; Figure S2: S2 Model Graph in OpenLCA; Figure S3: S3 Model Graph in OpenLCA; Figure S4: Cash flow diagram (S1); Figure S5: Cash flow diagram (S2); Figure S6: Cash flow diagram (S3); Table S1: Summary of Scenario; Table S2: LCI—input for S1, S2 and S3 [31,32]; Table S3: LCI—emission for S1, S2 and S3 [31,32]; Table S4: Calculation for TEA (S1); Table S5: Estimation of fixed capital cost, fluids processing plant (S1); Table S6: Estimation of Revenue (S1); Table S7: Estimation of Utilities (S1); Table S8: Estimation of OPEX (S1); Table S9: Cumulative cash flow (S1); Table S10: Calculation for TEA (S2); Table S11: Estimation of fixed capital cost, fluids processing plant (S2); Table S12: Estimation of Revenue (S2); Table S13: Estimation of Utilities (S2); Table S14: Estimation of OPEX (S2); Table S15: Cumulative cash flow (S2); Table S16: Calculation for TEA (S3); Table S17: Estimation of fixed capital cost, fluids processing plant (S3); Table S18: Estimation of Revenue (S3); Table S19: Estimation of OPEX (S3); Table S20: Cumulative cash flow (S3).

Author Contributions

Conceptualization, W.E.T., P.Y.L., L.S.T. and K.S.W.; methodology, W.E.T., P.Y.L. and K.S.W.; software, W.E.T.; validation, L.S.T., N.E.M.R., W.S.H. and J.N.; writing—original draft preparation, W.E.T. and P.Y.L.; writing—review and editing, L.S.T., K.S.W., N.E.M.R., W.S.H. and J.N.; visualization, W.E.T. and P.Y.L.; supervision, P.Y.L. and L.S.T.; funding acquisition, P.Y.L. All authors have read and agreed to the published version of the manuscript.

Funding

The authors would like to thank the Universiti Teknologi Malaysia for financial support through the UTM Encouragement Research Grant (Q.K130000.3843.31J02).

Data Availability Statement

The data presented in this study are available in the Supplementary Material.

Conflicts of Interest

The authors declare no conflict of interest.

References

  1. Sandars, D.L.; Audsley, E.; Cañete, C.; Cumby, T.R.; Scotford, I.M.; Williams, A.G. Environmental Benefits of Livestock Manure Management Practices and Technology by Life Cycle Assessment. Biosyst. Eng. 2003, 84, 267–281. [Google Scholar] [CrossRef]
  2. Berendes, D.M.; Yang, P.J.; Lai, A.; Hu, D.; Brown, J. Estimation of global recoverable human and animal faecal biomass. Nat. Sustain. 2018, 1, 679–685. [Google Scholar] [CrossRef]
  3. Feng, L.; Ward, A.J.; Moset, V.; Møller, H.B. Methane emission during on-site pre-storage of animal manure prior to anaerobic digestion at biogas plant: Effect of storage temperature and addition of food waste. J. Environ. Manag. 2018, 225, 272–279. [Google Scholar] [CrossRef] [PubMed]
  4. Nasir, I.; Mohd Ghazi, T. Pretreatment of lignocellulosic biomass from animal manure as a means of enhancing biogas production. Eng. Life Sci. 2015, 15, 733–742. [Google Scholar] [CrossRef] [Green Version]
  5. Nazari, L.; Sarathy, S.; Santoro, D.; Ho, D.; Ray, M.B.; Xu, C. Recent advances in energy recovery from wastewater sludge. In Direct Thermochemical Liquefaction for Energy Applications; Rosendahl, L., Ed.; Woodhead Publishing: Sutton, UK, 2018; pp. 67–100. [Google Scholar]
  6. Oehmichen, K.; Thrän, D. Fostering renewable energy provision from manure in Germany–where to implement GHG emission reduction incentives. Energy Policy 2017, 110, 471–477. [Google Scholar] [CrossRef]
  7. Breitenmoser, L.; Gross, T.; Huesch, R.; Rau, J.; Dhar, H.; Kumar, S.; Hugi, C.; Wintgens, T. Anaerobic digestion of biowastes in India: Opportunities, challenges and research needs. J. Environ. Manag. 2019, 236, 396–412. [Google Scholar] [CrossRef] [PubMed]
  8. Jiang, X.; Sommer, S.G.; Christensen, K.V. A review of the biogas industry in China. Energy Policy 2011, 39, 6073–6081. [Google Scholar] [CrossRef]
  9. Mezzullo, W.G.; McManus, M.C.; Hammond, G.P. Life cycle assessment of a small-scale anaerobic digestion plant from cattle waste. Appl. Energy 2013, 102, 657–664. [Google Scholar] [CrossRef] [Green Version]
  10. Hijazi, O.; Munro, S.; Zerhusen, B.; Effenberger, M. Review of life cycle assessment for biogas production in Europe. Renew. Sustain. Energy Rev. 2016, 54, 1291–1300. [Google Scholar] [CrossRef]
  11. Wang, Y.; Zhang, Y.; Li, J.; Lin, J.-G.; Zhang, N.; Cao, W. Biogas energy generated from livestock manure in China: Current situation and future trends. J. Environ. Manag. 2021, 297, 113324. [Google Scholar] [CrossRef]
  12. Singh, A.D.; Upadhyay, A.; Shrivastava, S.; Vivekanand, V. Life-cycle assessment of sewage sludge-based large-scale biogas plant. Bioresour. Technol. 2020, 309, 123373. [Google Scholar] [CrossRef] [PubMed]
  13. Ardolino, F.; Parrillo, F.; Arena, U. Biowaste-to-biomethane or biowaste-to-energy? An LCA study on anaerobic digestion of organic waste. J. Clean. Prod. 2018, 174, 462–476. [Google Scholar] [CrossRef]
  14. Foreest, F.V. Perspectives for Biogas in Europe; Oxford Institute for Energy Studies: Oxford, UK, 2012. [Google Scholar]
  15. Li, Y.; Zhao, J.; Krooneman, J.; Euverink, G.J.W. Strategies to boost anaerobic digestion performance of cow manure: Laboratory achievements and their full-scale application potential. Sci. Total Environ. 2021, 755, 142940. [Google Scholar] [CrossRef] [PubMed]
  16. Nasir, I.M.; Mohd Ghazi, T.I.; Omar, R. Anaerobic digestion technology in livestock manure treatment for biogas production: A review. Eng. Life Sci. 2012, 12, 258–269. [Google Scholar] [CrossRef]
  17. Meegoda, J.N.; Li, B.; Patel, K.; Wang, L.B. A Review of the Processes, Parameters, and Optimization of Anaerobic Digestion. Int. J. Environ. Res. Public Health 2018, 15, 2224. [Google Scholar] [CrossRef] [Green Version]
  18. Torrellas, M.; Burgos, L.; Tey, L.; Noguerol, J.; Riau, V.; Palatsi, J.; Antón, A.; Flotats, X.; Bonmatí, A. Different approaches to assess the environmental performance of a cow manure biogas plant. Atmos. Environ. 2018, 177, 203–213. [Google Scholar] [CrossRef]
  19. Shin, Y.-S.; Cho, K. BIM Application to Select Appropriate Design Alternative with Consideration of LCA and LCCA. Math. Probl. Eng. 2015, 2015, 281640. [Google Scholar] [CrossRef] [Green Version]
  20. Timonen, K.; Sinkko, T.; Luostarinen, S.; Tampio, E.; Joensuu, K. LCA of anaerobic digestion: Emission allocation for energy and digestate. J. Clean. Prod. 2019, 235, 1567–1579. [Google Scholar] [CrossRef]
  21. van den Oever, A.E.M.; Cardellini, G.; Sels, B.F.; Messagie, M. Life cycle environmental impacts of compressed biogas production through anaerobic digestion of manure and municipal organic waste. J. Clean. Prod. 2021, 306, 127156. [Google Scholar] [CrossRef]
  22. Collet, P.; Flottes, E.; Favre, A.; Raynal, L.; Pierre, H.; Capela, S.; Peregrina, C. Techno-economic and Life Cycle Assessment of methane production via biogas upgrading and power to gas technology. Appl. Energy 2017, 192, 282–295. [Google Scholar] [CrossRef]
  23. Imeni, S.M.; Puy, N.; Ovejero, J.; Busquets, A.M.; Bartroli, J.; Pelaz, L.; Ponsá, S.; Colón, J. Techno-Economic Assessment of Anaerobic Co-digestion of Cattle Manure and Wheat Straw (Raw and Pre-treated) at Small to Medium Dairy Cattle Farms. Waste Biomass Valorization 2020, 11, 4035–4051. [Google Scholar] [CrossRef]
  24. Tan, J.B.; Jamali, N.S.; Tan, W.E.; Che Man, H.; Zainal Abidin, Z. Techno-Economic Assessment of On-Farm Anaerobic Digestion System Using Attached-Biofilm Reactor in the Dairy Industry. Sustainability 2021, 13, 2063. [Google Scholar] [CrossRef]
  25. Aui, A.; Li, W.; Wright, M.M. Techno-economic and life cycle analysis of a farm-scale anaerobic digestion plant in Iowa. Waste Manag. 2019, 89, 154–164. [Google Scholar] [CrossRef] [PubMed]
  26. Rajendran, K.; Murthy, G.S. Techno-economic and life cycle assessments of anaerobic digestion—A review. Biocatal. Agric. Biotechnol. 2019, 20, 101207. [Google Scholar] [CrossRef]
  27. Tan, W.E.; Liew, P.Y.; Bong, C.P.C.; Van Fan, Y.; Tan, L.S.; Jamian, N.R. Life Cycle Assessment and Techno-Economic Assessment of Anaerobic Co-Digestion: A Short Review. Chem. Eng. Trans. 2021, 88, 907–912. [Google Scholar]
  28. ISO 14040:2006; Environmental Management—Life Cycle Assessment—Principles and Framework. International Organization for Standardization: Geneva, Switzerland, 2006.
  29. ISO 14044:2006; Environmental Management—Life Cycle Assessment—Requirements and Guidelines. International Organization for Standardization: Geneva, Switzerland, 2006.
  30. Food and Agriculture Organisation of the United Nation. World Food and Agriculture—Statistical Yearbook 2021; FAO: Rome, Italy, 2021. [Google Scholar]
  31. Fusi, A.; Bacenetti, J.; Fiala, M.; Azapagic, A. Life Cycle Environmental Impacts of Electricity from Biogas Produced by Anaerobic Digestion. Front. Bioeng. Biotechnol. 2016, 4, 26. [Google Scholar] [CrossRef] [Green Version]
  32. Adghim, M.; Abdallah, M.; Saad, S.; Shanableh, A.; Sartaj, M.; El Mansouri, A.E. Comparative life cycle assessment of anaerobic co-digestion for dairy waste management in large-scale farms. J. Clean. Prod. 2020, 256, 120320. [Google Scholar] [CrossRef]
  33. Li, Y.; Manandhar, A.; Li, G.; Shah, A. Life cycle assessment of integrated solid state anaerobic digestion and composting for on-farm organic residues treatment. Waste Manag. 2018, 76, 294–305. [Google Scholar] [CrossRef]
  34. Suhartini, S.; Lestari, Y.P.; Nurika, I. Estimation of methane and electricity potential from canteen food waste. IOP Conf. Ser. Earth Environ. Sci. 2019, 230, 012075. [Google Scholar] [CrossRef]
  35. Agostini, A.; Battini, F.; Giuntoli, J.; Tabaglio, V.; Padella, M.; Baxter, D.; Marelli, L.; Amaducci, S. Environmentally Sustainable Biogas? The Key Role of Manure Co-Digestion with Energy Crops. Energies 2015, 8, 5234–5265. [Google Scholar] [CrossRef]
  36. Jiang, Y.; Zhang, Y.; Wang, S.; Wang, Z.; Liu, Y.; Hu, Z.; Zhan, X. Improved environmental sustainability and bioenergy recovery through pig manure and food waste on-farm co-digestion in Ireland. J. Clean. Prod. 2021, 280, 125034. [Google Scholar] [CrossRef]
  37. Ramírez-Arpide, F.R.; Demirer, G.N.; Gallegos-Vázquez, C.; Hernández-Eugenio, G.; Santoyo-Cortés, V.H.; Espinosa-Solares, T. Life cycle assessment of biogas production through anaerobic co-digestion of nopal cladodes and dairy cow manure. J. Clean. Prod. 2018, 172, 2313–2322. [Google Scholar] [CrossRef]
  38. Zhang, Y.; Jiang, Y.; Wang, S.; Wang, Z.; Liu, Y.; Hu, Z.; Zhan, X. Environmental sustainability assessment of pig manure mono- and co-digestion and dynamic land application of the digestate. Renew. Sustain. Energy Rev. 2021, 137, 110476. [Google Scholar] [CrossRef]
  39. Dreyer, L.C.; Niemann, A.L.; Hauschild, M.Z. Comparison of Three Different LCIA Methods: EDIP97, CML2001 and Eco-indicator 99. Int. J. Life Cycle Assess. 2003, 8, 191–200. [Google Scholar] [CrossRef]
  40. Hung, C.-Y.; Tsai, W.-T.; Chen, J.-W.; Lin, Y.-Q.; Chang, Y.-M. Characterization of biochar prepared from biogas digestate. Waste Manag. 2017, 66, 53–60. [Google Scholar] [CrossRef]
  41. Peng, W.; Lü, F.; Hao, L.; Zhang, H.; Shao, L.; He, P. Digestate management for high-solid anaerobic digestion of organic wastes: A review. Bioresour. Technol. 2020, 297, 122485. [Google Scholar] [CrossRef]
  42. Ramírez-Arpide, F.R.; Espinosa-Solares, T.; Gallegos-Vázquez, C.; Santoyo-Cortés, V.H. Bioenergy production from nopal cladodes and dairy cow manure on a farm-scale level: Challenges for its economic feasibility in Mexico. Renew. Energy 2019, 142, 383–392. [Google Scholar] [CrossRef]
  43. Vaka, M.; Walvekar, R.; Rasheed, A.K.; Khalid, M. A review on Malaysia’s solar energy pathway towards carbon-neutral Malaysia beyond Covid’19 pandemic. J. Clean. Prod. 2020, 273, 122834. [Google Scholar] [CrossRef]
  44. Malaysian Investment Development Authority. Malaysia Aims 31% RE Capacity by 2025. Available online: https://www.mida.gov.my/mida-news/malaysia-aims-31-re-capacity-by-2025/ (accessed on 10 March 2022).
  45. Tanaga National Berhad. Pricing and Tariffs. Available online: https://www.tnb.com.my/commercial-industrial/pricing-tariffs1/ (accessed on 10 March 2022).
  46. Air Selangor. Water Tariff Information. Available online: https://www2.airselangor.com/my-water-smart/water-tariff-information (accessed on 12 March 2022).
  47. Sinnott, R.; Towler, G. Chapter 6—Costing and Project Evaluation. In Chemical Engineering Design; Butterworth-Heinemann: Oxford, UK, 2020. [Google Scholar]
  48. Kanoi, S. Cost Inflation Index, Meaning & Index from 1981–1982 to 2021–2022. Available online: https://taxguru.in/income-tax/cost-inflation-index-meaning-and-index-for-all-the-years.html (accessed on 10 March 2022).
  49. Syauqi Nazmi, M.; Abu Dardak, R.; Abdul Rani, R.; Rashid Rabu, M. Benchmarking Indonesia for the Development of the Grain Corn Industry in Malaysia. Available online: https://ap.fftc.org.tw/article/2782 (accessed on 10 March 2022).
  50. Index Mundi. Maize (Corn) Monthly Price—Malaysian Ringgit per Metric Ton. Available online: https://www.indexmundi.com/commodities/?commodity=corn&currency=myr (accessed on 28 March 2022).
  51. Ruiz, D.; San Miguel, G.; Corona, B.; Gaitero, A.; Domínguez, A. Environmental and economic analysis of power generation in a thermophilic biogas plant. Sci. Total Environ. 2018, 633, 1418–1428. [Google Scholar] [CrossRef]
  52. Li, Y.; Qi, C.; Zhang, Y.; Li, Y.; Wang, Y.; Li, G.; Luo, W. Anaerobic digestion of agricultural wastes from liquid to solid state: Performance and environ-economic comparison. Bioresour. Technol. 2021, 332, 125080. [Google Scholar] [CrossRef]
  53. Ertem, F.C.; Martínez-Blanco, J.; Finkbeiner, M.; Neubauer, P.; Junne, S. Life cycle assessment of flexibly fed biogas processes for an improved demand-oriented biogas supply. Bioresour. Technol. 2016, 219, 536–544. [Google Scholar] [CrossRef] [PubMed]
  54. Usack, J.G.; Gerber Van Doren, L.; Posmanik, R.; Labatut, R.A.; Tester, J.W.; Angenent, L.T. An evaluation of anaerobic co-digestion implementation on New York State dairy farms using an environmental and economic life-cycle framework. Appl. Energy 2018, 211, 28–40. [Google Scholar] [CrossRef]
  55. Jenkin, M.E.; Derwent, R.G.; Wallington, T.J. Photochemical ozone creation potentials for volatile organic compounds: Rationalization and estimation. Atmos. Environ. 2017, 163, 128–137. [Google Scholar] [CrossRef]
  56. Lijó, L.; González-García, S.; Bacenetti, J.; Moreira, M.T. The environmental effect of substituting energy crops for food waste as feedstock for biogas production. Energy 2017, 137, 1130–1143. [Google Scholar] [CrossRef]
  57. Tsapekos, P.; Khoshnevisan, B.; Alvarado-Morales, M.; Symeonidis, A.; Kougias, P.G.; Angelidaki, I. Environmental impacts of biogas production from grass: Role of co-digestion and pretreatment at harvesting time. Appl. Energy 2019, 252, 113467. [Google Scholar] [CrossRef]
  58. Bartocci, P.; Zampilli, M.; Liberti, F.; Pistolesi, V.; Massoli, S.; Bidini, G.; Fantozzi, F. LCA analysis of food waste co-digestion. Sci. Total Environ. 2020, 709, 136187. [Google Scholar] [CrossRef]
  59. Thompson, T.M.; Ramin, P.; Udugama, I.; Young, B.R.; Gernaey, K.V.; Baroutian, S. Techno-economic and environmental impact assessment of biogas production and fertiliser recovery from pelagic Sargassum: A biorefinery concept for Barbados. Energy Convers. Manag. 2021, 245, 114605. [Google Scholar] [CrossRef]
Figure 1. System Boundary of the study.
Energies 15 09586 g001
Figure 2. Environmental impact for all scenarios: (a) global warming potential, GWP100a; (b) acidification potential, AP; (c) eutrophication potential, EP; (d) photochemical potential, POCP.
Energies 15 09586 g002
Figure 3. Impact comparison of baseline with scenario A and B: (a) GWP 100a (kg CO2-eq); (b) AP (kg SO2-eq); (c) EP (kg PO4-eq); (d) POCP (kg C2H4-eq).
Energies 15 09586 g003
Figure 4. NPV, IRR and ROI for S1, S2 and S3.
Energies 15 09586 g004
Table 1. Summary of biogas plant scenarios.
ScenariosType of
Digestion
FeedstockVolume of AD Reactor (m3)VS (%)Reference
S1Mono-digestionCow manure18508.5[31]
S2Co-digestionMaize silage
Cow manure
137510.6
S3Co-digestionCow manure
Feed waste
Sewage sludge
Returned dairy products
60010.99[32]
Table 2. Typical factors for the estimation of project fixed capital cost [47].
FactorsValue
FPiping0.30
FInstrumentation0.15
FElectrical0.10
FBuildings, process0.10
FStorages0.10
FContractor0.05 or none (for small plant project)
FContingency0.05
Table 3. Environmental impact with each MWh of electricity produced.
Impact CategoryUnitS1S2S3
Acidificationkg SO2 eq0.810.920.48
Eutrophicationkg PO4 eq0.070.110.04
Global warming (GWP100a)kg CO2 eq285.60126.001125.55
Photochemical oxidationkg C2H4 eq0.07−0.010.25
Table 4. Summary of Economic Parameters calculated for each scenario.
ParameterUnitS1S2S3
PCEMYR (x103)2,526,148.682,093,702.191,212,269.47
CAPEXMYR4,820,001.804,025,381.392,405,748.76
OPEXMYR/year226,819.12302,803.90137,103.78
MYR/MWh1021.593064.833491.82
RevenueMYR/year154,716.87414,658.22504,094.07
MYR/MWh3481.5811,988.4811,188.30
Net ProfitMYR/year−72,102.25111,854.31366,990.28
MYR/MWh2459.998923.667696.48
SPPyearsNA35.996.56
NPVMillion MYR−5.54−2.901.28
IRR%NA−615
ROI%−1314
Publisher’s Note: MDPI stays neutral with regard to jurisdictional claims in published maps and institutional affiliations.

