1. Introduction
The rooftops of residential and commercial buildings provide some of the best locations for solar system installation, as they are exposed to abundant sunlight, are usually secure, and the system can be installed close to the end user. Yu Ping et al. [
1] assessed rooftop photovoltaics in Nanjing, China. They concluded that total generation from rooftop photovoltaics couldmeet 20% of the residential electricity demand, and the economic, environmental, and social benefits of rooftop photovoltaics can be far-reaching. Solar photovoltaic plants installed on rooftops require a support structure to keep these structures in place against wind loading. This support structure is usually a concrete counterweight. The cost of this concrete counterweight is a significant portion of the overall plant cost. Since most industrial roofs are pre-fabricated and have a minimum load-bearing capacity, reducing this counterweight has been a design challenge. Due to their large surface area, wind loading is critical for solar photovoltaic plants. Damage to PV plants due to wind loading has been reported from across the globe. Various factors that influence the effect of wind on PV panels may include the direction of the wind, the projected surface area of the panels, wind speed, ground clearance, and inter-row spacing between multiple PV arrays. It is very important to analyze the effects of wind during the design phase to avoid such incidents. Studies have found that the sheltering effect of adjacent PV rows can help reduce the impact of wind. Attempts have been made to estimate wind loads based on IBC and ASCE recommendations for minimum design load on a building, but the unique configuration of PV plants suggests that the loads estimated based on these codes are either higher or lower than the actual load [
2]. To estimate wind loading on solar panels, wind tunnel testing has been practiced since the 1980s. Several studies have been carried out commercially and in labs, but the results of only a few have been published. Radu et al. [
3] studied the sheltering effect of the building boundary wall on the last row of PV panels installed on a five-story building using wind tunnel testing and observeda reduction in mean force coefficients. Peterka et al. [
4] conducted several wind tunnel tests and studied the sheltering effect of adjacent rows and different types of wind barriers. Maffei et al. [
5] studied the impact of row spacing in solar panels using wind tunnel testing on industrial flatroof buildings. Chou et al. [
6] examined the wind loads on a solar panel at high tilt angles. Ginger et al. [
7] calculated the wind loads for designing ground-mounted solarpanel arrays. Wang et al. [
8] examined the flow patternon the solar arrays mounted on a flatroof building facing the wind from two normal directions. Marwood et al. [
9] used wind tunnel testing to study the importance of vortex shedding and the turbulence of wind flow on solar arrays. Aly et al. [
10] studied wind loading using tunnel testing forsolar panels mounted on sloped residential roofs. Erwin et al. and Geurts et al. [
11,
12] studied full-scale testing of wind impact on solar panels. Although wind tunnel testing maybe used to analyze the effects of wind, it mightcost time and money, even if only a few iterations are to be carried out.
Computational Fluid Dynamics (CFD) can be utilized to estimate the effects of wind on solar photovoltaic arrays with a good degree of accuracy and has been utilized to study wind effects on solar panels. CFD has been utilized by researchers to study wind effects on solar panels. Shademan et al. [
13] conducted CFD simulations to estimate wind loads on an array of solar panels at different azimuthal inclination angles. Warsido et al. [
14] conducted boundary layer wind tunnel tests to investigate the influence of different spacing parameters on the wind loading of rooftop and ground-mounted solar arrays. Ghosh et al. [
15] conducted a numerical simulation of the wind effect on a rooftop solar array and investigated the impact of wind on rooftop solar arrays using computational fluid dynamics. Optimizing different design parameters using these tools is difficult, as the time required for CFD simulation by varying different parameters is tremendous. Many optimization methods are used, such asthe Genetic Algorithm, response surface method, ant colony method, etc. Nagadurga et al. [
16] used a chip optimization algorithm to enhancethe global maximum power point of solar photovoltaic strings under partial shading conditions. Genetic algorithm (GA)-based optimization methods have gained much popularity in the recent past. Genetic algorithm is mostly used in configuration or layout work in many fields to find the optimized configuration. It is (i) simple to use, (ii) it finds the best solution with less computational effort and timewhen a large solution space is present, and (iii) it tries to find the global optimum and not the local. It has become a very useful tool for aerodynamic design problems. CFD can be coupled easily with GAs to reach an optimum configuration by saving computational time and effort. Vatandas et al. [
17] used a genetic algorithm in conjunction with computational fluid dynamics to optimize the design of a transonic wing by using parallel processing. Dina et al. [
18] used genetic algorithms with CFD to optimize airfoils in the incompressible regime. The pressure distribution lift and drag coefficients were calculated. Doyle et al. [
19] carried out aerodynamic optimization for freight trucks using a genetic algorithm with computational fluid dynamics. Florez et al. [
20] proposed a method based on a genetic algorithm for reconfiguration and energy impact analysis of different PV arrays under different environmental conditions. Meerimatha et al. [
21] investigated the effect of partial shading on the power output by reconfiguring PV arrays using a Genetic algorithm. Rajan et al. [
22] studied PV array reconfiguration using the concept of standard deviation and GA. Akram et al. [
23] concluded that the GA and Class Shape Transformation techniques couldbe very efficient for optimizingairfoil shapes. Using these techniques, a reduction in drag coefficients of 10% and 12% was achieved, while the lift-to-drag ratios improved by 7.4% and 15.9% for two different airfoils.
One of the most important variables for evaluating the efficiency of a photovoltaic plant is the “performance ratio”. The performance ratio is the ratio of the actual energy output from a photovoltaic plant and its theoretically possible energy outputs. Basically, the performance ratio shows the proportion of energy available for export to the grid after deducting energy losses. This implies that the closer the PR value is to 100%, the more efficient the plant is operating. In real life, 100% PR value cannot be achieved since some losses are unavoidable, and there will always be losses during any stage of PV plant electricity production. However, high-performing photovoltaic plants can reach a performance ratio of up to 80%. Some of the major factors that result in losses during electricity production from a PV plant may include losses due to shading, soiling, temperature, transformer losses, inverter loses, and panel degradation. Sharma et al. [
24] analyzed the performance ratio of a 1MW grid-connected photovoltaic system installed in Rajasthan (India) for one year and found that the average performance ratio for the plant was 0.79 for the simulation carried out using Pvsyst, while the performance ratio for the actual project data was 0.78. Decker et al. [
25] studied the performance of 170 grid-connected PV plants in northern Germany and analyzed the yield and performance ratio. Their study found that a well-designed rooftop system may obtain a final yield of 750 to 850 kWh. Typical annual performance ratios ranged between 60% and 79% due to array and system losses. W.G.J.H.M. van Reich et al. [
26] studied the development of performance ratios over the past three decades. Their study shows that the values have improved continuously and evolved from 50% to 75% in the late 1980s. The jump was more drastic in the 1990s, with performance ratios improving from 70% to 80% in ten years. Ghabuzyan et al. [
27] studied the thermal effect on photovoltaic array performance and concluded that wind velocity plays an important role in estimating PV performance. The efficiency of PV increases linearly with increased wind velocity. Wind direction, however, has little to no effect on array temperature and performance. CFD simulations showed that temperature along the array surface can vary significantly at lower wind speeds and that this variability decreases at higher wind speeds.
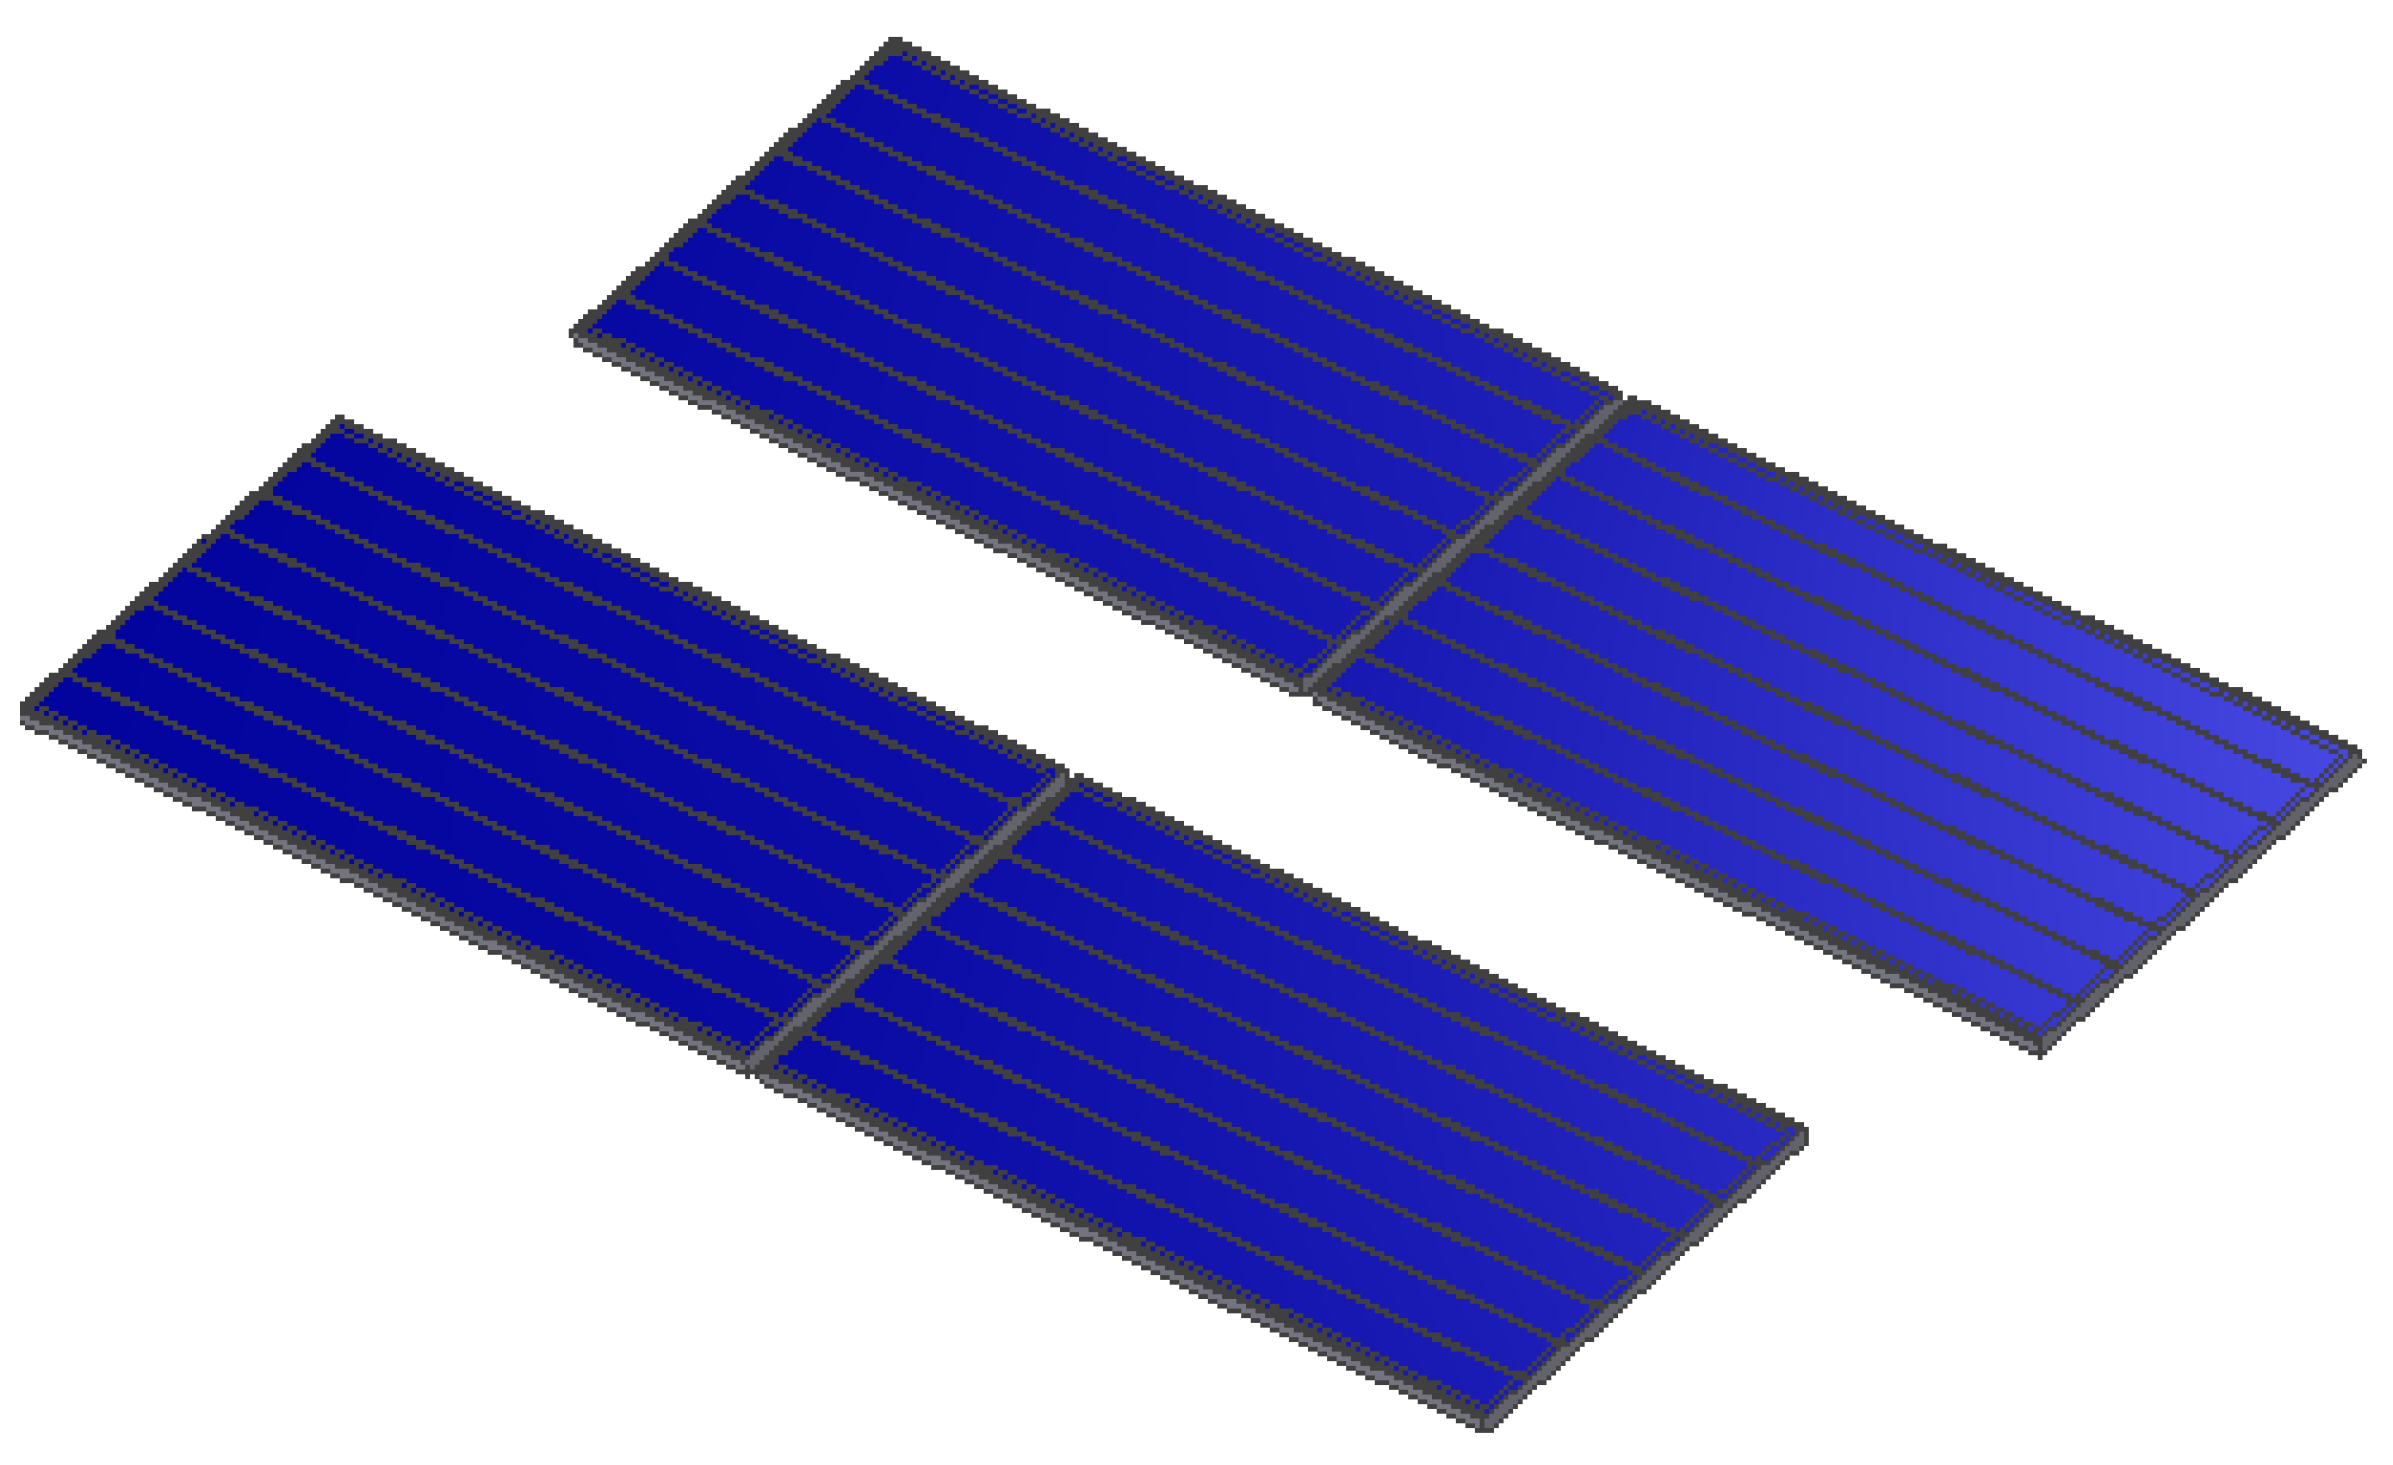
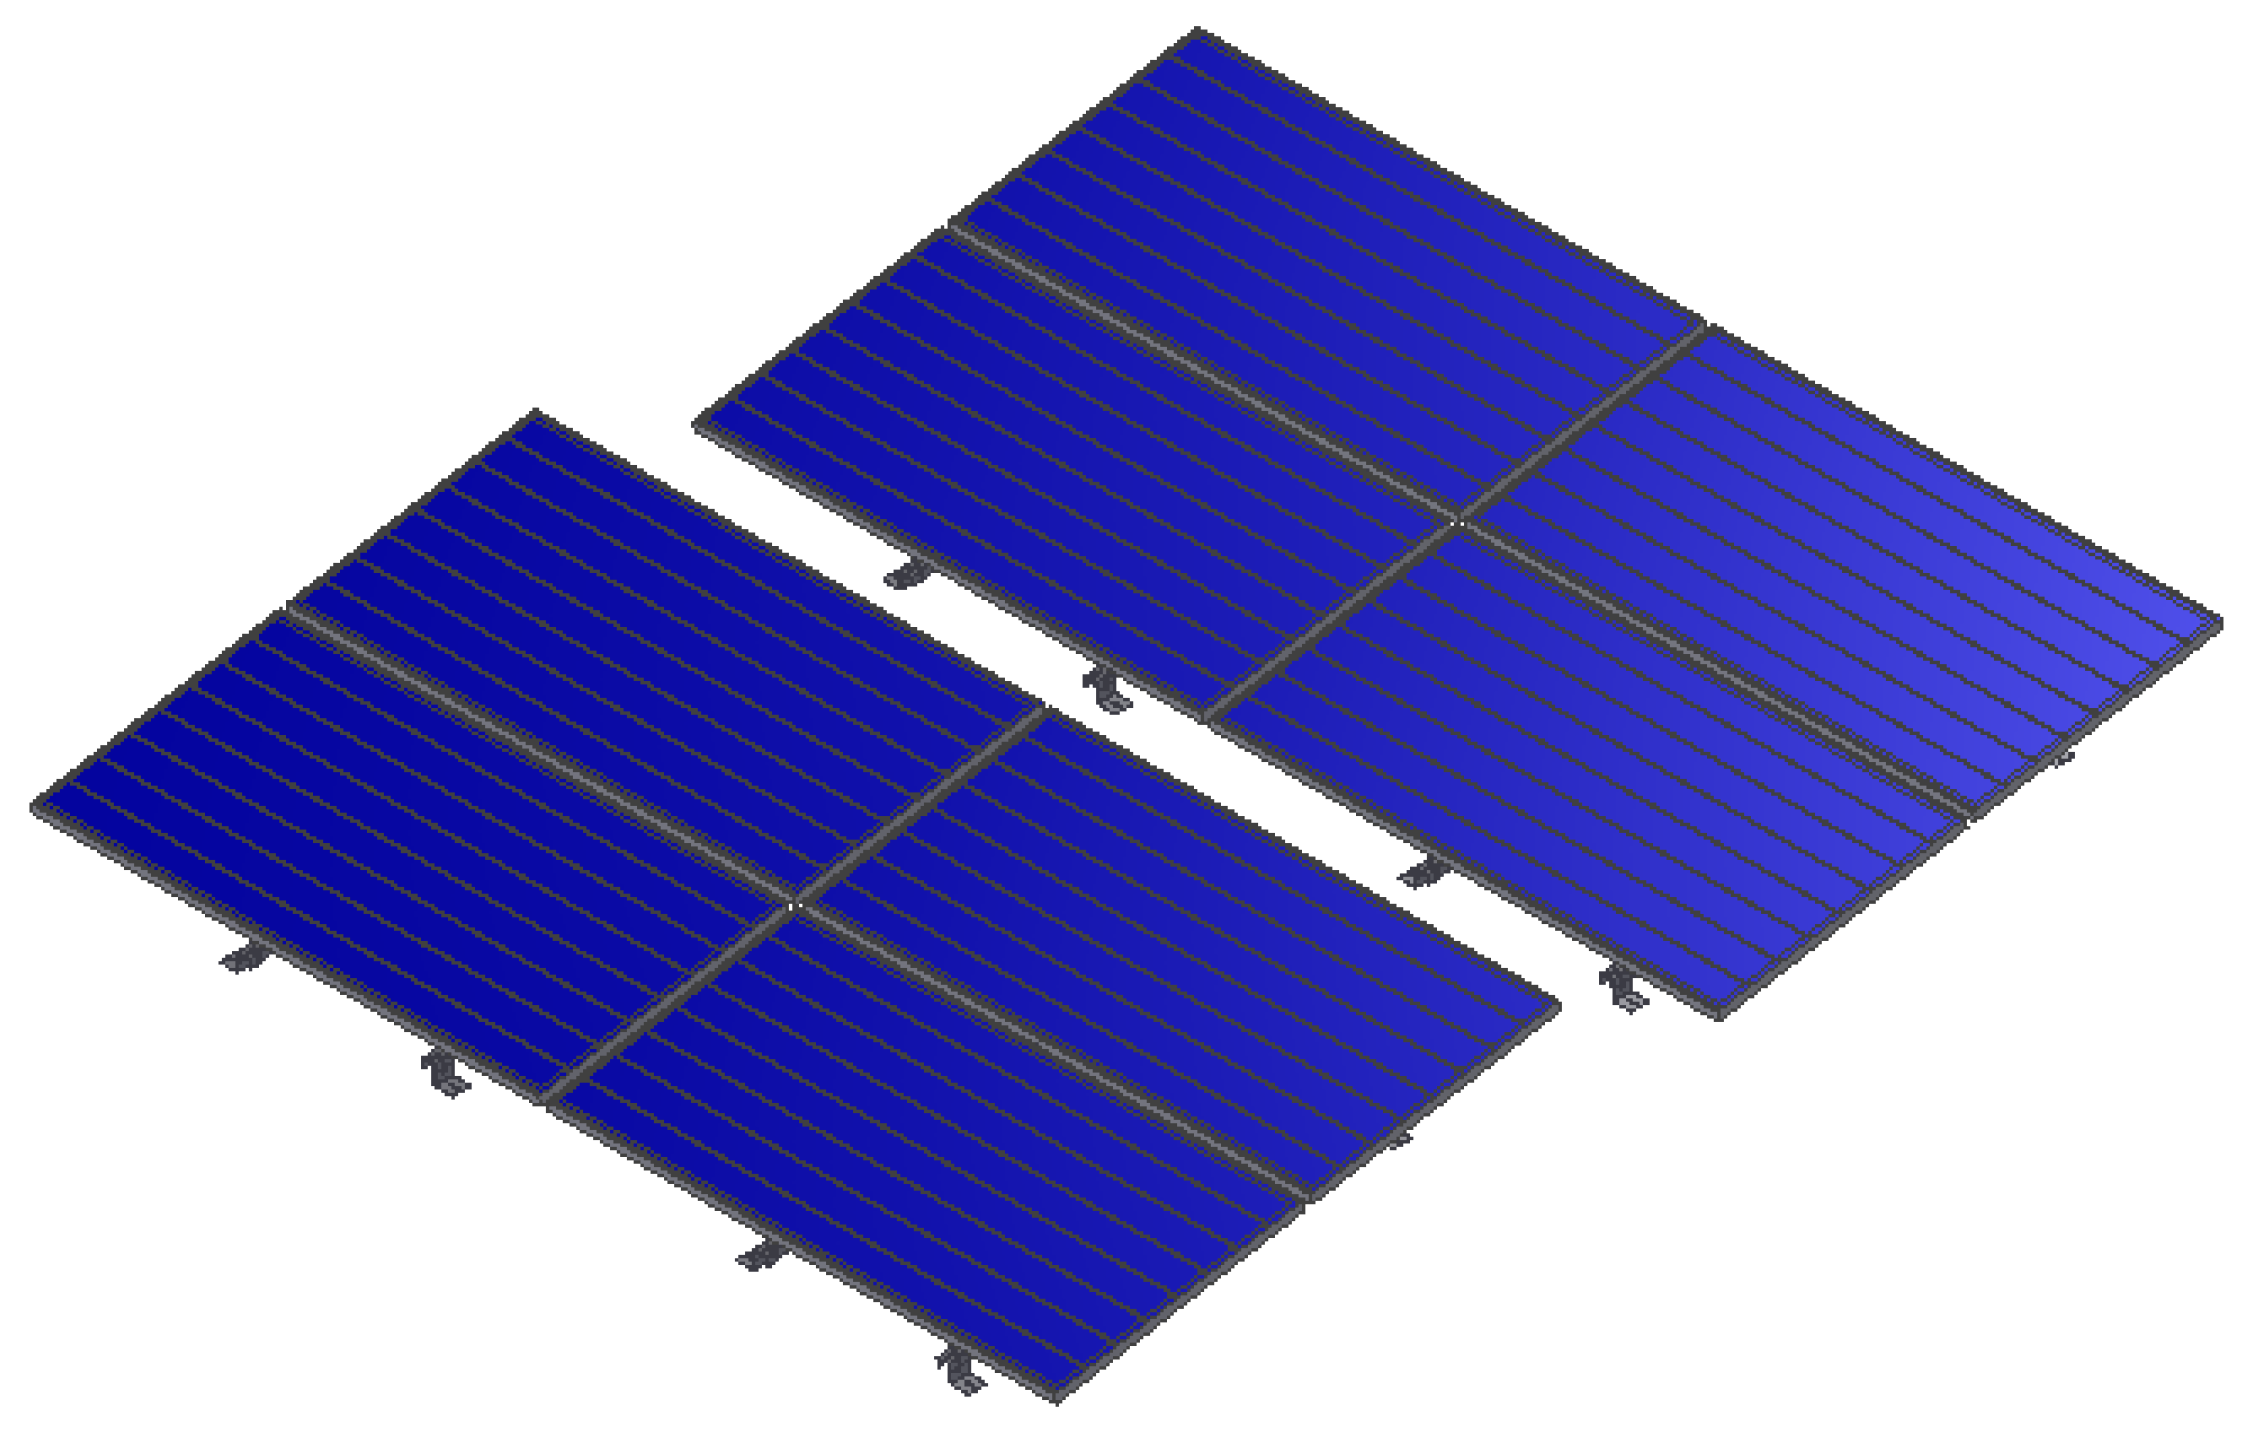
This study described a design problem including 2-D aerodynamic optimization of two rows of solar panels. The tilt angle of each row and the pitch distance between these two rows wereparameterized. Three different configurations, i.e., single-row landscape, two-row landscape, and triple-row landscape, were analyzed in this research. Since output production from a photovoltaic plant is linked to the tilt angle of solar arrays as well as the shading effect produced by adjacent rows on each other, only those combinations with a performance ratio >80%, estimated using PVSyst, have beenconsidered in this paper. Numerical Simulations werecarried out using ANSYS Fluent fitness assessment [
28].
2. Proposed Methodology
A novel methodology is proposed that combines the performance ratio with the optimization method (Genetic Algorithm) and CFD to optimize the lift force on the solar panel arrays by considering the tilt angle andpitch between rows to reduce the counterweight onthe pre-fabricated roofs. Although many researchers haveworked on solar photovoltaic arrays, they have worked on the limitingfactors. No concrete effort has been done in the literature combining these factors as formulated in this methodology.
2.1. Problem Formulation
This research aims to find theoptimum configuration of two rows of PV solar panel arrays with minimum lift force using a genetic algorithm in conjunction with computational fluid dynamics. The tilt angle of these two rows of solar panels and the pitch between them wereparameterized for optimization purposes, as given in Equation (2). To find the optimum configuration of PV panel arrays for minimal aerodynamic lift by varying the pitch between rows and the tilt angle of each row, the wind lift force needs to be minimized. The generic formula for wind lift force calculation is given in Equation (1).
: density of air.
: projected area calculated using Equation (3).
: lift coefficient computed from CFD.
θ1: tilt angle of the first row.
θ2: tilt angle of the second row.
P: pitch between rows.
,: tilt angles limits.
: pitch limits.
2.2. Optimization Process Using Genetic Algorithm
The design problem is finding the configuration of the photovoltaic panel array when the tilt angle of the first and second rows are
and
respectively. Pitch is denoted by
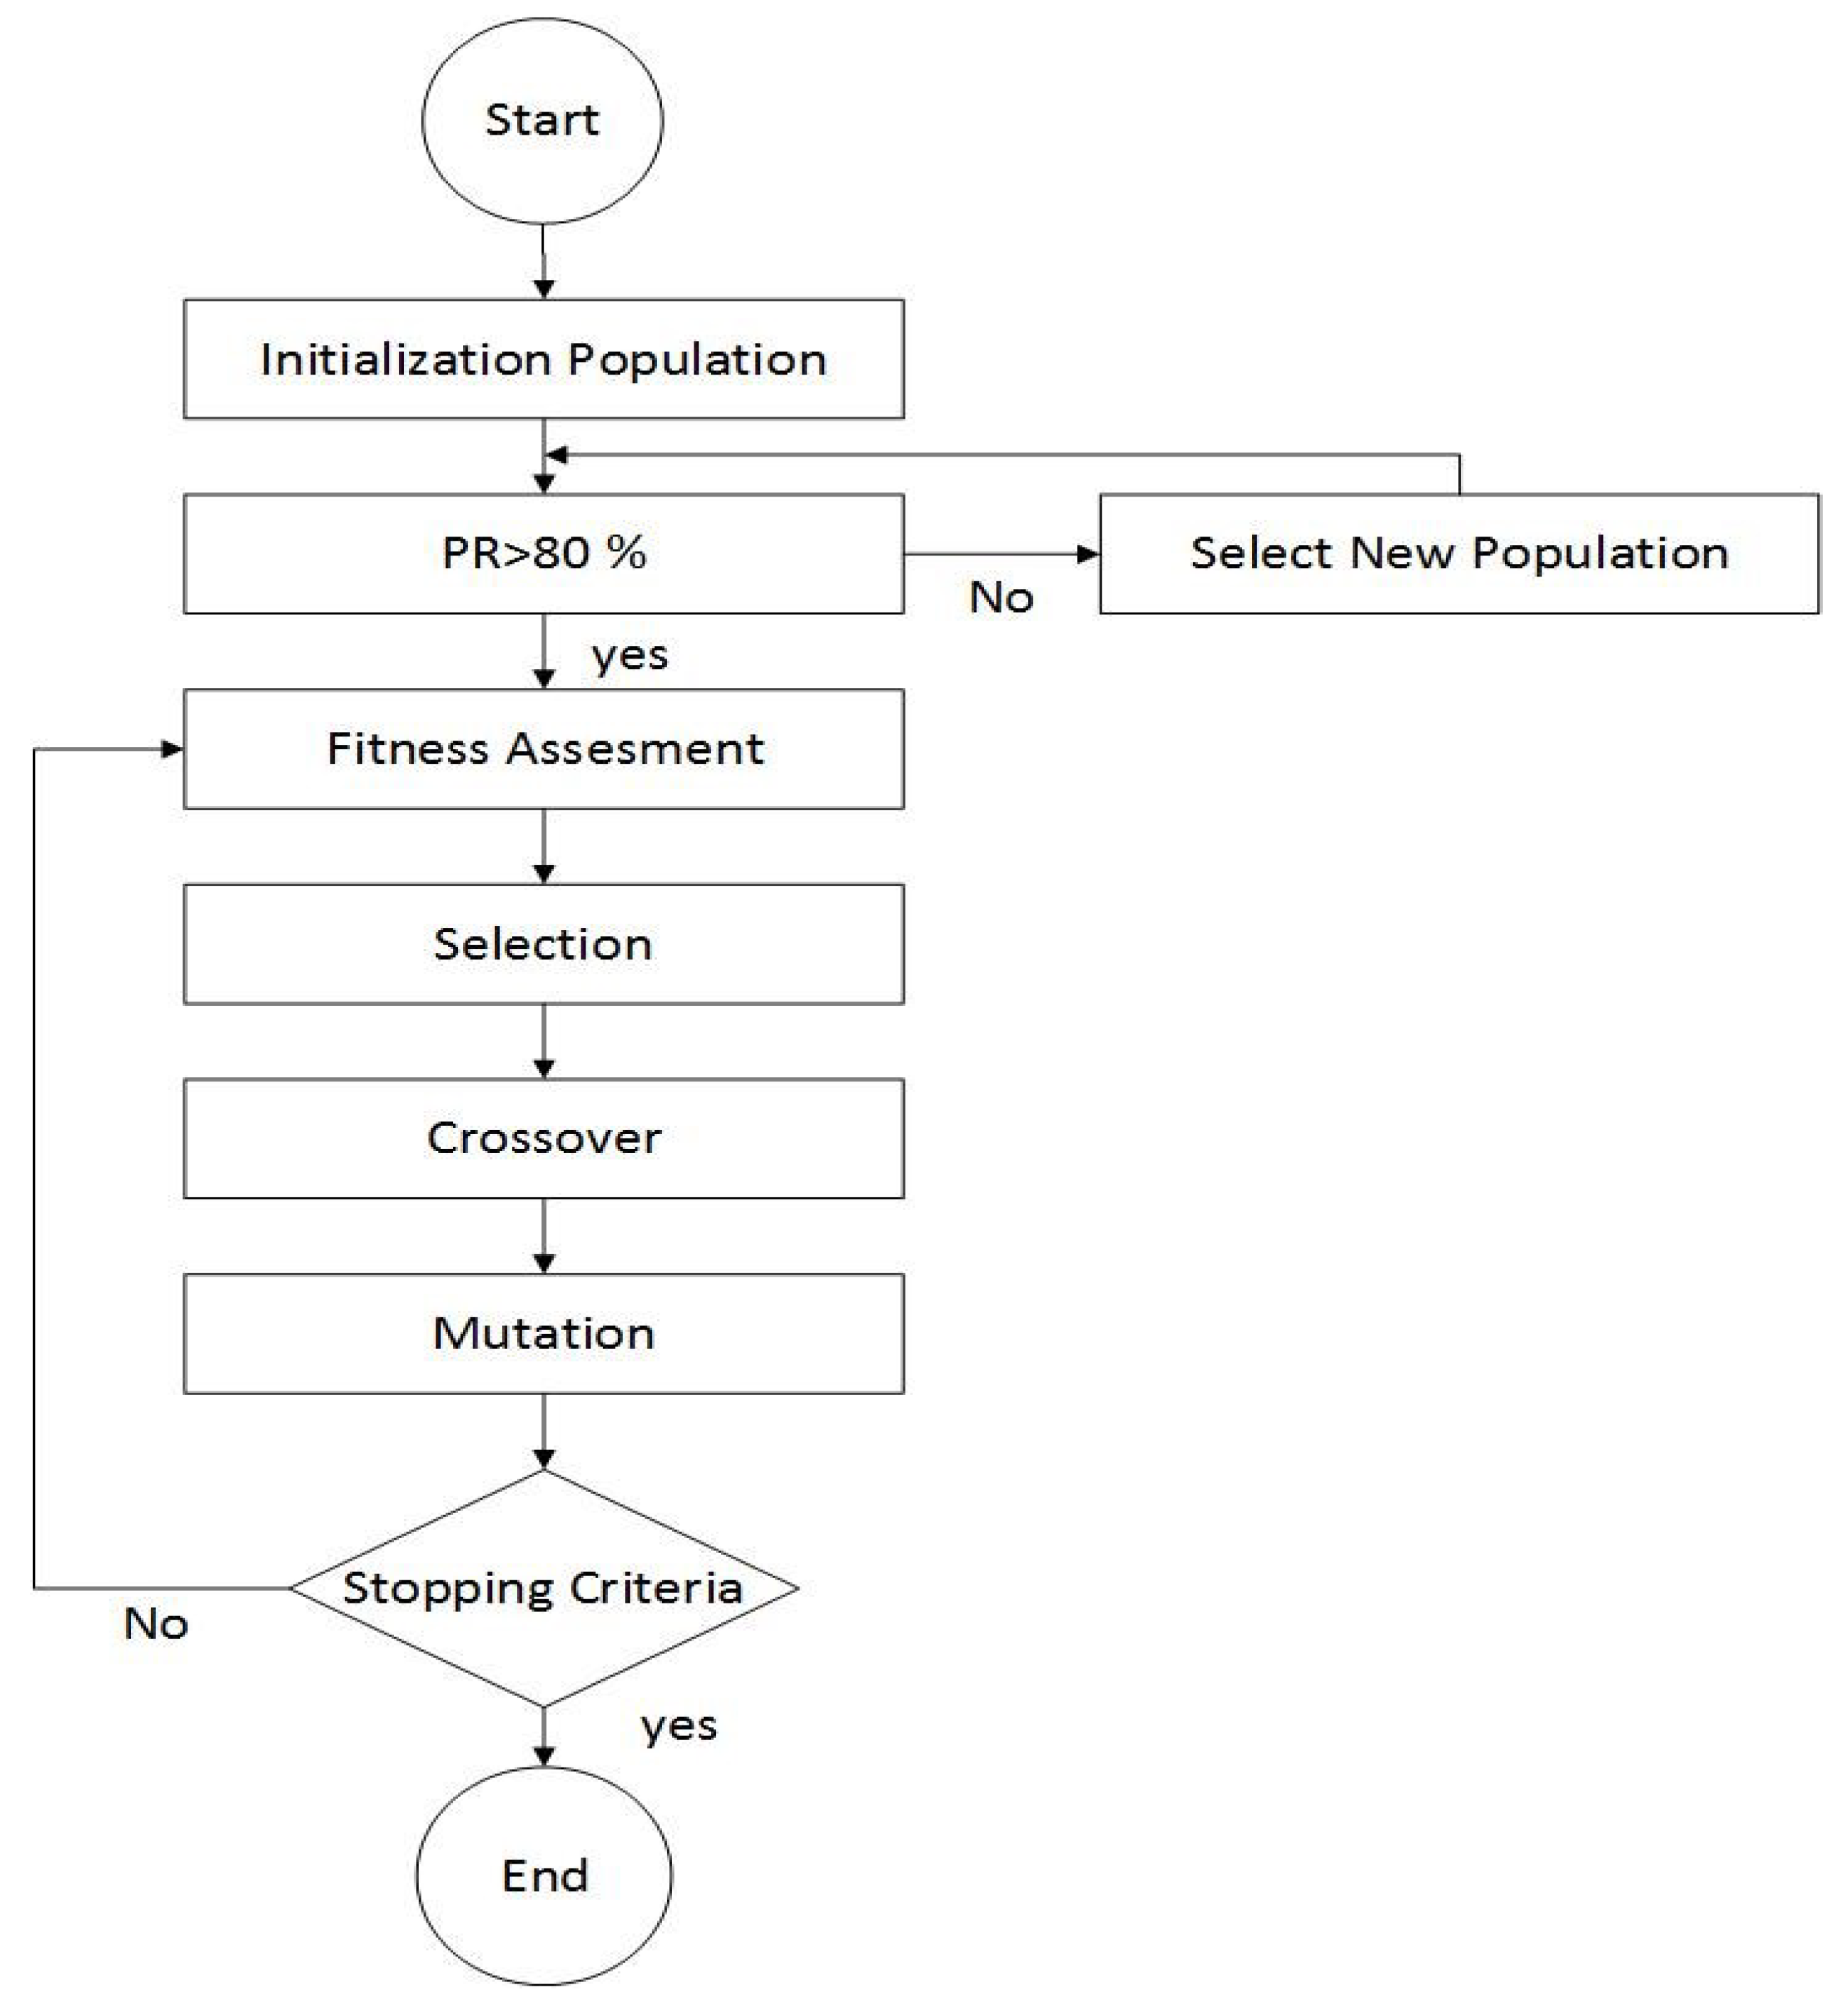
P. It results in the minimum lift force effect when the wind blowing at 33.3 m/s strikes the panels from the back side of the second row. A brief description of the optimization process is given in
Figure 1.
Initialization: Initial population size is assigned for the roof-mounted solar array system. The population contains all combinations of tilt angles for both rows of roof-mounted solar arrays and the pitch between the adjacent rows. These parameters are used to optimize the total wind lift force acting on the arrays.
Performance Ratio Assessment: In the second step of this modified genetic algorithm, the performance ratio of selected individuals is evaluated using PVSyst. Only those individuals with a performance ratio >80 % are allowed to move to the evaluation stage.
Evaluation: In the third stage of this optimization process, the individual’s fitness is calculated. The evaluation process is based on results obtained by CFD software: ANSYS Fluent using the second-order k–e model.
Selection: Once the lift force has been determined using the objective function, the selection process is carried out. In the selection process, individuals arechosen from the current population to enter a mating pool devoted to creating new individuals for the next generation; the chance of a given individual being selected to mate is proportional to theirrelative fitness.
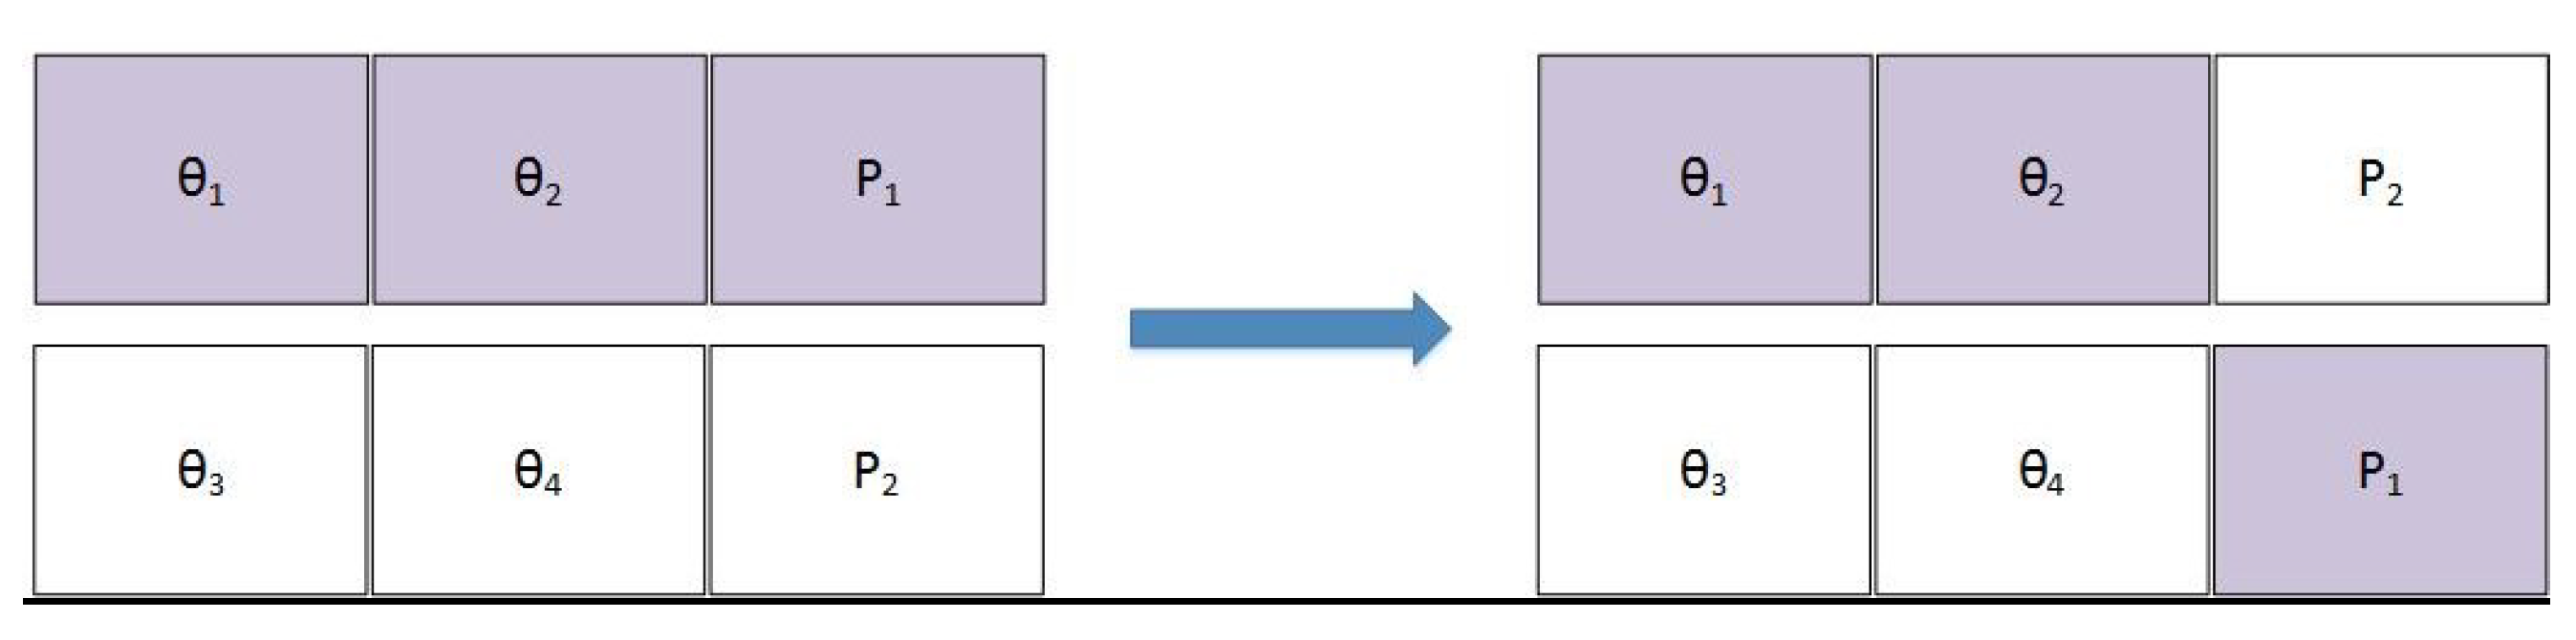
Crossover: Crossover provides valuable information that isshared among the population. It combines the genes of two parent individuals to form two children who may have new and possibly better genetic structures than their parents. One-point crossover was used to create new children. A cut line was generated, as shown in
Figure 2, and every parent part was exchanged with the other parent part to create a new child.
Mutation: Mutation is introduced to guard against premature convergence. The purpose of mutation is to introduce occasional perturbations to the variables to maintain the diversity in the population. To find the optimum lift force configuration in roof-mounted solar array systems, the mutation is also carried out.
Termination: Once a new generation is generated using crossover and mutation techniques, it is re-evaluated based on the fitness function. Termination is carried out after convergence criteria arefulfilled.
2.3. Performance Ratio Calculations
The performance ratio (PR) of a photovoltaic plant is an important parameter used to compare the overall efficiency of photovoltaic plants. PR values account for losses like module degradation, system temperature losses, soiling losses, shading losses, solar inverter, and transmission losses, and are the ratio of actual yield to plant reference yield. The closer the PR value is to 100, the better the plant’s performance. An actual PR value of 100 is not possible since some losses cannot be avoided. The PR value ofPV plants has improved with the improvement in technology over the years. High-performing photovoltaic plants have a performance ratio of around 80%. The performance ratio of photovoltaic plants can be estimated with a good degree of accuracy using commercial software such asPVSyst and Helioscope. For each configuration, a roof-mounted PV plant with two arrays of solar panels is designed using PVSyst. Its performance ratio is evaluatedbased on the given parameters mentioned in
Table 1. Only combinations with a >80% performance ratio are moved onto the fitness assessment stage of GA-based optimization.
2.4. Model
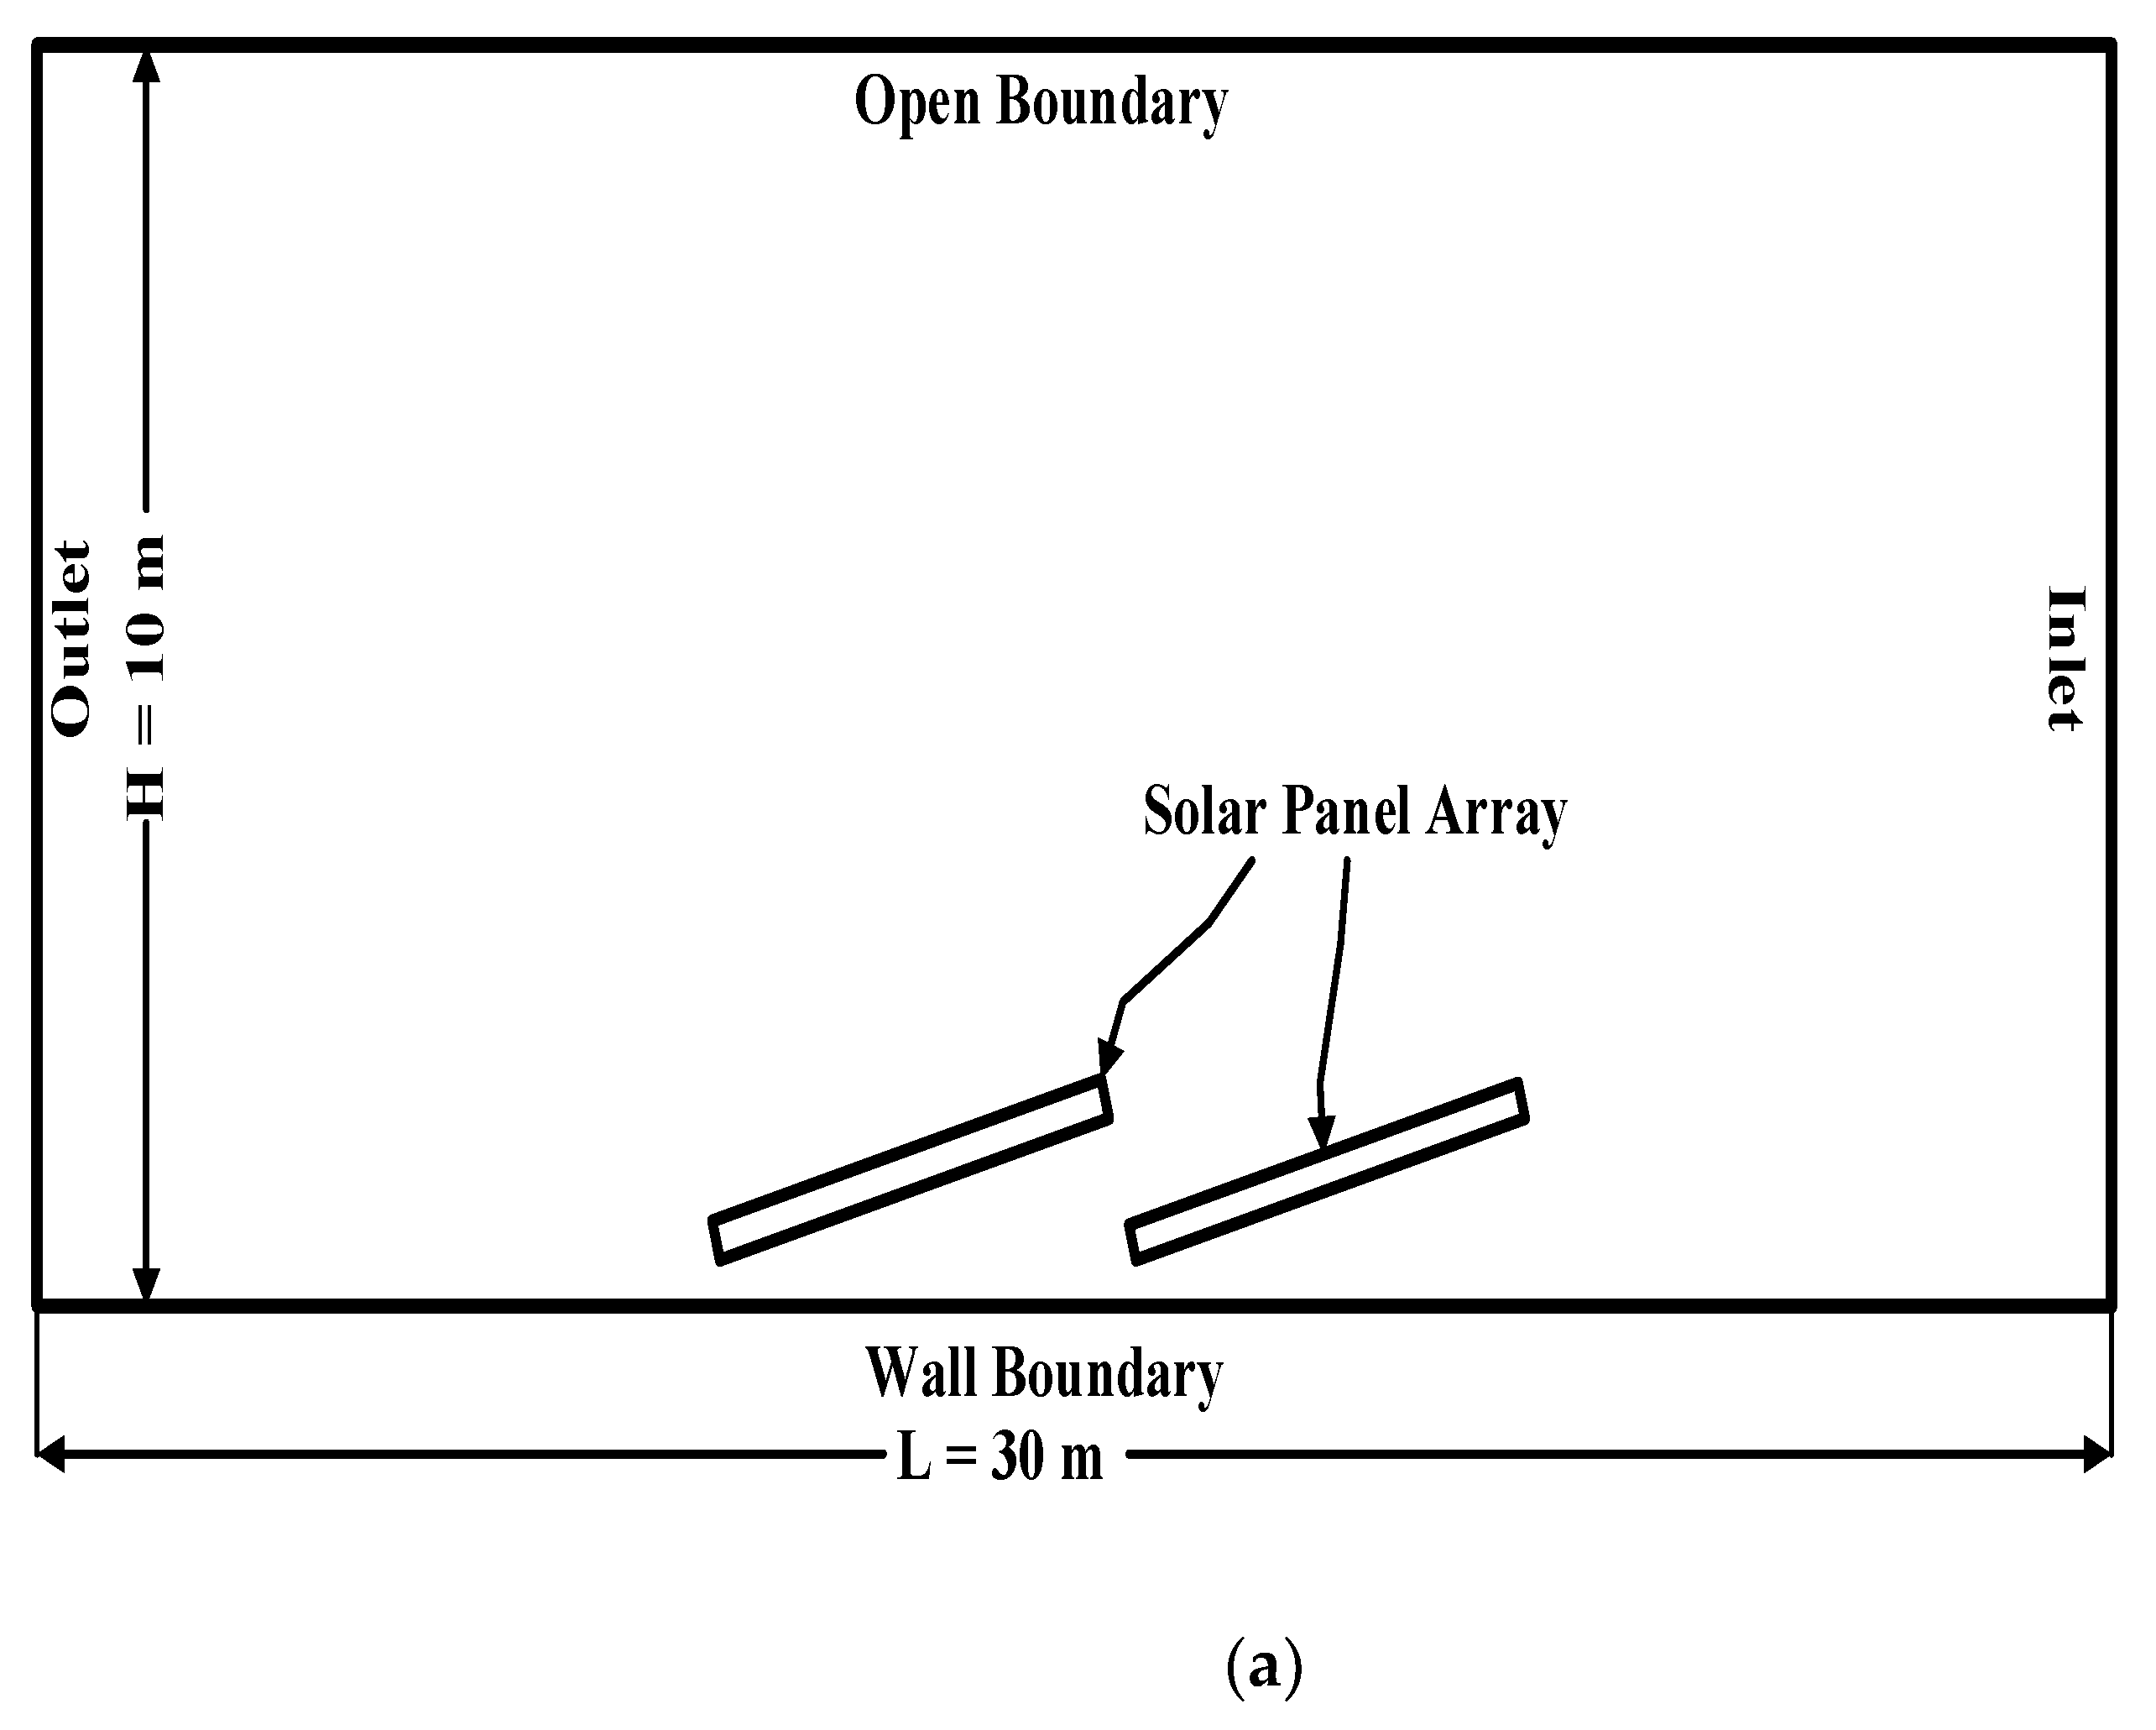
A computational domain of 30 m × 10 m = 300 m
2 was considered, as shown in
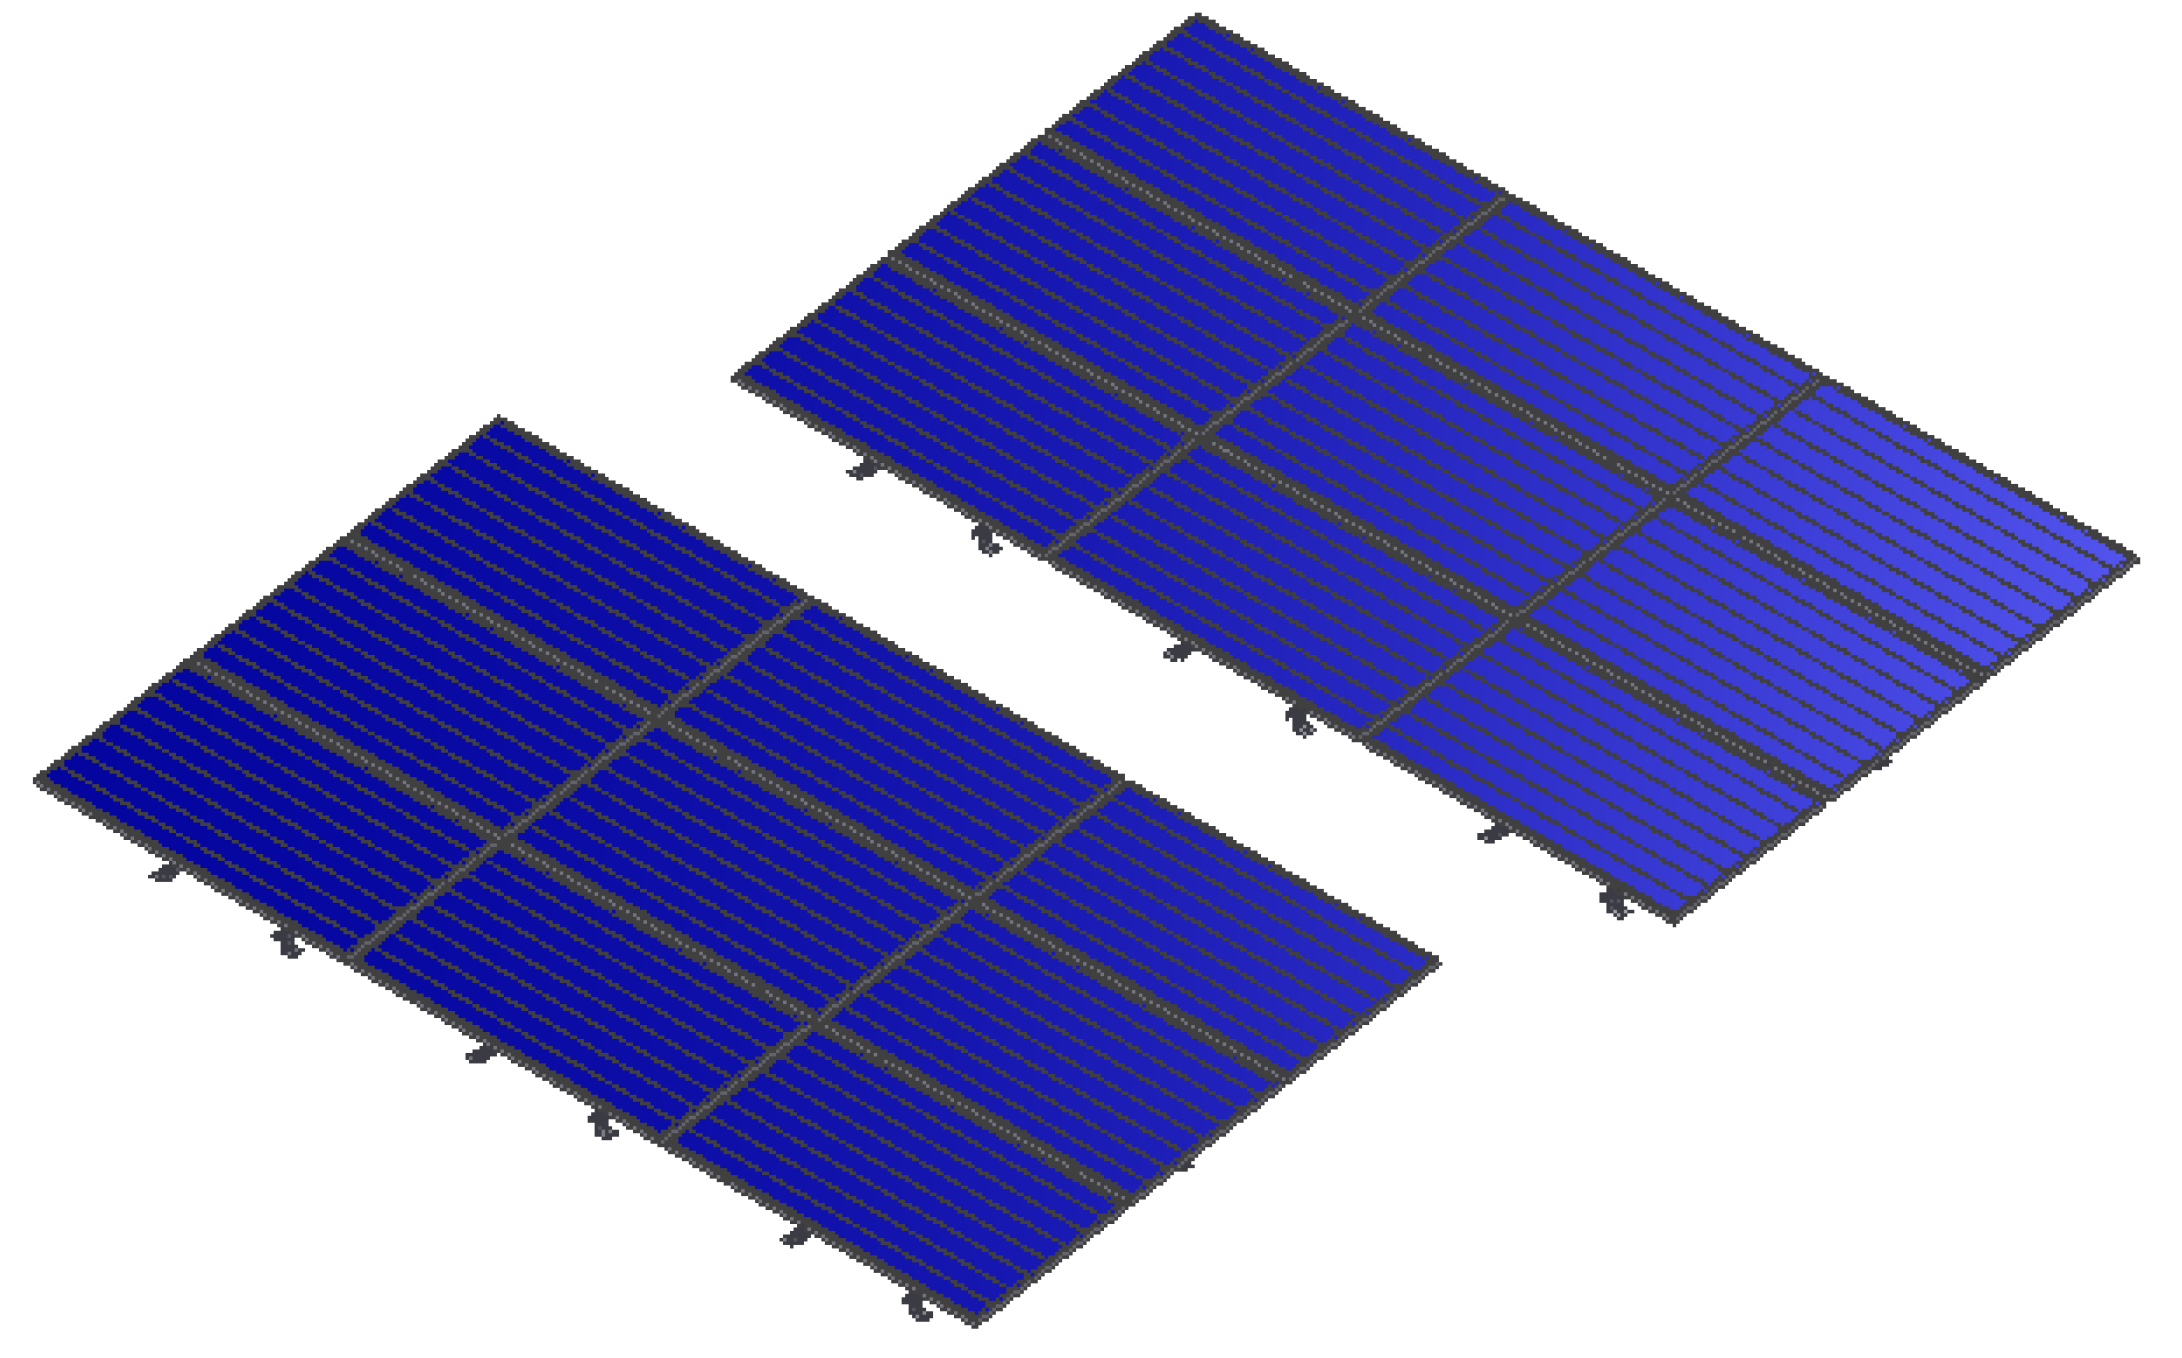
Figure 3a. A 1:1 Scale model was developed using an ANSYS Fluent geometry tool. For each type of configuration, two rows of solar panels wereconsidered in a 2-D domain (
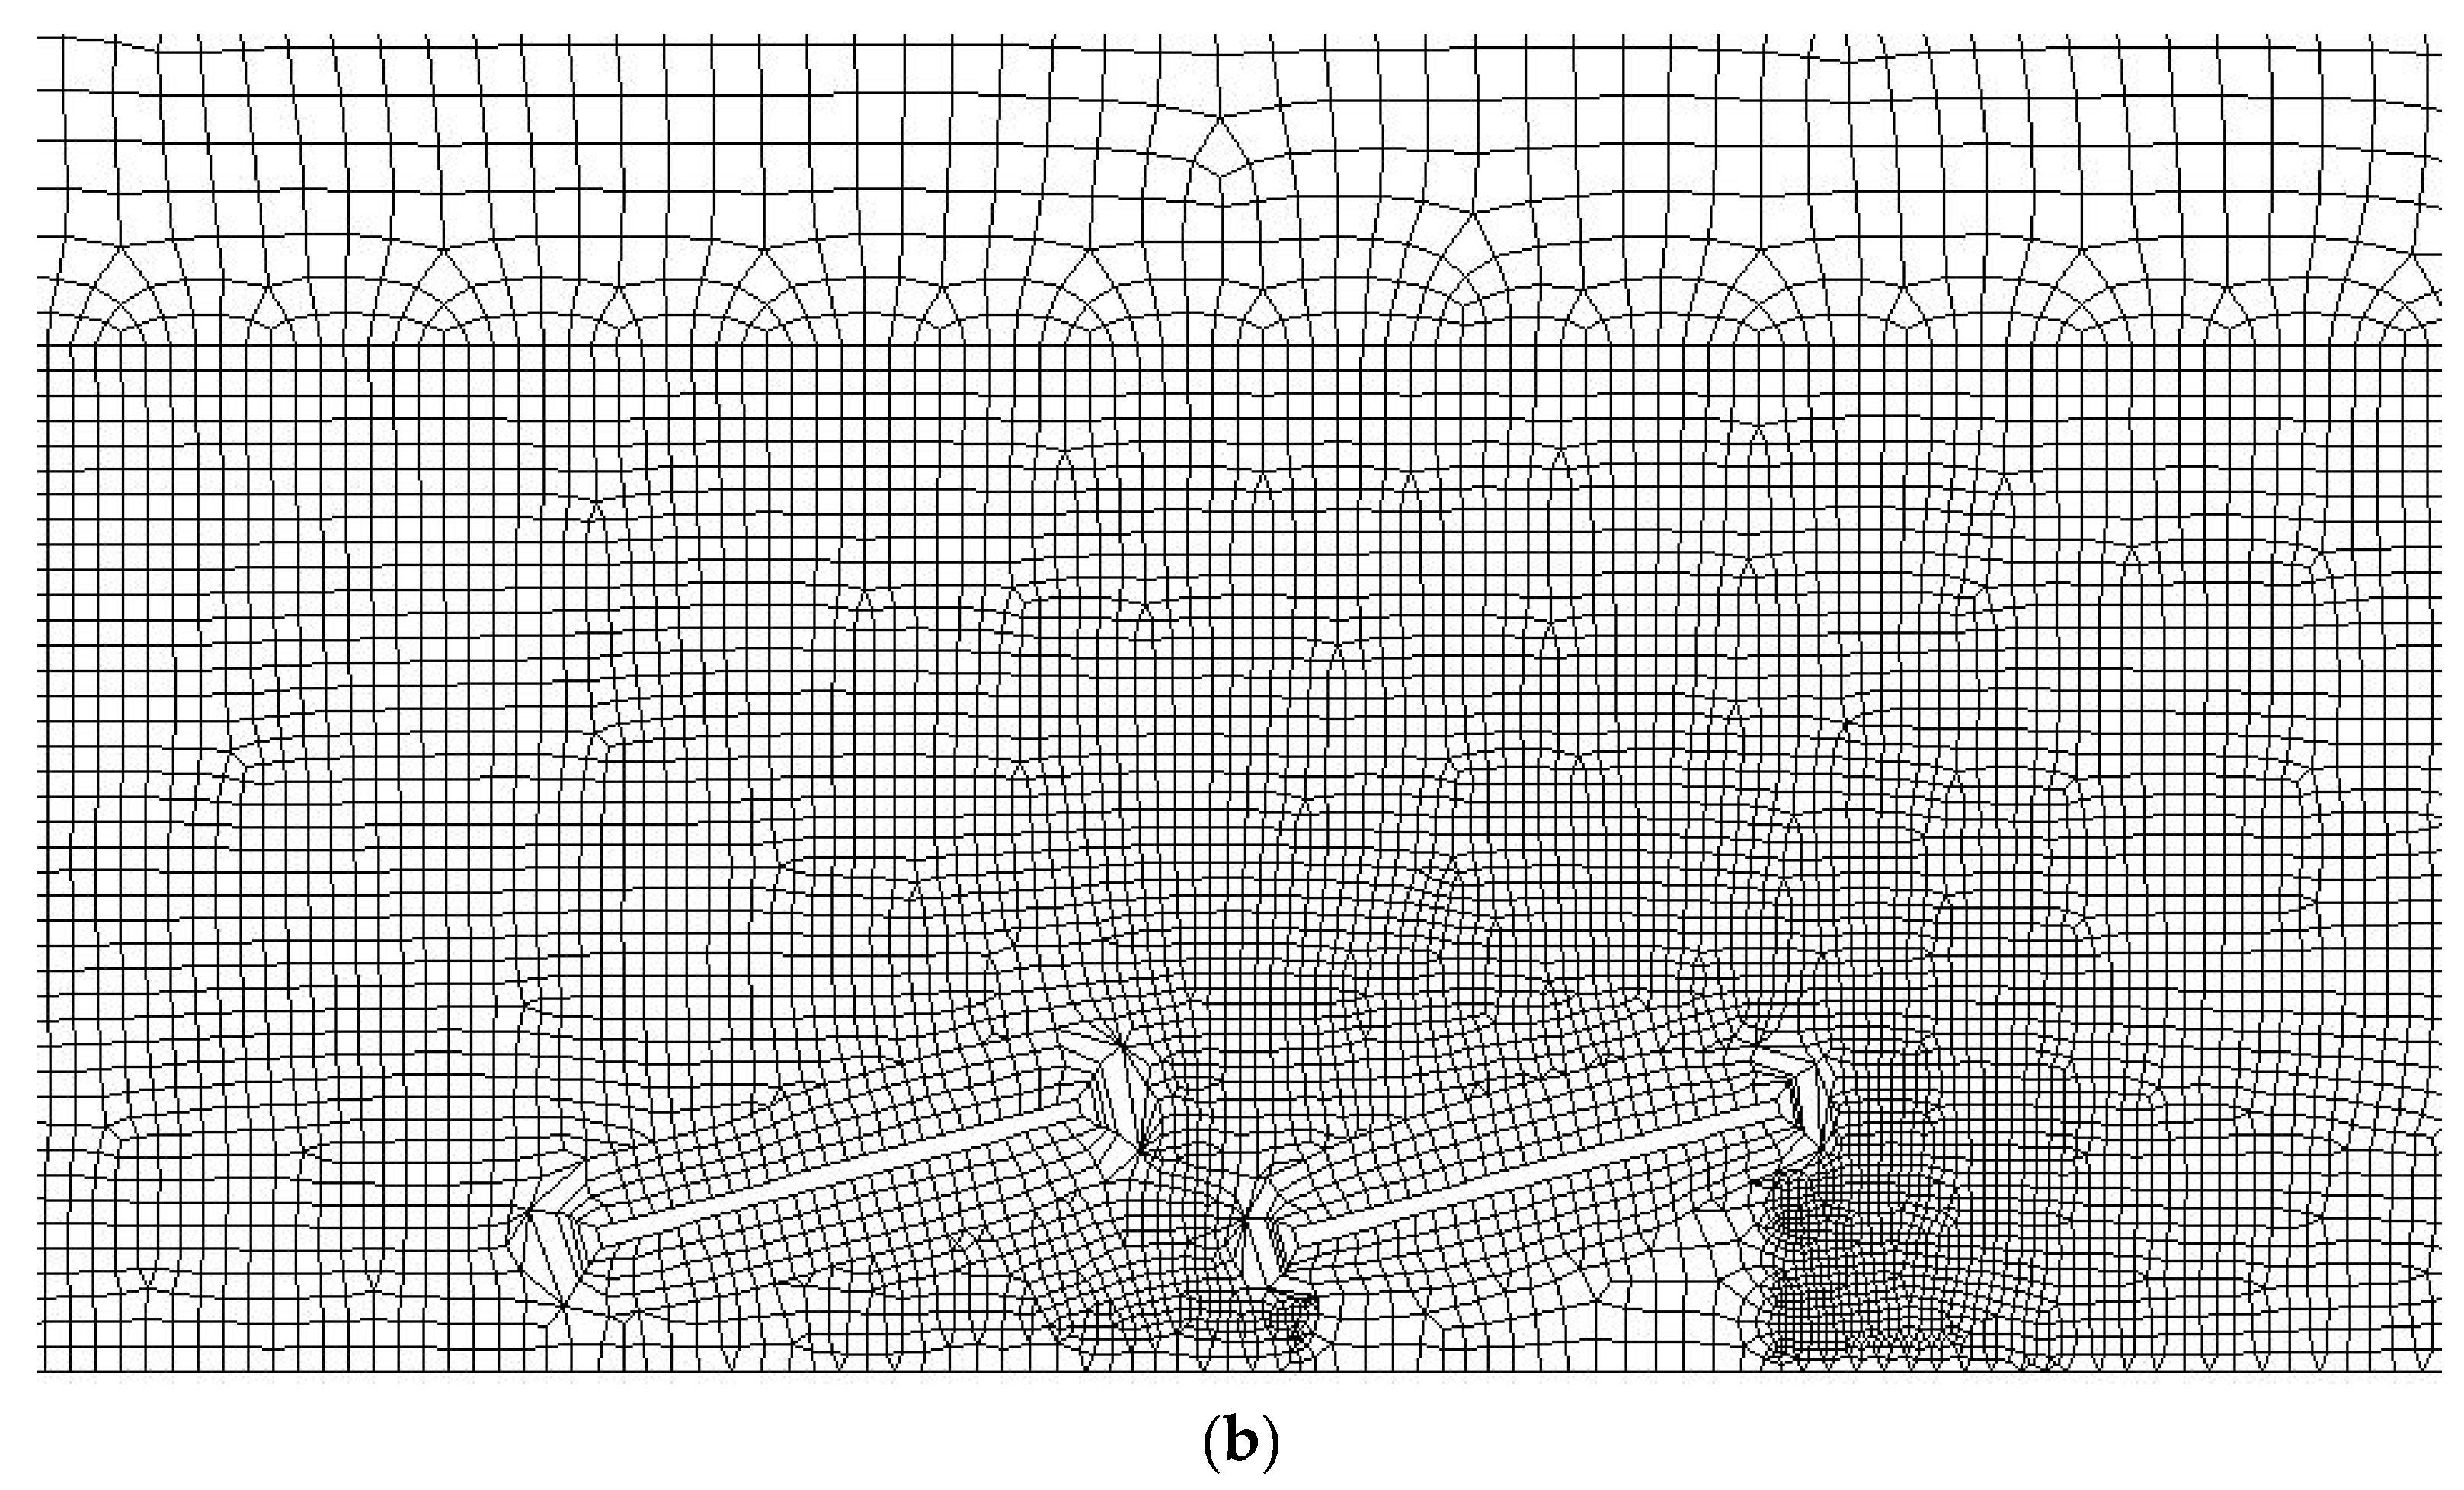
Figure 3a,b). The size of the panels considered was 2 m × 1 m × 40 mm. The parametric design approach was used in which the tilt angle of each row and the pitch between them wereparameterized and couldbe adjusted according to the requirement. Simulations werecarried out using the two-equation k-Ɛ model. The computation domain was subdivided into control volumes for better mesh generation. A multi-zone Quad/Tri mesh was generated. Grid independence study results are presented in
Table 2. Three types of mesh, coarse, medium, and fine, wereused to calculate the lift coefficient. The results formedium and fine mesh wereapproximately the same. Therefore, the medium mesh was used for the final results evaluation. Furthermore, to obtain better results, near-wall treatment was performed around the photovoltaicpanels, and refinement was done in the region of interest, i.e., the area around the solar panel, as shown in
Figure 3b.
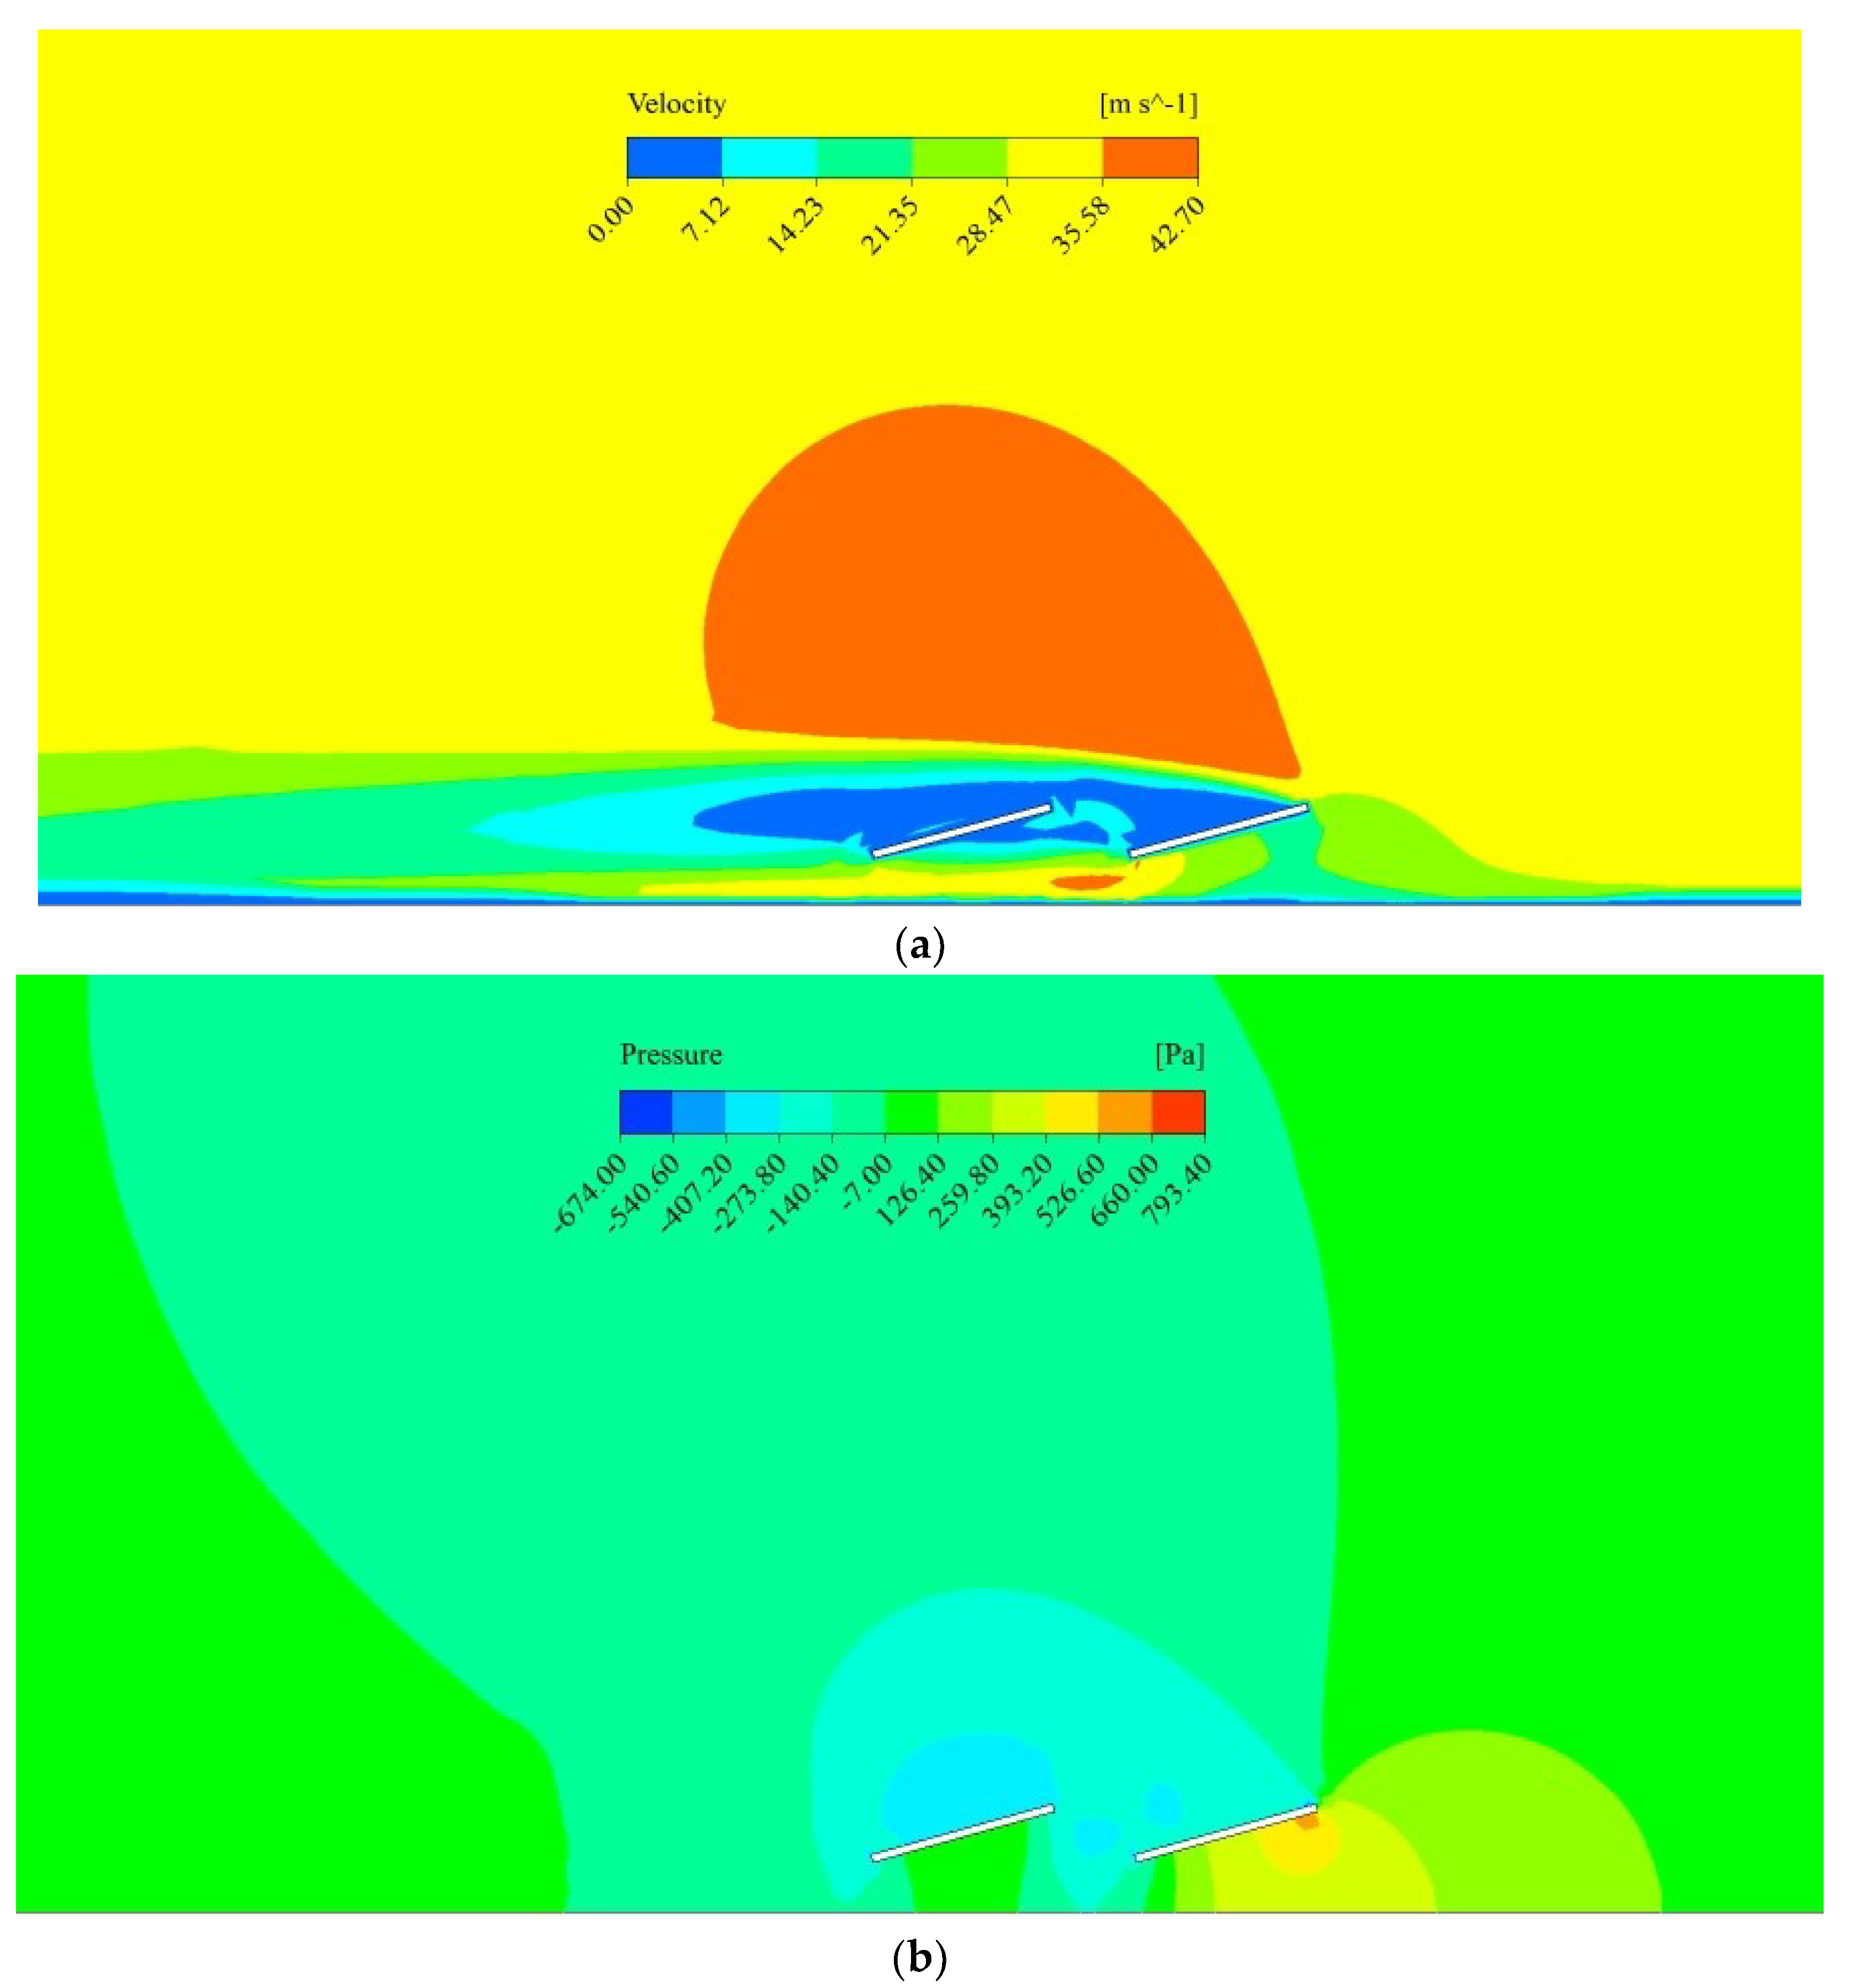
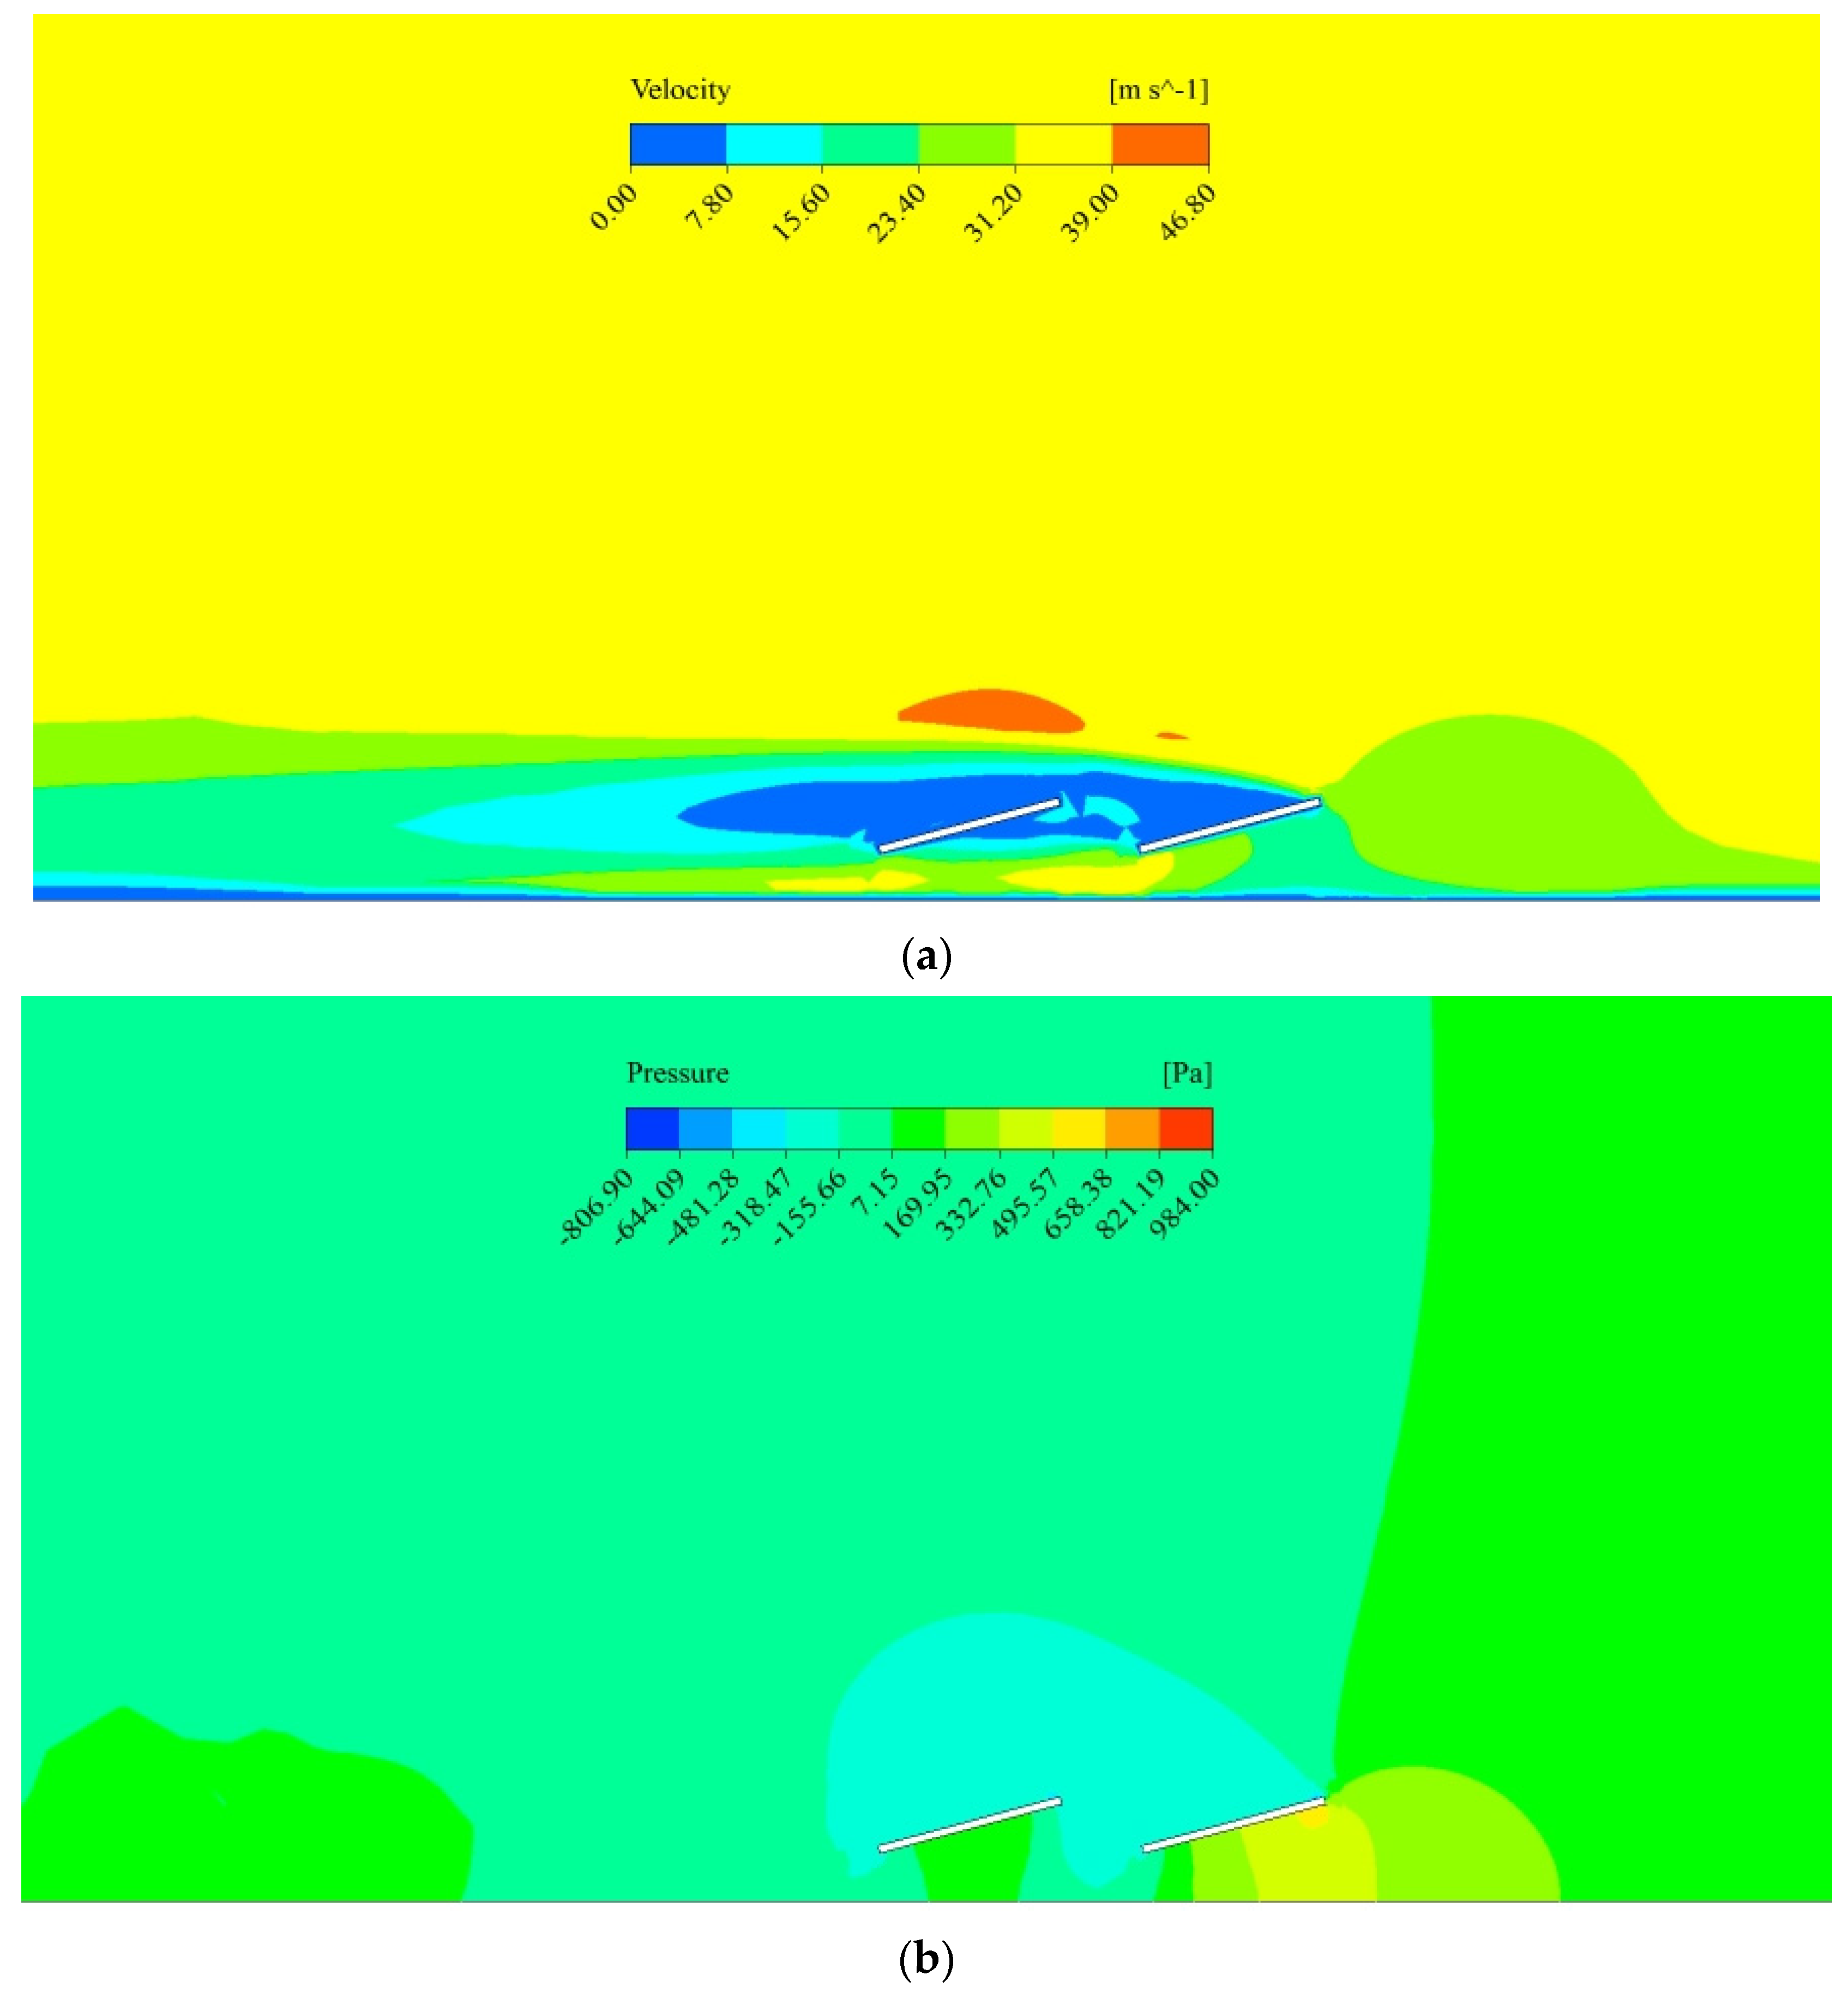
Suitable boundary conditions wereapplied for the wind flow simulation. No slip condition was considered for the bottom wall. On the downwind side, zero relative pressure was specified. On the upwind side, a wind inlet at 33.3 m/s was considered. The sides and top boundaries wereslip walls with zero normal gradients and velocities of all variables. To solve the numerical equations for the k-Ɛmethod, the least square method was used. For pressure–velocity coupling, the Semi-Implicit Method for Pressure-Linked Equation (SIMPLE) was used. Convection and viscous terms of the governing equations weresolved using first-order upwind discretization.
4. Conclusions
Most residential and commercial rooftops are flat, which are the simplest for mounting solar panels with a counterweight to hold the structure in place. Counterweight costs are a significant portion of the overall PV plant’s cost and must be optimized to get a levelized cost of energy production. Moreover, most industrial roofs are pre-fabricated with minimum allowable load capacity;thus, not much counterweight can be placed on top of them. Wind loading is critical in defining the load required to keep the structure in place. Some of the design factors of the structure might influence the wind load, including the tilt angle of the panels and the wind direction.
This research was carried out to find an optimum configuration in which the PV plants could be designed to reduce the impact of wind loading and thus reducethe counterweight required for roof-mounted solar systems. Wind loading can be estimated to a good extent with the help of Computational Fluid Dynamics. Still, due to high computational power requirements and time limitations, optimization is not feasible using CFD alone. In this research, CFD was combined with the GA method to reach an optimum configuration of PV plants. Three cases with three parameters, (the tilt angle of the first row, the tilt angle of the second row, and the pitch) were analyzed in this research. Due to limitations of computational power and time, only two rows of panels in each case were analyzed. Since the output from a PV plant is important, only those combinations of these three parameters were analyzed with a performance ratio >80%. Performance ratio was measured using commercially available software PVSyst, and for acceptable cases, fitness was checked by calculating wind lift force using CFD.
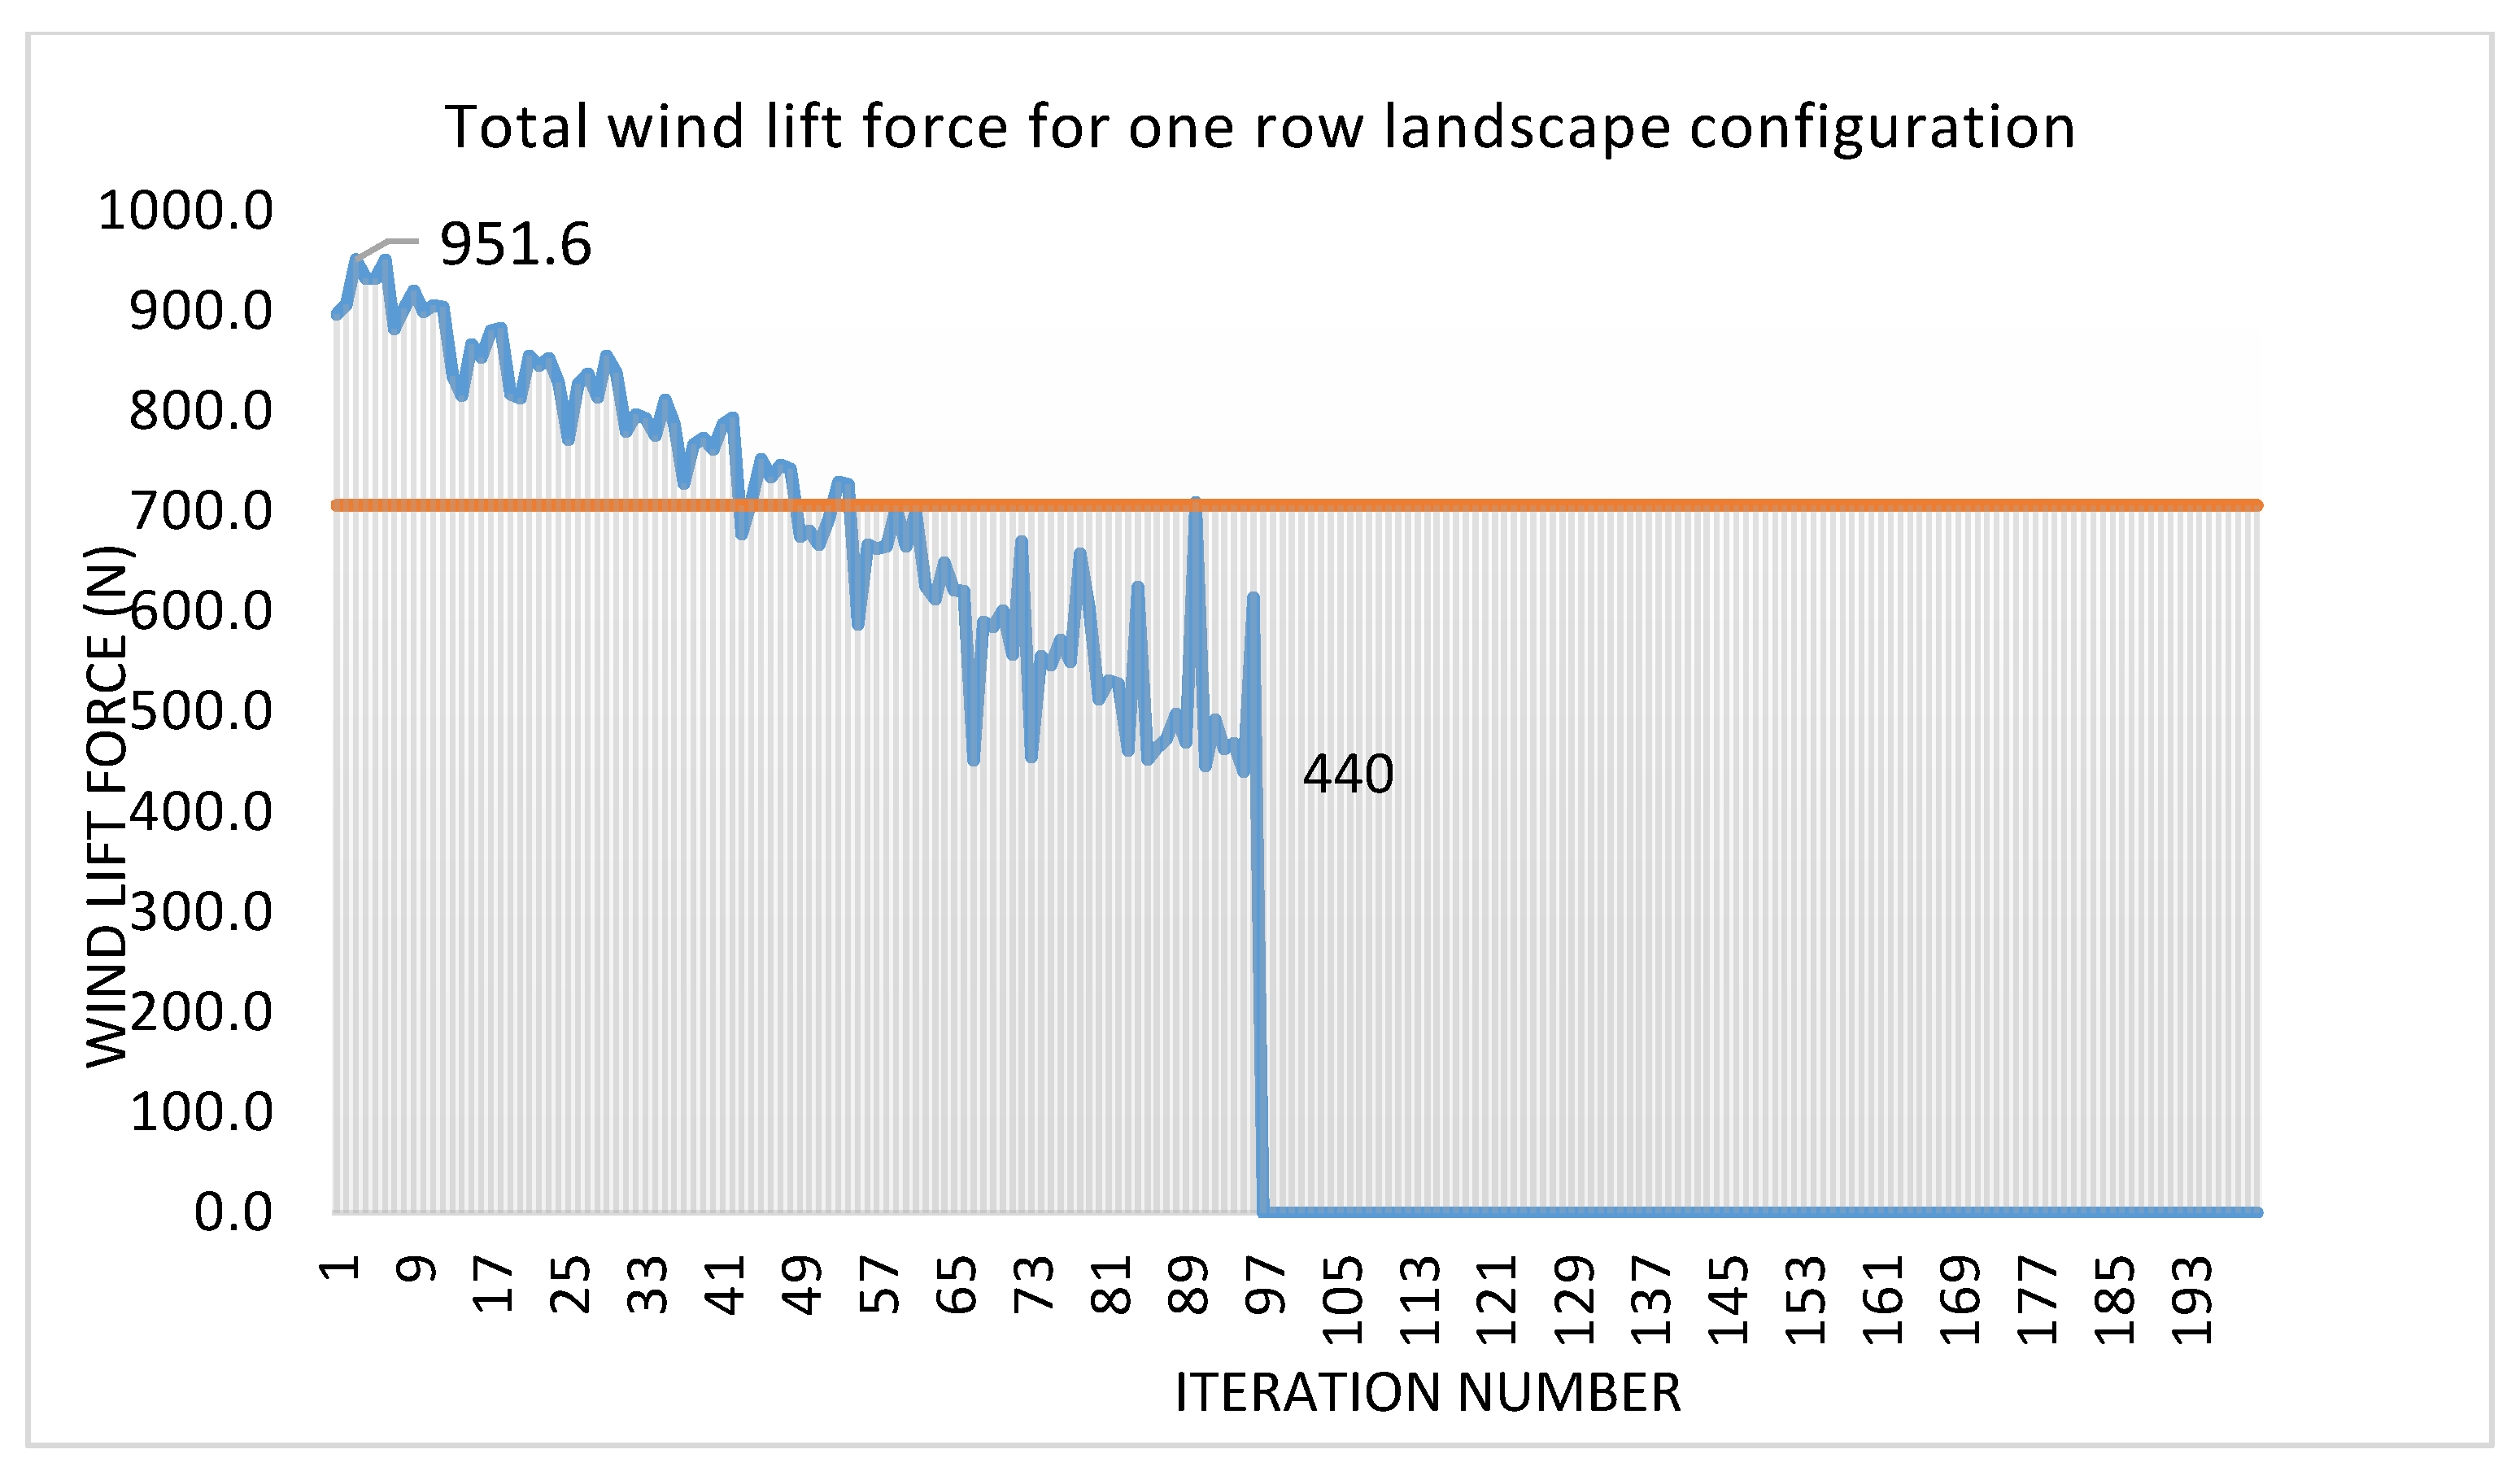
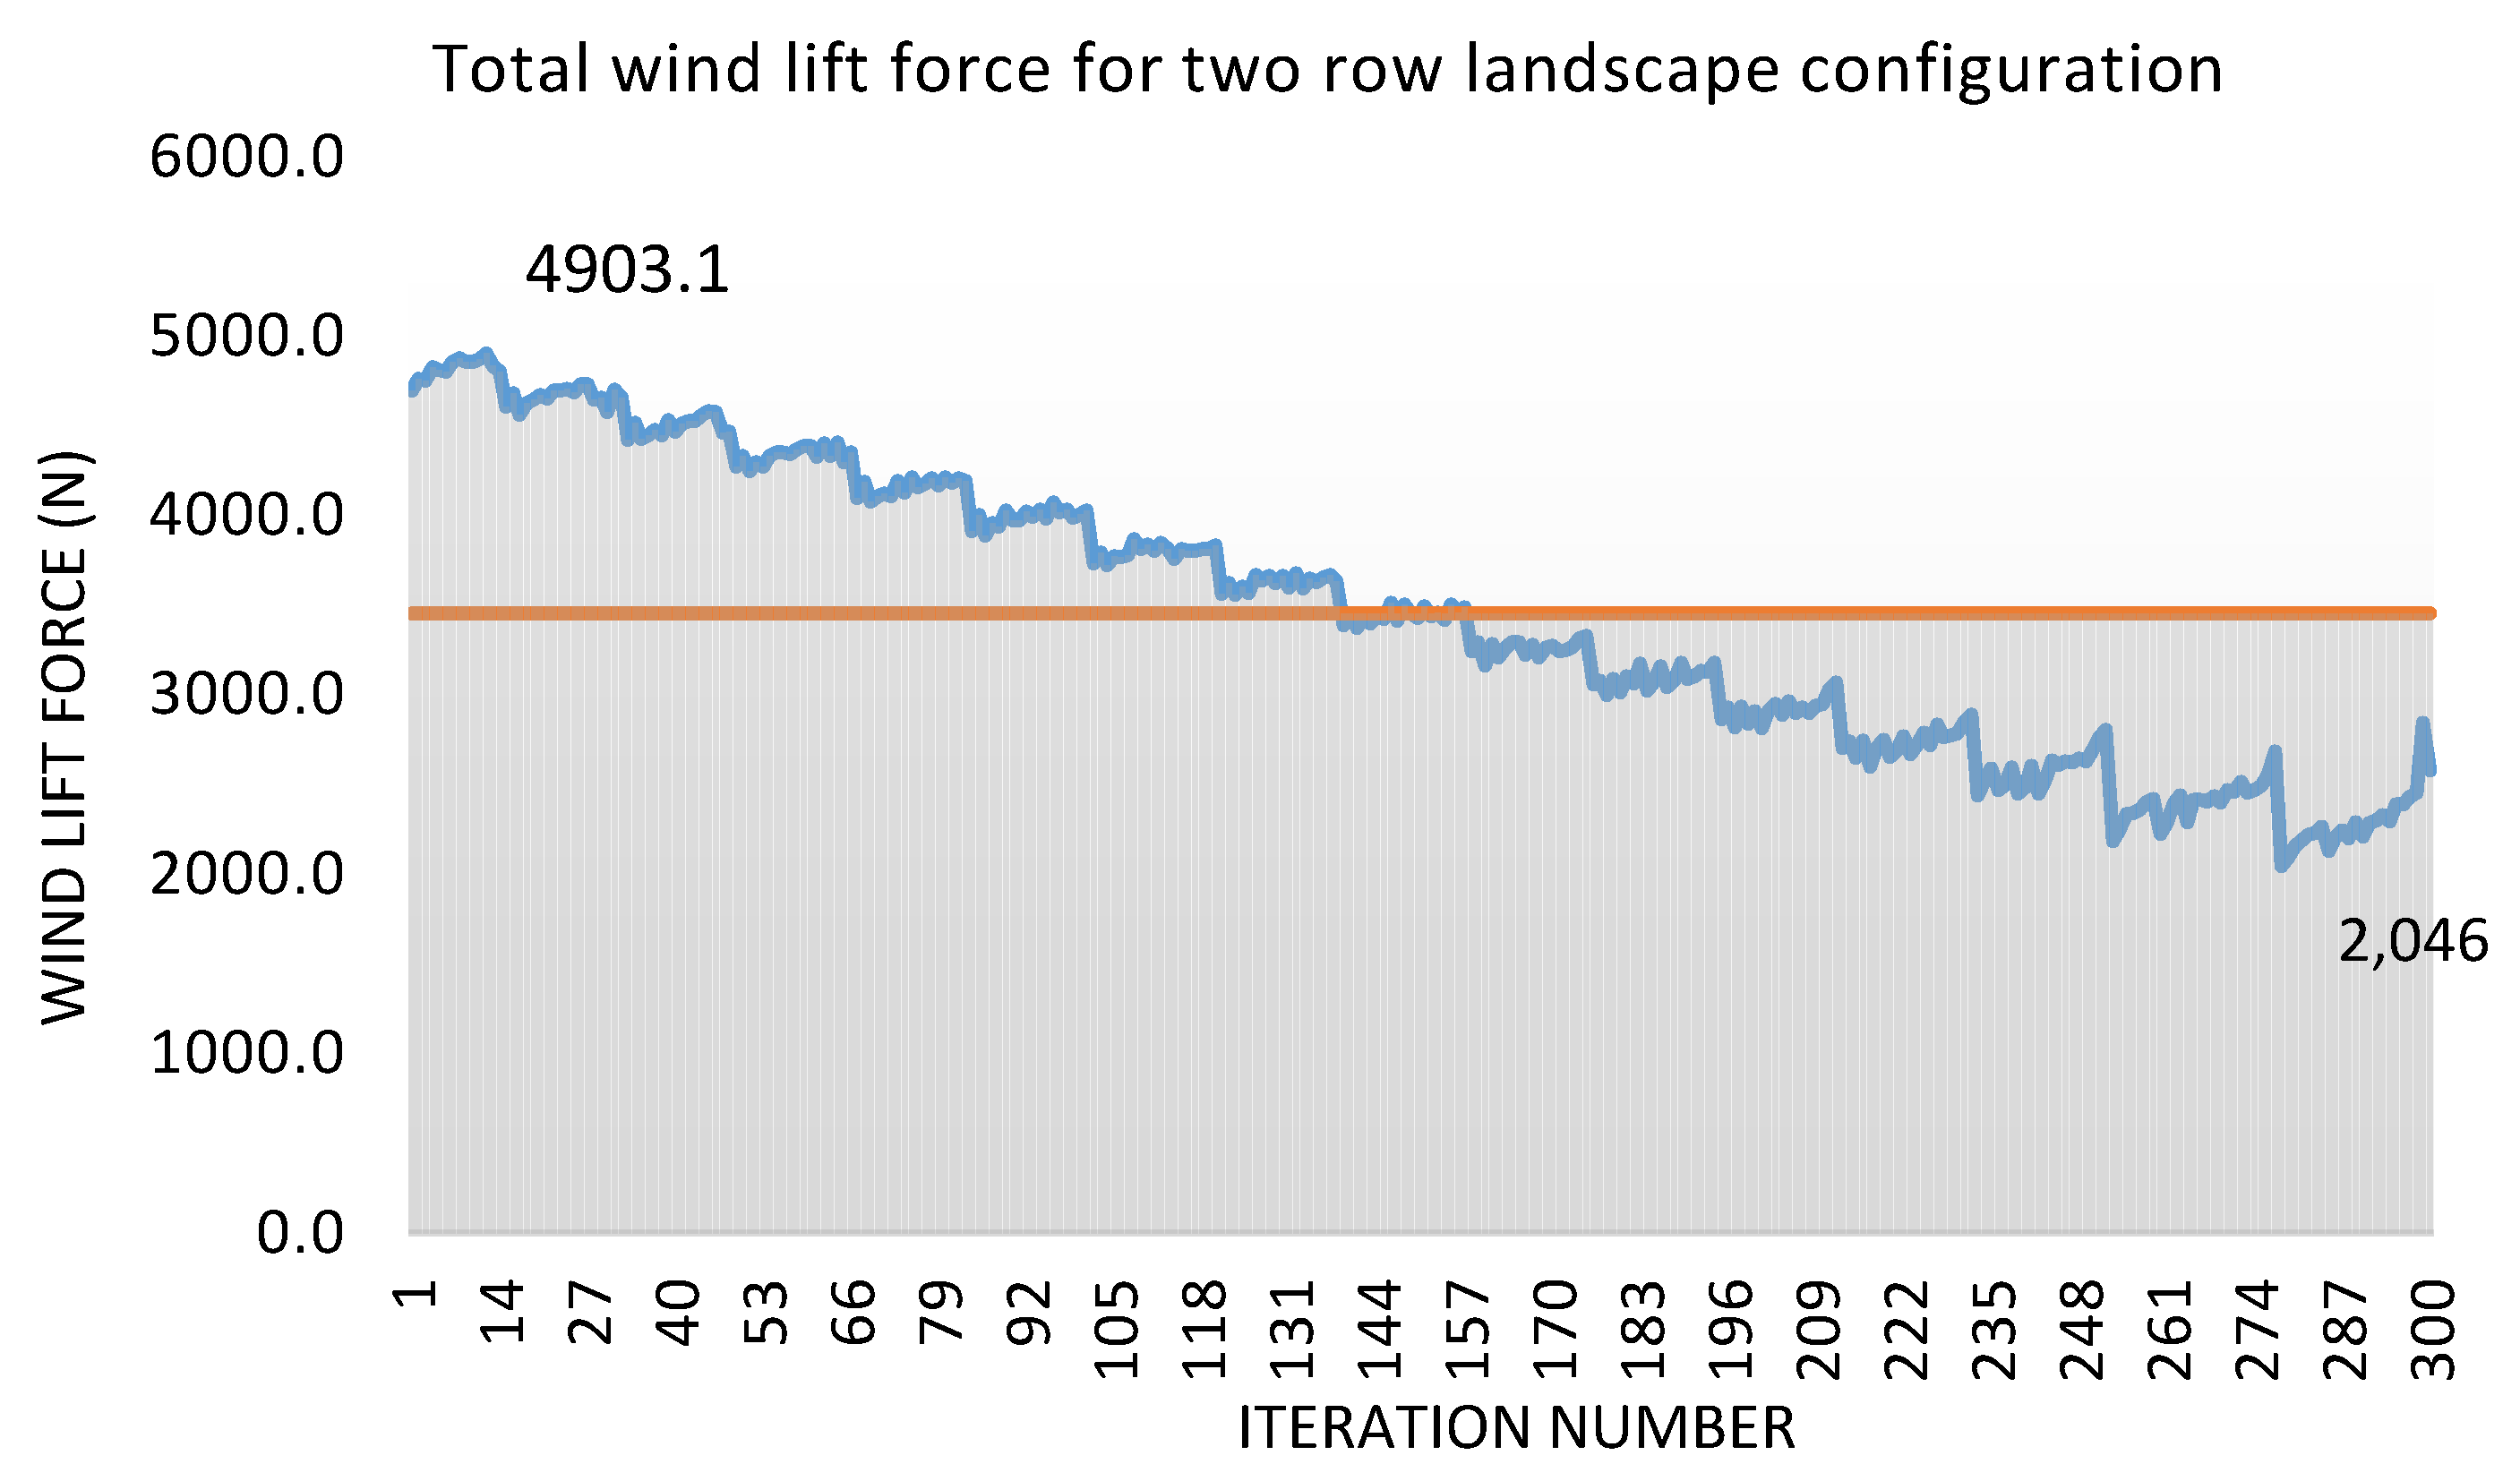
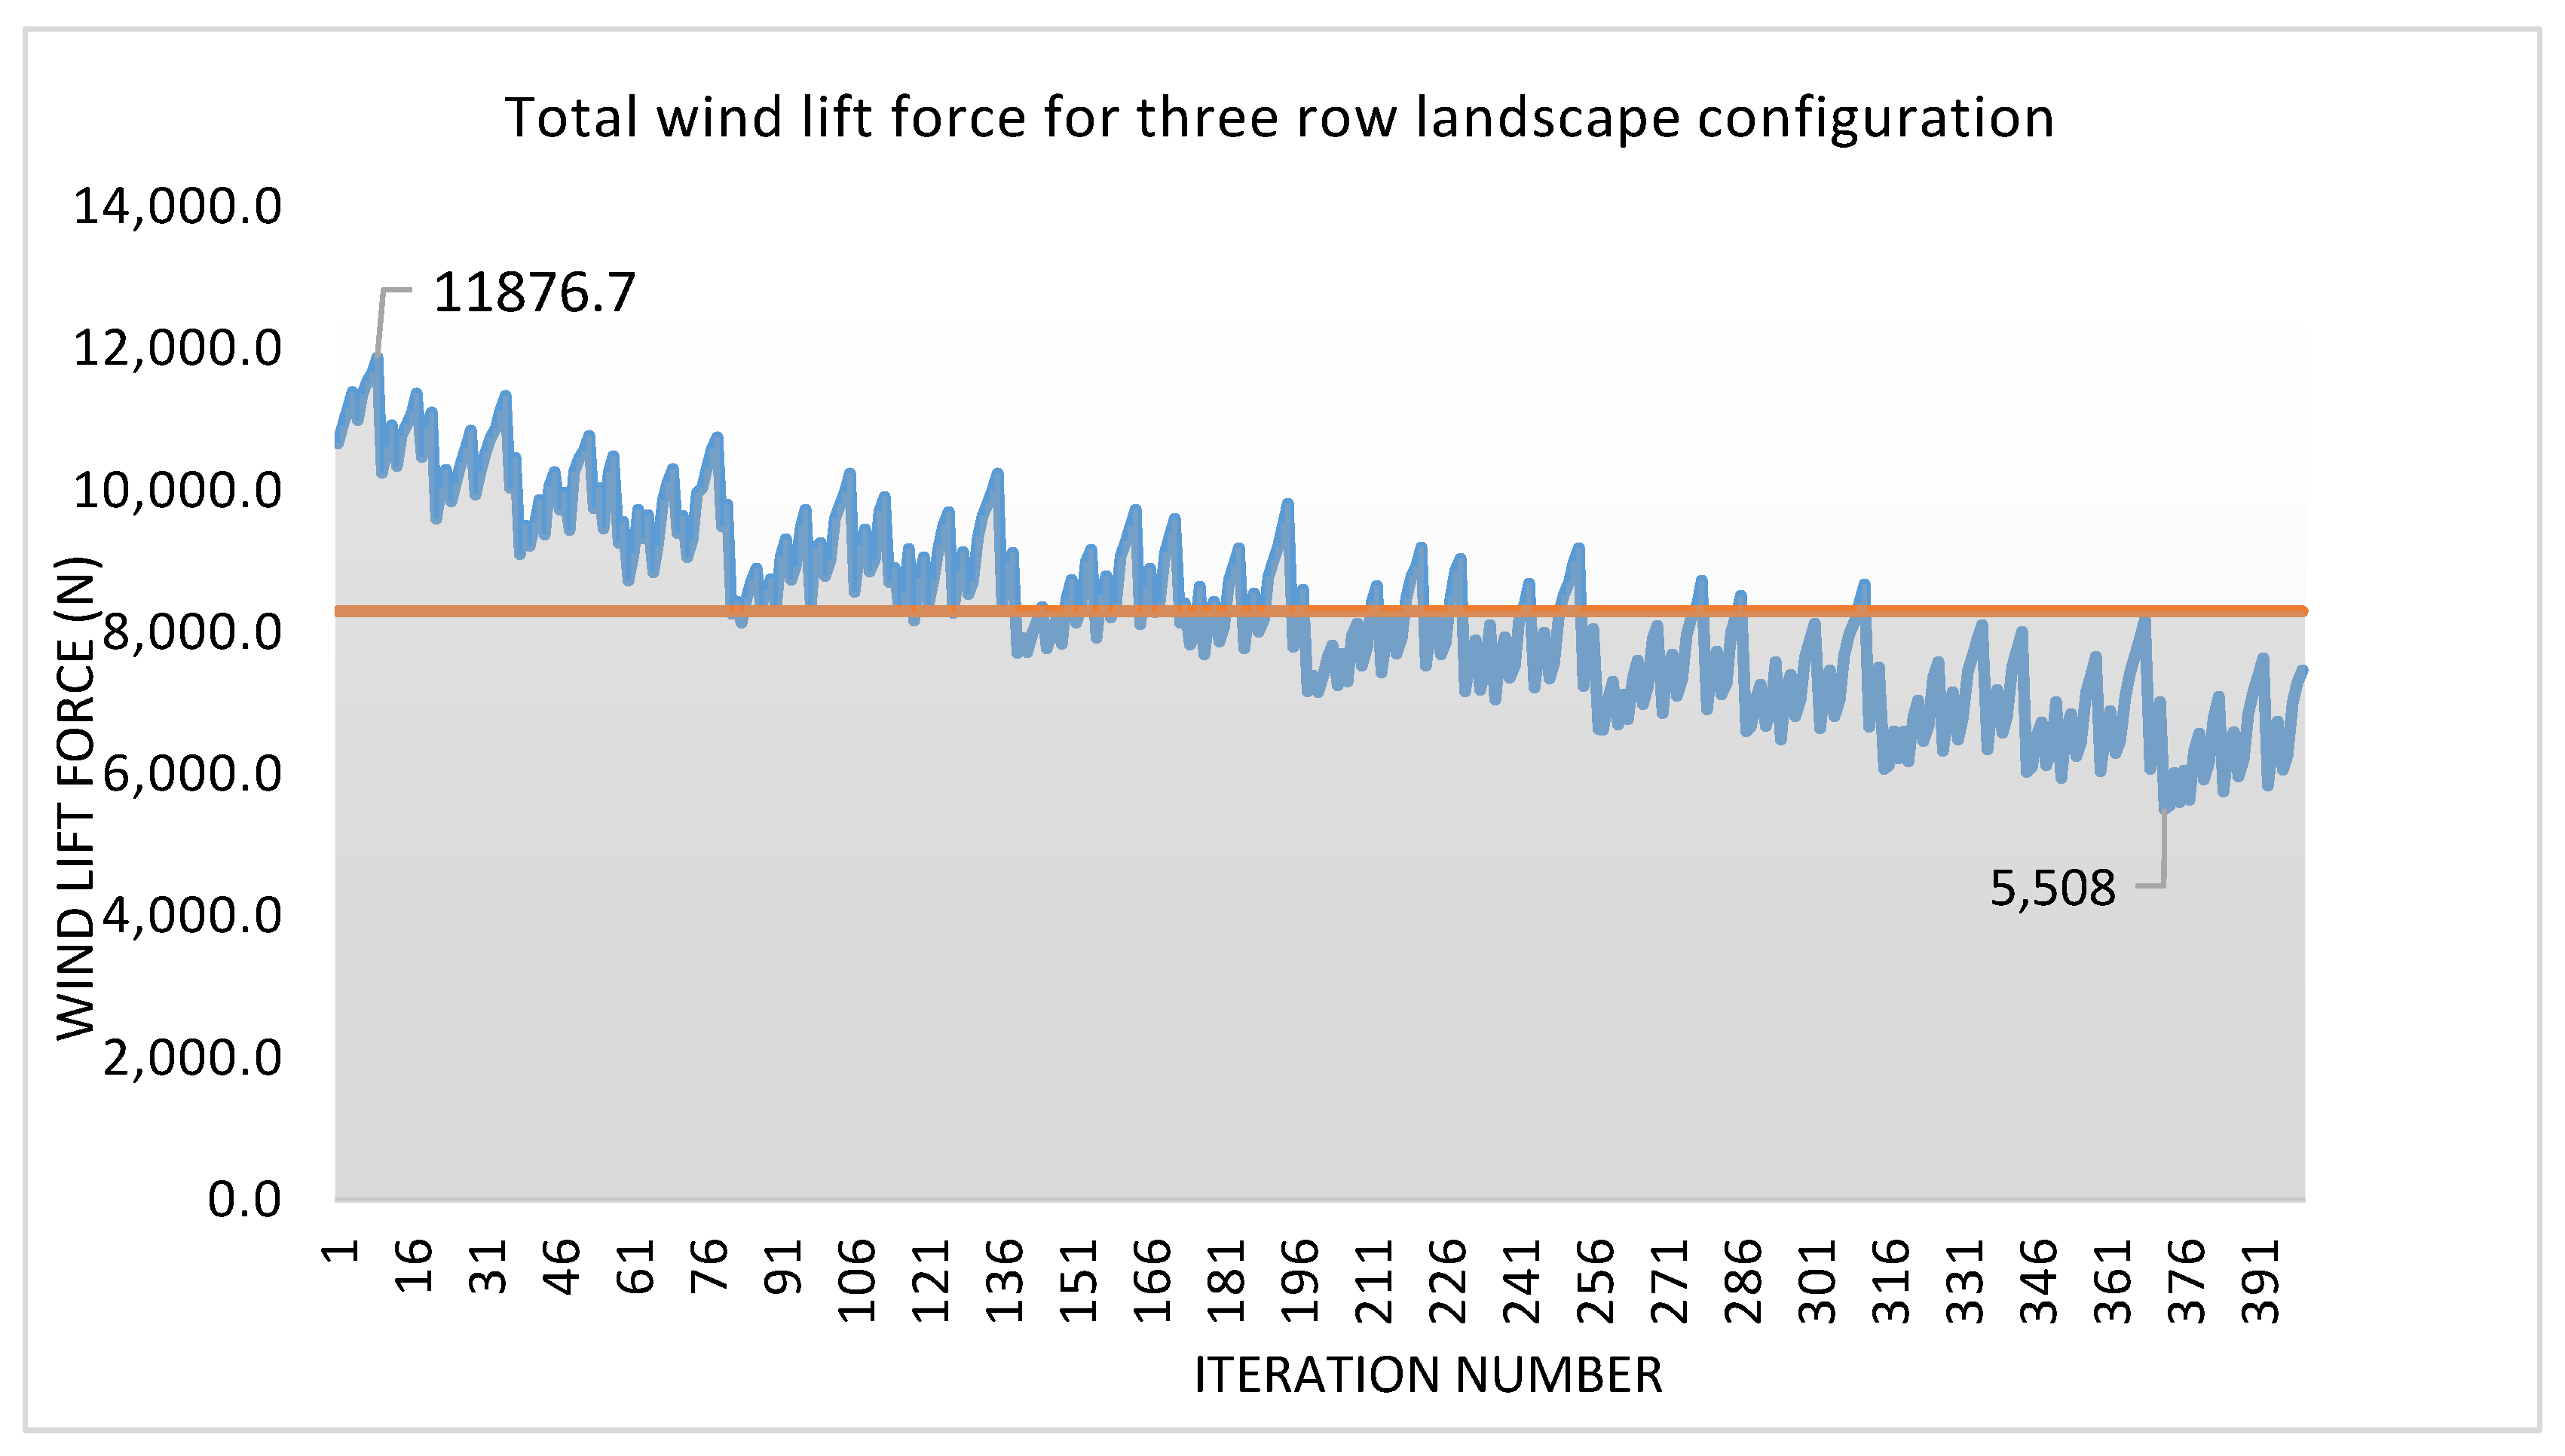
The results show a reduction of more than 50 percent in wind lift force between the minimum and maximum wind lift force configurations for all three cases. These results imply that if a PV plant is designed with an optimum configuration based on the pitch between rows and the tilt angle of each row, then the counterweight required to hold the structure in place can be reduced significantly, making them feasible for installation on commercial pre-fabricated roofs and thus resulting in an increased utilizable area and reduced levelized cost of energy production from photovoltaic plants.
The research was carried out considering wind acting from a single direction. The effect of wind direction on the drag and lift force concerningpitch and performance ratio can be considered an additional parameter for optimization. Furthermore, variation in the performance of photovoltaics due to the thermal effect caused by wind velocity change can be incorporated as an additional optimization parameter while carrying out GA-based optimization.


 ,
, 


