


Decarbonizing Thailand’s Economy: A Proposal


Abstract
:1. Introduction
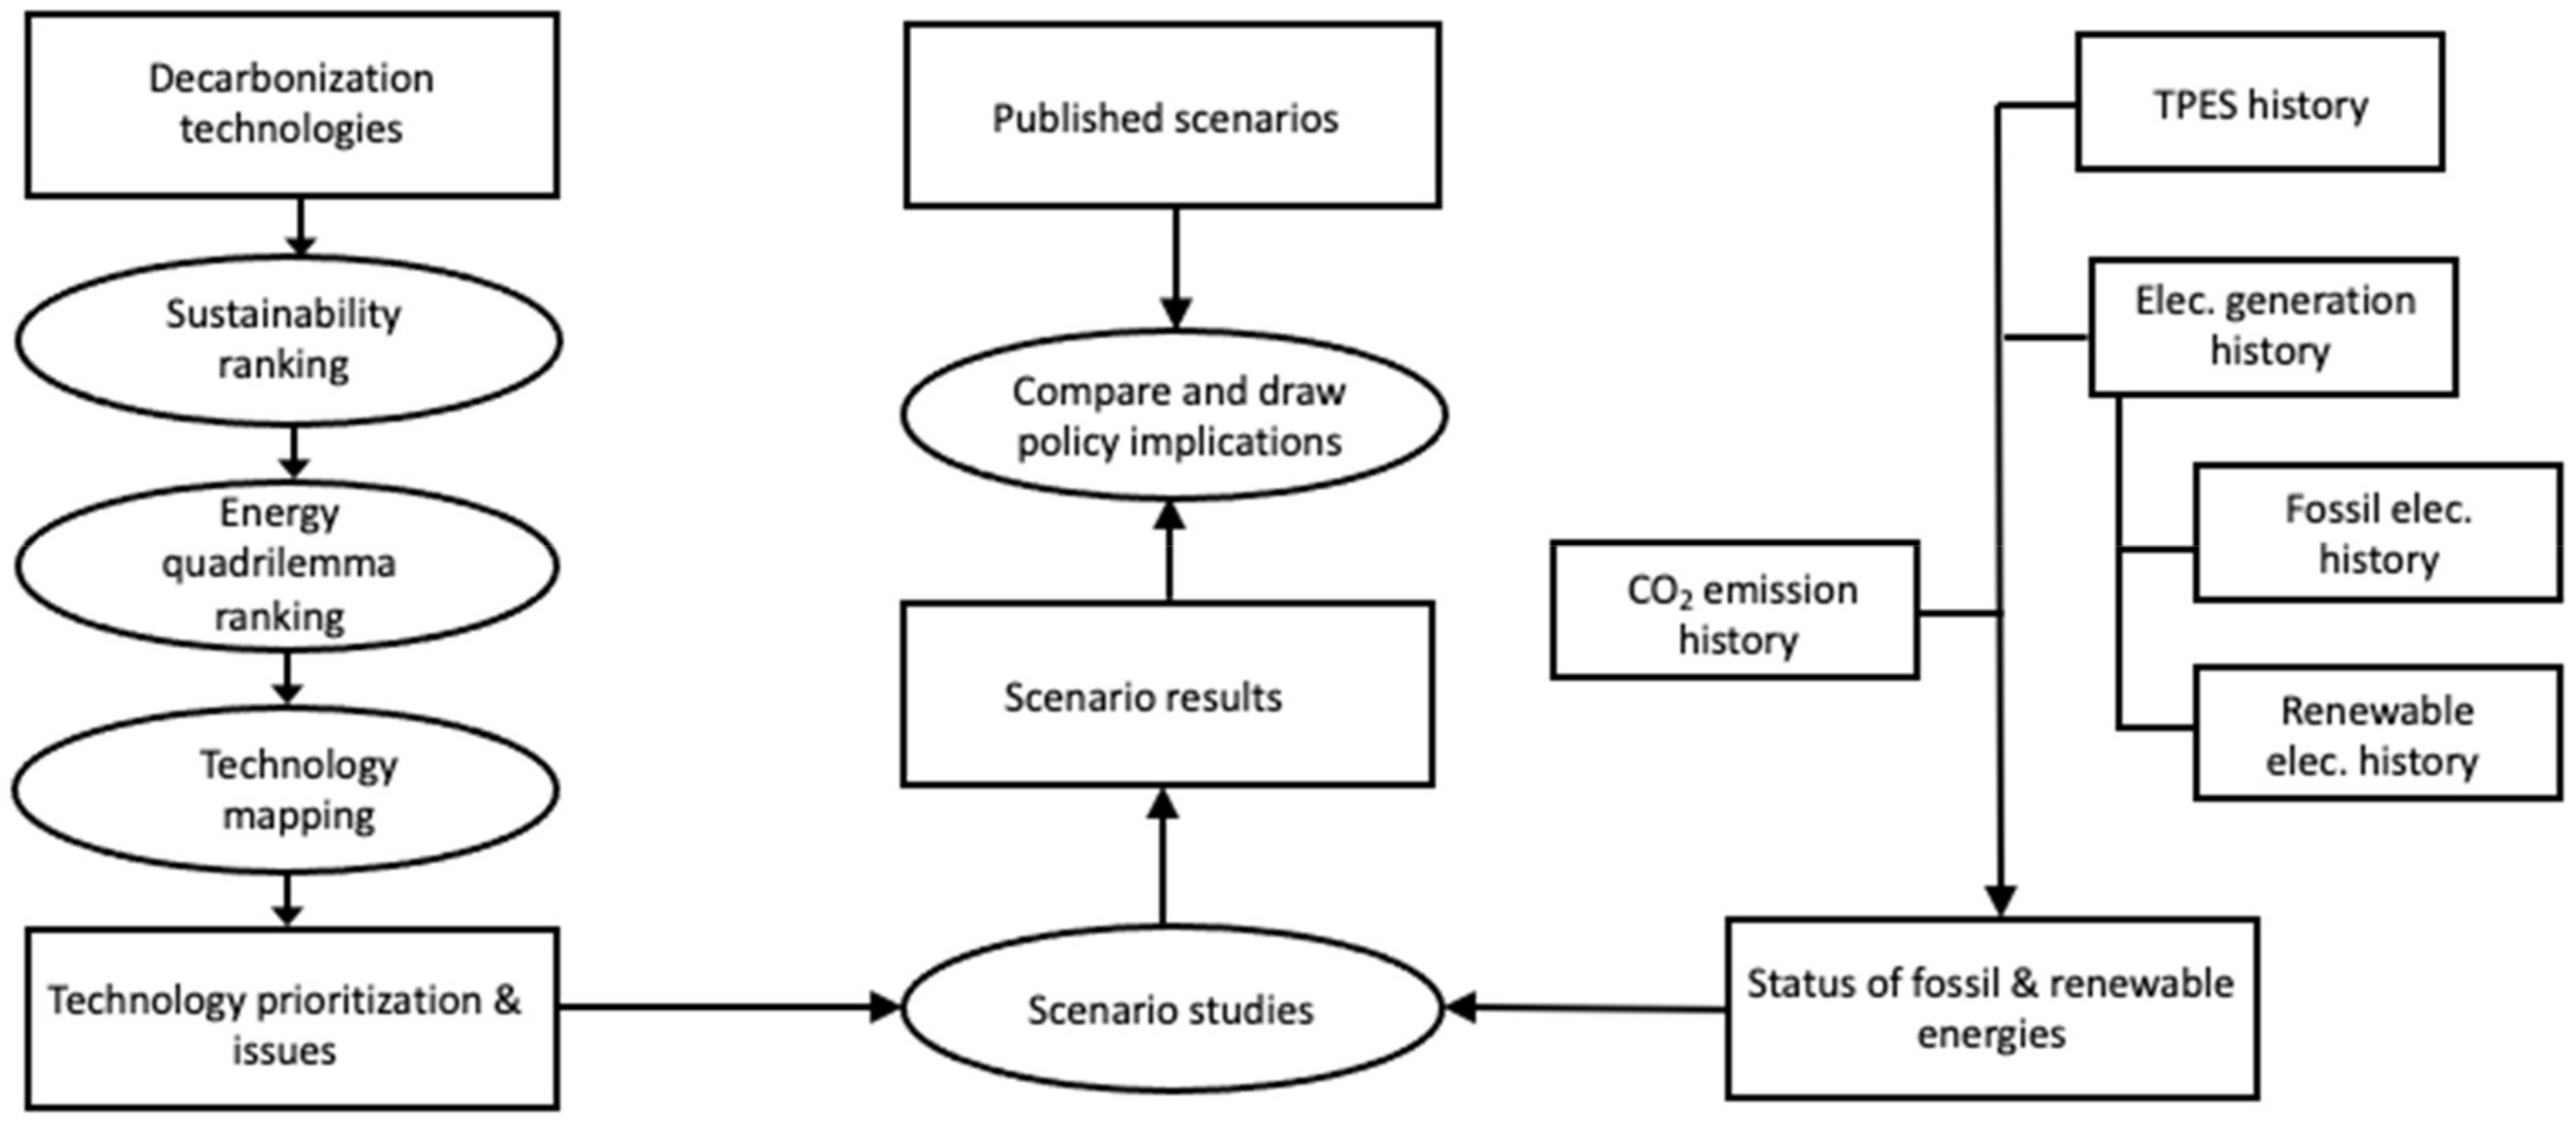
2. Objective and Methodology
3. Status of Fossil and Non-Fossil Energies
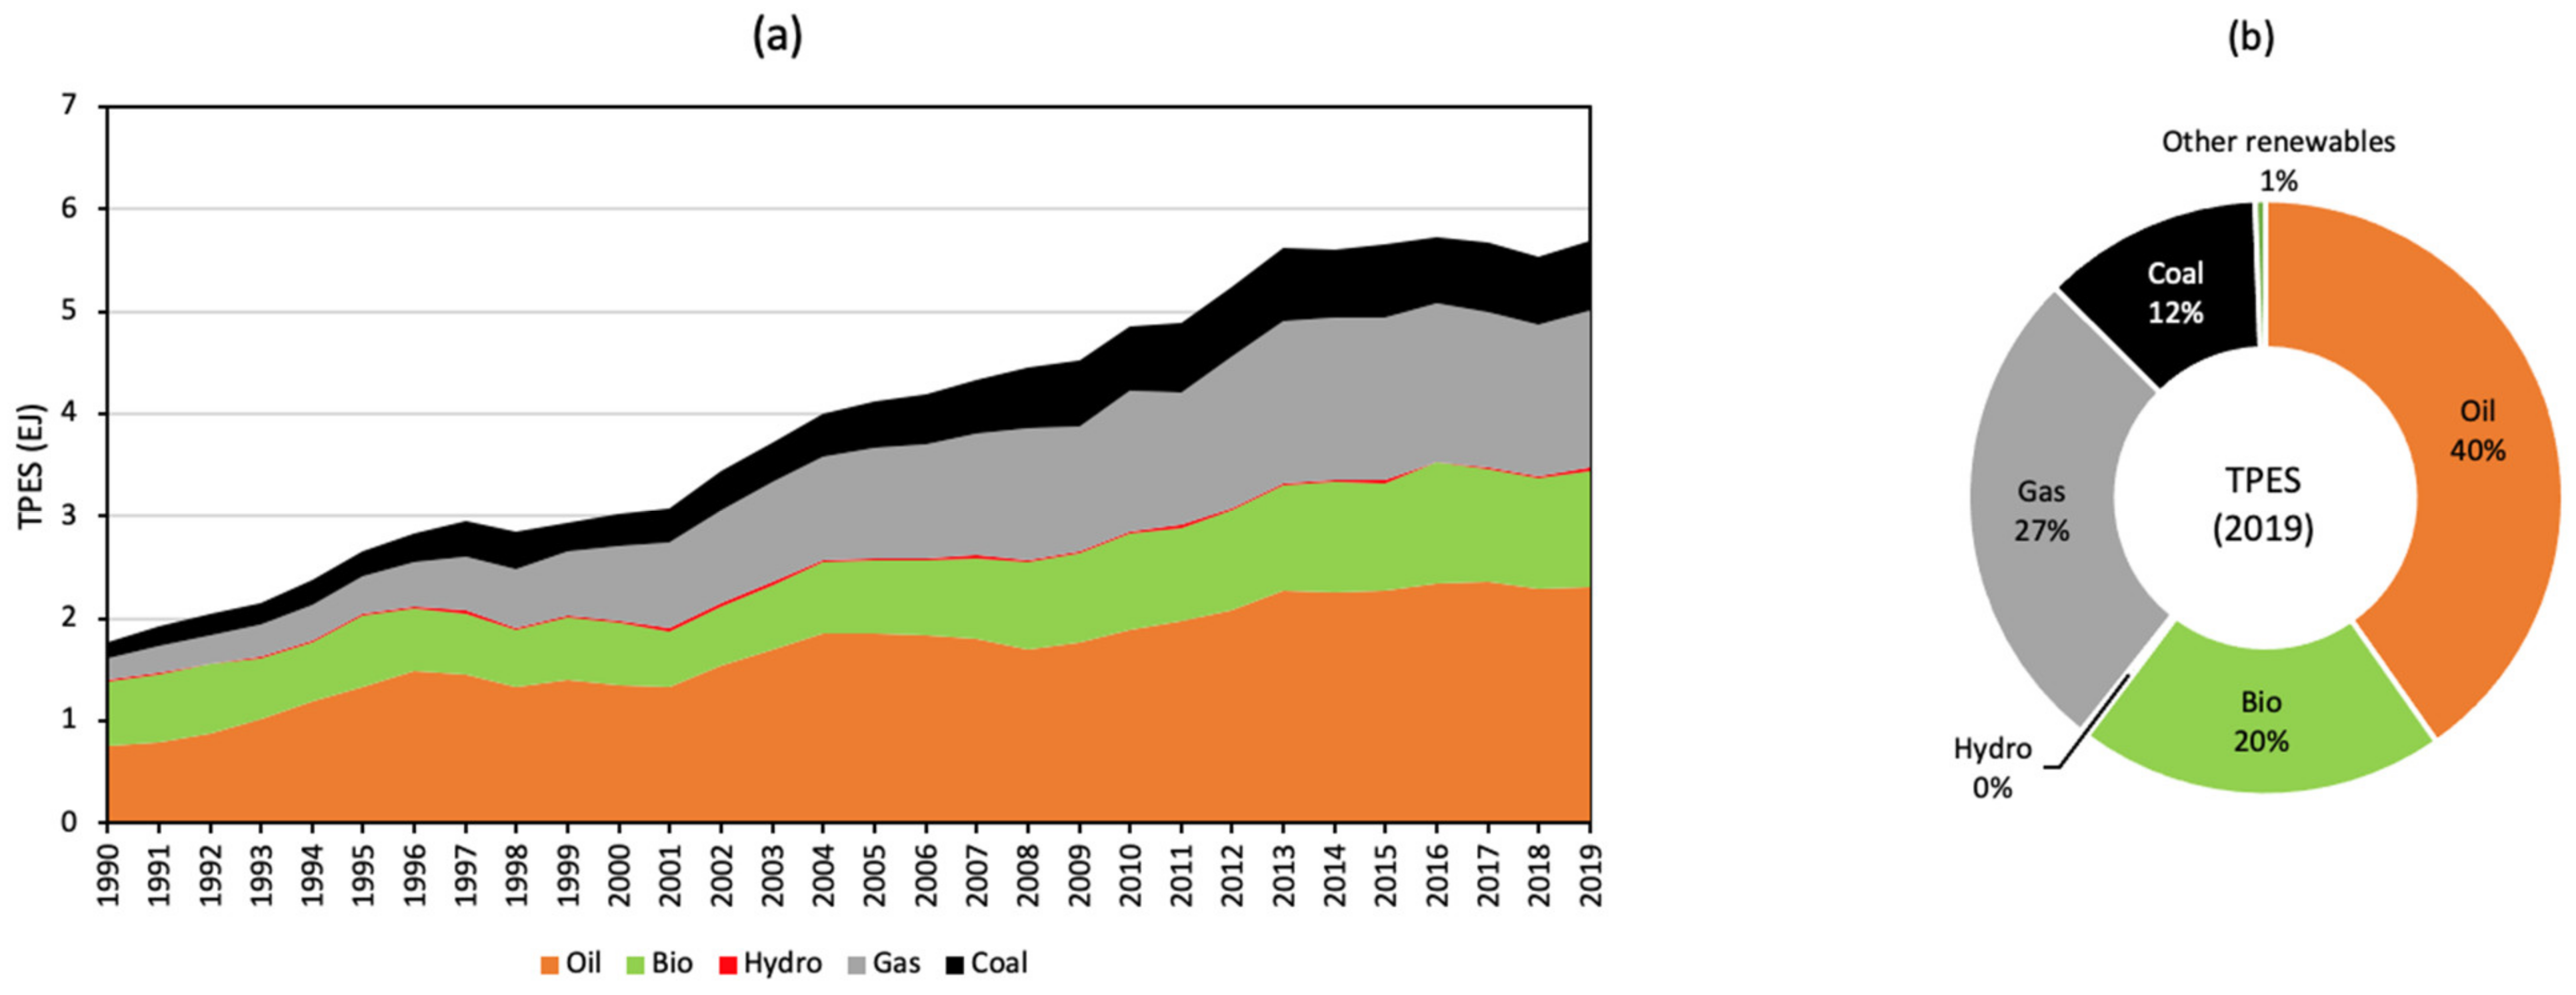
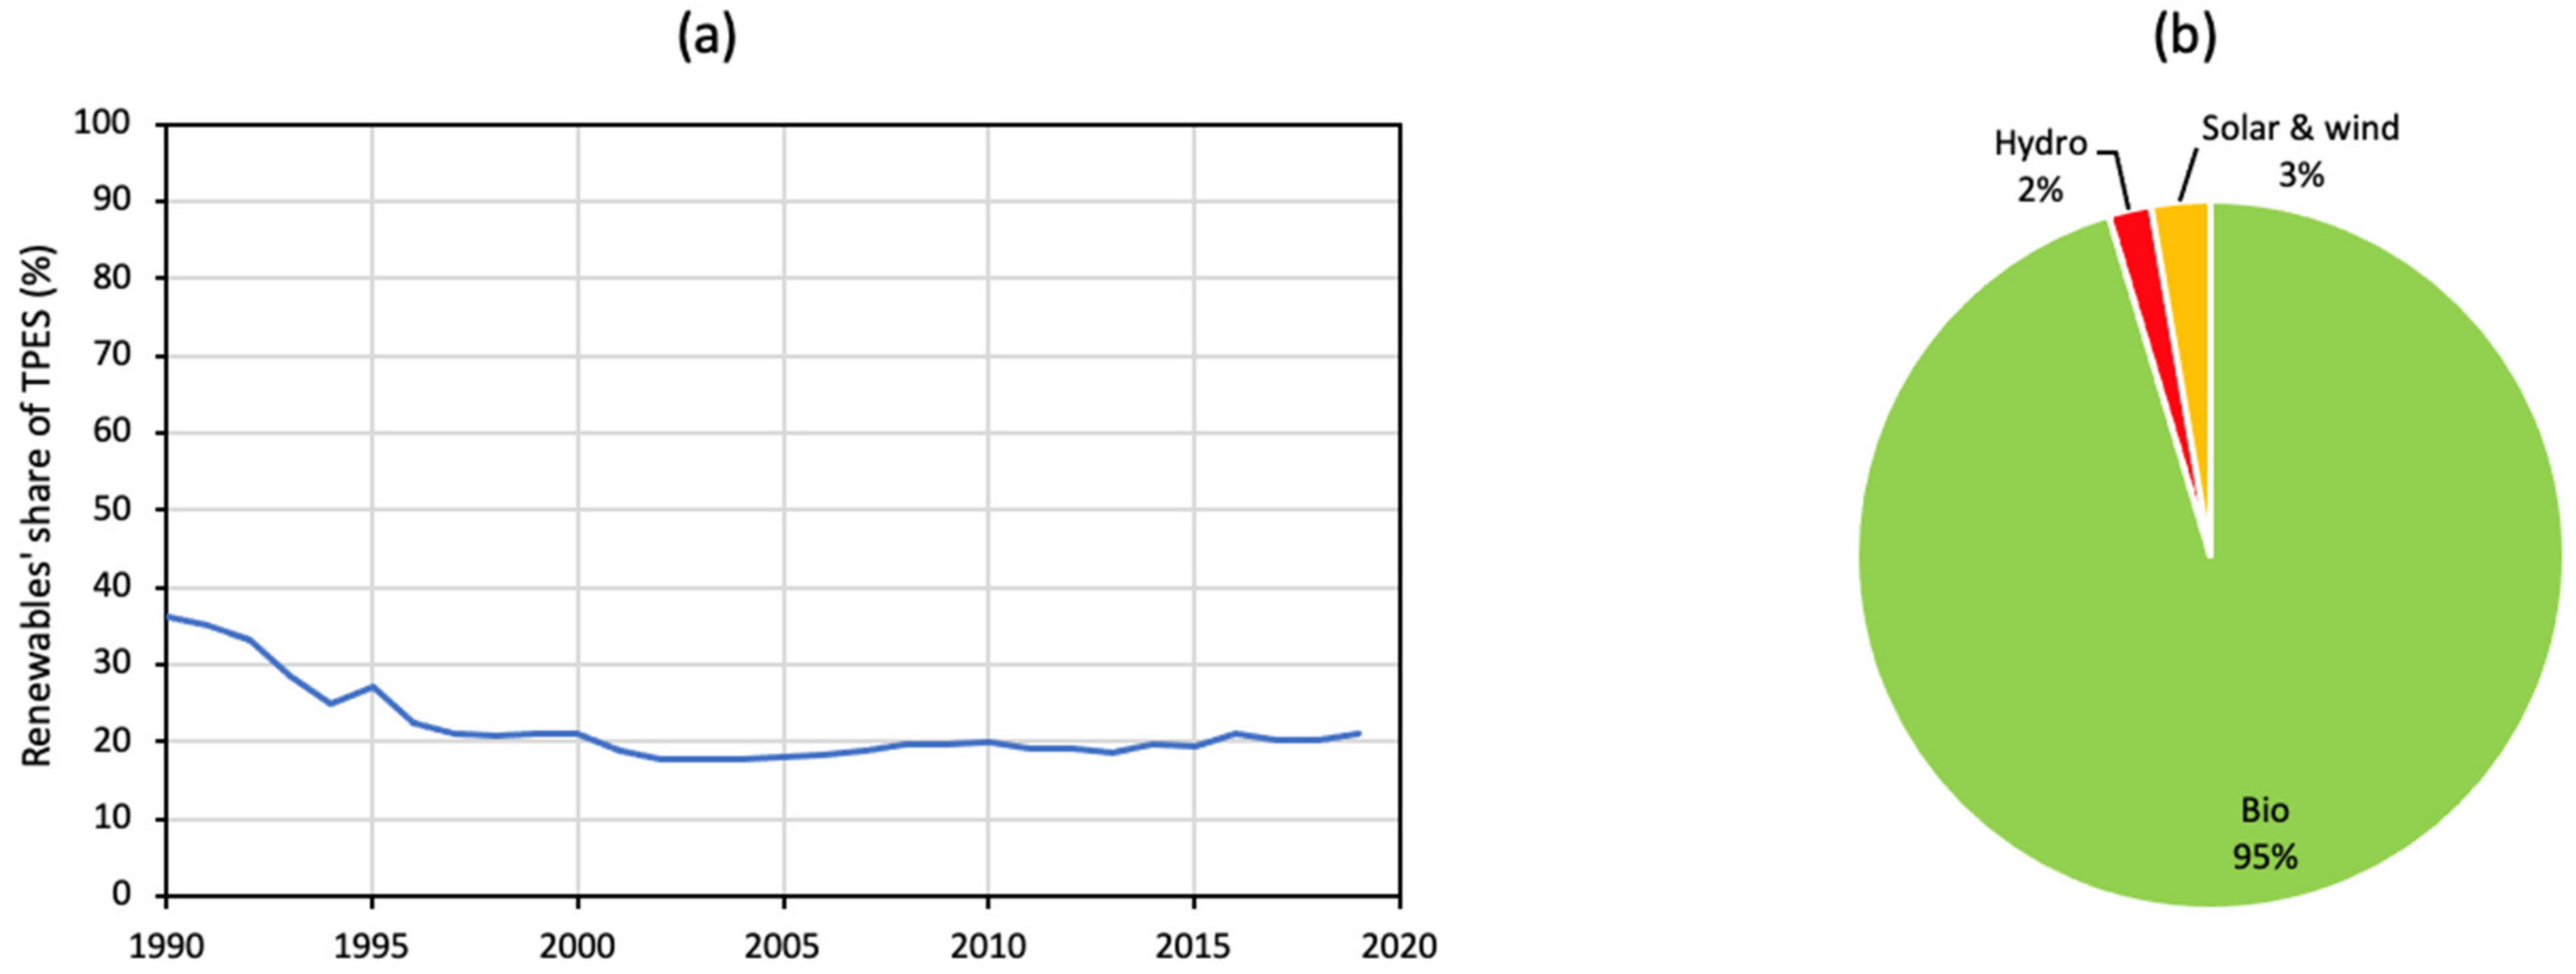
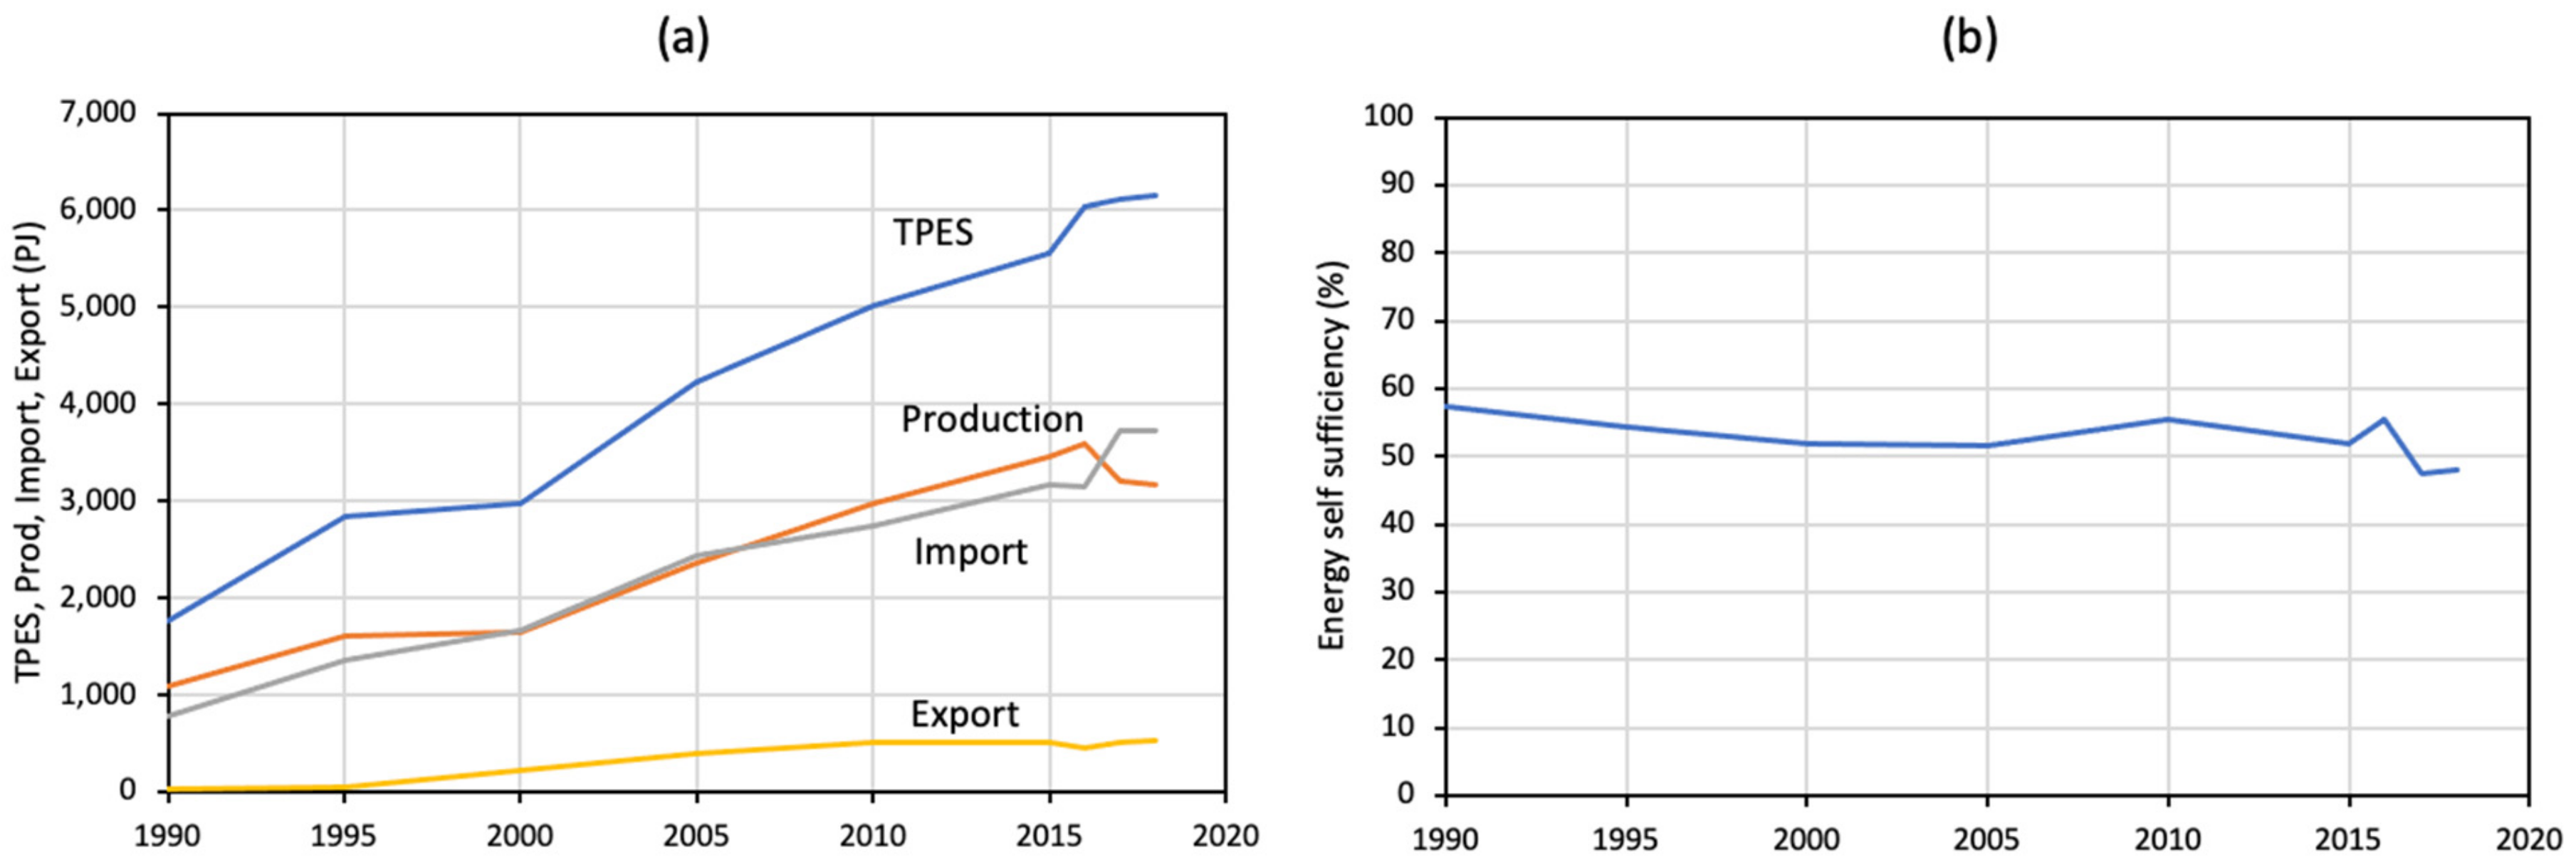
3.1. Primary Energy Supply
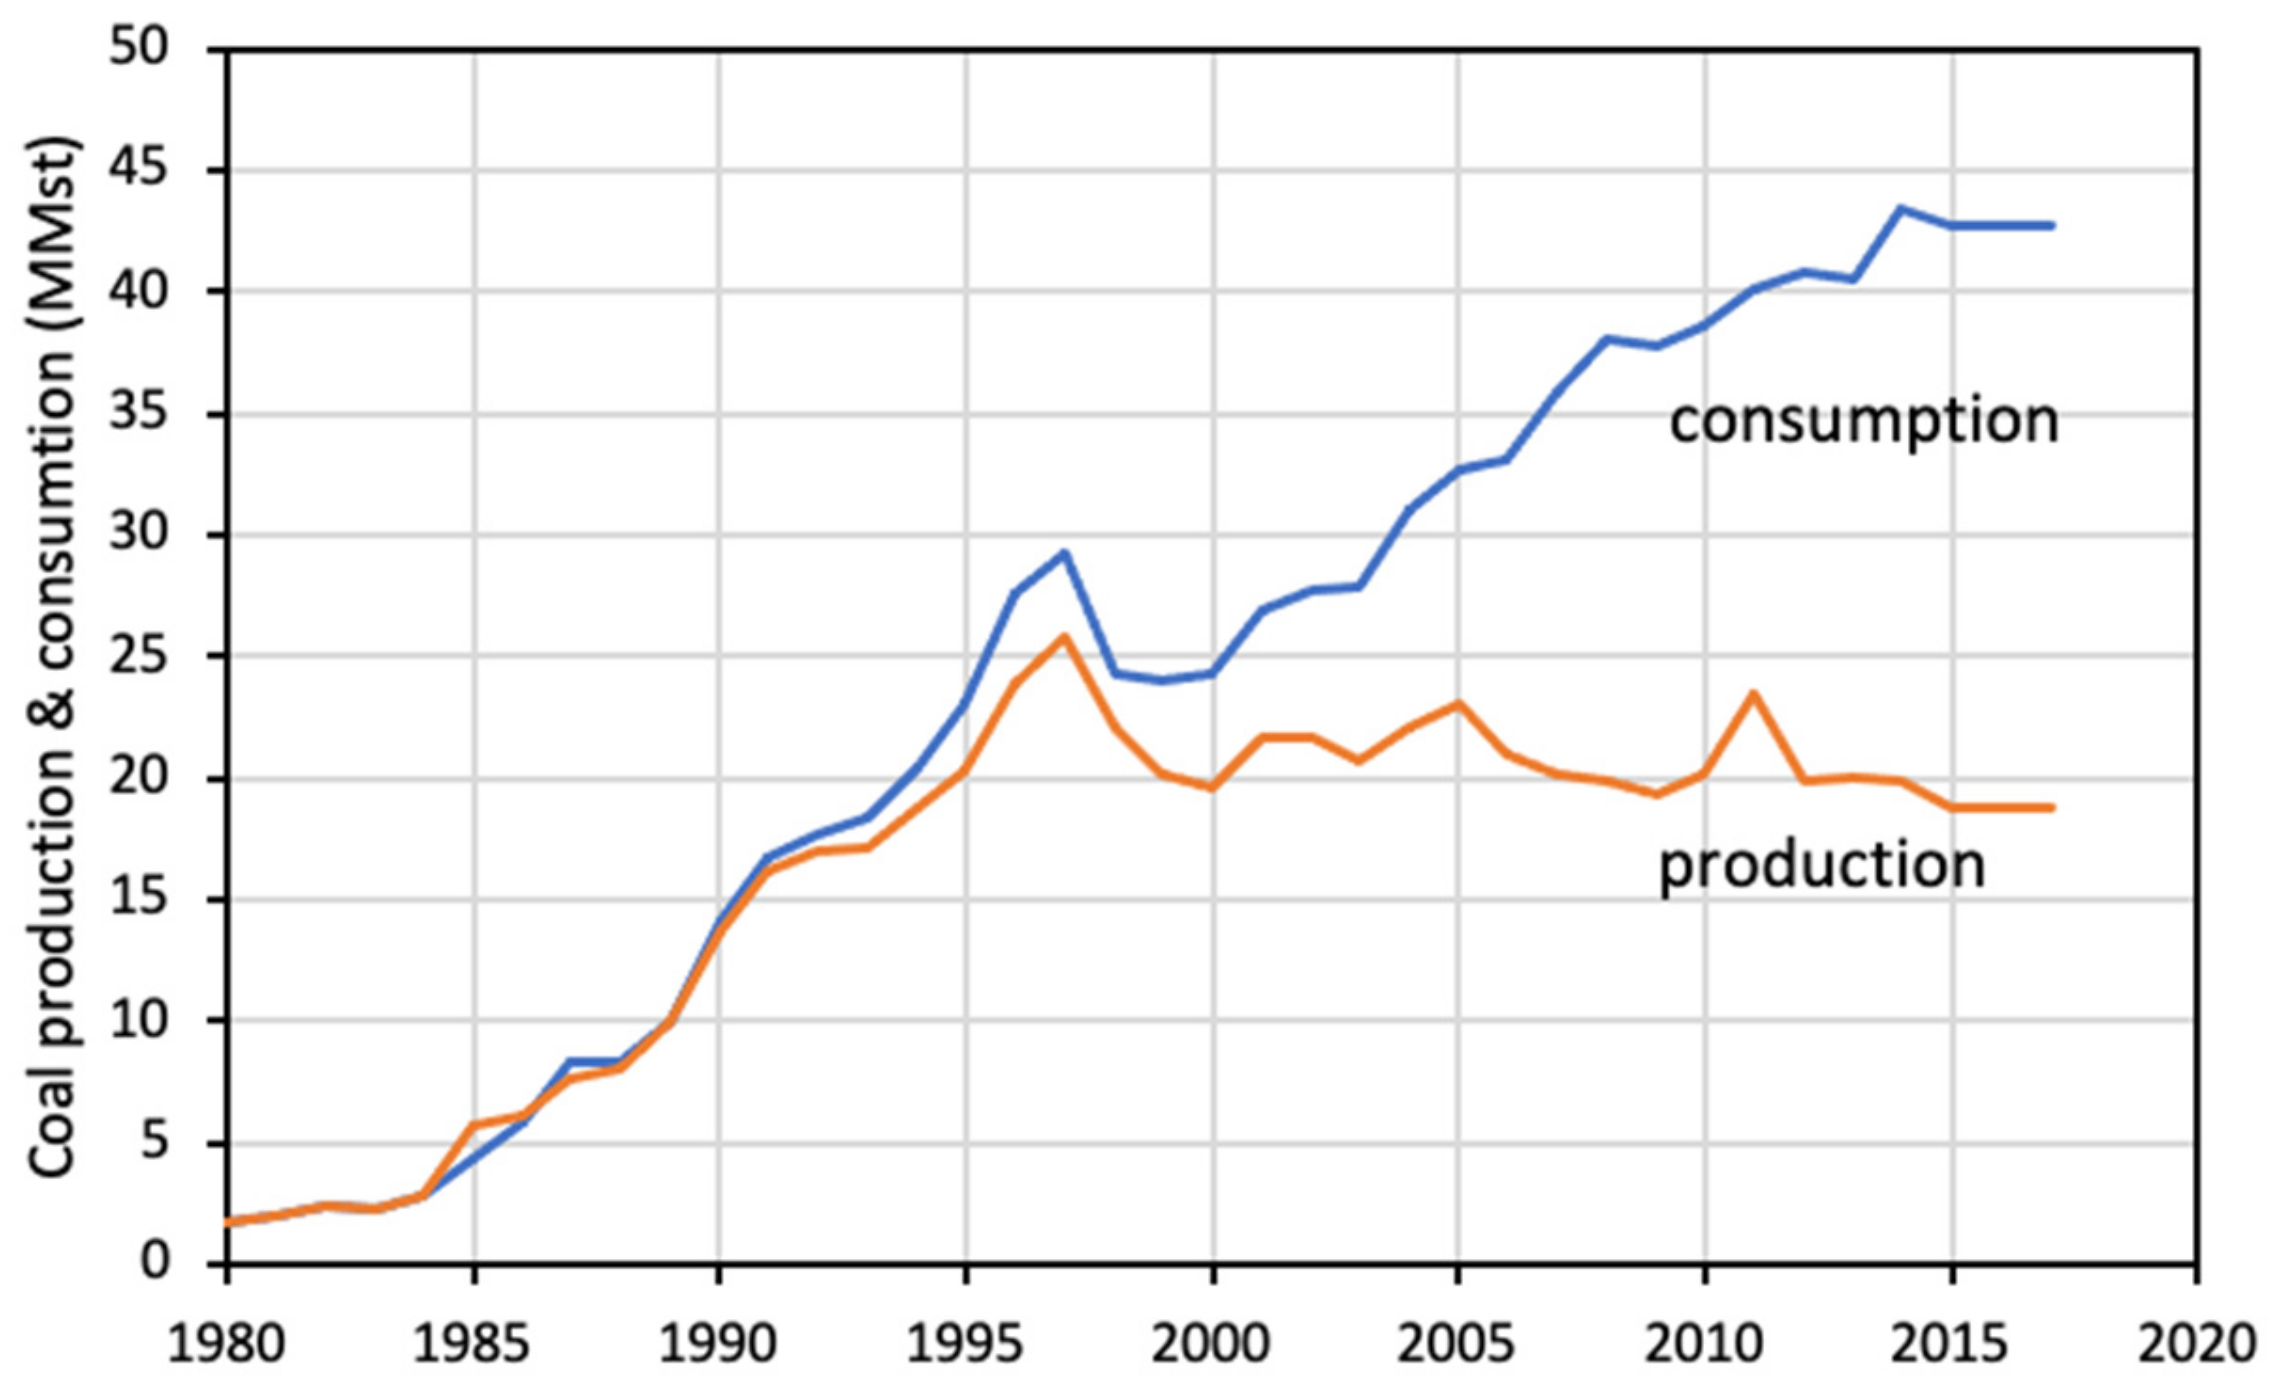
3.1.1. Coal Production and Consumption
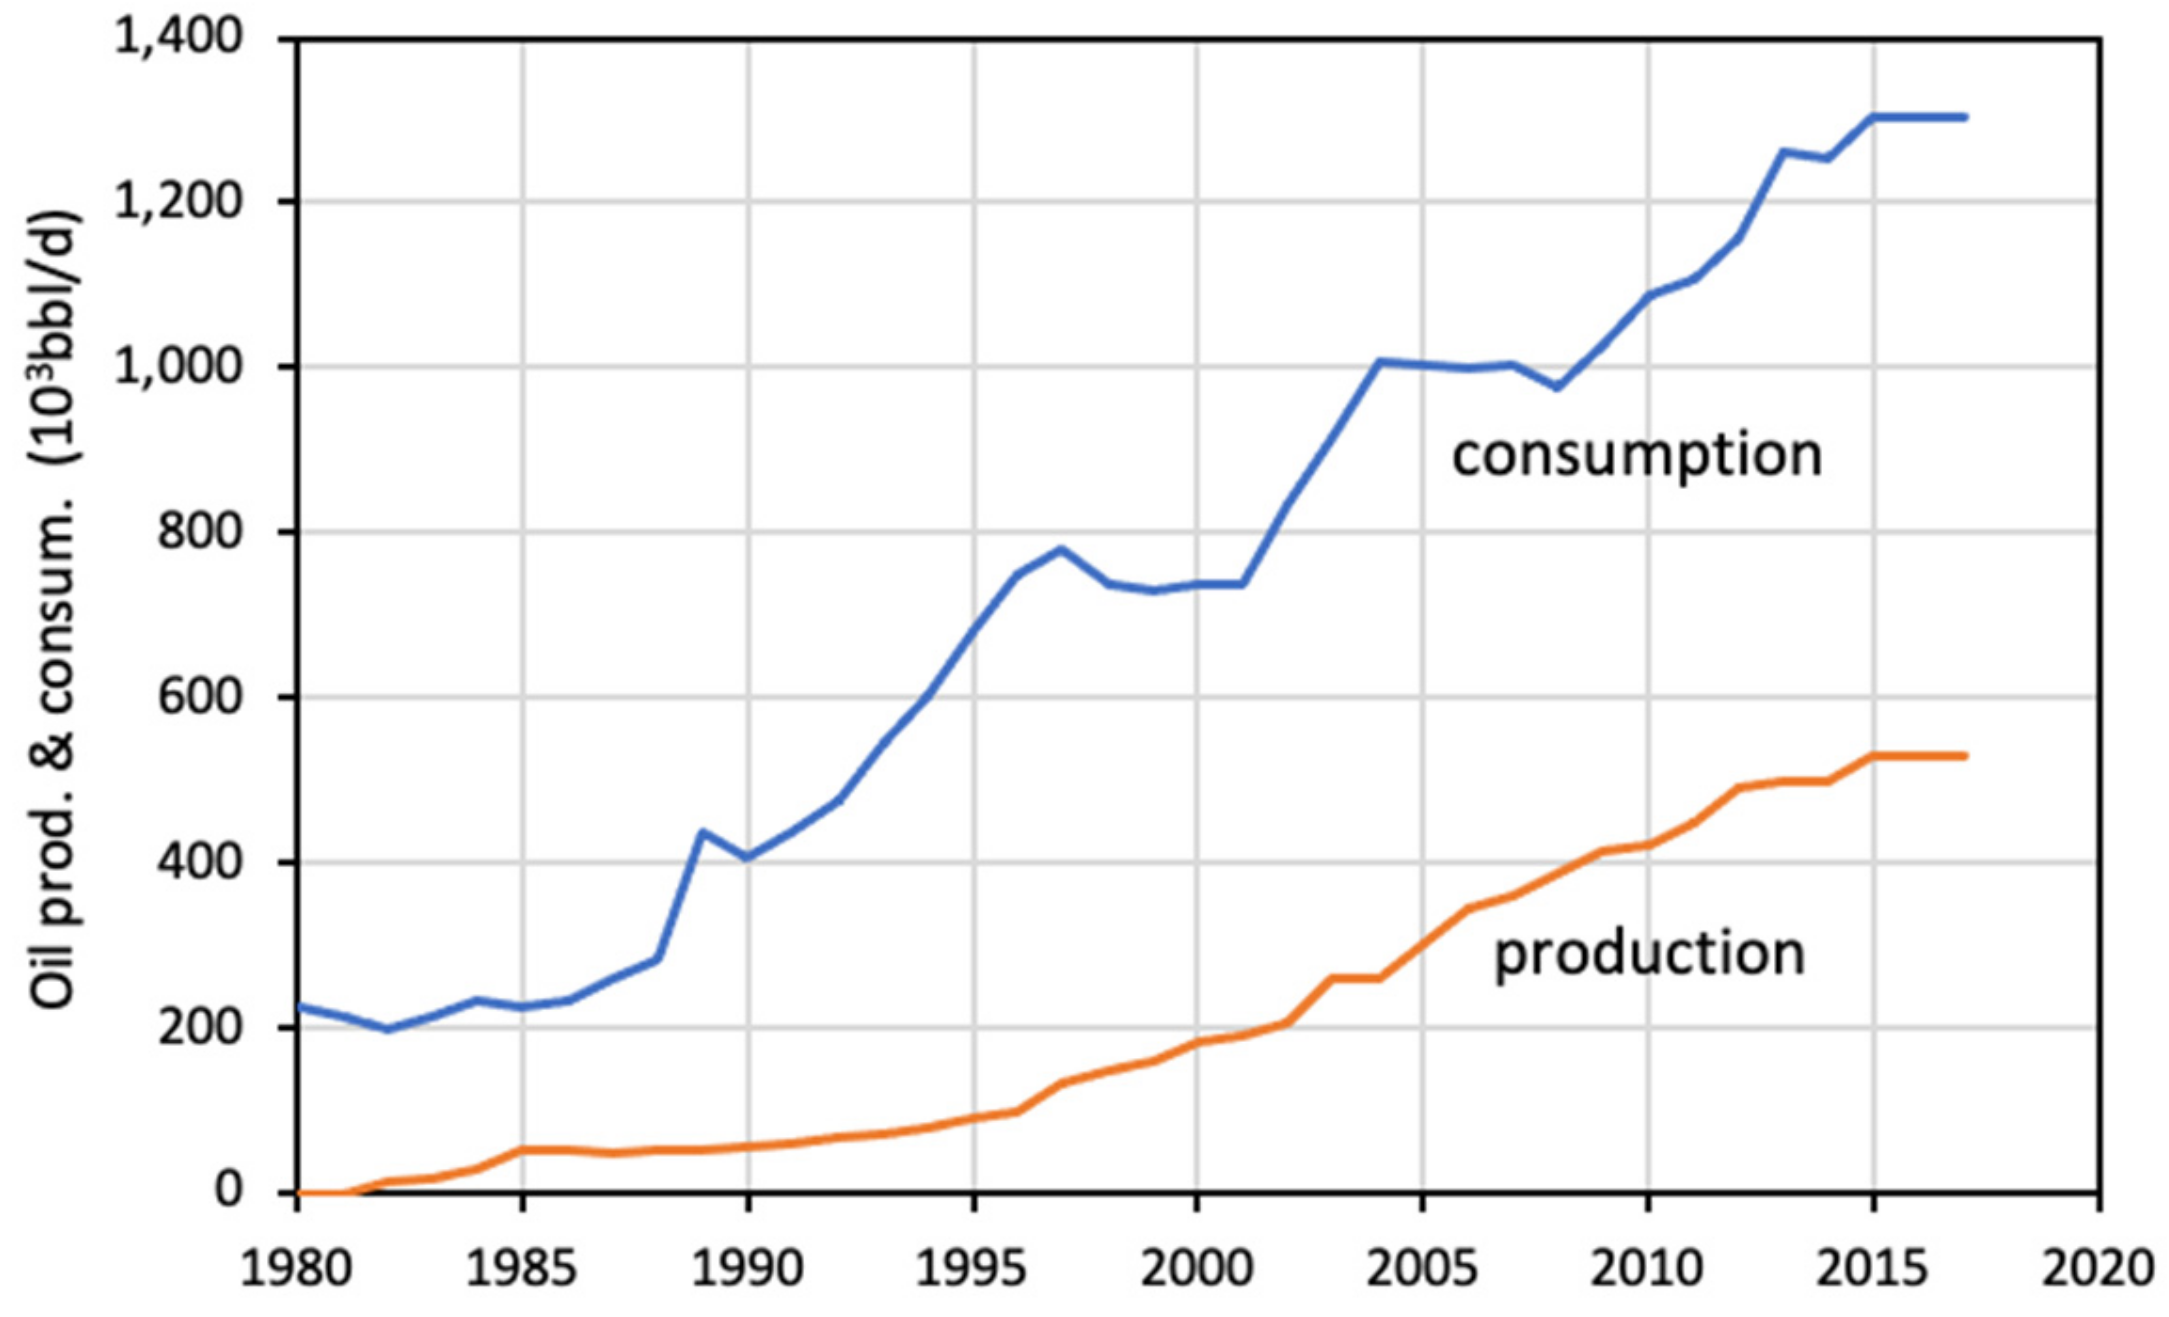
3.1.2. Oil Production and Consumption
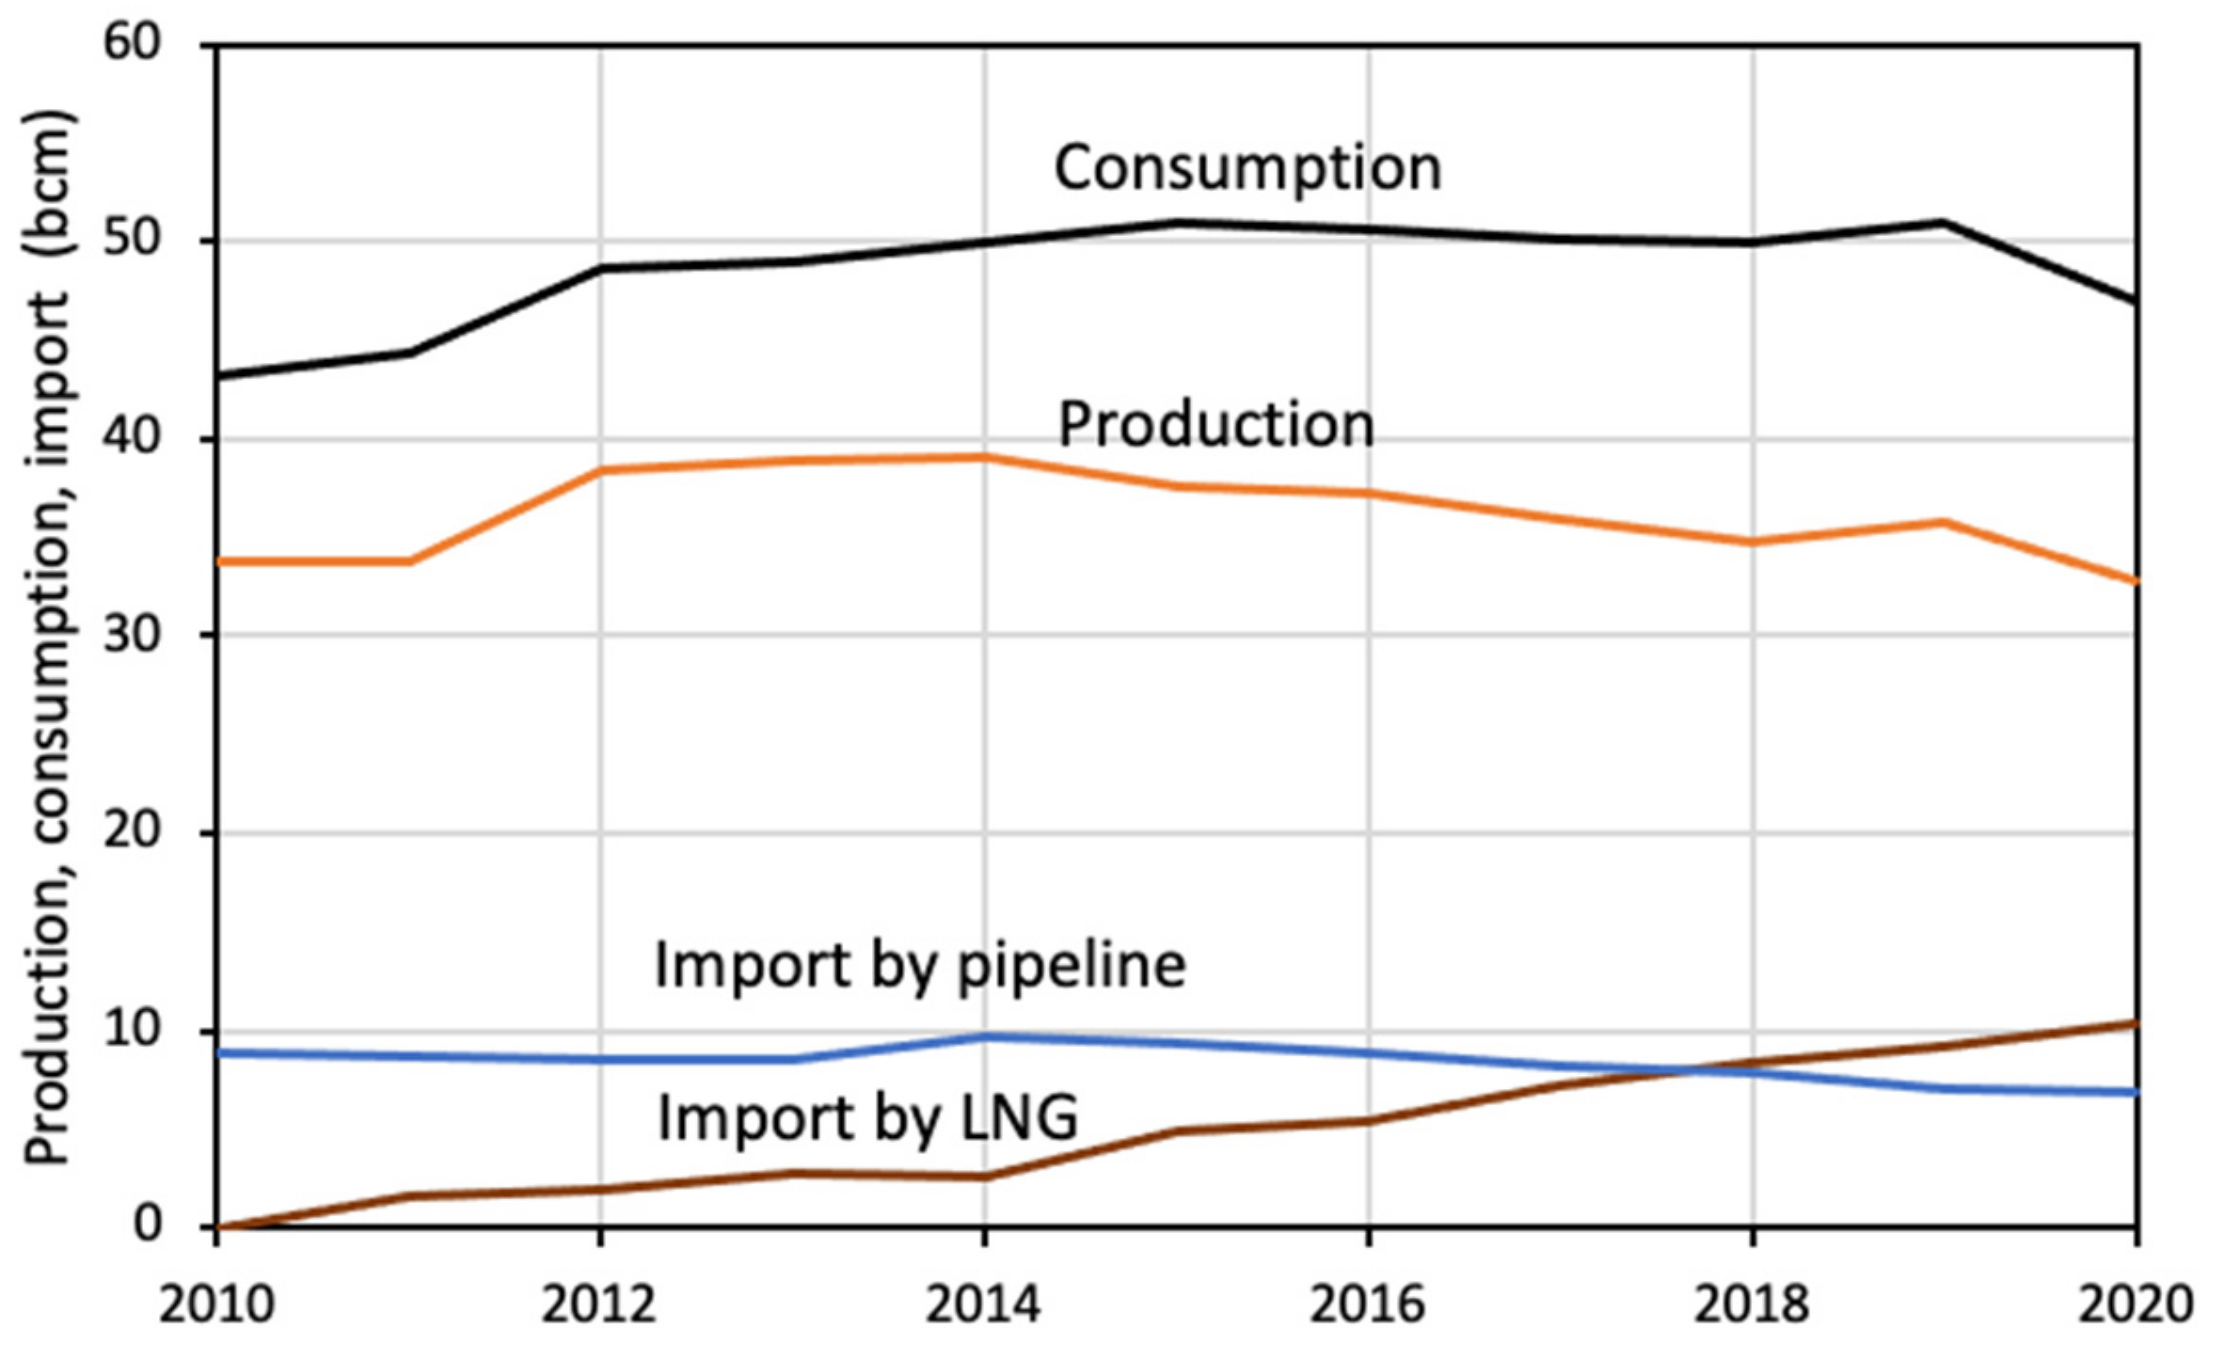
3.1.3. Gas Production and Consumption
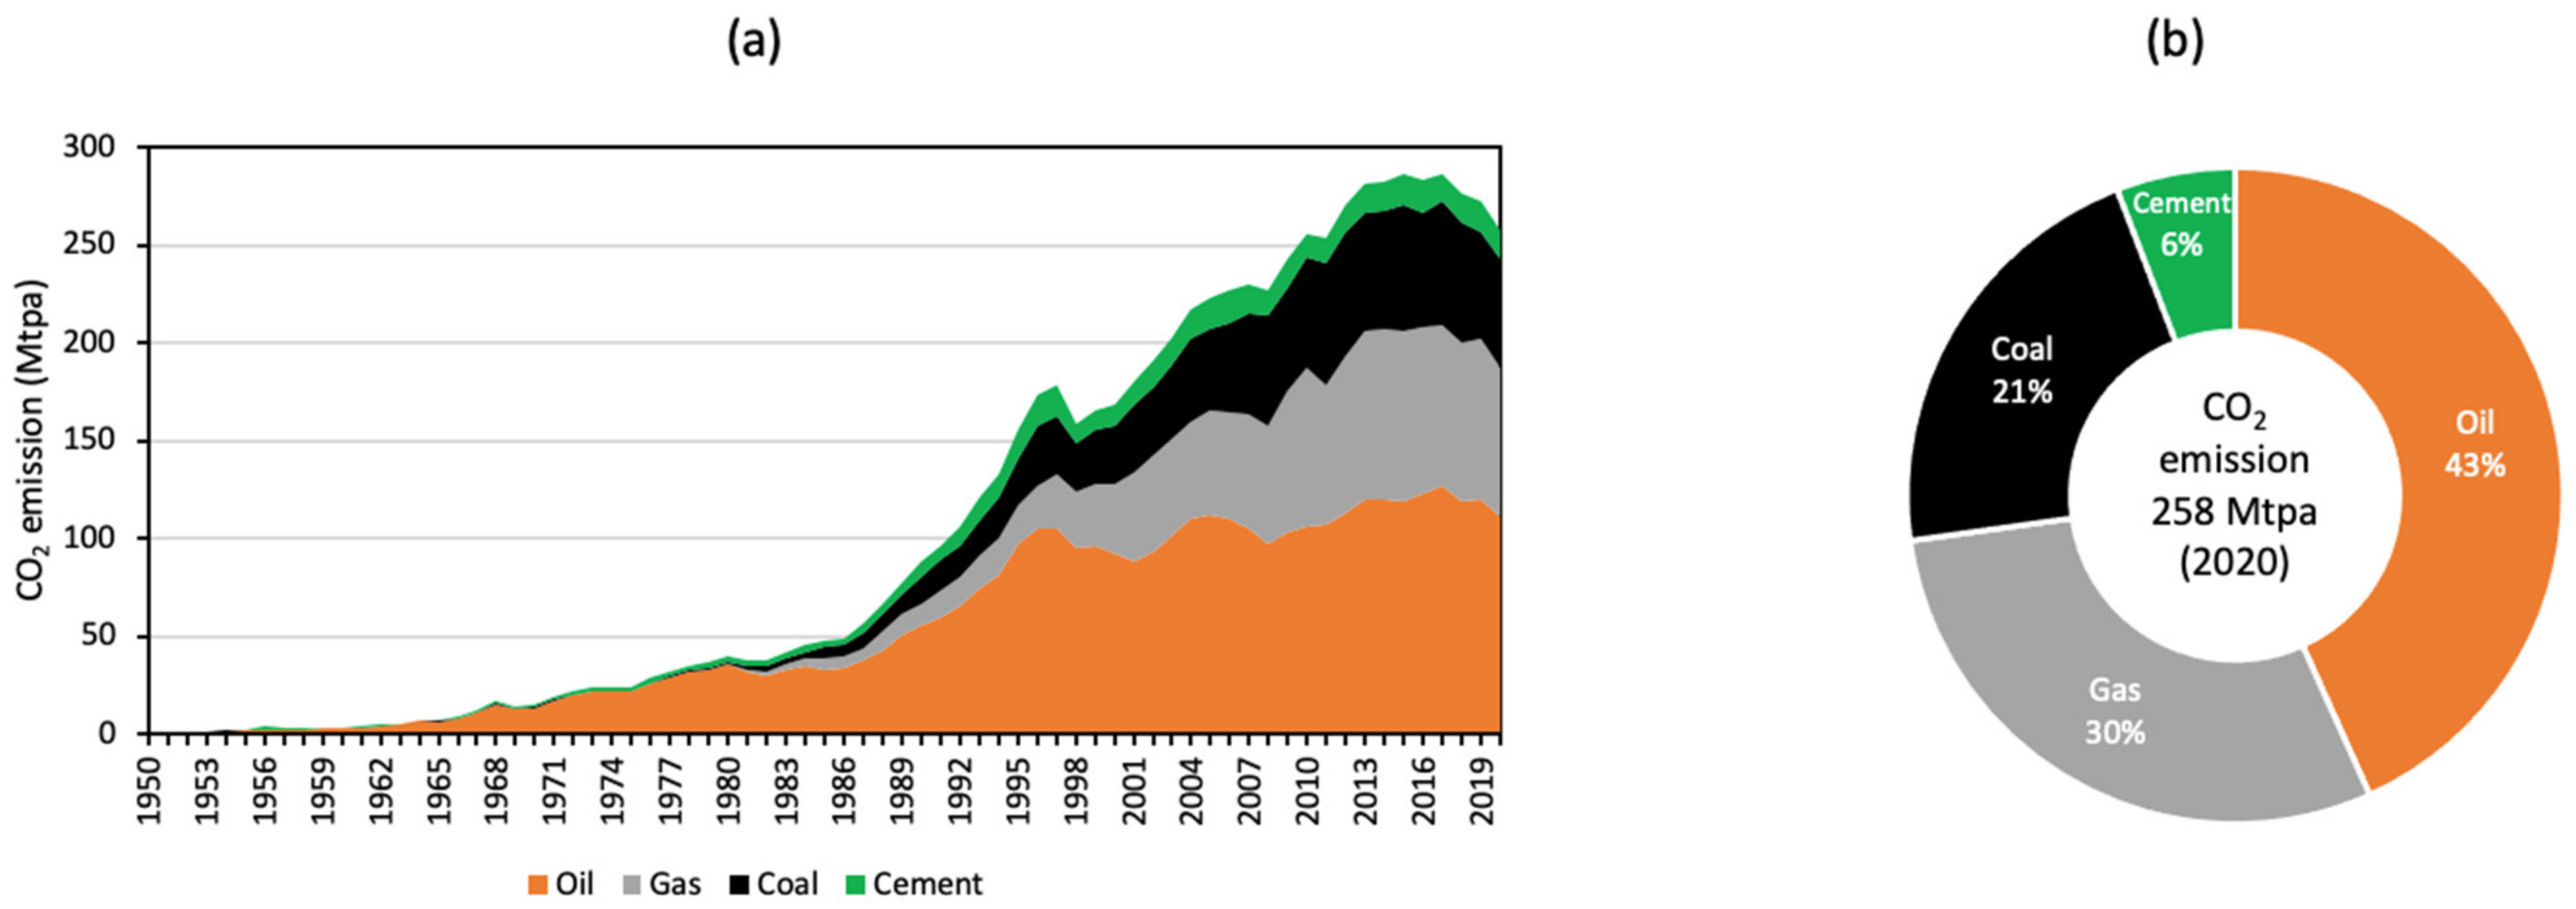
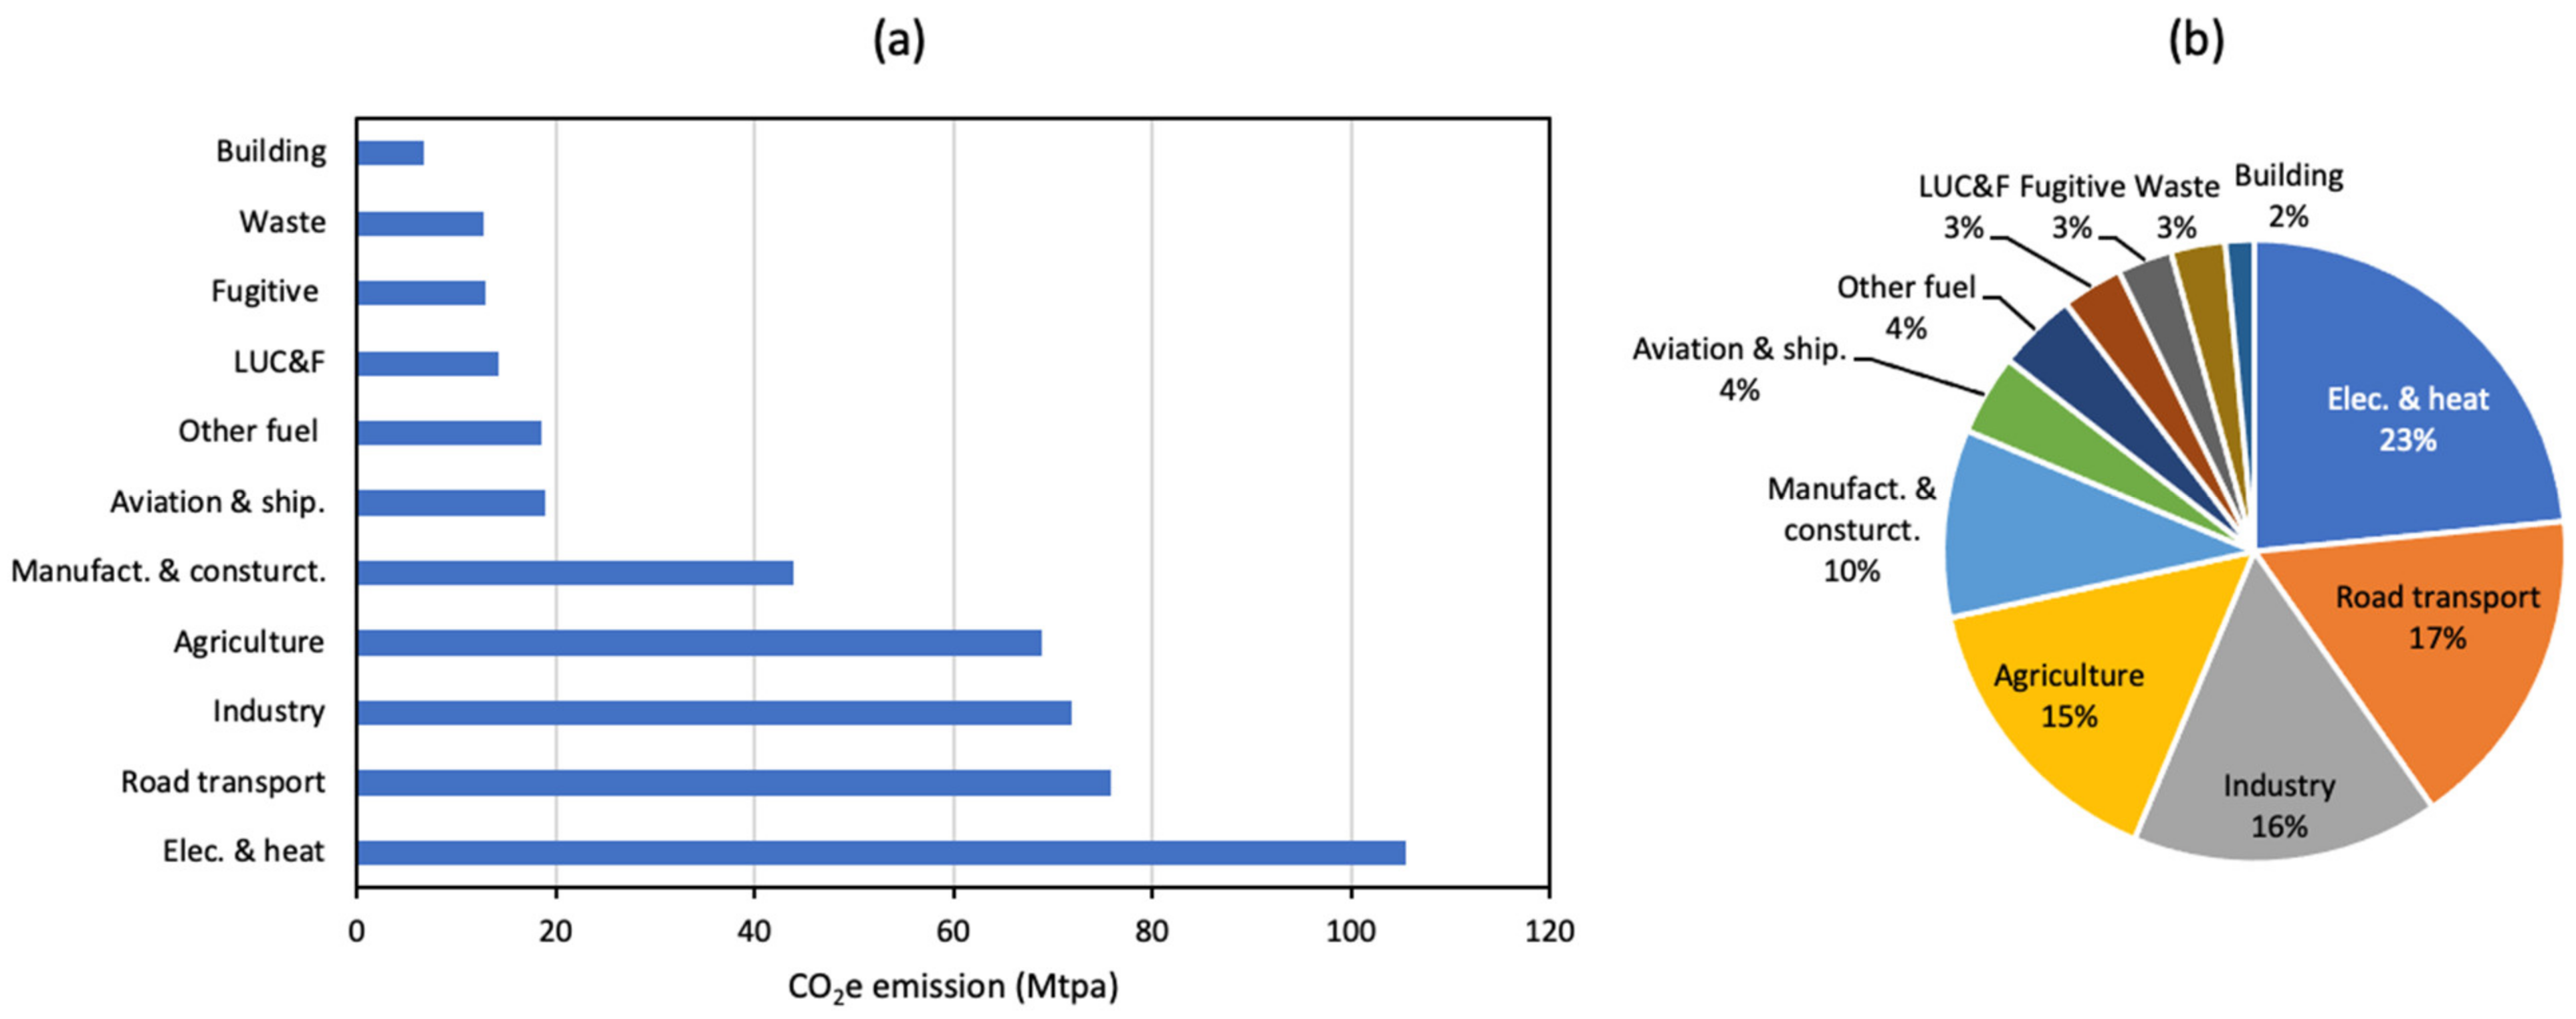
3.2. CO2 Emission
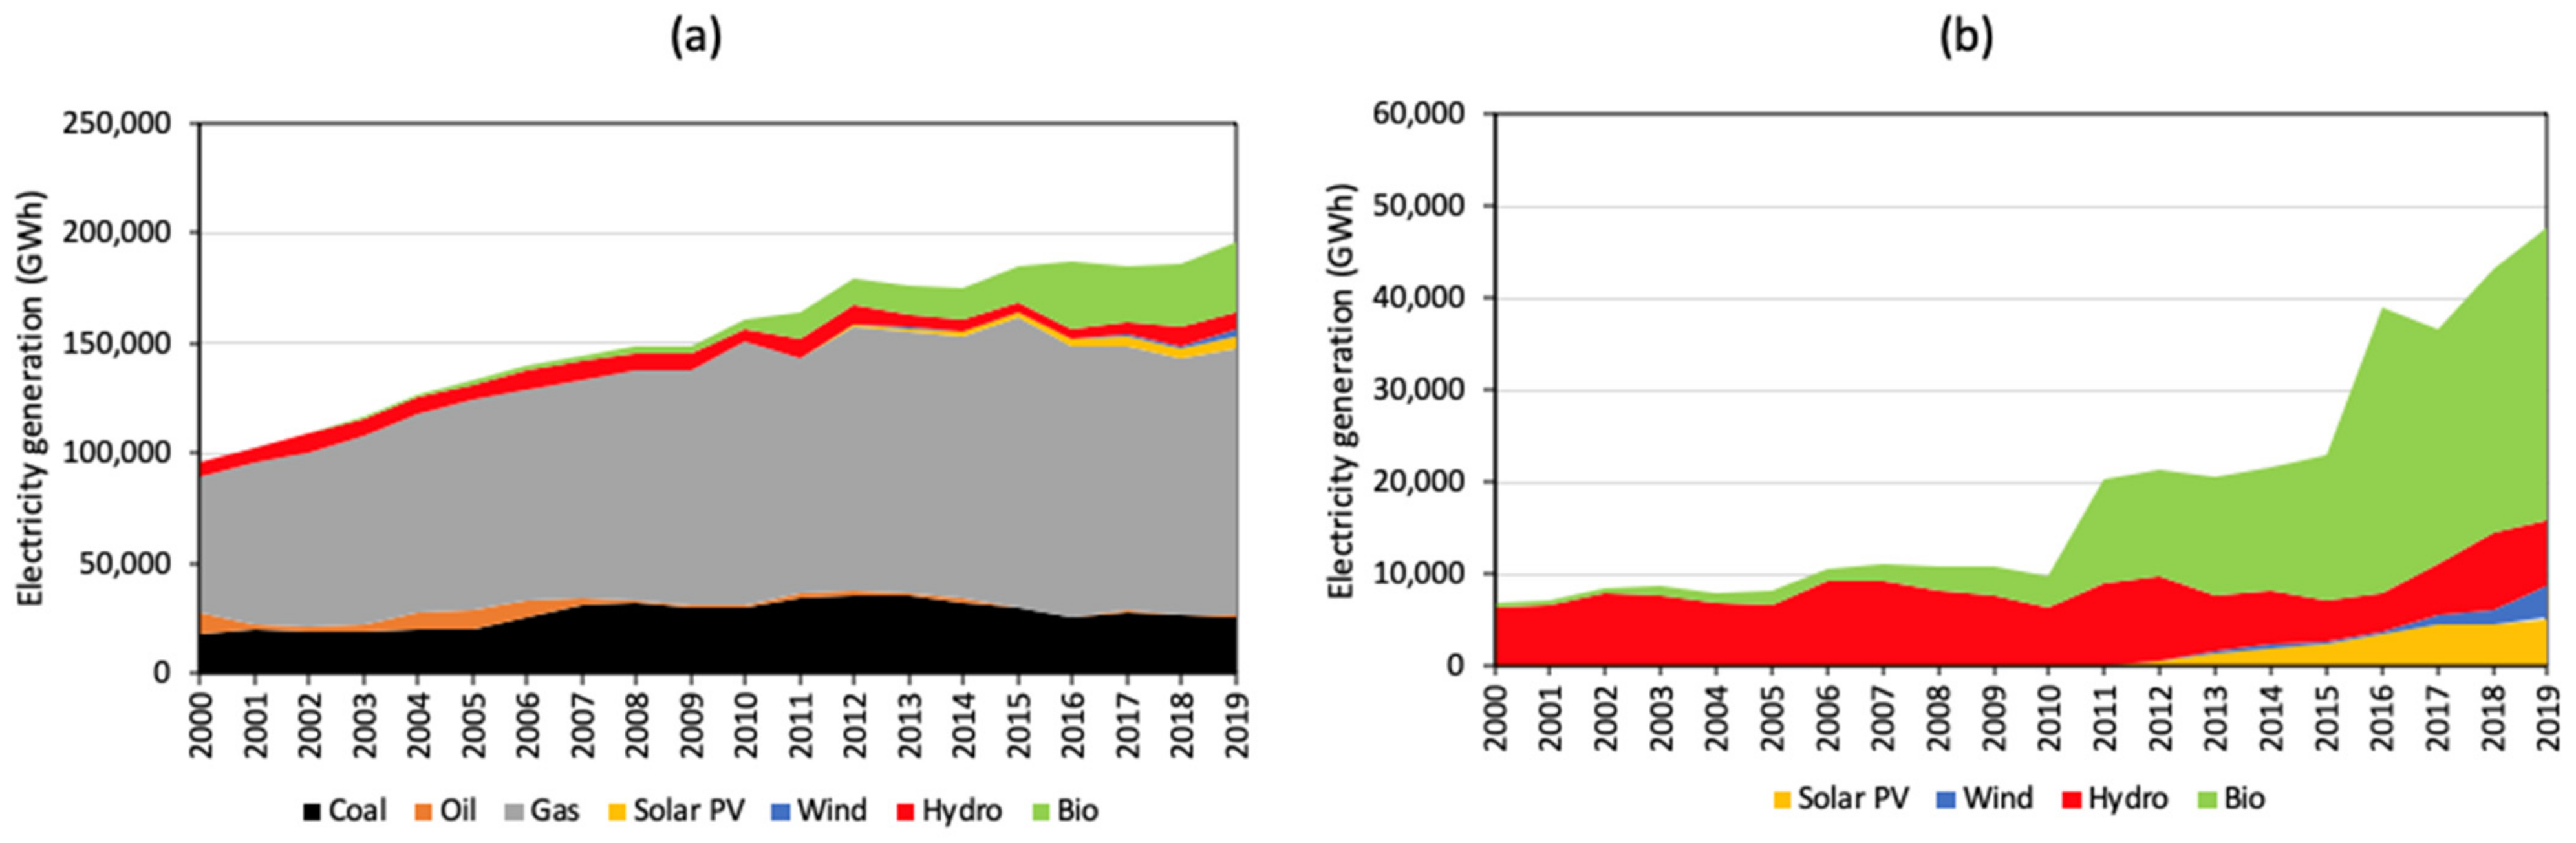
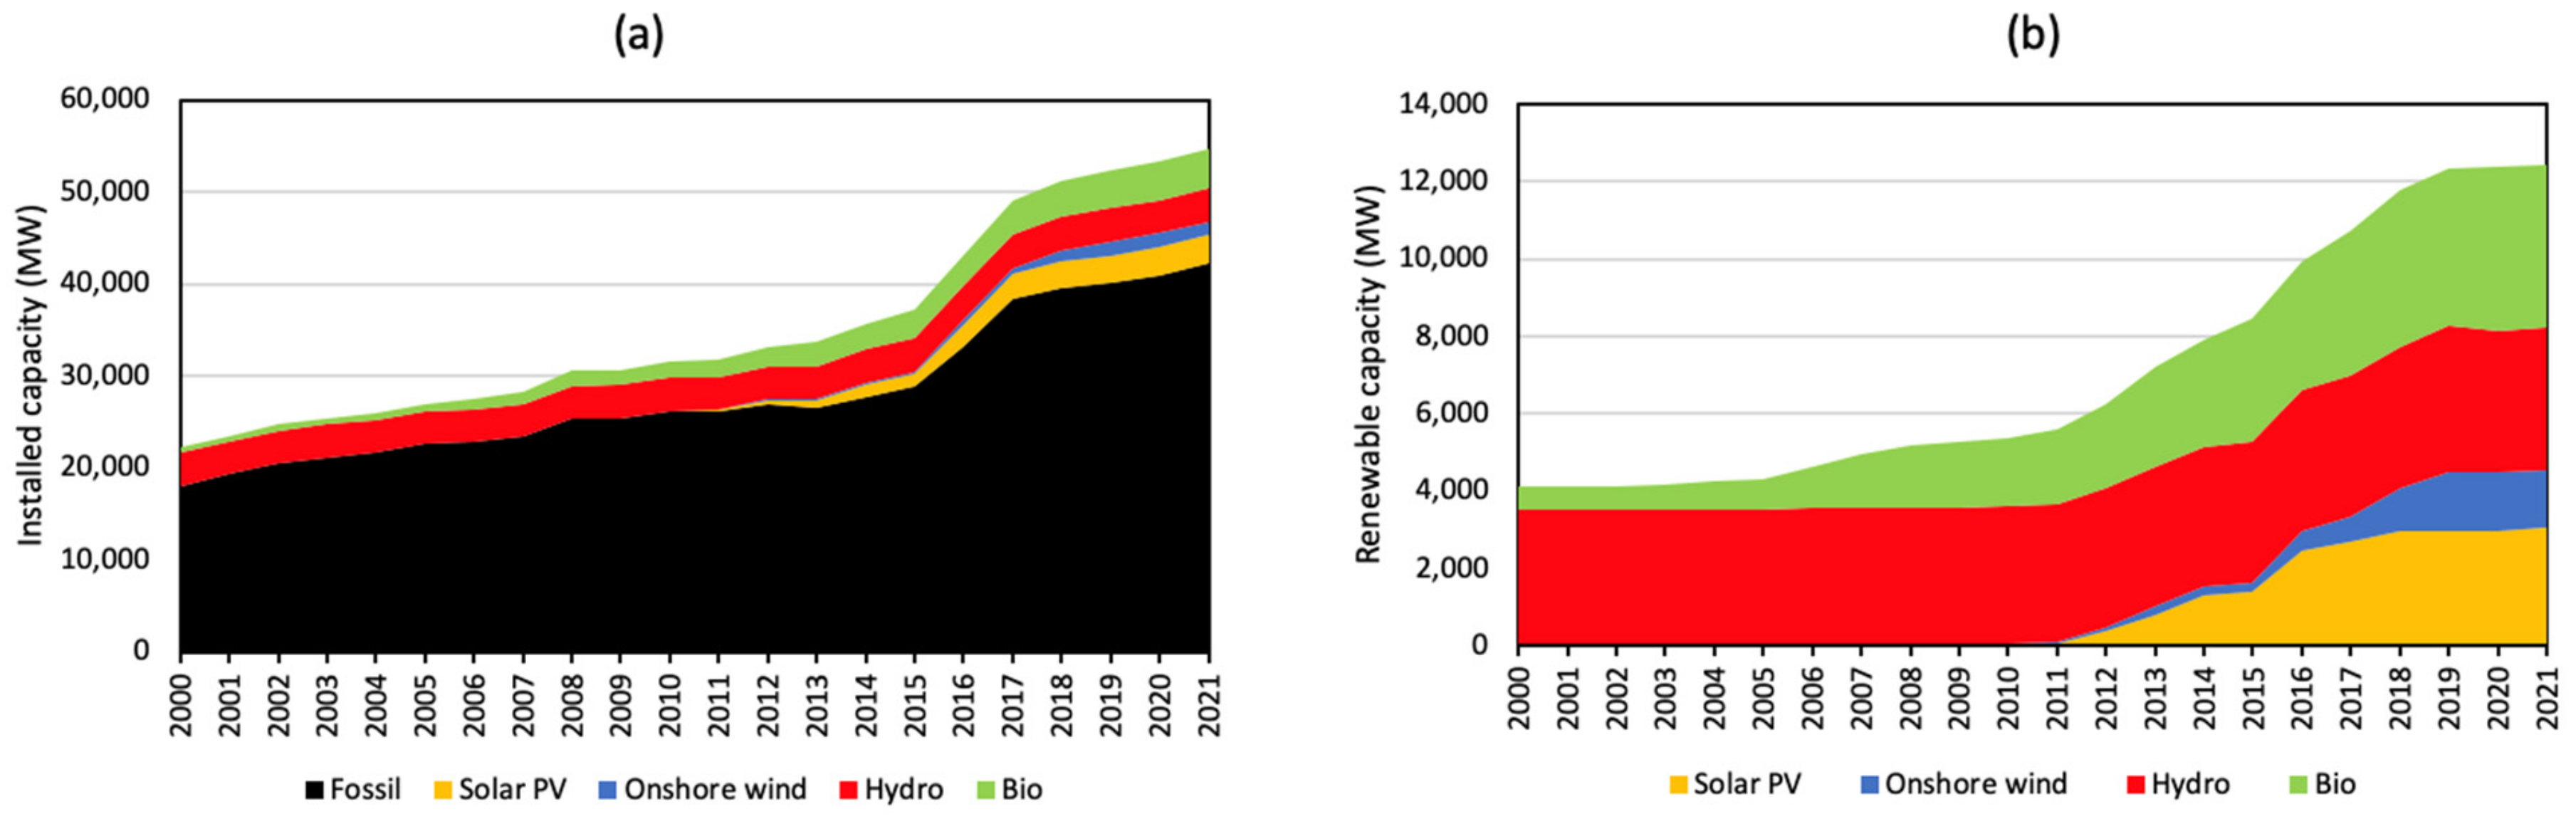
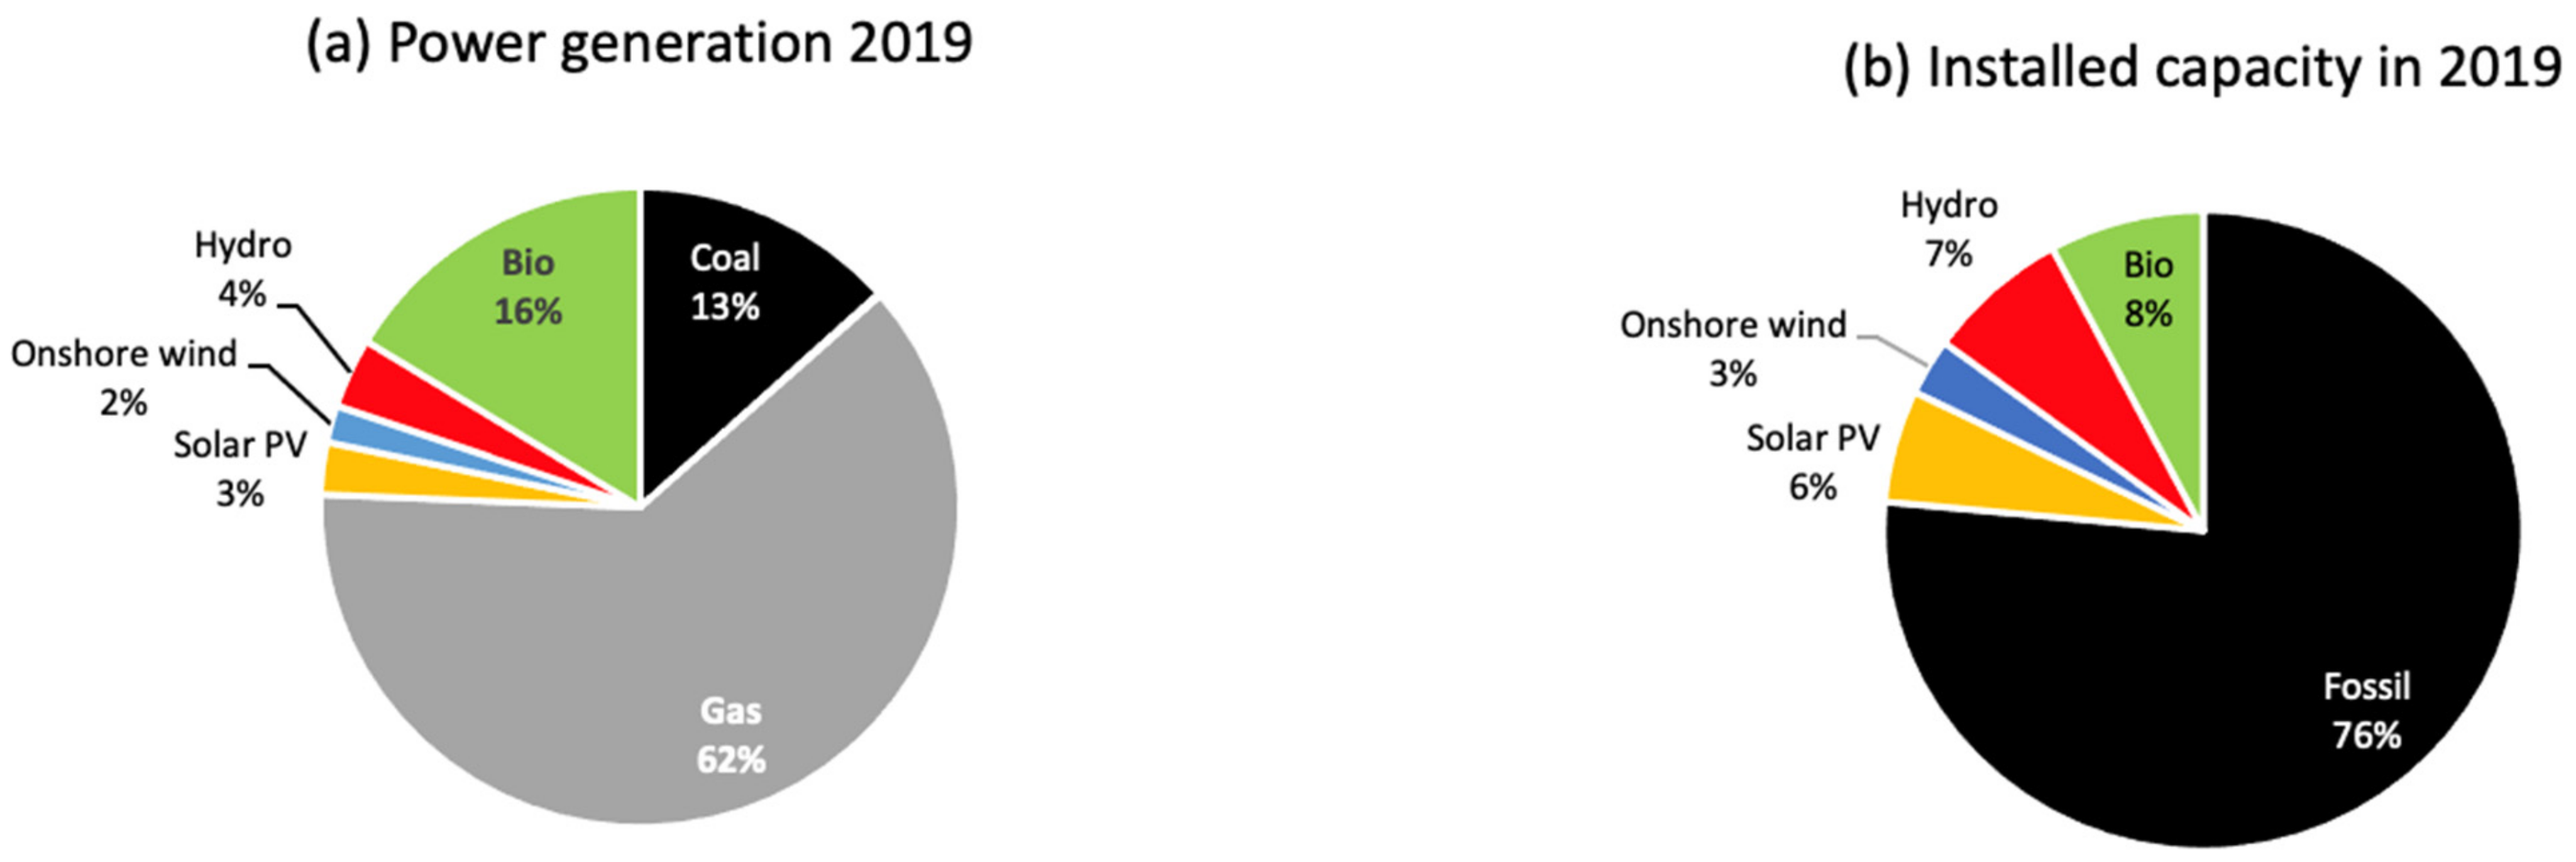
3.3. Status of Fossil and Renewable Electricity
3.3.1. Coal-Fired Electricity
3.3.2. Gas-Fired Electricity
3.3.3. Oil-Fired Electricity
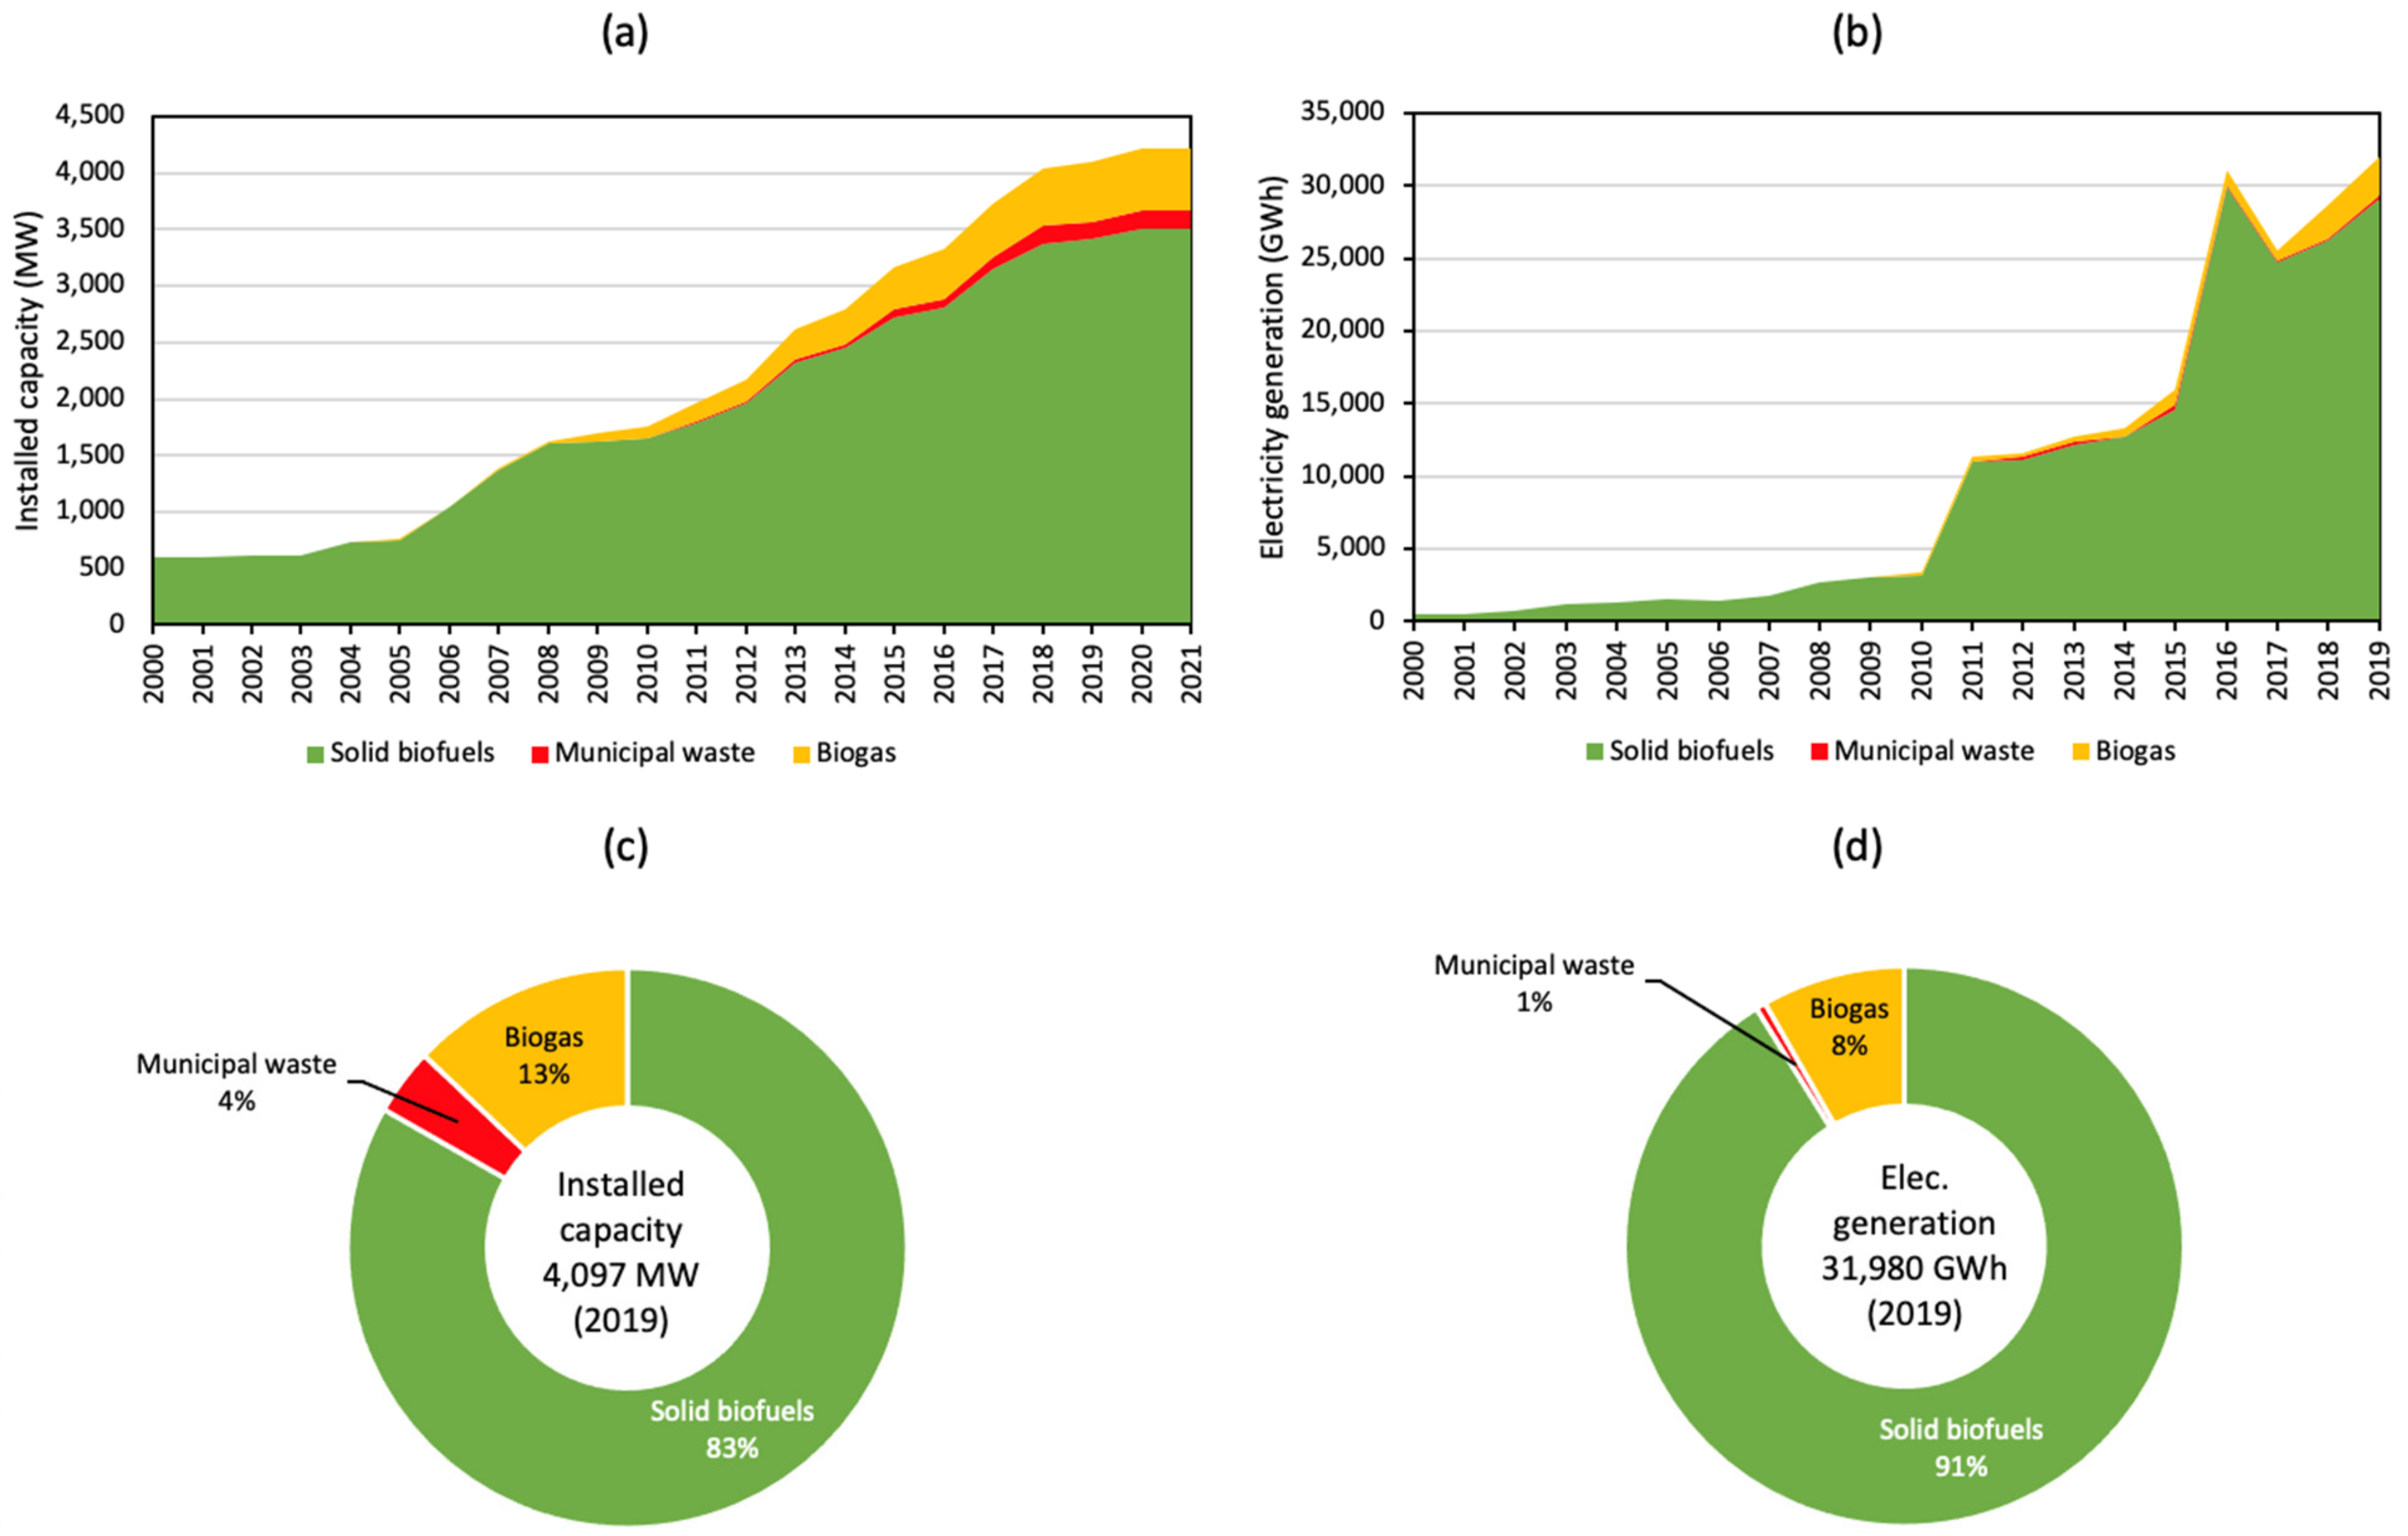
3.3.4. Bioelectricity
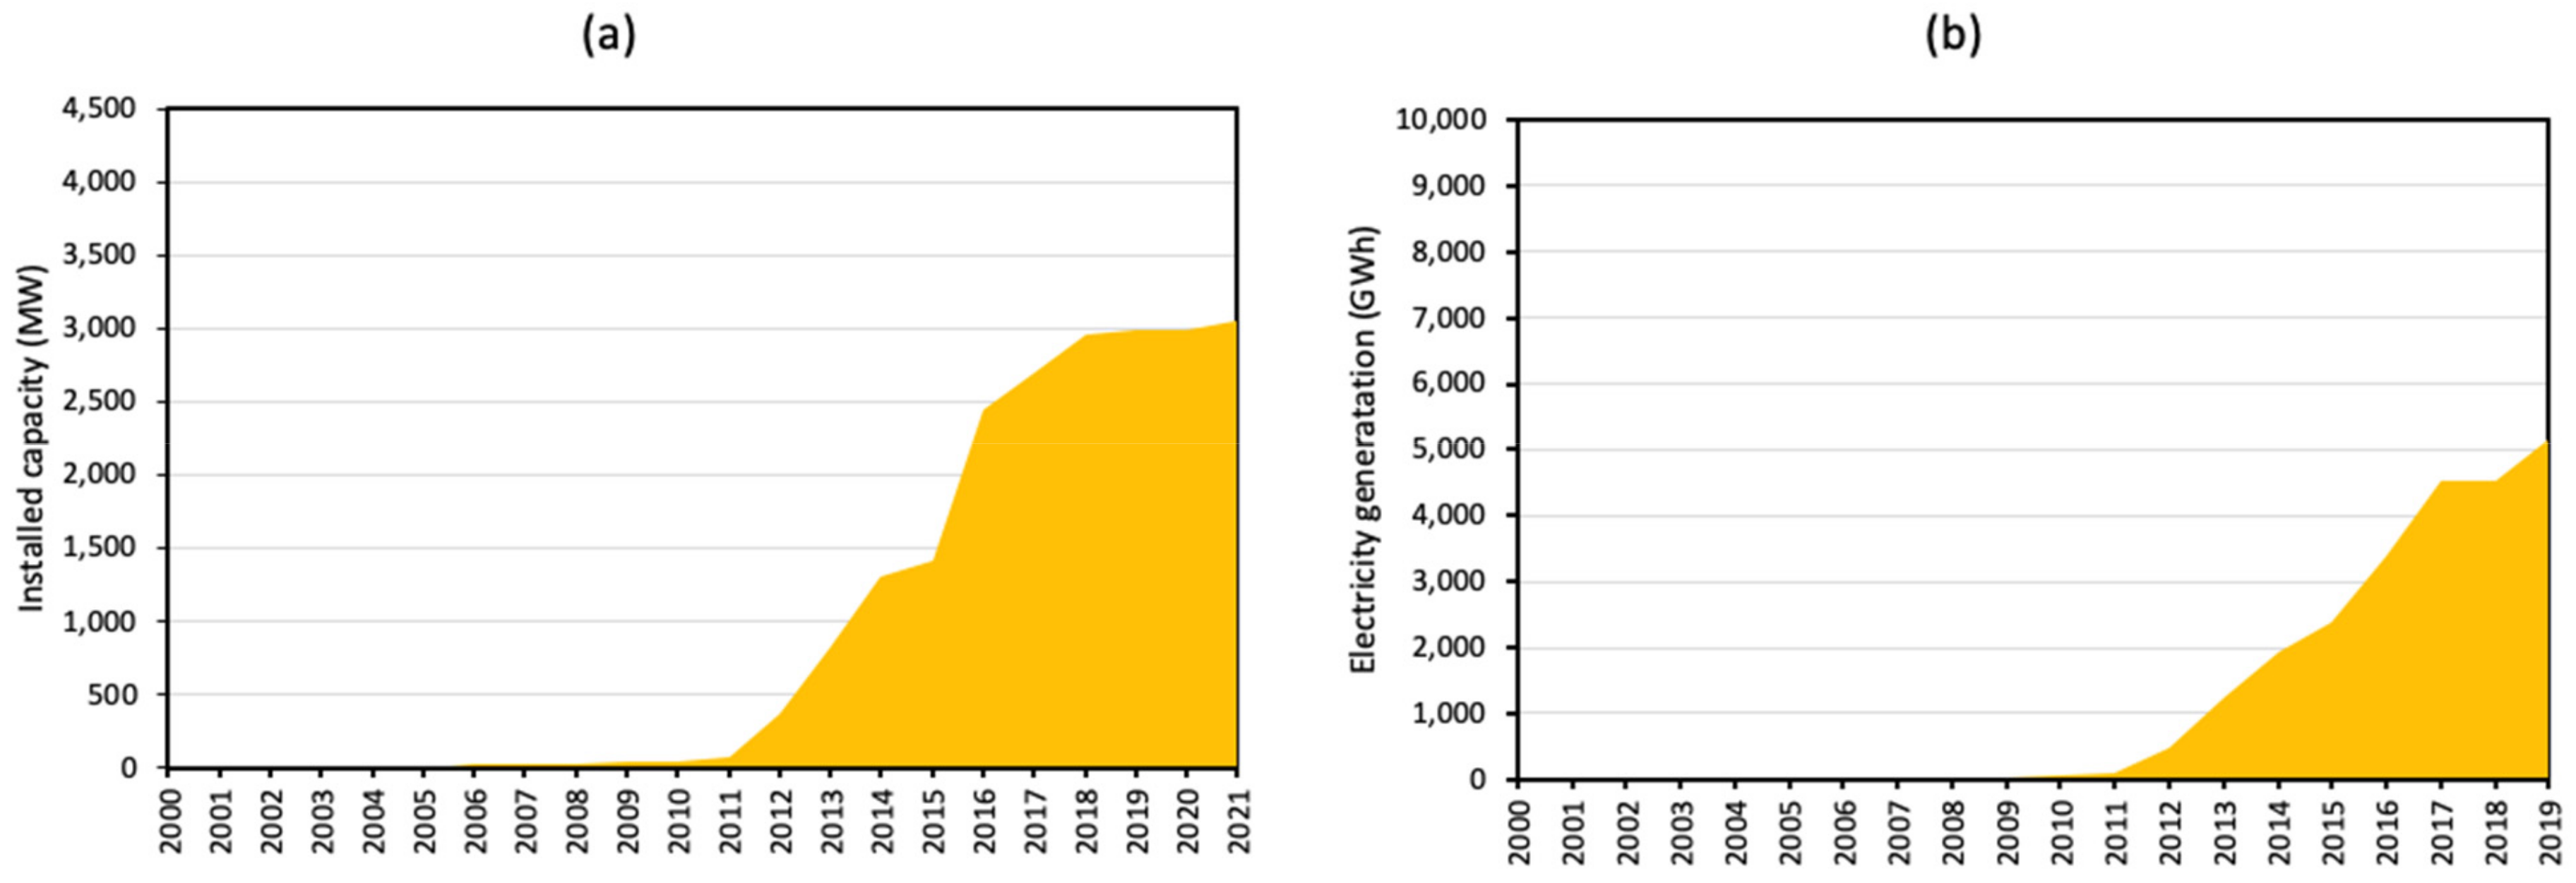
3.3.5. Solar PV
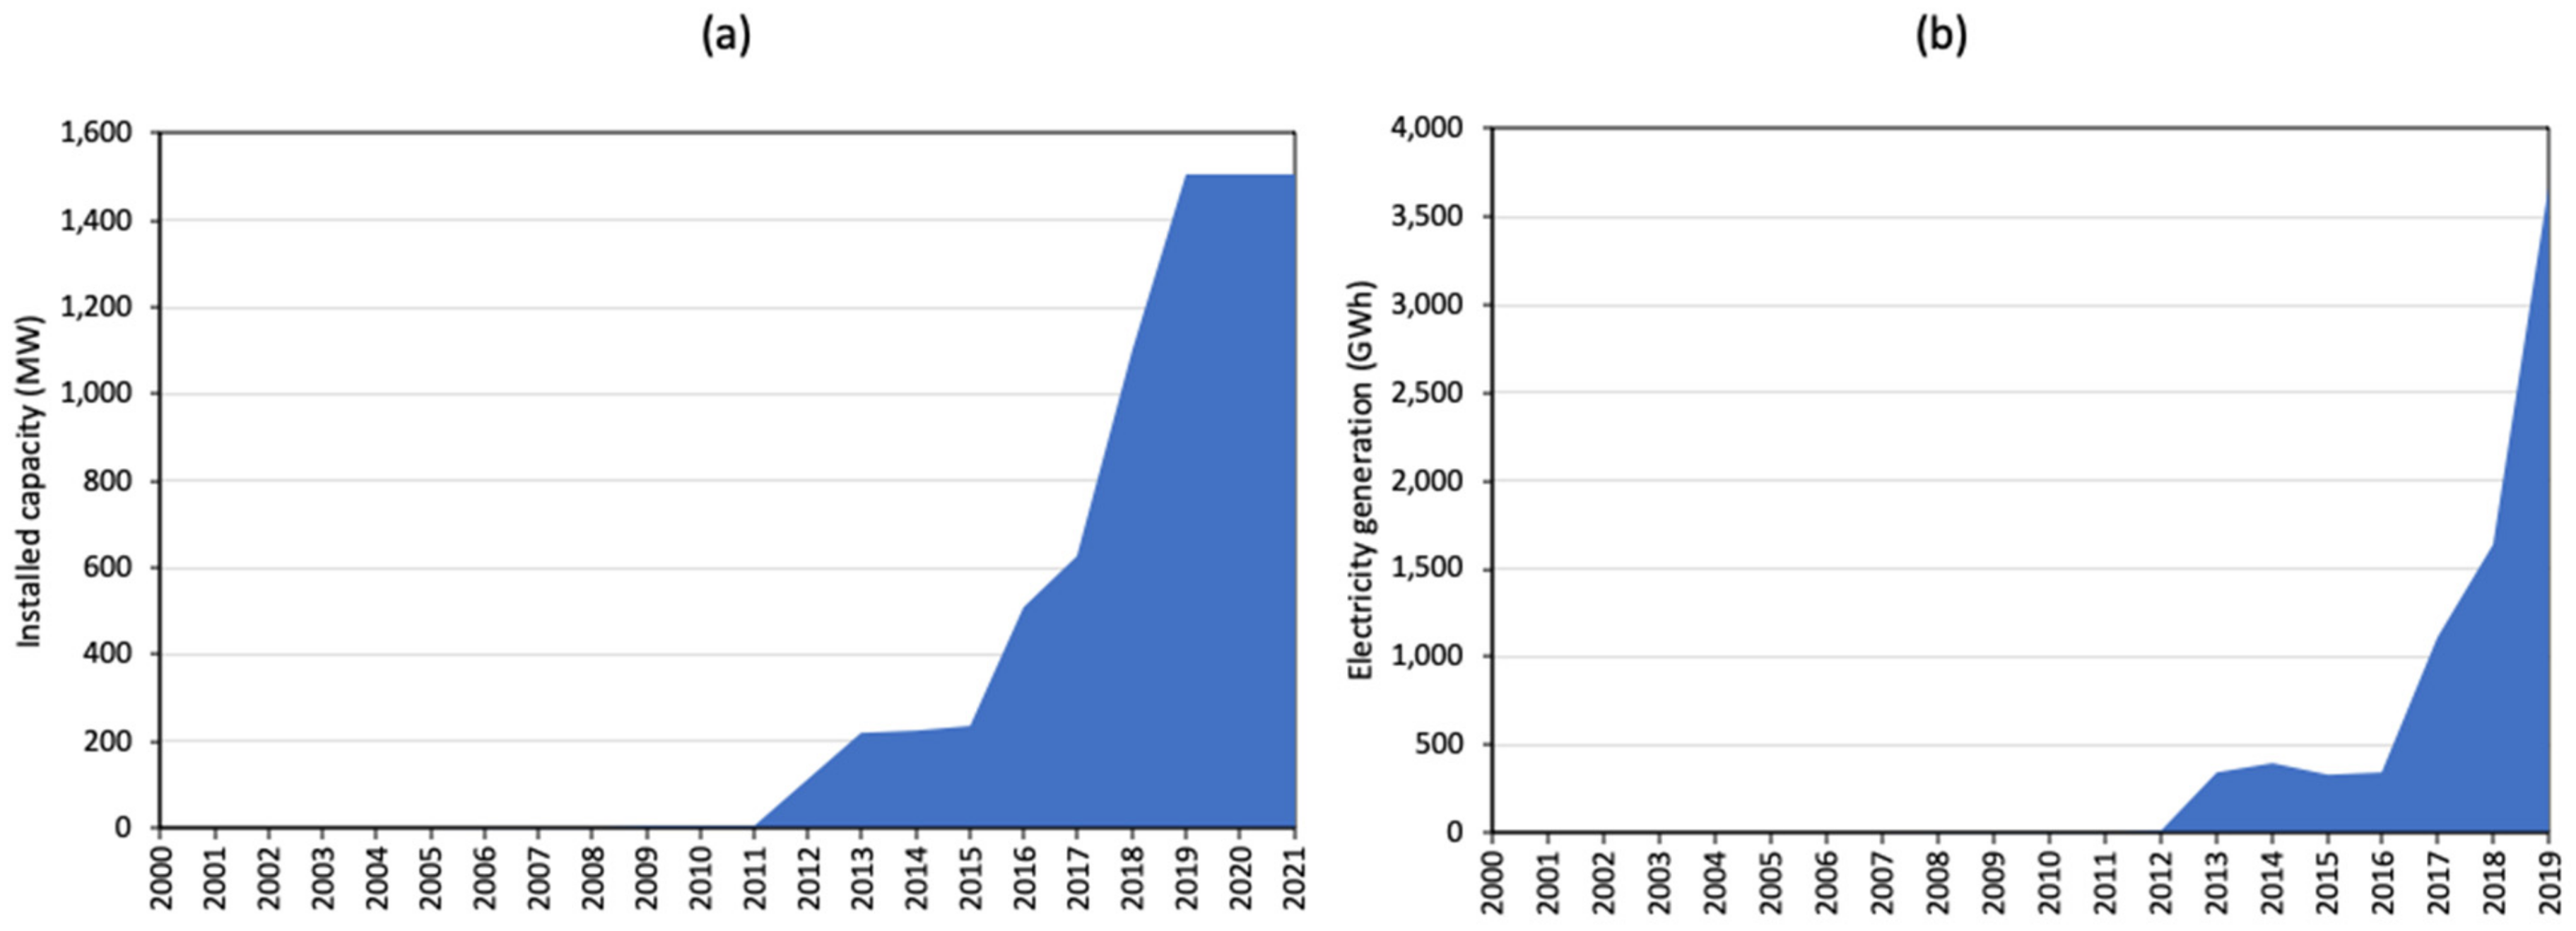
3.3.6. Wind Energy
3.3.7. Hydroelectricity
3.3.8. Geothermal Energy
3.3.9. Nuclear Energy
3.3.10. Estimated Technical Renewable Electricity Potential

| Resource | Potential Capacity (MW) | Potential Generation (TWh/y) | Installed Capacity in 2021 (MW) [23] | Installed/Potential (%) | Reference for Column 2 |
|---|---|---|---|---|---|
| Hydropower | 15,155 | 32 | 1738 | 11 | [32] |
| Pumped storage | 10,807 | 23 | 1929 | 18 | [9,35] |
| Hydro ROR | 1500 | 3 | Not available | Not available | [32] |
| Solar | 22,801 | 40 | 3044 | 13 | [8] |
| Onshore wind | 30,000 | 74 | 1507 | 5 | [9] |
| Offshore wind | 7000 | 17 | 0 | 0 | [9] |
| Biomass | 17,032 | 128 | 3668 | 22 | [9] |
| Biogas | 1507 | 11 | 554 | 37 | [9] |
| Geothermal | 6.6 | 0.02 | 0.3 | 5 | [36] |
| Total | 105,809 | 317 |
3.3.11. Comparison of Thailand’s Energy Profile with Those of ASEAN Countries
4. Results
4.1. Power Sector Decarbonization
4.1.1. Technology Screening for the Power Sector
4.1.2. Scenario Study for the Power Sector
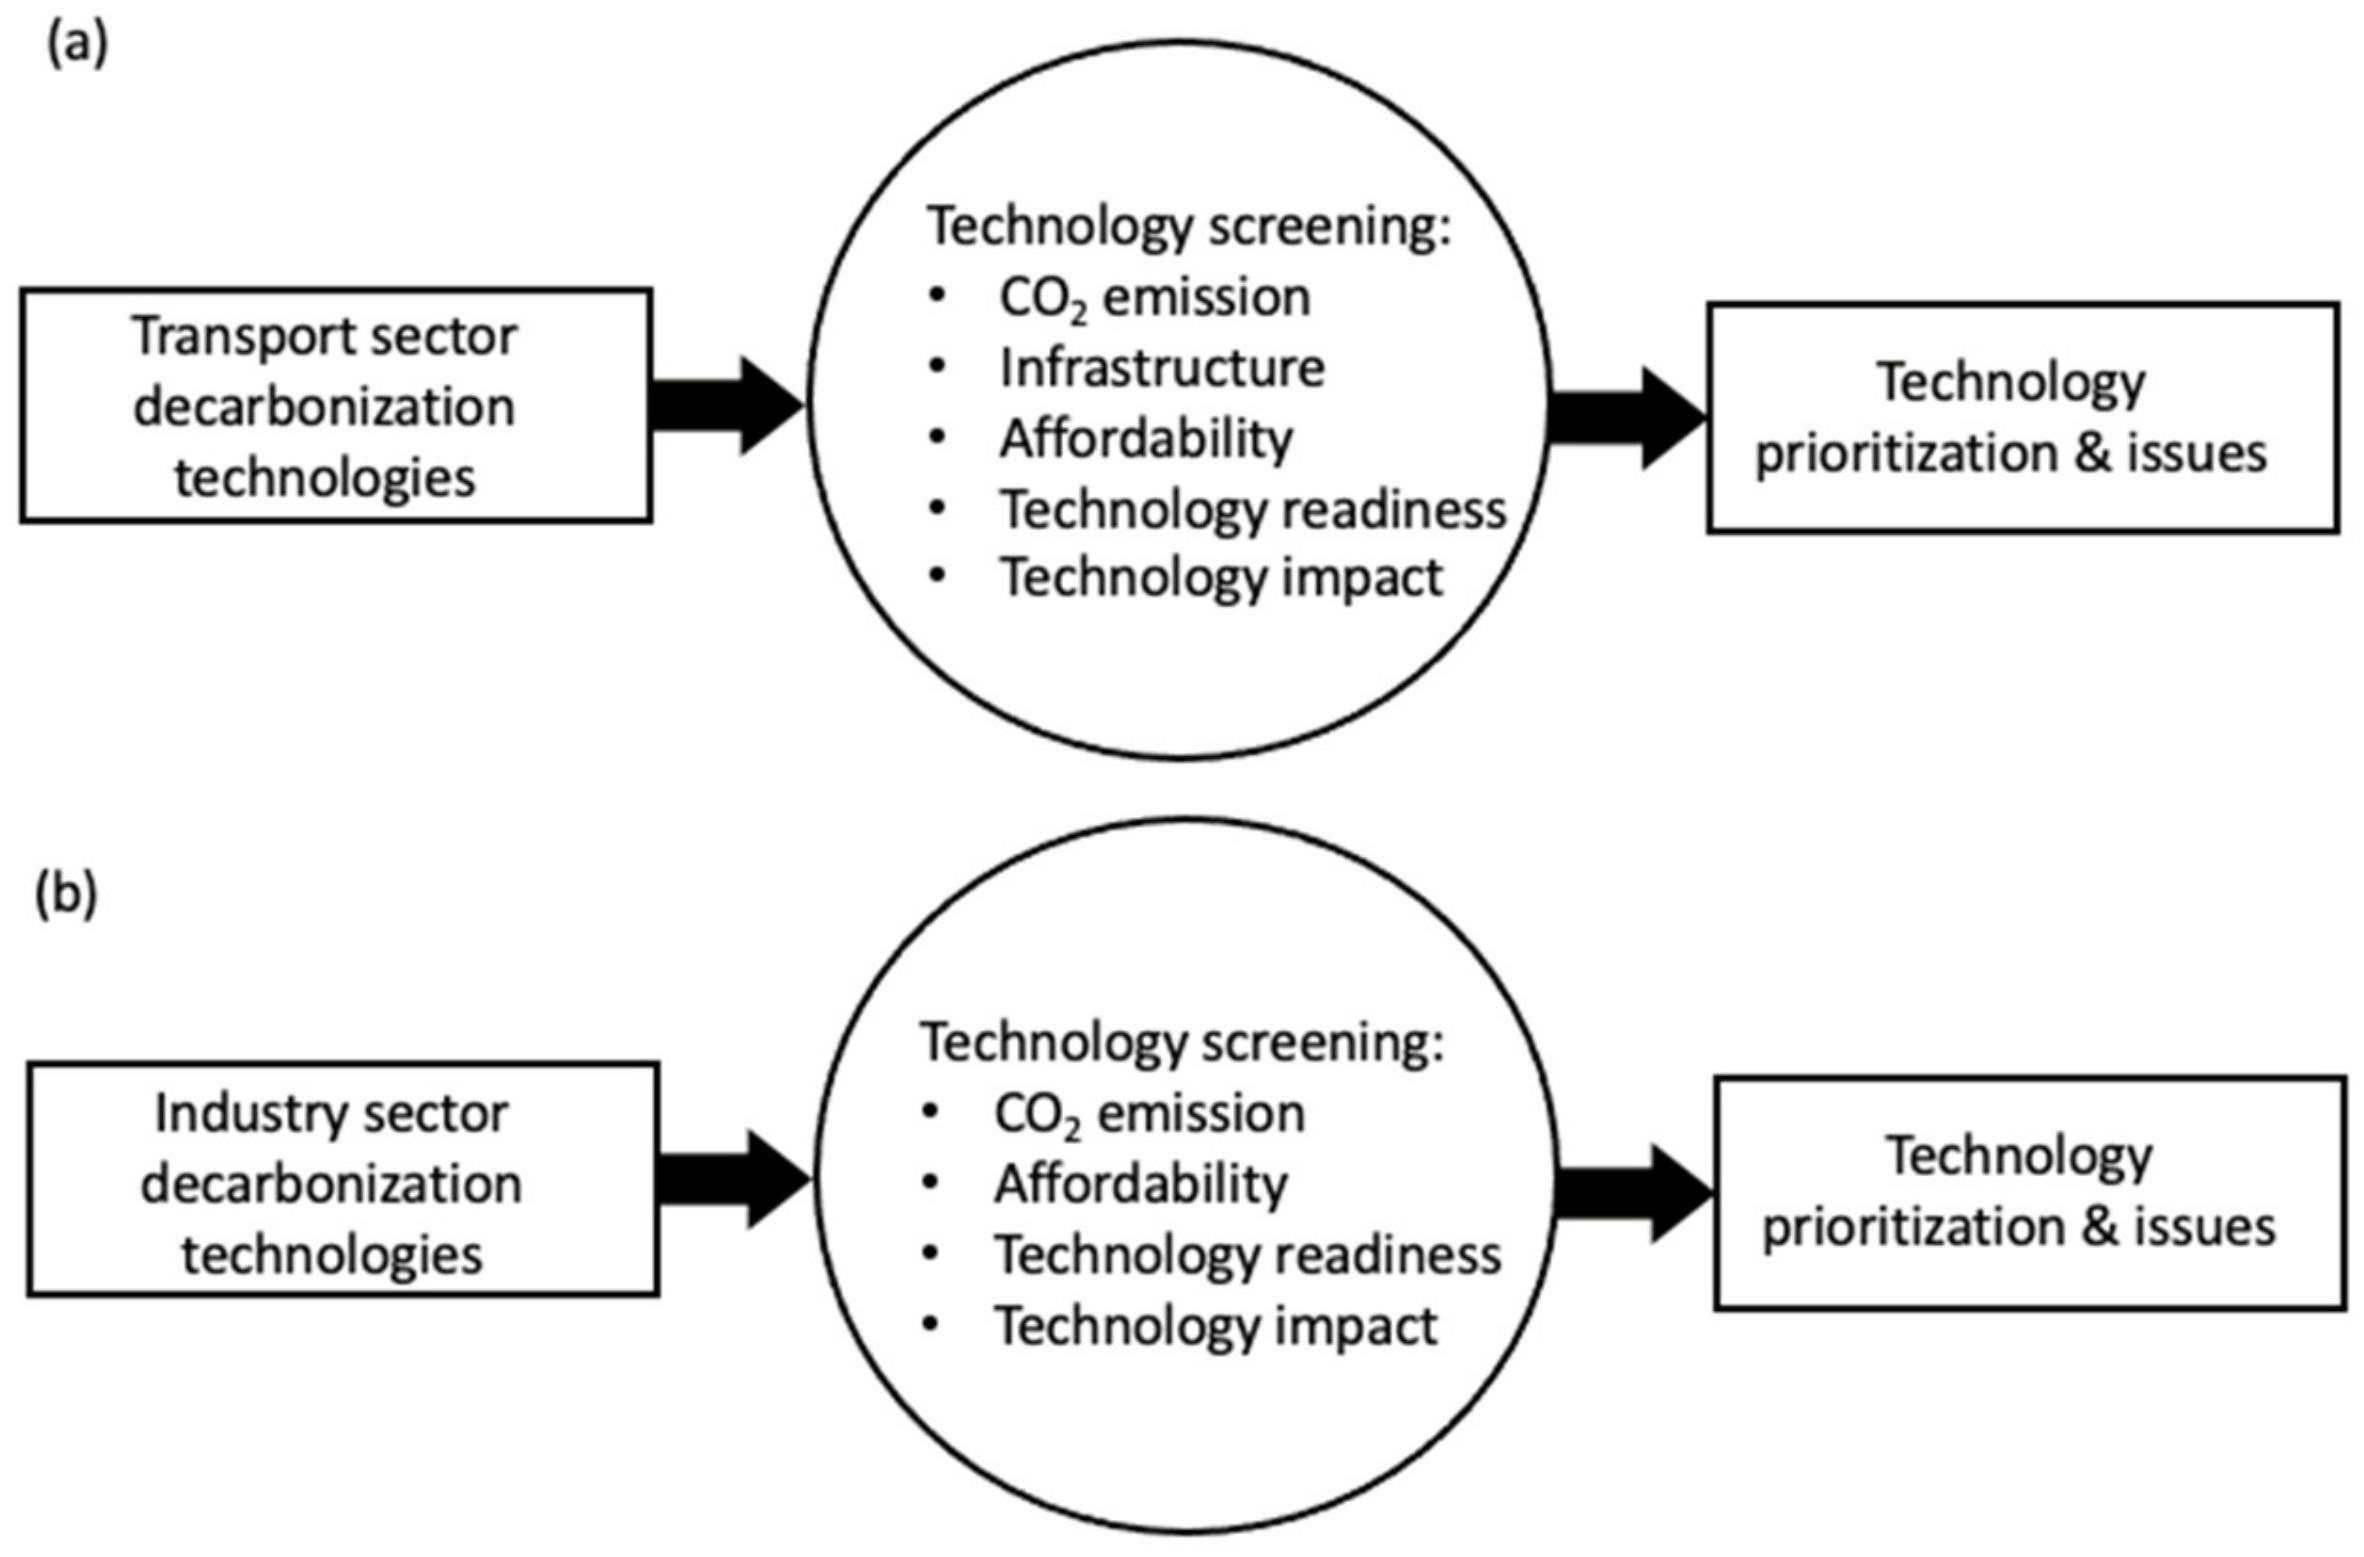
4.2. Decarbonizing Thailand’s Transport Sector
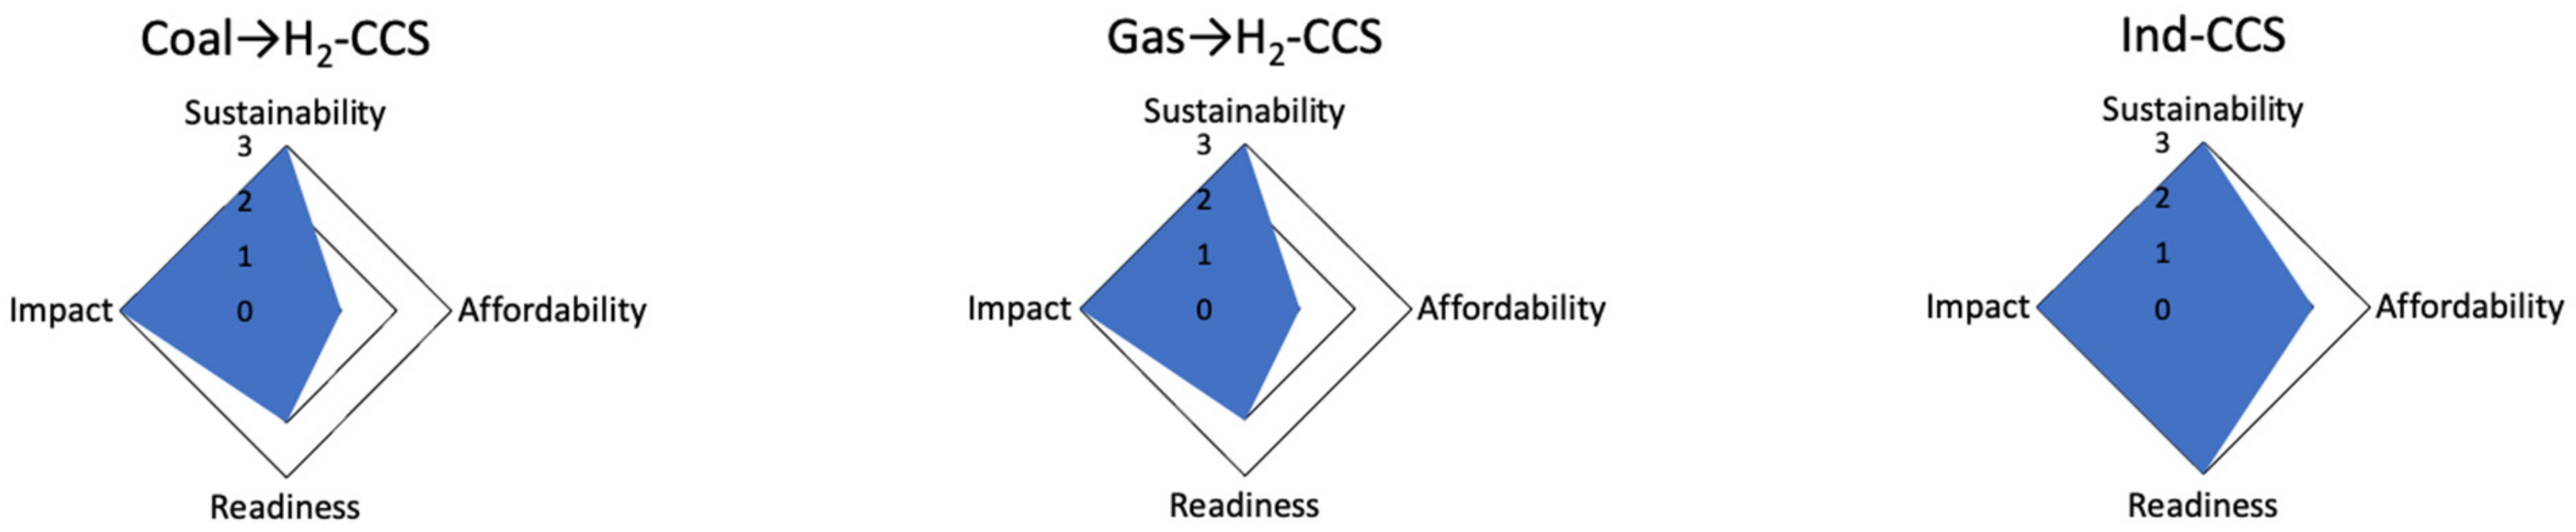
4.3. Decarbonizing Thailand’s Industry Sector
| Technology | Sustainability | Affordability | Technology Readiness | Technology Impact |
|---|---|---|---|---|
| Criterion | CO2 emission | Table A9 | TRL | Potential sector penetration (%) |
| Coal→H2-CCS | Low | >2 1 | 5 | >10 |
| Gas→H2-CCS | Low | >2 1 | 5 | >10 |
| Ind-CCS | Low | 23–125 2 | 8 | >10 |
| Tier Level | Technology | Key Issues to Be Addressed | Relative Score 1 |
|---|---|---|---|
| Tier 1 (highest potential) | Ind-CCS |
| 11 |
| Tier 2 (high potential) | Coal→H2-CCS |
| 9 |
| Gas→H2-CCS |
| 9 |
5. The Role of CCS in Thailand’s Energy Transition
6. Implications for Energy Policy
6.1. Engaging State-Owned Enterprises in Decarbonization
6.2. Promulgating a Credible Carbon Tax
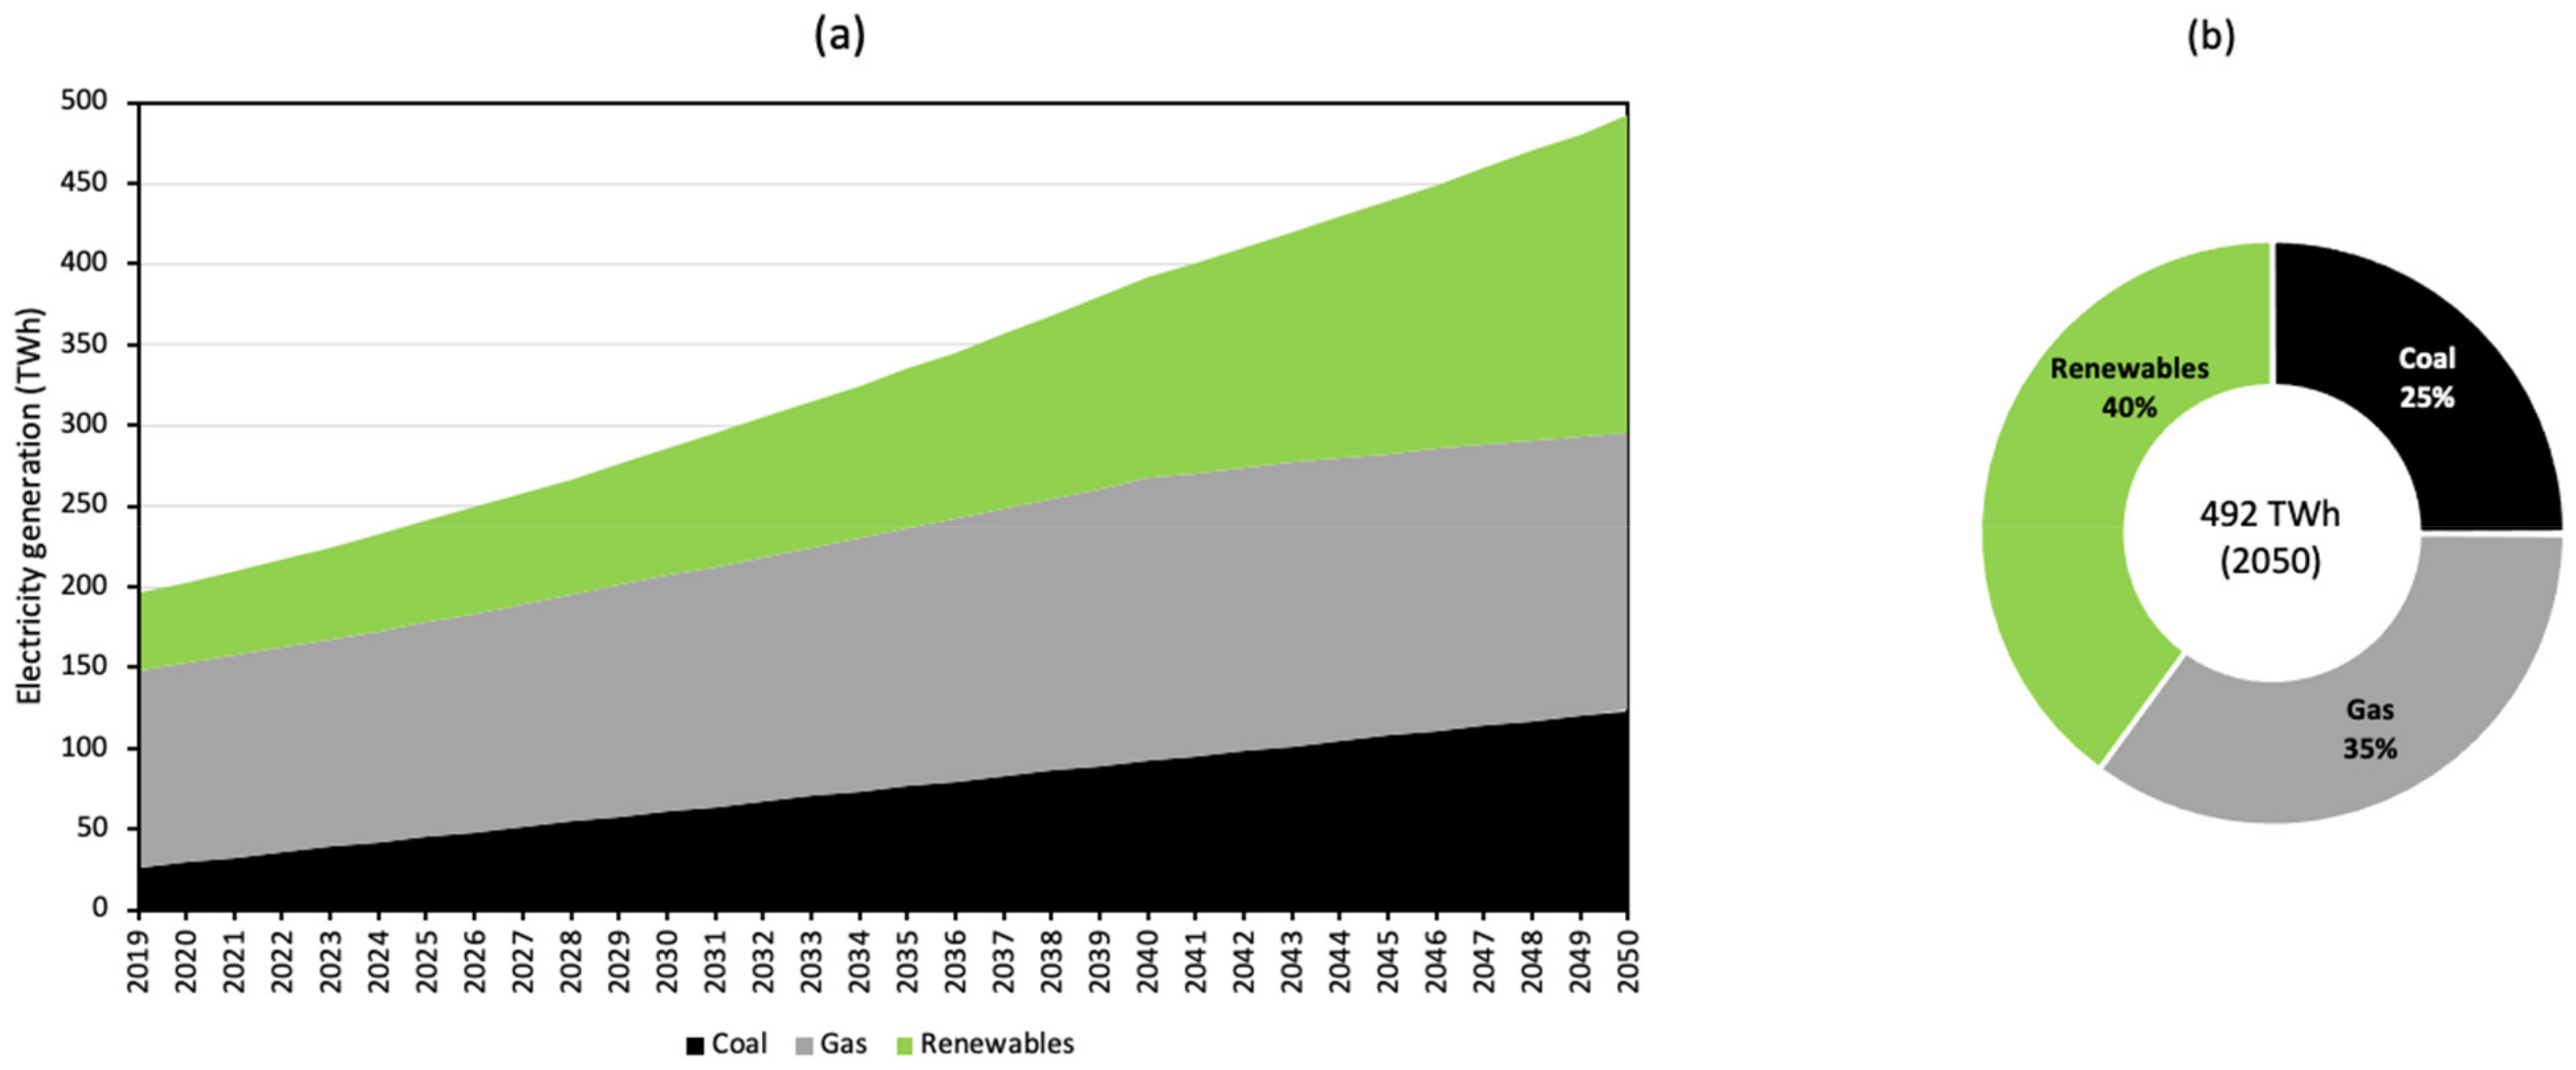
6.3. Switching from Coal to Gas in Power Generation
6.4. Implementing Large-Scale CCS Projects
6.5. Addressing Sustainable Issues of Renewable Energies
6.6. Formulating a Hydrogen Strategy
7. Discussion
8. Conclusions
- For the power sector, technologies with the highest decarbonization potential are coal→gas, CP-CCS and GP-CCS. Next in potential are hydro ROR, hydro, bioenergy, solar PV and onshore wind. Except for hydro ROR, these renewable energies have sustainability issues that need to be addressed.
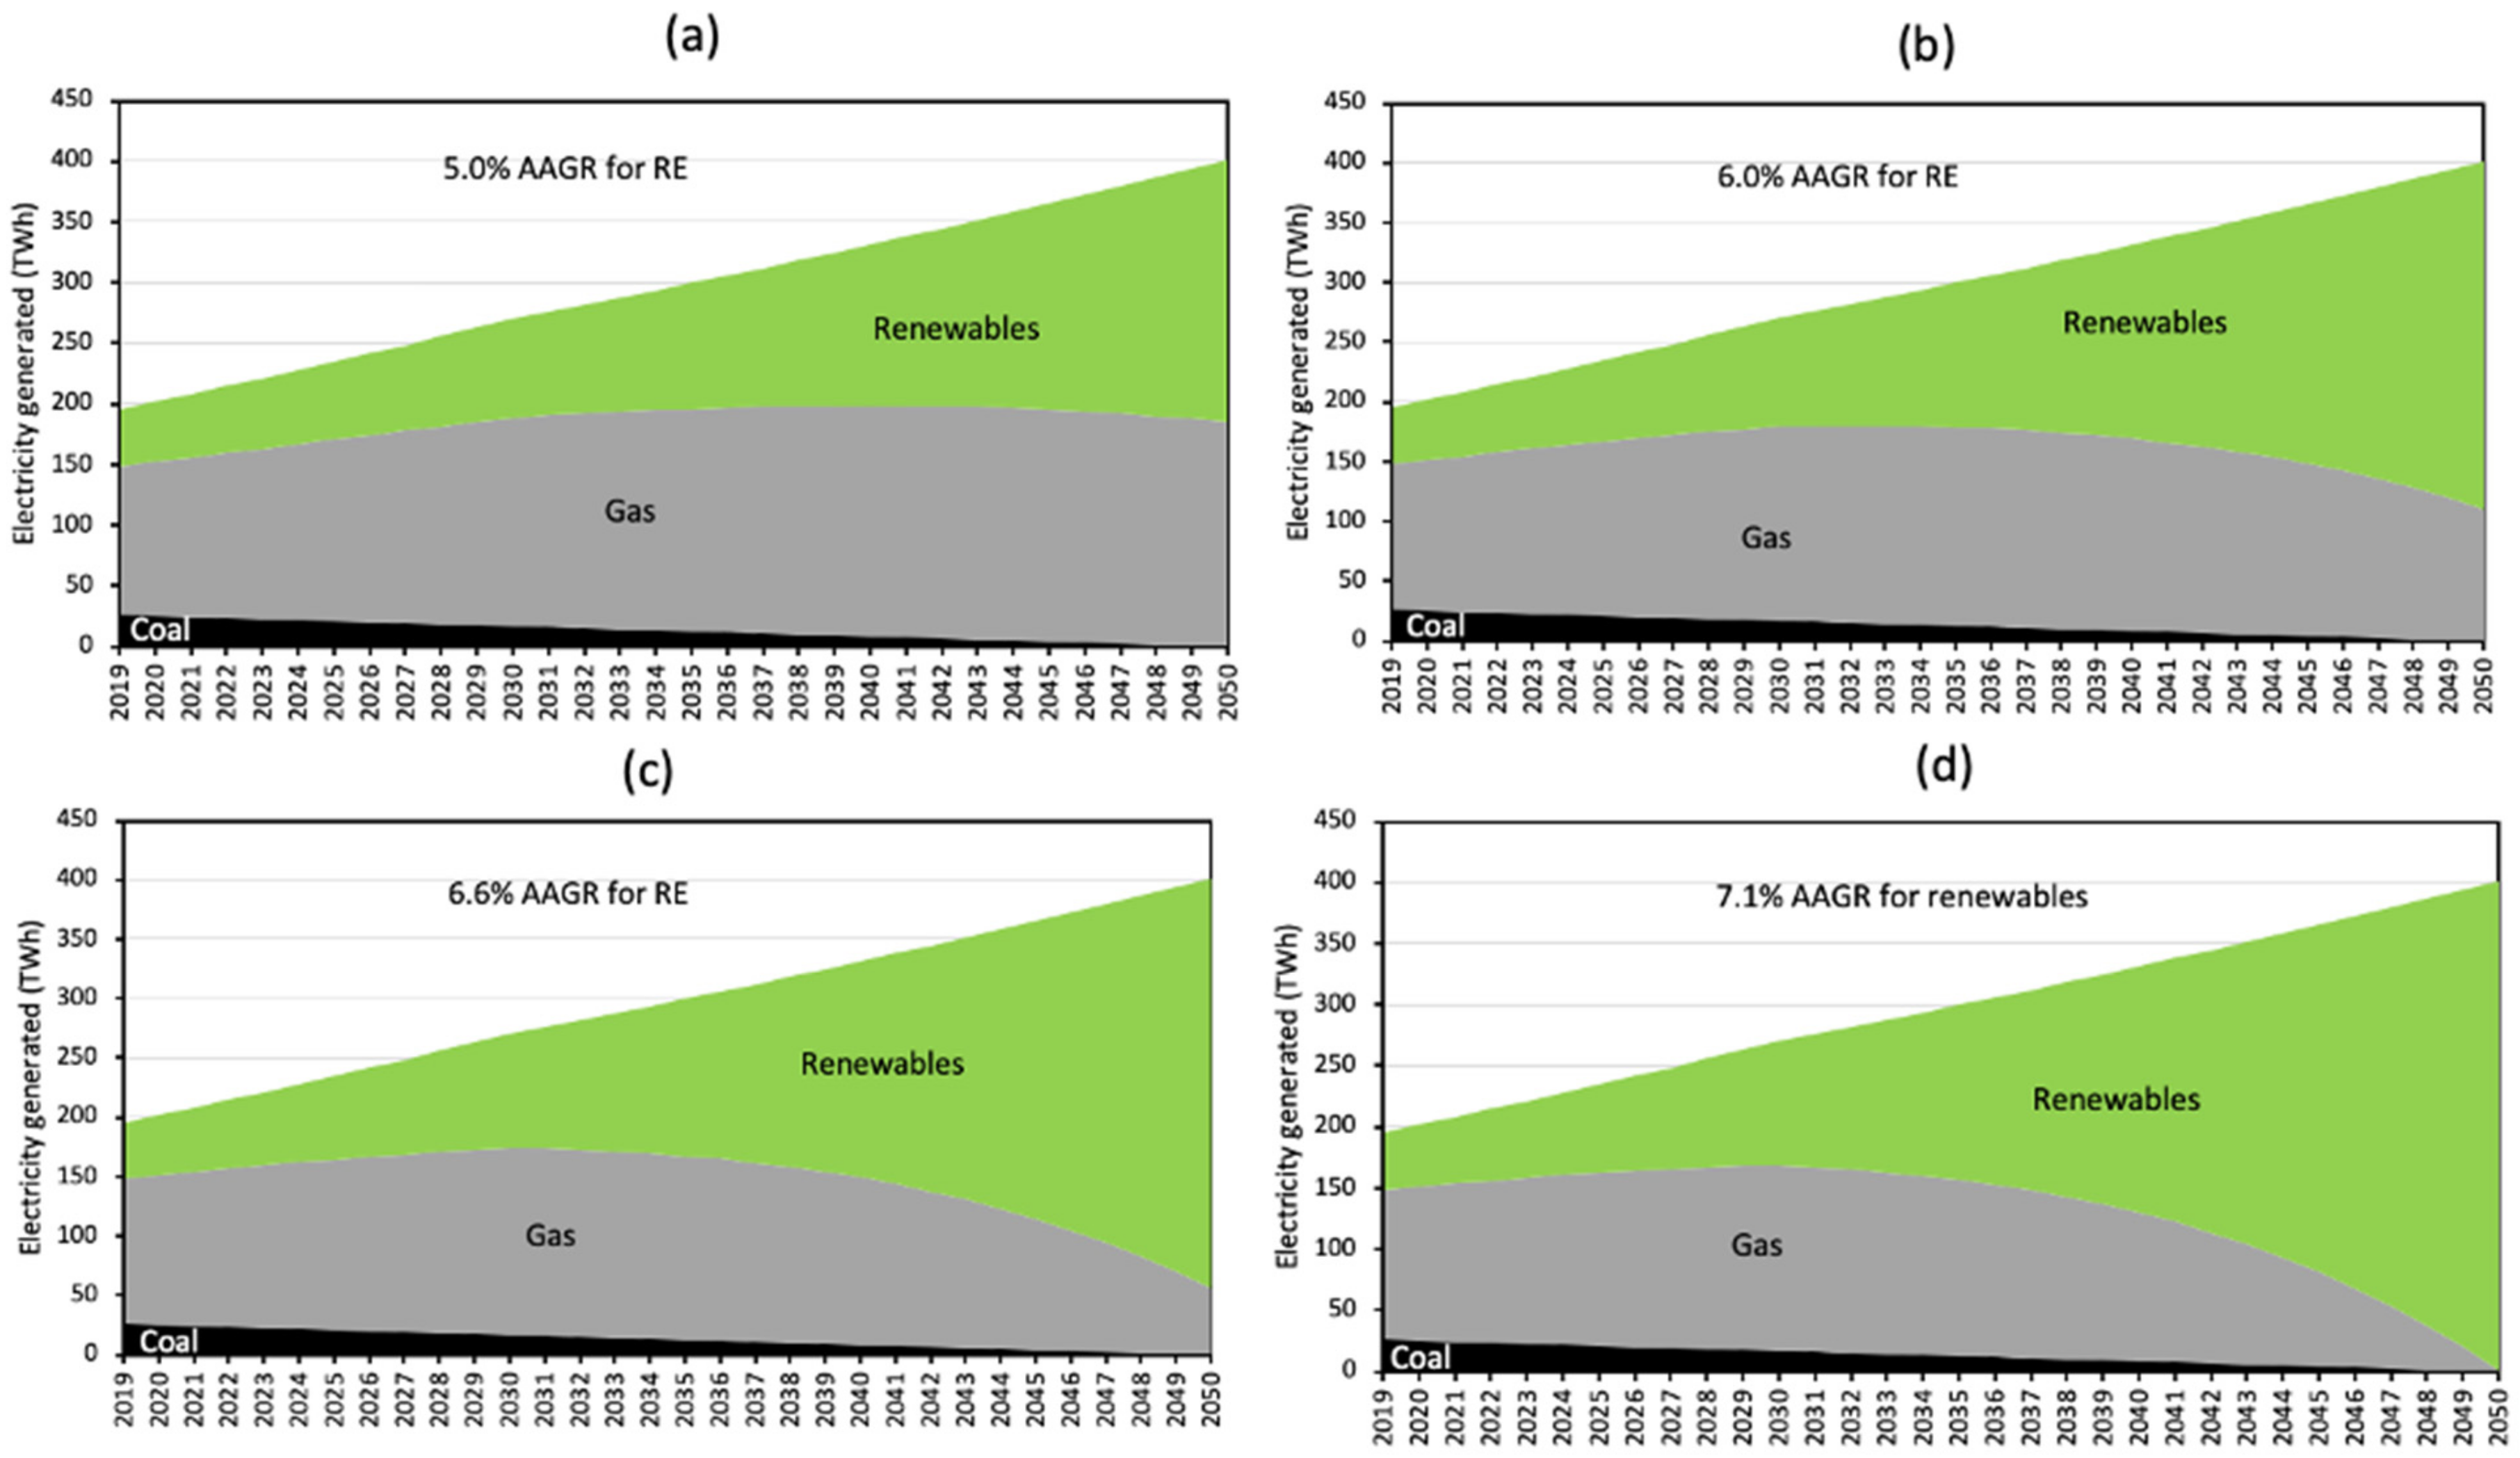
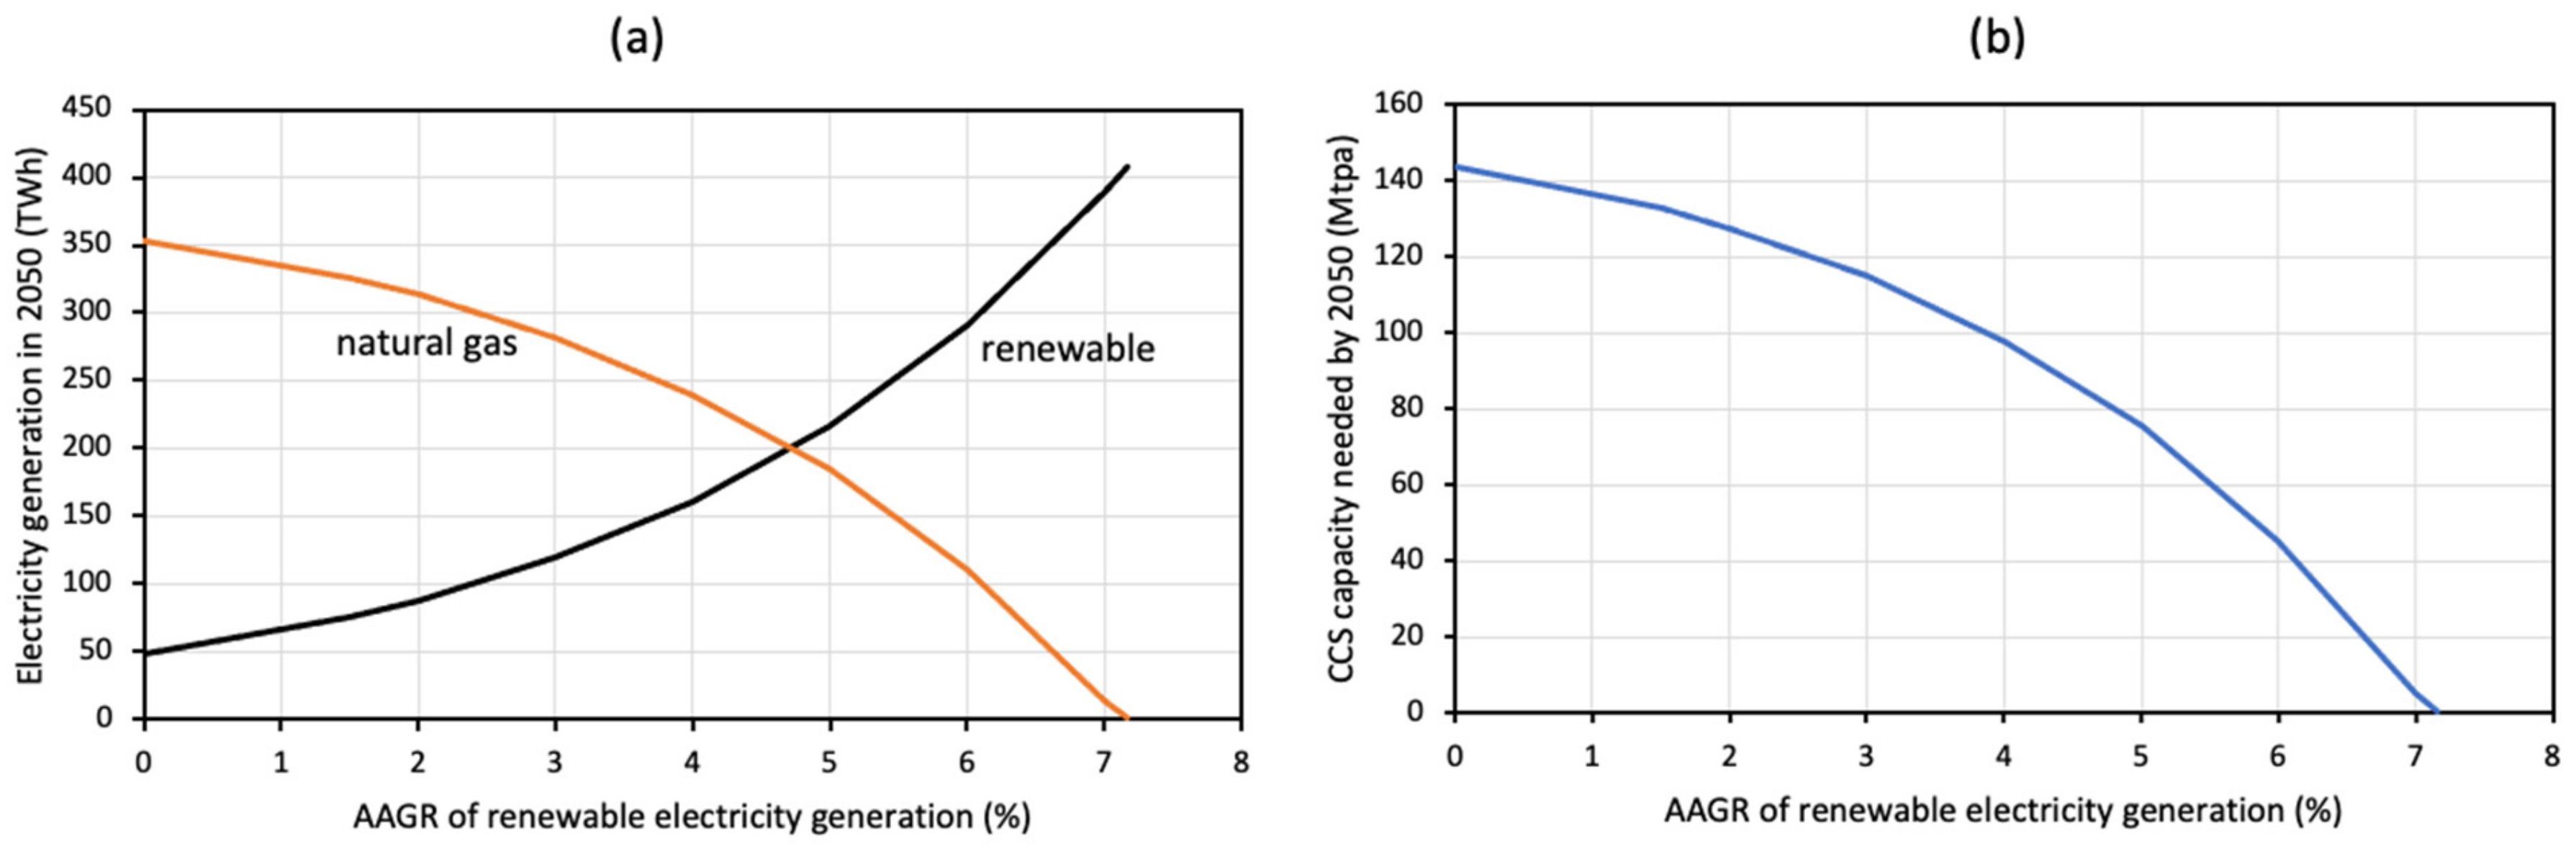
- Renewable electricity has to grow at an AAGR of 7.1% between now and 2050 in order to replace all fossil fuels by 2050. It will, however, reach 400 TWh exceeding the technical potential for Thailand. A more achievable goal is a AAGR between 5% and 6%. In this case, natural gas will be needed for power generation and a CCS capacity of 45–75 Mtpa will be needed to decarbonize the power sector.
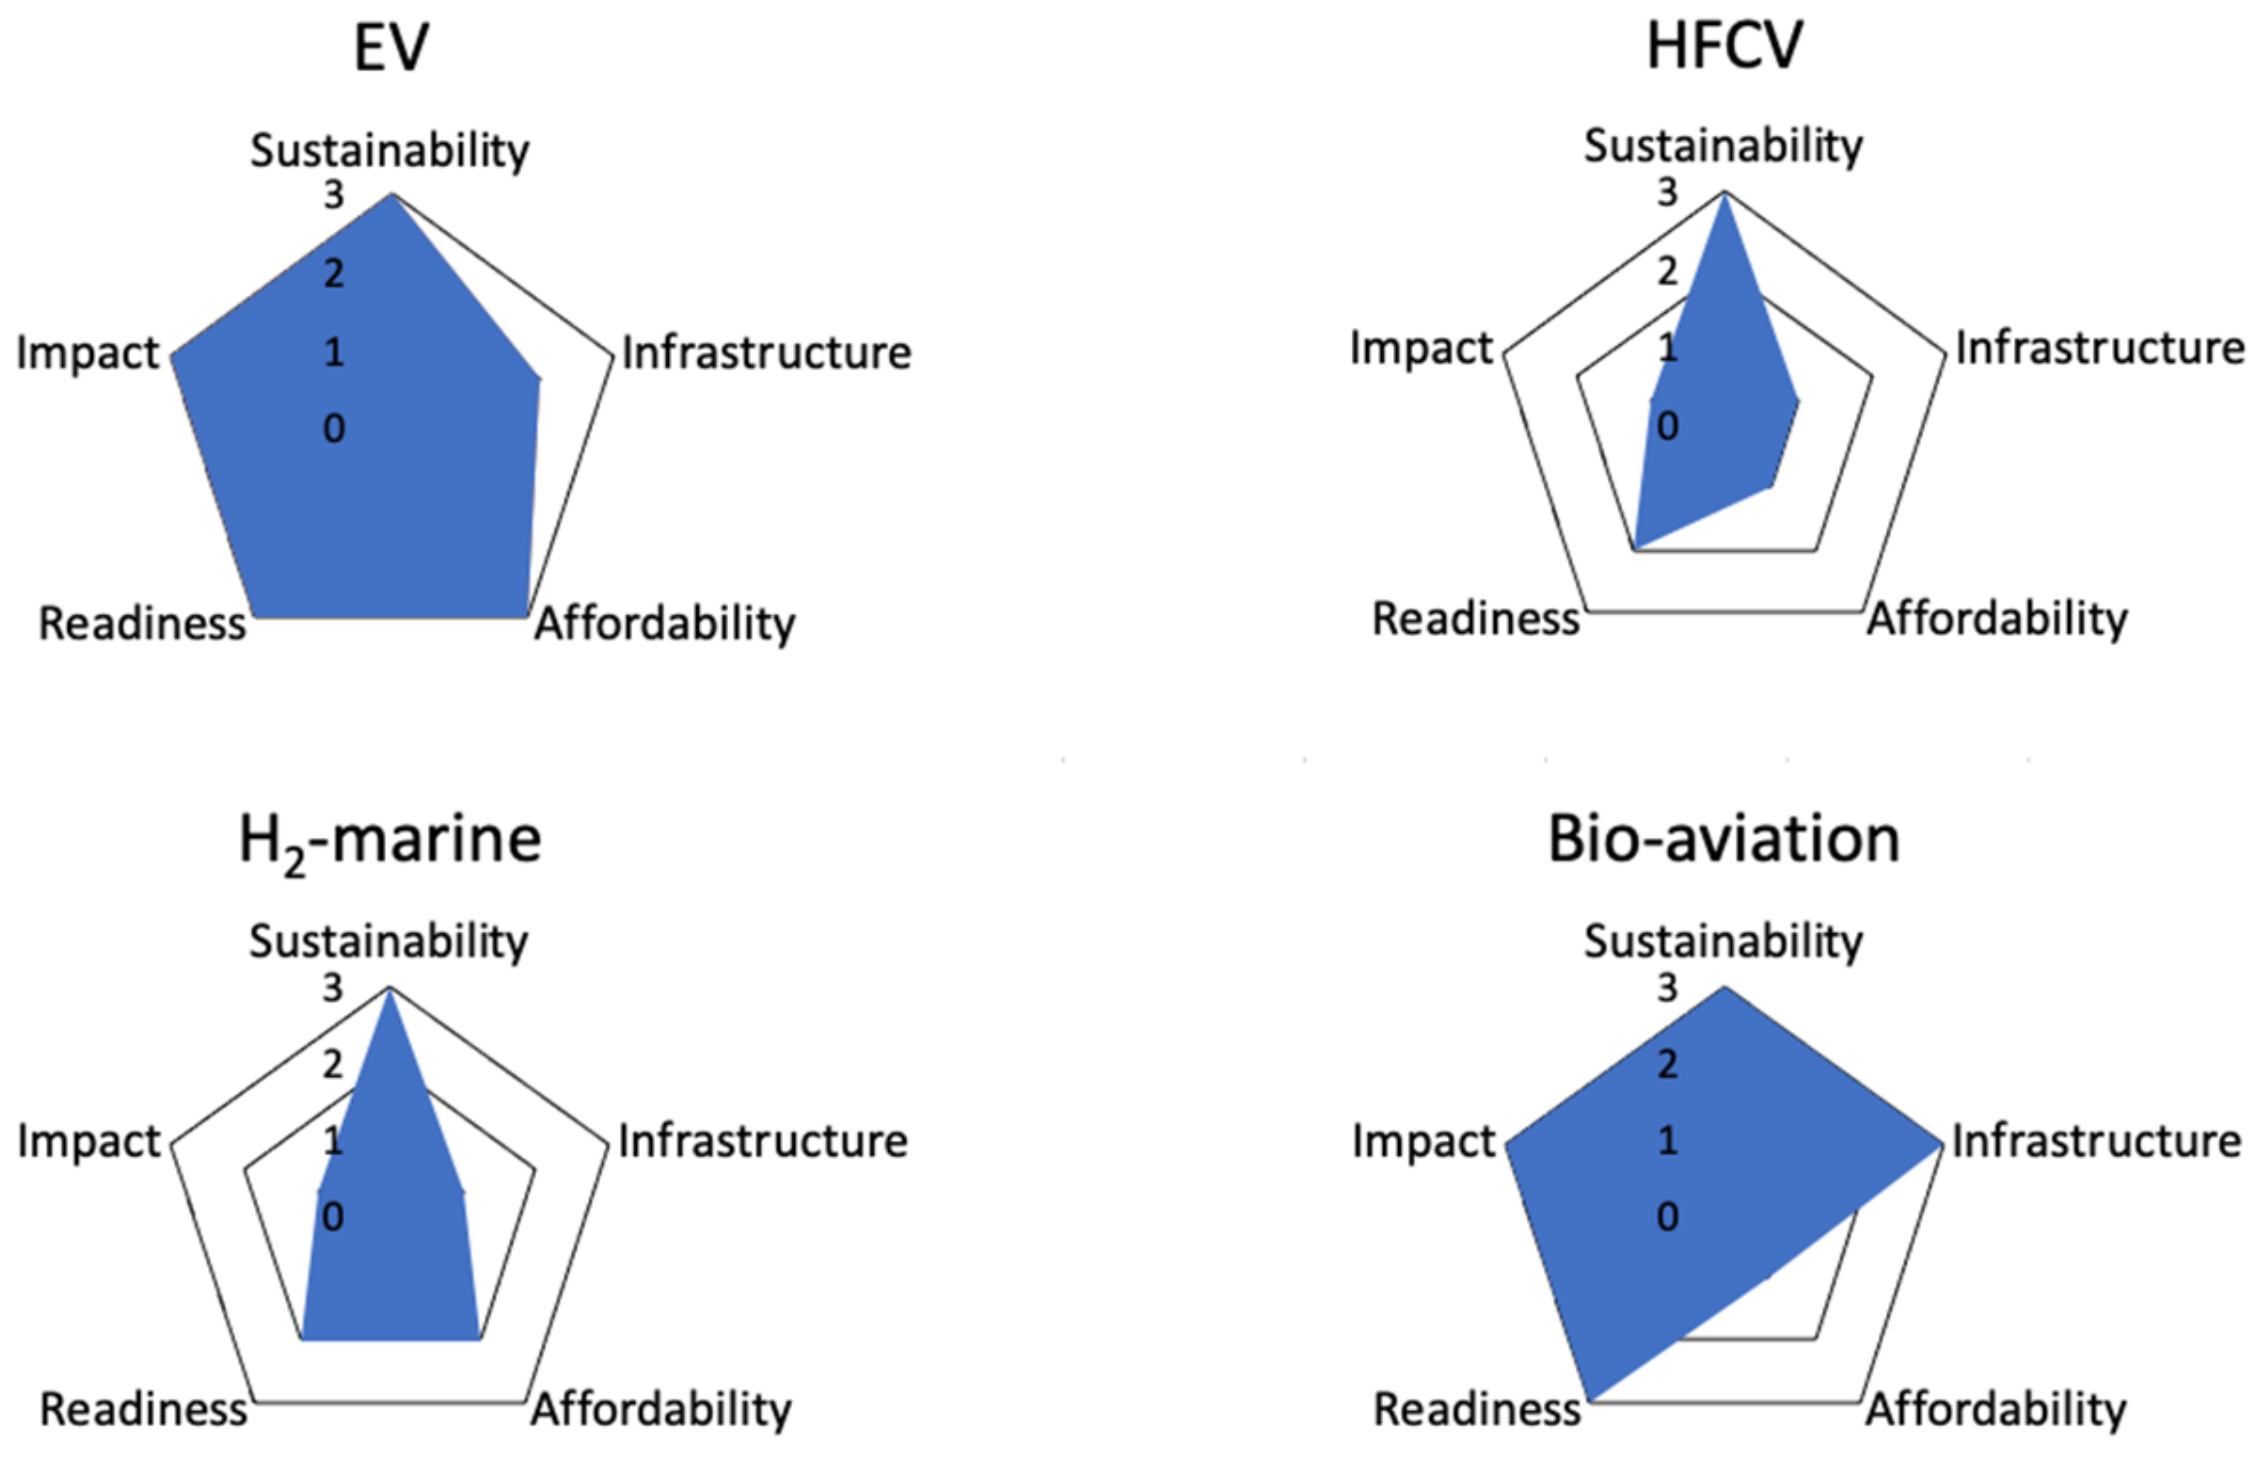
- Replacing ICEVs with EVs has the highest decarbonization potential for road transport. Next is bio-aviation for aviation transport. In the long term, H2-marine for marine transport also holds potential.
- For the industry sector, Ind-CCS has the highest decarbonization potential. Next is coal→H2-CCS, as Thailand’s coal reserves can be used to produce blue hydrogen. Also, gas→H2-CCS has the potential to decarbonize Thailand’s industry sector and enable it to become a regional hub for hydrogen.
- CCS as a critical technology to decarbonize Thailand’s power and industry sectors, and indirectly the transport sector. Since Thailand has enough subsurface CO2 storage capacity for several centuries of CO2 emission, large-scale implementation of CCS will enable Thailand to achieve net-zero by 2050.
Funding
Conflicts of Interest
Nomenclature
| AAGR | Average annual growth rate |
| ADB | Asia Development Bank |
| ASEAN | Association of Southeast Asian Nations |
| ASES | Advanced sustainable energy sector |
| BAU | Business-as-usual |
| BEV | Battery electric vehicle |
| Bio | Bioenergy |
| Bio-aviation | Biofuels for aviation |
| Blue hydrogen | Hydrogen produced from fossil fuels with CCS |
| CCS | Carbon capture and storage |
| CCU | Carbon capture and utilization |
| Coal→gas | Replacing coal by gas for power generation |
| Coal→H2-CCS | Hydrogen production by coal gasification with CCS |
| CO2-EOR | CO2 enhanced oil recovery |
| CO2-EGR | CO2 enhanced gas recovery |
| CP-CCS | Coal-fired power plant with CCS |
| EGAT | Electricity Generating Authority of Thailand |
| EV | Electric vehicle |
| EVSE | Public electric vehicle supply equipment (charging outlet) |
| Gas→H2-CCS | Hydrogen production by methane steam reforming or similar processes with CCS |
| Geo | Geothermal energy |
| Green hydrogen | Hydrogen produced from electrolysis with renewable electricity |
| Gt | 109 ton |
| GWh | 109 Wh |
| H2-marine | Hydrogen as fuel for ships |
| HEV | Hybrid electric vehicle |
| HFCV | Hydrogen fuel cell vehicle |
| Hydro | Hydropower plant |
| Hydro ROR | Run-of-the-river hydropower plant |
| ICEV | Internal combustion engine vehicle |
| Ind-CCS | Industrial plant equipped with CCS |
| LCOE | Levelized cost of electricity |
| LCS | Low carbon solution |
| Mbbl/d | 103 bbl/d |
| MMbbl | 106 bbl |
| MEA | Metropolitan Electricity Authority |
| MMst | 106 short ton |
| Mtpa | 106 ton per annum |
| MW | 106 W |
| Offshore wind | Offshore wind energy |
| Onshore wind | Onshore wind energy |
| PEA | Provincial Electricity Authority |
| PHEV | Plug-in hybrid electric vehicle |
| R&D | Research and development |
| RAM | Risk assessment matrix |
| RE | Renewable energy |
| SAF | Sustainable aviation fuel |
| SES | Sustainable energy sector |
| SOE | State-owned enterprise |
| Solar PV | Solar photovoltaic |
| TPES | Total primary energy supply |
| TRL | Technology readiness level |
| TWh | 1012 Wh |
Appendix A
| Sector | Decarbonization Technology | Description |
|---|---|---|
| Power | Hydro | Large hydropower plant |
| Hydro ROR | Run-of-the-river hydropower plant | |
| Solar PV | Solar photovoltaic | |
| Bio | Bioenergy for power generation | |
| Onshore wind | Onshore wind turbine for power generation | |
| Offshore wind | Offshore wind turbine for power generation | |
| Geothermal | Geothermal power plant | |
| Coal→gas | Switching from coal to gas for thermal power generation | |
| CP-CCS | Using CCS to capture and store CO2 emitted from coal-fired power plant | |
| GP-CCS | Using CCS to capture and store CO2 emitted from gas-fired power plant | |
| Transport | EV | Electric vehicles |
| HFCV | Hydrogen fuel cell vehicles | |
| H2-marine | Hydrogen as fuel for ships | |
| Bio-aviation | Biofuels as fuel for planes | |
| Industry | Ind-CCS | Using CCS to capture and store CO2 emitted from industrial plant |
| Coal→H2-CCS | Blue hydrogen generated from coal gasification (with CCS) for use in industry heating and raw material | |
| Gas→H2-CCS | Blue hydrogen generated from methane steam reforming (with CCS) for use in industy heating and raw material |
| CO2 emission (kg/kWh) | Low | Medium | High |
| <0.37 | 0.37 to 0.45 | >0.45 |
| Consequence | Increasing Probability of Happening | |||||
|---|---|---|---|---|---|---|
| Severity | Impact on people | Impact on animals | Impact on environ. (land & water) | A | B | C |
| Has occurred outside countries | Has occurred in Thailand | Occurred several times in Thailand | ||||
| 0 | Zero injury | Zero to slight injury | Zero effect | |||
| 1 | Slight injury | Single to multiple fatalities | Slight effect | |||
| 2 | Minor injury | Multiple fatalities to multiple species | Minor effect | |||
| 3 | Major injury | Single fatality to endangered species | Local effect | |||
| 4 | Single fatality | Multiple fatalities to endangered species | Major effect | |||
| 5 | Multiple fatalities | Multiple fatalities to multiple endangered species | Massive effect | |||
| Fossil | Hydro | Wind | Solar PV | Bio | Geothermal |
|---|---|---|---|---|---|
| 43 | 24 | 28 | 20 | 86 | 38 |
| Category\Ranking | Criteria | Low | Medium | High |
|---|---|---|---|---|
| Sustainability | CO2 emission, impact on people, animals, and environment | Ranked high in one or more sustainability categories | Ranked medium in any sustainability category. No high ranking | Ranked low in all sustainability categories |
| Security | In-country availability | Unavailable in country | Available in limited quantiity | Readily available in adequate quantity |
| Affordability | LCOE (USD/MWh) | >120 | 80–120 | <80 |
| Reliability | Capacity factor (%) | <20 | 20–40 | >40 |
| Stage | Research | Development | Deployment | ||||||
|---|---|---|---|---|---|---|---|---|---|
| TRL | 1 | 2 | 3 | 4 | 5 | 6 | 7 | 8 | 9 |
| Description | Research idea | Technology formulation | Proof of concept | Lab prototype | Lab pilot | Field pilot | Field demonstration | Field refinement | Commercial |
| Criterion | Low | Medium | High | |
|---|---|---|---|---|
| Technology readiness | TRL | 1 to 3 | 4 to 6 | 7 to 9 |
| Technology impact | Potential sector penetration (%) | <5 | 5 to 10 | >10 |
| Category | Criterion | Low | Medium | High |
|---|---|---|---|---|
| Sustainability | CO2 emission | None | Some | Some |
| Infrastructure (EV) | EVSE/EV | <0.05 | 0.05 to 0.10 | >0.10 |
| Infrastructure (HFCV, ship, plane) | Availability of refueling stations | Sparse | Inadequate | Adequate |
| Affordability (EV, HFCV) | Vehicle cost compared to ICEV | <1.5 | 1.5 to 2.5 | >2.5 |
| Affordability (ship & plane) | Fuel cost compared to fossil fuel | <1 | 1 to 2 | >2 |
| Technology readiness | TRL | 1 to 3 | 4 to 6 | 7 to 9 |
| Technology impact | Potential sector penetration (%) | <5 | 5 to 10 | >10 |
| Criterion | Low | Medium | High | |
|---|---|---|---|---|
| Sustainability | CO2 emission by fuel used for heating | Non-fossil | Fossil | Fossil |
| Affordability (coal→H2-CCS or gas→H2-CCS) | Fuel cost compared to fossil fuel | <1 | 1 to 2 | >2 |
| Affordability (Ind-CCS) | CCS cost ($/t CO2) | <30 | 30 to 90 | >90 |
| Technology readiness | TRL | 1 to 3 | 4 to 6 | 7 to 9 |
| Technology impact | Potential sector penetration (%) | <5 | 5 to 10 | >10 |
| Iron & Steel | Cement | Nat. Gas Processing | Fertilizer | Biomass to Ethanol | |
|---|---|---|---|---|---|
| Indonesia | 76 | 125 | 22.8 | 26.9 | 22.8 |
References
- World Bank. Population, Total, Thailand. 2022. Available online: https://donnees.banquemondiale.org/indicateur/SP.POP.TOTL?locations=TH (accessed on 2 August 2022).
- World Bank. GDP per Capita Thailand. 2022. Available online: https://data.worldbank.org/indicator/NY.GDP.PCAP.CD?locations=TH&view=map (accessed on 2 August 2022).
- Our World in Data. Thailand: CO2 Country Profile. 2022. Available online: https://ourworldindata.org/co2/country/thailand (accessed on 22 July 2022).
- BP. Statistical Review of World Energy 2021. London, UK. Available online: https://www.bp.com/en/global/corporate/news-and-insights/press-releases/bp-statistical-review-of-world-energy-2021-a-dramatic-impact-on-energy-markets.html (accessed on 22 July 2022).
- Climate Analytics (CA). Country Profile Thailand: Decarbonizing South and Southeast Asia. 2019. Available online: https://climateanalytics.org/media/decarbonisingasia2019-profile-thailand-climateanalytics.pdf (accessed on 1 December 2022).
- Thai PBS World. Thailand Vows to Reach Net Zero Carbon Emissions by 2065 at COP26. Available online: https://www.thaipbsworld.com/thailand-vows-to-reach-net-zero-carbon-emissions-by-2065-at-cop26/ (accessed on 2 August 2022).
- Phdungsilp, A.; Wuttipornpun, T. Analysis of the Decarbonizing Thailand’s Energy System Toward Low-Carbon Futures. Renew. Sustain. Energy Rev. 2013, 24, 187–197. [Google Scholar] [CrossRef]
- Asian Development Bank. Renewable Energy Developments and Potential in the Greater Mekong Subregion, Manila, Philippines. 2015. Available online: https://www.adb.org/sites/default/files/publication/161898/renewable-energy-developments-gms.pdf (accessed on 1 December 2022).
- Intelligent Energy Systems (IES). Alternatives for Power Generation in the Greater Mekong Sub-Region. Volume 5: Power Sector Vision of the Kingdom of Thailand. 2016. Available online: https://d2ouvy59p0dg6k.cloudfront.net/downloads/thailand_power_sector_vision_full.pdf (accessed on 1 December 2022).
- International Energy Agency (IEA). Putting a Price on Caron—An Efficient Way for Thailand to Meet Its Bold Emission Target. 2020. Available online: https://www.iea.org/articles/putting-a-price-on-carbon-an-efficient-way-for-thailand-to-meet-its-bold-emission-target (accessed on 2 August 2022).
- Rajbhandari, S.; Limmeechokchai, B. Assessment of Greenhouse Gas Mitigation Pathways for Thailand towards Achievement of the 2 °C and 1.5 °C Paris Agreement Targets. Clim. Policy 2021, 21, 492–553. [Google Scholar] [CrossRef]
- Chaichaloempreecha, A.; Chunark, P.; Hanaoka, T.; Limmeechokchai, B. Thailand’s Mid-Century Greenhouse Gas Emission Pathways to Achieve the 2 Degrees Celsius Target. Energy Sustain. Soc. 2022, 12, 22. [Google Scholar] [CrossRef]
- Diewvilai, R.; Audomvongseree, K. Possible Pathways toward Carbon Neutrality in Thailand’s Electricity Sector by 2050 through the Introduction of H2 Blending in Natural Gas and Solar PV with BESS. Energies 2022, 15, 3979. [Google Scholar] [CrossRef]
- Zhang, K.; Bokka, H.K.; Lau, H.C. Decarbonizing the Energy and Industry Sectors in Thailand by Carbon Capture and Storage. J. Pet. Sci. Eng. 2022, 209, 109979. [Google Scholar] [CrossRef]
- Lau, H.C.; Zhang, K.; Bokka, H.K.; Ramakrishna, S. A Review of the Status of Fossil and Renewable Energies in Southeast Asia and Its Implications on the Decarbonization of ASEAN. Energies 2022, 15, 2152. [Google Scholar] [CrossRef]
- Lau, H.C.; Zhang, K.; Bokka, H.K.; Ramakrishna, S. Getting Serious with Net-Zero: Implementing Large-Scale Carbon Capture and Storage Projects in ASEAN. In Proceedings of the Offshore Technology Conference, Houston, TX, USA, 2–5 May 2022. OTC-31881-MS. [Google Scholar]
- International Energy Agency (IEA). Thailand. 2022. Available online: https://www.iea.org/countries/thailand (accessed on 22 July 2022).
- Asia Pacific Energy Research Centre (APERC). 2020 APEC Energy Statistics. 2018. Available online: http://www.egeda.ewg.apac.org/ (accessed on 1 December 2022).
- Worldometer. Thailand Coal. 2022. Available online: https://www.worldometers.info/coal/thailand-coal/#:~:text=Thailand%20consumes%20618%2C735%20cubic%20feet,feet%20per%20capita%20per%20day (accessed on 22 July 2022).
- Argus Media. Thailand Buys More Coal from Russia. 2020. Available online: https://www.argusmedia.com/en/news/2052167-thailand-buys-more-coal-from-russia (accessed on 22 July 2022).
- Global Energy Monitor Wiki. Krabi Coal Power Station. 2022. Available online: https://www.gem.wiki/Krabi_coal_power_station#:~:text=The%20Krabi%20coal%20power%20station,SEA)%20and%20could%20still%20proceed (accessed on 22 July 2022).
- Worldometer. Thailand Oil. 2022. Available online: https://www.worldometers.info/oil/thailand-oil/ (accessed on 22 July 2022).
- International Renewable Energy Agency (IRENA). Statistical Profiles. 2022. Available online: https://www.irena.org/Statistics/Statistical-Profiles (accessed on 22 July 2022).
- Global Energy Monitor. Global Coal Plant Tracker. 2022. Available online: https://docs.google.com/spreadsheets/d/1W-gobEQugqTR_PP0iczJCrdaR-vYkJ0DzztSsCJXuKw/edit#gid=822738567 (accessed on 21 June 2022).
- Department of Industry, Science, Energy and Resources (DISER); Australian Government. Global Resources Strategy Commodity Report: Liquefied Natural Gas. 2022. Available online: https://www.industry.gov.au/sites/default/files/February%202022/document/grs-commodity-report-lng.pdf (accessed on 1 December 2022).
- International Renewable Energy Agency (IRENA). Renewable Energy Outlook: Thailand. Abu Dhabi, UAE, Table 5, p. 27. 2017. Available online: https://www.irena.org/-/media/Files/IRENA/Agency/Publication/2017/Nov/IRENA_Outlook_Thailand_2017.pdf (accessed on 1 December 2022).
- Global Solar Atlas. Global Photovoltaic Power Potential by Country. The World Bank. 2022. Available online: https://globalsolaratlas.info/global-pv-potential-study (accessed on 21 June 2022).
- Solar Magazine. Thailand Solar Energy Profile. 2022. Available online: https://solarmagazine.com/solar-profiles/thailand/ (accessed on 22 July 2022).
- World Bank. Wind Energy Resource Atlas of Southeast Asia; World Bank: Washington, DC, USA, 2001. [Google Scholar]
- Ministry of Energy (MOE). Alternative Energy Development Plan: AEDP2015. Department of Renewable Energy Development and Energy Efficiency. Government of Thailand. 2015. Available online: http://www.eppo.go.th/images/POLICY/ENG/AEDP2015ENG.pdf (accessed on 1 December 2022).
- Sowcharoensuk, C. Severe Drought: Agricultural Sector Takes Direct Hit and Spillover Effects on Manufacturing Supply Chains. Krungsri Research. 2020. Available online: https://www.krungsri.com/en/research/research-intelligence/RI-Drought (accessed on 3 August 2022).
- Aroonrat, K.; Wongwises, S. Current Status and Potential of Hydro Energy in Thailand: A Review. Renew. Sustain. Energy Rev. 2015, 46, 70–78. [Google Scholar] [CrossRef]
- World Nuclear Association. Fukushima Daiichi Accident. 2022. Available online: https://world-nuclear.org/information-library/safety-and-security/safety-of-plants/fukushima-daiichi-accident.aspx (accessed on 22 July 2022).
- Ministry of Energy (MOE). Thailand Power Development Plan 2015–2036 (PDP2015). Energy Policy and Planning Office. Government of Thailand. 2015. Available online: https://www.egat.co.th/en/images/about-egat/PDP2015_Eng.pdf (accessed on 1 December 2022).
- Chamamahattana, P.; Kongtahworn, W.; Pan-aram, R. The Small Hydropower Project as the Important Renewable Energy Resource in Thailand. Asian J. Energy Environ. 2005, 6, 139–144. [Google Scholar]
- Chatyat, N.; Chalchana, C.; Singharajwarapan, F.S. Geothermal Energy Potentials and Technologies in Thailand. J. Fundam. Renew. Energy Appl. 2014, 4, 2. [Google Scholar]
- United States Department of Interior Bureau of Reclamation (USBR). Teton Dam History & Facts. 2022. Available online: https://www.usbr.gov/pn/snakeriver/dams/uppersnake/teton/index.html (accessed on 29 July 2022).
- Baker, M.E.; Case Study: Lawn Lake Dam (Colorado, 1982). Association of State Dam Safety Officials. 2022. Available online: https://damfailures.org/case-study/lawn-lake-dam-colorado-1982/ (accessed on 19 July 2022).
- Soukhapon, A.; Baird, I.G.; Hogan, Z.S. The Impacts of Hydropower Dams in the Mekong River Basin: A Review. Water 2021, 13, 265. [Google Scholar] [CrossRef]
- United States Environmental Protection Agency (EPA). Solar Panel Frequent Questions. 2022. Available online: https://www.epa.gov/hw/solar-panel-frequent-questions (accessed on 29 July 2022).
- Boyle, G. Renewable Energy: Power for a Sustainable Future, 3rd ed.; Oxford University Press: Oxford, UK, 2012. [Google Scholar]
- Paulson, E.B.; Enevoldsen, P.A. Multidisciplinary Review of Recycling Methods for End-of-Life Wind Turbine Blades. Energies 2021, 14, 4247. [Google Scholar] [CrossRef]
- Lau, H.C. The Color of Energy: The Competition to be the Energy of the Future. In Proceedings of the International Petroleum Technology Conference, Virtual, 23 March–1 April 2021. IPTC-21348-MS. [Google Scholar]
- Duke Energy. Capacity Factor—A Measure of Reliability. 2015. Available online: https://nuclear.duke-energy.com/2015/02/18/capacity-factor-a-measure-of-reliability (accessed on 3 August 2022).
- Department of Energy (DOE); Levelized Cost of Energy (LCOE). United States Government. 2015. Available online: https://www.energy.gov/sites/prod/files/2015/08/f25/LCOE.pdf (accessed on 1 December 2022).
- National Aeronautics and Space Administration (NASA). Technology Readiness Level. 2012. Available online: https://www.nasa.gov/directorates/heo/scan/engineering/technology/technology_readiness_level (accessed on 3 August 2022).
- International Energy Agency (IEA). Projected Costs of Generating Electricity 2020 Edition. Paris, France. 2020. Available online: https://iea.blob.core.windows.net/assets/ae17da3d-e8a5-4163-a3ec-2e6fb0b5677d/Projected-Costs-of-Generating-Electricity-2020.pdf (accessed on 1 December 2022).
- Climate MIT. How Efficient Is Carbon Capture and Storage? 2021. Available online: https://climate.mit.edu/ask-mit/how-efficient-carbon-capture-and-storage#:~:text=CCS%20projects%20typically%20target%2090,will%20be%20captured%20and%20stored (accessed on 4 August 2022).
- CEIC Data. Thailand Number of Registered Vehicles. 2022. Available online: https://www.ceicdata.com/en/indicator/thailand/number-of-registered-vehicles (accessed on 22 July 2022).
- Electric Vehicle Association of Thailand (EVAT). Thailand Electric Vehicle Current Status as of June 2022. 2022. Available online: http://www.evat.or.th/attachments/view/?attach_id=265019 (accessed on 29 July 2022).
- International Energy Agency (IEA). Ratio of Public Chargers per EV Stock by Country, 2020. 2022. Available online: https://www.iea.org/data-and-statistics/charts/ratio-of-public-chargers-per-ev-stock-by-country-2020 (accessed on 29 July 2022).
- International Energy Agency (IEA). Global EV Outlook 2021. 2021. Available online: https://iea.blob.core.windows.net/assets/ed5f4484-f556-4110-8c5c-4ede8bcba637/GlobalEVOutlook2021.pdf (accessed on 1 December 2022).
- KPMG. Electric Vehicles in Thailand. 2021. Available online: https://assets.kpmg/content/dam/kpmg/th/pdf/2021/07/electric-vehicles-in-thailand.pdf (accessed on 1 December 2022).
- Simple Flying. How SAF Can Become Cost Competitive against Conventional Fuel. 2022. Available online: https://simpleflying.com/saf-cost-competitive-jet-fuel/#:~:text=After%20all%2C%20the%20cost%20is,price%20of%20conventional%20jet%20fuel (accessed on 29 July 2022).
- Vorayos, N.; Vorayos, N.; Jaitiang, T. Energy-Environmental Performance of Thai’s Cement Industry. Energy Rep. 2020, 6, 460–466. [Google Scholar] [CrossRef]
- Global CCS Institute. Global Costs of Carbon Capture and Storage 2017 Update. 2017. Available online: https://www.globalccsinstitute.com/archive/hub/publications/201688/global-ccs-cost-updatev4.pdf (accessed on 1 November 2022).
- Asian Development Bank. ASEAN Distributed Power Project (RRP REG 50410-001). Sector Overview. 2017. Available online: https://www.adb.org/sites/default/files/linked-documents/50410-001-so.pdf (accessed on 1 November 2022).
- Benoit, P. Engaging State-Owned Enterprises in Climate Action; Center on Global Energy Policy, School of International and Public Affairs, Columbia University: New York, NY, USA, 2019; Available online: https://www.energypolicy.columbia.edu/sites/default/files/pictures/SOE%20Benoit-CGEP_Report_090919.pdf (accessed on 1 November 2022).
- S&P Global. Singapore’s Carbon Tax Increase of Up to 16-Fold Will Make Low Carbon Technologies and Power Imports Cost Competitive. 2022. Available online: https://ihsmarkit.com/research-analysis/singapores-carbon-tax-increase-of-up-to-16fold-will-make-low-c.html#:~:text=the%20right%20decisions.-,Singapore’s%20carbon%20tax%20increase%20of%20up%20to%2016%2Dfold%20will,and%20power%20imports%20cost%20competitive&text=Singapore%20was%20the%20first%20Southeast,applied%20from%202019%20to%202023 (accessed on 1 August 2022).
- Nikkei Asia. Asian Majors Keep Myanmar Gas Pumping despite EU Sanctions. 2022. Available online: https://asia.nikkei.com/Spotlight/Myanmar-Crisis/Asian-majors-keep-Myanmar-gas-pumping-despite-EU-sanctions (accessed on 1 August 2022).
- Argus Media. Thailand Imports More LNG in December. 2022. Available online: https://www.argusmedia.com/en/news/2295474-thailand-imports-more-lng-in-december#:~:text=Thailand’s%20December%20imports%20brought%20its,5.61mn%20t%20in%202020 (accessed on 1 August 2022).
- Atlantic Council. The EU’s Plans to Replace Russian Gas: Aspiration and Reality. 2022. Available online: https://www.atlanticcouncil.org/blogs/energysource/the-eus-plans-to-replace-russian-gas/ (accessed on 1 August 2022).
- LNG Journal. Thailand to Become Asian LNG Hub. 2020. Available online: https://lngjournal.com/index.php/shipping-news-old/item/101109-thailand-to-become-an-asian-lng-hub (accessed on 8 August 2022).
- United States Energy Information Administration (EIA). How Much Carbon Dioxide Is Produced per Kilowatt Hour of U.S. Electricity Generation? 2022. Available online: https://www.eia.gov/tools/faqs/faq.php?id=74&t=11#:~:text=In%202020%2C%20total%20U.S.%20electricity,CO2%20emissions%20per%20kWh (accessed on 2 July 2022).


| Biomass Type | Available Residues for Power Generation by 2036 | ||
|---|---|---|---|
| Ton/Year | Ktoe | Power Potential (MW) | |
| Rice husk | 432 | 0.14 | 0.05 |
| Rice straw | 4,124,630 | 1204 | 461 |
| Sugarcane and leaf | 5,265,619 | 1929 | 738 |
| Bagasse | 21,280,000 | 3712 | 1421 |
| Corn cob | 80,889 | 18 | 7 |
| Corn trunk | 3,369,690 | 784 | 300 |
| Cassava rhizome | 3,372,560 | 439 | 168 |
| Cassava trunk | 2,084,755 | 769 | 294 |
| Palm frond | 33,586,191 | 5208 | 1993 |
| Palm empty fruit bunch | 1,402,455 | 240 | 92 |
| Palm fiber | 2,944,803 | 795 | 304 |
| Palm shell | 619,959 | 248 | 95 |
| Para wood root | 1,411,834 | 287 | 110 |
| Coconut shell | 79,678 | 31 | 12 |
| Coconut coir | 71,875 | 27 | 10 |
| Coconut bunch & frond | 249,026 | 91 | 35 |
| Total | 79,944,394 | 15,783 | 6040 |
| Country | CO2 (Mtpa) | Share in TPES in 2018 (%) | Power Generation in 2018 (GWh) | ||||||||
|---|---|---|---|---|---|---|---|---|---|---|---|
| Coal | Oil | Gas | RE | Hydro | Geo | Bio | Solar PV | Wind | Fossil | ||
| Thailand | 289 | 13 | 41 | 26 | 20 | 7783 | 0 | 28,705 | 4537 | 1641 | 144,581 |
| Indonesia | 625 | 31 | 32 | 15 | 22 | 16,828 | 13,019 | 636 | 20 | 6 | 235,365 |
| Philippines | 154 | 29 | 36 | 6 | 29 | 8597 | 10,435 | 1105 | 1249 | 1153 | 76,052 |
| Vietnam | 311 | 35 | 30 | 11 | 24 | 84,984 | 0 | 42 | 101 | 303 | 124,197 |
| Malaysia | 249 | 24 | 32 | 40 | 4 | 27,125 | 422 | 0 | 431 | 0 | 139,860 |
| Singapore | 53 | 3 | 60 | 35 | 2 | 0 | 0 | 2002 | 171 | 0 | 49,152 |
| Laos | 6.71 | 68 | 19 | 0 | 13 | 21,162 | 0 | 46 | 17 | 0 | 621 |
| Cambodia | 16 | 8 | 30 | 0 | 62 | 4737 | 0 | 69 | 41 | 0 | 3355 |
| Myanmar | 49 | 2 | 29 | 18 | 51 | 14,646 | 0 | 0 | 0 | 0 | 9486 |
| Brunei | 7.27 | 0 | 18 | 82 | 0 | 0 | 0 | 0 | 0 | 0 | 3852 |
| ASEAN average | 176 | 21 | 33 | 23 | 23 | 18,586 | 2388 | 3261 | 657 | 310 | 78,652 |
| Thai ranking | 3rd | 6th | 2nd | 3rd | 6th | 7th | 10th | 1st | 1st | 1st | 3rd |
| Sustainability | Energy Quadrilemma | Tech. Mapping | ||||||||
|---|---|---|---|---|---|---|---|---|---|---|
| CO2 | People | Animal | Env. | Sustain. | Reliab. | Afford. | Security | Read. | Impact | |
| kg/kWh | Risk assess. matrix | Risk assess. matrix | Risk assess. matrix | Combined ranking | Capacity fac. (%) 1 | LCOE ($/MWh) 2 | In-country availability 3 | TRL 4 | Share in elect. (%) 4 | |
| Hydro | 0 | Teton Dam 5 | Teton Dam 5 | Lawn Lake 6 | Med. | 24 | 75 | Med. | 9 | <5 |
| Hydro ROR | 0 | Low | Low | Low | High | 24 | <75 | Med. | 9 | <5 |
| Solar PV | 0 | Low | Low | Panel waste | Med. | 20 | 60 | High | 9 | 5–10 |
| Onshore wind | 0 | Low | Avian death | Blade waste | Med. | 28 | 50 | Med. | 9 | <5 |
| Offshore wind | 0 | Low | Avian death | Blade waste | Med. | 28 | 80 | Med. | 6 | <5 |
| Bio | <0.37 | Food scarc. | Bio di-versity | Forest clearing | Med. | 86 | 125 | High | 9 | >10 |
| Geo | <0.37 | Low | Low | Low | High | 38 | 100 | Low | 8 | <5 |
| Coal→gas | 0.37–0.45 | Low | Low | Low | Med. | 43 | 70 | Med. | 9 | >10 |
| CP-CCS | <0.37 | Low | Low | Low | High | 43 | 120 | Med. | 8 | >10 |
| GP-CCS | <0.37 | Low | Low | Low | High | 43 | 90 | Med. | 8 | >10 |
| Tier Level | Technology | Key Issues to Be Addressed | Relative Score 1 |
|---|---|---|---|
| Tier 1 (highest potential) | Coal→gas |
| 16 |
| CP-CCS |
| 16 | |
| GP-CCS |
| 16 | |
| Tier 2 (high potential) | Bio |
| 15 |
| Solar PV |
| 15 | |
| Hydro ROR |
| 14 | |
| Hydro |
| 13 | |
| Onshore wind |
| 13 | |
| Tier 3 (moderate potential) | Geo |
| 12 |
| Offshore wind |
| 11 |
| (a) | ||||||||||||
| BAU 1 | LCS (5%) 2 | LCS (6%) 2 | ||||||||||
| 2020 | 2030 | 2040 | 2050 | 2020 | 2030 | 2040 | 2050 | 2020 | 2030 | 2040 | 2050 | |
| Coal (TWh) | 30 | 61 | 92 | 123 | 25 | 16 | 7 | 0 | 25 | 16 | 8 | 0 |
| Gas (TWh) | 123 | 146 | 175 | 172 | 127 | 172 | 190 | 185 | 127 | 163 | 161 | 111 |
| RE (TWh) | 50 | 79 | 124 | 196 | 51 | 82 | 133 | 217 | 51 | 91 | 162 | 291 |
| Total (TWh) | 202 | 268 | 392 | 492 | 202 | 270 | 331 | 401 | 202 | 270 | 331 | 401 |
| RE share (%) | 25 | 28 | 32 | 40 | 25 | 30 | 40 | 54 | 25 | 34 | 49 | 72 |
| CO2 (Mtpa) | 79 | 120 | 162 | 192 | 76 | 86 | 86 | 75 | 76 | 83 | 74 | 45 |
| CCS (Mtpa) | 0 | 0 | 0 | 0 | 0 | 25 | 50 | 75 | 0 | 13 | 30 | 45 |
| (b) | ||||||||||||
| LCS (6.6%) 2 | LCS (7.1%) 2 | |||||||||||
| 2020 | 2030 | 2040 | 2050 | 2020 | 2030 | 2040 | 2050 | |||||
| Coal (TWh) | 25 | 16 | 8 | 0 | 25 | 16 | 8 | 0 | ||||
| Gas (TWh) | 126 | 157 | 141 | 56 | 126 | 152 | 122 | 1 | ||||
| RE (TWh) | 51 | 96 | 182 | 345 | 51 | 101 | 202 | 400 | ||||
| Total (TWh) | 202 | 270 | 331 | 401 | 202 | 270 | 331 | 401 | ||||
| RE share (%) | 25 | 36 | 55 | 86 | 25 | 38 | 61 | 100 | ||||
| CO2 (Mtpa) | 76 | 80 | 65 | 23 | 76 | 78 | 58 | 0 | ||||
| CCS (Mtpa) | 0 | 8 | 15 | 23 | 0 | 0 | 0 | 0 | ||||
| Scenario | BAU | LCS (5%) | LCS (6%) | LCS (6.6%) | LCS (7.1%) |
|---|---|---|---|---|---|
| RE in 2050 (TWh) | 196 | 217 | 291 | 345 | 400 |
| RE in 2050 (% tech. potential *) | 62 | 68 | 92 | 109 | 126 |
| Technology | Sustainability | Infrastructure | Affordability | Technology Readiness | Technology Impact |
|---|---|---|---|---|---|
| Criterion | CO2 emission | Table A8 | Table A8 | TRL | Potential sector penetration (%) |
| EV | None | 0.07 EVSE/EV | <1.5 | 9 | >10 |
| HFCV | None | sparse | >2.5 | 6 | <5 |
| H2-marine | None | sparse | >2 | 6 | <5 |
| Bio-aviation | None | None needed | 2.2 | 7 | >10 |
| Tier Level | Technology | Key Issues to Be Addressed | Relative Score 1 |
|---|---|---|---|
| Tier 1 (highest potential) | EV |
| 14 |
| Tier 2 (high potential) | Bio-aviation |
| 13 |
| Tier 3 (moderate potential) | H2-marine |
| 9 |
| HFCV |
| 8 |
Publisher’s Note: MDPI stays neutral with regard to jurisdictional claims in published maps and institutional affiliations. |
© 2022 by the author. Licensee MDPI, Basel, Switzerland. This article is an open access article distributed under the terms and conditions of the Creative Commons Attribution (CC BY) license (https://creativecommons.org/licenses/by/4.0/).
Share and Cite
Lau, H.C. Decarbonizing Thailand’s Economy: A Proposal. Energies 2022, 15, 9498. https://doi.org/10.3390/en15249498
Lau HC. Decarbonizing Thailand’s Economy: A Proposal. Energies. 2022; 15(24):9498. https://doi.org/10.3390/en15249498
Chicago/Turabian StyleLau, Hon Chung. 2022. "Decarbonizing Thailand’s Economy: A Proposal" Energies 15, no. 24: 9498. https://doi.org/10.3390/en15249498
APA StyleLau, H. C. (2022). Decarbonizing Thailand’s Economy: A Proposal. Energies, 15(24), 9498. https://doi.org/10.3390/en15249498