Abstract
In this paper, a modeling method for estimating the remaining useful life (RUL) of aged underground cable systems is proposed that uses statistical health index (HI) and operating factor (OF) data of retired systems. The HI is an indicator which identifies the condition of an underground cable system and its components and is calculated from testing and inspection results. The OF takes actual operating conditions and technical data from the system into consideration. Both factors are then combined to determine the overall health index (OHI) of each system. For RUL estimation of underground cable systems, normal distribution and Weibull distribution analyses are first applied to determine a health index curve and an aging line. The relationship between these two curves gives an estimate of the system’s apparent age. The RUL of the system is then calculated in terms of the difference between its apparent age and its actual chronological age. In this study, thirteen retired systems and ten operating systems were evaluated and analyzed, and accurate results were obtained. Using the methods described here, the apparent age and the RUL of underground cable systems can be accurately estimated. Finally, a maintenance strategy for underground cable systems is recommended, which promises more efficient maintenance and greater cost-effectiveness in the management of underground cable systems.
1. Introduction
Underground power cables are widely and continuously used in the high- and medium-voltage electrical systems of transmission and distribution networks, and of industrial estates. They are used in power systems because of the reliability of supply that they offer, as well as for aesthetic reasons. However, an increasing number of failures of underground cables have been reported in recent years. Causes include corrosion, thermal, electrical, and mechanical stresses, as well as environmental impacts [1,2,3]. Factors such as these can lead to the degradation, electrical breakdown, and catastrophic failure of underground cable systems. In addition, any damage to underground cables usually results in long outage time, difficulty in failure localization, high repair expense, and possible penalty costs. Prevention of such damage is not an easy task, because the cable system consists of a large number of system components and accessories, such as the cable itself, joints, terminations, manholes, and duct banks. Knowledge of the actual condition and of any weak spots within underground systems is therefore vital for proper maintenance planning, to prevent sudden system failures and unscheduled outages.
Recently, various special testing and inspection methods have been developed, which aim to assess the condition of underground cable systems both online and offline. Online testing involves partial discharge measurement, infrared thermography inspection, insulation resistance measurement, grounding resistance measurement, sheath voltage and current measurement, and physical visual inspection [4,5,6]. Offline testing involves a withstand voltage test, which uses a very low frequency (VLF) voltage source or an AC resonance test system as external supply voltage. VLF Tan delta testing is suitable for this purpose and is effective for investigating the degradation of MV cable systems regarding the water treeing of insulation, but it cannot be used for HV underground cable systems due to the limitation of the rated power of the VLF voltage source [7]. The AC resonance test system is designed to withstand voltage testing of HV equipment and can be used to test HV cable systems. However, it can only provide “pass” or “fail” information and can sometimes cause the premature failure of the tested system. Therefore, it is usually performed with HV equipment after installation, and an acceptance test is then carried out to confirm the system condition after transportation and complete installation [8]. In addition, during maintenance of HV cable systems, it is nearly impossible to perform offline testing due to the requirements of a system shutdown. These include the unplugging of cables for testing with an external voltage source, which is expensive and involves the risk of cable damage [8]. For these reasons, to assess the condition of HV cable systems, all testing methods are usually performed online, and provide actual, real-time information on the cables’ operating conditions. Generally, the degradation of an electrical asset cannot be determined by testing methods alone. Other factors must be taken into consideration, such as the installation type, loading conditions, and environmental effects, as well as the historical failure records for each system [2,3,6]. Using various test results and operating information, the condition assessment of an underground cable system can be carried out so that the system can be maintained using a condition-based strategy. There are various techniques used for modeling the condition of underground cable systems, including the thermal model [9] and the operation model [1,10]. Some scholars have proposed a health index (HI) calculation [11,12,13], which could be used for underground cable systems. An HI calculation, which takes both testing results and operating data into consideration, was proposed in [14]. To improve the accuracy of the obtained results, the proposed evaluation process typically determines the HI of each component, before a final percentage of the overall health index (%OHI) is obtained for the whole underground cable system by multiplying the HI of the cable system with the operating factor (OF).
Although the condition of underground cable systems in terms of %OHI has been successfully obtained, the remaining useful life (RUL) of such assets should also be known to better understand how underground cable systems age with usage, and to enable better planning for their replacement in time. Recent studies have used various methods to estimate the end-of-life (EoL) of HV equipment and underground cable systems, including HI regression analysis [15], thermal and reliability modelling [10], Weibull survival probability [16], and analysis of the statistical relationship between HI and aging [17,18]. Established statistical methods, such as normal distribution and Weibull distribution, are well-suited to modeling the failure probability and aging of power equipment in the wear-out and random-failure periods, respectively. Normal distribution is the most basic probability distribution function. It is typically used to estimate a failure curve of assets using data on the average asset condition [13,19,20]. The Weibull distribution is mostly used to estimate the aging of various kinds of power equipment by adjusting only shape and scale parameters [20,21,22]. Finally, general replacement plans for deteriorated underground cable routes with available budgets and human resources were reported in [3,6,23].
This paper describes a novel process of identifying a relationship between HI curves and aging curves to estimate the RUL of 115 kV underground cable systems. The normal distribution is applied to %OHI values derived from historical testing results and the practical operating conditions of underground cable systems. The plotted curve shows a relationship between probability of failure (PoF) and %OHI, known as the health index curve (HI curve). Weibull distribution is then applied to produce an aging curve for underground cable systems resulting in a trend plot of PoF against system age. Finally, in accordance with the results from both the HI and aging curves, the %OHI value for each underground cable system is used to determine the RUL of the underground cable systems.
For the purposes of this study, historical testing data were obtained for twenty-three 115 kV underground cable systems. Ten of these are now being used by an independent power producer which supplies 4512 MW of electricity to a large industrial estate in Thailand. For all systems, apparent ages were obtained by simply comparing HI and aging curves. RULs were then estimated by calculating the difference between the apparent system age and the expected lifetime given by the manufacturer, the recommendation of international standards, the operating condition of the system, and the particular strategies of the operator organizations. Finally, the estimated RUL of each underground cable system was used by organizations to set up effective replacement plans for deteriorated underground cable routes according to budgets and human resources available.
2. Health Index Monitoring System
A health index monitoring system is an effective tool for identifying the actual condition of underground cable system equipment based on an evaluation of various testing and inspection results together with degradation factors [12,13,24]. In this paper, %OHI is generally given in terms of a percentage, so that a higher %OHI value indicate a better asset condition. The %OHI evaluation process provides not only a measure of an asset’s condition but also further information regarding the location, type, and severity of defects, and also helps to identify components that need to be repaired or replaced in order to maintain the asset condition within acceptable parameters.
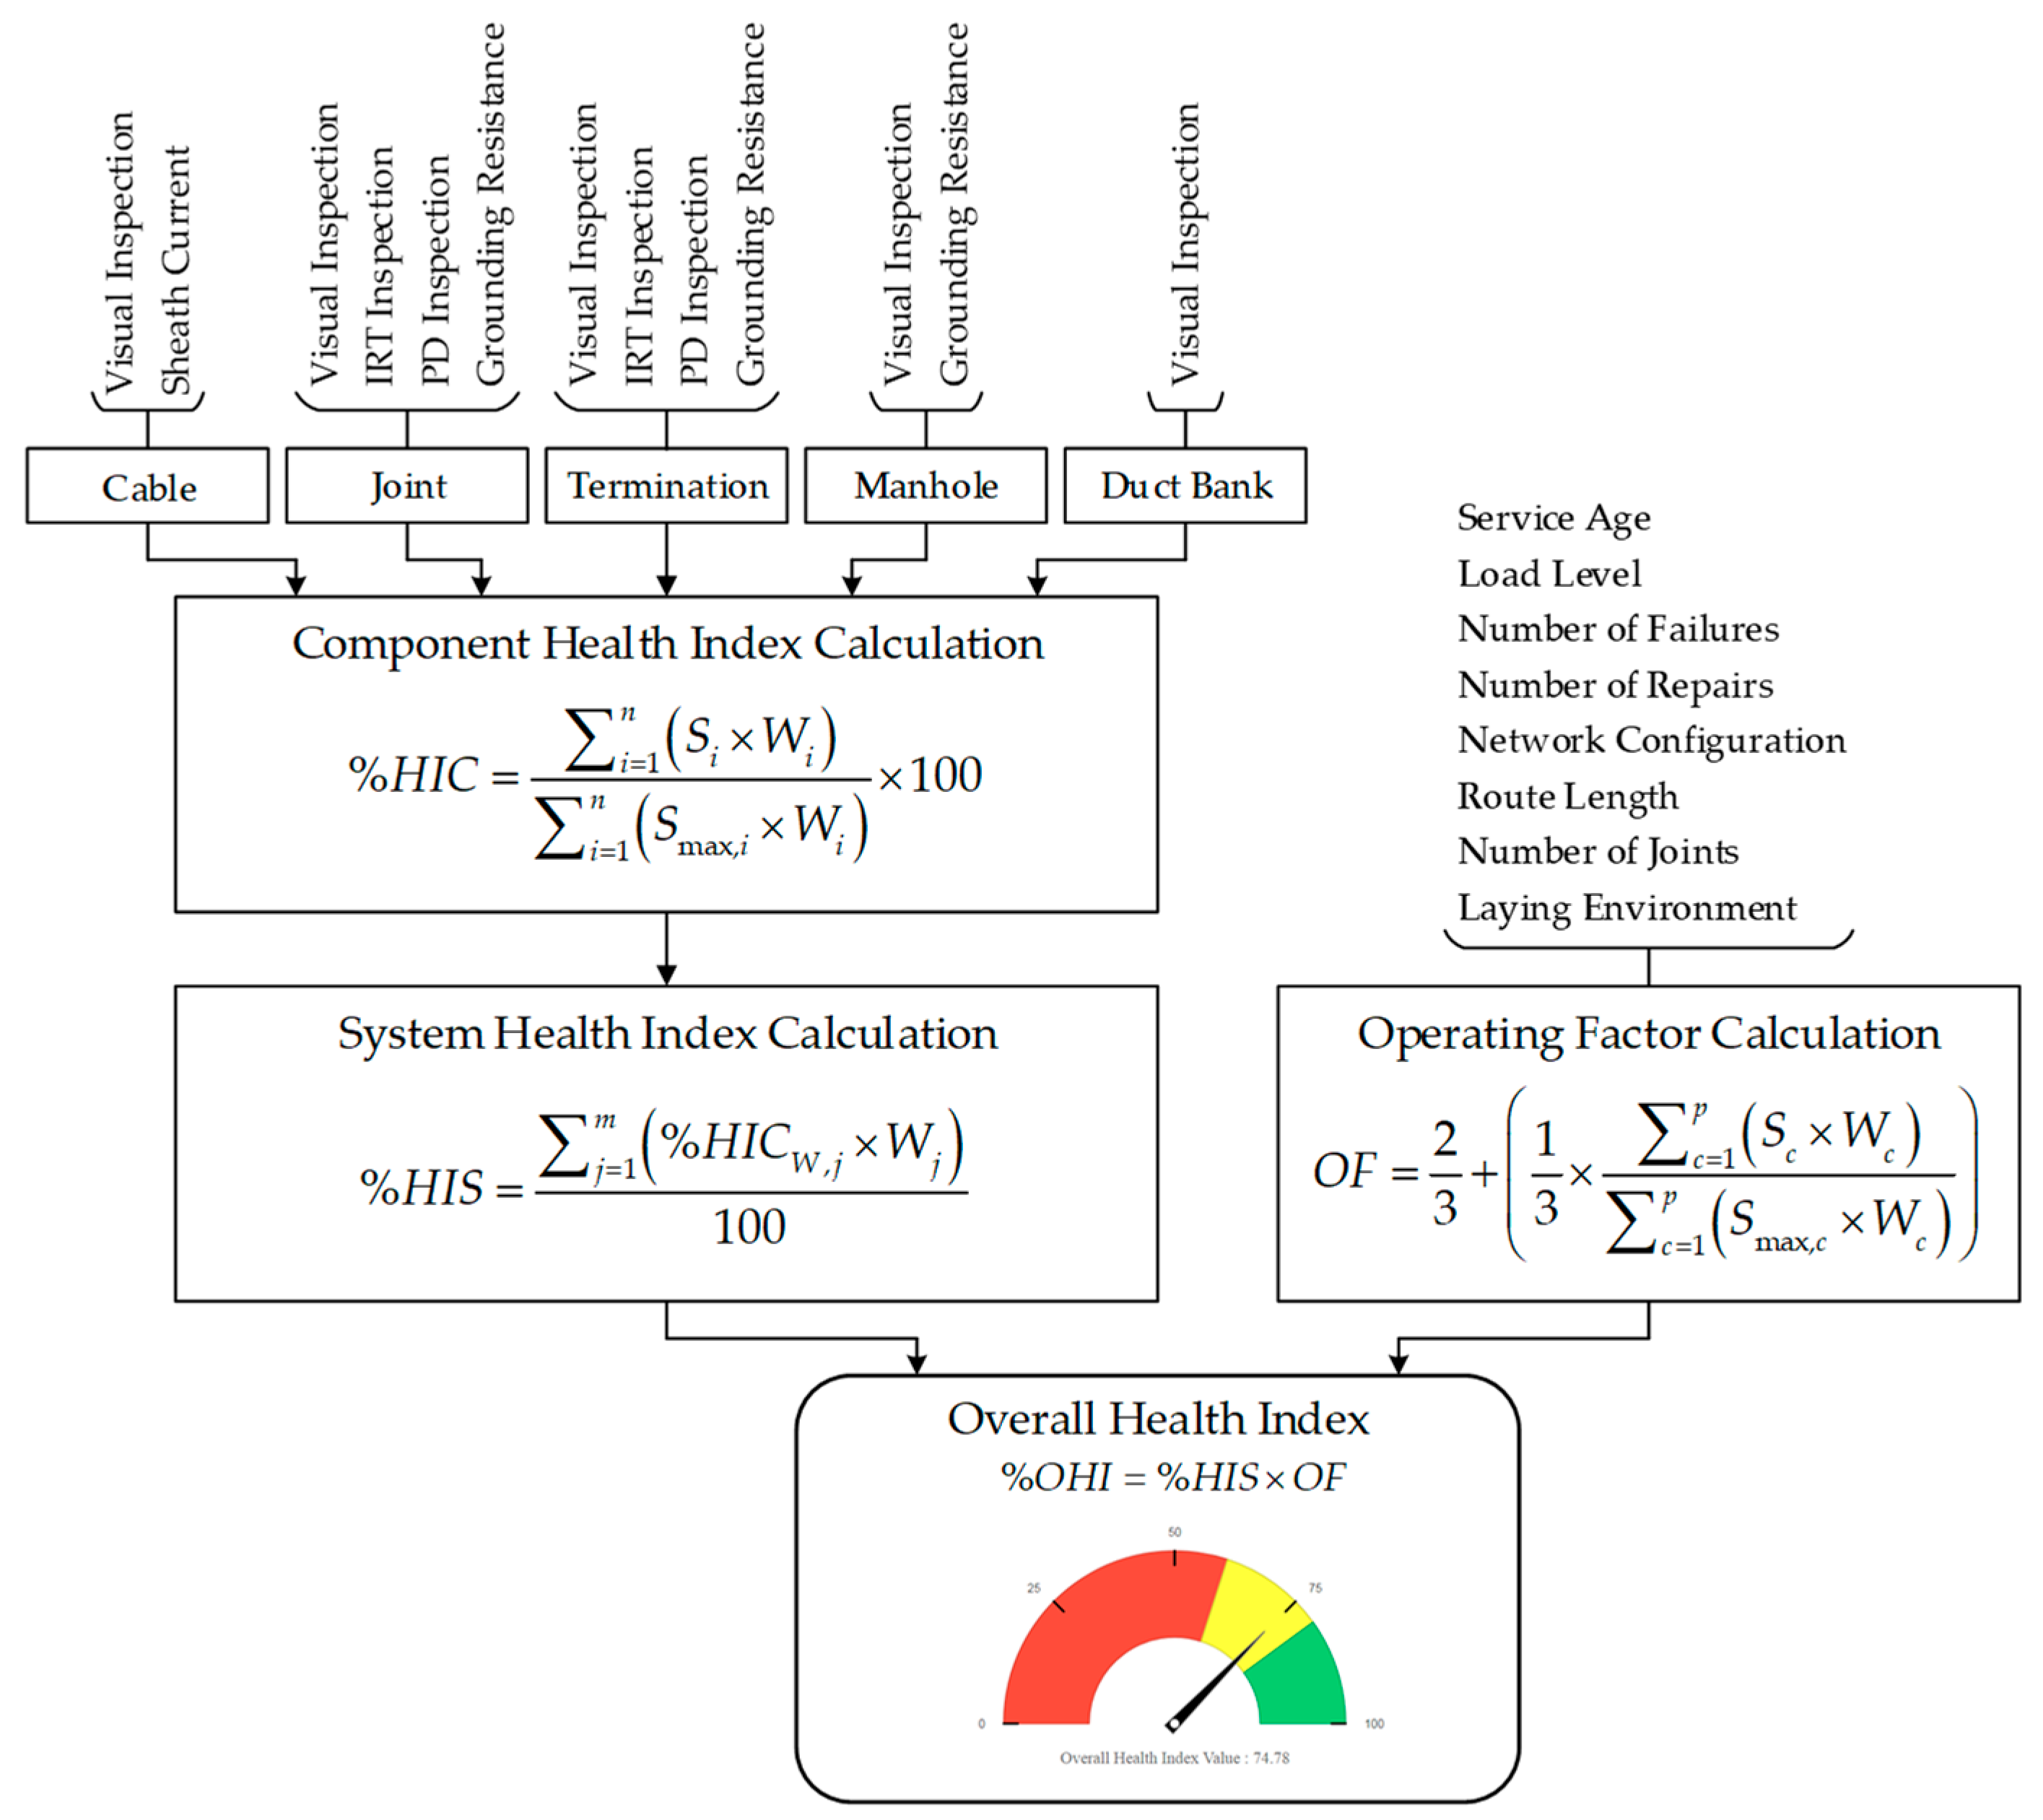
The method used to estimate %OHI in this study can be differentiated from those used in previous works, such as [14] and [24], in terms of our proposed parameters of practical operating factor (OF), as well as our application of practical testing methods and results to improve the trustworthiness of %OHI evaluation, so as to identify the actual condition of underground cable systems. Our %OHI estimation method is detailed in Figure 1, which shows an evaluation procedure that involves the actual condition and the operating condition in order to determine the %OHI of underground cable systems. Colors in the chart describe an asset’s condition as green, yellow, or red, indicating good, satisfactory, or bad conditions, respectively.
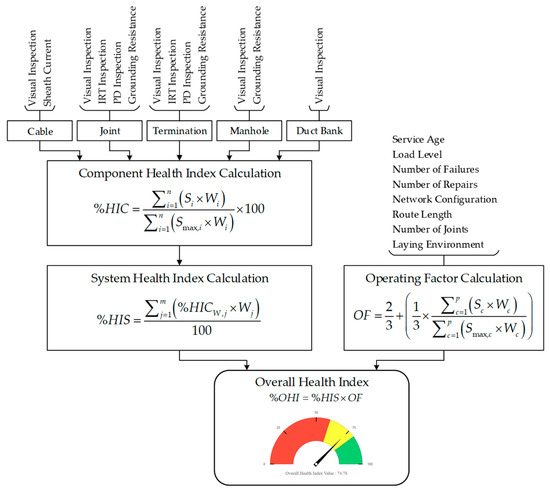
Figure 1.
Overall health index estimation procedure.
2.1. Data Collection
To calculate %OHI, three significant data sets were recorded and further used in the calculation process. These consisted of technical information, operating information, and the results of testing and inspection, and are detailed in Table 1. The historical test records were used to represent the trend of actual conditions and operating condition of assets in various terms.

Table 1.
Data requirement for HI calculation [14,24,25].
2.2. Operating Factor
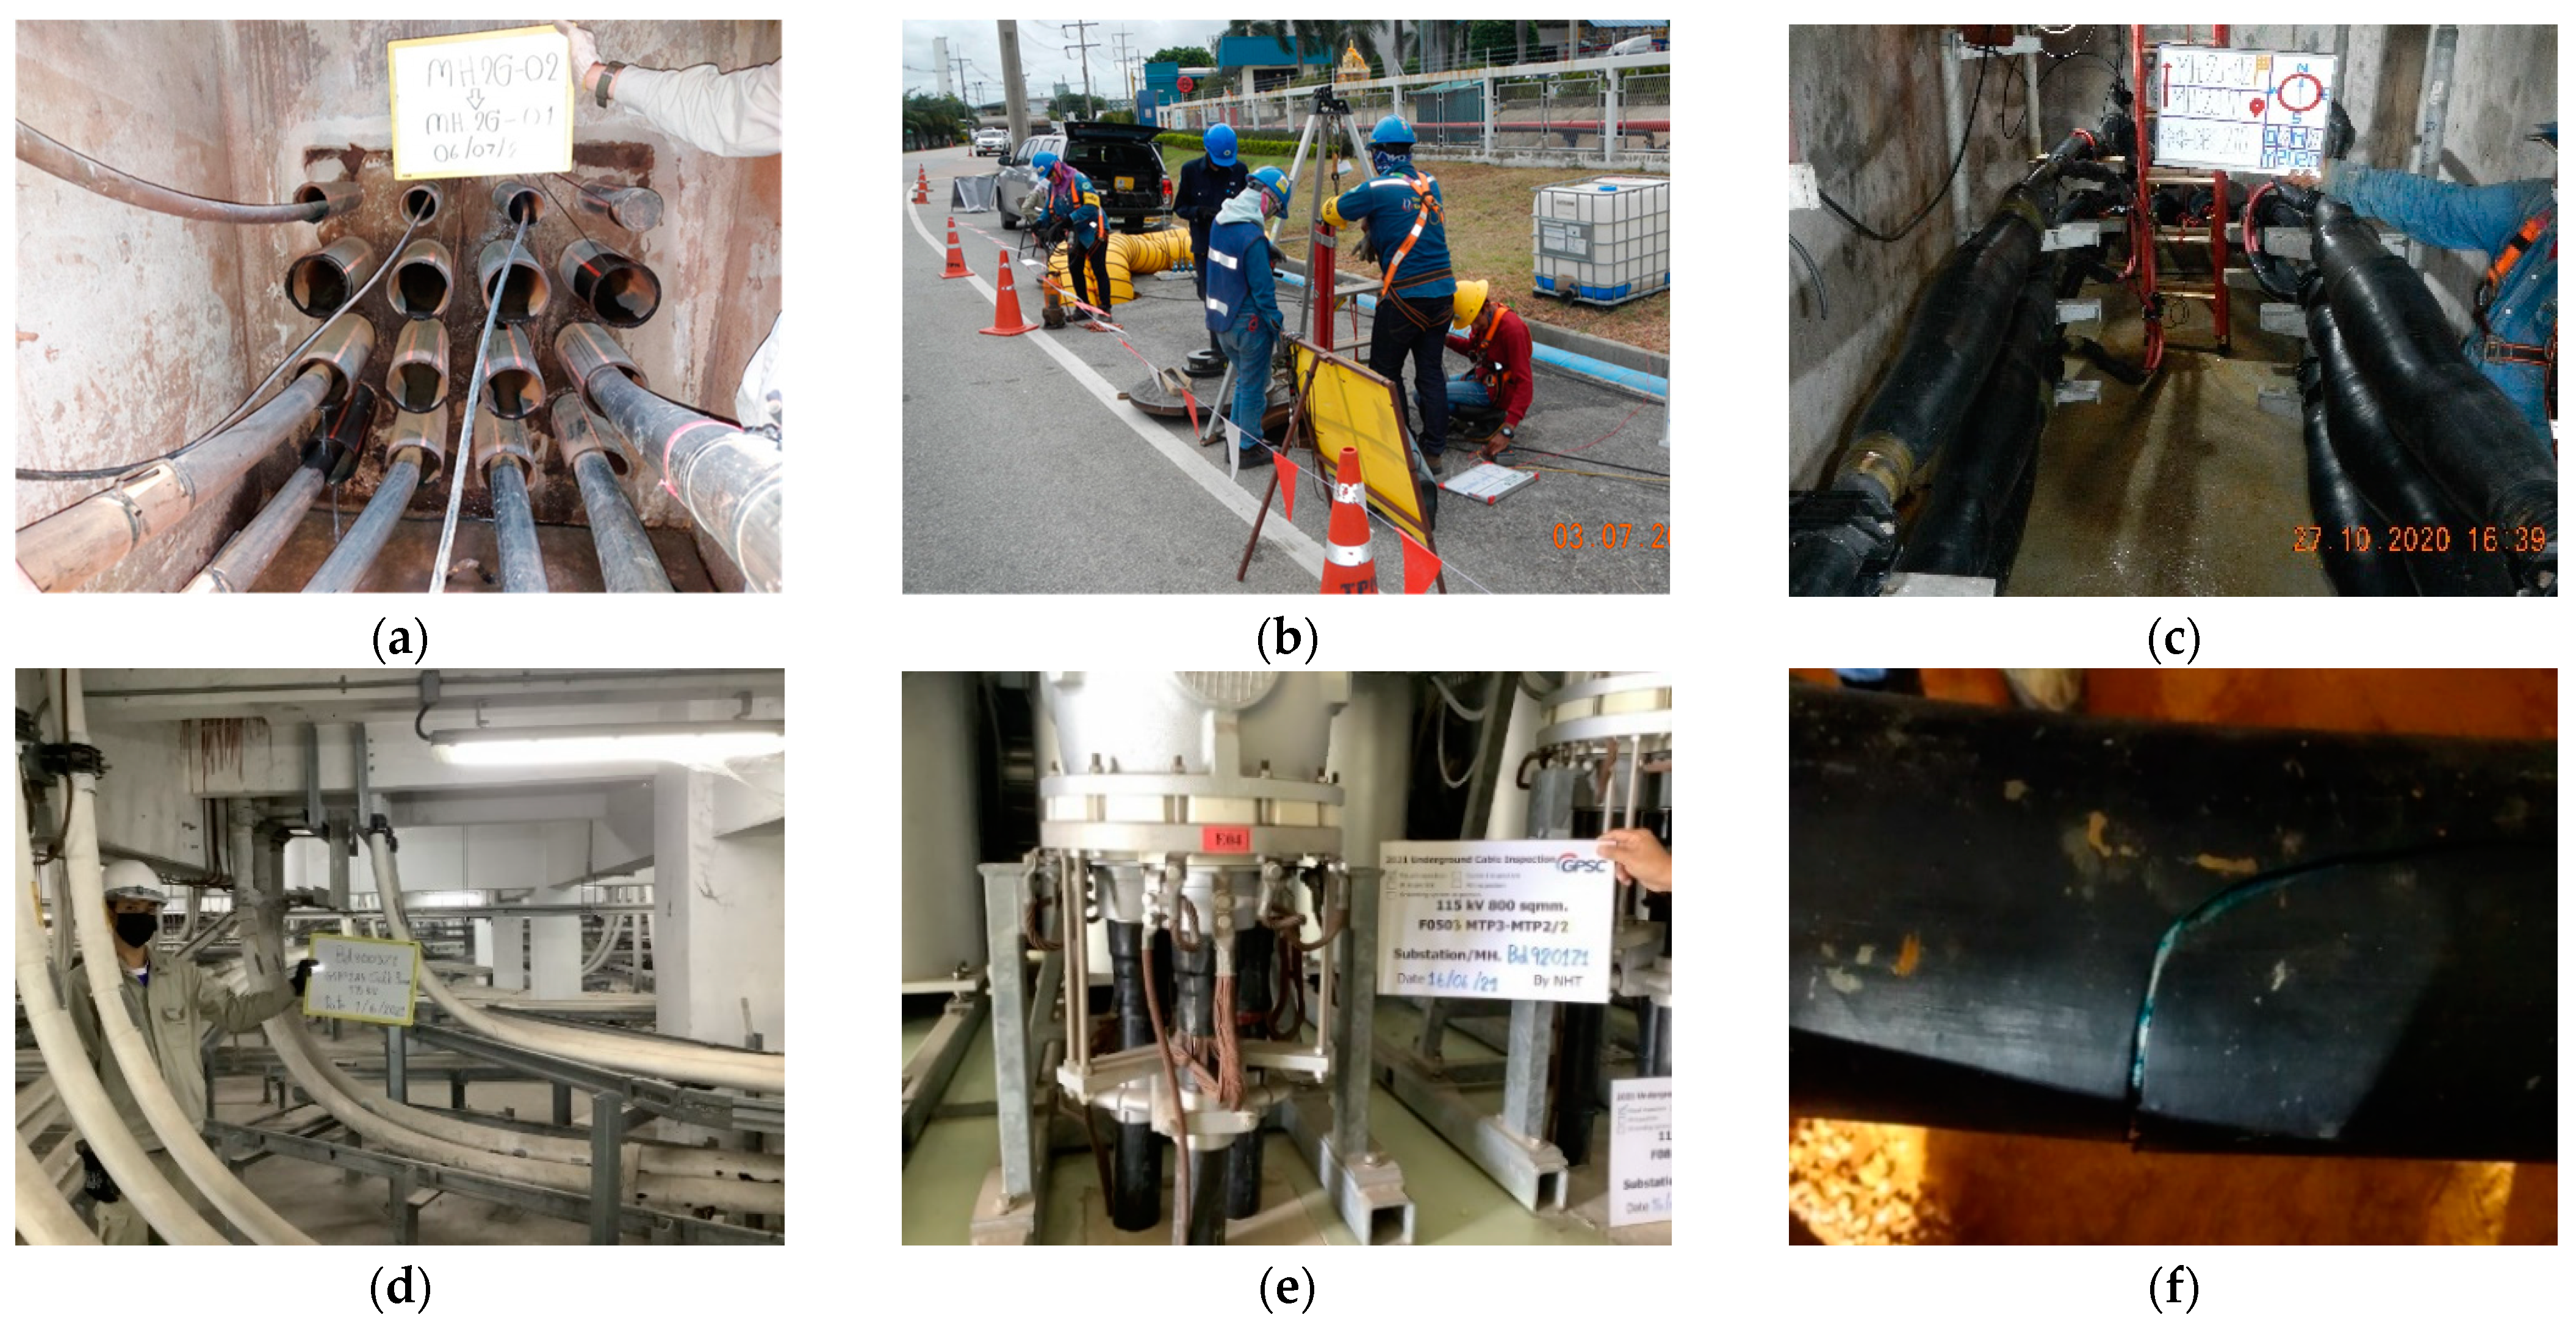
The operating factor (OF) takes into consideration such variables as service age, load level, number of failures, number of repairs, network configuration, route length, number of joints, and laying environment, and the examples of practical installation and operating environments are shown in Figure 2. The number of joints is counted from all individual joints of all phases in the three-phase underground cable system, which can be seen in Figure 2c. In this work, we used OF data to improve the accuracy of %OHI evaluation by incorporating practical operating conditions into our calculations. For each underground cable system, the obtained %OHI was multiplied by the OF to determine the system health index, as illustrated by the classification criteria in Table 2. However, for the next step of the %OHI calculation, we recalled that the OF cannot affect 100% of the asset’s overall condition. A figure of one-third was previously recommended and used [6,25] because the %OHI should not decrease to 0% if the system is new. This OF was used to take into account the severe operating condition of the cable systems under consideration. The OF calculation is expressed in Equation (1), as follows:
where Sc is a score of the cth operating criterion, Smax,c is a maximum score of the cth operating criterion, Wc is the importance weight of the cth operating criterion, c is the index of operating criterion, and p is the total number of operating criteria.
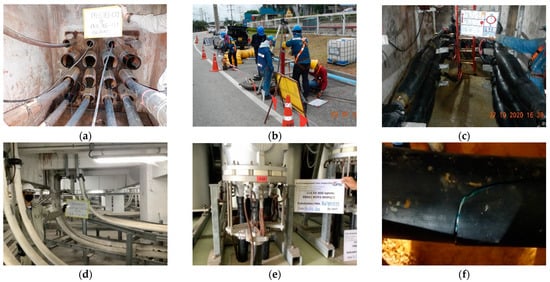
Figure 2.
Example working environment of underground cable systems: (a) cable laying through duct bank; (b) cable laying across the road; (c) joints of cables; (d) cable laying under the building; (e) plug-in GIS cable terminations; (f) cracked cable jacket.

Table 2.
Operating criteria for OF calculation [14,24,25].
2.3. Health Index Calculation
Following [14] and [24], underground cable system components were classified into five groups, i.e., cable, joint, termination, manhole, or duct bank, to facilitate the simple health index calculation set out in Figure 1. This condition estimation process begins with a calculation of the percentage health index of the underground cable system component (%HIC) by applying Equation (2) to the actual testing and inspection results given in Table 3, so that:
where Si is a score obtained from the ith test and inspection result, Smax,i is the maximum score of the ith test and inspection result, Wi is the importance weight of the ith test and inspection result, i is the index of testing and inspection methods, and n is the total number of test and inspection results.

Table 3.
Testing and inspection methods for HI calculation [4,14,24].
Next, the worst %HIC of each component group in the system is selected as a representative to calculate the percentage health index of the system (%HIS), as in Equation (3), as follows:
where %HICW,j is the worst component health index of the jth major component in each group, Wj is the importance weight of the jth major component of each group, j is the major component index of each group, and m is the total number of major component groups.
Finally, the percentage overall health index (%OHI) of the underground cable system is determined using Equation (4), as follows:
where %HIS is the system health index, and OF is the operating factor of the underground cable system.
This represents a consideration of the actual and operating conditions of the underground cable system, based not only on the test results, but also the usage level of the system. This calculation of %OHI can be similarly applied to other physical systems if their historical testing record and operating condition are sufficiently known.
3. Remaining Useful Life Estimation
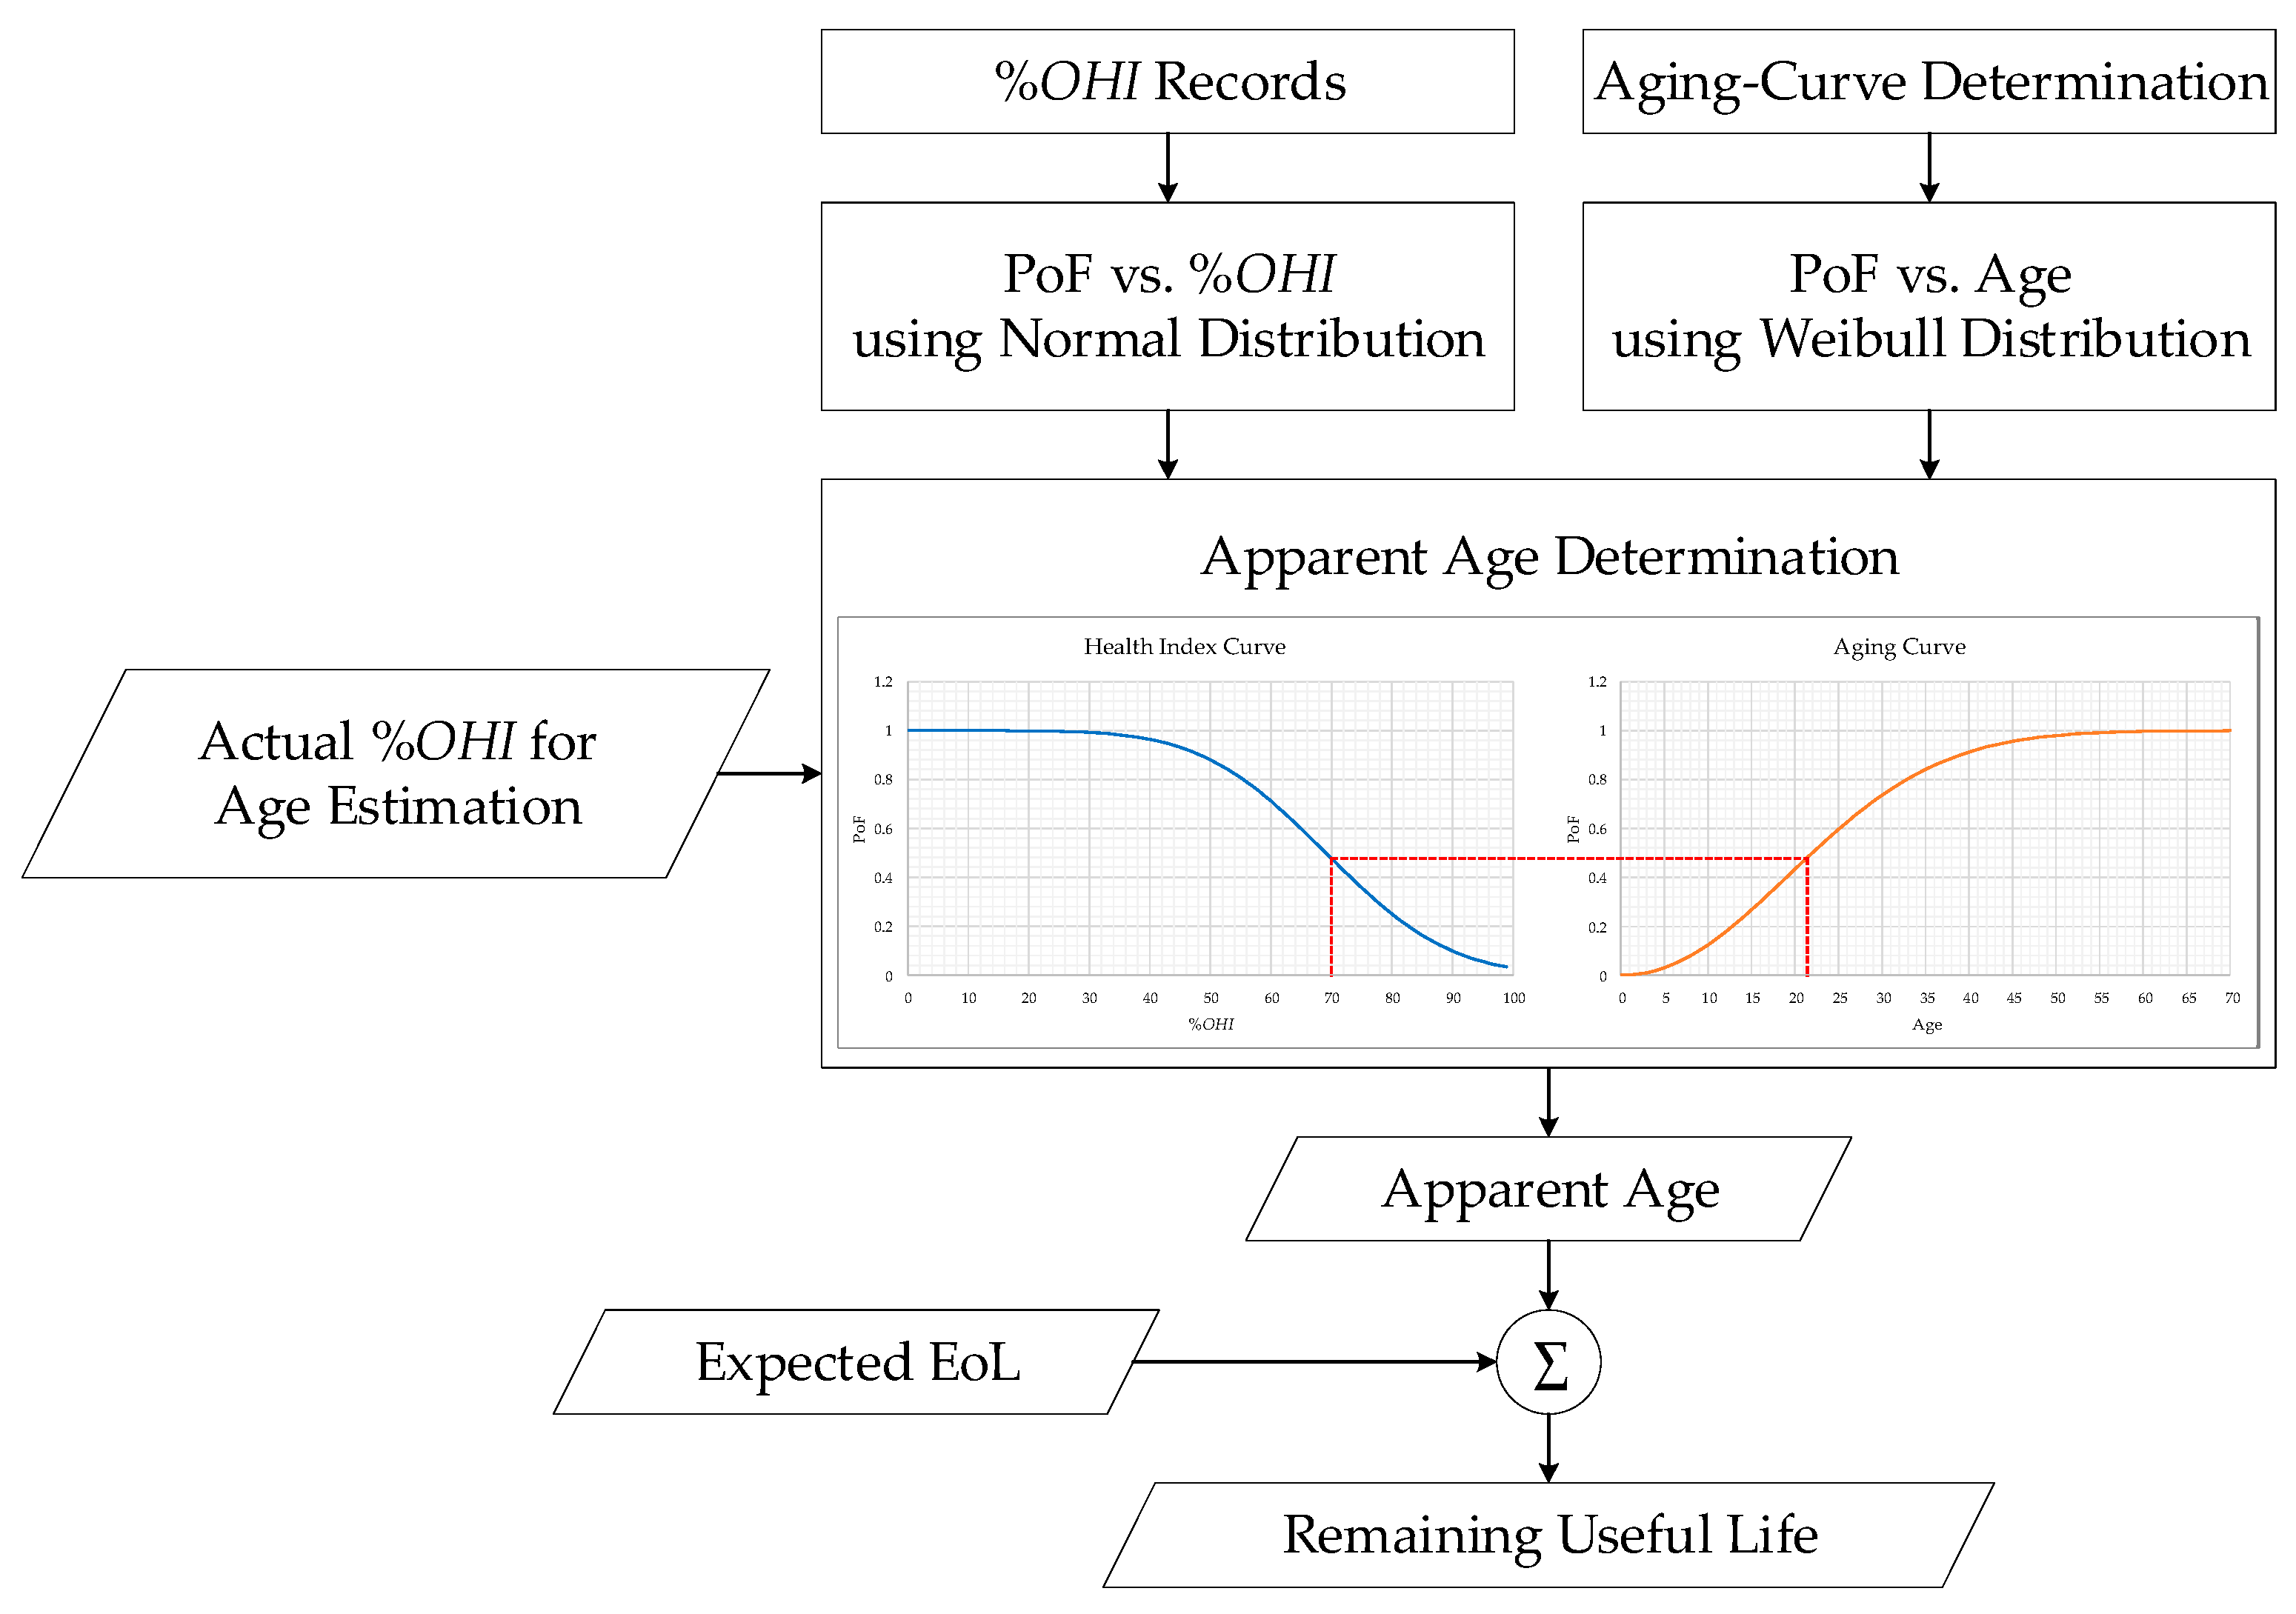
After the annual %OHI records of each retired underground cable system were sufficiently collected, statistical analyses were carried out to determine the correlation between the %OHI records and the aging of the equipment. Normal distribution was applied to determine the relationship between PoF and %OHI—known as the HI curve. Weibull distribution was used to estimate the aging behavior of equipment by determining the relationship between PoF and age—known as the aging curve. The procedure for RUL estimation is set out in Figure 3. Two additional inputs were used in the RUL evaluation process. These were the estimated actual %OHI and the expected EoL of the system.
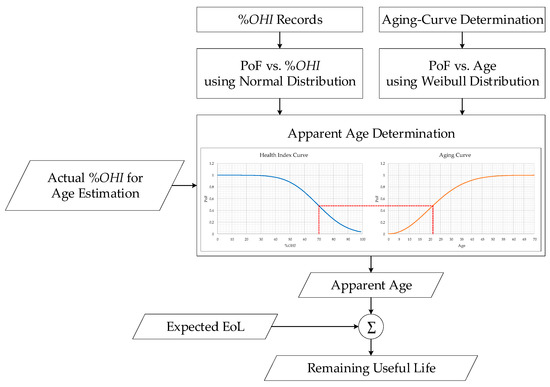
Figure 3.
Remaining useful life estimation procedure [26].
After the relationships between PoF and %OHI, and between PoF and age, were determined, the apparent asset age was estimated. This apparent age differs from the chronological age because it is an estimated figure based on practical testing data and actual operating stresses. Asset RUL was then determined as in Equation (5), thus:
3.1. Health Index Curve Using Normal Distribution
In Figure 3, on the left-hand side, normal distribution is used to estimate the failure probability of sample retired underground cable systems based on a mean and a standard deviation [16,20]. The probability of failure of underground cable systems is a combination of the system failure rate and %OHI, which illustrates the relationship between PoF and %OHI. This illustration was then confirmed by means of regression analysis of historical %OHI records of retired cable systems. With respect to the normal distribution analysis, three functions were used to determine the PoF from the %OHI, as follows: probability density function (PDF) or f(x); cumulative distribution function (CDF) or F(x); and survival function or S(x), as expressed in Equations (6)–(8) [13,18].
The probability density function (PDF) f(x) is therefore:
where μ is the mean of the population, σ is the standard deviation, and x is the population.
The cumulative distribution function (CDF) F(x) in normal distribution is an integral part of the PDF, so that:
The survival function S(x) using normal distribution is the inverse of the CDF, so that:
The probability density function f(x) is plotted in Figure 4a while the survival function S(x) is plotted in Figure 4b.

Figure 4.
Normal distribution application on %OHI analysis: (a) failure probability density versus %OHI; (b) HI curve.
Normal distribution analysis shows that the relationship between the %OHI and the PoF of the HI curve is an inverse variation, which means that the lower the %OHI, the higher the PoF that can be expected.
3.2. Aging Curve Using Weibull Distribution
On the right-hand side of Figure 3, the Weibull distribution was applied to determine the aging curve which displays the relationship between the PoF and the apparent age of underground cable systems by adjusting the shape (β) and scale (α) parameters according to the degradation behavior, the typical EoL, and the design lifetime [16,27,28]. To determine the apparent age of the underground cable system from %OHI, the aging curve was used as a representative curve for the studied HV cable systems, taking into consideration the actual operating condition, degradation behavior, and typical lifetime of underground cables. The calculations of failure rate and probability of failure using the Weibull distribution are set out in Equations (9) and (10), respectively [29], so that:
where t is the time in years, α is the scale parameter, and β is the shape parameter.
The α and β parameters were used to define the location and slope of the exponential rise of the aging curve. These two parameters were selected to closely reflect the typical aging process of the underground cable systems. The asset groups considered in this study had various EoL values ranging from 20 to 42 years. This finding was mainly a consequence of the typical lifetime of cross-linked polyethylene cables, which is typically 30–40 years, depending upon manufacturer design and international standard recommendations [4,9,30,31]. Using Equation (10), the value of α and β parameters has been estimated as 26.2 and 2.1, respectively, resulting in a shape of aging curve similar to that of the HI curve [16,28]. The failure probability density and aging graphs for the degradation characteristic of the asset’s cable system are shown in Figure 5a and b, respectively.

Figure 5.
Weibull distribution approaching aging curve analysis: (a) failure probability density versus age; (b) aging curve.
3.3. System Age Prediction
First, the apparent age of the considered underground cable system was determined using an actual %OHI of the cable system as an input to obtain the PoF value from the HI curve, as shown on the left-hand side graph of Figure 6, which is exactly consistent with the PoF value shown in the aging curve on the right-hand side graph, and thus indicates an estimated apparent system age.

Figure 6.
Estimation of apparent age of system [26].
Second, the apparent age of the considered underground cable system was calculated using Equations (11)–(13). Equation (11) is a rewritten form of Equation (6) which was used to determine the PDF according to the %OHI value of each system. Equation (12) is rewritten from Equation (8) and used to calculate the PoF of such a system using a survival or health index curve, such as that shown on the left-hand side of Figure 6. Finally, Equation (13) was used to calculate the apparent age of the system under consideration.
4. Results
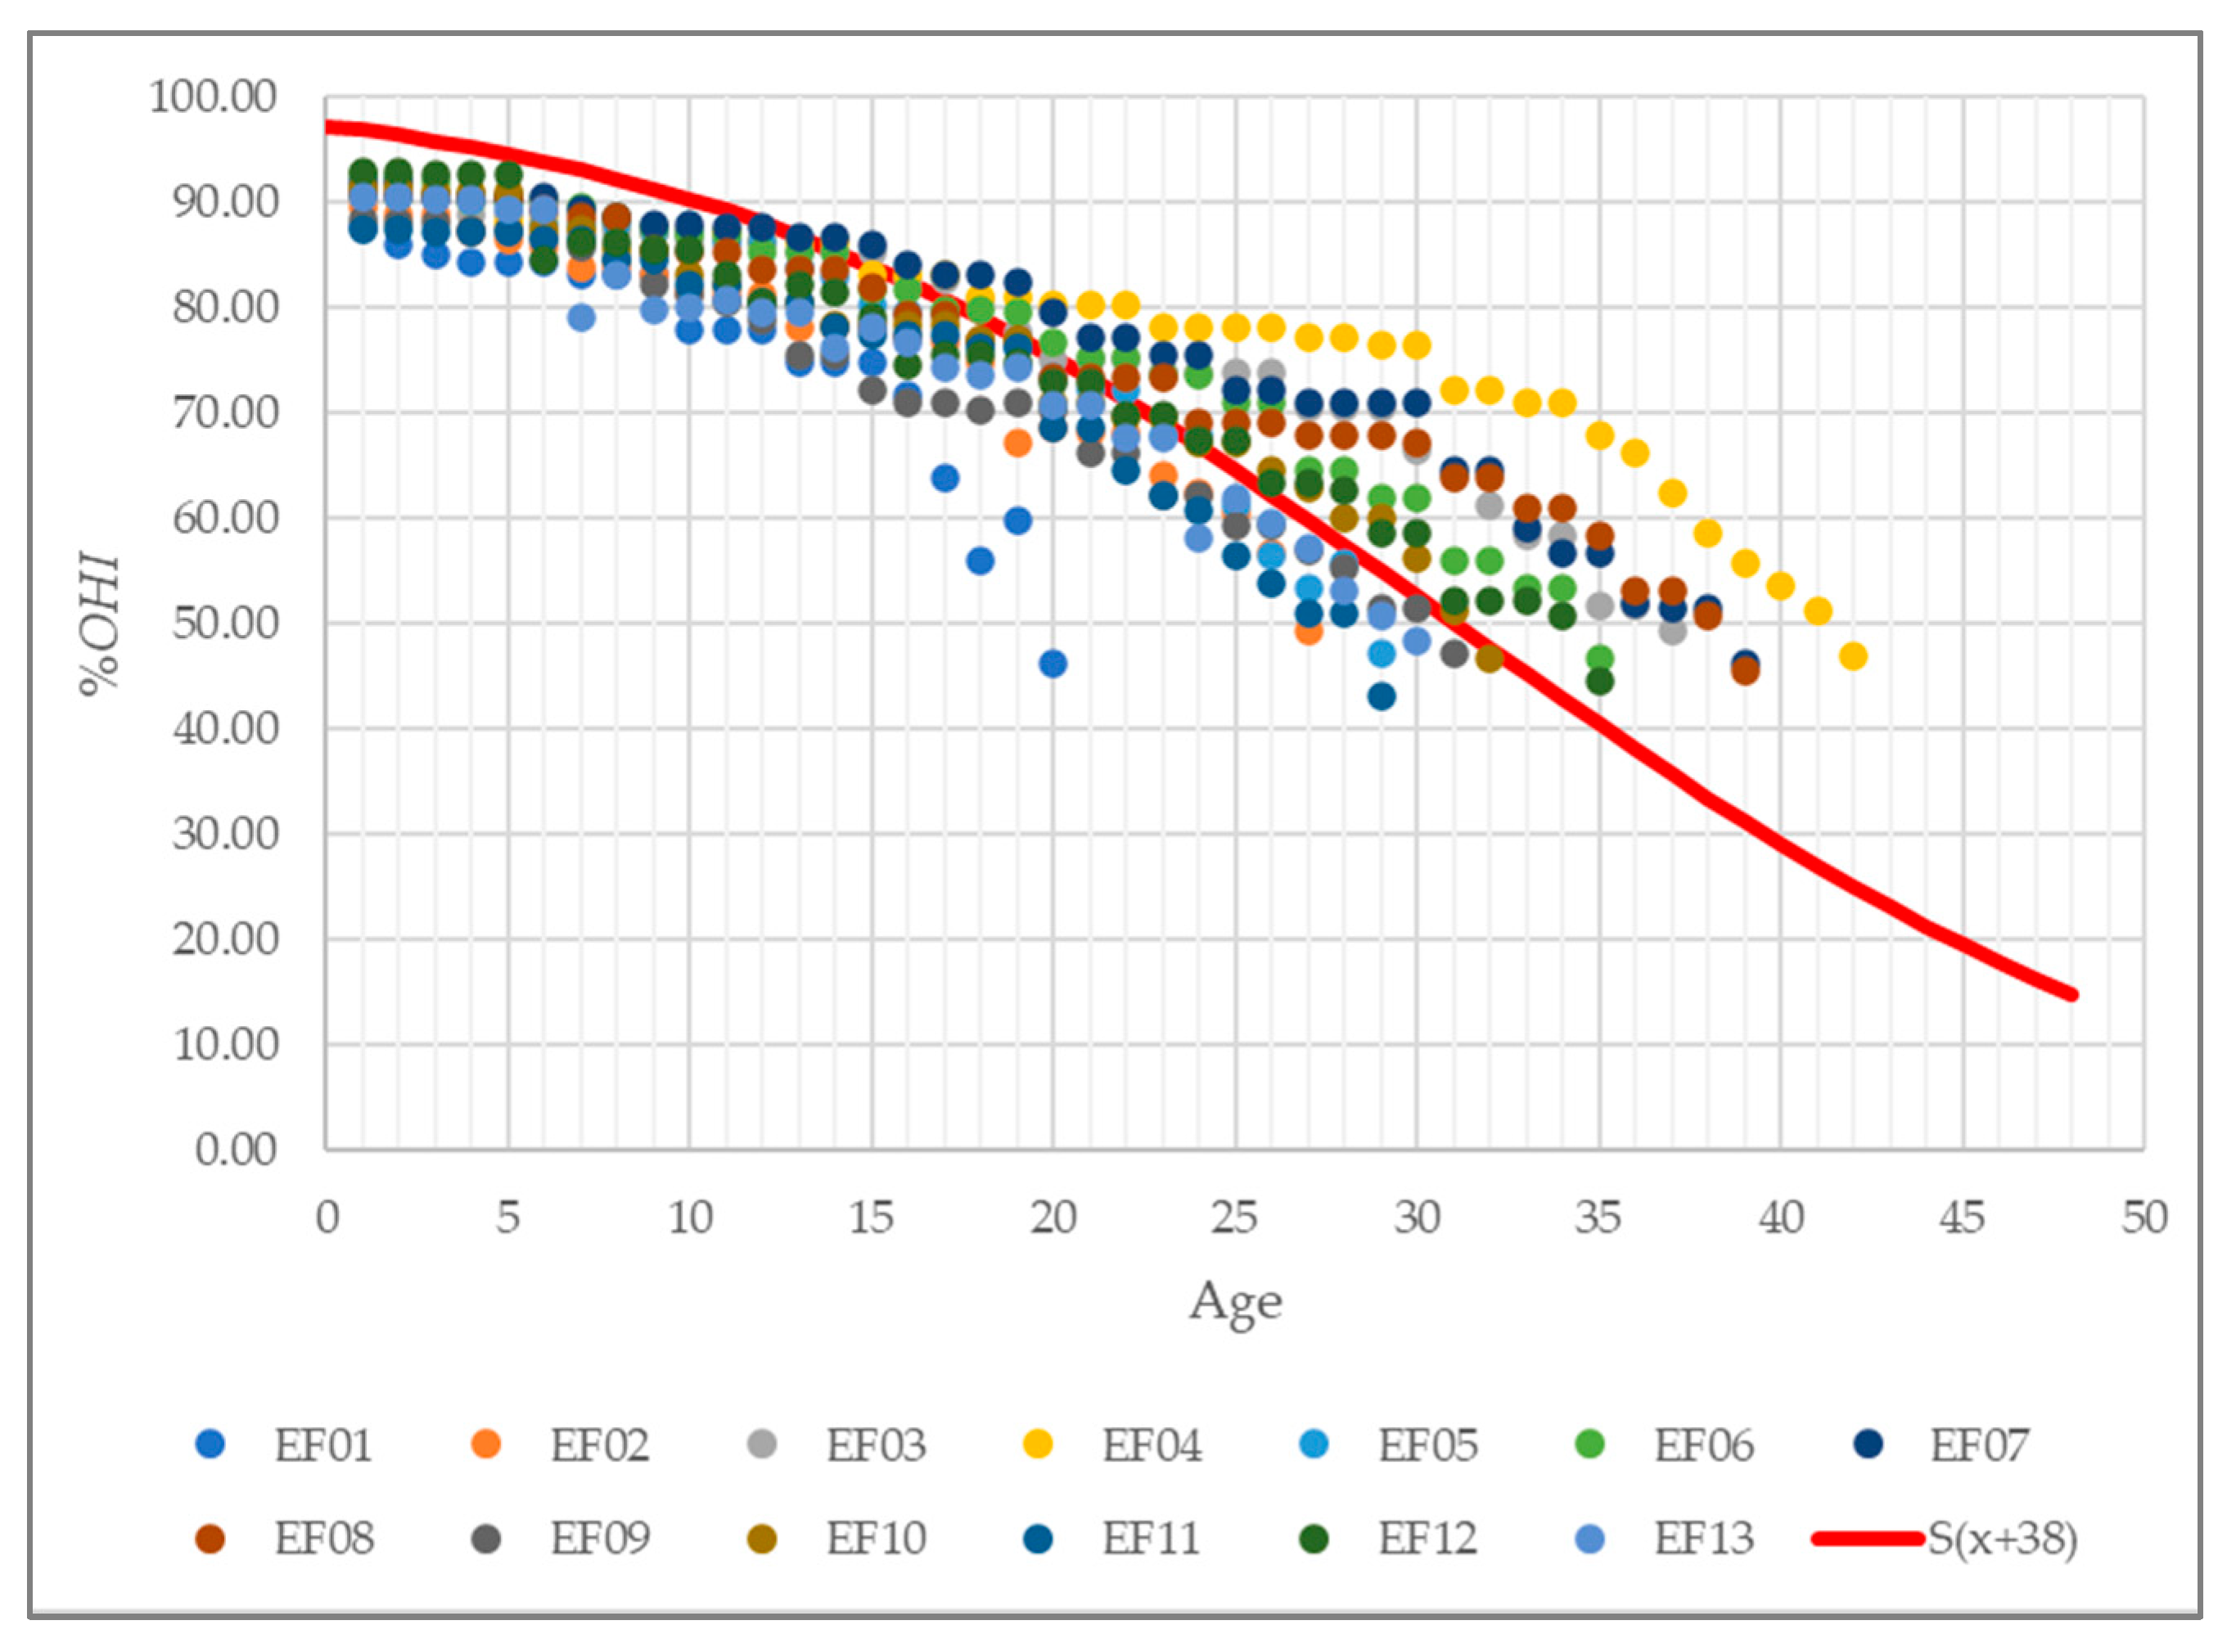
In this paper, thirteen retired underground cable systems from the same industrial estate area were evaluated and analyzed. All of them had been used in the system voltage of 115 kV and laid through duct banks and manholes. They had been used in different operating conditions, as shown in Table 4. Practical testing data and actual operating data of those underground cable systems were obtained during the evaluation process to determine %OHI values. However, the operating data for each underground cable system were unique because of the differences in environmental and operating conditions experienced by each individual system. The %OHI calculation method used in [14] and [24] was adopted for our study purposes and we obtained conventional health index (%HIS), operating factor (OF), and %OHI values for all 13 cable systems for both the starting year and the end-of-life year. These are shown in in Table 5. The %OHI values for the 13 systems for each year in service were then calculated. These are presented in Table 6. In all, 546 data of %OHI were evaluated from historical records, with values varying from 44% to 100%. Trend lines of the relationship between %OHI and serviced age were then plotted, and these are shown in Figure 7. The trend line fell dramatically after 15 years of service. Finally, the statistical parameters of %OHI consisting of the mean, variance, and standard deviation were determined, and these were equal to 69.05, 263.38, and 16.23, respectively.

Table 4.
Technical and operating information of 13 sample retired underground cable systems.

Table 5.
%OHI calculation of 13 sample of the retired underground cable systems.

Table 6.
Statistical %OHI records of 13 retired underground cable systems.
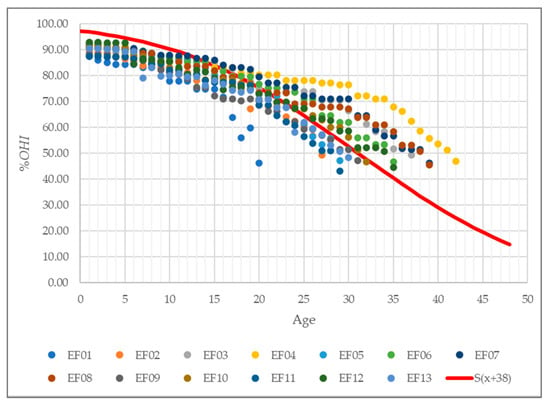
Figure 7.
All the %OHI records of 13 retired underground cable systems.
For the purposes of RUL estimation, we obtained the mean, variance, and standard deviation values for the 13 systems to calculate the PDF and S(x) functions, using Equations (6) and (8), resulting in the HI curves shown in Figure 4a and b, respectively. The obtained HI curve was then compared with the aging curve to estimate the apparent age of the underground cable systems, as illustrated in Figure 6. The results of the apparent age and the percentage age difference compared with the actual age are presented in Table 7. The RUL estimation resulted in very high errors at the beginning stage of the asset life (1st–10th years) due to the lack of recorded data for statistical estimation purposes. This means that the RUL evaluation method described here is not suitable for cases of premature failure or for burn-in periods; however, results for later years show that this method is applicable for aged underground cable systems, as per the stated objective of this work. When considering only the period between years 11 and 42, we found an average error of 3.79%, a minimum error of 0.29%, and a maximum error of 11.83%, and these figures are within the range generally considered as acceptable, i.e., that the average error should not exceed 5%.

Table 7.
RUL estimation error of the example retired systems.
After successfully applying the proposed RUL estimation method with retired cable systems, this method was then subsequently applied with 10 in-use underground cable systems, all installed in the same industrial area as the retired systems. By using their latest actual %OHI figures (Table 8), we found a highest RUL value of 30.01 years for the F01 system. This is because the F01 was the youngest of the 10 systems under consideration. Similarly, the oldest cable route—F10—had the lowest RUL value of 5.16 years. More interestingly, the F03 system and the F04 system both had the same chronological age of 17 years, but their apparent ages were different, being 17.37 and 14.97 years old, respectively. This difference in the apparent age can be explained by their different %OHI values, which reflect real-world differences in their actual condition and operating condition. In simple terms, the F03 system was in worse condition than the F04 system.

Table 8.
RUL estimation of 10 in-use systems in the same estate area.
The results obtained in this study may be of great practical benefit. If the %OHI of the underground cable systems in a network is known, the responsible organization can classify its cable systems to facilitate the efficient planning and management of maintenance actions. For underground cable system managers, the choice between urgent action, continuous monitoring, or normal inspection can be determined by considering the %OHI of a given system as representing bad, satisfactory, or good conditions, respectively [3,9,23]. Secondly, system lifetime extension can be achieved by considering the difference between apparent system age and actual age and adjusting operating conditions and maintenance intervals accordingly. Ideally, apparent and actual ages should be close to each other, and reflect the expected lifetime and the normal aging characteristics of the cable system. Finally, managers can optimize their budget by taking actions appropriate to the asset condition, such as the complete replacement of systems in seriously bad condition [9], the repair of systems with minor damage, the continuous monitoring of systems whose condition is suspect [31], or normal maintenance for systems in good condition [3] as summarized in Table 9.

Table 9.
Maintenance strategy recommendation for underground cable systems.
5. Conclusions
In this work, we sought to produce an effective RUL estimation tool for underground cable systems by considering statistical records of %OHI values from retired cable systems which reflected the degradation behavior of system components throughout their lifetime. The well-known HI calculation was applied to numerically determine the actual condition of components using technical information and operating data as well as actual testing and inspection results. Statistical methods were then applied, consisting of the normal distribution and Weibull distribution, to determine an HI curve and an aging curve, respectively, for the reference group of components. These were then used as representatives for subsequent estimations of apparent age and RUL. The %OHI records of the retired systems were analyzed using the normal distribution to provide a representative HI curve which displayed the relationship between the failure probability and %OHI. In addition, Weibull distribution was used to estimate an aging curve representing the degradation behavior of the underground cable systems, by adjusting the appropriate value of the shape and scale parameters. This aging curve illustrated the relationship of the PoF and the apparent age of the sample systems. Finally, the two curves were compared to each other by adding the latest actual %OHI of the estimating system to the HI curve to obtain the PoF value. The obtained PoF value was then applied to the aging curve resulting in an apparent age of the system. Finally, the RUL of the system was calculated by comparing the difference between the expected EoL and the apparent age. Estimations of apparent age were obtained for thirteen retired underground cable systems as well as ten in-use systems and are presented here. Differences between actual age and apparent age due to %OHI, as well as the RUL, are also described above. The error-percentage results demonstrate the accuracy and the effectiveness of this technique, as well as those age groups most suitable for its application. Results such as these can be used in system management to properly plan maintenance duration, repair, and replacement, and determine whether a matter is urgent or routine based on the RUL, apparent age, and %OHI data of the system. Finally, managers can optimize their budget by selecting appropriate options such as full replacement, minor repair, rescheduling a maintenance cycle, or continually performing routine activities, with reference to the obtained %OHI of each underground cable system.
Author Contributions
Conceptualization, T.S. (Tanachai Somsak), C.S. and T.S. (Thanapong Suwanasri); methodology, T.S. (Tanachai Somsak) and T.S. (Thanapong Suwanasri); formal analysis, T.S. (Tanachai Somsak) and C.S.; investigation, T.S. (Tanachai Somsak) and T.S. (Thanapong Suwanasri); resources, C.S. and T.S. (Thanapong Suwanasri); data curation, T.S. (Tanachai Somsak); writing—original draft preparation, T.S. (Tanachai Somsak), C.S. and T.S. (Thanapong Suwanasri); writing—review and editing, C.S. and T.S. (Thanapong Suwanasri); supervision, C.S. and T.S. (Thanapong Suwanasri); project administration, C.S. All authors have read and agreed to the published version of the manuscript.
Funding
This research was funded by National Science, Research and Innovation Fund (NSRF), and King Mongkut’s University of Technology North Bangkok with Contract No. KMUTNB-FF-66-13.
Data Availability Statement
Not applicable.
Conflicts of Interest
The authors declare no conflict of interest.
References
- Mazzanti, G. Life and Reliability Models for High Voltage DC Extruded Cables. IEEE Electr. Insul. Mag. 2017, 33, 42–52. [Google Scholar] [CrossRef]
- Bicen, Y. Trend Adjusted Lifetime Monitoring of Underground Power Cable. Electr. Power Syst. Res. 2017, 143, 189–196. [Google Scholar] [CrossRef]
- Gulski, E.; Jongen, R. Condition Based Maintenance of Transmission Power Cables. IEEE Trans. Power Deliv. 2022, 37, 1588–1597. [Google Scholar] [CrossRef]
- IEEE Std 400-2012; Guide for Field Testing and Evaluation of the Insulation of Shielded Power Cable Systems Rated 5 kV and Above. Institute of Electrical and Electronics Engineers: Piscataway, NJ, USA, 2012. [CrossRef]
- Zhang, Z.; Assala, P.D.S.; Wu, L. Residual Life Assessment of 110 kV XLPE Cable. Electr. Power Syst. Res. 2018, 163, 572–580. [Google Scholar] [CrossRef]
- CIGRE. Remaining Life Management of Existing AC Underground Lines; WG B1.09; Technical Brochure No. 358; CIGRE: Paris, France, 2008. [Google Scholar]
- IEEE Std 400.2-2013; Guide for Field Testing of Shielded Power Cable Systems Using Very Low Frequency (VLF)(Less than 1 Hz). Institute of Electrical and Electronics Engineers: Piscataway, NJ, USA, 2013. [CrossRef]
- IEEE Std 4-2013; Standard for High-Voltage Testing Techniques. Institute of Electrical and Electronics Engineers: Piscataway, NJ, USA, 2013. [CrossRef]
- Buhari, M.; Levi, V.; Awadallah, S.K.E. Modelling of Ageing Distribution Cable for Replacement Planning. IEEE Trans. Power Syst. 2016, 31, 3996–4004. [Google Scholar] [CrossRef]
- Mazzanti, G. The Effects of Seasonal Factors on Life and Reliability of High Voltage AC Cables Subjected to Load Cycles. IEEE Trans. Power Deliv. 2020, 35, 2080–2088. [Google Scholar] [CrossRef]
- Naranpanawe, L.; Ma, H.; Saha, T.K.; Lee, C.; Ghosal, A. A Practical Health Index for Overhead Conductors: Experience from Australian Distribution Networks. IEEE Access 2020, 8, 218863–218873. [Google Scholar] [CrossRef]
- Liu, Y.; Xv, J.; Yuan, H.; Lv, J.; Ma, Z. Health Assessment and Prediction of Overhead Line Based on Health Index. IEEE Trans. Ind. Electron. 2019, 66, 5546–5557. [Google Scholar] [CrossRef]
- Foros, J.; Istad, M. Health Index, Risk and Remaining Lifetime Estimation of Power Transformers. IEEE Trans. Power Deliv. 2020, 35, 2612–2620. [Google Scholar] [CrossRef]
- Somsak, T.; Suwanasri, T.; Suwanasri, C. Condition Assessment of Underground Cable System Using Health Index and Conditional Multiplying Factor. In Proceedings of the 21st International Symposium on High Voltage Engineering (ISH 2019), Budapest, Hungary, 26–30 August 2019; pp. 763–776. [Google Scholar] [CrossRef]
- Li, S.; Wu, G.; Dong, H.; Yang, L.; Zhen, X. Probabilistic Health Index-Based Apparent Age Estimation for Power Transformers. IEEE Access 2020, 8, 9692–9701. [Google Scholar] [CrossRef]
- Melchor-Hernández, C.L.; Rivas-Dávalos, F.; Maximov, S.; Coria, V.; Moreno-Goytia, E.L. An Analytical Method to Estimate the Weibull Parameters for Assessing the Mean Life of Power Equipment. Int. J. Electr. Power Energy Syst. 2015, 64, 1081–1087. [Google Scholar] [CrossRef]
- Tsimberg, Y.; Lotho, K.; Dimnik, C.; Wrathall, N.; Mogilevsky, A. Determining Transmission Line Conductor Condition and Remaining Life. In Proceeding of the 2014 IEEE PES T&D Conference and Exposition, Chicago, IL, USA, 14–17 April 2014; pp. 1–5. [Google Scholar] [CrossRef]
- CIGRE. Asset Management Decision Making using different Risk Assessment Methodologies; WG C1.25; Technical Brochure No. 541; CIGRE: Paris, France, 2013. [Google Scholar]
- Liu, S.; Wang, Y.; Tian, F. Prognosis of Underground Cable via Online Data-Driven Method with Field Data. IEEE Trans. Ind. Electron. 2015, 62, 7786–7794. [Google Scholar] [CrossRef]
- Li, W. Evaluating Mean Life of Power System Equipment with Limited End-of-Life Failure Data. IEEE Trans. Power 2004, 19, 236–242. [Google Scholar] [CrossRef]
- Chimunda, S.; Nyamupangedengu, C. A Reliability Assessment Model for an Outdoor 88kV XLPE Cable Termination. Electr. Power Syst. Res. 2019, 177, 105979. [Google Scholar] [CrossRef]
- Montanari, G.C.; Fabiani, D.; Ciani, F. Partial Discharge and Aging of AC Cable Systems Under Repetitive Voltage Transient Supply. In Proceeding of the 2016 IEEE Electrical Insulation Conference (EIC), Montreal, QC, Canada, 19–22 June 2016; pp. 379–382. [Google Scholar] [CrossRef]
- CIGRE. Maintenance of HV Cable Systems; WG B1.60; Technical Brochure No. 825; CIGRE: Paris, France, 2021. [Google Scholar]
- Somsak, T.; Suwanasri, T.; Suwanasri, C. Lifetime Estimation Based Health Index and Conditional Factor for Underground Cable System. Energies 2021, 14, 8113. [Google Scholar] [CrossRef]
- CIGRE. Generic Guidelines for Life Time Condition Assessment of HV Assets and Related Knowledge Rules; WG B1.17; Technical Brochure No. 420; CIGRE: Paris, France, 2010. [Google Scholar]
- Jahromi, A.; Piercy, R.; Cress, S.; Service, J.; Fan, W. An Approach to Power Transformer Asset Management Using Health Index. IEEE Electr. Insul. Mag. 2009, 25, 20–34. [Google Scholar] [CrossRef]
- Thind, B.S.; Reddy, G.N.; Thomas, A.J.; Reddy, C.C. Modified Damage Equalization Method for Lifetime Estimation of Dielectrics. IEEE Trans. Dielectr. Electr. Insul. 2021, 28, 1118–1126. [Google Scholar] [CrossRef]
- Shaban, A.H.; Resen, A.K.; Bassil, N. Weibull Parameters Evaluation by Different Methods for Windmills Farms. Energy Rep. 2020, 6, 188–199. [Google Scholar] [CrossRef]
- IEC 62539; IEEE 930; Guide for the Statistical Analysis of Electrical Insulation Breakdown Data. IEC: Geneva, Switzerland; IEEE: Piscataway, NJ, USA, 2007. [CrossRef]
- Hamad, A.A.; Ghunem, R.A. A Techno-Economic Framework for Replacing Aged XLPE Cables in the Distribution Network. IEEE Trans. Power Deliv. 2020, 35, 2387–2393. [Google Scholar] [CrossRef]
- Liao, Y.; Liu, H.; Yuan, J.; Xu, Y.; Zhou, W.; Zhou, C. A Holistic Approach to Risk-Based Maintenance Scheduling for HV Cables. IEEE Access 2019, 7, 118975–118985. [Google Scholar] [CrossRef]
Publisher’s Note: MDPI stays neutral with regard to jurisdictional claims in published maps and institutional affiliations. |
© 2022 by the authors. Licensee MDPI, Basel, Switzerland. This article is an open access article distributed under the terms and conditions of the Creative Commons Attribution (CC BY) license (https://creativecommons.org/licenses/by/4.0/).

