Article

Study on Characteristics of Overburden Strata Structure above Abandoned Gob of Shallow Seams—A Case Study

1
State Key Laboratory of Mining Disaster Prevention and Control Co-Founded by Shandong Province and the Ministry of Science and Technology, Shandong University of Science and Technology, Qingdao 266590, China
2
General Institute of Exploration and Research of China National Administration of Coal Geology, Beijing 100039, China
3
Shandong Geology and Mineral Resources Engineering Group Co., Ltd., Jinan 250013, China
4
Shandong Procincial Bureau of Geology & Mineral Resources, Jinan 250013, China
5
College of Mining Engineering, Taiyuan University of Technology, Taiyuan 030024, China
6
College of Foreign Languages, Shandong University of Science and Technology, Qingdao 266590, China
*
Authors to whom correspondence should be addressed.
Energies 2022, 15(24), 9359; https://doi.org/10.3390/en15249359
Submission received: 31 October 2022 / Revised: 7 December 2022 / Accepted: 8 December 2022 / Published: 10 December 2022
(This article belongs to the Special Issue Optimization of Coal Mining and Fossil Energy)

Abstract

:
To understand the change in overburden structure after coal seam group mining, we investigated the overburden characteristics and bearing capacity of abandoned coal mines in a coal seam group. We provide a theoretical basis for the construction and utilization of a coal mining subsidence area under a complex geological environment. This paper takes the construction project of Zhongtie Huizhi Square in Zhangqiu District, Jinan City, Shandong Province as the engineering background. According to the occurrence conditions of the study area, theoretical analysis, similar simulation, numerical simulation, and engineering practice verification are used. The overburden structure characteristics of abandoned mines in a shallow-buried coal seam group were studied. The results show that the development height of the water-carrying fractured zone after the mining of the 3#, 4#, and 9# coal seams is 17 m, 19.5 m, and 27.1 m, respectively, which shows that the height of water flow in the fractured zone is proportional to the buried depth of the coal seam after coal seam mining. After the model is set aside for three months, the degree of development of the residual fracture in the goaf is analyzed, and the distribution law of residual porosity in the longwall old goaf of a shallow-buried multiple coal seam is obtained. The development rate of residual fissures on both sides of the goaf is between 20.31% and 42.31%. The residual fracture development rate in the middle is relatively small, being between 8.21% and 18.53%. We comprehensively analyzed the characteristics of overlying strata in the abandoned mine under actual stratum conditions, and compared the empirical calculation results, theoretical research, similar simulation, and numerical simulation results in the specification with the engineering practice to prove the reliability of the research.

1. Introduction

The endowment characteristics of China’s energy resources determine the coal-based energy structure of China [1,2,3,4,5,6]. Surface subsidence caused by coal mining in China is mainly distributed in densely populated and economically developed central and eastern regions [7,8,9,10]. With the rapid development of urban and engineering construction in China, land for construction is becoming increasingly scarce, and some structures have had to be built or crossed over the mined-out area [11,12,13,14,15,16]. Affected by the residual deformation of the ground surface in the abandoned mine area, there are great safety hazards for these buildings [17,18,19,20]. Moreover, China is vast, and the occurrence of coal seams varies greatly. Additionally, many mines are used for multi-seam mining [21]. Therefore, it is important to scientifically and accurately understand the structural changes in the overlying strata after the mining of coal seams and to determine the characteristics and bearing capacity of the overlying strata in abandoned coal seam mines.
At present, the overburden structure and the distribution characteristics of the “three zones” have been well studied for a shallow single coal seam after the impact of mining. However, there is still a lack of scientific understanding in terms of the structural characteristics of the overlying strata and the distribution of the “three zones” in the abandoned mine area of shallow-buried double or multiple coal seams [22]. Cao [23] performed similar simulations of the overlying strata movement characteristics and the underlying strata stress distribution in the coal mines of the study area, and found that the overlying strata around the coal pillar formed asymmetrically, and that the fault zone was perpendicular to the long wall and the overlying strata can be “M-shaped” only during deep coal mining. Ghabraie [24] studied the subsidence characteristics of multi-coal-seam mining by different similar simulation experiments. Because the rock position of different coal seams has a significant impact on the development of multi-coal-seam subsidence, the multi-coal-seam mining area can be divided into different areas with different subsidence characteristics according to the different rock position. Qin [25] simulated the full-length wall mining process of multiple coal seams using a physical modeling experiment in order to reveal the essential differences between the rock failure mechanism of multi-coal-seam mining and that of single-coal-seam mining, and found that, during upper coal seam mining, the fracture position is greatly affected by the periodic weight distribution, and multi-coal-seam mining will cause the surface subsidence to move toward the end of the stope as a result of upper coal seam mining. Wang [26] studied the reasonable roadway layout of coal seams under multi-coal-seam mining through FLAC3D numerical simulation and found that locating the roadway in the stress reduction zone can avoid the influence of abutment pressure in upper coal seam mining, to a certain extent. Cheng [27] took the medium-distance mining activities of multiple coal seams in a coal mine in China as examples, and studied the connection between the failure zone of the upper coal seam floor and the fracture zone of the lower coal seam caused by the failure of the key strata between the upper and lower coal seams, by means of borehole water level observation, digital borehole camera test, and microseismic monitoring. Ghabraie [28], in order to solve the deviation of traditional subsidence prediction methods for multi-coal-seam subsidence prediction, took the case of an Australian multiple coal seam as the background to study the significant differences between the self-testing of single-coal-seam and multi-coal-seam subsidence parameters. By using the FLAC3D numerical simulation software, Zhang [29] studied the effects of different depths, different mining widths, different coal seam spacing, and different mining thicknesses on the surface subsidence pattern under multi-coal-seam strip mining. Herrera [30] used DInSAR to monitor the mined-out area of a metal mine, and compared the monitoring data with the leveling results, finding that the error was within the allowable range. O. Connor [31] used the time domain reflectometer (TDR) to monitor the movement speed of overlying strata and the stability of coal pillars, and predicted the collapse time of the goaf. Davies [16] used photogrammetry technology to monitor the movement and deformation of rock mass under longwall mining conditions.
In this paper, based on the China Railway Huizhi Square construction project in Zhangqiu District, Jinan City, Shandong Province, we adopt the methods of theoretical research, similar simulation, numerical simulation, and engineering practice verification to study the deformation and failure characteristics of overburden strata in an abandoned mine of the shallow-buried close-distance coal seam group. According to the “activation” deformation characteristics of the broken rock mass in the goaf and the mechanical characteristics of this broken rock mass, we constructed a characteristic equation suitable for the deformation of overburden strata in an abandoned mine. We used similar simulation and UDEC numerical simulation to analyze the deformation characteristics of overlying strata in an abandoned mine of a coal seam group. According to the actual engineering situation, the reliability of the mechanical model is verified to be suitable for determining the overburden structure characteristics of an abandoned mine for a shallow-buried close-distance coal seam group. Here, we study the control focus of a shallow coal seam group goaf, and provide theoretical guidance for the management of project construction for similar multi-seam abandoned mines.

2. Engineering Background

2.1. Overview of the Proposed Construction

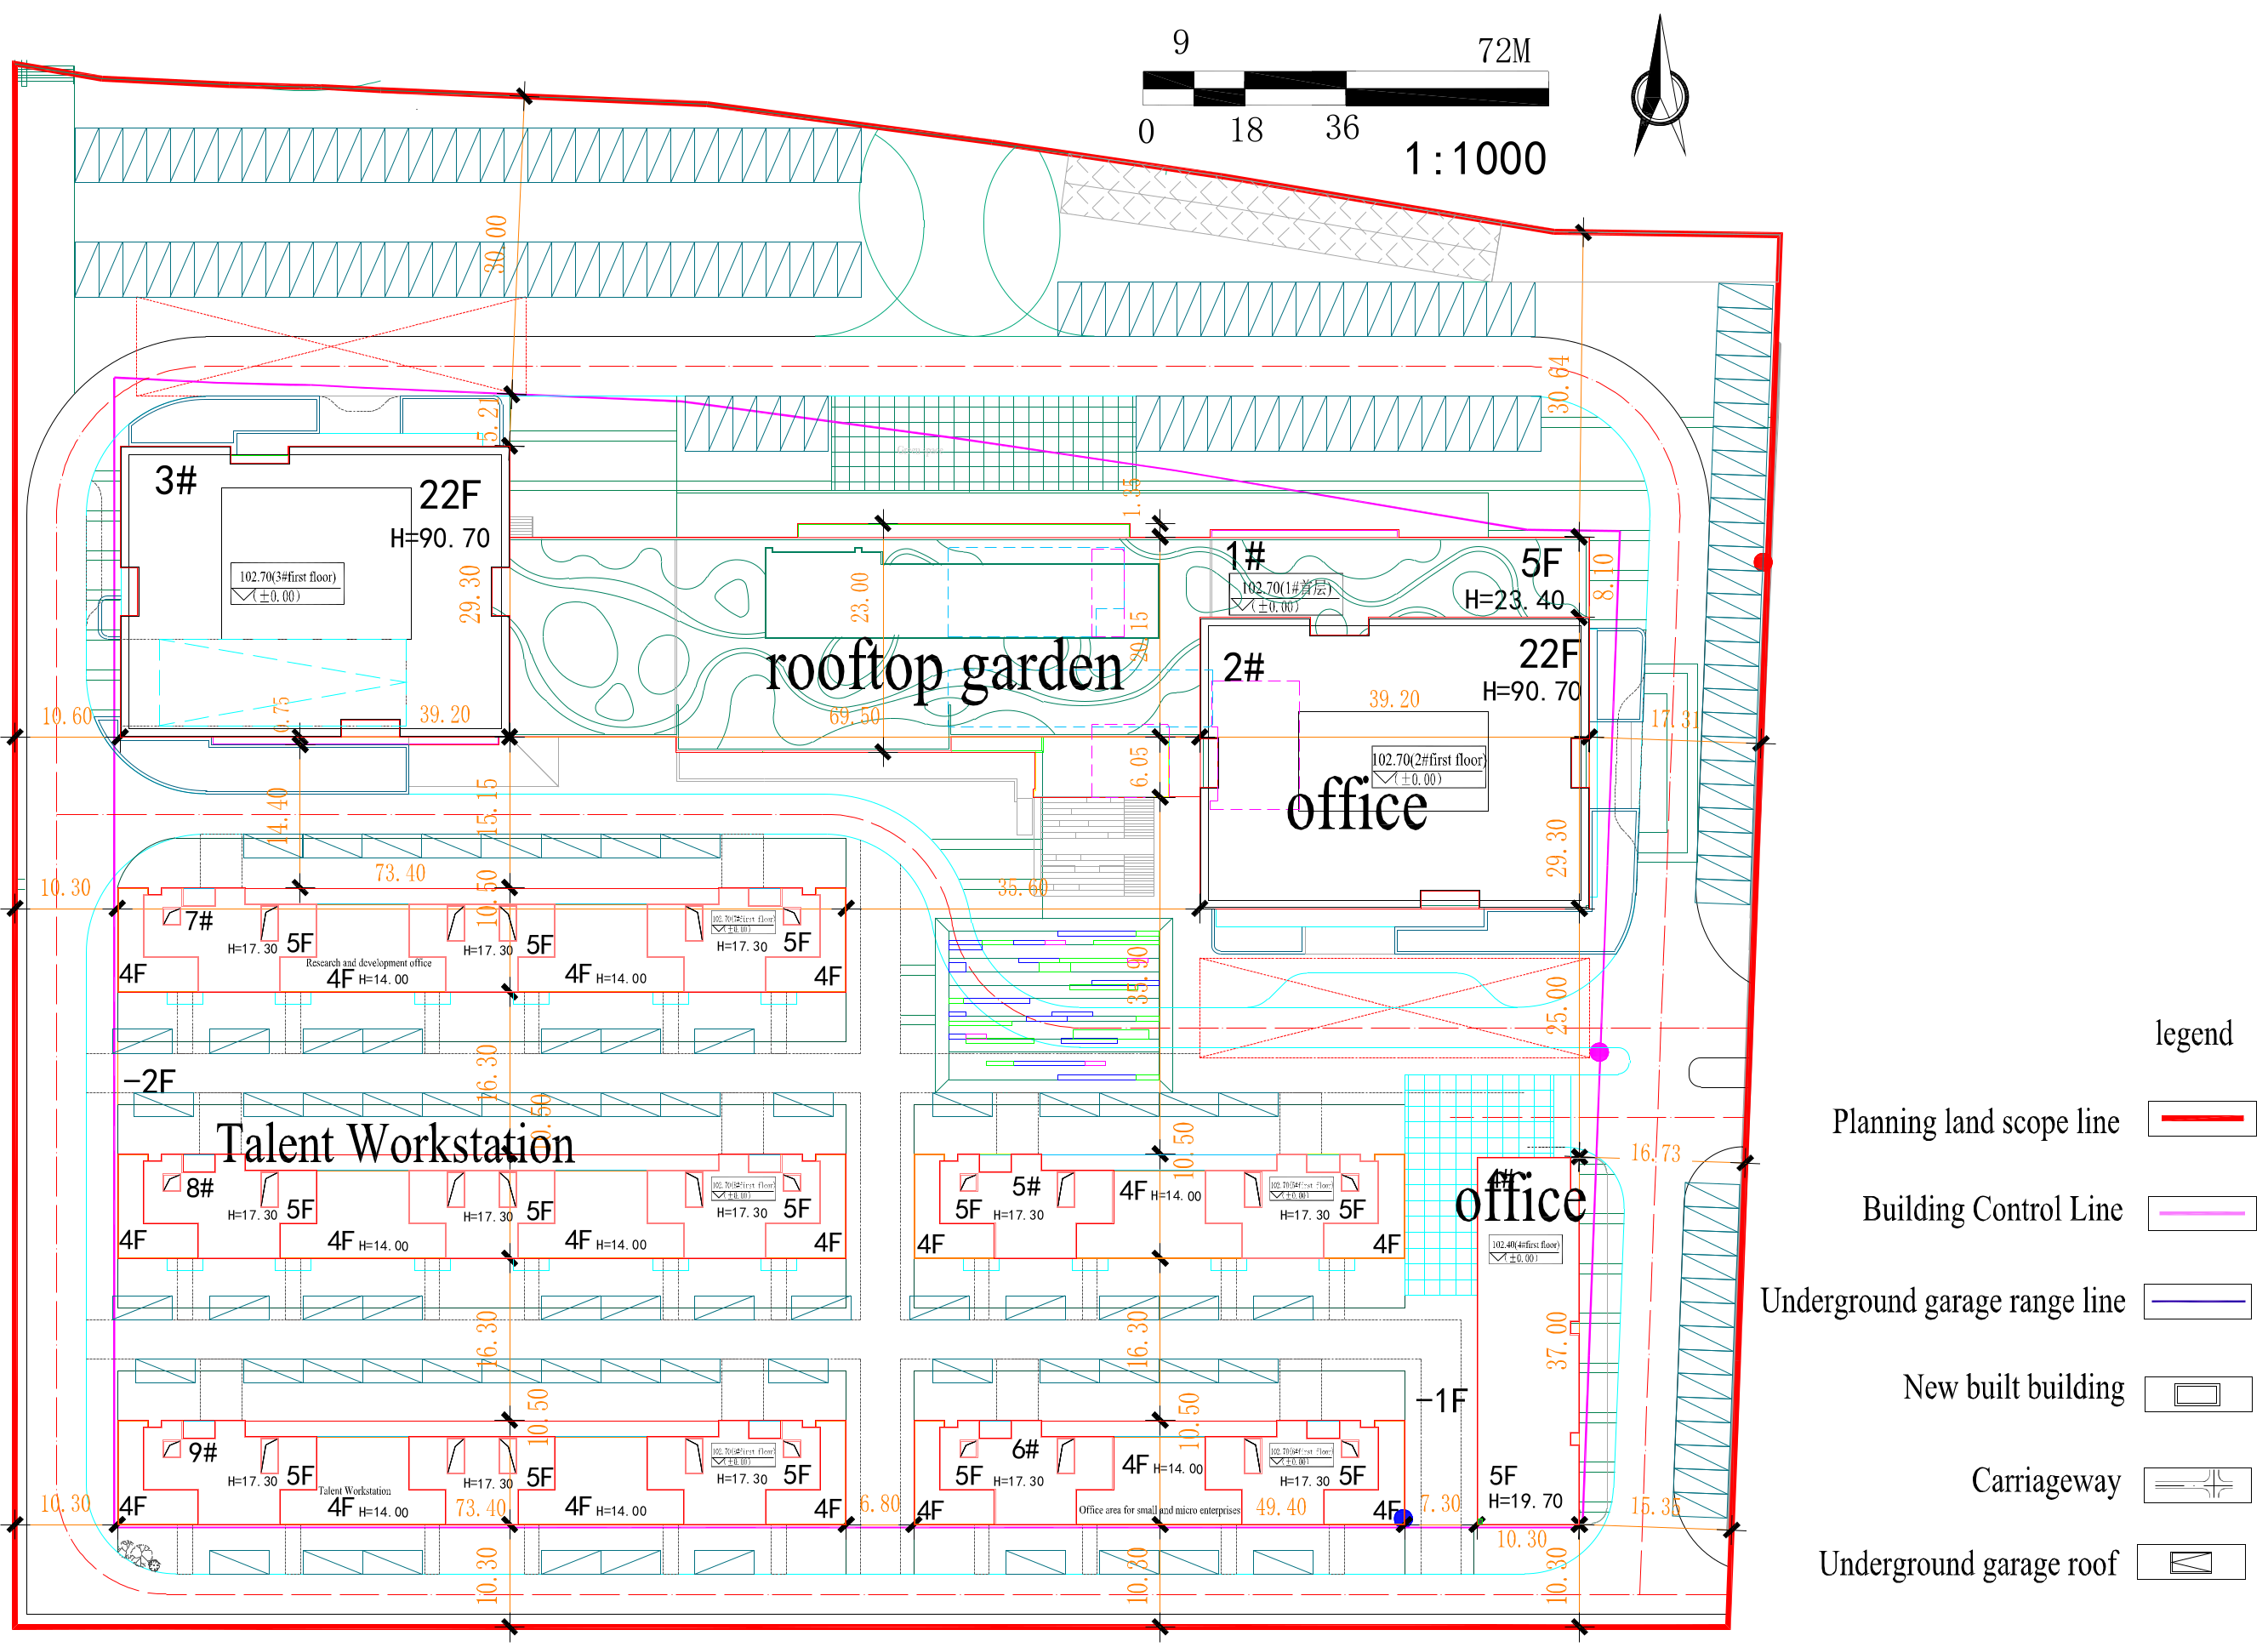
The proposed commercial project in the study area is located in the City of Zhangqiu, with convenient transportation and excellent geographical location (Figure 1). The proposed project includes two 22-storey office buildings, multiple small office buildings of 4–5 floors, and parking lots 1–2 floors underground. The distribution of buildings is shown in Figure 2.

2.2. Geological Conditions of Proposed Site

The main coal seams in the study area are the 3#, 4#, and 9# coal seams. For the 3# coal seam in the study area, the buried depth is 34.8~38.3 m, the average mining thickness is 1 m, and the goaf area is 19,808.33 m2. For the 4# coal seam in the study area, the buried depth is 52.3~61.4 m, the average mining thickness is 1 m, and the goaf area is 18,866.26 m2. For the 9# coal seam in the study area, the buried depth is 97.5~108.9 m, the average mining thickness is 1.5 m, and the goaf area is approximately 24,771.36 m2. In order to facilitate the study of large geological structures in the area, we simplified the structural influence.

3. Study of the Structural Characteristics of Overburden in an Abandoned Mine of the Shallow Coal Seam Group

3.1. Study on Instability Mechanism of Overburden Structure in Abandoned Mine of Coal Seam Group

3.1.1. Analysis of the Load on the Rock Stratum

(1) Load on overburden of upper coal seams [32]
Assuming that the i-th stratum in the overlying strata controls the n-th stratum above it, the i-th stratum deforms synchronously with the n-th stratum above it. According to the principle of composite beam, the load of the first layer of rock is determined, that is:
( q n + i ) i = E i h i 3 γ i h i + γ i + 1 h i + 1 + + γ n + 1 h n + 1 E i h i 3 + E i + 1 h i + 1 3 + + E n + i h n + i 3
In the formula: ( q n + i ) i —Load considering the effect of rock n on the i-th stratum, MPa;
E n + i —The elastic modulus of n + i layer;
h n + i —the r—Rock Height of Layer n + i ;
γ n + i —Rock Bulk Density of Layer n + i ;
(2) Load on interburden strata during mining of lower coal seams
For a shallow-buried close-distance coal seam, after the upper coal seam is mined, the overlying strata are broken, squeezed, and hinged with each other, and are in a temporary stable state. When the lower coal seam is mined, the stable state is difficult to maintain, but it has good performance in terms of pressure transfer. It can be considered that when the lower coal seam is mined, the weight of the overlying strata of the upper coal seam is applied to the interlayer strata [33]. The load on the interburden rock is calculated according to Equation (2). Assuming that the upper coal overburden has n layers of rock and the interlayer rock has m layers, the load on the j-th layer of the interlayer rock is
q j = 1 n γ i h i + j + 1 m γ j h j

3.1.2. Rock Strata Breaking Step Distance

Due to the difference in the hardness of the overlying strata, the failure forms and failure conditions are different. By predicting the breaking step distance, the support measures can be adjusted in time to provide a guarantee for the safe mining of the working face [34]. When the rock stratum is hard, the rock stratum collapse is usually a shear–slip failure, so the breaking step distance can be analyzed using the stress analysis method. When the rock layer is soft, the rock breaking is usually bending–tensile failure, so the ultimate span of tensile failure can be studied using the strain analysis method [35].
(1) First breaking step distance of hard rock strata
When the tensile stress on the rock strata exceeds its allowable maximum tensile stress σ t , the rock strata will break. Therefore, the initial breaking step distance of the rock strata is [35]
L c d = h 2 σ t q  
where L c d is initial breaking step, m;   h is the thickness of the rock strata, m; q is rock load, MPa; and σ t is maximum allowable tensile stress, MPa.
(2) Periodic breaking step distance of hard rock strata
According to the theory of material mechanics, the periodic fracture of the rock beam can be simplified as a cantilever beam, with the maximum tensile stress located at the fixed end. When the stress value reaches the maximum allowable tensile strength of the rock strata, the cantilever beam breaks, and the periodic fracture step distance of the rock strata is calculated as [36]
L z d = h σ t 3 q  
where L z d is periodic breaking step, m.
(3) Limit of tensile failure of soft rock strata
The limit span [37] of soft rock strata when tensile failure occurs can be calculated as follows:
L = h 2 E ε q  
The critical horizontal tensile deformation value of weak rock strata (such as clay layers and mudstone) is 1.0~3.0 mm/m [35]. Beyond this critical value, the weak rock strata will undergo tensile deformation and failure, which may produce water-carrying fissures.

3.1.3. Calculation of Free Space under the Rock Strata

(1) The maximum subsidence value of hard rock strata fracture instability
Before the hard rock stratum is broken, it is simplified as a fixedly supported beam. When the advancing length of the working face reaches the initial breaking step distance of the rock stratum, the fixedly supported beam is transformed into a simply supported beam. When the rock stratum is broken periodically, the extrusion pressure between rock blocks is not taken into account, so the maximum subsidence value is calculated according to the cantilever beam mechanical model, and the maximum subsidence value when the hard rock stratum is broken is [35]
Initial breaking: w c d = 5 qL cd 4 32 Eh Period breaking: w zd =   3 qL zd 4 2 Eh 3
(2) The maximum subsidence value of soft rock strata tensile failure
After the limit span of the tensile fracture of soft rock stratum is determined by calculation, the maximum subsidence value of the first fracture can be determined [38] as follows:
w = E h ε 2 8 q  
(3) The effective subsidence space height under the rock strata [38]
When the i-th layer is broken, the effective space height Δ i below it is expressed as
Δ i = m 1 i 1 h i k c i 1  
where m is the mining height, m;   h i is the the thickness of layer i above the coal seam, m; and k c i is the residual bulking coefficient of layer i above the coal seam.

3.1.4. Development Mechanism Analysis of Overburden Rock Failure and the Instability of the Coal Seam Group

When analyzing the fracture and instability of rock strata, the analysis is carried out downward layer-by-layer according to the coal seam mining sequence, and the highest height of the rock strata that produces the fracture is the height of fracture development during the process of coal seam mining.
According to the actual formation parameters of the study area, the mechanical parameters of each rock layer are summarized (Table 1).
The coal seam is mined by the process of descending mining, with the mining sequence of the 3# coal seam, 4# coal seam, and 9# coal seam. Due to the different bulk density, lithology, and load of the overlying strata, the span and development height of the overlying strata are also different. In the following, we will analyze the degree of overburden damage for each layer during the coal seam mining process. Substituting the parameters given in Table 1 into the formula, the overburden collapse deformation values after the mining of the 3# coal seam, 4# coal seam, and 9# coal seam are obtained.
Through calculation, it is found that, when the 3# coal seam is mined, the fracture zone of the 3# coal seam overburden strata develops to coarse sandstone strata, and the development height of the water-carrying fractured zone is 17 m. When the 4# coal seam is mined, the overburden water-carrying fractured zone proceeds to the 3# coal seam goaf, so the height of the water-carrying fractured zone development is the spacing between the 3# coal seam and 4# coal seam, which is 19.5 m. In the mining process of the 9# coal seam, the development height of the water-carrying fractured zone is 27.1 m, and its development position is between the 4# coal seam goaf and 9# coal seam goaf, which does not affect the 3# coal seam goaf and 4# coal seam goaf. According to the above calculation results, the first weighting step distance, the periodic weighting step distance, and the maximum subsidence value of the overlying strata in the mining process are drawn to obtain Figure 3.
In the overburden strata of the 3# coal seam, 4# coal seam, and 9# coal seam, there is no elastic foundation beam formed with both ends in the coal rock column and overhanging in the middle. Additionally, the water-carrying fracture zones of the 4# coal seam affect the 3# coal seam. The 3# coal seam goaf and 4# coal seam goaf fissure zone are connected, and the broken rock seams of the two goafs are hinged to each other to form a whole fracture arch. The water-carrying fracture zone of the 9# coal seam goaf does not affect the 4# coal seam goaf, which is a separate fracture arch. Therefore, the development model of the stress arch and fracture arch in the study area is shown in Figure 3.

3.1.5. Study of the Characteristics of Overburden Rock in an Abandoned Mine

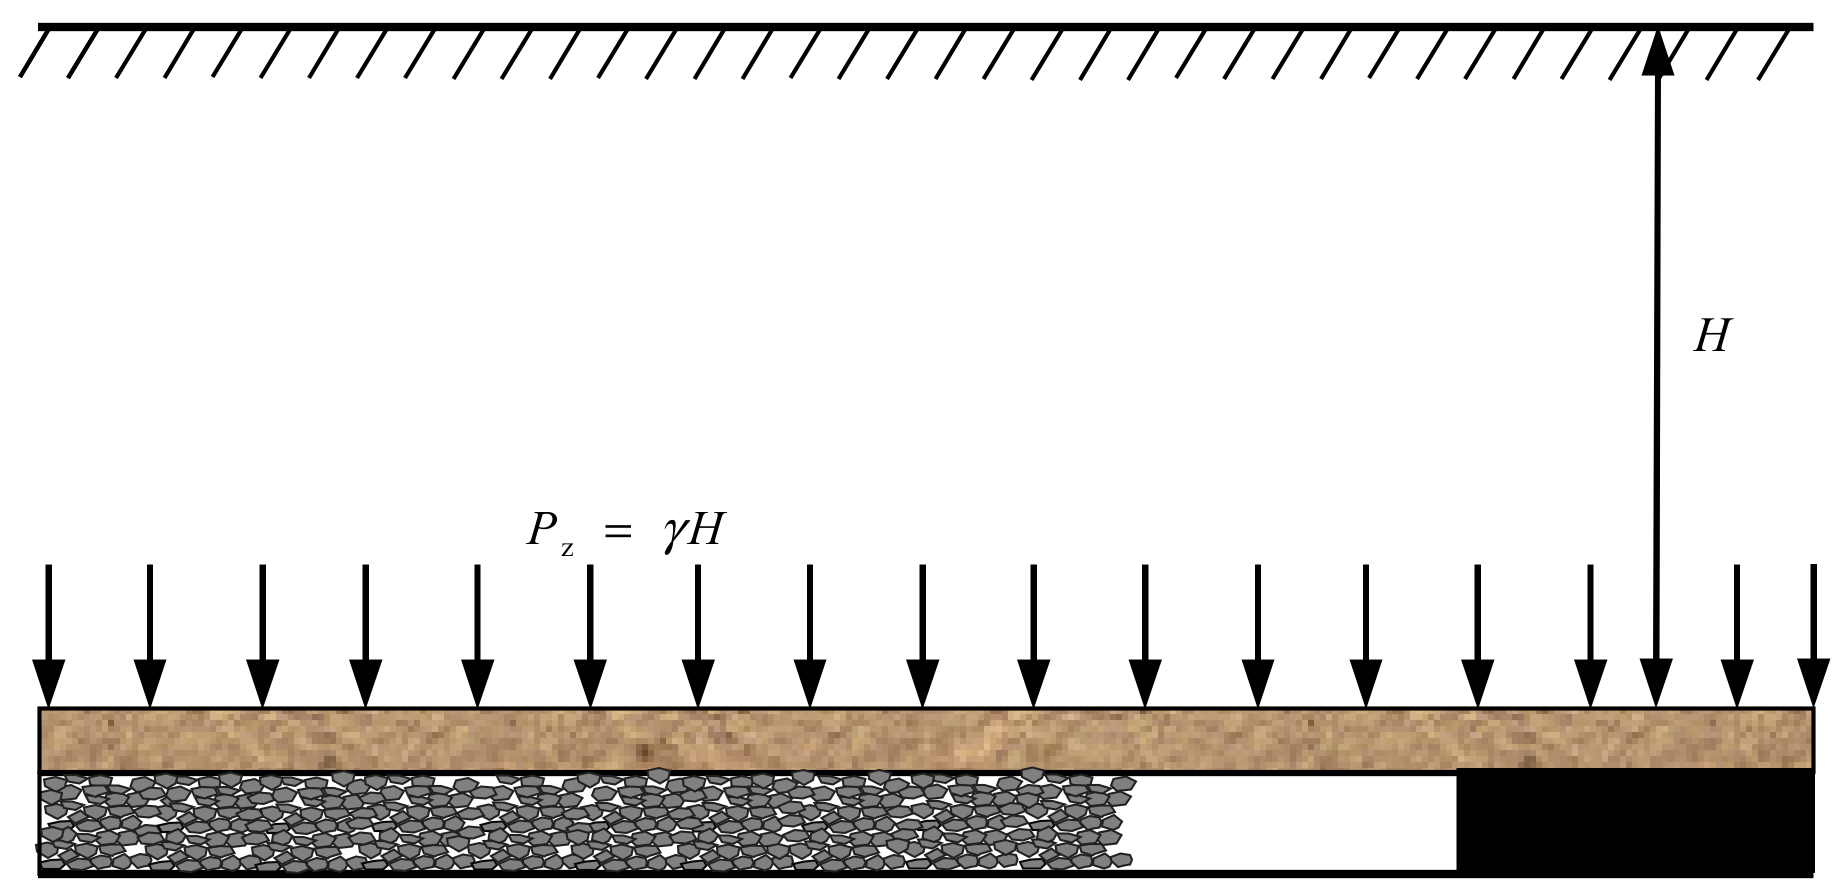
According to the actual situation of the rock strata, the studied problem is simplified, as shown in Figure 4, and the following assumptions are made:
(1) Both the coal seams and rock strata are horizontal (dip Angle = 0°);
(2) The mining working face is a long straight working face, and the influence of coal pillars is not considered;
(3) There is no major geological structure failure in the overlying strata;
(4) The broken rock in the goaf is a viscoelastic rock mass conforming to the Kelvin-body rheological model;
(5) The initial stress of the rock mass at depth is
P z = γ H  
where γ is the average unit weight of rock mass, kN/m3, and H is the buried depth of rock, m.
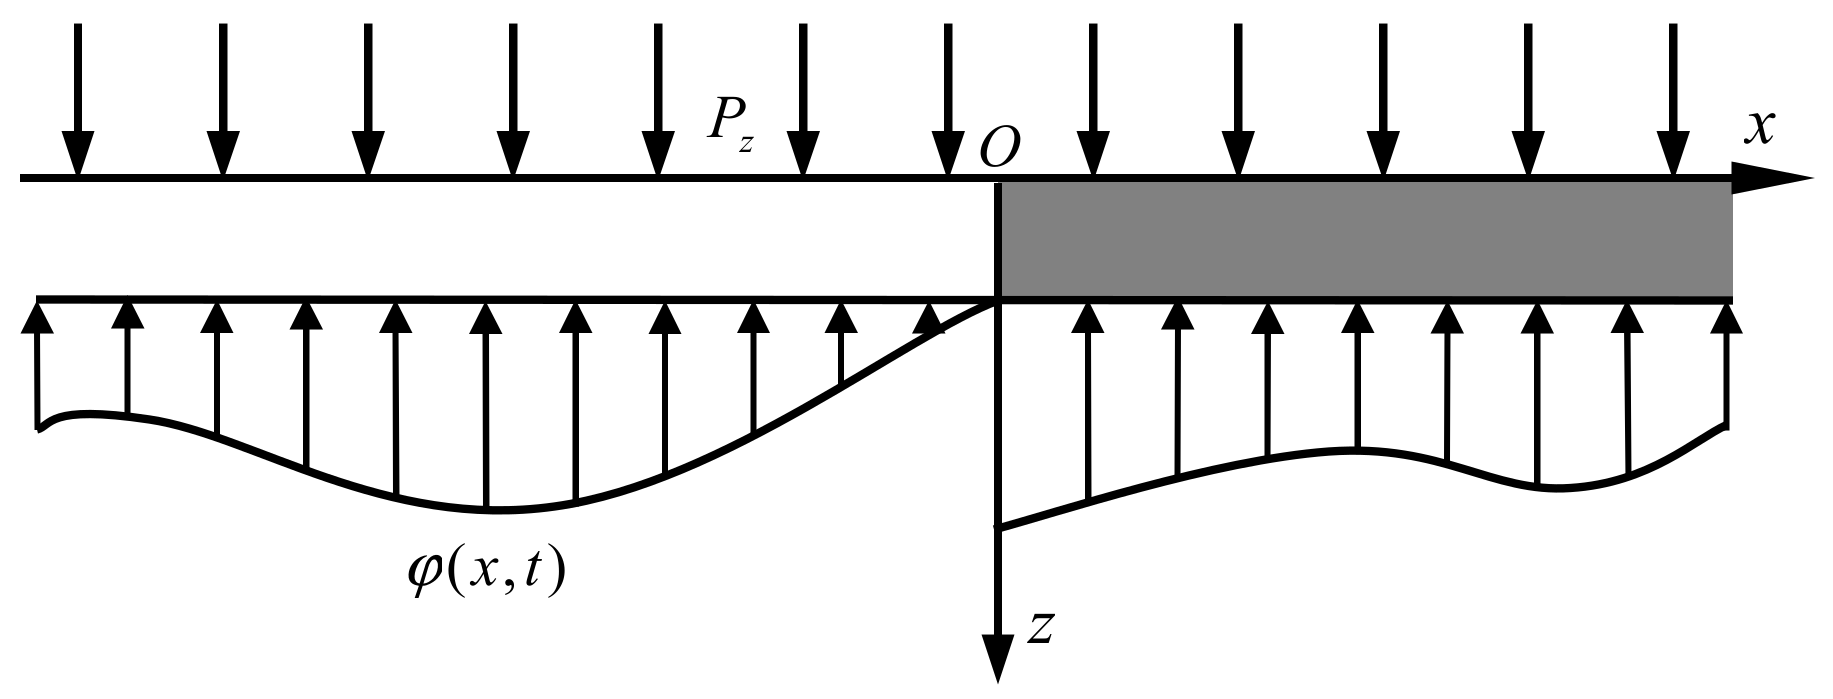
Take the rectangular coordinate system xOz, as shown in Figure 5. In the x < 0 part, the foundation of the beam is the broken gangue of the goaf. In the x > 0 part, the foundation of the beam is the unmined coal.
According to references [33,39]:
(1) The base reaction force of crushed gangue in the quarry area
φ x , t = E k m w x , t w 0 , t + η k m t W x , t W 0 , t  
where E k is the instantaneous elastic modulus of crushed gangue;   η k is the viscosity coefficient of crushed gangue; and W(0, t) is the roof deflection (subsidence) at the mining boundary.
(2) Stress analysis of roof rock beam
It is assumed that there is no gap between the beam and the broken gangue, that is, the deflection (vertical displacement) of the beam at any point at any moment is equal to the subsidence of the foundation at that point [40];
W b x , t = W k x , t = W x , t
where W(x,t) is the sinking of the beam at the moment of x point t, and Wk(x,t) is the sinking of the foundation at the moment of x point t.
According to reference [33], the partial differential expression for the deflection curve equation of the roof beam above the broken rock in the goaf is:
W x , t = exp k t exp β x B 1 t sin β x + B 2 t sin β x m P z E R + w 0 , t + m P z E k
According to reference [41], the subsidence expression of the bedrock in the goaf section is obtained as follows:
W x , t = m η 1 exp k t 1 1 2 exp π L x cos π L x
The deformation of the bearing layer above the fracture arch and below the bending zone in the abandoned mine is
Δ W = W T W x , t
where W(T) is the free space subsidence value of coal seam overburden obtained in Section 3.1.4.

3.1.6. Analysis of Residual Deformation of Overburden Rock in an Abandoned Mine

In the process of studying the residual deformation of the goaf, we only consider the bearing deformation of the broken rock and do not consider the influence of coal pillar deformation. The coal mine in the study area was closed in 2013, and the selected time is 10a.
Based on previous studies, the bearing layer above the fracture arch and below the bending zone in the study area is selected as the research object. The actual geological parameters are substituted into Formula (15), and the maximum deformation value is selected to represent the deformation of the confined layer above the fracture arch and below the bending zone in the old goaf. The corresponding changes in the confined layer of the 3# coal seam, 4# coal seam, and 9# coal seam are calculated (Table 2).
The study area is mainly constructed by grouting into the caving zone and fracture zone of the abandoned mine. The calculated residual deformation subsidence can meet the grouting demand of the abandoned mine, and provide theoretical guidance for the grouting range of the shallow-buried close-distance abandoned mine.

3.2. Similar Simulation Experiment on the Evolution Law of the Overlying Strata Structure in an Abandoned Mine of the Coal Seam Group

3.2.1. Overburden Rock Failure Characteristics of Each Coal Seam after Coal Mining

When the working face advances to 66 m, the overlying layer separation space continues to develop upward and penetrates to the surface, which results in the obvious subsidence of the surface (Figure 6). In many areas of the overlying strata, short separation zones are produced due to fractures, which develop laterally with the advance of the working face. As the working face continues to advance, the short separation zone develops laterally, the overlying strata continue to collapse under the action of load, and the surface subsidence area continues to develop. The final height of the water-carrying fracture zone is 20.10 m (Figure 7).
When the coal seam is mined to 75 m (Figure 8), the overburden separation fissures in the upper part of the 4# coal seam are all compacted, and the separation space is further closed. The ground surface is affected by the mining of the 4# coal seam, and the subsidence value reaches its maximum. The development height of the water-carrying fractured zone after the mining of the 4# coal seam is 20 m. With the further mining of the working face, the overlying strata are constantly destabilized and deformed under the influence of mining, and the surface is also constantly sunk and deformed (Figure 9).
When the 9# coal seam is excavated to 72.3 m (Figure 10), the overburden rock of the 9# coal seam develops alongside the coal seam mining, and the overburden caving deformation affects the 4# coal seam goaf. The 4# coal seam goaf and the adjacent overburden are affected by the mining of the 9# coal seam, resulting in bending deformation. With the mining of the 9# coal seam, the subsidence deformation values of the 4# coal seam goaf and 3# coal seam goaf gradually increase, in addition to the range of influence (Figure 11).

3.2.2. Study on the Distribution Law of Residual Cracks in an Abandoned Mine

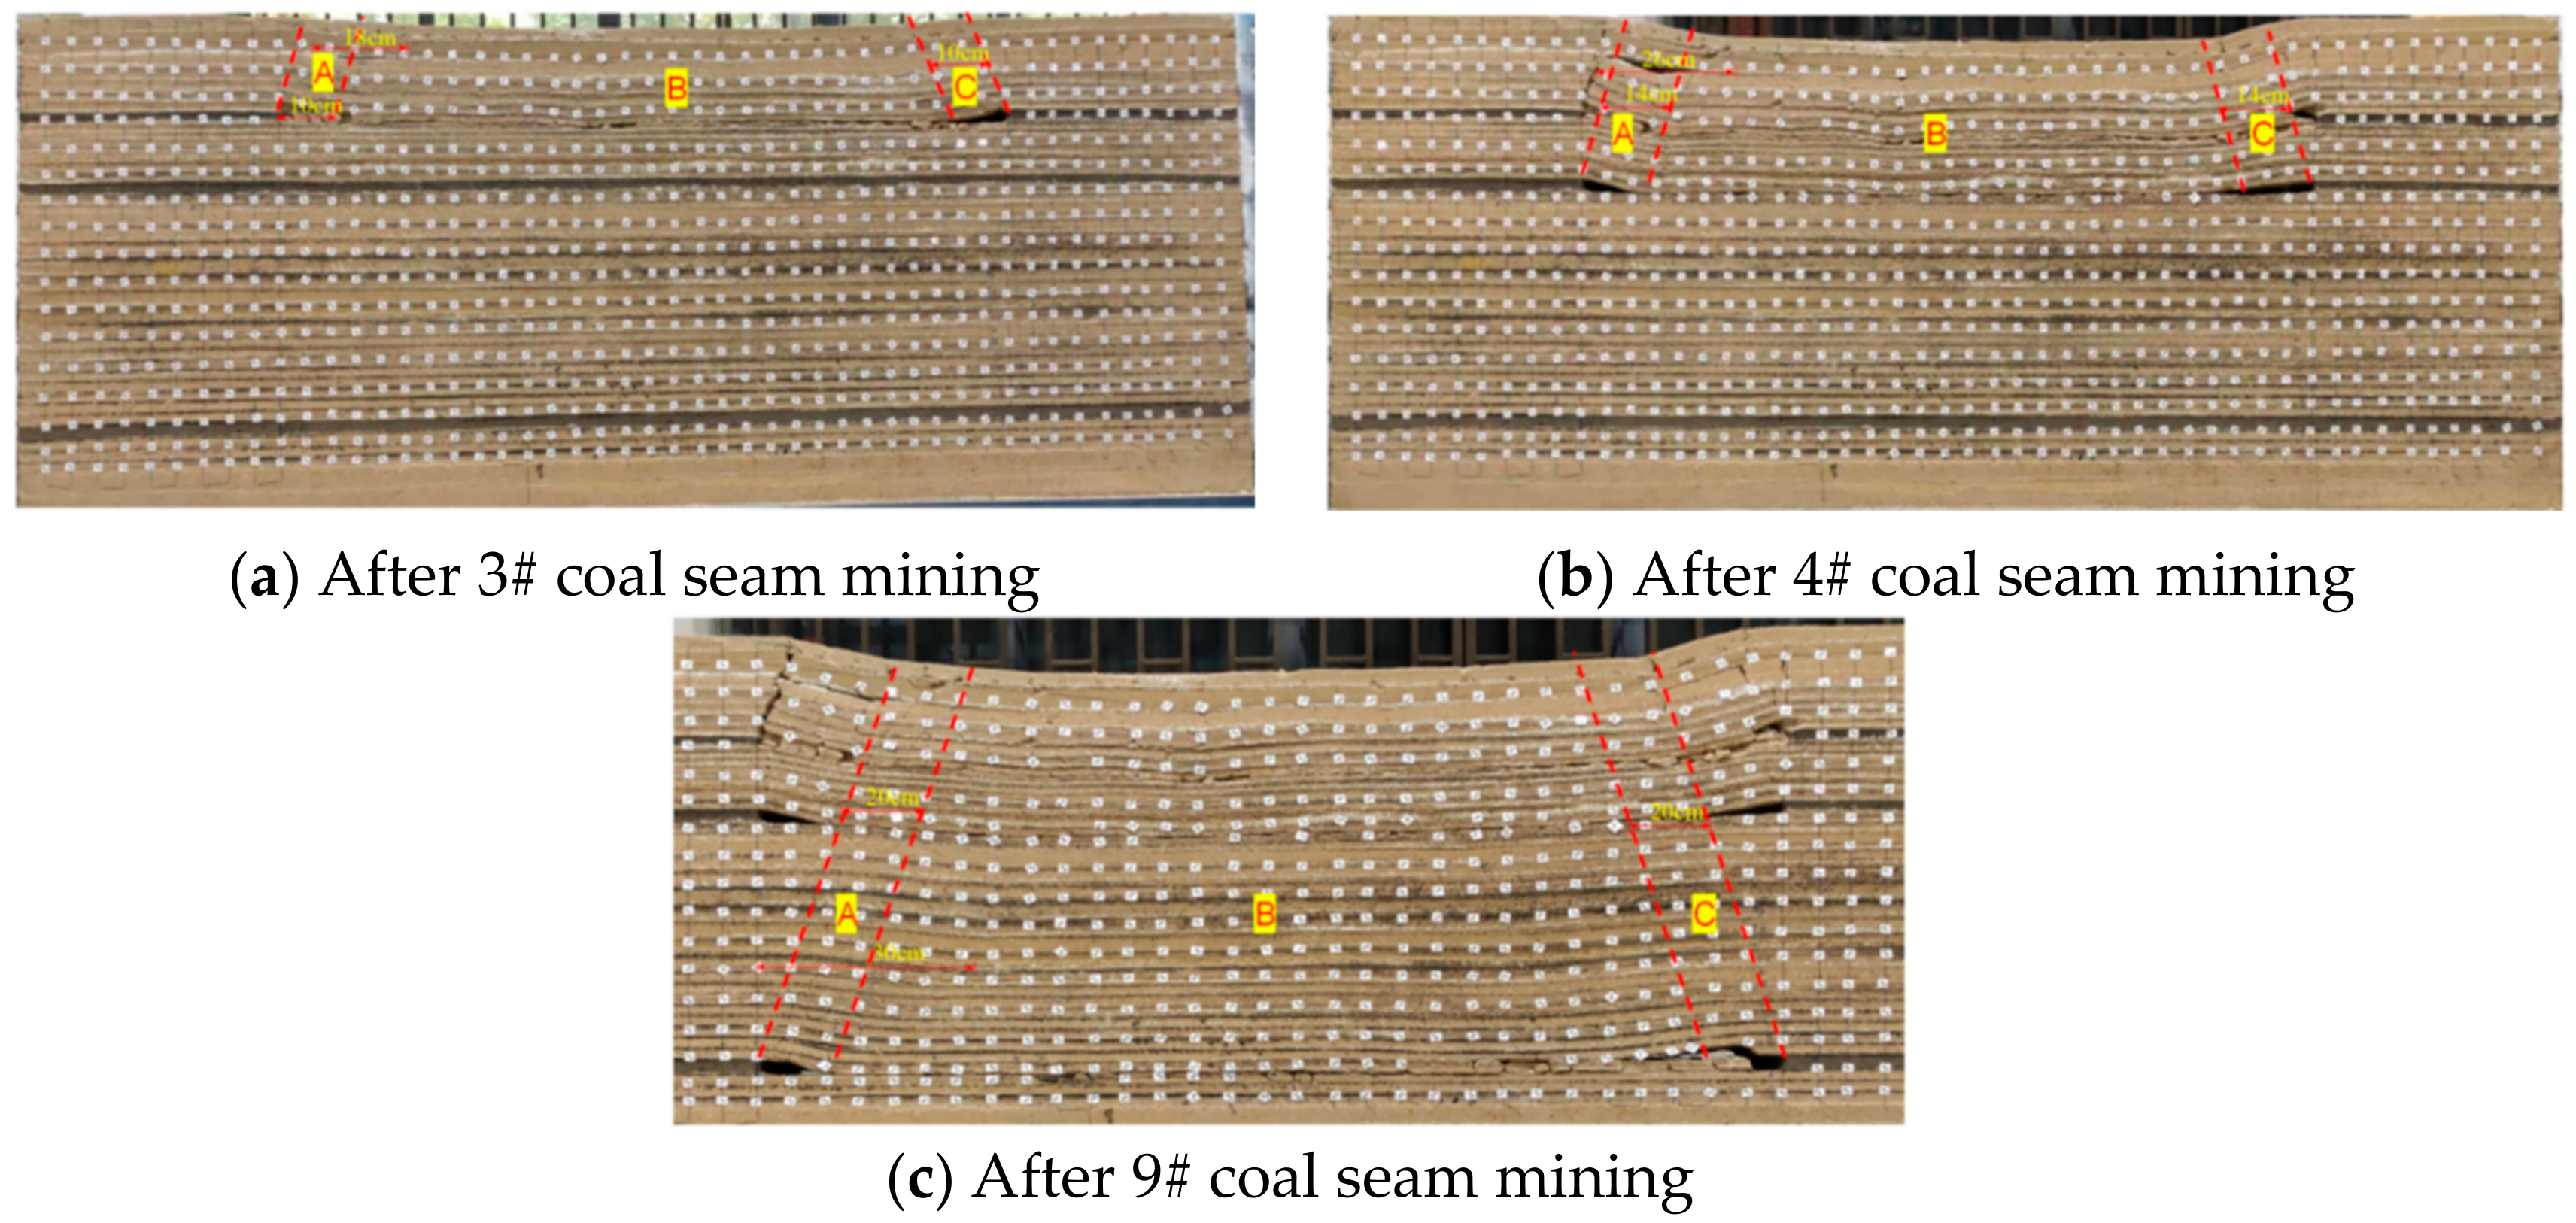
The experimental results show that, with the mining of the working face, the overburden strata collapse layer by layer, and the cracks gradually develop upward. After the mining of each layer of the working face, the residual cracks in the goaf have obvious zoning. From both sides of the goaf to the middle, this area can be divided into the residual crack development area, crack compaction area, and surface tension crack area. After the model was left to stand for three months, the distribution of fracture development was obtained, as shown in Figure 12.
(1) Residual crack development zone
Areas A and C are shown in Figure 12. The area is located below the stop-mining line and the fracture angle of the open-cut hole near the side of the goaf. With the mining of the coal seam, a cantilever structure is formed in the roof of this area, and this support structure causes a large number of holes that are not filled by rock blocks to exist at the edge of the goaf. From Figure 12a, it can be seen that after the end of the mining of the 3# coal seam, the fracture angle of the rock strata on the side of the open-cut seam is 53°, and that on the side of the stop-mining line is 50°. After the repeated mining of the 4# and 9# coal seams, under the same mining length of the working face, the rock fracture angle on both sides does not change much. However, by the influence of repeated mining on both sides, the volume and width of the residual fractures increases, and the length of the developed residual fractures is between 10 and 20 cm. This area is unstable. In the process of the mining of the lower coal seam, cracks may be further generated and holes may once again develop, which is the focus of grouting reinforcement.
(2) Fracture compaction zone
Area B is shown in Figure 12. The area is in the center of the mined-out area, in the center of the residual fracture development area on both sides, and is almost fully filled with rock blocks after coal mining. After the mining of the 3# coal seam is stabilized, the fissures caused by the mining of the lower caving zone are closed in a stable manner, and the laminated fissures appear in the upper strata. After the mining of the 4# coal seam is finished, the crushing of rock blocks in the goaf caving zone and the fracture zone of the 3# coal seam goaf is intensified. After the mining of the 9# coal seam, affected by multi-layer mining, the rock blocks in the caving zone and fracture zone of the 3# goaf all fall and break, and the mining action affects the surface. The larger fracture holes in this area are mainly produced between the fracture zone and the bending zone, manifesting as holes and fracture re-compaction.
(3) Tension crack zone
This area is above the fracture angle near the surface on the side of the caved rock block. Above the fracture angle on both sides, horizontal tension is generated by leaning to the surface on the side of the uncollapsed rock mass, forming tensile cracks. After the mining of the 3# coal seam, a 14 cm tensile crack is formed. After the mining of the 4# coal seam, a 26 cm tensile crack is formed. After the mining of the 9# coal seam, a 30 cm tension fracture is formed. Tensile fracture is the key area addressed by the grouting filling of goafs.

3.3. Numerical Simulation Experiment on the Evolution Law of Overburden Structure in an Abandoned Mine of the Coal Seam Group

3.3.1. Numerical Simulation Establishment

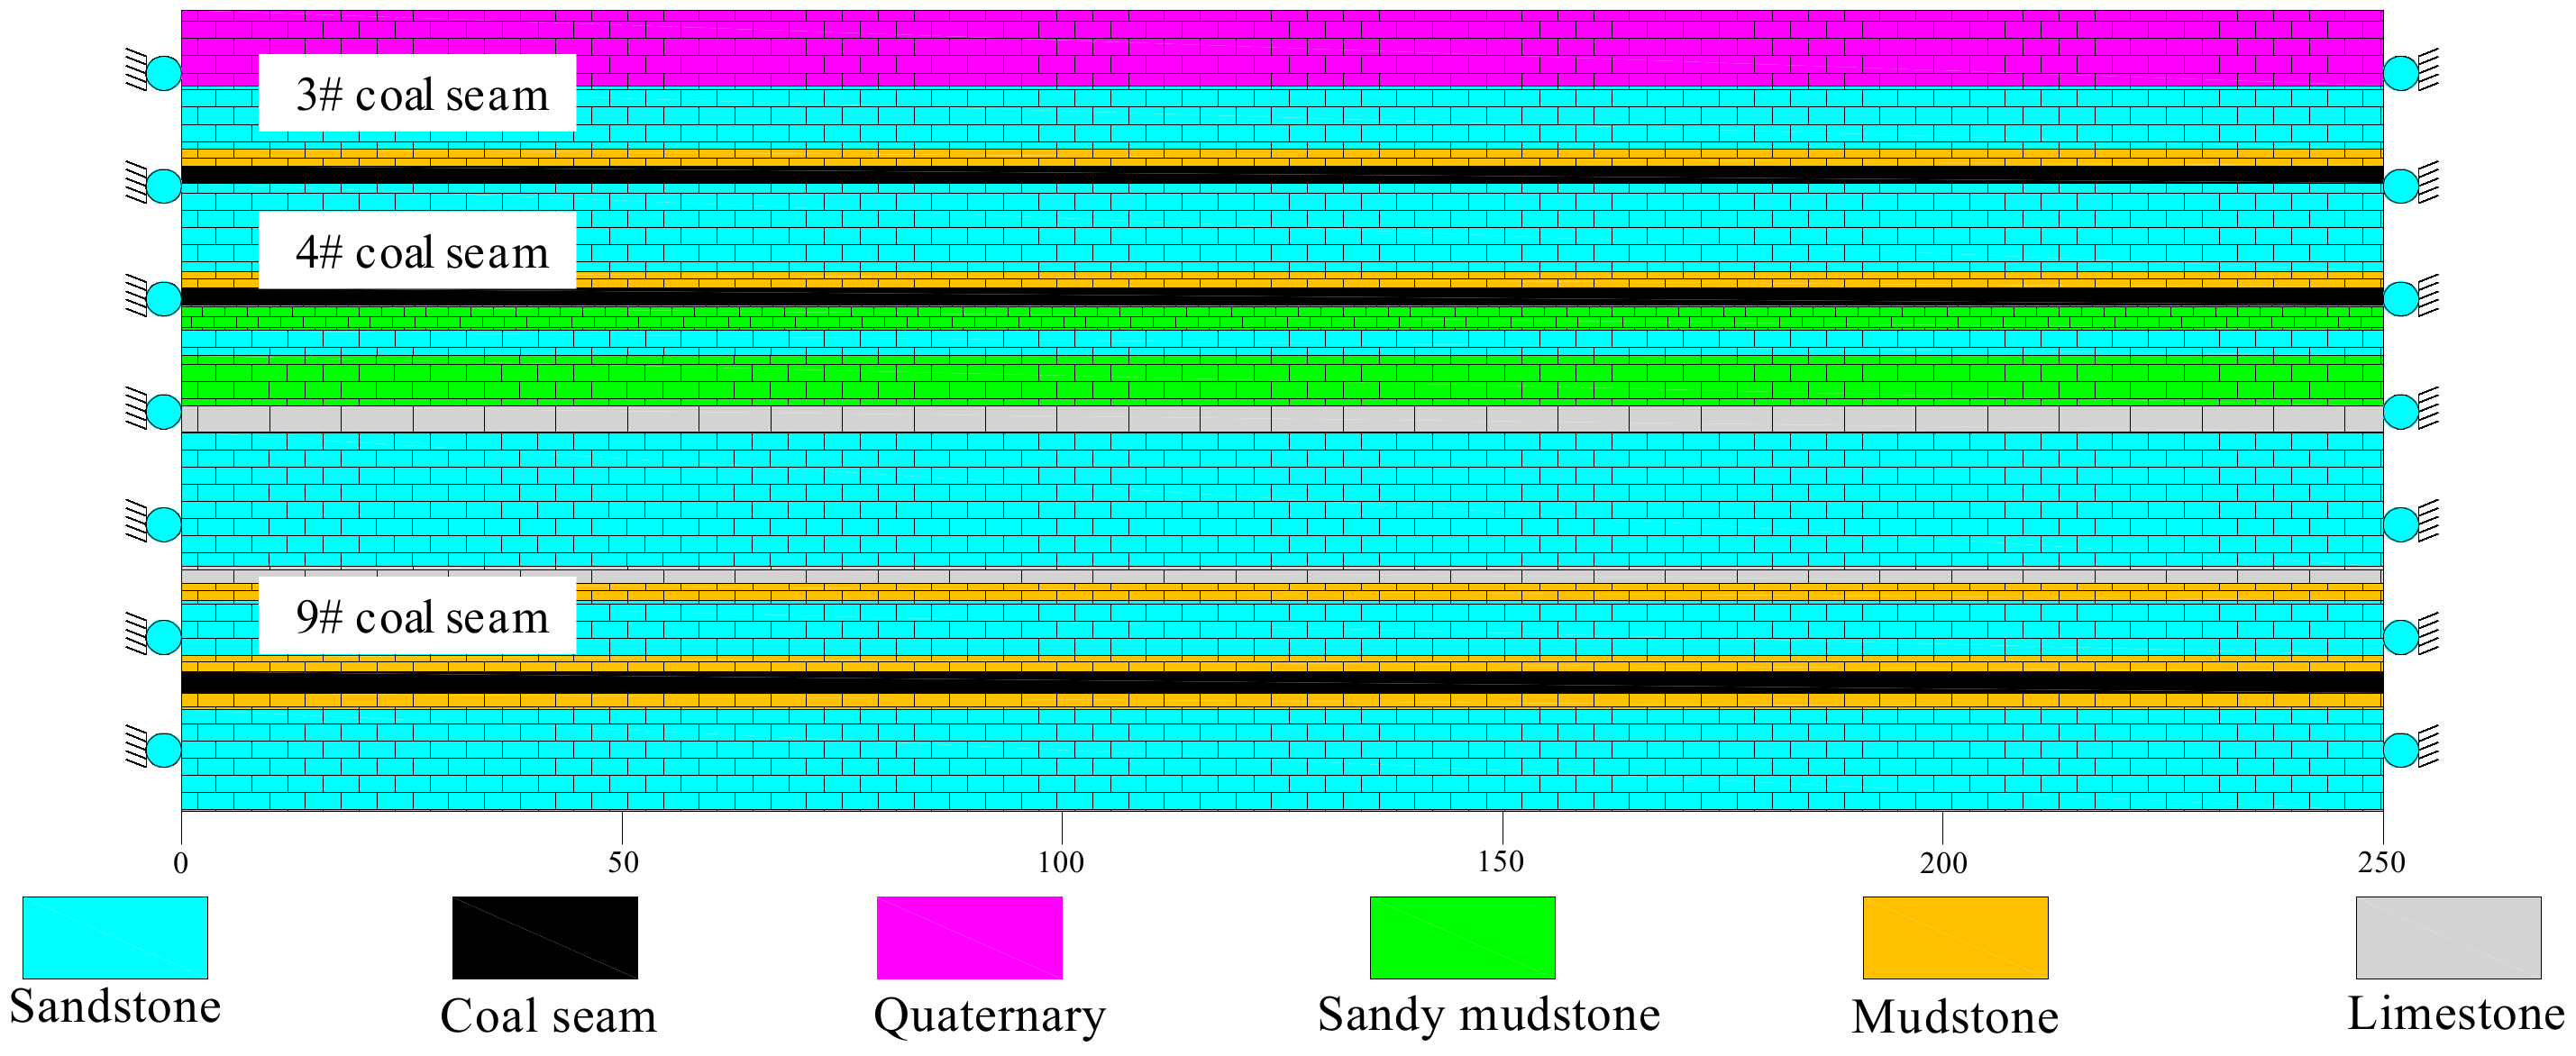
In order to study the evolution law of overburden structure and the void field law in the goaf of the shallow-buried coal seam group, the numerical simulation model is constructed by UDEC numerical simulation software with the formation conditions of the study area as parameters. The model is shown in Figure 13.
According to the research results obtained by Zhang Junying [42], the crushing gangue compaction experiments were carried out with large broken coal gangue, graded uniform coal gangue, and water-wetted graded uniform coal gangue (labeled series 1, series 2, and series 3, respectively). The characteristic curves (Figure 5) and secant modulus (the ratio of compressive stress to corresponding compressive strain, which is usually used to represent the elastic modulus of rock) of the broken rock under different conditions were obtained using the numerical simulation calculation model, as shown in Figure 13.
Based on the experimental data, the linear equations of modulus and stress are fitted (Figure 14). In this study, large pieces of broken coal gangue were taken as mudstone strata in the model. According to the equation, the initial elastic modulus is 4.65 MPa, and the bulk modulus and shear modulus are 3.23 GPa and 1.85 GPa, respectively. According to the flow chart (Figure 15), considering the change in the mechanical parameters of broken gangue in the abandoned mine after ten years of mining, the mechanical parameters are substituted into the post-mining model to obtain the change in the overlying strata in the abandoned mine.

3.3.2. Numerical Simulation Results

The actual stratigraphic conditions in the study area are used as parameters to analyze the deformation and failure characteristics of the overlying strata, the evolution law of the stress field, and the variation characteristics of the abandoned mine during the process of the downward mining of coal seams in the study area.
Figure 16 shows the stress distribution of overburden after the mining of the 3# coal seam. Although the 3# coal seam is close to the surface, the surface subsidence deformation is not obvious. After the mining of the 3# coal seam, the overlying strata collapse and the surface moves and deforms. The maximum subsidence area of the surface is close to the side of the open-cut, and the maximum subsidence value is approximately 0.95 m. Because the overlying strata are broken from simply supported beams to cantilever beams in the process of working face mining, they develop upward in a cyclic way. As a result, the subsidence deformation of the surface subsidence area near the open-cut side is larger than that of the stop-mining line. Figure 17 shows the overburden displacement field after the mining of the 3# coal seam. After the mining of the 3# coal seam is completed, the stress concentration zone of the model is mainly gathered on the side of the open-cut and stop-mining line, which expands and develops upward in a semi-arch shape, and the abutment pressure of the floor is distributed in the shape of an ellipse. The type of mining in the working face is full mining, there is no articulated abutment stress between the overburden strata, the vertical stress of the overburden is relatively uniform, and there is no observed stress concentration area in the middle.
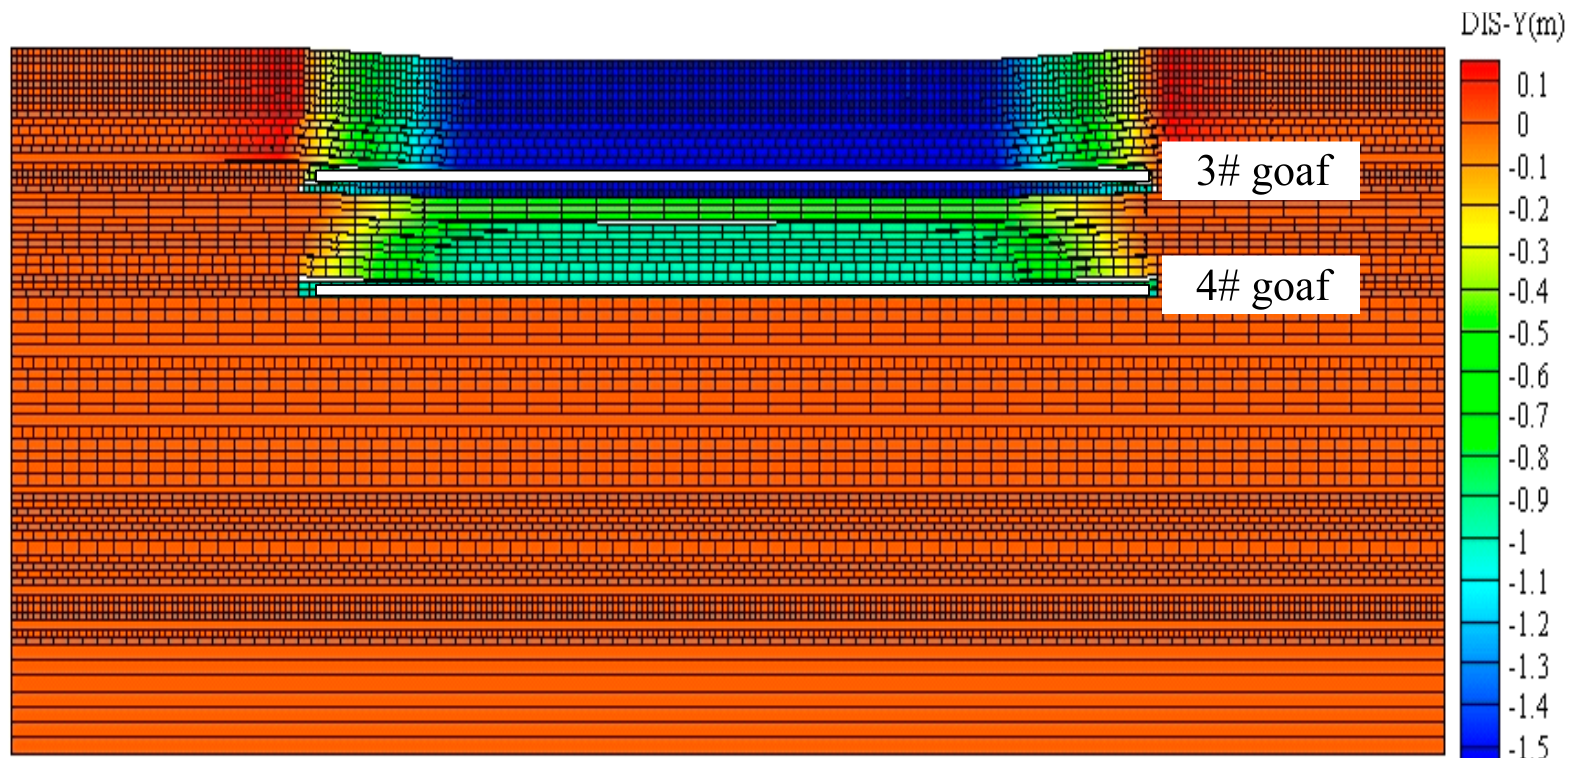
Figure 18 shows the stress distribution map of the overlying strata after the mining of the 4# coal seam. With the mining of the 4# coal seam, the overlying strata and 3# goaf are affected, and the surface is moved and deformed. Moreover, the overburden rock near the open-off cut side is sunken and deformed more, which also leads to a larger subsidence deformation value and a higher surface tilt deformation value. Figure 19 shows the displacement field diagram of the overlying strata after the mining of the 4# coal seam. With the mining of the 4# coal seam, the stress concentration area on both sides of the open-off cut and stop line of the 3# coal seam goaf expands downward, forming a large stress concentration range. Influenced by repeated mining, more stress concentration areas are formed in the process of caving deformation, and the stress concentration area on the side of the open-off cut is larger.
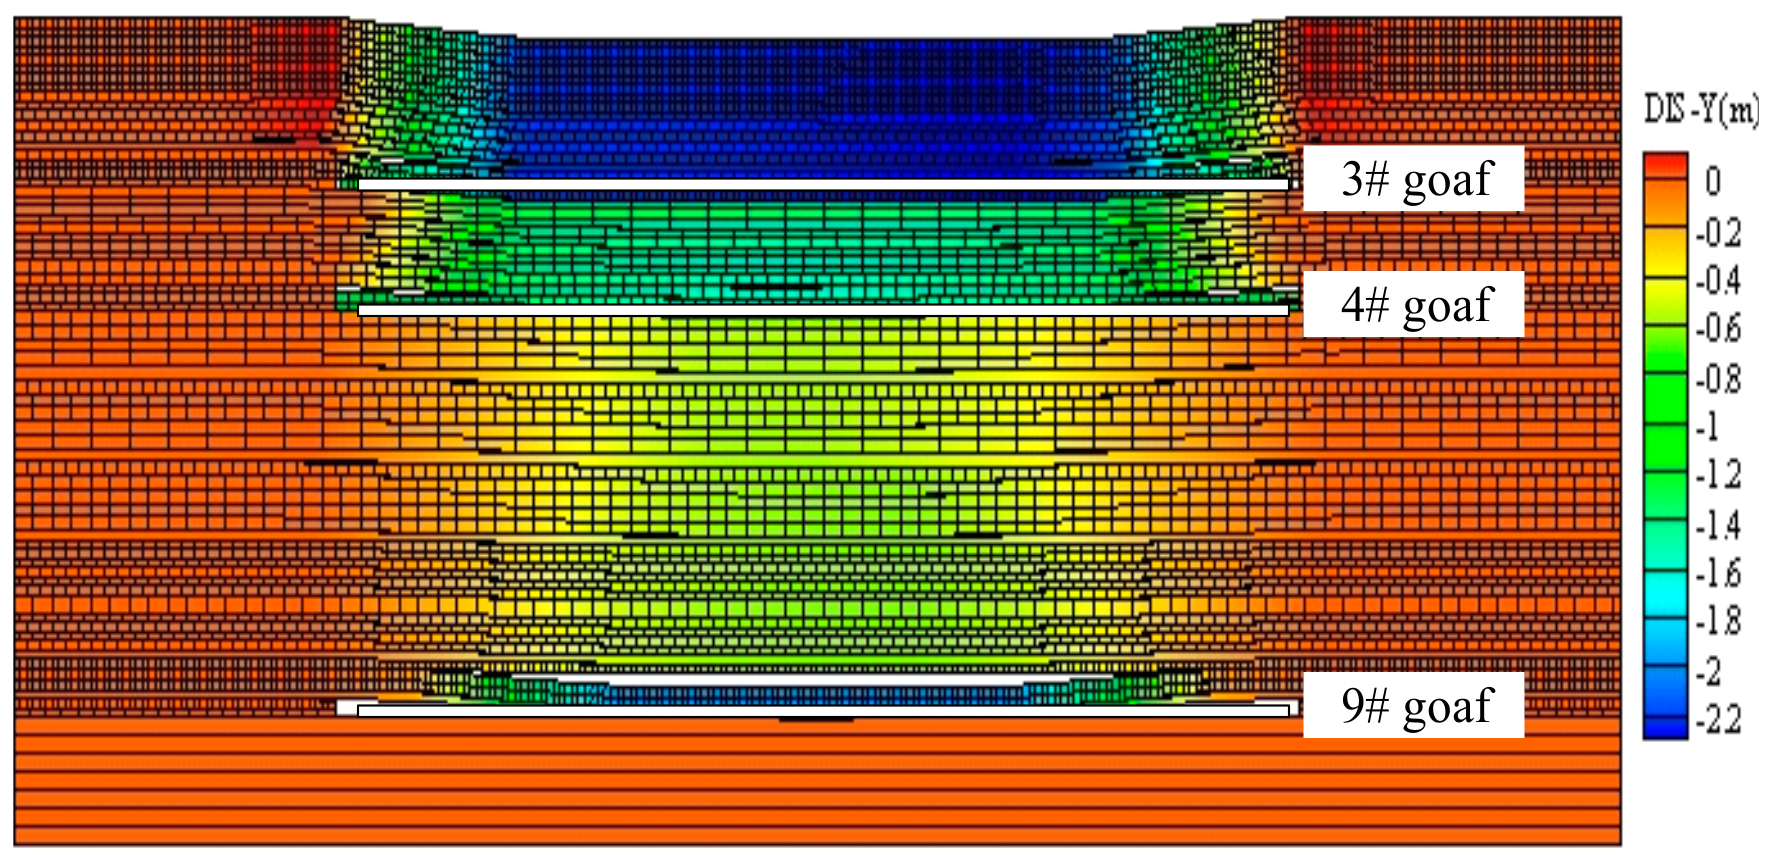
Figure 20 gives the stress distribution map of the overlying strata after the mining of the 9# coal seam. With the mining of the 9# coal seam, the overlying strata gradually collapse and affect the surface. In the process of the gradual collapse and instability of overburden rock from bottom to top, due to the great distance from the goaf of the 4# coal seam, the collapse deformation of the overburden rock presents an obvious partition, forming an obvious fracture area under the limestone and an obvious bending subsidence zone above. In the 9# coal seam working face, the movement deformation value is larger for the open-off cut above the side of the overburden, and that of the stop line above the side of the overburden is smaller. Because the 9# coal seam is far from 4# coal seam, the range of influence of the 4# coal seam goaf and 3# coal seam goaf is small. Figure 21 shows the displacement field diagram of the overlying strata after the mining of the 9# coal seam. With the mining of the 9# coal seam, the stress concentration areas of the 3# coal seam goaf and 4# coal seam goaf are transferred to the lower overlying strata. The stress concentration area on the side of the open-off cut and the side of the stop line in the goaf of the 9# coal seam is large, and the stress concentration in the boundary rock of the fractured zone and bending zone is obvious. The vertical stress value of the overlying rock near the open-off cut is greater.
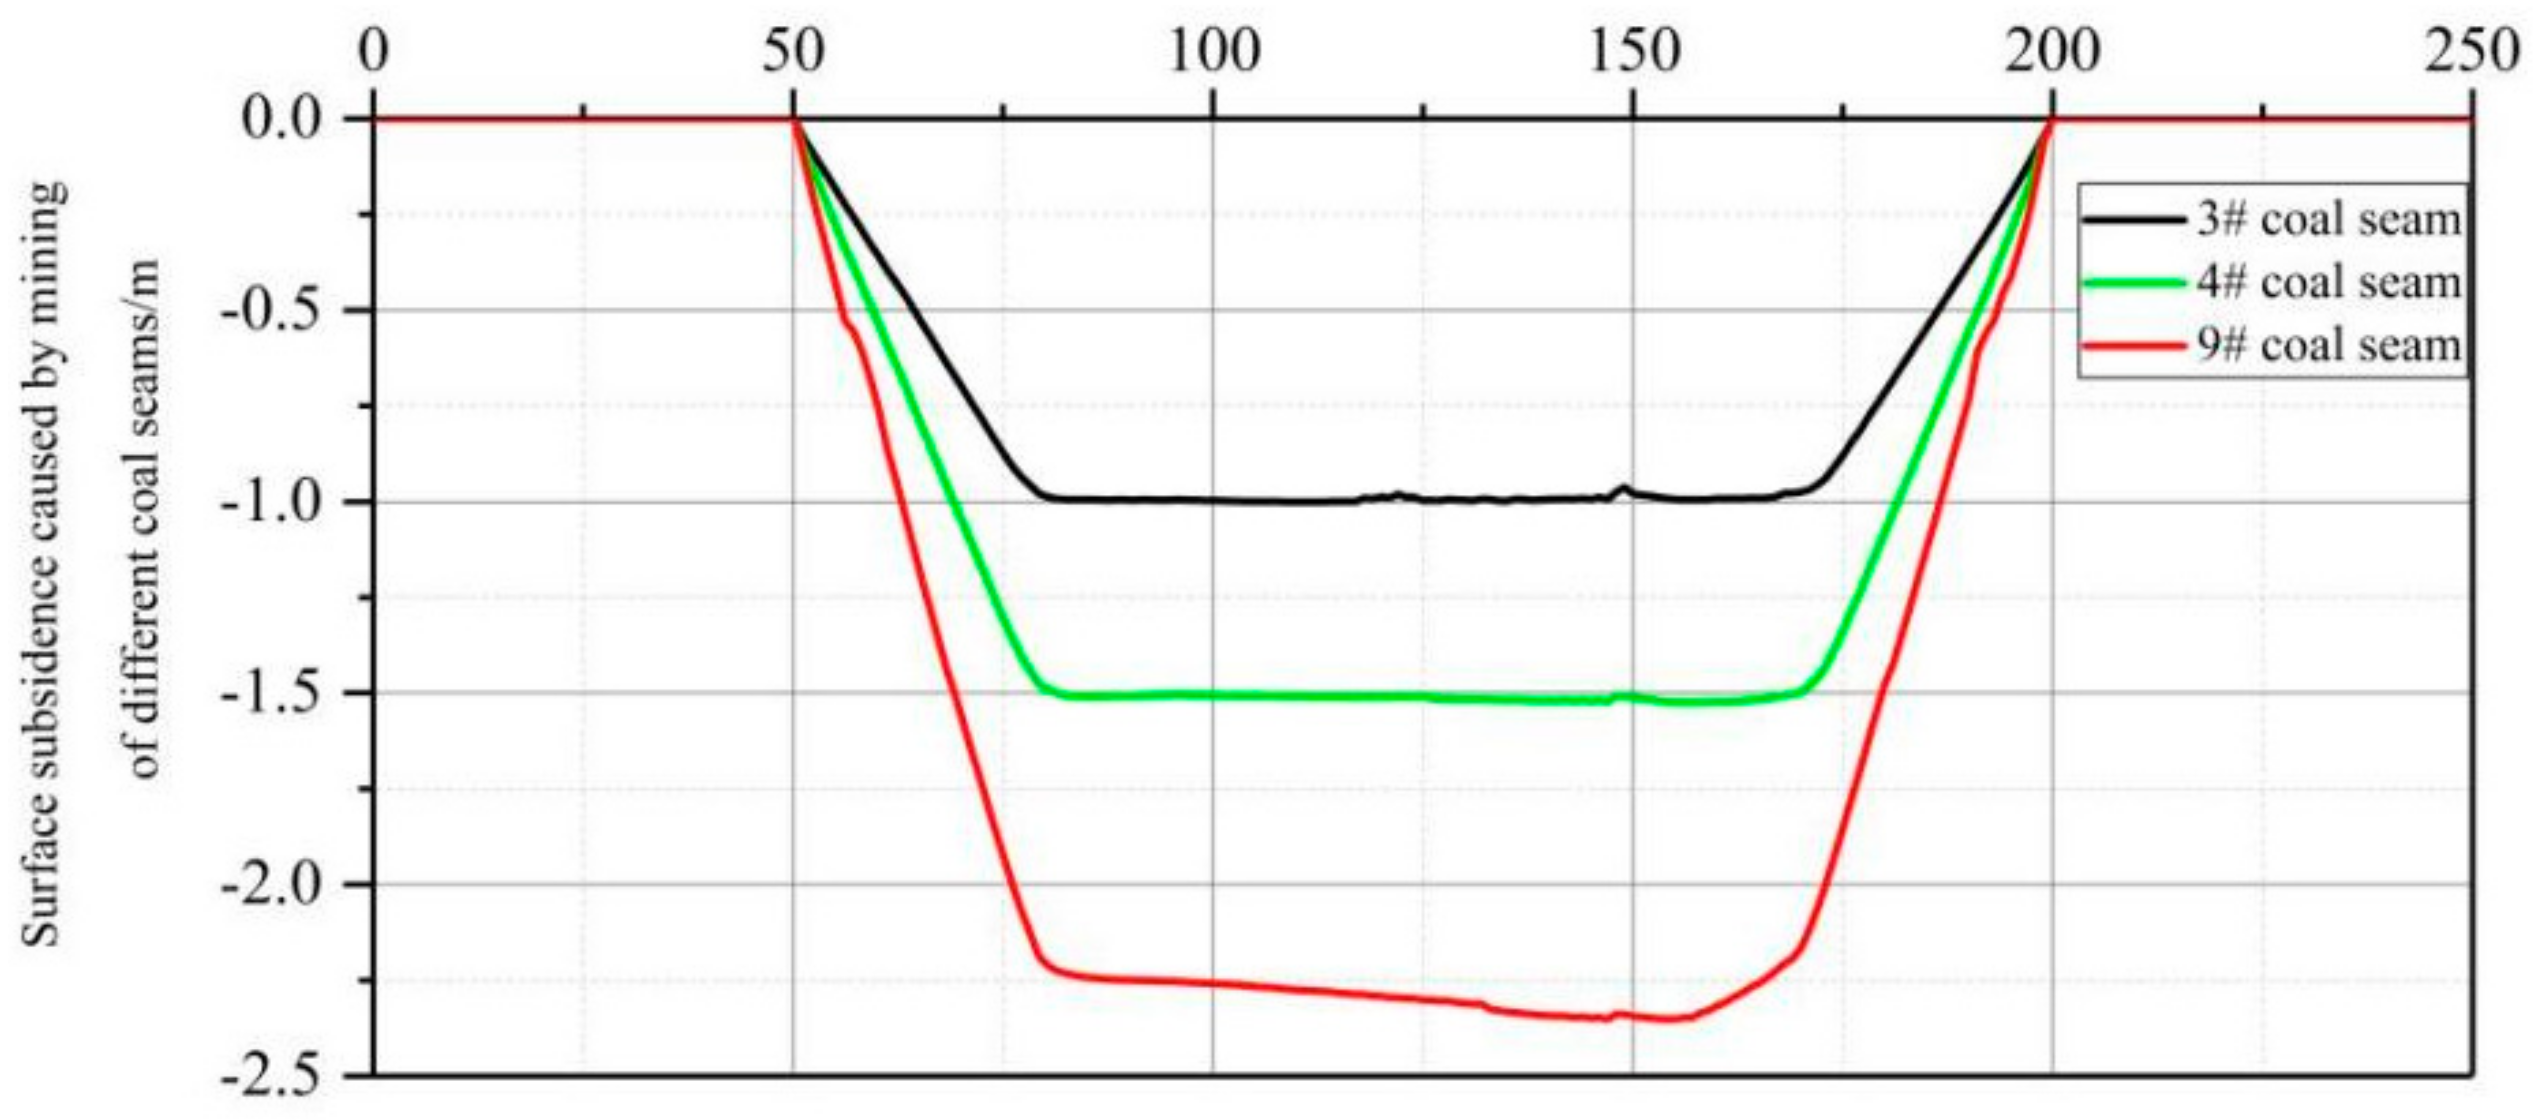
Figure 22 shows the surface subsidence after the mining of different coal seams. It can be seen from the figure that the three-layer coal mining reached the status of full mining. The maximum surface subsidence values after the mining of the 3# coal seam, 4# coal seam, and 9# coal seam are 0.95 m, 1.42 m, and 2.21 m, respectively. The length of the stable subsidence area on the surface is approximately 50 m.
After the model is stabilized, the mechanical property changes in the broken rock in the goaf after ten years are calculated, and the specific values are substituted into the model to change the parameters of the broken gangue in the goaf. The re-deformation subsidence diagram of the water-carrying fracture zone in the old goaf is obtained (Figure 23).
As shown in Figure 23, the development heights of the water-carrying fracture zones after the mining of the 3#, 4#, and 9# coal seams in the study area are 19.4 m, 20 m, and 30.4 m, respectively, which are basically consistent with the results of theoretical analysis and similar simulation. The development height of the water-carrying fractured zone of the overlying rock structure of the old goaf in the study area is 0.22 m and 0.39 m, respectively. Because the 4# coal seam is close to the 3# coal seam, the mining stage affected the 3# coal seam goaf, so the water-carrying fractured zone is connected to the 3# coal seam goaf.

4. Treatment of the Shallow Coal Seam Group in the Abandoned Mine

4.1. Results of Study Area Exploration

Combined with EH-4, the high-density electrical method was used to detect the goaf, and for the comprehensive analysis of the goaf characteristics. The goaf in the study area is located in the 3#, 4#, and 9# coal seams. The total area of the goaf in the study area is approximately 63,445.95 m2. According to the leakage of the borehole water level, the heights of the caving zone and fractured zone are obtained, as shown in Table 3, Table 4 and Table 5. The layout of the goaf in the study area is shown in Figure 24.
The height of the caving zone of the overlying rock in the goaf of the 3# coal seam is 1.8~2.8 m, the average mining height of the 3# coal seam in the recoverable area is 1 m, and the height of the caving zone is 1.8~2.8 times the mining height. The height of the fractured zone is 15.3~18.6 m, the average mining height of the 3# coal seam is 1 m, and the height of the fractured zone is 15.3~18.6 times the mining height.
The height of the caving zone in the goaf of the 4# coal seam is 2.4~3.2 m, the average mining height of the 4# coal seam is 1 m, and the height of the caving zone is 2.4~3.2 times the mining height. The height of the fractured zone is 18.7~20.5 m, the average mining height of the 4# coal seam is 1 m, and the height of fractured zone is 18.7~20.5 times the mining height.
The height range of the 9# coal seam goaf overburden caving zone is 2.21~6.5 m, the average mining height of the 9# coal seam is 1.5 m, and the height of the caving zone is 1.47~4.3 times the mining height. The height of the fractured zone is 19.1~28.2 m, the average mining height of the 9# coal seam is 1.5 m, and the height of the fractured zone is 12.7~18.8 times the mining height.
The above results show that with the gradual deepening of coal seam mining, the height of the fracture zone in each coal seam increases. Compared with the 3# coal seam, the height of the fracture zone in the 4# and 9# coal seams increases by 1.9~3.4 m and 3.8~9.6 m, respectively.

4.2. Study on Overburden Rock Characteristics in the Study Area

According to the “building, water, railway and main roadway coal pillar and coal mining specification” [43], according to the geological survey of the study area, the 3#, 4#, and 9# coal seams overlying the rock lithology can be classified as medium hard rock; hence, after mining, the roof collapse height calculation formula is [43]
H k = 100 m 1.6 m + 3.6 ± 5.6
The height estimation formula of the fracture zone, including the collapse height, is
H l = 20 m + 10
where H k is the roof collapse height, m; and H l is the roof fracture zone height, m.
Substituting the rock parameters of the 4# coal seam into Formula (15), the development height of the water-carrying fractured zone of the 4# coal seam is 24.83 m, which exceeds the spacing between the 3# coal seam and 4# coal seam. Therefore, the 3# coal seam and 4# coal seam should be selected using the close-distance coal seam mining experience formula for the comprehensive estimation of mining thickness.
m 1 2 = m 1 + m 2 1 h 1 2 h 2 k
where m 1 is the upper coal seam thickness, m; m 2 is the thickness of the lower coal seam, m;   h 1 2 is the normal distance between the upper and lower layers of coal, m; and h 2 k is the caving height of the lower coal roof, m.
According to Formula (16), after the water-carrying fractured zones of the 3# coal seam and 4# coal seam overlap, the height of the water-carrying fractured zone of these seams is 31.86 m and 20 m, respectively.
According to Formula (15), the height of the water-carrying fractured zone of the 9# coal seam is 34.49 m.
According to the formation conditions of the study area, numerical simulation calculation was carried out to obtain the development height of the water-carrying fractured zone of the abandoned mine in the study area. The results of empirical calculation, theoretical analysis, and similar simulation are compared with the field-measured data, as shown in Table 6.
From Table 6, it can be seen that the data obtained using the empirical formula exhibit a large deviation from the field-measured data. The values obtained by the previous theoretical studies are closer to those of the field-measured data. The average error rate of the values obtained by similar simulation and numerical simulation is small, which verifies the reliability of the theoretical analysis.

4.3. Grouting Treatment Foundation in a Shallow-Buried Close-Distance Coal Seam Group in an Abandoned Mine

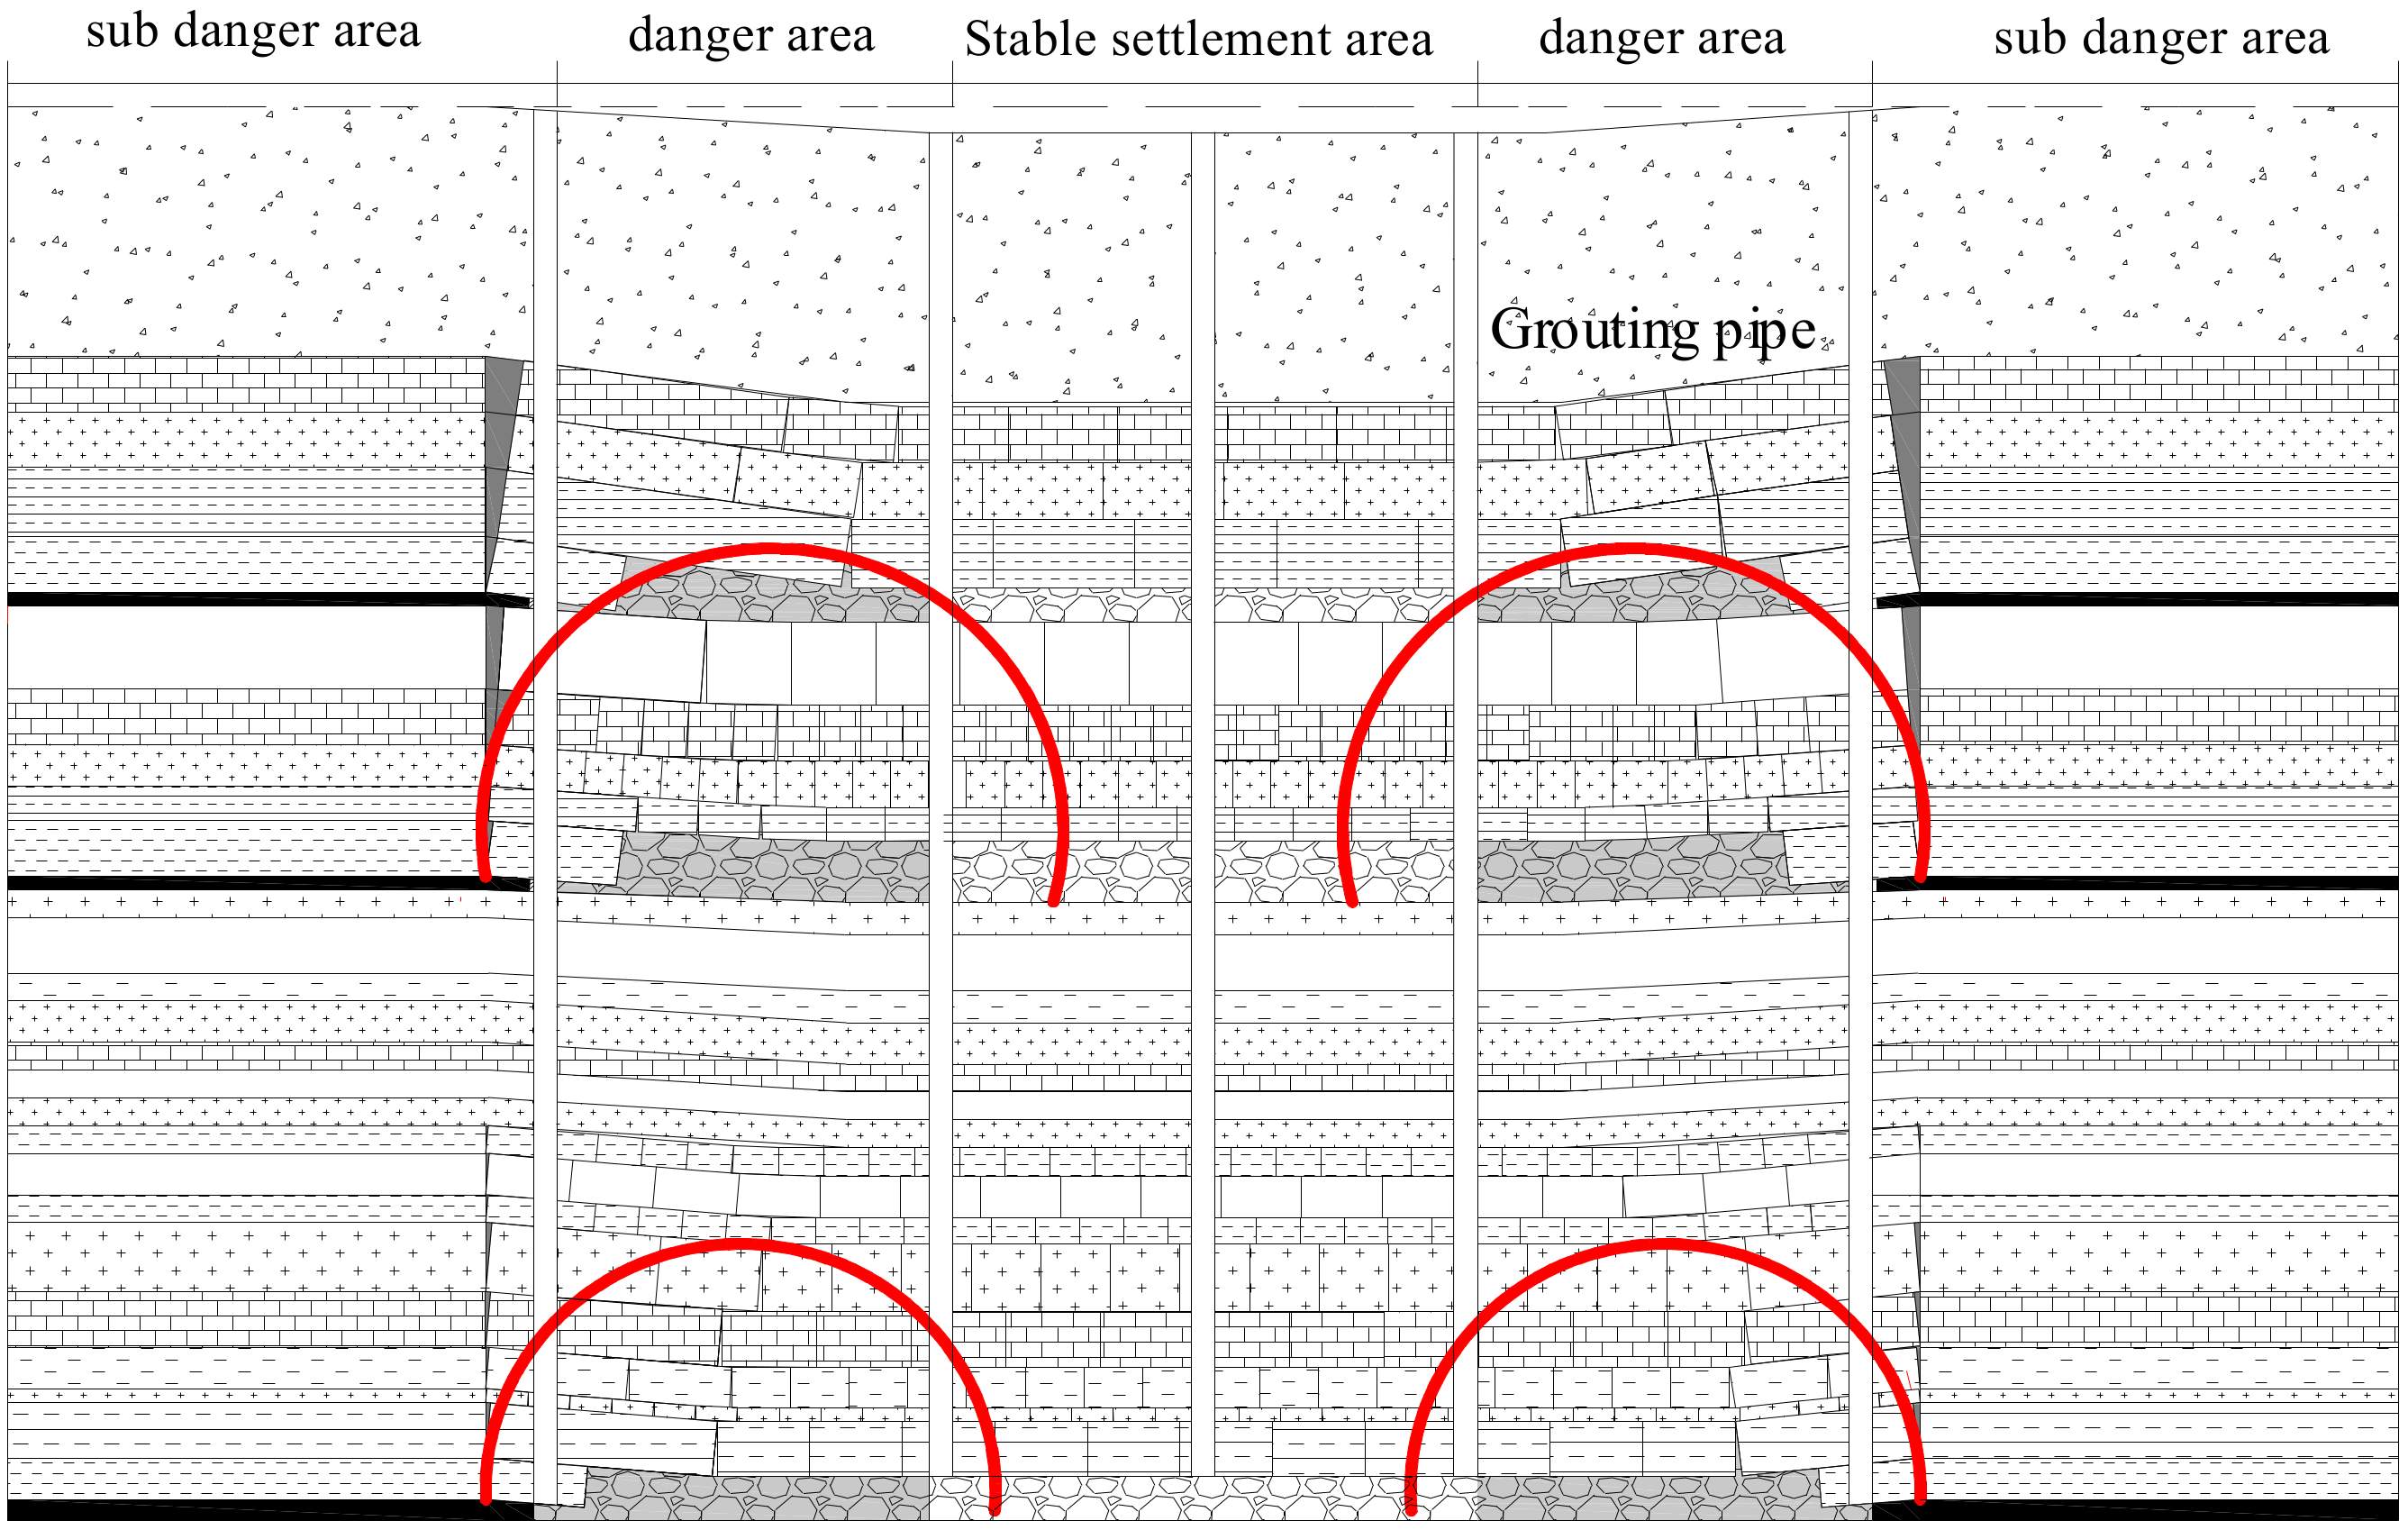
Through the above, it can be seen that the overlying strata in the central goaf are relatively dense, and the “activation” space is mainly composed of the broken expansion space in the compaction area of the caving zone and the fracture space in the central overlying strata. The key points of grouting reinforcement in the study area are shown in Figure 25. In the goaf within the stable settlement area, the “activation” behavior of the rock mass is slow, uniform, and small, which is less harmful to the project. Grouting reinforcement should control a certain amount of grouting; in the boundary of a mined-out area, there are a large number of cavities and under-compaction areas, and the “activation” of overburden rock is more intense, which is the key area of grouting reinforcement and is an area at high risk of overburden rock deformation and instability. On both sides of the boundary of the goaf, with the downward mining of the coal seam, the overlying rock of the upper coal seam is affected by repeated mining. The boundary of the upper goaf suffers from rock deflection and re-sinking, forming a large number of holes and fissures. This part of the area is also the key area targeted by grouting reinforcement, which is at secondary risk of the activation of overlying rock deformation.

5. Conclusions

(1) The development height of the water-carrying fractured zone after the mining of the 3#, 4#, and 9# coal seams is 17 m, 19.5 m, and 27.1 m, respectively, which shows that the height of the water-carrying fractured zone is proportional to the buried depth of the coal seam after mining.
(2) After the model is set aside for three months, the degree of development of the residual fracture in the goaf is analyzed, and the distribution law of the residual porosity in the longwall old goaf of shallow-buried multiple coal seams is obtained. The development rate of residual fissures on both sides of goaf is between 20.31% and 42.31%. The residual fracture development rate in the middle is relatively small, being between 8.21% and 18.53%. UDEC numerical simulation software was used to analyze the overburden failure and instability after the mining of the 3#, 4#, and 9# coal seams in the study area, and the status of full mining was achieved. The maximum surface subsidence values were 0.95 m, 1.42 m, and 2.21 m, respectively. After the stability of the overlying rock structure in the old goaf was achieved, the final development height of the water-carrying fractured zone was 19.62 m, 20 m, and 30.79 m.
(3) The characteristics of the overlying strata in the old goaf under actual stratum conditions were comprehensively analyzed. The results of empirical calculation, theoretical analysis, similar simulation, and field-measured data were compared and analyzed.

Author Contributions

Conceptualization, K.L.; Data curation, N.J.; Formal analysis, Z.G.; Project administration, H.D.; Resources, J.M.; Software, T.P. All authors have read and agreed to the published version of the manuscript.

Funding

This work was supported by the Natural Science Foundation of China (Nos. 52004146, 52074169 and 52174159), the Shandong Provincial Natural Science Foundation (Nos. ZR2020QE102), the 2020 joint fund of the State Key Laboratory of coal resources and safe mining-Beijing University outstanding young scientists program (SKLCRSM20LH04), China Postdoctoral Science Foundation (2022M713386).

Data Availability Statement

The data used to support the findings of this study were included within the article.

Conflicts of Interest

The authors declare no conflict of interest.

References

  1. Li, X.L.; Cao, Z.Y.; Xu, Y.L. Characteristics and trends of coal mine safety development. Energy Sources Part A Recover. Util. Environ. Eff. 2020, 2020, 1–19. [Google Scholar] [CrossRef]
  2. Hower, J.C.; Groppo, J.G.; Hsu-Kim, H.; Taggart, R.K. Distribution of rare earth elements in fly ash derived from the combustion of Illinois Basin coals. Fuel 2021, 289, 104676. [Google Scholar] [CrossRef]
  3. Islam, N.; Rabha, S.; Subramanyam, K.S.V.; Saikia, B.K. Geochemistry and mineralogy of coal mine overburden (waste): A study towards their environmental implications. Chemosphere 2021, 274, 129736. [Google Scholar] [CrossRef] [PubMed]
  4. Behera, S.K.; Mishra, D.P.; Ghosh, C.N.; Prashant; Mandal, P.K.; Singh, K.M.P.; Buragohain, J.; Singh, P.K. Characterization of lead-zinc mill tailings, fly ash and their mixtures for paste backfilling in underground metalliferous mines. Environ. Geol. 2019, 78, 394.1–394.13. [Google Scholar] [CrossRef]
  5. Baryakh, A.; Telegina, E.; Samodelkina, N.; Devyatkov, S.Y. Prediction of the intensive surface subsidences in mining potash series. J. Min. Sci. 2005, 41, 312–319. [Google Scholar] [CrossRef]
  6. Cui, X.M.; Wang, J.C.; Liu, Y.S. Prediction of progressive surface subsidence above longwall coal mining using a time function. Int. J. Rock Mech. Min. 2001, 38, 1057–1063. [Google Scholar] [CrossRef]
  7. Cui, X.M.; Zhao, Y.L.; Wang, G.R.; Zhang, B.; Li, C. Calculation of Residual Surface Subsidence Above Abandoned Longwall Coal Mining. Sustainability 2020, 12, 1528. [Google Scholar] [CrossRef] [Green Version]
  8. Leng, W.; Zhong, S.J. Surface subsidence caused by mantle plumes and volcanic loading in large igneous provinces. Earth Planet. Sci. Lett. 2010, 291, 207–214. [Google Scholar] [CrossRef]
  9. Wu, L.X.; Gao, J.H.; Ge, D.Q.; Liao, M.S. Experimental Study on Surface Subsidence Monitoring with D-InSAR in Mining Area. J. Cent. South Univ. 2005, 26, 778–782. [Google Scholar]
  10. Ma, J.B.; Jiang, N.; Wang, X.J.; Jia, X.; Yao, D. Numerical study of the strength and characteristics of sandstone samples with combined double hole and double fissure defects. Sustainability 2021, 13, 7090. [Google Scholar] [CrossRef]
  11. Chen, S.J.; Zhang, L.B.; Jiang, N.; Yin, D.; Gao, Z.; Guo, W. A case of large buildings construction above oldmine goaf in Shandong Province. J. China Coal. Soc. 2022, 47, 1017–1030. [Google Scholar] [CrossRef]
  12. Yao, D.H.; Jiang, N.; Wang, X.J.; Jia, X.; Lv, K. Mechanical behaviour and failure characteristics of rocks with composite defects of different angle fissures around hole. Bull. Eng. Geol. Environ. 2022, 81, 290. [Google Scholar] [CrossRef]
  13. Jiang, N.; Yin, D.W.; Ma, J.B.; Han, L.; Yin, Q. Effects of water immersion on the long-term bearing characteristics of crushed gangue in goaf. Geofluids 2021, 2021, 6675984. [Google Scholar] [CrossRef]
  14. Jung, H.C.; Kim, S.W.; Jung, H.S.; Min, K.D.; Won, J.S. Satellite observation of coal mining subsidence by persistent scatterer analysis. Eng. Geol. 2007, 92, 24–34. [Google Scholar] [CrossRef]
  15. Yang, H.; Deng, K.; Zhang, S.; Liu, C.; Rui-Peng, Y.U. Research on Subsidence Monitoring of Mine Surface Using Digital Close-range Photogrammetric Technique. J. Image Graph. 2008, 3, 519–524. [Google Scholar] [CrossRef]
  16. Davies, P.; Fryer, J. Photogrammetric monitoring of deformation caused by mine subsidence. Aust. Surv. 1995, 40, 5–9. [Google Scholar] [CrossRef]
  17. Guo, W.B.; Zhao, G.B.; Bai, E.H.; Guo, M.; Wang, Y. Effect of overburden bending deformation and alluvium mechanical parameters on surface subsidence due to longwall mining. Bull. Eng. Geol. Environ. 2021, 80, 2751–2764. [Google Scholar] [CrossRef]
  18. Hou, D.F.; Li, D.H.; Xu, G.S.; Zhang, Y.; Engineering, S.; Beijing, T. Impact of mining thickness on dynamic subsidence characteristics in condition of mining under thick unconsolidated layers. Coal Sci. Technol. 2016, 44, 191–196. [Google Scholar] [CrossRef]
  19. Guo, Q.B.; Meng, X.R.; Li, Y.M.; Lv, X.; Liu, C. A prediction model for the surface residual subsidence in an abandoned goaf for sustainable development of resource-exhausted cities. J. Clean. Prod. 2021, 279, 123803. [Google Scholar] [CrossRef]
  20. Zhang, H.; Wang, Y.J.; Li, Y.F. SVM model for estimating the parameters of the probability-integral method of predicting mining subsidence. Sci. China Technol. Sci. 2009, 19, 385–388. [Google Scholar] [CrossRef]
  21. Hua, G.; Liang, Y.; Shen, B.T.; Qu, Q.; Xue, J. Mining-induced strata stress changes, fractures and gas flow dynamics in multi-seam longwall mining. Int. J. Rock Mech. Min. 2012, 54, 129–139. [Google Scholar] [CrossRef]
  22. Xu, W.S.; Wang, F.; Gao, Z. Analysis on Overburden Load Structure in Mining Under Thick Loose Layer with Confined Water. Coal Technol. 2012, 31, 85–87. [Google Scholar]
  23. Cao, W.X.; Liu, H.L.; Hang, Y.J. Similarity Simulation on the Movement Characteristics of Surrounding Rock and Floor Stress Distribution for Large-Dip Coal Seam. Sensors 2022, 22, 2761. [Google Scholar] [CrossRef] [PubMed]
  24. Ghabraie, B.; Gang, R.; Smith, J.V. Characterising the multi-seam subsidence due to varying mining configuration, insights from physical modelling. Int. J. Rock Mech. Min. 2017, 93, 269–279. [Google Scholar] [CrossRef]
  25. Qin, Y.; Xu, N.X.; Zhang, Z.J.; Zhang, B. Failure Process of Rock Strata Due to Multi-seam Coal Mining: Insights from Physical Modelling. Rock Mech. Rock Eng. 2021, 54, 2219–2232. [Google Scholar] [CrossRef]
  26. Yin, D.; Ding, Y.; Jiang, N.; Li, F.; Zhang, J.; Xu, H. Mechanical properties and damage characteristics of coal samples under water immersion pressure. Lithosphere 2022, 2022, 1278783. [Google Scholar] [CrossRef]
  27. Cheng, G.W.; Yang, T.H.; Liu, H.Y.; Wei, L.; Zhao, Y.; Liu, Y.; Qian, J. Characteristics of stratum movement induced by downward longwall mining activities in middle-distance multi-seam-ScienceDirect. Int. J. Rock Mech. Min. 2020, 136, 104517. [Google Scholar] [CrossRef]
  28. Ghabraie, B.; Gang, R.; Barbato, J.; Smith, J.V. A predictive methodology for multi-seam mining induced subsidence. Int. J. Rock Mech. Min. 2017, 93, 280–294. [Google Scholar] [CrossRef]
  29. Pan, H.Y.; Jiang, N.; Gao, Z.Y.; Liang, X.; Yin, D. Simulation study on the mechanical properties and failure characteristics of rocks with double holes and fractures. Geomech. Eng. 2022, 30, 93–105. [Google Scholar]
  30. Herrera, G.; Tomas, R.; Lopez-Sanchez, J.M.; Delgado, J.; Mallorqui, J.J.; Duque, S.; Mulas, J. Advanced DInSAR analysis on mining areas: La Union case study (Murcia, SE Spain). Eng. Geol. 2007, 90, 148–159. [Google Scholar] [CrossRef] [Green Version]
  31. O’Connor, K.M.; Murphy, E.W. TDR monitoring as a component of subsidence risk assessment over abandoned mines. Int. J. Rock Mech. Min. Sci. 1997, 34, 619. [Google Scholar] [CrossRef]
  32. Huang, Q.X.; Wang, L.T.; Du, J.W. Stability of coal pillars in room-and-pillar goaf with opposite mining under ultra-close shallow goafs. J. Min. Saf. Eng. 2022, 39, 118–125. [Google Scholar] [CrossRef]
  33. Zhao, L.C.; Li, L.; Peng, Y.H. Mechanics of Materials; University of Electronic Science and Technology Press: Chengdu, China, 2020. [Google Scholar]
  34. Song, Y.; Yang, M.; Ma, H. Study on deformation law and breaking span of main roof of isolated working face based on thin plate theory. Saf. Coal Mines 2022, 53, 201–207. [Google Scholar] [CrossRef]
  35. Wang, G.A.; Zhu, S.T.; Jiang, F.X.; Zhang, X.; Liu, J.; Wang, X.; Ning, T.; Zhang, Y.; Wei, Q. Seismic mechanism of coal pillar-key layer structure in fully mechanized caving face of inclined thick coal seam. J. China Coal Soc. 2022, 47, 2289–2299. [Google Scholar] [CrossRef]
  36. Zuo, J.P.; Sun, Y.J.; Wen, J.H.; Zhengdai, L.I.; Beijing, T.; Engineering, C. Theoretical and mechanical models of rock strata movement and their prospects. Coal Sci. Technol. 2018, 46, 87. [Google Scholar] [CrossRef]
  37. Li, G.C. Study on Stability and Safety Control of Surrounding Rock of Weak Interlayer Roof Roadway. Ph.D. Thesis, China University of Mining and Technology, Beijing, China, 2008. [Google Scholar]
  38. Huang, Y. Study on Deformation and Failure Characteristics and Height Development of Overlying Strata under Repeated Mining of Double Coal Seams. Ph.D. Thesis, China University of Mining and Technology, Beijing, China, 2014. [Google Scholar]
  39. Chen, Y.J.; Pan, C.L.; Cao, P.; Wang, W. A new mechanical model for soft rock rheology. Rock Soil Mech. 2003, 24, 209–214. [Google Scholar] [CrossRef]
  40. Hou, D.F.; Li, D.H.; Xu, G.S.; Zhang, Y. Superposition model for analyzing the dynamic ground subsidence in mining area of thick loose layer. Int. J. Min. Sci. Technol. 2018, 28, 119–124. [Google Scholar] [CrossRef]
  41. Cui, X.; Che, Y.; Malinowska, A.; Zhao, Y.; Li, P.; Hu, Q.; Kang, X.; Bai, Z. Method and problems for subsidence prediction in entire process induced by underground mining. J. China Coal Soc. 2022, 47, 2170–2181. [Google Scholar] [CrossRef]
  42. Li, B.; Liang, Y.; Zhang, L.; Zou, Q. Experimental investigation on compaction characteristics and permeability evolution of broken coal. Int. J. Rock Mech. Min. 2019, 118, 63–76. [Google Scholar] [CrossRef]
  43. Wang, X.; Liu, Y. Study on Hydrogeological Conditions of Waterproofing and Sand Prevention in Shallow Buried Area of Coal Seam. Coal Technol. 2022, 41, 152–154. [Google Scholar] [CrossRef]
Figure 1. Location map of the study area.
Energies 15 09359 g001
Figure 2. Layout plan of the proposed building.
Energies 15 09359 g002
Figure 3. Overburden structure map of the study area.
Energies 15 09359 g003
Figure 4. Model hypothesis diagram.
Energies 15 09359 g004
Figure 5. Stress diagram of roof beam.
Energies 15 09359 g005
Figure 6. Characteristics of overburden movement and deformation during the mining of the 3# coal seam.
Energies 15 09359 g006
Figure 7. Evolution characteristics of the displacement field of the strata during the mining of the 3# coal seam.
Energies 15 09359 g007
Figure 8. Characteristics of overburden movement and deformation during the mining of the 4# coal seam.
Energies 15 09359 g008
Figure 9. Evolution characteristics of the displacement field of the strata during the mining of the 4# coal seam.
Energies 15 09359 g009
Figure 10. Characteristics of overburden movement and deformation during the mining of the 9# coal seam.
Energies 15 09359 g010
Figure 11. Evolution characteristics of the displacement field of the strata during the mining of the 9# coal seam.
Energies 15 09359 g011
Figure 12. Zoning map of residual fractures in the goaf.
Energies 15 09359 g012
Figure 13. Numerical simulation calculation model.
Energies 15 09359 g013
Figure 14. Relationship between the secant modulus and compressive stress of broken rock in different states.
Energies 15 09359 g014
Figure 15. Model post-harvest flow chart.
Energies 15 09359 g015
Figure 16. Stress field diagram of overburden after the mining of the 3# coal seam.
Energies 15 09359 g016
Figure 17. Displacement field of overburden after the mining of the 3# coal seam.
Energies 15 09359 g017
Figure 18. Stress field diagram of overburden after the mining of the 4# coal seam.
Energies 15 09359 g018
Figure 19. Displacement field of overburden after the mining of the 4# coal seam.
Energies 15 09359 g019
Figure 20. Stress field diagram of overburden after the mining of the 9# coal seam.
Energies 15 09359 g020
Figure 21. Displacement field of overburden after the mining of the 9# coal seam.
Energies 15 09359 g021
Figure 22. Surface subsidence caused by the mining of different coal seams.
Energies 15 09359 g022
Figure 23. Redevelopment of and change in the water-carrying fracture zone in the old goaf.
Energies 15 09359 g023
Figure 24. Centralized drilling area of the goaf of the 3#, 4#, and 9# coal seams in the study area.
Energies 15 09359 g024
Figure 25. Key areas of grouting reinforcement in the study area.
Energies 15 09359 g025
Table 1. Rock mechanical parameters.
Serial NumberLithologyElasticity Modulus,
E × 104/MPa
Volume Weight ,   γ /
k N m 3
Poisson s   Ratio ,   μ Strength   in   Tension ,   σ 1 /
MPa
Bulking Coefficient
1unconsolidated formation0.222.00.2 1.05
2mudstone0.5817.20.30.071.05
3fine sandstone2.0625.090.2013.481.03
4siltstone1.6424.40.2172.21.03
5Sandy mudstone1.5524.10.2681.31.025
6limestone9.6325.40.226.131.05
7medium sandstone2.5025.02.42.511.03
8coarse sandstone4.5625.822.14.351.03
Table 2. Deformation of bearing stratum above the fracture arch and below the bending zone in the abandoned gob.
Coal Seam3# Coal Seam and 4# Coal Seam9# Coal Seam
Residual subsidence volume/m0.110.22
Table 3. List of the “three zones” in the 3# coal seam goaf.
Serial NumberHole NumberDrilling Depth/mGoafDrilling Depth/mStuck Drill or Footage Significantly Accelerate the Depth/mCaving Zone Height/mFracture Zone Height/m
1zk3-25120.203# coal seam 34.8–37.6
(2.8)
34.8–37.6
(2.8)
19.5–34.8
(15.3)
2zk4-25120.103# coal seam 35.8–38.5
(2.7)
35.8–38.5
(2.7)
18.7–35.8
(17.1)
3zk4-28120.303# coal seam 38.3–40.7
(2.4)
38.3–40.7
(2.4)
19.7–38.3
(18.6)
4zk8-25120.053# coal seam37.9–38.6
(0.7)
36.6–38.4
(1.8)
20.5–36.6
(16.1)
Table 4. List of the “three zones” in the 4# coal seam goaf.
Serial NumberHole NumberDrilling Depth/mGoafStuck Drill or Footage Significantly Accelerate the Depth/mCaving Zone Height/mFracture Zone Height/m
1zk3-25120.204# coal seam52.3–55.5
(3.2)
52.3–55.5
(3.2)
33.6–52.3
(18.7)
2zk4-25120.104# coal seam56.7–59.3
(2.6)
56.7–59.3
(2.6)
36.2–56.7
(20.5)
3zk4-28120.304# coal seam61.4–65.5
(4.1)
61.4–65.5
(4.1)
42.5–61.4
(18.9)
4zk8-25120.054# coal seam59.7–62.1
(2.4)
59.7–62.1
(2.4)
40.4–59.7
(19.3)
Table 5. List of drilling parameters n the goaf of the 9# coal seam.
Serial NumberHole NumberDrilling Depth/mGoafDrilling Depth/mStuck Drill or Footage Significantly Accelerate the Depth/m
1zk3-25120.209# coal seam97.5–100
(2.5)
2zk4-25120.109# coal seam102.7–104.8
(2.1)
3zk4-28120.309# coal seam108.9–110.9
(2.0)
4zk8-25120.059# coal seam 105.6–112.1
(6.5)
5zk8-28120.459# coal seam 108.7~114.6
(5.9)
Table 6. Analysis and comparison of the measured data of the water-carrying fracture zone.
3# Coal Seam4# Coal Seam9# Coal SeamMean Error Rate
field test18.6 m20 m28.2 m
empirical formula31.86 m20 m34.49 m31.20%
theoretical analysis17.11 m19.5 m27.1 m5.6%
analogy simulation20.10 m20 m33.6 m9.8%
numerical simulation19.62 m20 m30.79 m5.8%
Publisher’s Note: MDPI stays neutral with regard to jurisdictional claims in published maps and institutional affiliations.