1. Introduction
A water distribution system (WDS) is a major infrastructure whose goal is to consistently provide people with clean and safe water [
1,
2]. To ensure that people consume fresh water that is both conservatively stable and safe, measuring devices are installed to continuously monitor hydraulic variables (e.g., pressures, pipe flows) at key locations throughout the WDS [
3]. Abnormal conditions (e.g., water quality events) could cause changes in WDS measurements such as the pressure and flow rate [
4]. In the event of a water quality accident, abnormal values will occur in the observed water quality measurements, such as turbidity, pH, electrical conductance, and temperature [
5,
6,
7,
8]. Recently, smart meters have been installed in WDSs [
9,
10,
11,
12,
13,
14,
15] to capture data with a higher temporal resolution [
16,
17,
18]. The measurements collected from these meters are known as structured data that have a standardized format and are generally stored in a database such as a supervisory control and data acquisition system.
Due to the benefits of smart meters, several studies have developed data-driven anomaly detection tools such as statistical process control (SPC) methods that identify abnormal events based on the measured WDS structured data (e.g., pressure, demand, and water quality data) [
19,
20,
21,
22,
23,
24,
25,
26,
27]. For example, Jung et al. (2015) applied two forms of structured data (demand and pressure) into several SPC methods to identify anomalies and compared their detection performances [
28]. Hou et al. (2014) also developed an SPC method for anomaly detection in a small-scale WDS but used real-time measured water quality data [
29]. Liu et al. (2020) developed a statistical method to quickly detect water quality events by analyzing three quality data sources including turbidity [
30]. Hu et al. (2022) developed a single-point anomaly identification approach to detect water quality events using saliency collected from three sensors [
31]. However, these previously proposed studies have several limitations.
The past studies assumed that smart meters are installed at every significant location of the WDS and that they work perfectly without any metering failures (e.g., missing data). However, having meters installed at all the significant sites is a rare case. In addition, sensor failures often occur when structured data are measured through meters. Thus, structured data-based detection tools are likely to fail to identify small fluctuations in the measurements if low meter density and sensor failures are considered.
More importantly, the data obtained through smart meters are point-by-point data, whereby each point data covers a range of water supplied in areas. For example, a node in WDS is the aggregation of households in vicinity to that node. The structured data measured from a node could provide an estimate of system conditions near that location, but it can never provide individual users’ satisfaction levels regarding the quality of the drinking water supplied. Due to the lack of information about individual user consumption, several past studies have failed to identify water quality events [
22,
32]. In these works, many water quality accidents were not detected although a good detection model was developed (e.g., support vector machine). Thus, detection methods that identify anomalous events using information provided by individual users should be developed to improve detection performance. An alternative approach is to incorporate unstructured data such as complaints uploaded by people on social media platforms.
Unstructured data is a type of data that has many formats with no structure (e.g., row, column, and numbers), such as text content, images, colors, and sounds [
33]. Unstructured data can be expressed through various social media platforms. These data are scattered on the Internet with various pieces of information and several studies have used them for anomaly event detection [
34,
35]. Using social networking service (SNS) data, Lee and Hwang (2019) examined the spatial distribution of previous flooding events [
36]. This study proved that a strong relationship appears among the amount of data gathered through social media, the time at which the keyword “rainfall” was gathered, the data from the region indicated, and the actual accident. Lee et al. (2021) used water surface elevation, the amount of discharge from the dam, and the tide level of the bridge downstream as structured data in a machine learning model and predicted the level of a specific bridge by filling the deficiencies of structured data through SNS unstructured data [
37]. These previous works have proven that combining unstructured and structured data together improves detection accuracy rather than only using structured data.
The reason why integrating two types of data has shown good results can be seen from the advantages and disadvantages of each data characteristic. The structured data are useful for preemptive detection. Since significant changes caused by an anomaly can be identified by smart meters installed in WDS pipes, any accidents can be detected before its water (water that has flaws such as quality issues) reaches the end-users. However, if the meters fail to collect or transmit data (e.g., missing data) or if the data contains many errors (i.e., high data uncertainty), structured data-based detection methods perform poorly. Unstructured data have the potential to solve these problems.
Although the anomalous event is not detected by structured data-based tools, it can be identified by looking at the information that users (or consumers) uploaded to their SNSs and the Internet. After the causes of accidents are made known, people are aware of them and will try to notify other users in their neighborhood for their safety. For example, if a pipe buried underground is damaged at a road repair site, people will upload videos or photos to their SNSs with explanations [
38,
39,
40]. Another benefit of unstructured data is that the data do not require any sensors or meters but only mobile devices. On the other hand, it has the disadvantage whereby preemptive detection is not allowable. Thus, anomaly detection approaches that combine unstructured and structured data should improve detection accuracy particularly when structured data-based methods fail to identify the events.
However, no studies have simultaneously utilized structured and unstructured data in the WDS field. When discoloration (which is caused by the mobilization of materials from pipe walls) of one of the water quality events has occurred, a post will be uploaded with a text saying that the color of the water coming from the faucet is strange, and news about the accident will also be written up and uploaded [
41,
42,
43]. Since there are many unstructured data types for various abnormal situations, research on performing anomaly detection by integrating available data (unstructured and structured) is essential.
The goal of this study is to propose a framework for detecting and diagnosing water quality events that have occurred in a WDS by integrating two types of available data; structured and unstructured data. This framework enables us to prepare for accidents that are impossible to be detected when only structured data are used. In this work, an appropriate methodology was presented by confirming the anomaly detection performance according to (1) the imputation method of outliers and missing values of structured data and (2) the anomaly detection method. By investigating the characteristics of various social networking services (SNSs), three SNS types (blogs, Twitter, and a news portal) that are appropriate for this work have been selected to collect and assess which types of unstructured data are the best for anomaly detection and diagnosis. The detection performance of the proposed framework is evaluated for a water quality accident in which various suspended substances are introduced into the WDS pipe. In the case of unstructured data, anomaly detection was performed by setting keywords that end-users generally use.
2. Water Quality Event Detection and Diagnosis Framework
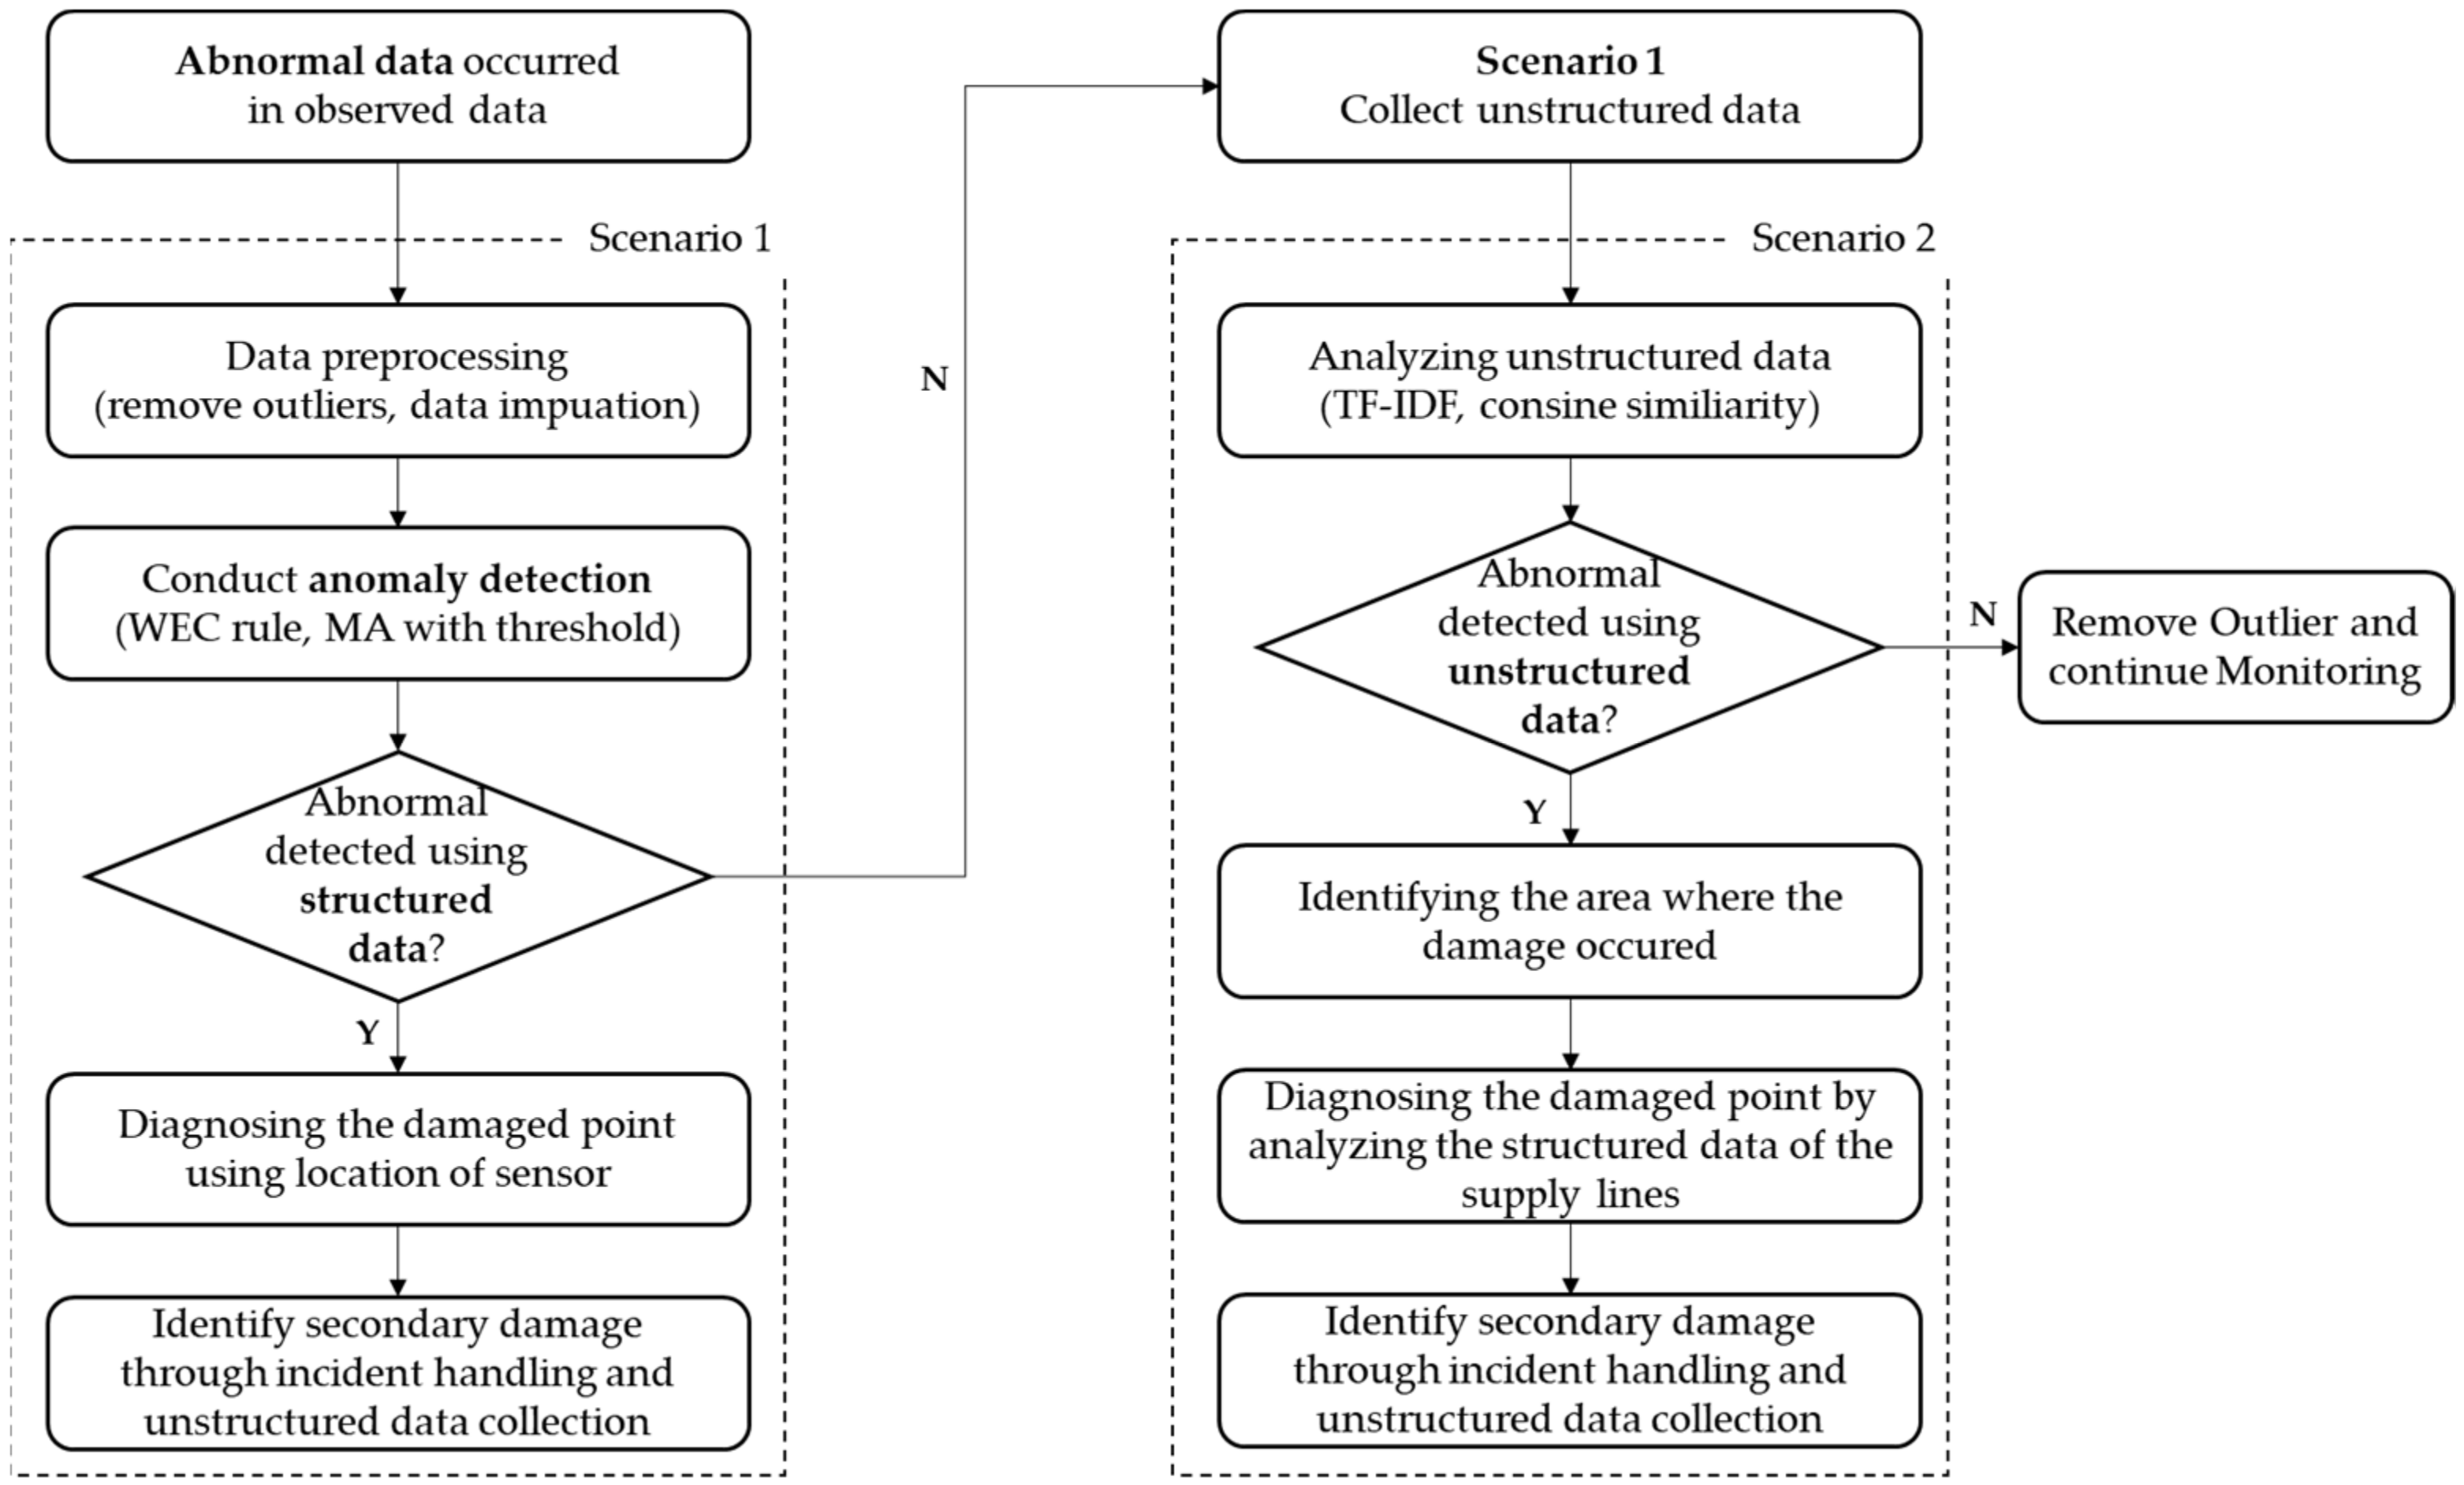
This study presents a framework that integrates structured and unstructured data for anomaly detection in WDSs (
Figure 1). The proposed framework assumes that structured data are collected from smart meters installed in WDSs and that unstructured data occur in the regions for which a WDS is responsible.
The proposed framework is divided into a process of performing anomaly detection using structured data and a process of anomaly detection through unstructured data. When an abnormality occurs in the monitored turbidity data (i.e., structured data), in order to detect the water quality event occurring in the WDS, scenario 1 is applied. First, a preprocessing process for structured data is performed. Outliers are removed during the preprocessing process, and the removed part and missing data are replaced by imputation methods. Thereafter, SPC tools are applied to determine whether an anomality has occurred. If it is determined that a water quality event has actually occurred, the damage point is diagnosed using the location of the sensor, and the secondary damage is identified through the collected unstructured data.
If an anomality is not detected through scenario 1, it goes to scenario 2. This situation can be used if there is a problem in setting the threshold of the SPC method or if scenario 1 cannot detect the anomality due to sensor failures. Even if the sensor-measured structured data do not show abnormal data, unstructured data monitoring continues. When water with quality problems comes out of end-users’ faucets, people post text posts (unstructured data) about the damage on SNSs. If data the begin to be collected by web crawling around the name of the area that is being monitored and keywords related to damage, scenario 2 is applied. Scenario 2 is available because a large amount of unstructured data exists. In this study, it is assumed that the probability of people uploading text posts (i.e., unstructured data) on their SNSs is high based on the fact that the percentage of people using mobile phones is 97% in 2022 [
44] and the Internet usage rate was 81.9% [
45] in 2021. In fact, when a water quality event occurred in a city in Korea with a population of 130,000, more than 20,000 unstructured pieces of data from a news portal could be collected [
46]. As a result, most of the citizens in the study area can be considered as having a willingness to provide information about the water quality events through unstructured data. The collected unstructured data are analyzed by term frequency-inverse document frequency (TF-IDF) and cosine similarity to check the correlation between the collected data and the water quality event to determine whether damage has really occurred. If damage is confirmed, diagnosing the damaged point by analyzing the supply lines is completed. If it is determined that the collected unstructured data are not related to the accident, the collected unstructured data and structured data can be determined as outliers, deleted, and then monitoring can be continued.
When abnormal data are measured on structured data, the suggested framework enters scenario 1. At this stage, it is not possible to determine if the abnormal data represent an actual accident or a simple instrument error. After the data preprocessing process, the analysis is carried out, and the abnormality is identified. If the SPC method confirms the abnormal data to be normal data, it continues to scenario 2. Unstructured data monitoring continues even if the sensor-measured structured data are free of anomalous data. After the preprocessing step, the analysis of unstructured data is carried out if one or more unstructured data set is gathered using a predetermined keyword or if scenario 1 identified the abnormal data as being normal data. If scenario 2 also finds that the unstructured data are normal, the suggested framework would recognize the abnormal data as outliers and exclude them.
The data preprocessing used in the framework is different depending on the structured and unstructured data. The structured data are preprocessed by removing the outliers and replacing the removed and missing data using an appropriate imputation method. The unstructured data are collected by keywords, but based on TF-IDF and cosine similarity, it is determined whether the collected data are related to the accident. This process will be briefly described in a later section.
3. Anomaly Detection Using Structured Data
3.1. Data Preprocessing
Owing to the development of technology, the amount of data available has increased significantly as meters capable of collecting high-time resolution data have been installed. However, the use of outliers and missing data caused by mechanical defects in the sensor itself [
47], cyber-attacks [
48], uncertainty in measurements, and large amounts of data that are not properly processed pose a major problem in conducting research using data. To achieve high anomaly detection performance using the observed data, an appropriate procedure to replace the outliers and missing data should be determined.
3.2. Removing Outliers
Outliers can be simply defined as the values that significantly differ from the true measured values. For example, meter malfunctions, relay failures, weather events, vandalism, and cyber-attacks are unexpected circumstances when outliers occur [
49]. Outliers are defined as the data at each measured point that are less than the 1st percentile and exceed the 99th percentile [
50]. The percentile was defined by the Python package, Pandas, and then the outliers were removed. After removing outliers in the structured data, an imputation method should be applied in order to replace the empty part, the removed outliers, and missing data. Missing data refers to the data without any measurements because of data transmission not being successfully performed. In this study, several imputation methods have been applied to remove the outliers and replace the empty data with imputed values. The next sections briefly explain the applied imputation methods.
3.3. Imputation Methods
Imputation is a technique that enhances data quality by generating a new value (i.e., imputed data) to replace the outliers and missing data. Improving data quality is essential because missing data can significantly impact the effectiveness of anomaly detection. In this study, five imputation methods were applied: zero, linear interpolation (LI), historical mean (HM), distribution sampling (DS), and moving average (MA).
3.3.1. Zero
Zero was applied when the proportion of missing data was <5%; this is the simplest imputation method. The method imputes all the missing values to zero [
51]. If too much data is replaced by zero, the quality of the data may decrease.
3.3.2. Linear Interpolation
Linear interpolation (LI) refers to linearly filling the value between the value of the time when the missing data begins to occur and the value of the time when the missing data end. LI can easily derive through a linear equation with two known values.
3.3.3. Historical Mean
Historical mean (HM) is a statistically reasonable methodology because it uses the average value of the same time zone as the data to be replaced [
52]. HM is used in several areas of data management, including power grids, transportation, and water resources [
49,
53,
54]. In this study, HM used the average value of previous data collected at the same time to replace missing data values.
3.3.4. Distribution Sampling
Unlike HM, distribution sampling (DS) has the advantage of preventing convergence to one value and imparting uncertainty to the data itself. It is considered that there is a certain pattern at the time when outliers/missing data occur, and a PDF file of the corresponding time zone is generated for each measurement point. Based on the PDF file generated using the observed data at each point, a cumulative density function (CDF) is drawn, and a random number within [0,1] is generated to derive missing data for the corresponding probability. This process is repeated in the section in which all imputations are required. Jun et al. (2021) was the first example of DS being applied in a WDS, please refer to it for detailed information [
49].
3.3.5. Moving Average
The moving average (MA) replaces the missing data with the average data value within the time window [
55]. The time window should use appropriate values according to the data used, and in this study, the sensitivity analysis was performed by setting the time window to 5, 10, 30, and 60 min, and the values with the best anomaly detection performance were found.
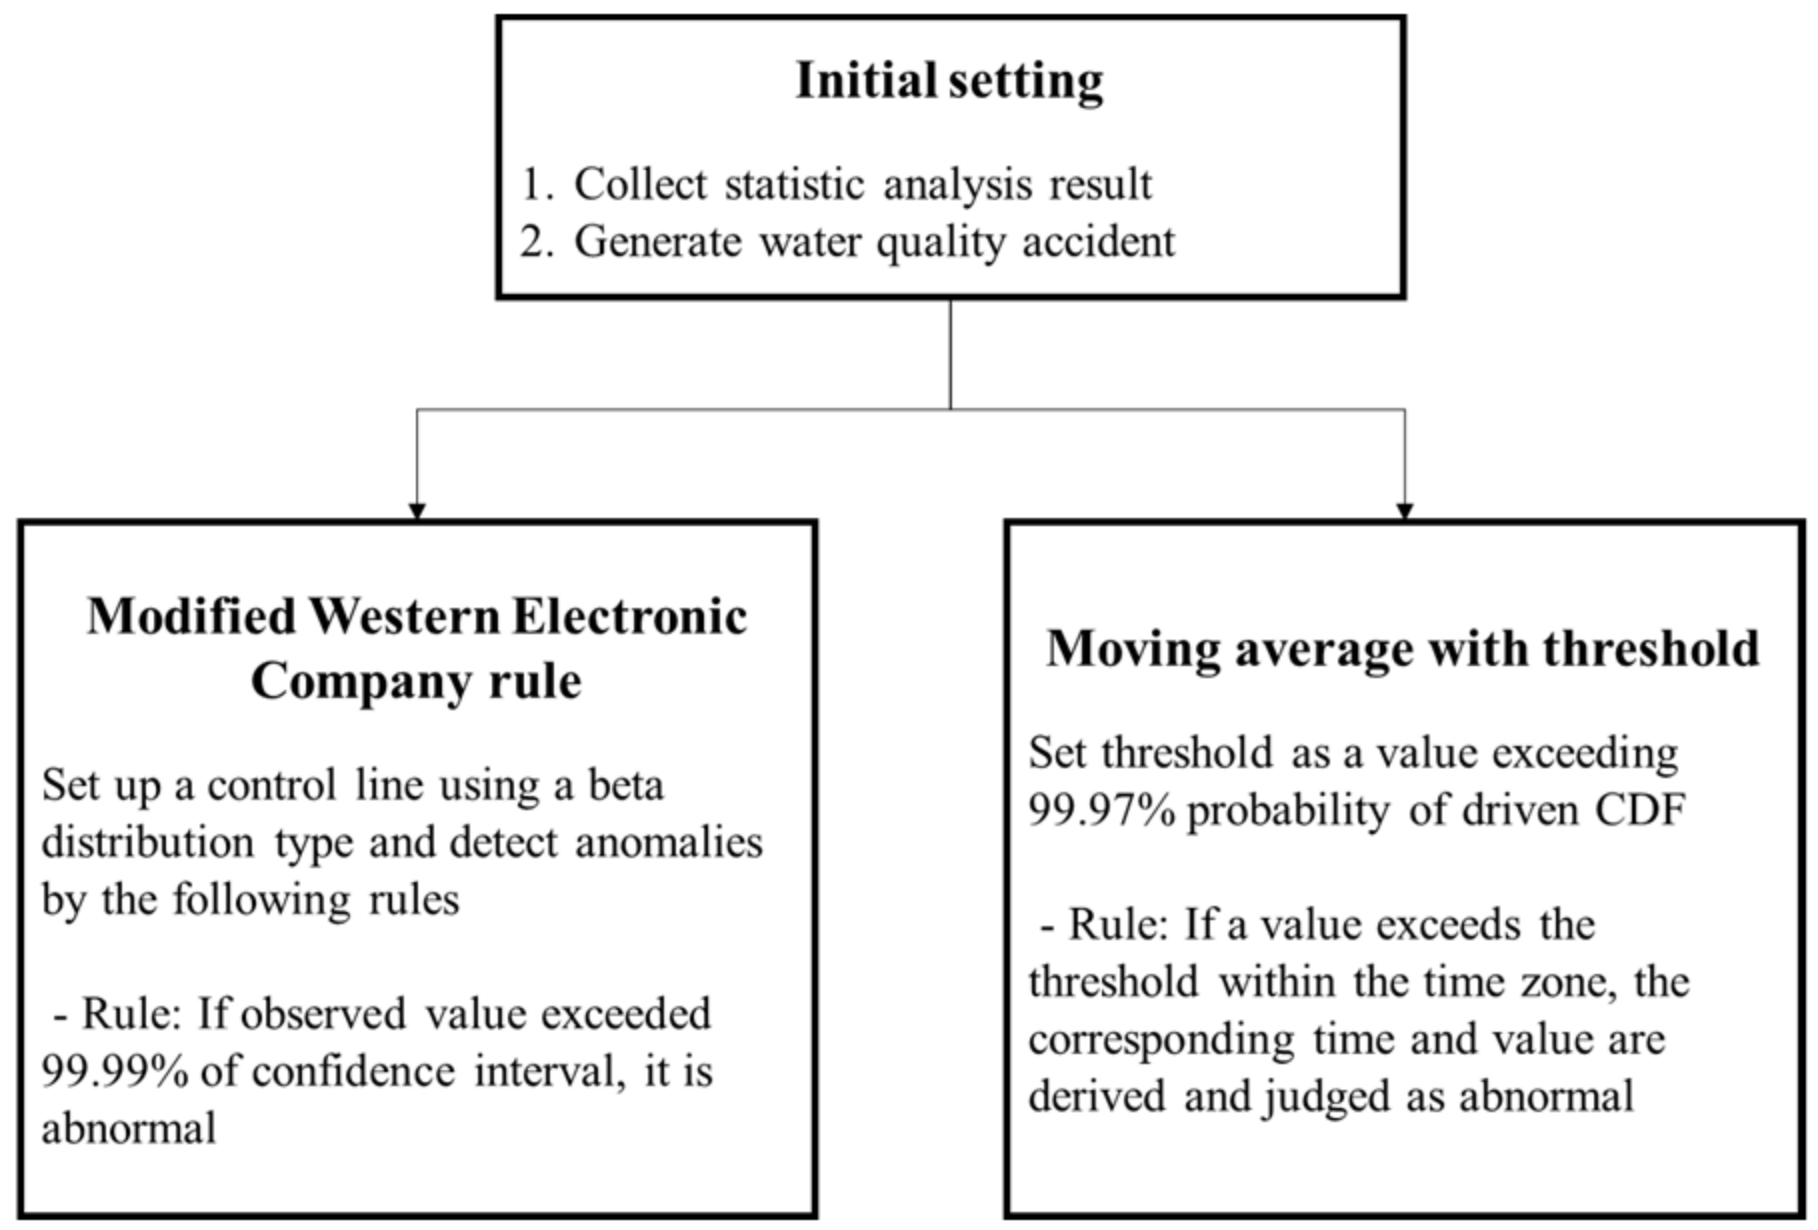
3.4. SPC Method
The anomaly detection technique performed in this study aims to utilize a statistical method. The detection performance of the two methods was compared. The two methods are the modified version of the Western Electric Company (WEC) rules [
56] and MA with threshold, as shown in
Figure 2.
3.4.1. Modified Western Electric Company Rules
WEC rules are a method to detect abnormal conditions in which abnormal data occur in the measurement data in which a certain pattern is repeated. Ref. [
57] performed pipe burst detection by applying WDS demand data to the WEC rule, and abnormality detection was performed based on a total of four rules. However, water quality data were unavailable because they did not follow a normal distribution, unlike the demand data. In addition, it was confirmed that because the data pattern did not exist, a very large RF rate occurred, resulting in a significant decrease in the detection performance. In this study, by utilizing the 4σ rule of the WEC, it was determined that there was an abnormality when the observed data exceeded a confidence interval of 99.99%.
3.4.2. Moving Average with Threshold
Moving average with thresholds is a separate method from the previous application of the imputation method. It was determined that there was an abnormality in the case where the necessary section was regenerated through the MA, and an appropriate threshold was set to exceed the corresponding value. The process is as follows:
Set the time to analyze anomaly detection performance;
Modify the data to the MA according to the time window set in that time zone;
Statistical analysis specifies a value exceeding 99.97% probability of driven CDF as the threshold;
If a value exceeds the threshold within the time zone, the corresponding time and value are derived and judged as abnormal.
4. Anomaly Detection Using Unstructured Data
If an anomaly is not identified with the structured data, its impact spreads out and may cause severe damage to customers. Then, those affected end-users can communicate the anomaly event, which is a water quality event in this work, through SNSs. Since the posted text data uploaded onto SNSs may contain unnecessary information, they should be collected by appropriate criteria. Thus, several tasks should be performed to select proper unstructured data to be used for anomaly detection [
58,
59]. First, SNS types should be determined that are useful for the analysis of anomaly detection. Then, the characteristics of the chosen SNSs should be analyzed and web crawling should be applied accordingly. Web crawling is performed using keywords of unstructured data uploaded in the past when water quality events have occurred. The unstructured data used in the study consist of only Korean words uploaded to SNSs.
Software established in Python was used to perform web crawling automatically on three selected SNSs. Python is utilized because: (1) unstructured text data can be collected effectively; (2) obtained data can be easily analyzed (e.g., word cloud analysis); and (3) location information in unstructured data can be easily identified. The web crawling software developed for this study acquires and analyzes unstructured data relating to the keywords. After setting which keywords to search for and which SNS to use, unstructured data are automatically collected and analyzed according to the web crawling procedure proposed in
Table 1.
4.1. Setting Keywords and Stopword Processing
The main information of unstructured data is the contents including keywords and the dates when unstructured data are uploaded. In this study, the keywords are set as “drinking water”, the name of the water quality event, and the name of the monitoring area. Unstructured data are collected using keywords; this may be the data that are not suitable for anomaly detection. Thus, in order to accurately judge this, it is essential to remove unnecessary content by stopword processing [
60]. In this study, unstructured data of past water quality events are (1) data with the aforementioned keywords and (2) data for a total of 40 days from 10 days before the actual water quality event occurred.
4.2. Analyzing SNS Characteristics and Establishing Web Crawling Procedures
In this study, three types of SNS are used: (1) blogs, (2) Twitter, and (3) a news portal. They were selected because blogs and Twitter share information quickly via their users, and news sources share the entirety of information even after the anomality has occurred (
Table 1). Because of the characteristics of the two SNSs, information is shared quickly on blogs and Twitter. Both SNSs have strengths in rapidity because they can upload data concisely and immediately. Therefore, they can be used to recognize real-time water quality accidents. In the case of the news portal, although it is less rapid than the other two SNSs, it not only delivers accurate information but also include integrated information such as the causes of water accidents and the measures taken to deal with the water accidents. As a larger amount of data is collected compared to the two SNSs presented above, attention should be paid to improving the accuracy of search results by processing the disused words.
Different web crawling procedures were established according to the characteristics analyzed for each SNS. The results are presented in
Table 2. First, it is necessary to select a monitoring area to perform web crawling. Unlike other SNSs, the process of selecting only blogs related to the region is required. Subsequently, a search was performed by combining keywords related to the occurrence of a water quality accident and a monitoring area, and web crawling was performed. By checking the collected unstructured data, the meaning of the data (e.g., damage situation) was analyzed, and the number of collected data points was checked. Finally, based on the results of the meaning analysis and the amount of unstructured data collected, it was determined whether an anomaly occurred. Through the news portal, the progress during the post-accident period was identified and analyzed.
The process of web crawling is automatically performed through software built with Python. Python can efficiently collect unstructured data by setting the selected SNS and provides various unstructured data analysis packages. When the software is operated based on the aforementioned keywords, unstructured data collection is performed, and when related data are found, two indices introduced in the next section are calculated to analyze the association and complete a semantic analysis of the collected data.
4.3. Term Frequency-Inverse Document Frequency
The term frequency-inverse document frequency (TF-IDF) is calculated from the term in the web crawling document. TF-IDF weights keywords by considering their significance in the unstructured data gathered [
61]. Term frequency can then be expressed as
,
, which indicates how often term
appears in document d through the following expression:
Inverse document frequency is an indicator of how often term
appears in the entire document. IDF is expressed as follows:
where
is the total number of documents in the collected unconstructed data, and
is the number of documents that contain term
. Finally, TF-IDF can be calculated as:
Unstructured data searched by keywords automatically perform TF-IDF analysis. This is because unstructured data contain various forms of information. This may indicate the time at which the accident occurred, the symptoms, and that it has been resolved. After completing the TF-IDF analysis, cosine similarity analysis is performed.
4.4. Cosine Similarity
The cosine similarity is an index that quantifies the similarity between two vectors; the more parallel the directions of the two vectors, the more similar they are, and the closer they are to the right angle, the less similar they are. Therefore, as the two vectors have the same direction, the index becomes closer to one and zero at a right angle. If the directions of the two vectors are opposite to each other, then the index becomes −1. It is possible to construct a matrix containing words collected from the collected documents and keyword sets and build a vector through this. The similarity between two different vectors can be expressed by (4):
The unstructured data collected are searched based on keywords. By analyzing the keywords and the words used around them through TF-IDF, the meaning of the unstructured data collected is analyzed. The meaning of unstructured data can be quantified through an index called cosine similarity. It is possible to provide a basis for determining whether an actual accident occurred through the number of collected data and the similarity of cosine.
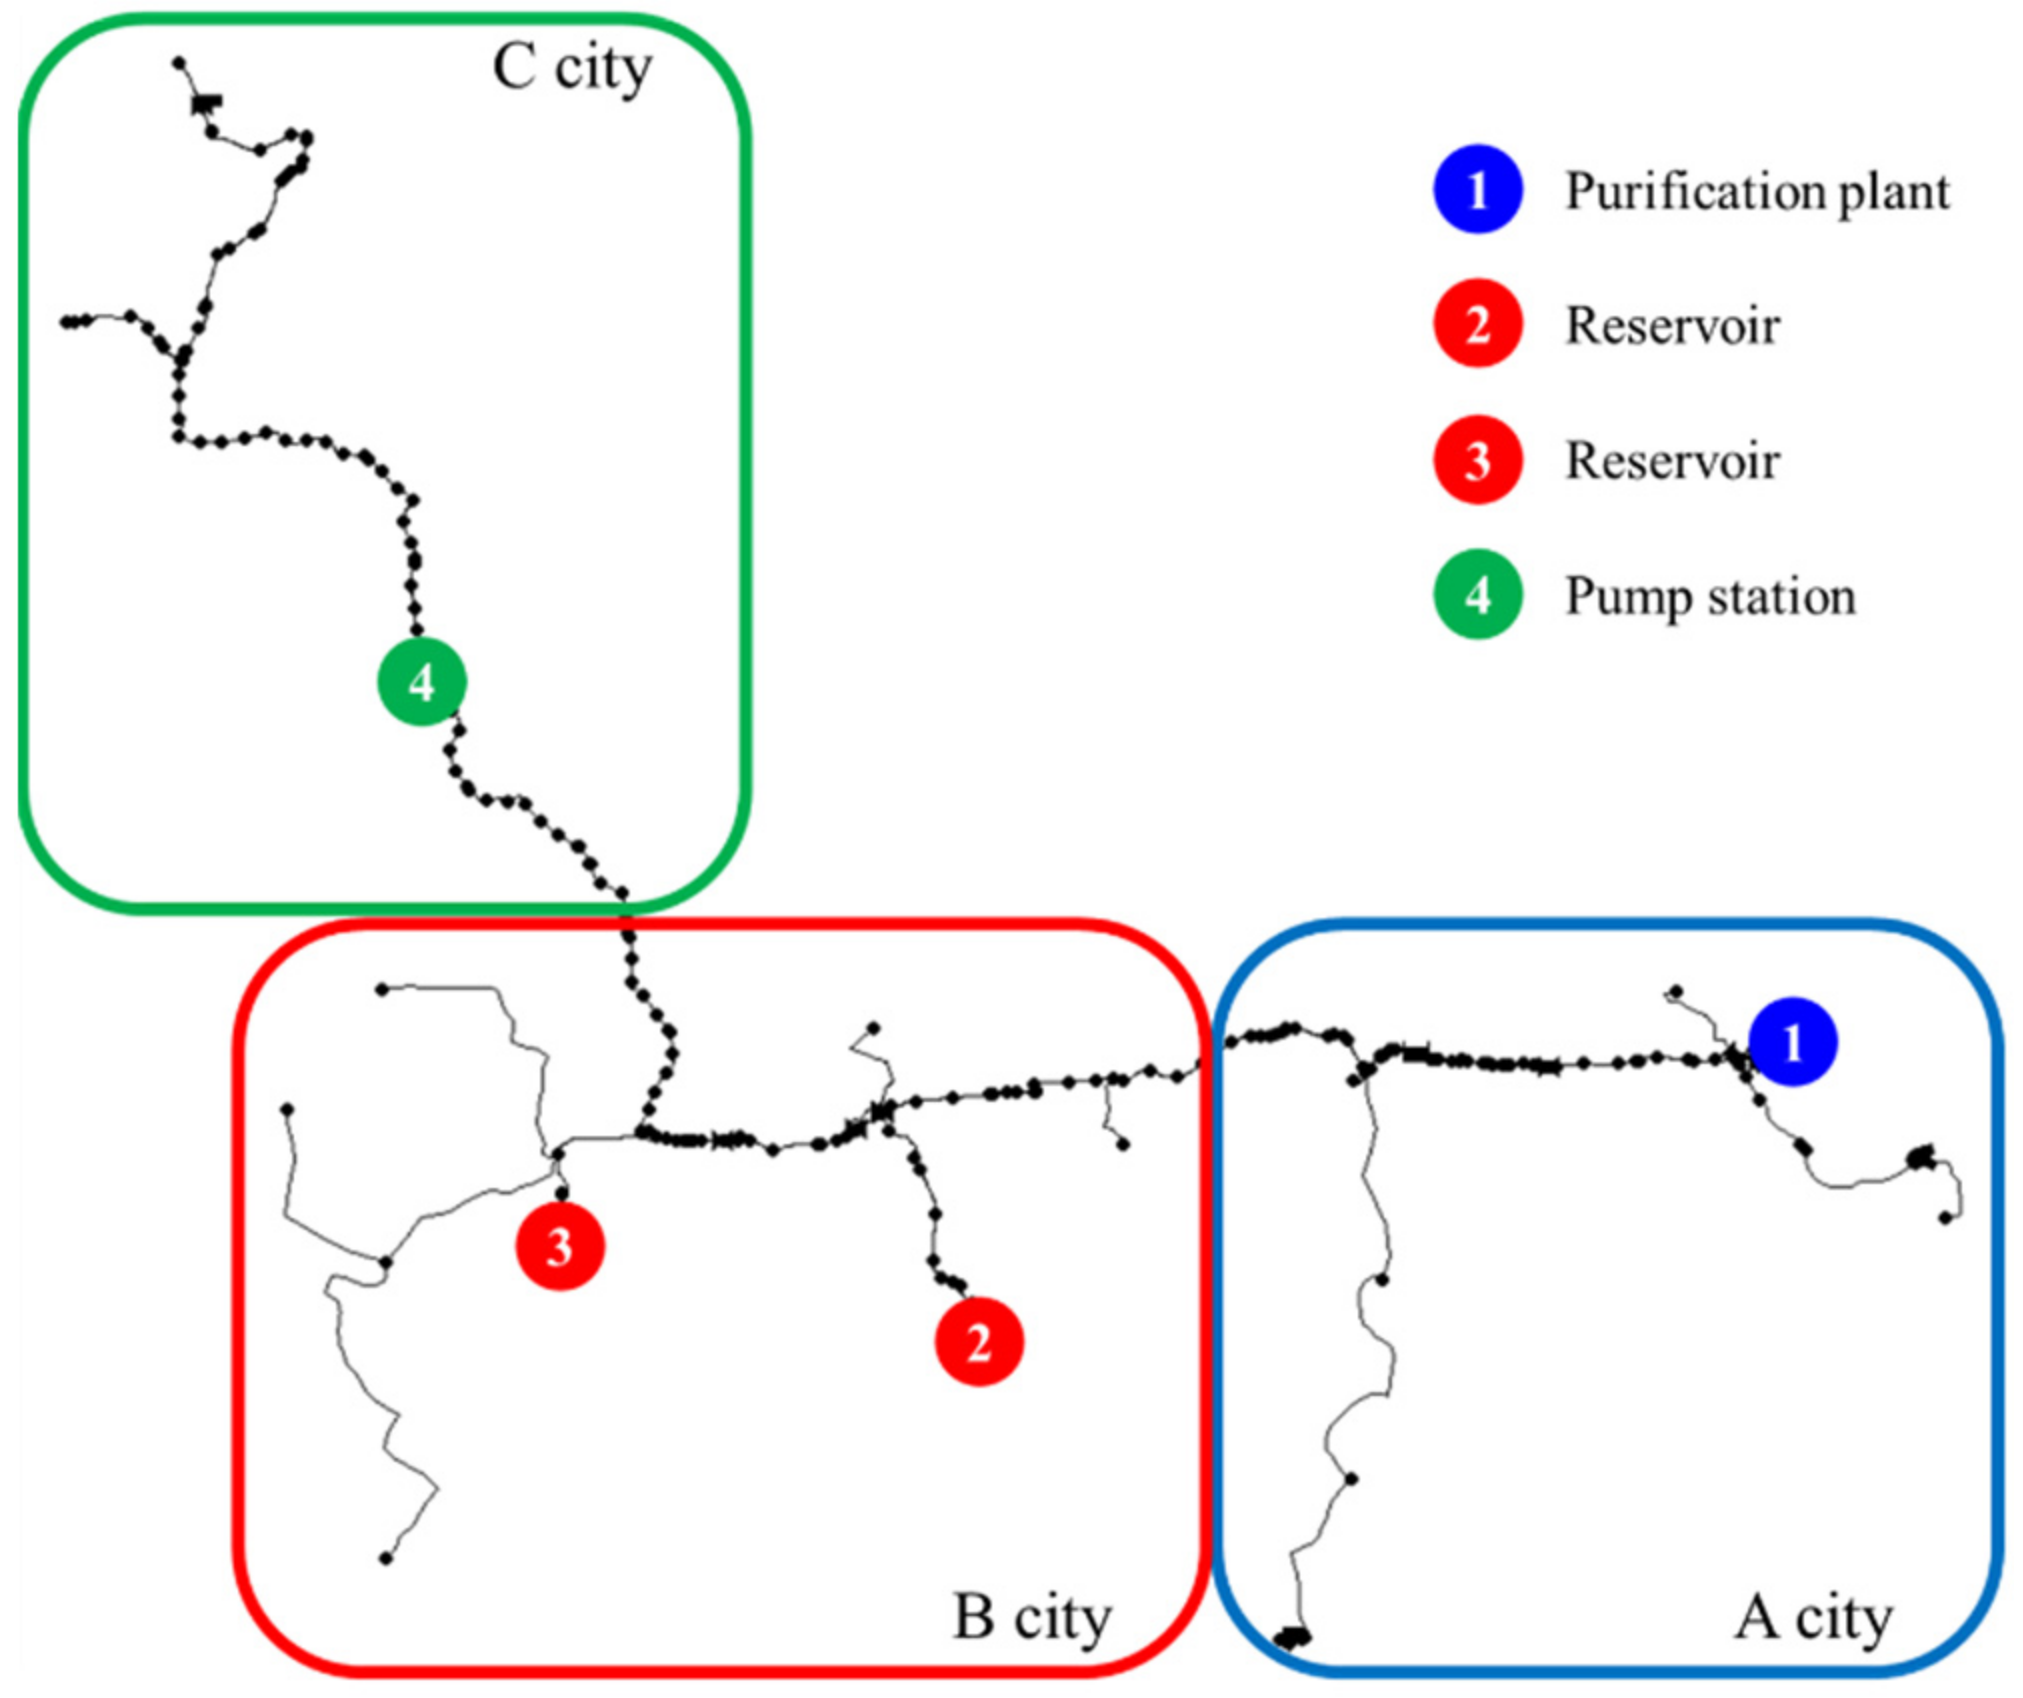
5. Study Network
The proposed water quality event detection and diagnosis framework by integrating structured and unstructured data was applied to a WDS located in South Korea. This study network supplies water to the cities B and C from the water purification plant of city A. The populations of cities A, B, and C are 62,600, 116,700, and 83,300, respectively, with areas of 787.01 km
2, 608.45 km
2, and 866.1 km
2, respectively. The daily average system flow rate from the source is 72,232 m
3/day, and the total pipe length is 166,973 km. As shown in
Figure 3, several types of hydraulic measurements, such as flow, pressure, turbidity, and pH, are collected from four smart meters. Meter 1, located in City A, is installed at the water purification plant. Meters 2 and 3, located in City B, are reservoirs before being supplied to the end-users in City B. Finally, Meter 4, located in C City C, supplies water with a stable pressure to the end of the WDS with a pump. Turbidity measurements were made at four points from 1 October to 31 December 2021, at 1-min intervals and were used in this study.
Discoloration, one of the water quality events that often occurs in WDSs, had occurred in City B. A hole has occurred in the pipe, and soil and clay were introduced into the pipe. Undissolved substances caused water quality problems. The size of discoloration can be measured using the apparent color or turbidity. The apparent color was determined in the original water sample without filtration or centrifugation and by the color resulting from dissolved and undissolved suspensions. The undissolved suspensions of colloids of mineral or organic origin in the water are what cause turbidity. These are most frequently clay, sand, plant particles, precipitated compounds of iron, manganese, or calcium. Hydraulic disturbance in WDSs (e.g., rezoning exercises, burst pipes, increases in peak demand, etc.) is the main reason for discoloration in WDSs [
62]. A water treatment plant exists to prevent various water quality event in WDSs, but when substances enter the pipe after water treatment plants, end-users see increased turbidity and changes in the color of the water, which is called discoloration. Many studies have shown that water quality events have been called discoloration by end-users [
63,
64,
65,
66,
67,
68] and turbidity is used as an indicator of water quality event size. Turbidity was employed in this study as a value to represent the magnitude of a simulated water quality event.
The ratios of outliers and missing data for four points are listed in
Table 2. At Points 1, 2, and 3, missing data accounted for an average ratio of around 1.3 percent, but in other places, an insignificant degree of missing data occurred at about 14.45 percent.
All of the data at each point followed a beta distribution verified by comparing the data’s normal distribution, beta distribution, and log-normal distribution.
This study generated 30 types of water quality event cases to analyze the effects of various water quality accident situations. Randomly generated water quality events were classified differently according to the magnitude of water quality event cases and the duration of the water quality event. When a water quality event occurs in drinking WDSs, the measured turbidity value increases, and the increased value is considered as the magnitude of water quality events. The magnitude of the water quality event was changed by adding 0.01, 0.02, 0.03, 0.05, 0.07, and 0.10 NTU to the measured turbidity values at the time of the water quality event, and the duration was set to 1, 3, 5, 7, and 10 h. Water quality events were simulated such that the previous accident end time and the subsequent accident start time did not overlap within the measurement period. Two hundred simulations were performed per water quality event type, and the detection performance was quantified for detection using structured data.
In this study, unstructured data in text format and written in Korean were collected from the three selected SNSs. The detection result was analyzed by reviewing the web crawling results of past water quality events and deriving the amount of data and cosine similarity of documents collected from the selected SNSs.
6. Application Results
All of the past structured data measured at the four points of the study network were measured in normal situations. Therefore, to perform anomaly detection, an anomaly was simulated, as mentioned above. In addition, a time-lag correlation was performed by analyzing the simulation results using EPANET, which measured the flow rate and the water level data to determine the spread of the damage and the corresponding time. In this study, a water quality event occurred at Point 1, and damage spread to Points 2, 3, and 4 was simulated. The detection performance was quantified using the detection probability (DP) and rate of false alarm (RF) used in [
27].
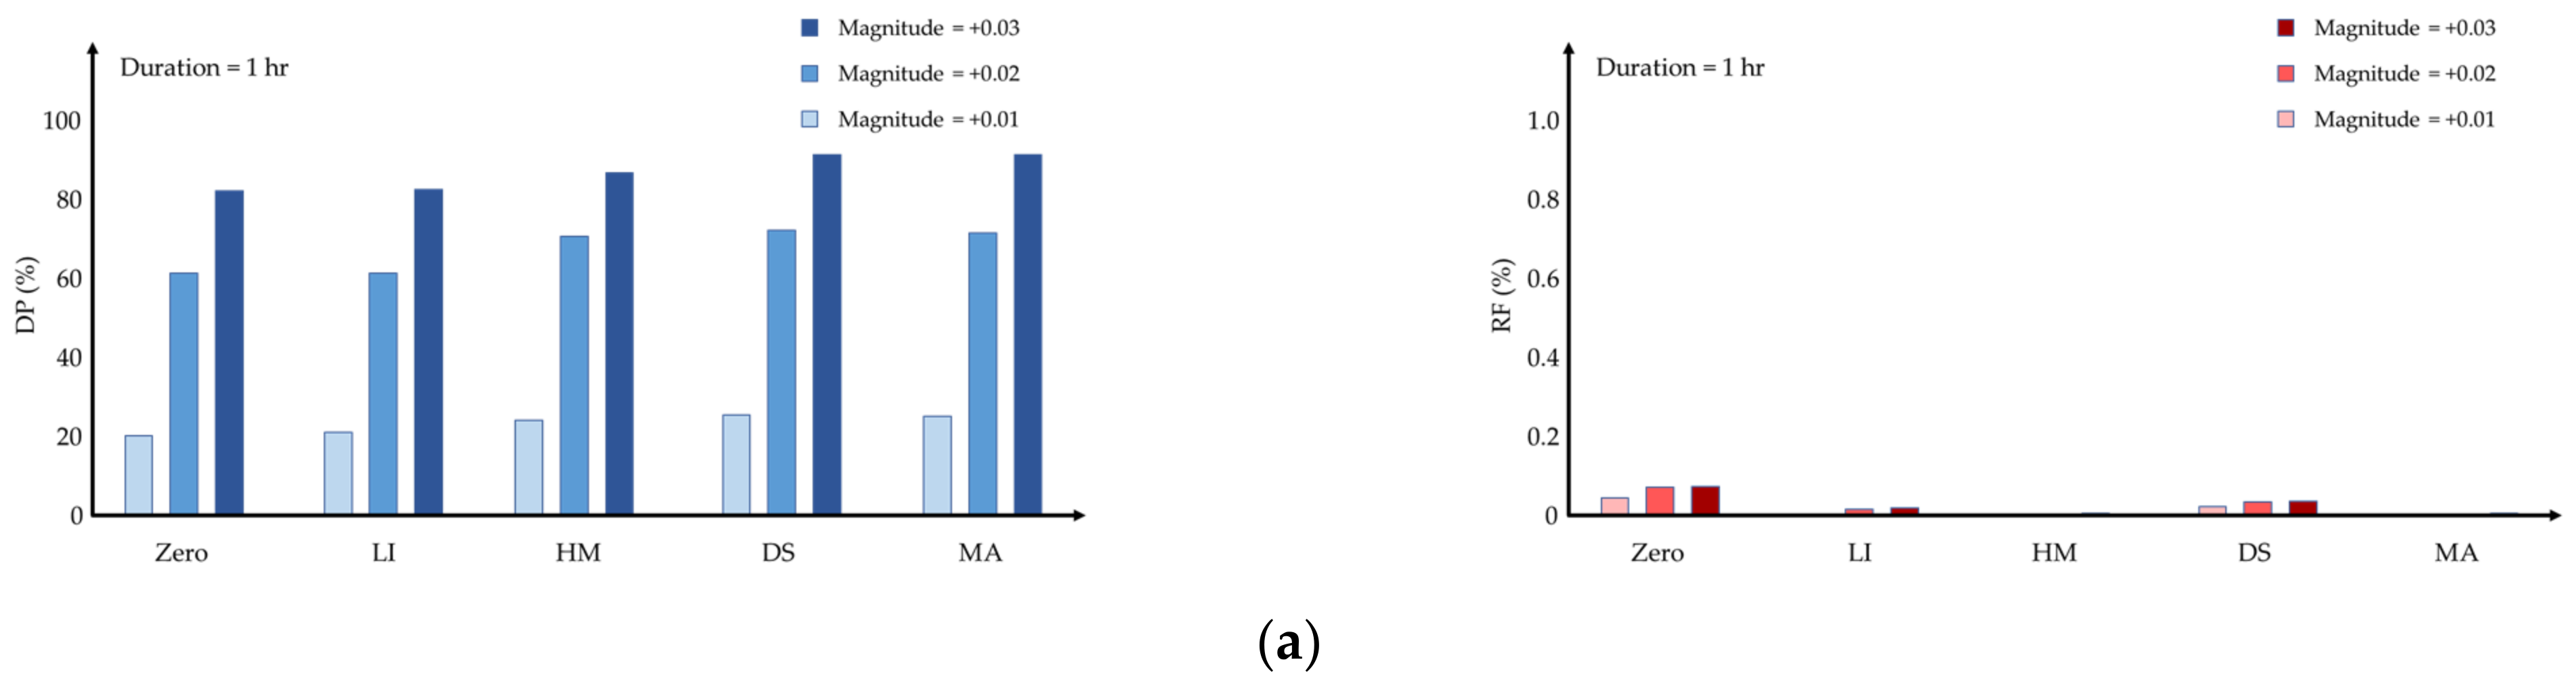
6.1. Detection Results Using Structured Data
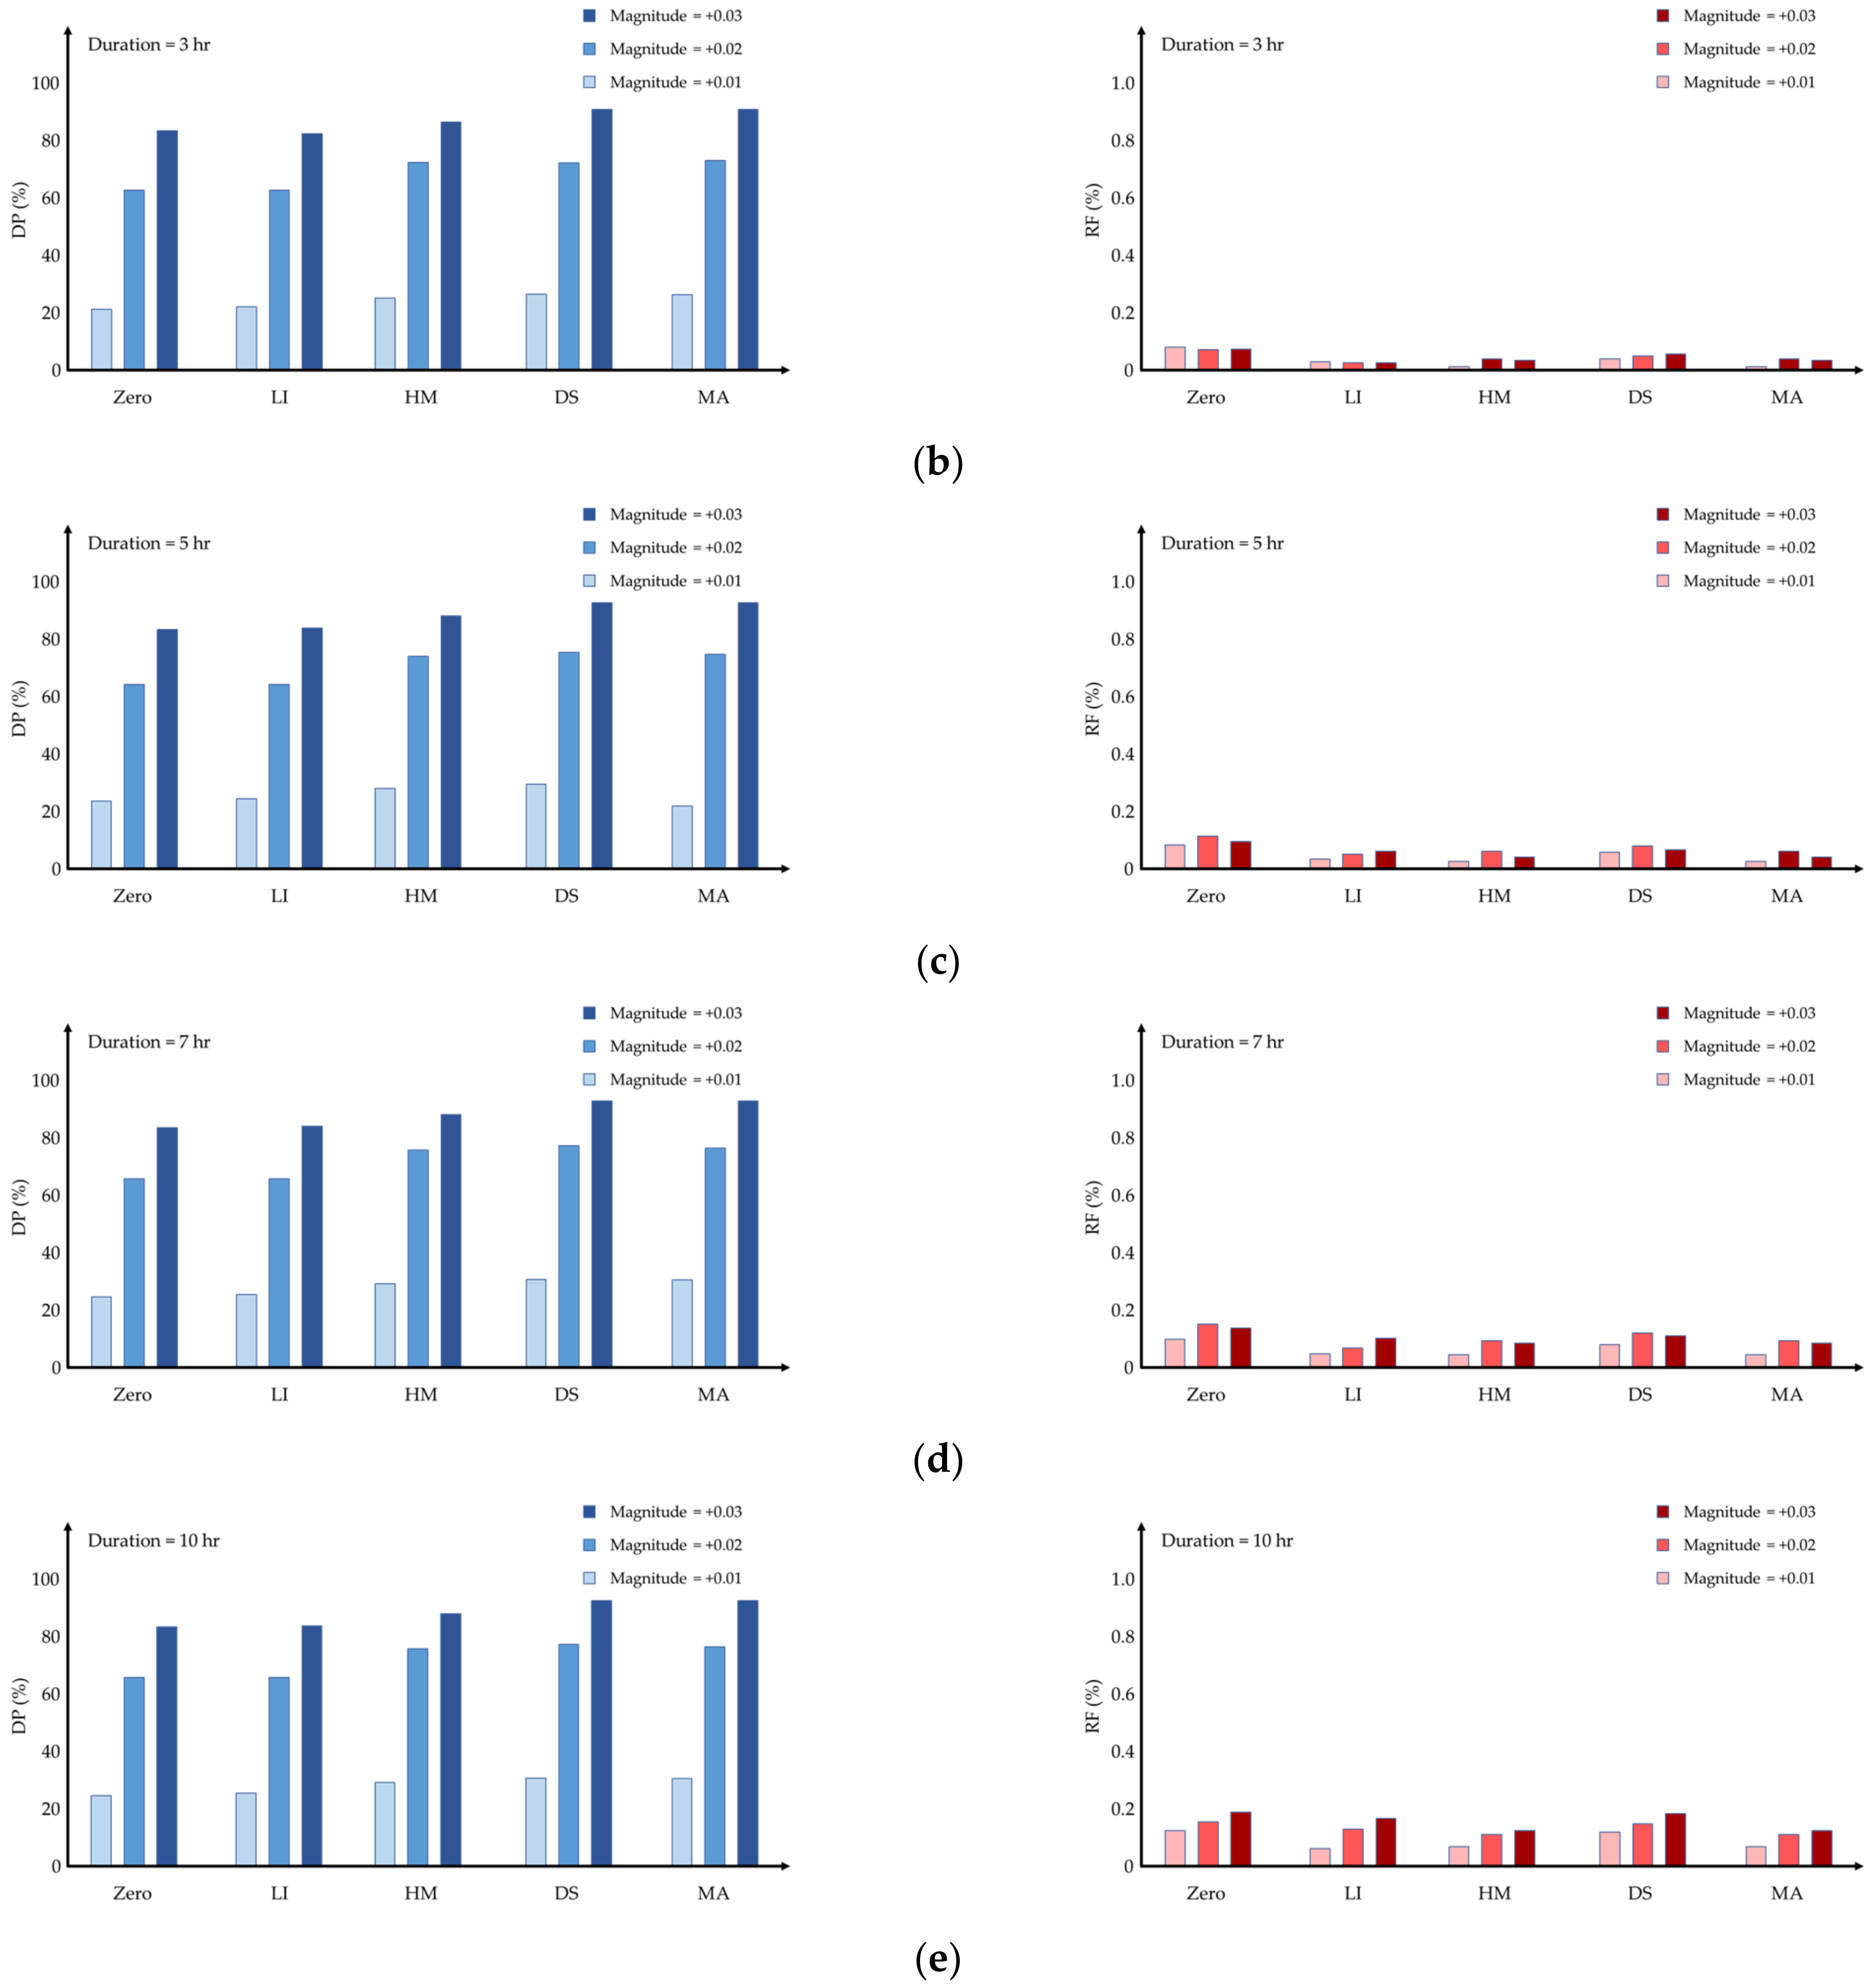
Figure 4 shows the detection performance according to the imputation methods when water quality events occur 200 times. Only using MA with the threshold method was shown for anomaly detection results as the WEC rule showed poor performance.
Table 3 shows the average detection performance of the two detection methods. The DP of the WEC rule was low for all imputation methods except for zero. Since the replaced data using the zero method were detected as anomalies, the DP of the WEC rule is higher than the MA with threshold.
If the magnitude of the water quality event was simulated by adding more than 0.05 NTU, the DP was 100% for every imputation method and SPC method. Therefore,
Figure 4 shows the result of a small increase in magnitude and displays the average values of DP and RF calculated at four metering points.
6.2. Detection Results Using Unstructured Data
If a large magnitude of water quality events occurs, anomaly detection is possible by analyzing structured data. This is because the abnormal data measures a value that is much higher than the rule or threshold. As a result, it can be easily detected. However, if the magnitude of increased turbidity due to a water quality event was measured lower than or near to the threshold, such as in
Figure 4, detection methods using structured data would not be able to detect all of the anomalies [
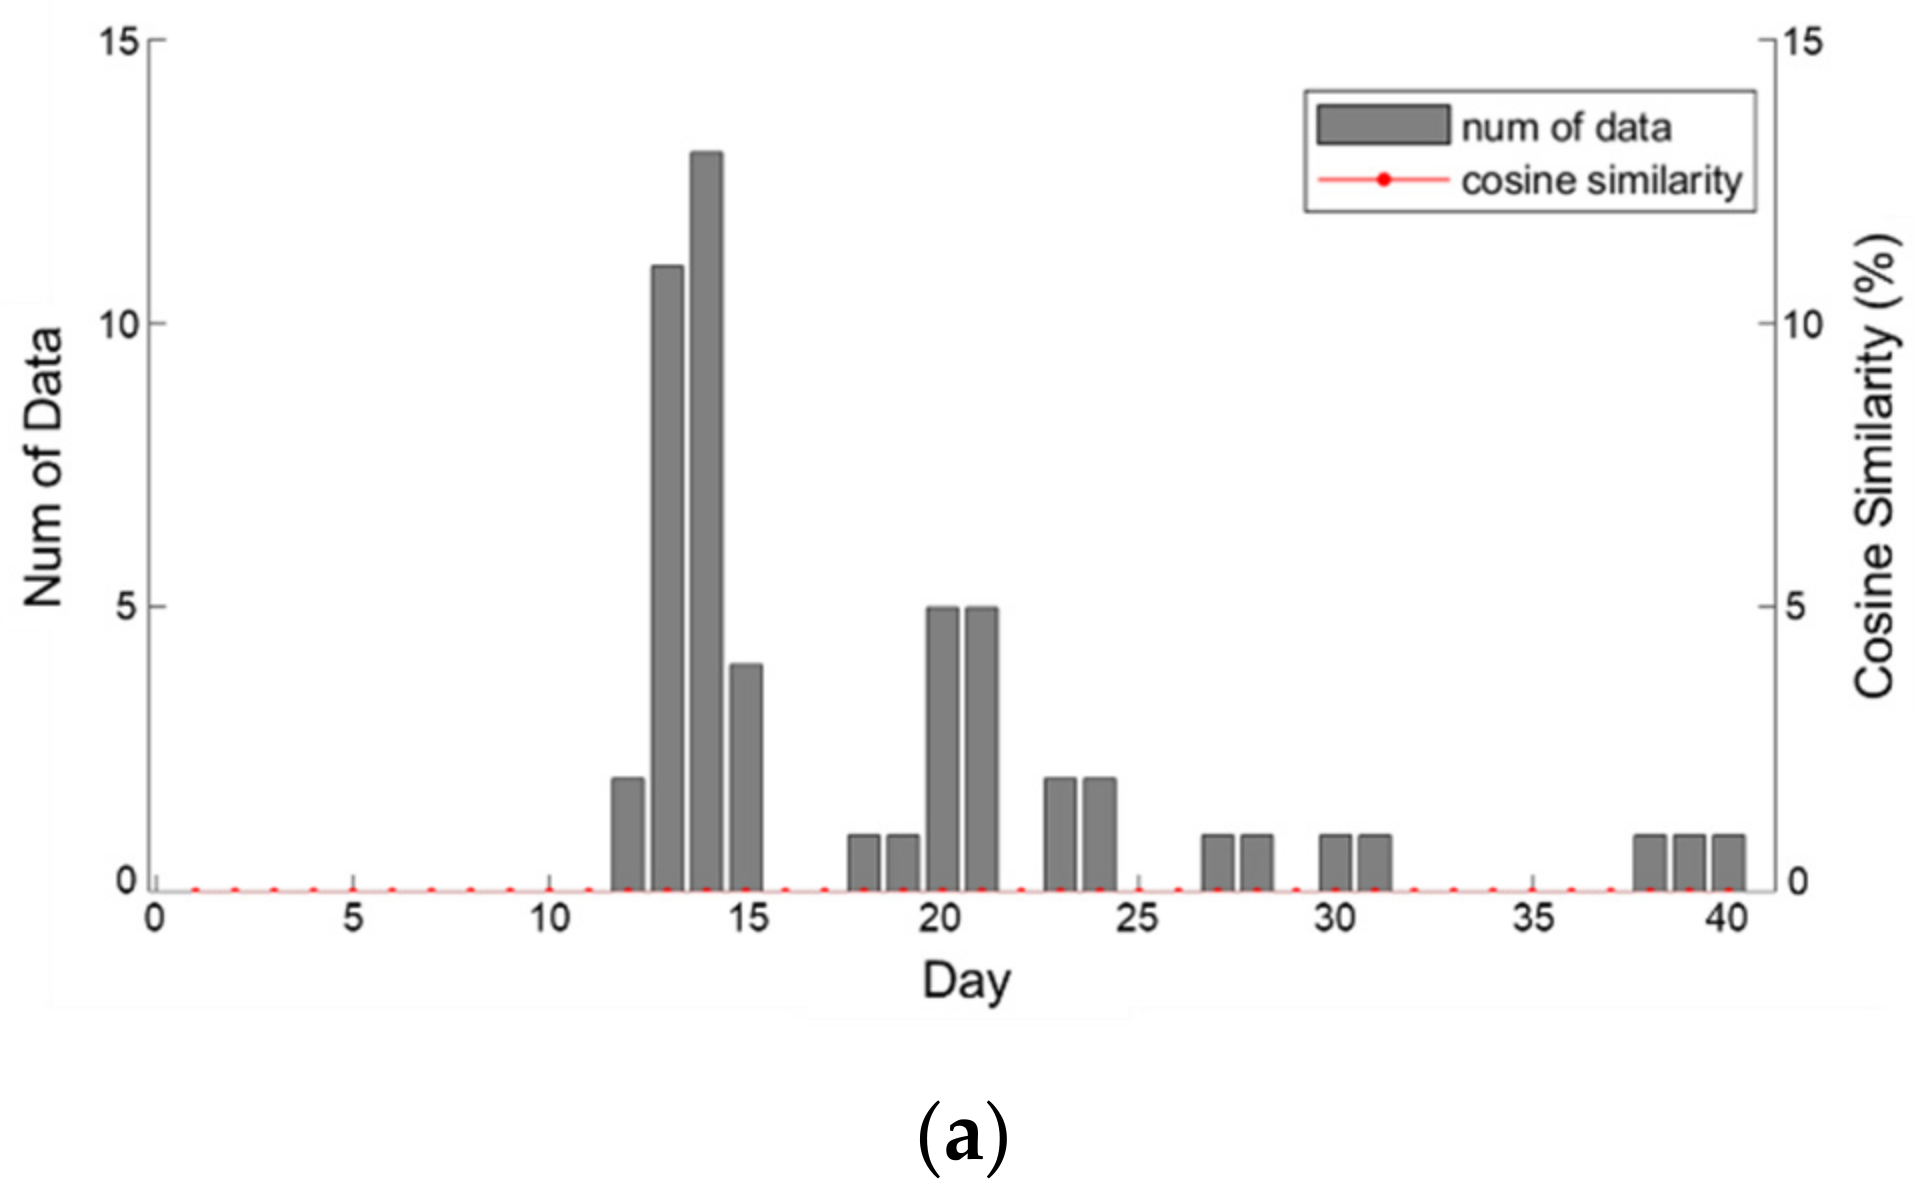
32]. In that case, unstructured data are used for anomaly detection. A water quality event was observed on day 10 of
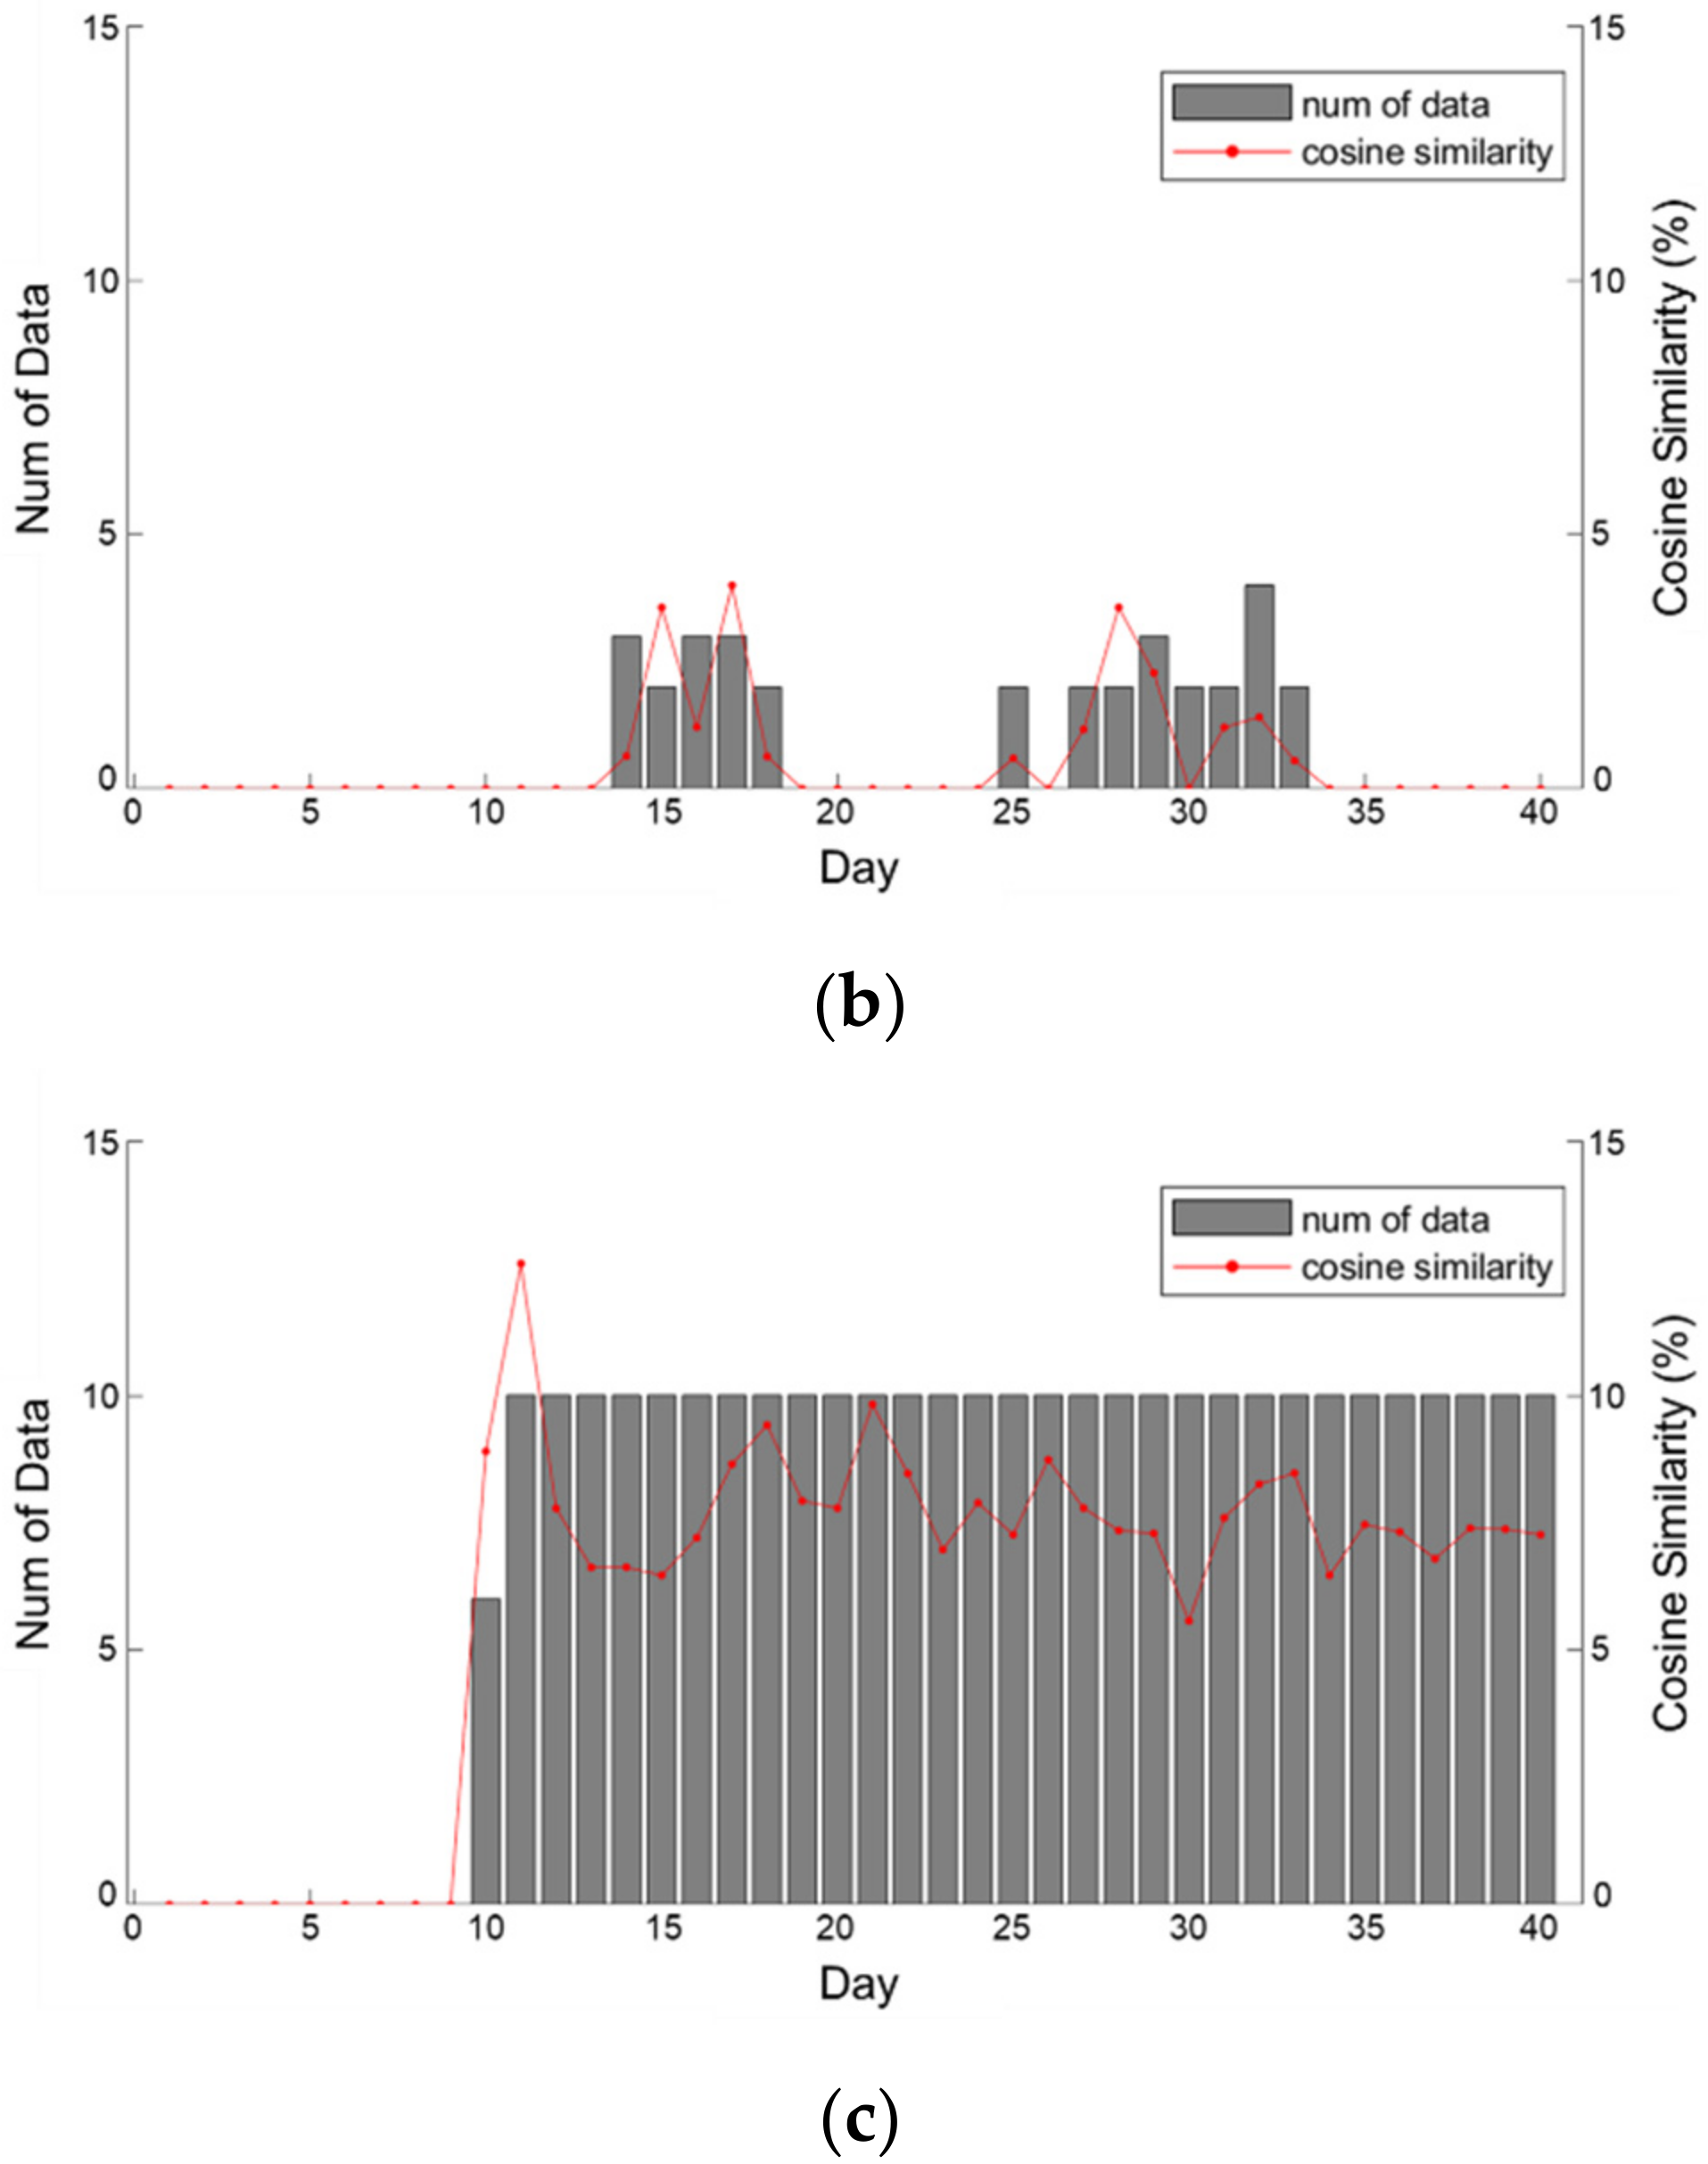
Figure 5 and it shows the amount of data collected for each SNS for a total of 40 days including before and after the accident and the cosine similarity. Data collected from blogs and Twitter plunged within a short period after a temporary surge in the amount of data only immediately after the accident, but news sources could confirm that the data were steadily collected. Owing to cosine similarity, all of the values were 0 in the section.
Before the occurrence of a water quality accident all types of SNS did not collect data. In the blogs results, the keyword was searched, but all of the cosine similarities were zero, and there was no significant correlation. Twitter data showed a low similarity of 0.64% when they began to be collected; however, the similarity increased to 3.99% as the damage to end-users became clear. Moreover, although more data were collected on days 25–34, the cosine similarity slightly decreased. On the other hand, in the case of the data collected through the news portal, the cosine similarity is higher than that of blogs and Twitter. The average cosine similarity of the news portal from day 10 to day 40, when the data began to be collected, was 7.79%, which was high compared to the other SNSs.
In terms of accident recognition, blog posts exploded after the date of the accident, while Twitter posts occurred approximately three to four days later. In the case of blogs, accident information can be spread rapidly through blogs that actively shares information between citizens living in the target area. This indicates that they can be used to gather data about the early detection and spread of accidents through the web crawling of local and regional blogs. In the case of Twitter, personal activities and characteristics representing personal opinions can be confirmed through the results shown in
Figure 5b. Thus, the news portal is appropriate for checking the continuity and degree of regional distribution of accidents.
These results were shown because a large amount of unstructured data could be utilized. If the characteristics of the SNSs were identified, monitored, and analyzed, it could have been confirmed that the number of damaged cases increased immediately after the water quality event occurred. The increase in the damaged cases could be determined by the amount of data collected and the increasing cosine similarity. Using the proposed framework that integrates structured and unstructured data, the water quality event can be detected more quickly and accurately than when the anomaly detection fails using only the structured data.
7. Conclusions
Various structured data based WDS anomaly detection approaches have been developed. However, they may fail to detect many water quality events due to data acquisition problems such as metering malfunctions. A clear next step is to use both structured and unstructured data for detection. However, no previous work has developed a tool that uses both data types. Thus, this study proposed an integrated framework that utilizes both structured and unstructured data for water quality event detection. Several findings are derived from the results.
First, detection performance within structured data only was evaluated. By comparing two SPC methods, modified WEC and MA with threshold, the latter resulted in better detection performance. It provided lower RF and higher DP than the former. Furthermore, replacing data with moving averages best represented the data characteristics. Thus, when structured data are used for detection, MA should be applied.
When unstructured data are used, an appropriate web crawling process is applied according to the characteristics of the SNSs. In the case of blogs and Twitter, real-time registration was possible with fast information acquisition from customers’ uploaded content. For the two SNSs, the amount of collected unstructured data increased rapidly in the time after the accident occurred. However, these SNSs showed that data collection significantly decreased after the anomaly’s occurrence while the data collected from the news portal increased steadily with the event. Using news from the news portal, useful information about the occurrence of water quality events was obtained actively after the event which can aid future the operation and management of WDSs.
Lastly, two scenarios are tested in this study: one scenario that detects events using only structured data; and the other scenario that detects events using only unstructured data. Each scenario can be used complementarily depending on the condition of the WDS. When the structured data were identified to be abnormal through the smart meter, the anomaly detection was performed using the structured data. If the abnormal data were judged to be normal, the unstructured data analysis could be performed. Real data collected in the past are applied in a real-time manner to evaluate the proposed framework. The results have demonstrated that using both data types improved the detection results. As these data sets can compensate each other in case of any failure on either side (two scenarios), the redundancy of the proposed detection framework should be secured.
This study has several limitations and future studies should be performed. The detection and diagnostic performance of the proposed framework could be improved by reducing the uncertainty of unstructured data. As unstructured data are generated by humans, human error exists. To reduce these errors, any future work should consider the settings for keywords and stopwords based on the words that people generally use in SNSs. After minimizing the uncertainties that exist in the data, the proposed framework should be applied to other types of water quality events such as chlorine, pH, and hard water.


 ,
, 


