1. Introduction
The spraying of liquids is a phenomenon that occurs in the world around us, both naturally in nature and due to human activities. The subject of spraying is very willingly undertaken and researched, as evidenced by numerous publications. It is worth emphasizing that the general theory of spraying has still not been developed, which is due to the complexity of the process and the variety of design solutions. The spraying process, as previously mentioned, is a complex and complicated process. It involves the transformation of a stream of liquid into smaller drops. For this purpose, forces are used, which depend on the used construction of the atomizer. These forces allow surface tension to be overcome, thanks to which the surface of the liquid increases in relation to its volume, which in turn results in the improvement of heat exchange and mass transfer processes. This work focuses on two-phase spraying. For the purpose of research, the continuous phase of our system is air (gas), while the dispersed phase is water (liquid). The difference between single-phase and two-phase flows includes, among others, the effect of influences on the fluid. In single-phase systems, external influences are the most important. In the case of two-phase flows, the fluid is not only affected by external influences, but also by internal influences that occur at the phase boundaries. These interactions are variable with regard to both place and time. They can change the speed, temperature, and pressure of a given outflow. An additional difference between single and two-phase flows is that the velocity of these phases can change according to the direction of the flow, which leads to a change in density.
One of the key issues in the spraying process is the generation of dry fog and the wettability of the surface being sprayed. A measure of the wettability of a surface is the angle of wettability θ, also known as the contact angle or the boundary angle. It defines the angle between the wetted surface and the tangent to the surface of a liquid droplet, which is drawn from the point of contact with the surface of a solid body [
1]. In theory, the contact angle θ = 0° imitates the state in which the liquid perfectly covers the surface, and full wettability occurs. The angle θ = 180° is assigned to non-wettability. The angle 0° < θ < 180° is the stage between different degrees of wettability of a solid’s surface. It is usually assumed that the contact angle varies in relation to the size of a droplet. Over the years, numerous researchers have studied, and tried to elucidate, this relationship. Most of them reported that the contact angle decreases with an increase in the size of a droplet [
2,
3]. Another explanation of the relationship between the droplet size and contact angle is the surface inhomogeneity effect [
4,
5]. Rodríguez-Valverde et al. [
5] explained that the volume of a droplet placed on a rough surface is greater than that placed on a smooth surface. The author also determined that roughness increases the contact angle if this angle is greater than 90°, and reduces this angle if it is less than 90°. Almost all the reported results in the literature, concerning the contact angle with regards to the size of a droplet, referred to droplets measured on smooth, flat, and homogeneous surfaces such as Teflon [
6,
7] and two fluoropolymer surfaces AF 1600 and EGC-1700 [
8], mica surfaces (coated with a fluoro compound (FC 721) and the following five liquids: decane, dodecane, methyl salicylate, ethylene glycol, and glycerol) [
9], a self-assembled monolayer (SAM) surface of 1-octadecanethiol (HS(CH2)17CH3) on gold [
10,
11], metal [
12], electrospun submicron fiber mats [
13] and FC725 coated hydrophobic glass [
14]. This work, in its assumptions, includes the use of a glass surface covered with oil, and therefore the results and dependencies from the available literature should be analyzed while taking into account this criterion. It is worth noting that in work [
15] noticed an analysis of the contact angle according to the nature and structure of the substrate, and also the size of the drops. The composite interfaces used in the research were made of materials with different natures and spatial structures (smooth, rough, homogeneous, and heterogeneous surfaces). This work shows that the contact angle can vary with the drop volume according to a power law.
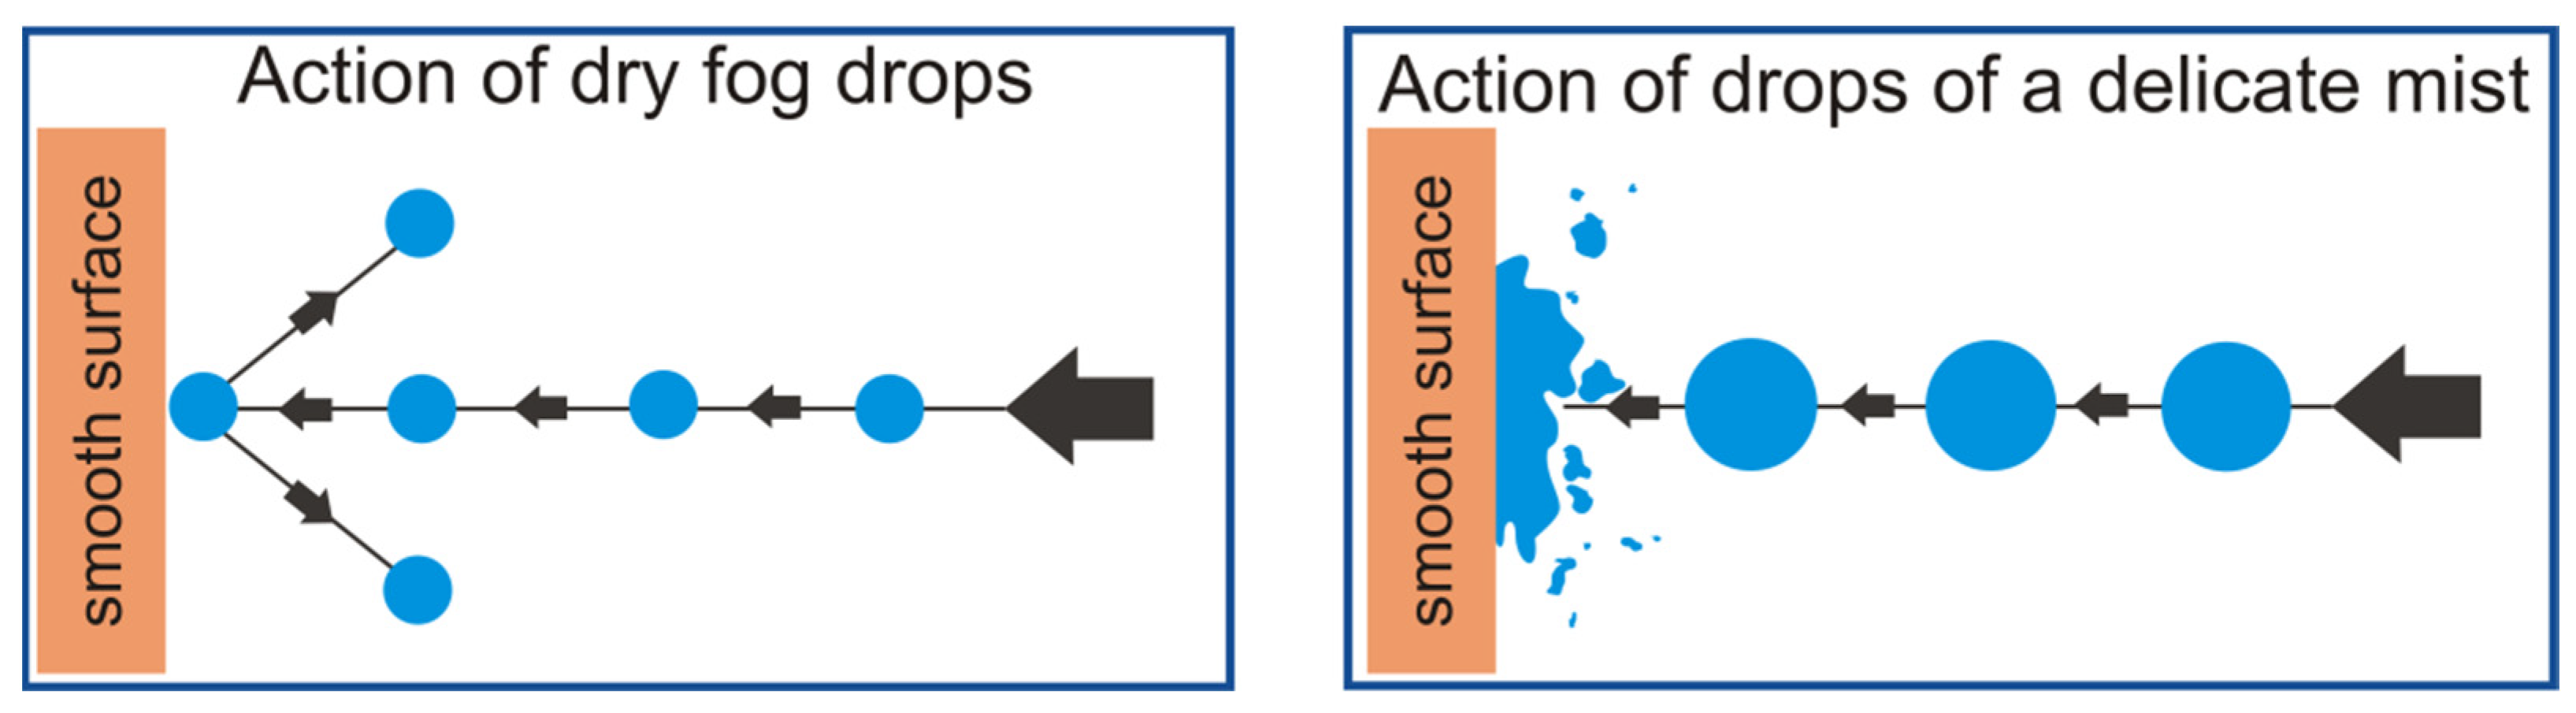
Reducing the diameter of nebulized liquid droplets can then lead to a situation where geometric parameters will cause the surface tension of a droplet to be so big that internal forces will not allow for a contact angle of less than 180° to be created. Such a situation describes a state in which the droplet does not wet a given surface but will bounce off it. The situation described above is presented in
Figure 1.
Unlike wet fog, the tiniest particles of dry fog do not settle on surfaces immediately, and instead, act more like a gas filling a space. Additionally, dry fog disperses widely and does not wet the surfaces it comes into contact with, hence its name—“dry fog”. Research that expands knowledge on the production of very fine droplet aerosols is an extremely important aspect of the scientific world. Devices designed for this purpose must be accurate and refined. Dry fog must not be used in conditions where the surface cannot be wetted unconditionally, such as when working with electrical devices, and yet this is the case. Such an eventuality may occur when the operating conditions, or the structure of the device itself, were not properly designed. As a result, in the created aerosol there is a certain percentage of larger droplets, the surface tension of which is not sufficient to maintain their structure. The phenomenon of coalescence may also be unfavorable in this case. Research should take into account its impact in order to mitigate it.
Pneumatic nebulizers are an example of devices that can efficiently produce dry fog [
16,
17]. A nebulizer should be understood as the entire system, which also includes a source of compressed gas (most often a compressor) and a spray head in which the liquid is placed [
18]. The spray head and the compressor are connected to each other by a pressure hose [
19,
20]. The spraying process in jet nebulizers involves the evaporation of water, which in turn causes the spray solution to concentrate, and the liquid to cool down [
19,
21]. In many cases, this adversely affects the application of jet nebulizers, which is why further research in this direction is so important [
17,
21]. Building a system that is capable of producing dry fog, and what is more, one that has its operating conditions controlled is important. Knowledge regarding this matter is still being developed. The last few decades have resulted in the development and design of many new devices with very different geometries [
22,
23]. The size of the droplets that are formed in the process of producing dry fog depends on the cross-section of the nozzle in the head, as well as the gas flow rate, i.e., also its pressure [
24,
25].
Optimization plays a key role in the improvement of any process. Each solution, process, or device must work faster, more efficiently, and with less waste and upfront costs [
26]. Aerosol droplets with an average diameter of fewer than 10 μm can bring many positive aspects to this topic. Dry fog has been used, among other things, to improve air conditioning and air humidification, air disinfection at the particle level, cooling, drying, dust suppression, the prevention of excessive dusting, humidity control without surface wetting, plant and fungus cultivation, and paper production. Dry fogging is a relatively new decontamination technology that uses a liquid disinfectant and compressed air as consumables. The very fine droplet size of the dry fog prevents it from falling easily onto surfaces. Droplets with a diameter of fewer than 10 μm are excellent for disinfecting, as they act on bacteria and viruses at the particle level. The use of dry fog does also not wet the surface in the case of using it with disinfectants, which in turn does not limit the place of its use. An example from real life, without any doubt, is the use of the dry fog production process during the SARS-CoV-2 virus pandemic [
23,
25]. The demand for disinfectants has increased dramatically. In many cases, the use of decontamination apparatus was the only solution to maintain sterility and reduce the risk of virus transmission. The process of creating dry fog, which uses a liquid disinfectant, enables a homogeneous mixture of air particles and disinfectant to be obtained. Droplets of disinfectant come into contact with the virus (that is still in the air) before its particles hit the surfaces that are most often touched by humans. Research has also shown that virus particles are able to stay in the air for long periods of time, as well as travel long distances. This fact alone gives an advantage in the fight against the virus. It has been estimated that a single cough or sneeze can release 100,000 micrometric droplets into the environment. The use of dry fog with a similar diameter of droplets significantly reduces the risk of the virus spreading, and thus reduces the possibility of infection. There is also one more benefit of using dry fog in this case, which was mentioned earlier. The use of an aerosol, which consists of very small droplets, perfectly moisturizes the air. Increasing the relative humidity shortens the viability of viruses. Research has shown that 50–70% humidity means that viruses have a much shorter lifetime. Lower humidity values do not have such a positive effect, and it is usually values of around 30% that occur in apartments and offices.
2. Materials and Methods
This paper presents the results of research concerning the process of producing dry fog with the use of a designed pneumatic atomizer. The atomizer had variable parameters of ambient temperature and gas pressure, which were supplied to the nebulizer. An analysis of the sizes of the droplets obtained during the experiment was carried out. The tests took into account changes in pressure, with three different values being taken into consideration. Additionally, a variable was introduced that determined the value of the power that was delivered to the air supply and heating device. These assumptions led to nine different measurement conditions, as shown in
Table 1.
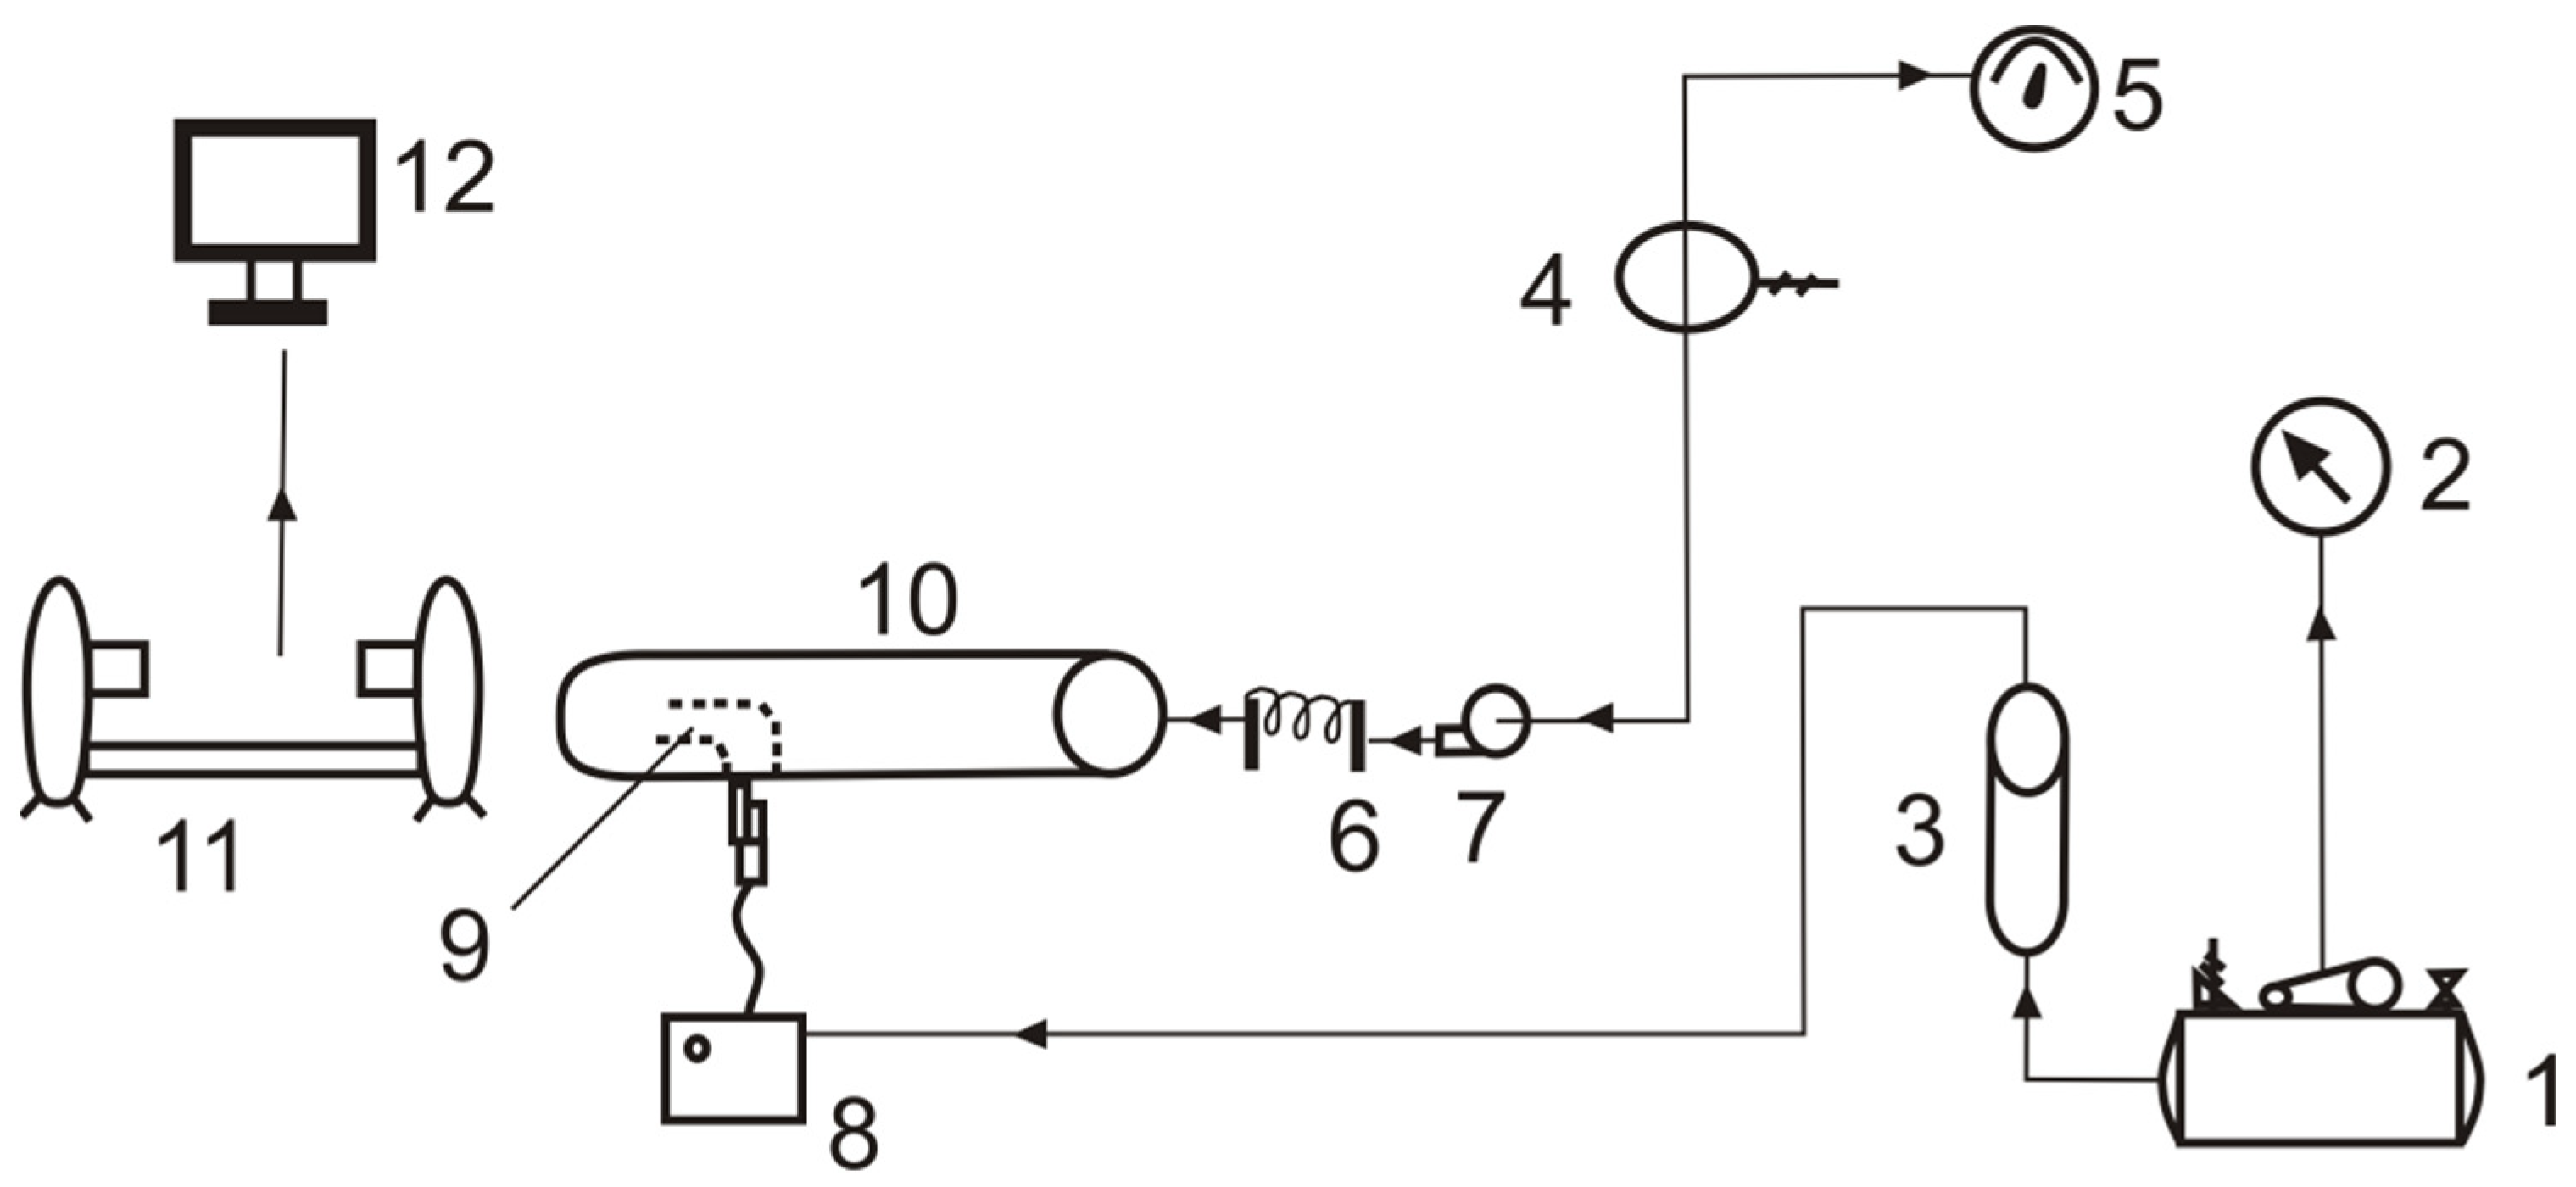
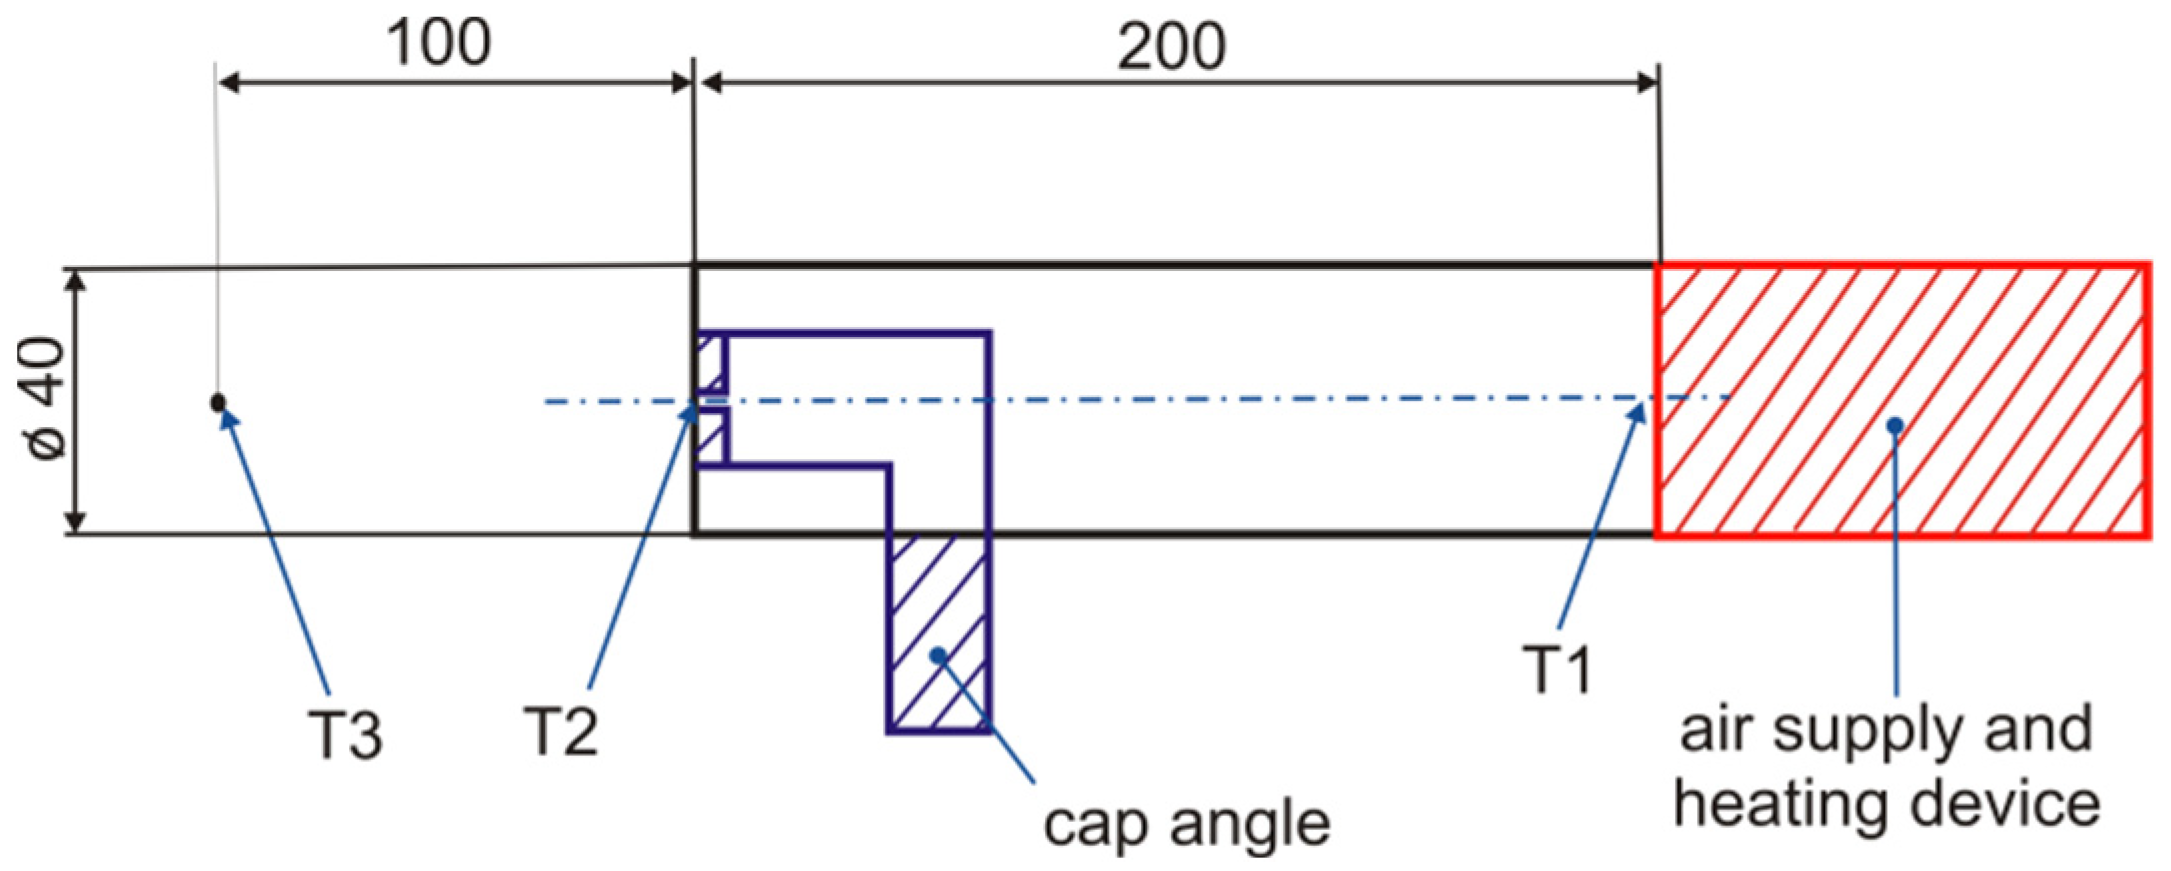
Figure 2 shows the elements of the measurement stand. The compressor allowed the air to be compressed to a pressure of several bars. A built-in reducer and pressure gauge enabled work under specific set air pressure values to be conducted. The rotameter provided information about the flow rate of the gas that was supplied to the jet nebulizer of the MedelJet Family type, which sprayed the liquid located in the spraying head. The stand also allowed for the measuring of temperature at various points. The autotransformer enabled the power of the heating device (with a power of 2 kW) to be adjusted, which could then be read with the use of the attached wattmeter. The temperature was measured using a Center 309 m (accuracy ±0.3% + 1 °C) that had T-type sensors connected to it. The measurements were conducted at three locations: at the heating device’s outlet, at the nebulizer’s outlet, and at a distance of ten centimeters from the nebulizer’s outlet—as shown in
Figure 3. The obtained temperature values are presented in
Table 2. It is also worth emphasizing that the standard spray head of the MedelJet Basic nebulizer was additionally equipped with an elbow fitting (
Figure 3). An element that directs the flow of the aerosol was designed and then printed on a 3D printer. The lack of an elbow fitting causes the sprayed liquid to disperse, and the aerosol to be deposited on the pipe’s walls, which in turn causes inaccurate results.
Figure 3 also shows a narrowing of the outlet, which was meant to additionally accumulate the spray solution. A Metabo Mega 350–100 D reciprocating compressor, which is powered by a three-phase current, was used in the research. Its characteristic features include a maximum pressure of 10 bar, an engine power of 2.2 kW, and a tank capacity of 90 L. The measurement system also included the MCP M10-522-20 autotransformer (with a rated power of 2 kVA), and the GreenBlue GB202 wattmeter (current measurement error ± 1% or 0.01 A; voltage measurement error ± 1%) that enables the measurement time, network voltage, current consumption, and the current load of the socket to be displayed.
McCallion et al. [
27] reported cases of drops in the temperature of aerosol in relation to liquid when using a pneumatic nebulizer. A drop in the temperature value by a few or several degrees Celsius results from the rapid expansion of the gas at the aerosol’s outlet. The temperature has a significant influence on the diameter of the produced droplets, as well as on the total volume of the dispersed liquid [
28,
29]. Pneumatical spraying in nebulizers is also associated with the evaporation of the liquid, which results in the concentration of the liquid used in the process.
In order to determine the nature of the generated aerosol on the basis of the performed tests, the volume distributions of the droplets’ diameters and the equivalent values of the mean droplet diameters were determined. Measurements were made on a specially prepared test stand, in which the main element was an optical unit—the Spraytec particle size analyzer from Malvern Instruments (Malvern, Great Britain). The rate of data acquisition equals 10 kHz and yields size distributions with a 100-microsecond time resolution. For this reason, the analysis of the dynamics of spray atomization and dispersion for devices is very accurate. The Spraytec is equipped with two types of lenses to measure in the size range from 0.1 to 2000 microns, with a dynamic range of greater than 1000:1 being covered by each lens. The accurate measurements by Spraytec can be made at high spray concentrations. In addition, in the specifications from the device manufacturer, we note that the working range is 150 mm at 0.5 microns extending to >1 m above 5 microns, concentration range: minimum acceptable transmission: 5% (dependent on particle size range), and also accuracy: better than +/− 1% on the Dv50 for NIST-traceable latex standards. Laser diffraction uses the Mie theory of light scattering to calculate the particle size distribution, assuming a volume-equivalent sphere model. The Mie theory requires knowledge of the optical properties (refractive index and imaginary component) of both the sample being measured, along with the refractive index of the dispersant. For both, liquid and gas the refractive index can be set. When preparing the Spraytec particle size analyzer for the measurements, a 300 mm lens was selected, which is suitable for use with aerosols with diameters ranging from 0.5 to 600 m. The main stage of the measurement process was the creation of a standard measurement procedure (SOP—Standard Operating Procedure Software by Malvern Instruments). A continuous measurement mode, with a data collection frequency of 1 Hz, was chosen. The measurement time was set at 60 s on the basis of multiple observations of the exemplary measurement, in which 60 s was the time interval that allowed for full stabilization of the measurements and the obtaining of reliable measurement data. In order to maintain the repeatability of the results, the spraying was carried out in a designated place, keeping the distance between the outlet nozzle and the measurement zone constant. Finally, the most important parameters were selected in the appropriate Spraytec PC software, the values of which were estimated and compared in order to fully characterize the generated dry fog. The measurements were repeated 10 times.
3. Results
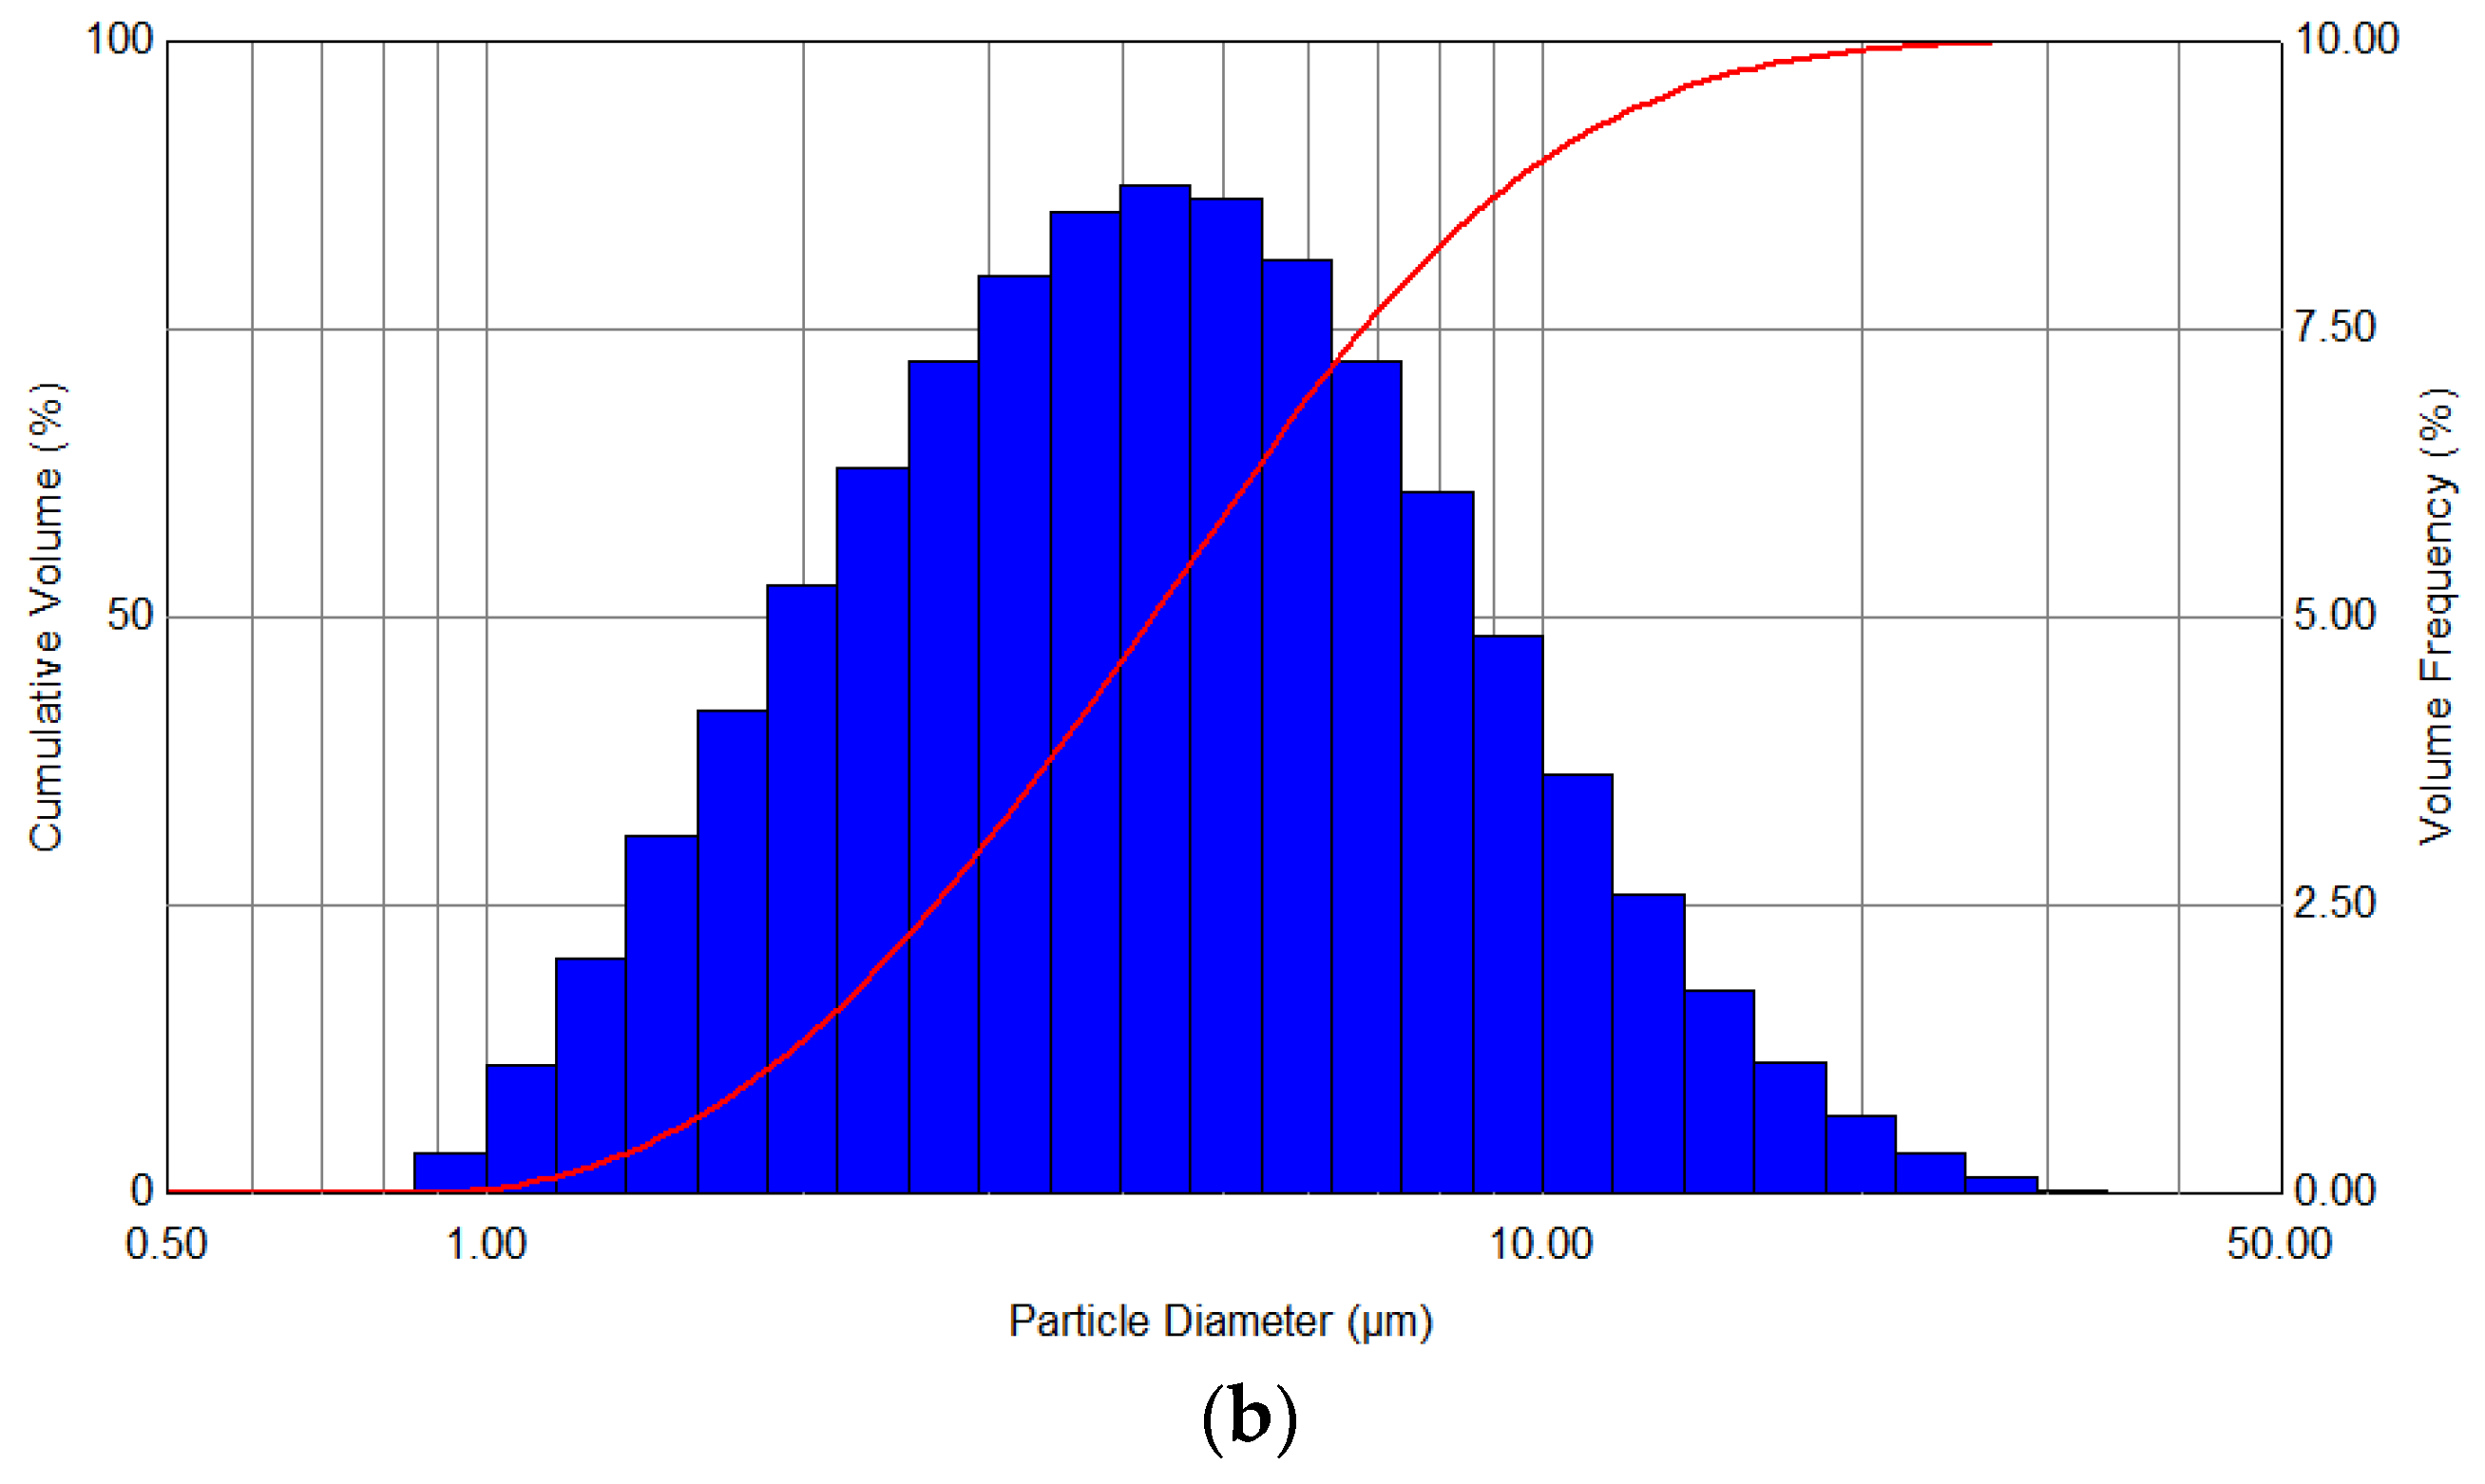
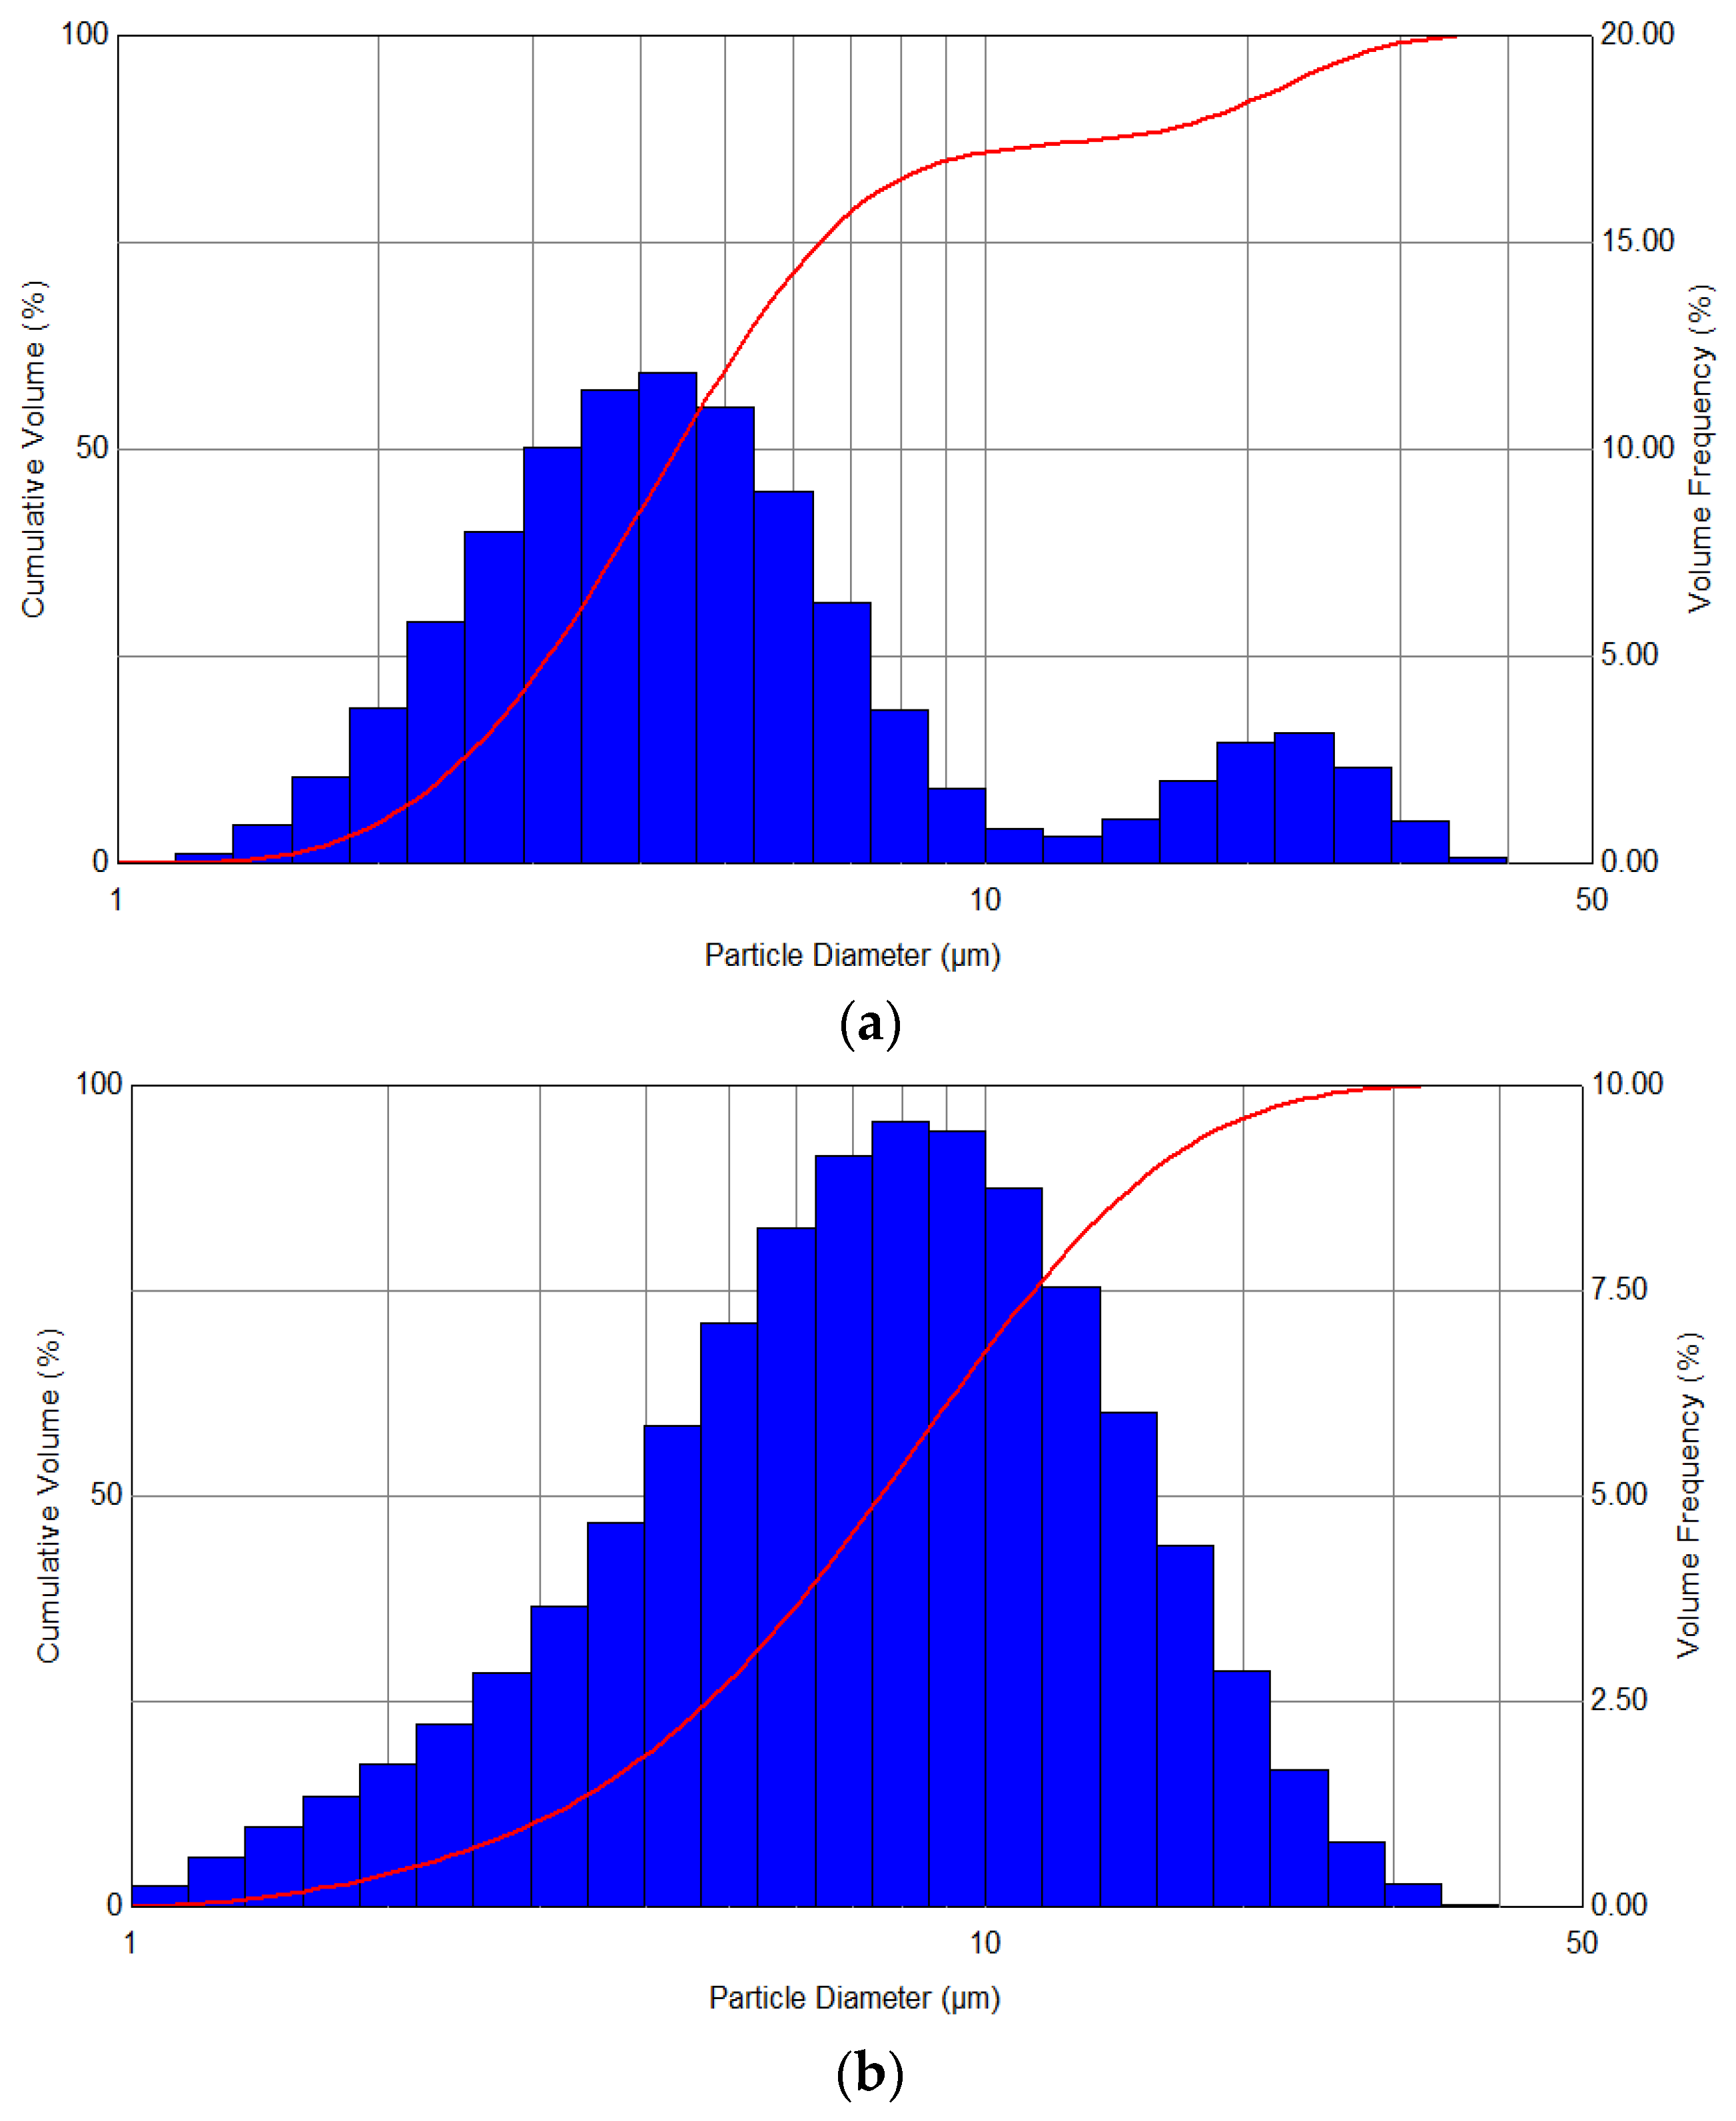
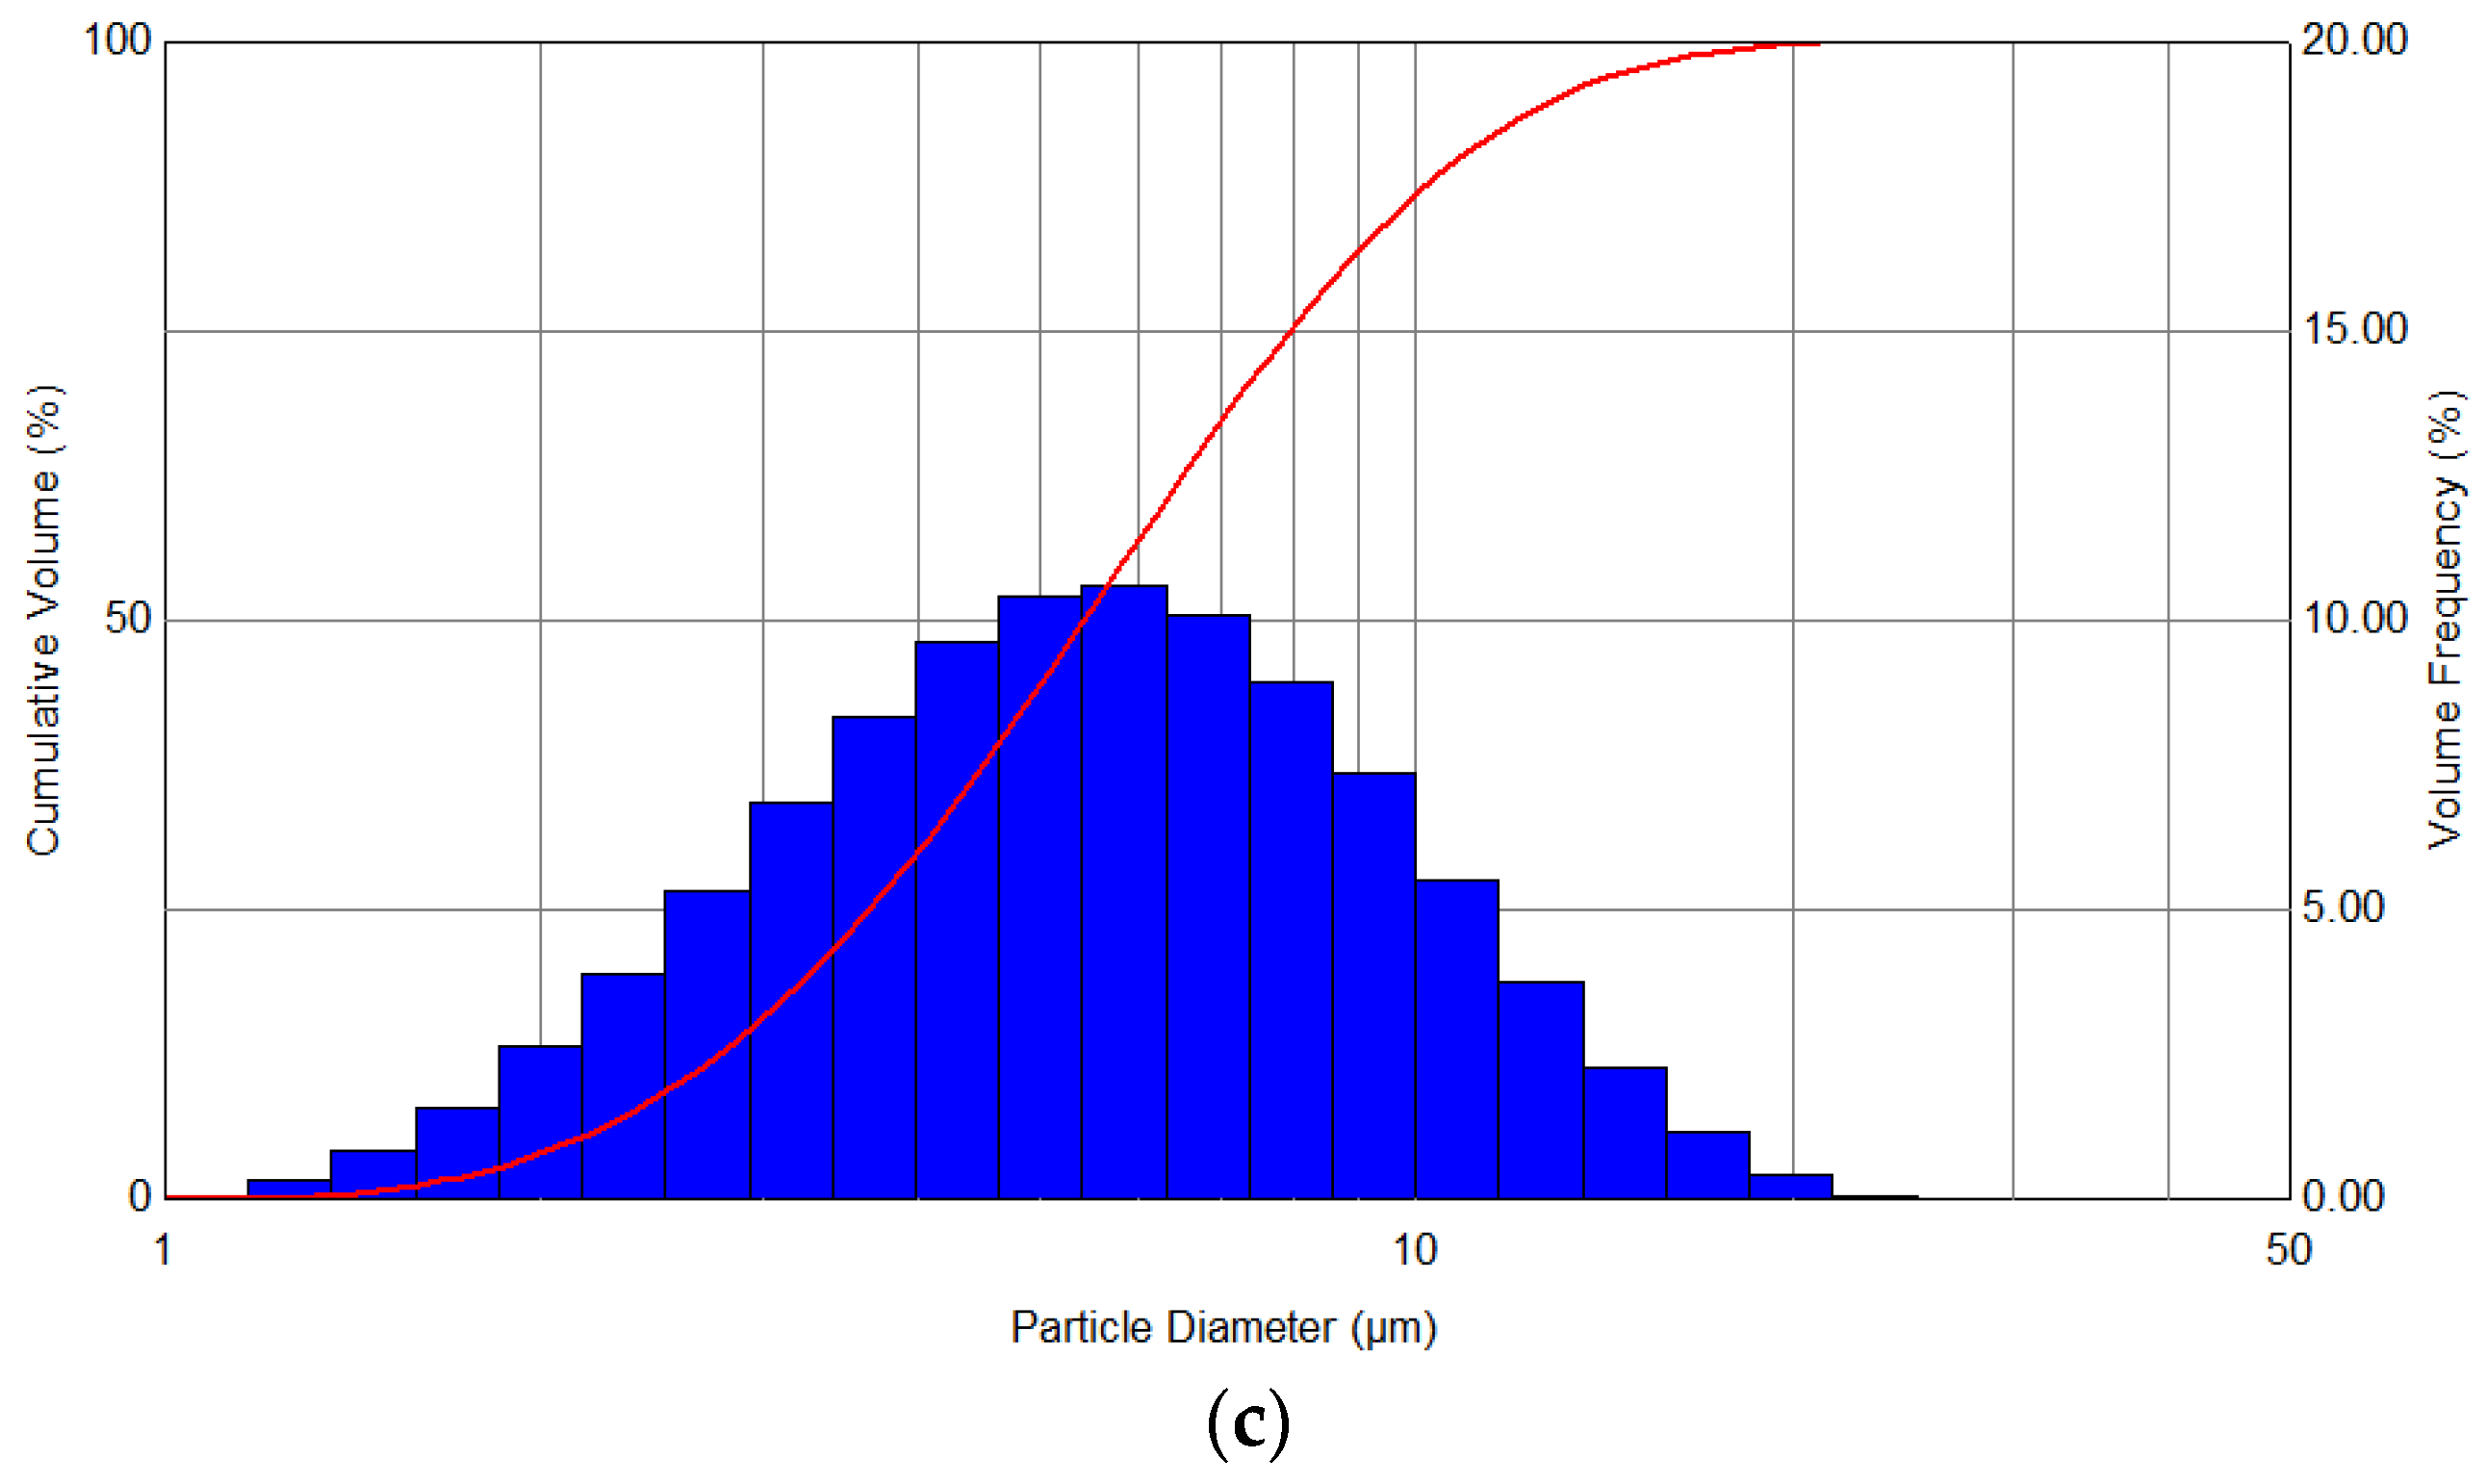
The evaluation of the quality of the performed process is based on the determination of the distribution spectra of the generated aerosol, as well as the comparison of the Sauter mean volume-surface diameter. Exemplary curves of the droplet volume distributions, which were obtained as a result of atomization at a constant pressure of 2 bar with the use of 50 W heating, and also without heating, are presented in
Figure 4.
In turn,
Figure 5 shows the spectra of the distribution of the aerosol obtained as a result of spraying the liquid at variable pressures—in the range from 1 to 3 bar—and also during the simultaneous use of heating with a power of 100 W. The analysis of the distribution of the droplets’ diameters showed that a clear narrowing of distributions and a shift towards smaller diameters are observed with an increase in the set pressure, with the nature of the generated aerosol becoming more monodisperse.
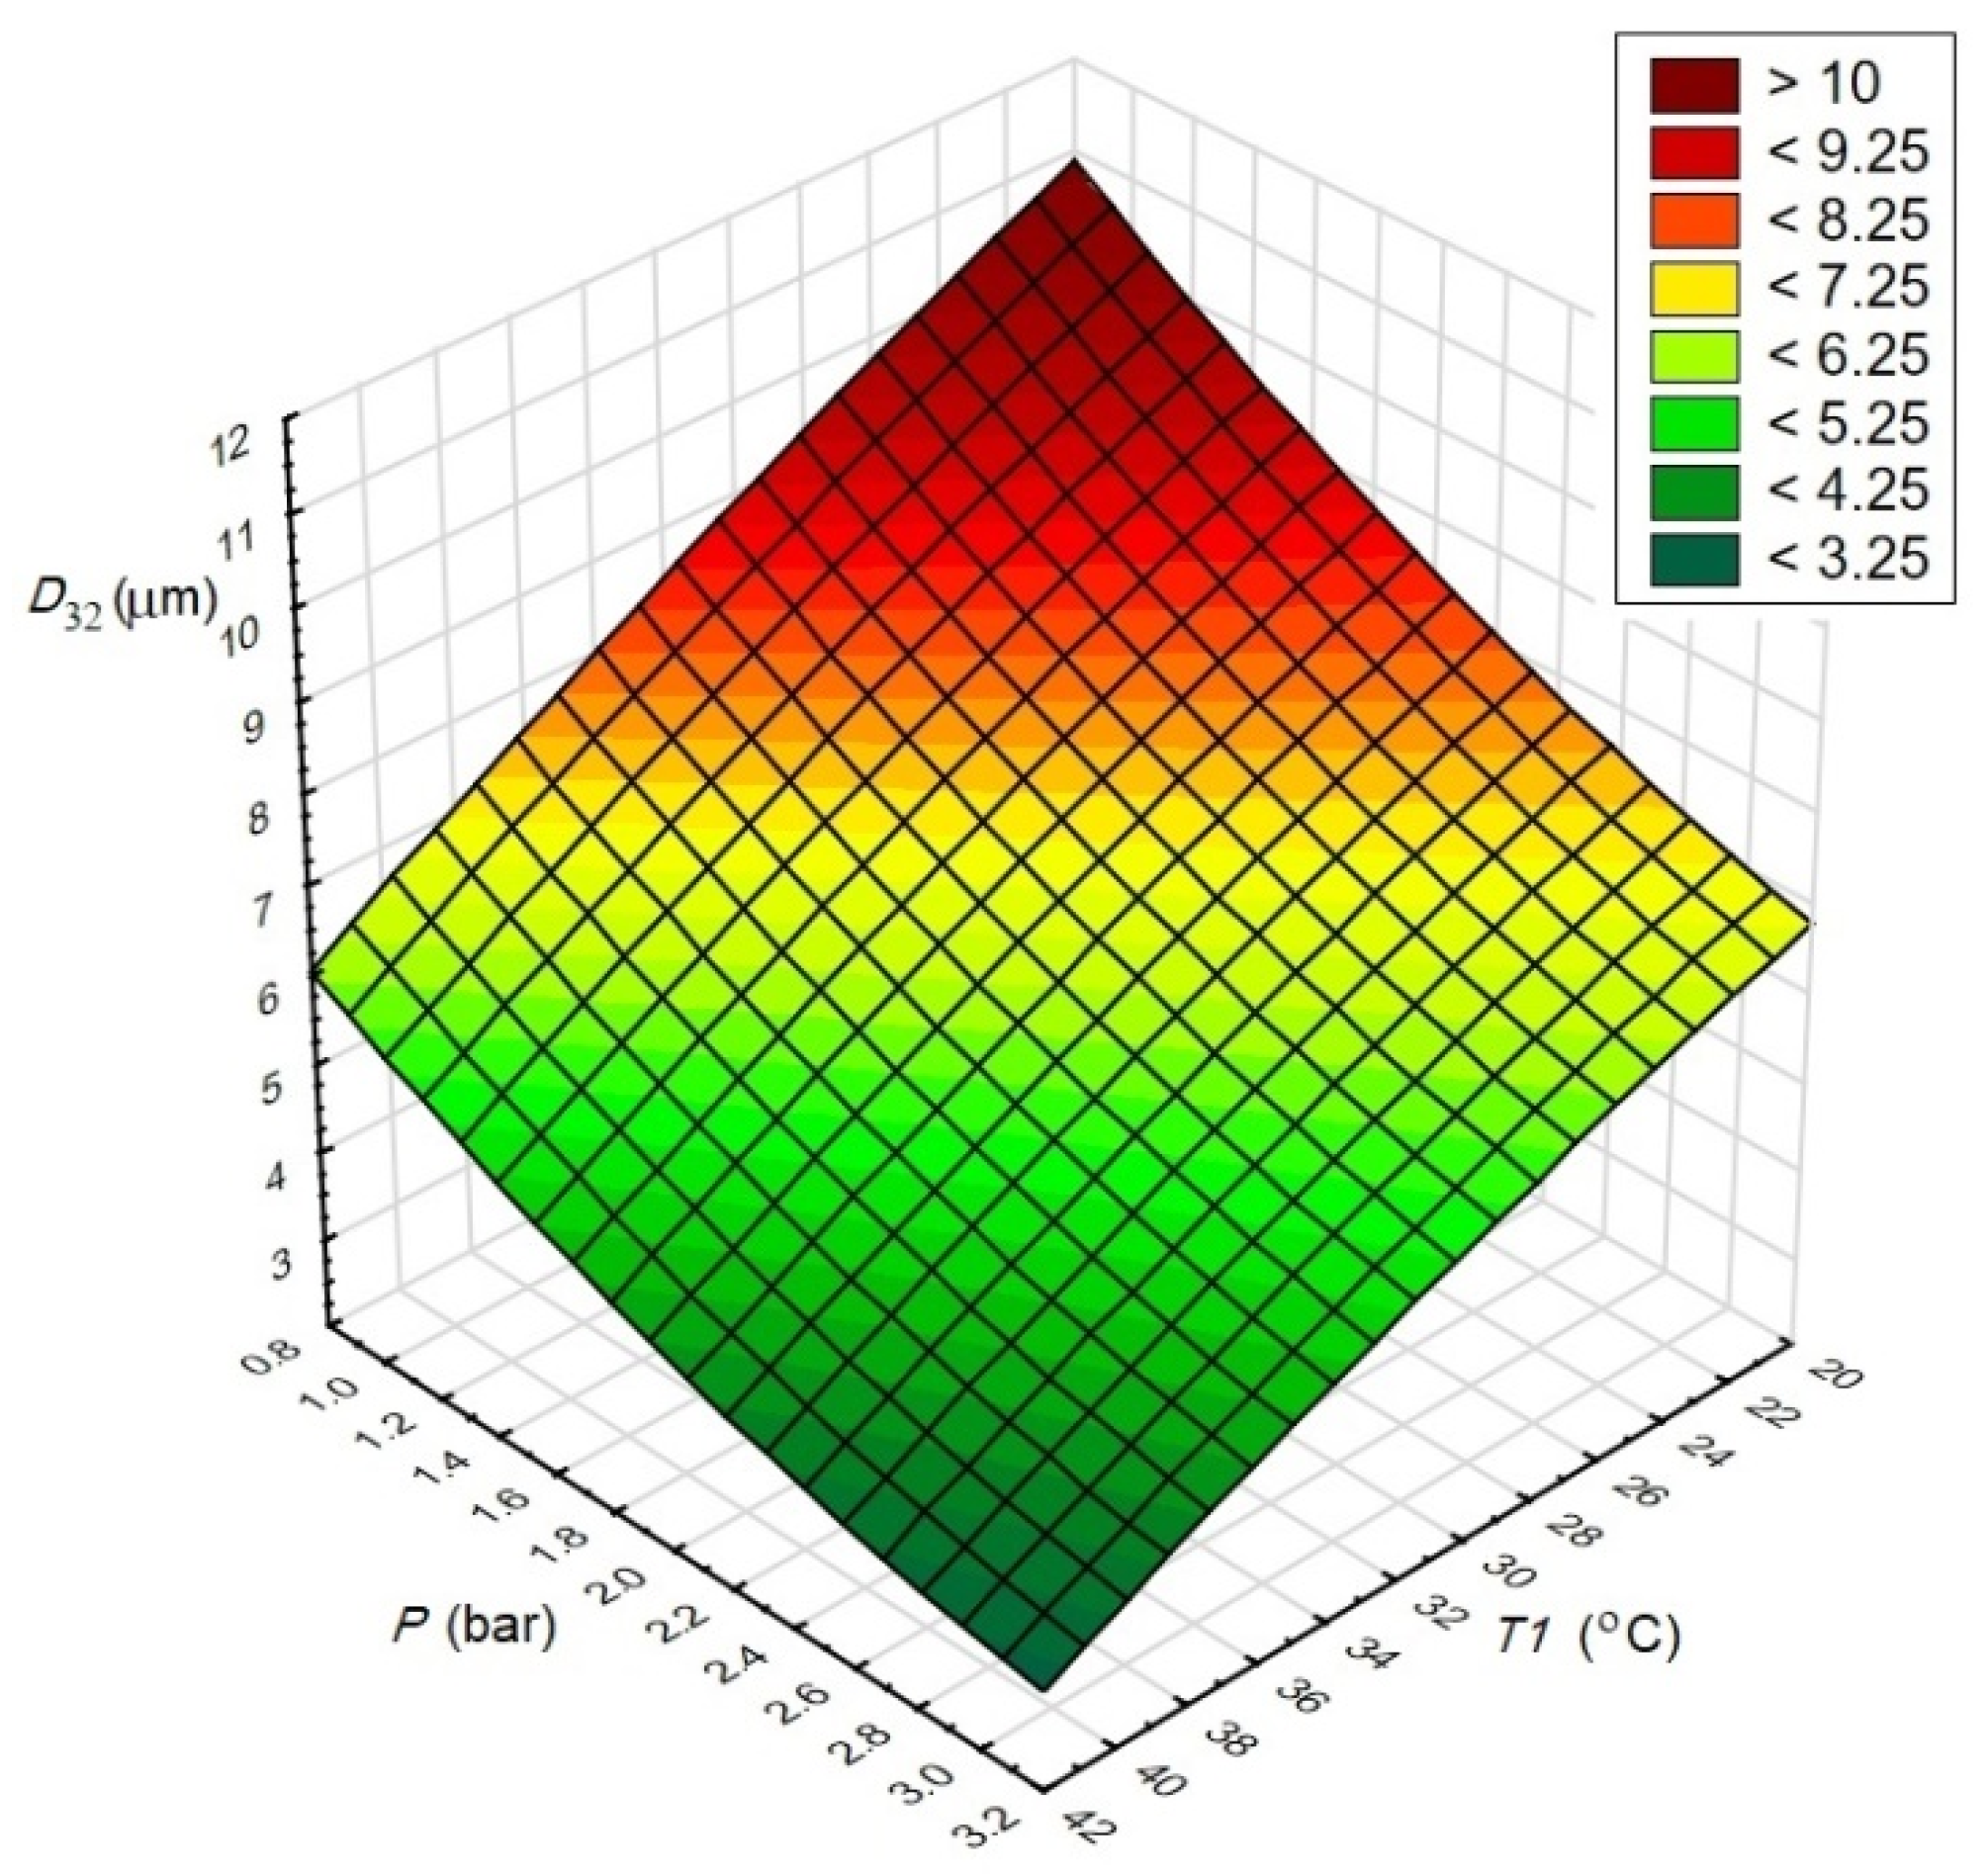
On the basis of the obtained results, it was found that the selection of optimal conditions for the atomization process depends both on the gas pressure used for the atomization process and the ambient temperature in which the aerosol is generated. An important fact that can be read from the graph is the overlapping of the result ranges. For example, some of the diameters that can be obtained at a pressure of 1 bar and with a heating device power of 100 W can also be obtained for the conditions of 2 bar and a heating device power of between 0–50 W. This is especially important when there are unfavorable values of temperature and pressure and when it is necessary to modify selected parameters in such a way that they do not adversely affect the desired size of the droplet diameters.
Figure 6 shows the obtained values of the Sauter mean diameters in relation to the gas pressure and temperature of the air (
T1) supplied by the heating device, respectively. The parameter of GSD is defined as geometric standard deviation and is calculated as:
where
Vi is the relative volume of interval
i,
di—size of interval
i,
Dv(50)—median diameter (μm). Estimated
GSD values did not exceed 0.75 μm.
The dependencies presented in
Figure 6 allowed the formula for the Sauter mean diameter to be determined with regards to the gas pressure (
pG) and the temperature
T1 measured at the used air supply and heating device. The formula has the following form:
which is valid for the tested system within the range of
pG from 1 to 3 bar, and
p < 100 W (
T1 listed in
Table 2). For the correlation R
2 = 0.956.
Figure 7 shows the observed values in relation to the predicted ones. On the basis of the obtained results and dependencies, it was found that regarding the subject of equipment for producing dry fog and its application, there are still many aspects that require improvement. It is worth continuing the research, especially with regard to the effective use of dry fog in the direct fight against viruses, as well as for disinfecting rooms, which in light of the SARS-CoV-2 virus pandemic, may turn out to be a huge advantage. The use of this type of apparatus can of course be very wide—it can also be used as a humidifying device in both residential and medical premises. It can spray certain substances (e.g., fragrances) and create a kind of aromatization installation in supermarkets. Stores use fragrances to evoke associations with the product they sell. By spraying a specific fragrance, they are able to communicate what kind of brand they are, to whom they address their offer, and what kind of feelings they want to evoke among their customers. Moreover, it can also be used as an aromatherapy device—aromatherapy devices (aroma diffusers) are devices that spray pleasant aroma compositions, e.g., essential oils.
4. Conclusions
Based on the conducted experimental tests and the analysis of the results, it was shown that a change in the pressure of the gas used as a medium has a direct impact on the size of the droplets in the generated aerosol. The use of a higher pressure value caused the formation of droplets with a smaller Sauter volume–surface mean value. The largest diameter, obtained at a pressure of 1 bar, was equal to 9.81 µm, which is already a very satisfactory and desirable diameter in many applications. The smallest droplets that could be produced were formed under the pressure of 3 bar, and their diameter was equal to 3.54 µm. Such a low droplet size value is very satisfactory. The dry fog devices available on the market are adapted to work with liquid particles that have an average diameter between 5 µm and 10 µm (depending on the manufacturer). The established dependency allows the pressure value used in the gas process to be selected with regard to the expected size of the aerosol’s droplets.
An increase in the power of the air supply and heating device translates directly into an increase in the ambient temperature in which the dry fog is formed. The collected results show that a higher temperature corresponds to smaller diameter values of the obtained droplets. An increase in temperature causes a drop in the dynamic surface tension and viscosity, which in turn results in smaller droplets. This is due to the lower physical forces in the liquid that holds the droplets together. The increase in temperature also increases the evaporation rate of the aerosol’s components, which contributes to the reduction in the diameter of the droplets.
The obtained temperature measurement results show a significant decrease in their value at the outlet of the dispersed liquid, which is due to the rapid expansion of the gas in this place. A low temperature of the aerosol in the case of dry fog is not a favorable phenomenon due to the reduced ability of the liquid to evaporate. When considering disinfection, a lower temperature increases the viability of viruses and bacteria. The prevention against cooling of the aerosol is therefore one of the priorities in the production of dry fog. The results show that a simple heating device placed 20 cm behind the aerosol outlet is able to compensate for temperature drops. The value of the power used for this purpose does not need to be high—50 W is enough to increase the temperature by a few degrees Celsius using a heater.
Based on the literature data and the conducted research, it was shown that the designed device is capable of producing dry fog. The system also has the option of regulating temperature and pressure. Changing these parameters affects the size of the droplets obtained in the process, which in turn allows them to be adapted to specific purposes.
The system produces very small droplets with an average diameter of less than 10 μm, which act on the microbes at the particle level. In addition, the use of dry fog does not wet the surface—also when using a disinfectant as a medium. This extends the scope of the applicability of dry fog in terms of the place of its use. Small droplets have a very good effect on air humidification, which translates into a shorter lifetime of viruses.


