Article

Characteristics of Generic Dielectric Materials and Char as Bed Materials of a Dielectric Barrier Discharge Reactor under High Temperature and Wide Frequency Range

by
Saravanakumar Arumugam
1,*,
Philipp Schröder
2,
Thomas Schoenemann
3 and
York Neubauer
4
1
Institute of Marine Engineering, University of Rostock, Albert-Einstein-Str. 2, 18059 Rostock, Germany
2
Bundesanstalt für Immobilienaufgaben, 53119 Bonn, Germany
3
HHT/IEF/IEE, University of Rostock, Tannenweg 22 (Speicher II Eingang West), 18059 Rostock, Germany
4
TCKON Engineering Services, 13088 Berlin, Germany
*
Author to whom correspondence should be addressed.
Energies 2022, 15(23), 9241; https://doi.org/10.3390/en15239241
Submission received: 4 November 2022 / Revised: 25 November 2022 / Accepted: 2 December 2022 / Published: 6 December 2022
(This article belongs to the Special Issue Diagnostic Testing and Condition Monitoring Methods)

Abstract

:
This paper investigates the characteristics of generic dielectric materials and char, which are intended to be used as the fixed bed materials of a non-thermal-plasma (NTP)-based dielectric barrier discharge (DBD) reactor. Such data are very essential when upgrading the fixed bed to a fluidised bed, which may provide further improvement in the production and quality of the producer gas. This measure would eventually cause a better producer gas and effective biomass-based power generation. Pertinent data that are currently available focus on either improving the design requirements of the producer gas or studying the impact of individual dielectric-material-specific applications to produce useful gases by decomposing the polluting gases. Considering that there has only been a meagre attempt to gather this information, this study gains its importance. In this context, the collective electrical behaviour of bed materials viz. quartz-sand, olivine, and char under ambient and higher temperatures is recorded and their frequency dependencies are analysed. First, the electrical behaviour of the chosen materials is resolved over a wide frequency range. For this purpose, two test cells, i.e., one for the ambient conditions and the other for higher temperatures, are built. Subsequently, the surface and volumetric properties of the chosen bed materials under ambient and higher temperatures are studied. As these materials are not as conductive as metal, such an approach is necessary to understand the apparent behaviour of the materials and anticipate their direct or indirect effects in the presence of non-thermal plasma. In summary, the data from the test cell under ambient and higher temperatures and the influence of materials in the dielectric barrier discharge reactor qualitatively define the material usage and may provide an opportunity to optimise their performance.

1. Introduction

Non-thermal-plasma (NTP)-activated dielectric barrier discharge (DBD) reactors with fixed and/or fluidised bed dielectric materials and char are a novel and innovative approach intended to be used to improve the quality of the producer gas generated in a gasifier unit [1]. The producer gas is combustible with no free oxygen. The pertinent DBD reactors used for the application of gas must be capable of working at atmospheric pressure and need to be scalable [1,2]. The producer gas with better quality implies a higher heating value and re-formation of the pollutants into useful gas components, thereby improving the performance of gas synthesis and the conversion of chemical energy into electrical power [3,4,5]. Currently used NTP-based DBD reactors employ generic dielectric materials, resulting in the removal of toxic constituents in the exhaust gas. The harmful constituents in the exhaust gas (nitrous oxide (NOx), sulphur dioxide (SO2), carbon monoxide (CO), or volatile organic compounds (VOCs)) are reformed (reaction pathway) into useful gases and elements such as nitrogen (N2), oxygen (O2), or carbon dioxide (CO2) [3,4,5]. The reaction pathways, in turn, depend on the type of dielectric material used and the way the discharges are introduced. In this context, understanding the characteristics of the dielectric material under the adverse operating conditions in NTP-based DBD reactors becomes quite important. Such information not only improves the functional efficiency, but also helps to improve the design and structure of DBD reactors.
The composition of the producer gas and an optimal method to improve its quality were explained in [6,7], respectively. Amongst numerous possibilities, a popular pathway to improve the quality of the producer gas is achieved by enhancing the heterogeneous reactions in the presence of reactive charcoal [7,8]. During this process, it is highly desired to use the bed material approach in which dielectric materials are packed in between the electrodes and apply non-thermal plasma for gas cleaning and quality enhancement application [7,8]. This approach of packing the space between electrodes with dielectrics as the bed materials is expected to provide higher conversion rates and better gas quality [7]. The currently available literature focuses on the design improvements of DBD reactors’ impact with respect to specific materials on the plasma generation and decomposition of oxygen from the flue gas. During this, the primary focus is either on a multi-needle electrode configuration on the electrical discharge or NOX removal efficiency [9]. In some cases, the structural effects of electrodes such as the shape, diameter, length, etc., on the removal of NOX gas in a DBD reactor are studied [10]. In addition, the reduction of NOx from flue gases via interconnecting two barrier discharge plasma reactors is studied [11]. The available information related to dielectrics once again studies the impact of non-thermal plasma on specific materials such as glass beads, glass sand, ceramics, etc. [12,13]. Alternatively, a combination of plasma discharge and the TiO2 photocatalyst is investigated to eliminate NO compounds [14]. In certain cases, even the theoretical and experimental analyses of NO and SO2 removal using a DBD photocatalyst hybrid system are studied [15,16]. At the same time, only a meagre attempt has been made to understand the frequency-dependent electrical parameters of the dielectric and charcoal materials under higher temperatures. Such information also might be necessary for designing the next generation of plasma-activated producer gas to syngas treatment systems and/or during the generation of a non-thermal plasma inside the bed region in a fluidised bed gasifier unit.
The selection of packed bed materials will not only determine the efficiency of the gas cleaning but maintain effective application on the non-thermal plasma discharges to achieve the same [17,18]. Alternately, char or charcoal can be used as a complete or partially packed bed mixed with dielectric materials. The char particles are semi-conductive and may support heterogeneous reactions of the non-thermal plasma on the composition of the producer gas, thereby improving its quality [17,18]. Therefore, it becomes equally important to understand the typical temperature- and frequency-dependent behaviours of char and generic dielectric materials, which are the subject matter.

2. Present Literature

The basic concept of the application and functionality of DBD reactors, bed materials, and the environment in which the discharges are initiated has been intensively studied for more than three decades. At the same time, certain aspects such as the electrical properties of the materials and their characteristics under a wide temperature and frequency range are yet to be deeply investigated. Considering this, the literature that is relevant is discussed.

2.1. Solid Materials Intended to Be Used as the Bed in a DBD Reactor

DBD reactors and the application of non-thermal plasma are normally used for ozone generation, material treatment, particle reduction from exhaust, removal of NOX, COX, particulate matter, pollutants, etc. [19,20,21,22,23,24,25]. Naturally, the selection of bed materials varies as per their respective application. For instance, the removal of carbon particulate matter in diesel exhaust uses MnOX/CeO2 as a catalyst for the removal of carbon [12]. At the same time, for the particle reduction of CO2 to CO and O2, g–C3N4, TiO2, and/or ZnO are used [24,25]. On the contrary, the production and processing of CO2 into CO and O2 requires AL2O3, CeO2, and glass beads, while ozone production employs primarily TiO2 combined with other bed materials such as Pyrex beads, Pyrex wool, etc. [12,13,26]. The material combination used is inevitable as the same aids the process and improves the discharge mechanism. In addition, it is reported in the literature that the char material is also inevitably present along with the DBD material.

2.2. Current “Know-How” on the Electrical Properties of Bed Materials

The generic properties of bed materials commonly used in DBD reactors are currently available in the public domain. In particular, the relation of the choice of the bed materials and the yield of ozone, CO2 decomposition, the removal of C2F6 from ferroelectric particles, etc., are reported in several literature works [23,27]. The literature indicates that the gasification reactors invariably contain char as a constituent in the bed material. On the contrary, the focus for DBD reactors is only on the process and application of plasma discharges, and the materials used in such an environment are yet to be investigated. The electrical resistivities of char, coke, and other forms of carbonaceous materials are currently available [28,29,30,31,32]. The current strategy for measuring the DBD bed materials primarily focuses on the catalyst used, the gas flow rate, the frequency, the peak voltage applied, the streamers, and the discharge mechanisms [29]. At the same time, measuring the electrical properties of the DBD bed materials has received little attention.
Summarising all the above, it appears from these literature works that it is very essential to understand the typical behaviour of bed materials with respect to the temperature. The common properties of the bed materials are currently available; however, their electrical properties and their characteristic responses under a wide temperature and frequency range are yet to be investigated. Considering this, this paper investigates these two aspects viz.:
  • The surface and volumetric behaviour of DBD bed materials with respect to the temperature and frequency.
  • The typical characteristics of the char material and their temperature dependency.
It is believed that gaining such knowledge might help not only to improve the DBD reactors, but also to achieve the better utilisation of the raw materials in renewable energy systems, enhancing the cleaning measures of the producer gas, improving the performance and operating conditions of electrostatic precipitator (ESP) units.

3. Procedure

The significance of DBD reactors using non-thermal plasma and their respective industrial applications is well established and widely reported [2]. The concepts of dielectric barrier discharges (also called silent discharges), micro-discharges, their respective application, ozone generation, modelling the discharge phenomena, etc., have been widely investigated. At the same time, the electrical properties of solid materials applied as bed materials in the DBD reactor require more investigation. In this context, carbonaceous materials such as char, coke, ash, etc., have been given wide attention. The electrical properties of char and coke and their typical behaviour at a wide temperature range have been studied. The pertinent literature defines the dependencies of the char material on its geometry, structure, etc. In this context, the present study provides an apparent view of the electrical properties of solid materials intended to be used as bed materials in DBD reactors.
This study is restricted to the experimental investigation of specific granular solid materials to be applied in new fluidised bed DBD reactor systems and understanding their electrical properties at ambient and high temperature and a wide frequency range. For this purpose, three materials viz. quartz sand, olivine, and char that are intended to be used as DBD reactor bed materials were chosen. The chosen materials were placed in a three-electrode test cell, specifically designed to house powder and/or granular materials, and the surface and volumetric parameters of the same were measured from the terminals. The test cell was developed based on the inputs as mentioned in [33,34]. First, the collective electrical behaviour of individual bed materials (quartz sand, olivine, and char) under ambient temperature conditions was studied. The electrical properties such as the loss factor, terminal capacitance, resistance, impedance, and complex permittivity of quartz sand and olivine were measured and analysed, and subsequently, the resistive property of char was recorded over a wide frequency range and analysed. The electrical and/or dielectric characteristics imply measuring the loss factor, terminal capacitance, resistance, and impedance, respectively. The loss factor (or dissipation factor) is represented as “tan(δ)”, describing the energy lost in the dielectric material due to the polarisation phenomena. “δ” represents the phase angle between the applied voltage and the capacitive current drawn by the dielectric material. In the present context, “tan(δ)” defines the frequency-dependent behaviour of the dielectric bed materials chosen for a DBD reactor operated at ambient and higher temperatures. The terminal capacitance is the apparent value measured at the terminals of the test object with the materials filled. The capacitance also denotes the amount of charge stored in the material. The resistance (or conductance) and reactance (susceptance) indicate the reaction of the test materials with respect to the applied voltage and frequency. Naturally, the presence of moisture, other undesired substances, and further structural changes caused by the higher operating temperatures would introduce deviations in these parameters, once again indicating and quantifying the material’s properties. Being conductive (or at least semi-conductive) in nature, the char material does not exhibit individually dielectric properties, but rather manifests resistive behaviour. The temperature dependency of the char material was studied by monitoring its resistive behaviour over a wide frequency range. Subsequently, the changes in the resistance of the char material with respect to the applied temperature were calculated from the measured data, and the same were analysed. The data obtained from both the measurements collectively provide the information regarding the apparent behaviour of materials at higher temperatures and frequencies.
The measuring strategy adopted involves two methods viz. dielectric response analysis (DRA) and frequency response analysis (FRA) to record the dielectric and electrical properties of the materials adopted. Such an approach provides vast opportunities to record the surface and volumetric characteristics of the chosen materials at ambient and high temperatures over a wide frequency range. The DRA method uses low frequencies to energise time-dependent polarisation mechanisms such as long-range ion movements, dipole orientation, and barrier charge accumulation. This is acceptable as the materials used may contain symmetrical and/or asymmetrical particles with different dimensions and structures. Therefore, these chosen materials may pose different superficial (or surface) and bulk (volume) responses to the applied test frequencies, thereby providing an opportunity to understand their behaviour. At higher frequencies, the time provided for energising the slower polarisation mechanisms ceases to exist, thereby lowering the sensitivity of the superficial and bulk components of the response. Therefore, the pertinent FRA method may be less sensitive to the applied frequency and, at the same time, may be sensitive to external factors such as moisture, air, etc. Therefore, the DRA and FRA methods, used to record the frequency-dependent surface and volume impedances, provide a complete overview of the material’s characteristics, which may help in understanding the influence of external factors such as the higher operating temperature.

4. Sample Preparation and Test Cell

The chosen samples for the experimental investigations were the quartz sand, olivine, and char materials. Figure 1a–c shows the pictorial description of the chosen samples of quartz sand, olivine and char adopted. The quartz sand and olivine were commercially obtained, while the char samples were prepared using pinewood chips. The pinewood chips were burnt at a higher temperature, and the samples of the quartz sand, olivine, and char were obtained and placed in a test cell and subjected to electrical measurements.
A test cell was developed to house the chosen samples of the DBD bed reactor materials and to measure their respective electrical properties. Figure 2a–c shows the schematic and pictorial description of the test cell adopted for this study. The test cell contains four parts viz. the centre electrode, outer ring electrodes, and middle ring electrode, insulating rings or spacers, base plate, and outer cover. Initially, the ring electrodes were placed on one another on the base plate, and the insulating rings or spacers were interleaved between the outer and middle ring electrodes. Thus, the insulator rings electrically isolate the outer ring electrodes. The base plate was provided with grooves so as retain the symmetricity of the electrodes’ position. Once the ring electrodes were placed, the centre electrode was concentrically placed on the symmetrically positioned ring electrodes and the outer protective cover was placed to ensure that the positioning and symmetricity of the electrodes were not disturbed under any circumstances.
The electrodes have provisions for electrical connections, which are marked as “U0”, “U1”, and “U2” representing the centre, outer, and middle ring electrodes, respectively. Two test cells marked as “TC1” and “TC2” were involved in the present study, out of which “TC1” was designed to measure the test samples under ambient conditions. The second test cell marked as “TC2” is similar in principle but designed to handle higher temperatures. The test cell used for ambient condition (“TC1”) measurements contains an insulating spacer (or Teflon rings) for electrically isolating the top and bottom ring electrodes. At the same time, the test cell used for measuring high temperatures (“TC2”) uses mica rings as the spacers for electrical isolation. Otherwise, both test cells are identical in design and dimension. The only difference is the auxiliary system, which enables the second test cell (“TC2”) to operate under higher temperatures without any fire hazard. Thermocouples were installed in the second test cell (“TC2”) for the purpose of monitoring the temperature.
Once the necessary requirements were included, the test cells were used to record the characteristics of the test samples under ambient and higher-temperature conditions. Such an approach was performed to cross verify the possibilities of the structural and/or material change of the sample at least at the macroscopic level.

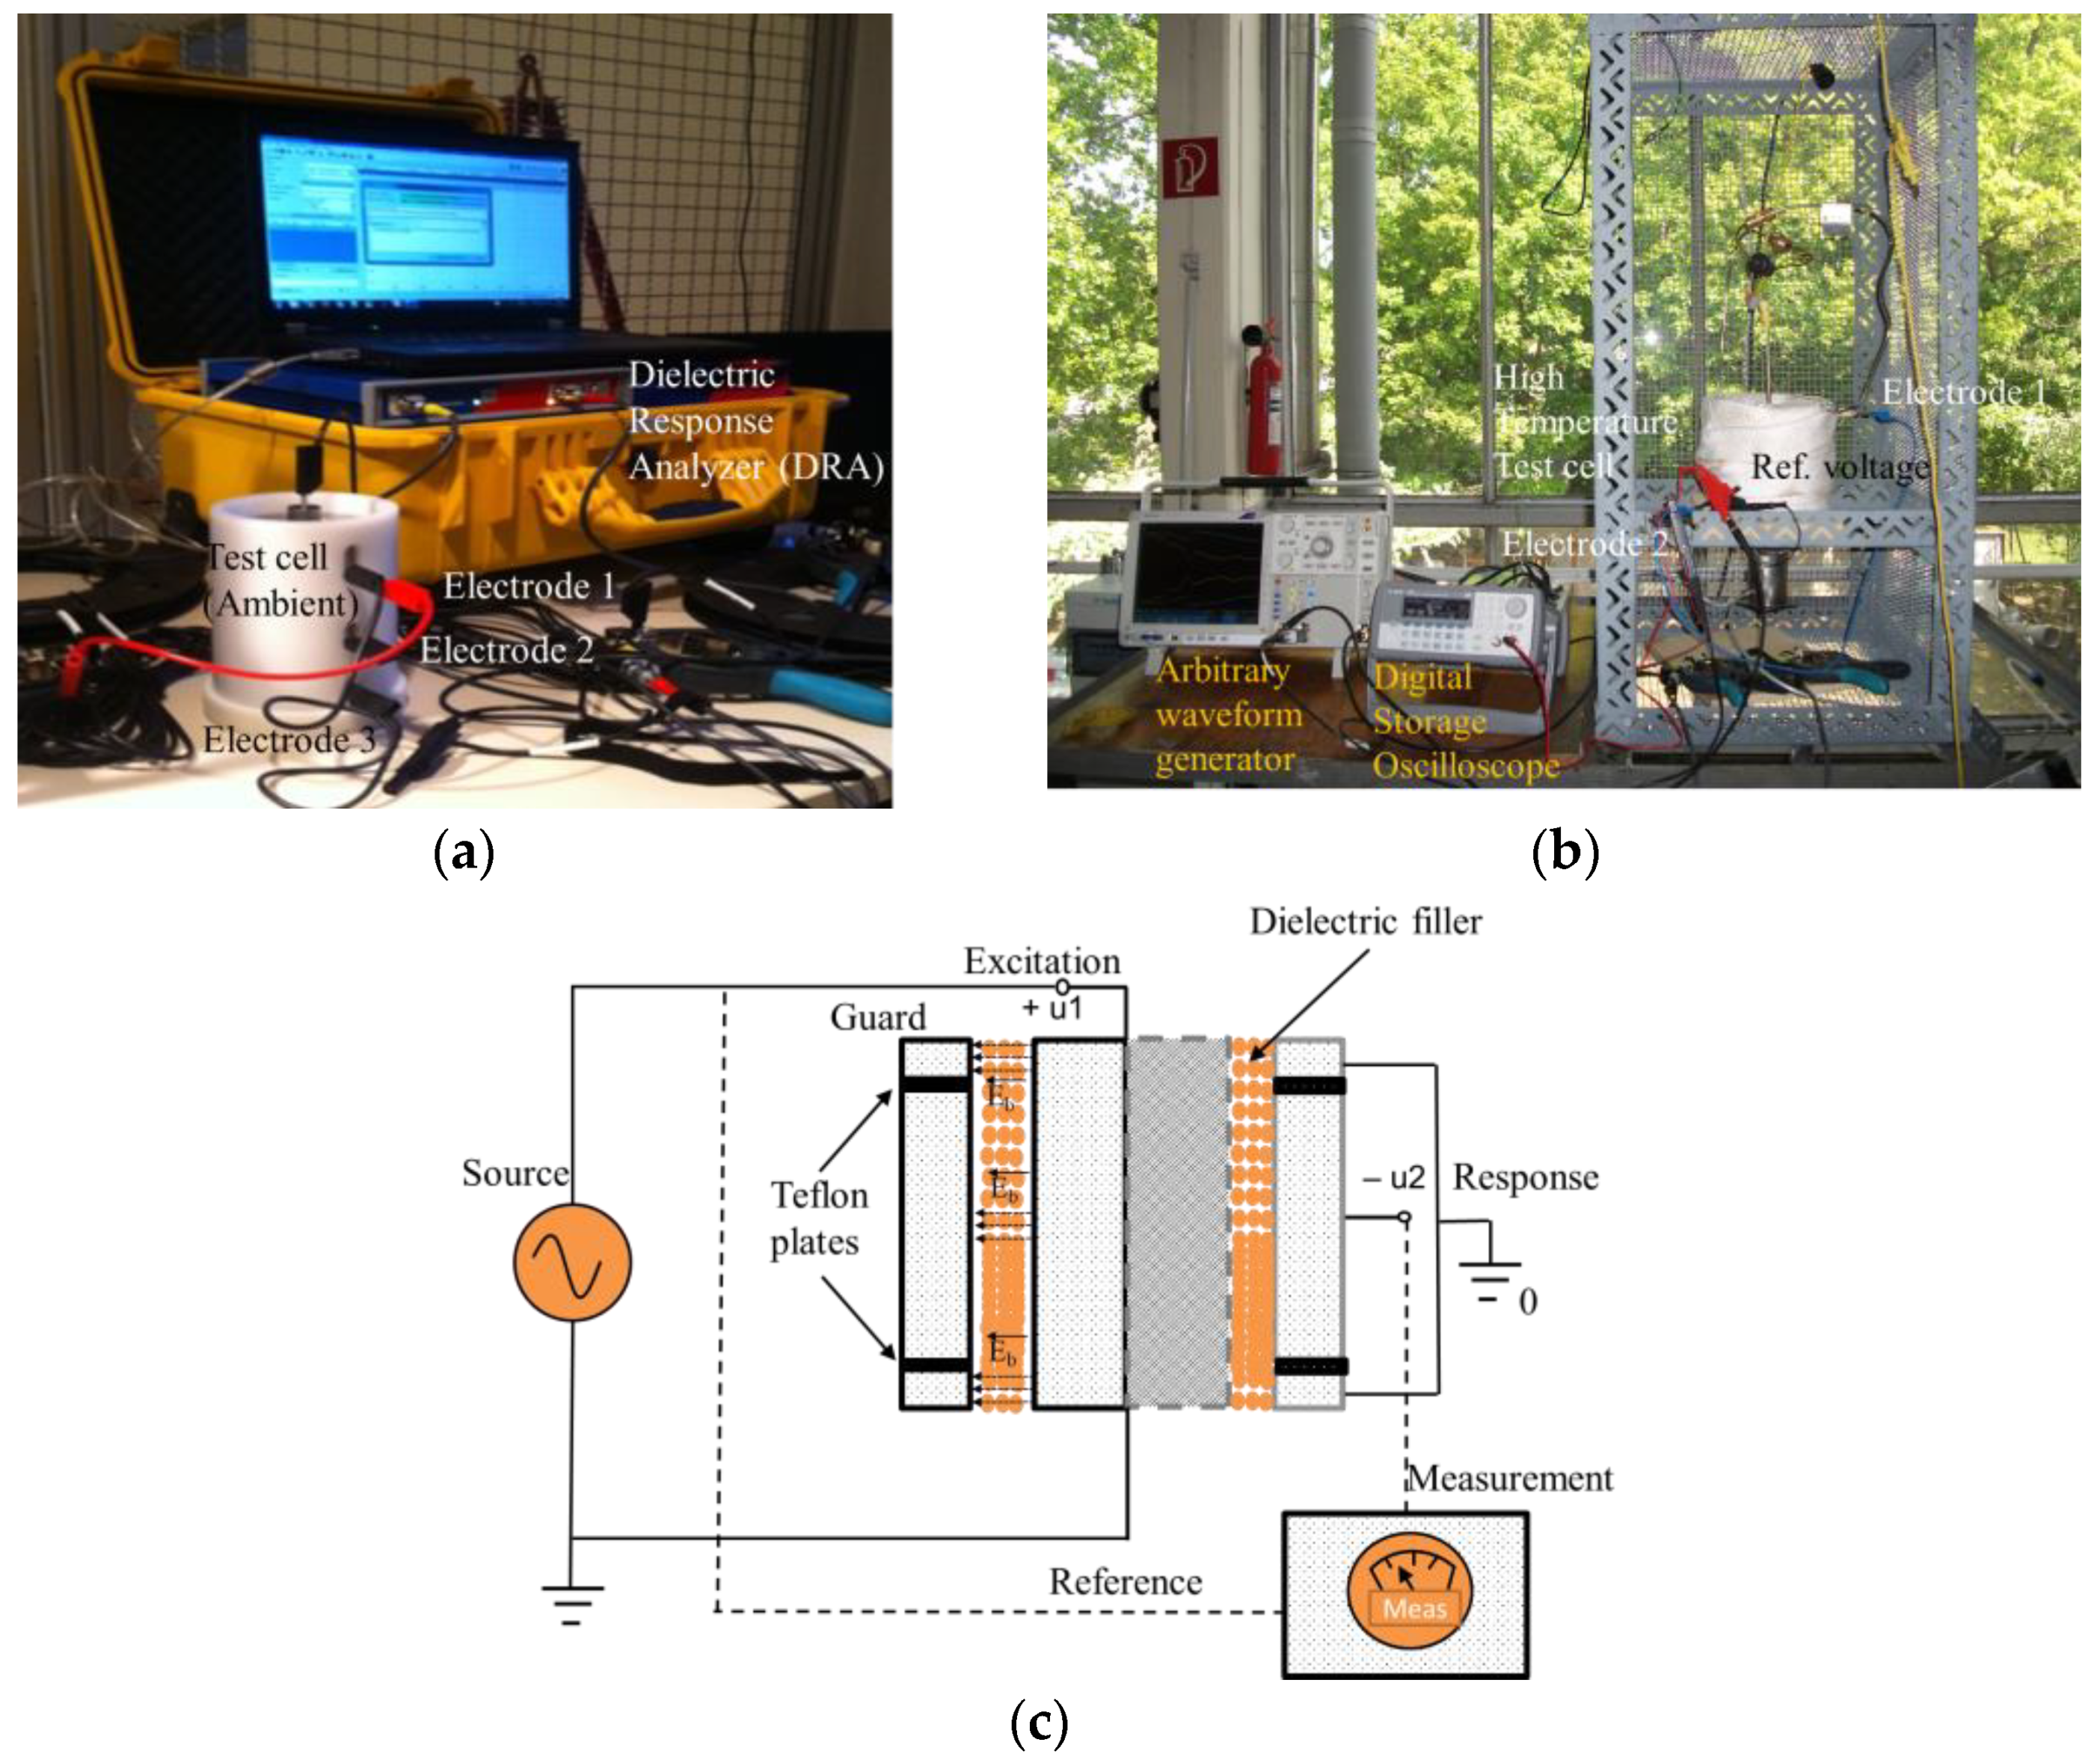
5. Measurement Principle

The underlying measuring principle adopted for recording the electrical properties of the DBD bed materials focuses on resolving their surface and volumetric parameters and their dependencies with respect to temperature and frequency. For this purpose, a method involving three terminal measurements (source, guard, and measurement) was chosen. The concept of the three-terminal-based test cell was developed based on the recommendations made by [34,35]. Figure 3a,b show the schematic diagram of the underlying principle used for measuring the surface and volumetric parameters of the chosen DBD reactor bed materials. During these measurements, the surface and volumetric parameters of the chosen materials were recorded by simply alternating the source, measurement, and guard connections of the electrode. For instance, to measure the surface properties of the material, the test signals were injected into the material through the outer ring electrodes, while the corresponding responses were recorded from the middle ring electrode. The centre electrode was grounded to eliminate the volumetric influence of the test sample. On the contrary, the volumetric measurements involved the middle ring electrode to energise the sample and the centre electrode to record their respective responses. To eliminate the surface parametric response of the material, the outer ring electrodes were grounded.
In the present context, the dielectric materials were filled-in and packed between the gaps of the electrodes. This arrangement can be adequately represented using a simple RC circuit analogy. Figure 3c,d show the RC-circuit-based representation of the bulk and surface impedance of the chosen materials. The RC components in the circuit model represent the ionic, interfacial, and dipolar polarisation mechanisms, respectively. The parallel RC circuit represents dipolar polarisation, while the series RC circuit shows the surface contribution of the material [35,36]. Naturally, during surface measurements, the volumetric counterpart (bulk RC) was guarded out and vice versa. At the same time, it is very important to mention that the circuit analogy is apparent in nature, and a more detailed model that incorporates the structural information of grains, packing ratio, size, shape, weight, water concentration, etc., is necessary to accurately represent the arrangement. This is currently an ongoing work, and the authors will be able to provide more information upon completion.
It is well known that the char material is resistive. The value of the resistance of the char material depends on its porous structure, which is dependent on the feedstock used and other conditions such as the temperature, gasification agents, treatment, duration, etc., experienced during the thermo-chemical conversion process. Naturally, it is expected that the application of the external temperature might influence its electrical characteristics. Considering this, experiments were conducted on a single char sample, which was operated at a high temperature i.e., from ambient (21.6 °C) to 650 °C, respectively. Following this, the electrical characteristics of the char sample pertaining to the discrete temperature were recorded over a wide frequency range. Once the characteristics were recorded, the sample was once more aged, and the complete measurement was repeated. Such an approach was performed to cross verify the possibilities of the structural and/or material change of the sample at least at the macroscopic level.
Once the underlying principle for measuring was decided, the experiments were exercised on the chosen samples, and their respective electrical properties and their time and frequency dependencies were studied.

6. Experiments

The electrical parameters of the chosen samples were measured through the dielectric and frequency response test methods. The suitability of both of these methods (dielectric response and frequency response) in ascertaining the characteristics of non-conventional applications (IGBT modules, tar species, etc.,) are well established and experimentally proven. Prior to the measurements, the test cell was suitably positioned, and the samples were filled in, while the electrical connections for measuring the surface and volume parametric data were made appropriately (refer to Figure 3a,b). As explained earlier, the test cell (shown in Figure 2a–c) adopted in the present study employed three electrode arrangements viz. test, measurement, and guard, respectively. The measurement electrode was stacked in between two guard electrodes, while the test electrode was placed concentrically to the stacked measurement and guard electrodes. A dielectric spacing of 2 mm was introduced between the measurement and guard electrodes through Teflon spacers. The complete electrode arrangement was placed in a concentric dielectric cylinder made of Teflon material. Grooves were made on the electrodes (test, measurement, and guard) to establish suitable electrical connections through lab cables. The same set of connecting leads and cables was used to maintain the repeatability of the experiments. It is important to mention that the test cells used for the ambient temperature and higher temperatures were identical in design concept, while the only difference was the materials used for the electrical isolation and thermal withstanding ability. The ambient temperature measurements used Teflon rings to electrically isolate the guard (outer or top and bottom ring) and measurement (middle ring) electrodes, while mica rings were used at the same location for achieving electrical isolation and to withstand higher temperatures. Subsequently, the samples were filled in the gap between the centre cylindrical electrode and the ring electrodes and subjected to experiments.

6.1. Frequency-Dependent Test Method

The test setup used for recording the electrical properties at ambient and higher temperatures are shown in Figure 4a,b, respectively. The schematic of performing the frequency response measurements is shown in Figure 4c. During frequency response measurements, a three-terminal electrode that used the source, reference, and measurement from the excitation and test cell was adopted. The underlying principle of surface and volumetric parameter measurements is shown in Figure 3a,b. The test device chosen for recording the electrical properties was a dielectric response analyser (Figure 4a), popularly used not only for assessing the diagnostic condition of a high-voltage apparatus (i.e., power cables, transformers, bushings, etc.,), but also to measure the generic dielectric materials that are housed in a test cell. The adopted test equipment can resolve both the electrical (resistance, capacitance, impedance) and dielectric (i.e., loss factor, complex permittivity, complex capacitance, power factor) properties of the chosen material or test object. The chosen dielectric response analyser has an inherent AC source that generates a sinusoidal voltage of a magnitude up to 200 V at a frequency ranging from 300 µHz to 5 kHz in discrete steps. The signals were injected through the centre cylindrical electrode, and the responses were recorded from the measurement or guarded ring electrodes. Later, the measured responses were used to determine the electrical and dielectric properties of the chosen material over a wide frequency range. During this, the connections were made at the electrodes through a short jumper, no more than 10 cm in length, which was electrically connected to the device using a triaxial cable. The triaxial cable provides a better shield to noise and external interference, thereby enabling the device to perform a sensitive and accurate measurement. Following this, the high-frequency surface and volumetric electrical properties (i.e., resistance, impedance) of the chosen samples were recorded.
Surface resistance and impedance define the resistance offered to the flow of (leakage) current over the surface of a material. The volumetric resistance and impedance define the resistance offered to the flow of current diverging volumetrically through the material. The direction of the flow of current depends on the direction of the electric field applied to the material. Figure 3a,b show the electrical connection and field direction while measuring the surface and volumetric parameters, respectively. The surface and volumetric impedances reveal the joint interaction of both frequency-dependent resistance and reactance, respectively. In the present context, the degree of sensitivity and response of resistance and reactance might differ with respect to the material. In order to observe the same, the influence of higher temperature and frequency dependencies are characterised were studied.
Figure 4b shows the test setup used for measuring the frequency-dependent impedance of the chosen samples of DBD bed materials using the frequency response analysis (FRA) method. For this purpose, a function generator capable of producing a 20 V peak-to-peak sinusoid, a 16-bit digital oscilloscope, and a clamp-on current probe (sensitivity: 2 mA/mV, bandwidth: 450–60 MHz) were used. All the signals were connected to the instruments via a 50 Ω co-axial cable having a maximum length of 1 m. An automatic procedure (refer to (Figure 4b)) was adopted for gathering the sweep frequency measurement data and later transferred to a PC for analysis.
During the FRA measurements, the spectrally pure sinusoidal signal of a 20 V peak-to-peak sinusoid was injected into the test object through the terminals in discrete frequency steps, and the excitation and responses were measured from the input terminal. The input impedance was computed from the measured excitation and responses so that the maxima and minima of the measured spectrum revealed the natural frequencies of the test setup and the chosen sample. The FRA method incorporates three lead measuring method (source, reference, and measurement) and can dynamically adjust the vertical scale deflection. Being a high-frequency measurement, the necessary precautions required to gain immunity over noise and interference were duly exercised.

6.2. Measuring Electrical Properties under Ambient Temperature

The frequency-dependent test method adopted for measuring the surface and volumetric properties implies recording the superficial (surface) and bulk (volumetric) responses of the chosen sample and obtaining their respective electrical properties (i.e., loss factor, capacitance, resistance, complex permittivity, impedance, etc.,) from the same. The loss factor quantifies the dielectric loss in the material, while the capacitance indicates the ability of the material to store charges, and the resistance enumerates the material’s conductivity initiated by the frequency-dependent polarisation mechanism. First, the surface and volume electrical properties of the chosen samples were recorded at ambient temperature and later at a higher temperature. The data obtained from the ambient temperature provide the typical characteristics of the chosen materials, and the same at the higher temperature indicate the possible deviations in their respective condition. The surface parametric measurement implies measuring the superficial response or, in other words, the tangential component of the total response of the material to the applied voltage. The volume parametric measurement implies measuring the bulk response of the chosen material to the applied voltage, which is nothing but the normal component. The surface and volume parametric information regarding the electrical properties of the material characterises the dependencies with respect to the temperature and frequency.
Figure 5a–d show the surface electrical properties of the chosen samples of the DBD bed materials, measured under ambient room temperature. The corresponding numerical values that significantly explain the typical behaviour of the chosen materials are shown in Table 1. It becomes clear from these figures (Figure 5a–d) that the chosen materials individually are better dielectric materials and may be used as bed materials in DBD reactors. The same can be ensured by comparing the electrical properties of the chosen samples to the same measured from the geometry of the test cell. Such a comparison was used to validate the data measured from the DBD reactor bed materials to that of the air as the same remains as the insulating medium in the geometry of the test cell. Naturally, the corresponding data emerge as the reference and were used for the comparative analysis. At first glance, the dielectric response of the geometry of the test cell (empty with air filling the gaps) emerged with a better loss factor over a wide frequency range. The loss factor of the test cell (with air as the medium) remained less than 0.1, indicating lower dielectric loss. At the same time, the olivine material manifested a larger loss factor (tan(δ) ≈ 80) than the quartz sand (tan(δ) ≈ 0.1) and air. The reason for such an elevated loss factor of olivine might be attributed to its higher dielectric constant. The dielectric constant (Ꜫr) of olivine is around 7.5 (refer to [4]), while the same for quartz sand and air are 3 to 5 (depending on its dry, saturation, and wet state) and 1.0, respectively. Therefore, to quantify the dielectric quality of the material, the other electrical properties such as capacitance (Figure 5b) and resistance (Figure 5c) were studied.
The capacitance and resistance of the geometrical surface of the test cell, olivine, and quartz sand measured with respect to a wide range of frequency are shown in Figure 5b,c. Comparatively, the capacitances of the geometrical surface of the test cell with air as the medium and quartz sand measured remained close to each other or at least at higher frequencies. In particular, the capacitance values of the geometrical surface of the test cell and quartz sand remained at 75 pF at 1 kHz, which seemed to remain the same until 10 Hz. A further decrease in the frequency caused a slight increase in the surface capacitance of the quartz sand, indicating a slightly better ability to store the charges, contributed by the barriers and junctions formed by the quartz sand granules. This trend or behaviour of the surface capacitance of the quartz sand and the geometry of the test cell (or air) are reasonable as their dielectric constant remained at a closer range (i.e., Ꜫr (air) ≈ 1.0, Ꜫr (quartz sand) ≈ 3.0). At the same time, as expected, the olivine (Figure 5b) with a higher dielectric constant manifested a greater ability to store charges on its surface. As the frequency increased, the value of the surface capacitance of the olivine seemed to decrease in an exponential manner, i.e., from 275 pF to 175 pF approximately. At the same time, the corresponding value of the surface resistance of the olivine seemed to be lower than the quartz sand and the geometry of the test cell (with air as the medium). It can be observed from Figure 5c that the apparent surface resistance of the olivine was approximately 107 ohms at lower frequencies and seemed to drop to 106 Ω at 1 kHz. This indicates dominant conductivity in the olivine due to the polarisation mechanism, making it have higher dielectric loss than the geometry of the test cell (air) and the quartz sand material. Once this information was obtained, the apparent impedance contributed by the surface of the chosen samples of the DBD materials were measured and analysed.
The procedure of the dielectric response analysis involved either analysing the loss factor, resistance, or capacitance properties individually. Alternately, the impedance of the materials and/or the test objects measured altogether characterises the collective response of the DBD materials initiated by the material conductance and capacitive reactance, respectively. In other words, the response of the test materials or test objects, which are physically realizable during a real-time measurement, can be recorded and analysed, while the resistance and capacitance parameters measured are components of the total response measured. Therefore, the measured impedance provides a complete overview of the material’s characteristics over a wide frequency range, hence being sufficient to understand the overall diagnostic condition and/or status of the materials or test objects under investigation. Figure 5d shows the apparent surface impedance measured from the chosen DBD materials over a wide frequency range. The collective behaviour of surface resistance (conductivity) and surface capacitance (charges stored) can be viewed by the impedance shown in Figure 5d. As observed from Figure 5a–c, the olivine emerged with a lower impedance at lower frequencies, indicating more conductivity than the geometry of the test cell (air) and the quartz sand material. As the frequency increased, the total response of the olivine seemed to be in line with the air and quartz sand material. This reconfirms that the olivine emerged with a higher dielectric loss on its surface than the air and quartz sand. A further increase in the frequency caused the surface impedance (Figure 5d) of all the chosen materials to reduce, thereby making them more conductive. It also can be observed from Figure 5b that the surface capacitance reduced with increasing frequency. This might be due to the introduction of high-frequency polarisation mechanisms, which make the material more conductive. With this information, the volumetric response of the chosen materials was studied, and their typical behaviour with frequency was analysed.
Figure 6a–d show the volumetric electrical properties of the chosen samples of the DBD bed materials at ambient temperature. The pertinent values that significantly describe the volumetric behaviour of the chosen DBD bed materials are shown in Table 2. As expected, the larger dielectric constant of the olivine material manifested a higher loss factor (Figure 6a) at lower frequencies and remained close to the quartz sand at higher frequencies. At the same time, the volumetric response of the loss factor of the air and quartz sand remained within 1.0 per unit (p.u.). The pertinent capacitance (Figure 6b) of the olivine material emerged at a value higher than the quartz sand and air and seemed to further decrease exponentially with increasing frequency. This indicates the ability of the bulk material aiding in storing the charges in response to the applied voltage. However, the volumetric resistance of the olivine material shown in Figure 6c emerged as being lower than the air and quartz sand materials, thereby indicating its higher volumetric or bulk conductivity with frequency. The volumetric resistance of the olivine was around 108 Ω at lower frequencies and dropped to 106 Ω at higher frequencies. This once again confirms the fact that the olivine material, also in the volumetric sense, was lossy in nature.
On the contrary, the quartz sand, although manifesting higher loss factor, nevertheless had higher resistance, slightly lower than air. This confirms that the conductivity of the quartz sand material is smaller and, hence, can be less lossy than olivine. As expected, the conductive nature of the material might be due to the frequency-dependent polarisation mechanism and barrier charge build-up. Similar observations could be made from the volumetric impedance of the chosen materials. The olivine emerged with a lower bulk impedance, which seemed to drop with increasing frequency. On the contrary, the impedance of the air and quartz sand dropped linearly with the increase in frequency. With this information, the surface and volumetric impedance of the chosen samples were measured at higher frequencies, and their typical behaviour was analysed.

6.3. High-Frequency Impedance of the Char and Bed Materials at Ambient Temperature

The impedance measured was an outcome of the complex response of the material to the applied voltage. The impedance measured comprised the effect of the polarisation of the dipoles, ion migration, etc., which are dependent on the applied voltage and frequency. In other words, these relaxation processes are frequency dependent, individually containing different time constants and several characteristic frequencies. The resistance and capacitive reactance of the impedance carry information regarding the characteristics of the material’s conductivity and its ability to store the charges due to its capacitive nature. The dielectric material’s conductivity is contributed by the polarisation mechanism (relaxation process), while the permittivity (or capacitance) indicates the ability of the material to store charges, thereby to confine the electric field within the desired location. At lower frequencies, the slower time provides the opportunity for longer-range ion movements and barrier charging and discharging activities. At higher frequencies, the polarisation mechanism and the corresponding material’s conductivity reduces since the longer-range ionic movements, dipolar orientation, and other pertinent phenomena cease to follow the faster dynamic variation of the applied voltage. Therefore, the impedance measured at high frequencies collectively provides the overall response of the material.
Figure 7 and Figure 8 show the surface and volumetric impedance of the geometry of the test cell (air), quartz sand, olivine, and char materials. The respective values that significantly explains the typical behaviour of chosen samples of DBD materials are shown in Table 3. At first glance, it appears from Figure 7 that there are no spurious and/or regular resonant peaks and troughs, indicating the absence of the influence of the inherent impedance of the geometry of the test cell, connecting jumpers and cables. This ensures that there are no external impedances that compromise the measurement sensitivity and accuracy. It becomes clear from Figure 7 that there is a slight difference in the surface impedance measured from the geometry, quartz sand, and olivine at lower frequencies. At the initial frequencies (i.e., 103 Hz), the quartz sand emerged with a higher surface impedance than the test cell (air) and olivine. The measured value of the surface impedance of the quartz sand appeared close to 1.2 MΩ, while the same for the geometry and olivine was approximately 0.8 and 0.7 MΩ, respectively. These starting values of the surface impedance measured using the FRA method match the dielectric response analysis data, as shown in Figure 5d. This ensures the sensitivity of the adopted methods involved in the present study. A further increase in frequency caused the surface impedance of the chosen materials (other than the char) to remain in line with each other throughout the span.
As the frequency increased from 104 Hz, the values of the high-frequency surface impedance measured from the test cell (with air as the medium), quartz sand, and olivine remained close to 0.9 MΩ. As the frequency reached 106 Hz, the surface impedance of the chosen materials (test cell (air), quartz sand, olivine), despite remaining in line with each other, gradually dropped to 0.5 MΩ, which further reduced to a very low value at 107 Hz. The reason for the gradual drop of the surface impedance might be due to the progressive inclusion of the inductance of the test cell, geometry, wires, etc., which drew the measuring arrangement into a resonant condition. This behaviour fixed the threshold of the adopted measurement strategy to retain its sensitivity and accuracy. At the same time, the FRA experiments on the char samples (Figure 7) to measure their surface impedance revealed a different result. Two sets of char samples prepared for two different durations with a slight variation in their particle size were prepared and subjected to impedance measurements. Therefore, it is reasonable to expect deviations in their respective surface impedance as the effective surface area will be different. This confirms the fact that the structural information of the grains of the char, including their time of preparation (differences in water concentration), is very significant. As expected, the surface impedance of the chosen samples manifested different values. The char sample identified as “char#1” manifested 40 KΩ, while the second, identified as “char#2” manifested 65 kΩ, which remained constant throughout the measurement frequency. At higher frequencies (i.e., 107 Hz), the surface impedance seemed to drop slowly, indicating the gradual contribution of external inductances due to the test cell and geometry. With this information, the volumetric response of the chosen materials at high frequencies was recorded and analysed.
Figure 8 shows the high-frequency volumetric impedance of the chosen samples adopted in the present study. As can be observed from Figure 8, there were no kinks and/or regular peaks in the frequency-dependent volumetric impedance function. This confirms the fact that there was no significant influence of the inherent impedance function of the geometry of the test cell, connecting jumpers, cables, etc., or at least until a certain frequency. In the present context, the volumetric impedance of the chosen samples of the DBD bed materials seemed to match throughout the span of test frequencies. Even the minor deviations that appeared at the low frequencies of the surface impedance are absent. The measured value of the volumetric impedance of the bulk material was approximately 1 MΩ for frequencies ranging from 103 Hz to 106 Hz respectively. A further increase in frequency (i.e., from 106 Hz) caused the impedance of the chosen materials of the test cell (with air as the medium), quartz sand, and olivine to drastically drop to 104 Ω. This might indicate the drastic inclusion of the inherent inductance of the test cell, its geometry, jumpers, connectors, etc., which enforce a threshold on the applied frequency and measurement sensitivity.
Similar observations could be made on the two char samples (“char#1”, “char#2”) produced at the two different durations. As opposed to the surface impedance, the high-frequency volumetric response of the chosen char samples was the same and remained in line with each other throughout the frequency range. The value of the high-frequency volumetric impedance measured from both char samples remained within 34 MΩ until 2 MHz. Even the minor changes that appeared at the lower frequencies of the surface impedance (i.e., 104 Hz) of the chosen samples were absent in the present volumetric case. This may indicate that the particle volumetric dimensions were not as sensitive as the surface parameters. Beyond this frequency, the impedance drastically dropped to a very low value, indicating the further influence of the test cell and other factors contributing to the apparent inductance of the measuring circuit, enforcing threshold for the measurement procedure.
Summarising, the experiments under ambient temperature indicated a typical behaviour of the chosen samples at low and high frequencies. It appeared that the materials were more sensitive at lower frequencies, which might be due to the gradual contribution of the dielectric response such as slower polarisation mechanisms, barrier charging due to asymmetrical particle dimensions, parameters, and arrangements. With this information, the typical response of the char materials at higher temperatures were investigated. During this, the samples of the char materials were subjected to investigation as they are invariably present in the DBD reactor and gasifier units as an intermediate product after the thermo-chemical conversion of raw materials.

6.4. Electrical Properties of Char as a Bed Material at a Higher Temperature

Char is the by-product or intermediate product that emerges after the thermo-chemical conversion and gasification of solid raw materials. The pertinent process is also addressed as carbonisation, charring, and pyrolysis. Being a carbonaceous material, char manifests a lower resistance and has found wide application. Therefore, measuring the electrical properties of char implies recording and characterising the surface and volumetric components of resistance and impedance at ambient and high temperature over a wide frequency. Figure 9a–d show the measured values of the surface and volume resistance of the char samples and their trend manifested at higher temperatures under low frequencies. The corresponding values of the surface and volume resistance of the char materials are shown in Table 4. It becomes clear from Figure 9a–d that the surface and volumetric resistance of the char materials remained constant with respect to the frequency. This trend of the frequency independency of the surface and volume resistance of the char can be observed from 1 Hz to 1 kHz. Following this, another interesting observation can be made from Figure 9a and Figure 9b, respectively. Comparatively, the surface resistance of the char was relatively higher than the volumetric counterpart. The same can also be observed from Table 4. This indicates that the surface of the char material is more responsive than its volumetric counterpart, which is in consonance with the previous results.
At the same time, the temperature dependency of the surface resistance of the char material manifested a different result. The surface resistance seemed to increase with temperature, until it reached a critical point. In the present context, the value of the surface resistance at ambient temperature (i.e., 20 °C) was 20 Ω, and the critical temperature at which the surface resistance peaked to a value of 90 Ω was around 220 °C, respectively. Afterwards, any increase in temperature caused the surface resistance to drop to the ambient value, and this trend seemed to repeat like a quasi-sinusoidal waveform. Similar observations can be made for the volumetric resistance (Figure 9b). The volumetric resistance was frequency-independent and remained constant with the applied frequency. The temperature dependency seemed to more or less like quasi-sinusoidal; however, the resistance value measured was lower than its counterpart. With this information, the applied frequency was further widened and the high-frequency surface and volume impedance at higher temperatures were measured and analysed.
Figure 10a–d show the frequency-dependent surface and volumetric impedance of the char material measured under higher temperatures over a wide frequency. Table 4 shows the values of the surface and volumetric impedance of the char materials measured under higher temperatures over a wide frequency. As expected, the impedance measured was free from resonant peaks and troughs, which confirms that the chosen char material alone contributed to the response function and ascertained the adequacy of the adopted method. At first glance, it appears from Figure 10a–d that the surface and volumetric impedances were temperature dependent and not frequency dependent. In other words, the surface and volumetric impedance measured responded to any change in temperature while remaining unresponsive to any change in frequency. This is in consonance with the previous observations. It becomes clear from Figure 10a,c that the surface and volume impedance of the char material measured remained invariably the same at lower frequencies provided the applied temperature remained the same. For instance, the low-frequency surface impedance of the char material measured under room temperature remained at 9.958 Ω (Table 4), while the same reached (Table 4) 59.227 ohms at 220 °C, respectively, throughout the applied frequency (1 Hz to 103 Hz). This overall temperature dependency of the surface (Figure 10a) and volumetric impedance (Figure 10c) measured at lower frequencies manifested a quasi-sinusoidal behaviour, which is in consonance with the surface resistance (shown in Figure 9c).
Similar observations can also be made from the high volumetric impedance (Figure 10d) measured at different temperatures. The value of volumetric impedance at higher frequencies remained the same as long as the material temperature remained the same. As the material temperature increased, this forced the high-frequency volumetric impedance to change, which did not vary with the applied frequency. On the contrary, a different temperature dependency behaviour of the high-frequency surface impedance can be observed from Figure 10b. At ambient temperature, the surface impedance remained the same with the applied frequency or at least until 106 Hz. As the temperature increased, this consistency of the high-frequency surface impedance was lost, and the initial value as slightly lower, which required a critical frequency to reach a constant value. The same can be observed from Figure 10b: the high-frequency surface impedance at higher temperatures introduced initially mild deviations and later settled into a constant value with a further increase in the applied frequency. This once again confirms the fact that the surface impedance measurements were more responsive than the volumetric parametric measurements. With this information, the typical trend formed by the temperature dependency of the surface and volumetric impedances measured from the char material were recorded and analysed.
Figure 11a–d show the typical temperature dependency trend manifested by the surface and volumetric impedance manifested by the char material over a wide frequency range. It becomes clear from these figures that the trend formulated by the surface and volume impedance of the char material at lower and higher temperatures was incomparable with the previous findings. In all, the trend formed by the temperature dependency of the surface impedances was quasi-sinusoidal, which is in consonance with Figure 9a,c. At the same time, the trend formed by the temperature dependency of the volumetric impedance char materials measured at higher frequencies manifested a different result. Figure 11b,d shows that the apparent impedance dropped with the increasing temperature to a lower value. For instance, the high-frequency surface impedance, which was initially at 105.3 Ω at room temperature, dropped to 6.985 Ω as the applied temperature increased to 600 °C, respectively. The high-frequency volumetric impedance showed a temporary increase in the value of the impedance with the frequency; nevertheless, the trend seemed to drop with a further increase in the temperature. This behaviour is different from previous observations made on the chosen samples and char materials, respectively.
Thus, it becomes clear from these experiments that the surface and volumetric parameters of the chosen materials manifested significant temperature- and frequency-dependent characteristics. Such information acts as a valuable input while designing high-performance dielectric barrier discharge reactors and gasification units used for thermo-chemical conversion of the producer gas from the biomass raw materials.

7. Inferences

It emerges from this experimental study that the frequency-dependent surface and volumetric electrical properties of the chosen samples measured using the dielectric and frequency response analysis method can be invariably used for characterising their ambient and high-temperature behaviour. The pertinent interesting observations made from this experimental study are listed below:
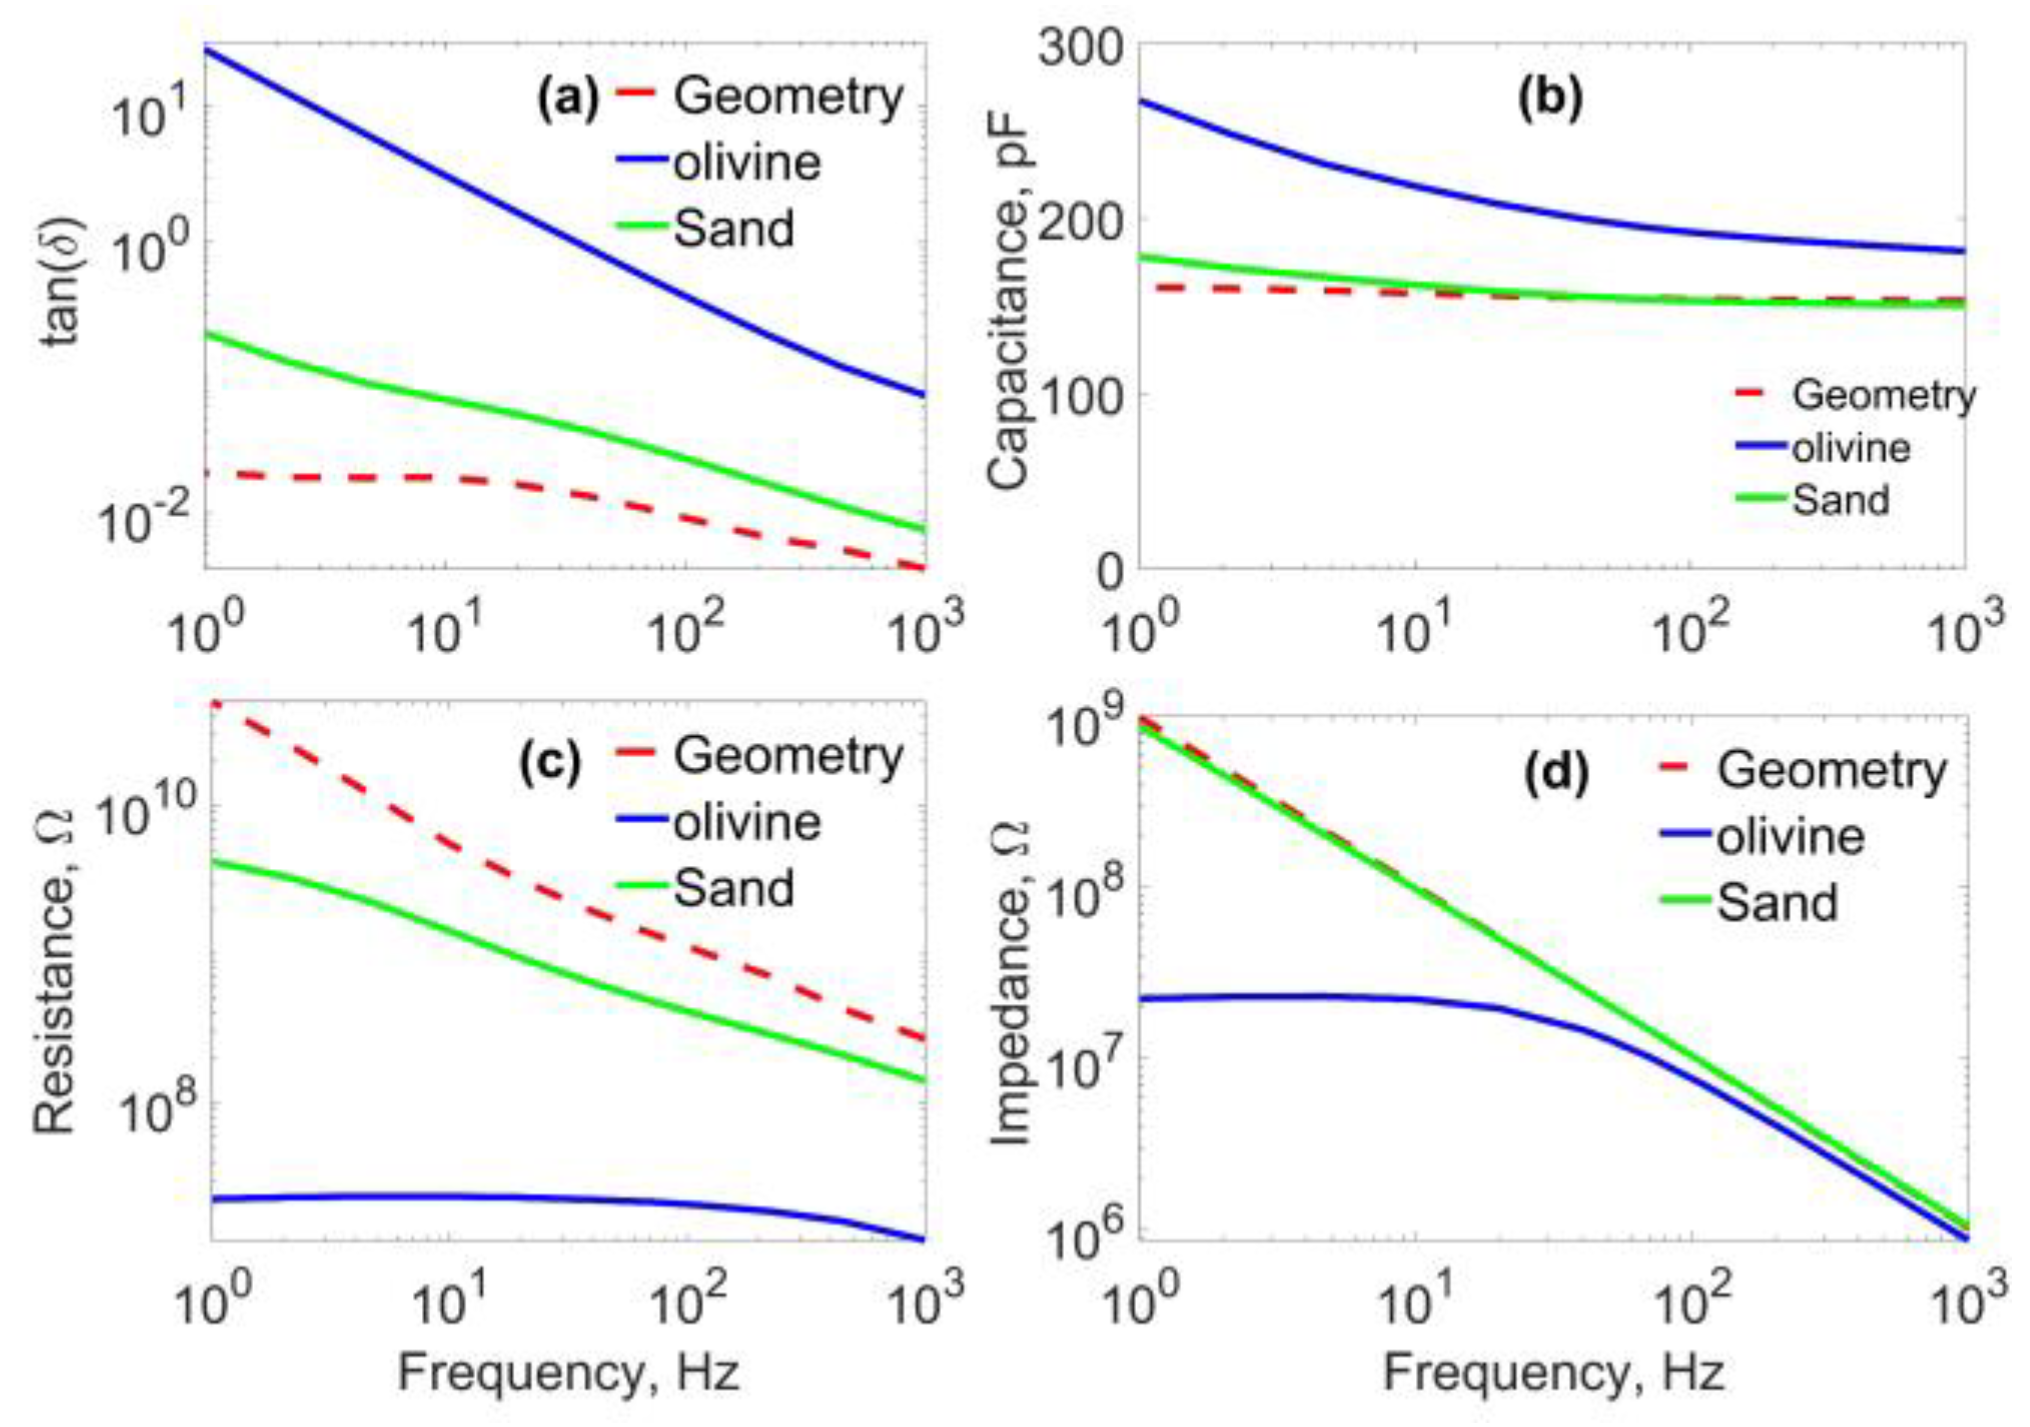
  • The experimental results obtained give evidence that the loss factor measured at ambient temperature from the surface and volumetric parameters of the chosen DBD reactor bed materials manifested significant differences with the applied frequency. The surface and volumetric loss factor quantifies the energy lost in the material; the capacitances indicate the ability of the material to store charges; surface resistance provides information on the apparent material’s conductivity caused by the frequency-dependent polarisation. The surface parametric loss factor of the quartz sand and air emerged with lower values throughout the frequency span, thereby qualified as better materials. Comparatively, the capacitance of the surface of the test cell and quartz sand measured remained close to each other at higher frequencies. A further decrease in frequency caused a slight increase in the surface capacitance of the quartz sand, indicating a slightly better ability to store charges, contributed by the barriers and junctions formed by the quartz sand granules. Contrary to this, the surface parameter of the olivine material emerged with a higher loss factor at lower frequencies, which monotonically reduced with increasing frequency. The olivine with a higher dielectric constant manifested a higher ability to store charges on its surface at lower frequencies. As the frequency increased, the surface capacitance of the olivine decreased exponentially. Considering its surface resistance, which is lower than the quartz sand and air, it is possible to expect dominant conductivity in the olivine due to polarisation mechanism, making it higher in dielectric loss.
  • The volumetric response of the chosen DBD reactor materials at ambient temperature remained more of less similar to that of the surface parametric measurements. The quartz sand and test cell (with air as the medium) emerged as better materials with a loss factor less than the olivine material. The pertinent volumetric response of the material indicated that the quartz sand and geometry of the test cell emerged with a loss factor lower than 1.0, while the same for the olivine was close to 10. Similar observations can be made from the volumetric capacitance, resistance, and impedance measured from the chosen DBD reactor materials. The volumetric capacitance of the olivine showed higher values at lower frequencies, indicating the ability of the bulk material to aid in storing charges in response to the applied voltage, which decreased exponentially with increasing frequency.
  • The impedance measured at high frequencies collectively provided the overall response of the material. The measured impedance collectively described the typical behaviour of the frequency-dependent relaxation process containing several characteristic frequencies. The resistance and capacitive reactance of the impedance carry information regarding the characteristics of the material’s conductivity and its ability to store the charges due to its capacitive nature. The dielectric material’s conductivity was contributed by the polarisation mechanism (relaxation process), while the permittivity (or capacitance) indicated the ability of the material to store charges, thereby to confine an electric field within the desired location. It emerged from these experiments that the surface impedance of the chosen DBD materials manifested differences at lower frequencies, i.e., in the kHz range. A further increase in the frequency forced the surface impedances to match, which dropped to a lower value. At the same time, the volumetric impedance of the chosen materials remained the same throughout the frequency range.
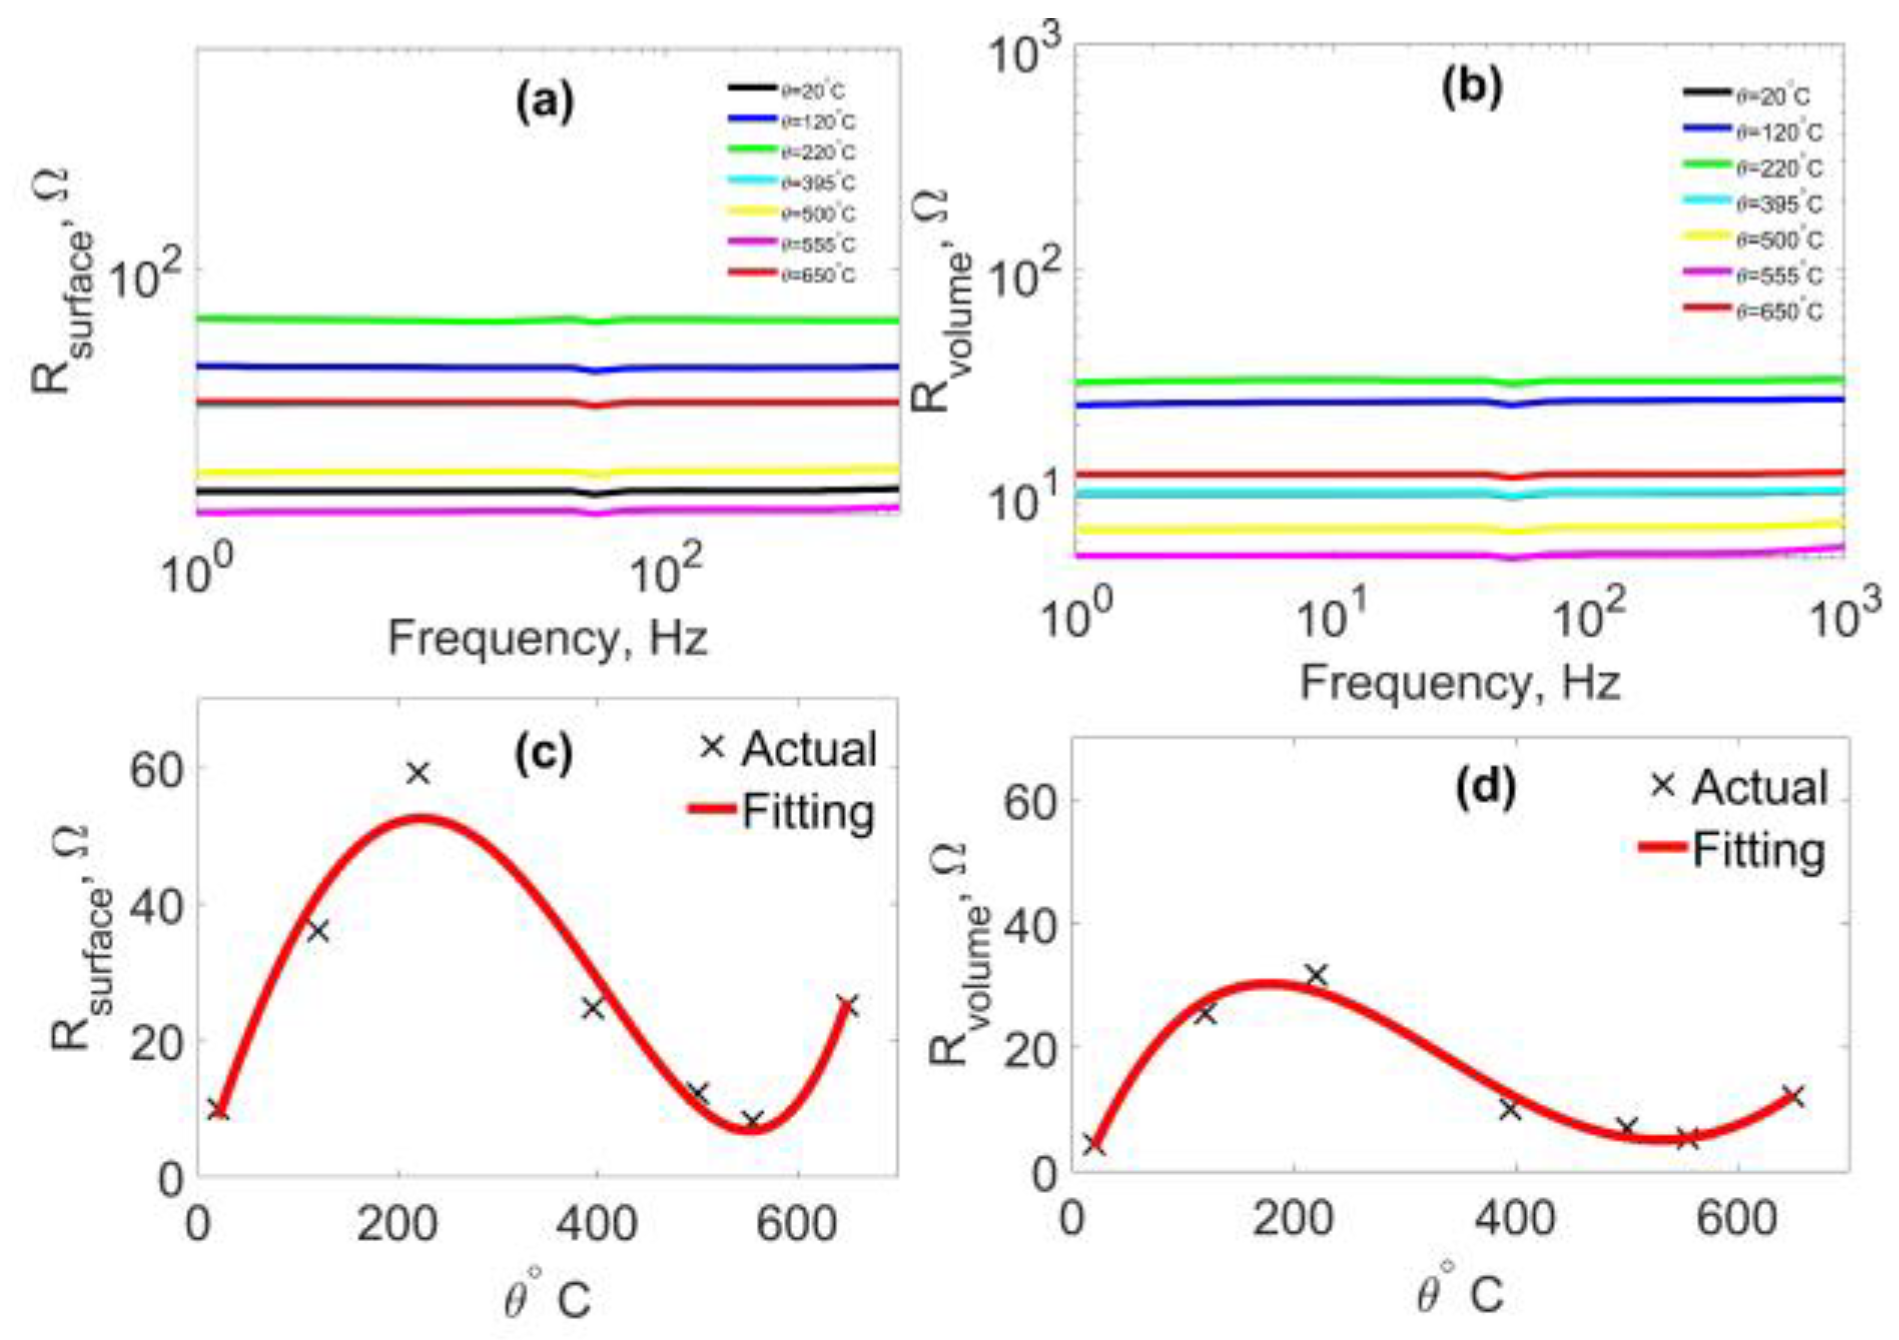
  • Char, being a carbonaceous material, is predominantly conductive in nature. Therefore, the electrical property of char implies recording and characterising the surface and volumetric components of resistance and impedance at ambient and high temperature over a wide frequency range. It is understood through experiments that the surface of the char is more responsive than the bulk material. The resistance measured from the surface and volume of the char under ambient temperature remained constant with frequency. At the same time, the temperature dependency of the char seemed to be different. The temperature dependency of the surface and volumetric resistance seemed to be oscillatory at low frequencies. At lower frequencies, the surface and volumetric resistance increased with the temperature until a higher threshold value, beyond which, the same dropped until it reached a lower threshold value. A similar trend can be observed from the impedance function only at lower frequencies. At higher frequencies, the surface and volumetric resistance seemed to drop with temperature, reached a steady lower value, and remained at the same.
Thus, it appears from the experimental study that the chosen materials are individually better materials and can be invariably used as bed materials for DBD reactors and gasification plants. In addition, studying the electrical properties of the materials over a wide frequency range completely characterised the typical behaviour of the chosen bed materials, thereby helping to determine the performance and operating efficiency of DBD reactors and gasification units, respectively.

8. Conclusions

Experimental investigations on the chosen test samples of gasifier bed materials indicated interesting results. The electrical characteristics of the chosen samples showed a typical and notable behaviour over a wide range of frequency. The char sample emerged as being semi-conductive, indicating the requirement for a new test cell arrangement specifically designed to suit its testing requirements. In this regard, more detailed and systematic investigations along with a deep understanding and the correlation with their physical and chemical structure become necessary to understand the relevant phenomena. This forms the next step of investigation. Furthermore, the gasifier bed materials at high temperatures manifested a different behaviour, hence also being experimentally investigated. The conductivity seemed to increase to a certain value beyond a certain critical frequency. Such an observation could be made irrespective of the operating temperature. This indicates that more detailed investigations are necessary before understanding the deduced mechanisms. In addition, a more detailed model that incorporates the structural information of the grains, packing ratio, size, shape, weight, water concentration, etc., is necessary to accurately represent the arrangement. This forms the future scope of the present experimental study.

Author Contributions

Conceptualisation, P.S. and Y.N.; methodology, S.A. and P.S.; validation, S.A. and P.S.; formal analysis, S.A.; investigation, S.A. and P.S.; resources, P.S. and Y.N.; writing—original draft preparation, S.A.; writing—review and editing, S.A., P.S., Y.N. and T.S.; visualisation, S.A., P.S., Y.N. and T.S.; supervision, Y.N.; project administration, P.S. and Y.N.; funding acquisition, Y.N. All authors have read and agreed to the published version of the manuscript.

Funding

The authors extend their sincere thanks to the funding agencies for their support in the development of this work. This research work was carried out within the junior research group NWG-TCKON funded by the German Federal Ministry of Education and Research through the Projekträger Jülich PtJ (FkZ: 03SF0442). The collaboration with the University of Rostock, High Voltage and High Current Technologies, Rostock, Germany, was funded via a sub-contract within the aforementioned project.

Acknowledgments

The authors express their sincere thanks to Sascha Kosleck, University of Rostock, Institute of Marine Engineering, LMT/MSF, Germany, for his moral and invaluable support in publishing this work.

Conflicts of Interest

The authors declare no conflict of interest.

References

  1. Akdemir, M.; Hansu, F. Effect of Dielectric Barrier Discharges on the Elimination of Some Flue Gases. IEEE Trans. Plasma Sci. 2020, 48, 1030–1034. [Google Scholar] [CrossRef]
  2. Kogelschatz, U. Dielectric-barrier discharges: Their history, discharge physics, and industrial applications. Plasma. Chem. Plasma Process. 2003, 23, 1–46. [Google Scholar] [CrossRef]
  3. Wang, W.; Zhao, Z.; Liu, F.; Wang, S. Study of NO/NOx removal from flue gas contained fly ash and water vapor by pulsed corona discharge. J. Electrost. 2005, 63, 155–164. [Google Scholar] [CrossRef]
  4. Ma, H.; Chen, P.; Zhang, M.; Lin, X.; Ruan, R. Study of SO2 removal using non-thermal plasma induced by dielectric barrier discharge (DBD). Plasma Chem. Plasma Process. 2002, 22, 239–254. [Google Scholar] [CrossRef]
  5. Ma, S.; Zhao, Y.; Yang, J.; Zhang, S.; Zhang, J.; Zheng, C. Research progress of pollutants removal from coal-fired flue gas using non-thermal plasma. Renew. Sustain. Energy Rev. 2017, 67, 791–810. [Google Scholar] [CrossRef]
  6. Arumugam, S.; Schröder, P.; Neubauer, Y.; Schoenemann, T. Dielectric and Partial Discharge Investigations on Ceramic Insulator Contaminated with Condensable Hydrocarbons. IEEE Trans. Dielectr. Electr. Insul. 2014, 21, 2512–2524. [Google Scholar] [CrossRef]
  7. Schröder, P.; Arumugam, S.; Neubauer, Y. Application of Non-Thermal Plasma for Improving Producer Gas Quality. In Proceedings of the 24th European Biomass Conference and Exhibition, Amsterdam, The Netherlands, 6–9 June 2016; pp. 553–557. [Google Scholar]
  8. Parvulescu, V.I.; Magureanu, M.; Lukes, P. Plasma Chemistry and Catalysis in Gases, and Liquids; Wiley-VCH: Weinheim, Germany, 2012; ISBN 978-3-527-33006-5. [Google Scholar]
  9. Takaki, K.; Jani, M.A.; Fujiwara, T. Removal of nitric oxide in flue gases by multi-point to plane dielectric barrier discharge. IEEE Trans. Plasma Sci. 1999, 27, 1137–1145. [Google Scholar] [CrossRef]
  10. Anaghizi, S.J.; Talebizadeh, P.; Rahimzadeh, H.; Ghomi, H. The configuration effects of electrode on the performance of dielectric barrier discharge reactor for NOx removal. IEEE Trans. Plasma Sci. 2015, 43, 1944–1953. [Google Scholar] [CrossRef]
  11. Urashima, K.; Chang, J.-S.; Ito, T. Reduction of NOx from combustion flue gases by superimposed barrier discharge plasma reactors. IEEE Trans. Ind. Appl. 1997, 33, 879–886. [Google Scholar] [CrossRef]
  12. Sijia, N.I.; Yixi, C.A.I.; Yunxi, S.H.I.; Weikai, W.A.N.G.; Nan, Z.H.A.O.; Yirui, L.U. Effects of packing particles on the partial discharge behavior and the electrical characterization of oxygen PBRs. Plasma Sci. Technol. 2020, 23, 015405. [Google Scholar]
  13. Takaki, K.; Urashima, K.; Chang, J. Ferro-electric pellet shape effect on C2F6 removal by a packed-bed-type nonthermal plasma reactor. IEEE Trans. Plasma Sci. 2004, 32, 2175–2183. [Google Scholar] [CrossRef]
  14. Chen, M.; Jin, L.; Liu, Y.; Guo, X.; Chu, J. Decomposition of NO in automobile exhaust by plasma–photocatalysis synergy. Environ. Sci. Pollut. Res. 2014, 21, 1242–1247. [Google Scholar] [CrossRef] [PubMed]
  15. Wang, T.; Sun, B.-M. Effects of O2 and H2O on SO2 removal by dielectric barrier discharge at various temperatures. Jpn. J. Appl. Phys. 2014, 53, 046201. [Google Scholar] [CrossRef]
  16. Pham, H.-C.; Kim, K.-S. Effect of TiO2 thin film thickness on NO and SO2 removals by dielectric barrier discharge-photocatalyst hybrid process. Ind. Eng. Chem. Res. 2013, 52, 5296–5301. [Google Scholar] [CrossRef]
  17. Pang, Y.; Bahr, L.; Fendt, P.; Zigan, L.; Will, S.; Hammer, T.; Baldauf, M.; Fleck, R.; Müller, D.; Karl, J. Plasma-Assisted Biomass Gasification with Focus on Carbon Conversion and Reaction Kinetics Compared to Thermal Gasification. Energies 2018, 11, 1302. [Google Scholar] [CrossRef] [Green Version]
  18. Roland, U.; Holzer, F.; Kopinke, F.-D. Combination of non-thermal plasma and heterogeneous catalysis for oxidation of volatile organic compounds: Part 2. Ozone decomposition and deactivation of γ-Al2O3. Appl. Catal. B Environ. 2005, 58, 217–226. [Google Scholar] [CrossRef]
  19. Pekarek, S. Experimental study of surface dielectric barrier discharge in air and its ozone production. J. Phys. D Appl. Phys. 2012, 45, 075201. [Google Scholar] [CrossRef]
  20. Dwivedi, C.; Toley, M.A.; Dey, G.R.; Das, T.N. Ozone Generation from Argon-Oxygen Mixtures in Presence of Different Packing Materials within Dielectric Barrier Discharge Gap. Ozone Sci. Eng. 2015, 35, 134–145. [Google Scholar] [CrossRef]
  21. Huang, W.; Ren, T.; Xia, W. Ozone Generation by Hybrid Discharge Combined with Catalysis. Ozone Sci. Eng. 2013, 29, 107–112. [Google Scholar] [CrossRef]
  22. Kostov, K.G.; Honda, R.Y.; Kayama, M.E.; Alves, L.S.M. Characteristics of dielectric barrier discharge reactor for material treatment. Braz. J. Phys. 2009, 39, 322–325. [Google Scholar] [CrossRef]
  23. Liu, L.-J.; Li, X.-X.; Wang, H.; Xue, B.; Zheng, X.-M.; Chen, M. Application of combined plasma-catalytic method for carbon particulate matter (PM) removal. Royal Soc. Adv. 2015, 5, 40012–40017. [Google Scholar] [CrossRef]
  24. Nguyen, V.T.; Nguyen, D.B.; Heo, I.; Mok, Y.S. Plasma-Assisted Selective Catalytic Reduction for Low-Temperature Removal of NOx and Soot Simulant. Catalysts 2019, 9, 853. [Google Scholar] [CrossRef] [Green Version]
  25. Ray, D.; Chawdhury, P.; Subrahmanyam, C. A facile method to decompose CO2 using a g-C3N4-assisted DBD plasma reactor. Environ. Res. 2020, 183, 109286. [Google Scholar] [CrossRef] [PubMed]
  26. Ray, D.; Subrahmanyam, C. CO2 decomposition in a packed DBD plasma reactor: Influence of packing materials. Royal Sci. Chem. Adv. 2016, 6, 39492–39499. [Google Scholar]
  27. Mei, D.; Zhu, X.; He, Y.L.; Yan, J.D.; Tu, X. Plasma-assisted conversion of CO2 in a dielectric barrier discharge reactor: Understanding the effect of packing materials. Plasma Sources Sci. Technol. 2015, 24, 015011. [Google Scholar] [CrossRef] [Green Version]
  28. Marzec, A.; Czaijkowska, S.; Moszynski, J. Electrical resistivity of carbonized coals. Energy Fuels 1994, 8, 1296–1303. [Google Scholar] [CrossRef]
  29. Challa, S.; Little, W.E.; Cha, C.Y. Measurement of the dielectric properties of char at 2.45 GHz. J. Microw. Power Electromagn. Energy 1994, 29, 131–137. [Google Scholar] [CrossRef]
  30. Eidem, P.A. Electrical Resistivity of Coke Beds. Ph.D. Thesis, Norwegian University, Trondheim, Norway, 2008. [Google Scholar]
  31. Duba, A.G. Electrical conductivity of coal and coal char. Fuel 1977, 56, 441–443. [Google Scholar] [CrossRef]
  32. Koei, N.A.; Hata, T.; Ishihara, S. Mechanism and clarification of electrical conduction through wood charcoal. Wood Res. 1995, 82, 34–36. [Google Scholar]
  33. Lucas, J. Bestimmung des spezifischen elektrischen Widerstands mit einer speziellen Messzelle. Tech. Sicherh. Bd 2011, 1, 33–36. [Google Scholar]
  34. Teipel, U.; Wolf, S.; Schreiber, A. Durchgangswiderstand von partikulären Systemen. Chem. Ing. Tech. 2020, 92, 229–237. [Google Scholar] [CrossRef]
  35. Arumugam, S. Theoretical Considerations While Applying Frequency Response Analysis Method in Determining the Inter-Winding Capacitance of Power Transformers at Higher Frequencies. Eng. Rep. 2019, 1, e12036. [Google Scholar]
  36. Panda, N. Complex impedance spectroscopy for monitoring frequency response to the electrical properties of polycrystalline materials. Int. J. Intellig. Comp. Appl. Sci. 2016, 4, 14–19. [Google Scholar]
Figure 1. Pictorial description of the samples of the DBD reactor bed materials that are commonly used for generic applications. (a) Quartz sand (b); olivine (c); char.
Energies 15 09241 g001
Figure 2. Schematic and pictorial description of the test cell used for measuring the surface and volumetric electrical properties of the DBD reactor bed materials at room and high temperature. (a) Schematic; (b) electrode with Teflon insulation; (c) test cell filled in with samples used at room temperature; (d) test cell used at a higher temperature.
Energies 15 09241 g002
Figure 3. Measuring principle for recording the electrical properties of the chosen DBD reactor bed materials. (a) Surface parameter; (b) volume parameter; (c) RC circuit analogy of surface measurements after volume parameters guarded out; (d) RC circuit analogy of volume measurements with volumetric parameters guarded out.
Energies 15 09241 g003
Figure 4. Setup used for measuring the frequency-dependent electrical properties of the DBD reactor bed materials. (a) Ambient temperature; (b) higher temperature; (c) common schematic diagram showing the underlying principle of performing a frequency response measurement.
Energies 15 09241 g004
Figure 5. Surface parametric electrical properties of the chosen samples of the DBD bed materials measured at ambient temperature. (a) Loss factor; (b) capacitance; (c) resistance; (d) impedance.
Energies 15 09241 g005
Figure 6. Volume parametric electrical properties of the DBD bed materials measured at ambient temperature. (a) Loss factor; (b) capacitance; (c) resistance; (d) impedance.
Energies 15 09241 g006
Figure 7. Surface impedance of the chosen samples of the DBD bed materials measured at ambient temperature.
Energies 15 09241 g007
Figure 8. Volumetric impedance–frequency response function of the chosen samples of the DBD bed materials measured at ambient temperature.
Energies 15 09241 g008
Figure 9. Temperature-dependent surface and volume parametric resistance of the char material measured under higher temperature. (a) Actual values of surface resistance; (b) actual values of volumetric resistance; (c) temperature dependency of the surface resistance; (d) temperature dependency of the volumetric resistance.
Energies 15 09241 g009
Figure 10. Surface and volume parametric impedance of the char material measured under a higher temperature over a wide frequency. (a) Surface impedance at low frequencies (1 Hz to 103 Hz); (b) surface impedance at high frequencies (104 Hz to 106 Hz); (c) volumetric impedance at low frequencies (1 Hz to 103 Hz); (d) volumetric impedance at low frequencies (104 Hz to 106 Hz).
Energies 15 09241 g010
Figure 11. Trend of the temperature dependency of the surface and volume parametric impedance of the char material measured at a higher temperature over a wide frequency. (a) Surface impedance at low frequencies (1 Hz to 103 Hz); (b) trend of the temperature dependency of the surface impedance at high frequencies (104 Hz to 106 Hz); (c) volumetric impedance at low frequencies (1 Hz to 103 Hz); (d) trend of the temperature dependency of the volumetric impedance at low frequencies (104 Hz to 106 Hz).
Energies 15 09241 g011
Table 1. Surface electrical properties of the DBD bed materials measured at frequencies from 1 Hz to 103 Hz.
Dielectric
Material Filling in Cell
FrequencySurface Parameter
Loss FactorCapacitanceResistanceImpedance
Hzp.u.pFGΩMΩ
Air10.0199160.82049.797989.451
500.0122154.7141.69020.573
1030.0039153.0220.2681.040
Quartz Sand10.2128178.2584.196873.285
500.0359154.8170.57220.547
1030.0075150.6550.1401.056
Olivine126.486267.43711.88122.453
500.7328197.96121.94312.970
1030.0738181.43411.8810.875
Table 2. Volume electrical properties of the DBD bed materials measured at frequencies from 1 Hz to 103 Hz.
Dielectric
Material Filling in Cell
FrequencyVolume Parameter
Loss FactorCapacitanceResistanceImpedance
Hzp.u.pFGΩMΩ
Air10.238014.37646.25110,770.0
500.17417.4592.4510420.413
1030.03656.5740.663024.194
Quartz Sand11.480251.2452.09801739.0
500.446516.7360.4259425.920
1030.103311.8640.1298129.859
Olivine19.3966246.70568.65568.269
500.771186.17347.9029.251
1030.226963.28511.0852.453
Table 3. Surface and volume electrical properties of the DBD bed materials measured at a higher frequency.
MaterialFrequencies Ranging 1 Hz to 103 HzFrequency 103 Hz to 106 Hz
Surface Impedance (ZL)Volume Impedance (ZL)Surface (ZV)Volume (ZV)
1501031 Hz50 Hz103104104104104
MΩMΩMΩMΩMΩMΩMΩMΩMΩMΩ
Air989.45120.5731.04010,770.0420.41324.1940.88810.52831.0240.9532
$ Sand873.28520.5471.0561739.0425.920129.8590.90410.52010.87420.8738
Olivine22.45312.9700.87568.26929.2512.4530.86230.52650.90380.9174
Char10.06600.06590.03320.0338
Char20.04090.04120.03270.336
$ Quartz sand.
Table 4. Surface and volume electrical properties of Char at wider temperature and frequency.
TemperatureLow Frequency 100–103 HzHigh Frequency 104–106 Hz
Surface ParameterVolume ParameterSurfaceVolume
ResistanceImpedanceResistanceImpedanceImpedanceImpedance
θRSLZSLRVLZVLZSHZVH
°C
209.9729.9584.3554.323105.328.78
12036.07536.07125.494255.48912.8610.2
22059.22759.22531.67431.6704.6287.956
40024.71224.70710.06810.06815.9304.652
50012.23012.2176.9626.985
5558.1268.1095.3265.3262.6
65025.09825.09112.11612.1162.211
Publisher’s Note: MDPI stays neutral with regard to jurisdictional claims in published maps and institutional affiliations.

