Article

Energy-Saving Potential Comparison of Different Photovoltaic Integrated Shading Devices (PVSDs) for Single-Story and Multi-Story Buildings

1
School of Architecture, Tsinghua University, Beijing 100080, China
2
Key Laboratory of Eco Planning & Green Building, Ministry of Education (Tsinghua University), Beijing 100080, China
3
Architectural Design and Research Institute of Tsinghua University, Beijing 100084, China
*
Author to whom correspondence should be addressed.
Energies 2022, 15(23), 9196; https://doi.org/10.3390/en15239196
Submission received: 31 October 2022 / Revised: 25 November 2022 / Accepted: 29 November 2022 / Published: 4 December 2022
(This article belongs to the Special Issue Low-Carbon Building and City Strategies in Different Dimensions)

Abstract

:
Building-integrated photovoltaic (BIPV) façades are a promising technique for improving building energy performance. This study develops energy simulation models of different photovoltaic-integrated shading devices (PVSDs) in single-story and multi-story office buildings. A cross-region study in China is carried out to explore the energy performance of PVSDs in five climate zones. The shading effect of the upper PVSDs is taken into account. The results show that (1) PVSDs can be applicable in hot and cold climates; shading effects lead to a notable difference in the optimal PVSDs style. The average comprehensive energy saving ratios of different PVSDs ranged from 16.12% (fixed PV louvres in the vertical plane) to 51.95% (lower single panel). The most rewarding PVSDs are for single-story buildings in Kunming and the least suitable are for multi-story buildings in Guangzhou. (2) In climate zones with little air-conditioning energy consumption, avoiding considerably increased lighting consumption by PVSDs is vital. (3) To reduce shading effects, solar panels with smaller widths or vertical placements can be adopted. In addition, the distance of the PV modules from the top edge of the windows is also critical. Building performance evaluation in the early design stage enables maximum benefits for the same input (total area of PV panels). The research methodology and data analysis presented can guide parameters design and the geographical applicability of PVSDs, providing a reference for optimal building energy performance.

1. Introduction

Greenhouse gases such as carbon dioxide originating from fossil fuels are causing constant global warming and it has become a consensus in all fields to reduce energy consumption [1]. According to the International Energy Agency (IEA), buildings account for more than 30% of global energy consumption [2] and the building sector accounts for 40% of total carbon dioxide emissions, which is constantly increasing [3]. With rapid urbanization, many developing countries face the challenge of a low-carbon transition. In China, for example, according to statistics in the China Building Energy Consumption Study 2020, the total life-cycle energy consumption of buildings nationwide was 2.147 billion tons of standard coal in 2018 [4], which corresponds to a significant carbon footprint. Chinese government departments have consistently encouraged the promotion and application of building energy efficiency technologies, and have achieved considerable success [5]. China has also published and executed the “General code for energy efficiency and renewable energy application in buildings” (GB 55015-2021), which has led to more attention being paid to renewable energy technologies for buildings; the code calls for new buildings to be assembled with solar energy systems to meet the energy needs of the building [6]. The integration of photovoltaics in the building envelope is a promising energy-saving strategy (Figure 1). Especially for a country such as China with a huge building capacity, promoting renewable energy technologies such as the building-integrated photovoltaic (BIPV) is crucial [7].
Building façades significantly shape the indoor physical environment for thermal comfort and people health [9]. The introduction of BIPV products in the façade will also increase the energy-saving potential of the building through PV generation—this also usually alters the daylighting and thermal performance of building façades [10]. Experimental and simulation studies have been carried out on the daylighting, thermal performance, and the electricity generation of BIPV façades.
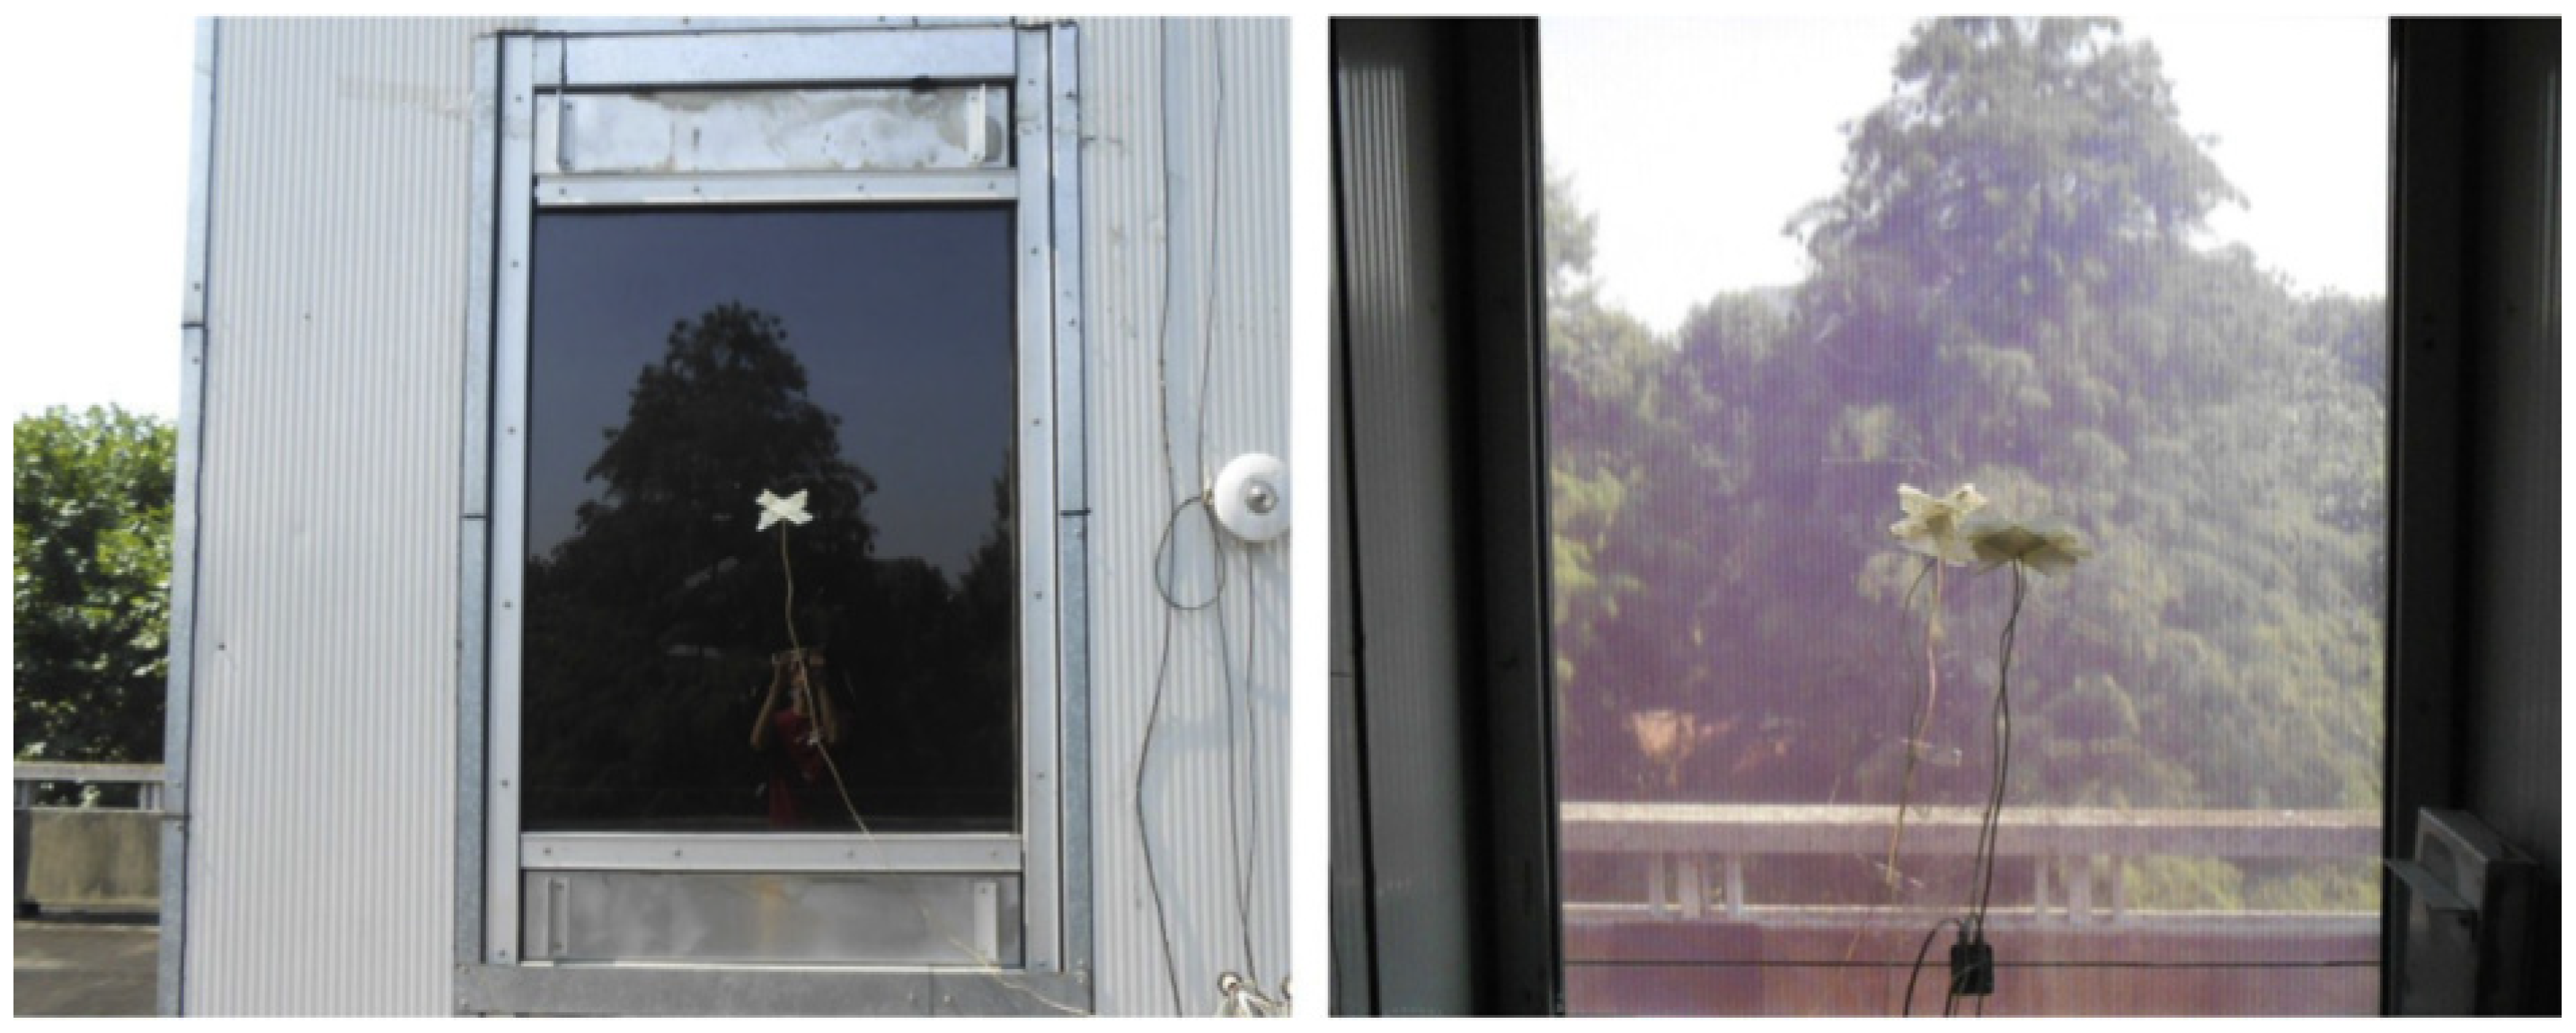
PV glazing allows for the generation of electricity while providing a window view (Figure 2). Liao et al. [11] compared the energy performance of a-Si windows with traditional windows, which confirmed that a-Si windows could effectively reduce cooling energy consumption; the influence of room depth, room height, and the window-to-wall ratio on the building energy performance was also investigated, which highlights the importance of building design parameters. Lee et al. [12] conducted a two-year study by building a full-scale mock-up to investigate the power generation performance of a semi-transparent DSSC BIPV window and found that the efficiency of the DSSC PV was related to sky cloudiness and radiation intensity. Jarimi et al. [13] proposed a semi-transparent thin-film PV vacuum glazing with a low U-value, which effectively expanded the energy-saving potential of PV glazing.
To further improve the thermal insulation of the PV glazing, another layer of traditional glazing can be installed on the inside part, which forms a photovoltaic double-skin façade (Figure 3). Wang et al. [14] proposed a photovoltaic double-skin façade with CdTe cells and evaluated its comprehensive energy performance, characterizing its advantages in seasonal energy performance. Although lighting consumption increased, the benefits from its PV generation and thermal performance were more significant. Peng et al. [15,16,17] proposed a semi-transparent a-Si BIPV façade. Further, the PV generation, thermal and lighting performance of this façade were investigated to assess its comprehensive energy-saving potential and optimal operation strategy. Yang et al. [18] evaluated the energy-saving potential of BIPV/T double-skin façade in three Australian climate zones (Darwin, Sydney, and Canberra as typical cities) using simulation studies. It was found that annual comprehensive energy savings of over 100% could be achieved, even based on reasonable façade design parameters. The study also investigated the impact of the façade’s different ventilation patterns on the building energy performance.
Solar panels can also be integrated into the building façade as shading devices, forming PVSDs (Figure 4) that do not affect the coloration of the lightguide [19]. Yoo et al. [20] explored the energy-saving potential of PVSDs on the south façade of a building in the Giheung area (37.27° N) using an over one-year measurement. The results show that the average efficiency of PV panels varies between seasons, with PVSDs reaching a 15.5% power generation efficiency in winter. Sun et al. [21,22] investigated PV panels’ power-generation and thermal performance as shading devices at different tilt angles and orientations in Hong Kong (22.3° N). At the same time, the study gave optimal design solutions for different scenarios of PVSDs use. Additionally, in Hong Kong, Zhang et al. [23] explored the optimal installation angles for PVSDs by EnergyPlus, taking into account lighting consumption, air conditioning consumption, and PV generation. The results showed that tilt angles of 30° and 20° were suggested for the two scenarios with the most energy generation and the highest comprehensive energy saving ratio, respectively. Mandalaki et al. [24] investigated the energy-saving potential of applying different PVSDs in Athens (37.58° N) and Chania (35.30° N) through a combination of measurement (1/10 scale physical model) and simulation. The study explored multiple design parameters for PVSDs, with various total solar panel areas used for PVSDs. Skandalos et al. [25] explored the energy performance of four BIPV façades (of which there were two PVSDs) in Prague (33° N), Athens (27.2° N), and Dubai (21° N). The results show that BIPV technology can have passive energy savings of up to 43% in addition to electricity production. Li et al. [26] investigated the comprehensive energy efficiency of PVSDs in multi-story buildings. This study identified an optimal design solution based on the tilt angle and width of the PV panels to reduce the loss of energy efficiency to shading effects from upper PVSDs. Baghoolizadeh et al. [27] considered six design parameters of PVSDs and built simulation models through EnergyPlus to simulate the performance of five European cities (Berlin, 52.38° N; London, 51.33° N; Madrid, 40.7° N; Milan, 45.67° N; and Paris, 49.02° N). In addition, this study explored the static payback period of PVSDs in different cities. In another study by Baghoolizadeh et al. [28], the multi-objective optimal design of PVSDs was carried out for cities such as Tehran, Iran (35.42° N), and the results showed that PV shading devices could save up to 22% of electricity use in the summer. Gindi et al. [29] explored the energy-saving potential of 14 types of PVSDs for office buildings in Cairo, Egypt (30.1128° N) through DesignBuilder, while considering the energy performance of different building orientations. Mesloub et al. [30] evaluated the energy performance and visual comfort of five BIPV façades (four PVSDs and one PV glazing) using EnergyPlus in the hot desert climate of Saudi Arabia (27° N); the results show that PVSDs can effectively improve the comprehensive energy performance and reduce glare.
Although many studies on the energy-saving potential of PVSDs have been reported, few studies compare the difference in energy benefits of PVSDs applied in single-story and multi-story buildings. Compared to single-story buildings, PVSDs on multi-story façades are affected by the shading of the upper PVSDs, and the extent of the shading effect varies between different styles of PVSDs. Not only that, the cost of BIPV products is mainly determined by the PV panels [33], and the comprehensive energy saving benefits of different PVSDs are not compared under the same total PV panel areas. In addition, little research has focused on the energy efficiency of PVSDs applied in cold regions. China is a vast country and the energy-saving potential of PVSDs in different climate zones needs to be compared—there are differences in meteorological parameters such as solar energy resources and outdoor temperature in different climate zones [34]. Therefore, it is necessary to conduct a comparative study of the energy-saving potential of PVSDs in single-story and multi-story buildings with different parameter configurations; simultaneously, a cross-region study is necessary. Research results can be made available to guide the selection and design of PVSDs.
Based on the background described, this study was carried out from the following perspectives. (1) What is the difference between the energy-saving potential of PVSDs applied to single-story and multi-story buildings due to shading effects? (2) How does the performance of PVSDs differ between five climate zones in terms of comprehensive energy performance, particularly in the severe cold and cold zones? (3) Based on the same total area of PV panels, what climate zones or single-story/multi-story buildings are different PVSDs applicable to?
In general, this study investigates the energy performance of PVSDs in building façade in five typical climate zones in China. The types of energy with gaming relationships considered include three aspects—air conditioning energy consumption, lighting consumption, and PV generation. The five climate zones (typical city) include the severe cold zone (Harbin, 45.75° N), cold zone (Beijing, 39.93° N), hot-summer and cold-winter zone (Shanghai, 31.40° N), temperate zone (Kunming, 25.02° N), and hot-summer and warm-winter zone (Guangzhou, 23.22° N). Nine PVSDs with different design parameters (PV panels with the same total area) in single-story and multi-story buildings were modelled, for a comparison study of the comprehensive energy-saving potential. The results of this study can guide the performance-oriented shape design of PVSDs in different climate zones and in single-story and multi-story buildings, improving the effective optimization of whole-life building performance in the early design stage [35].

2. Materials and Methods

2.1. Workflow

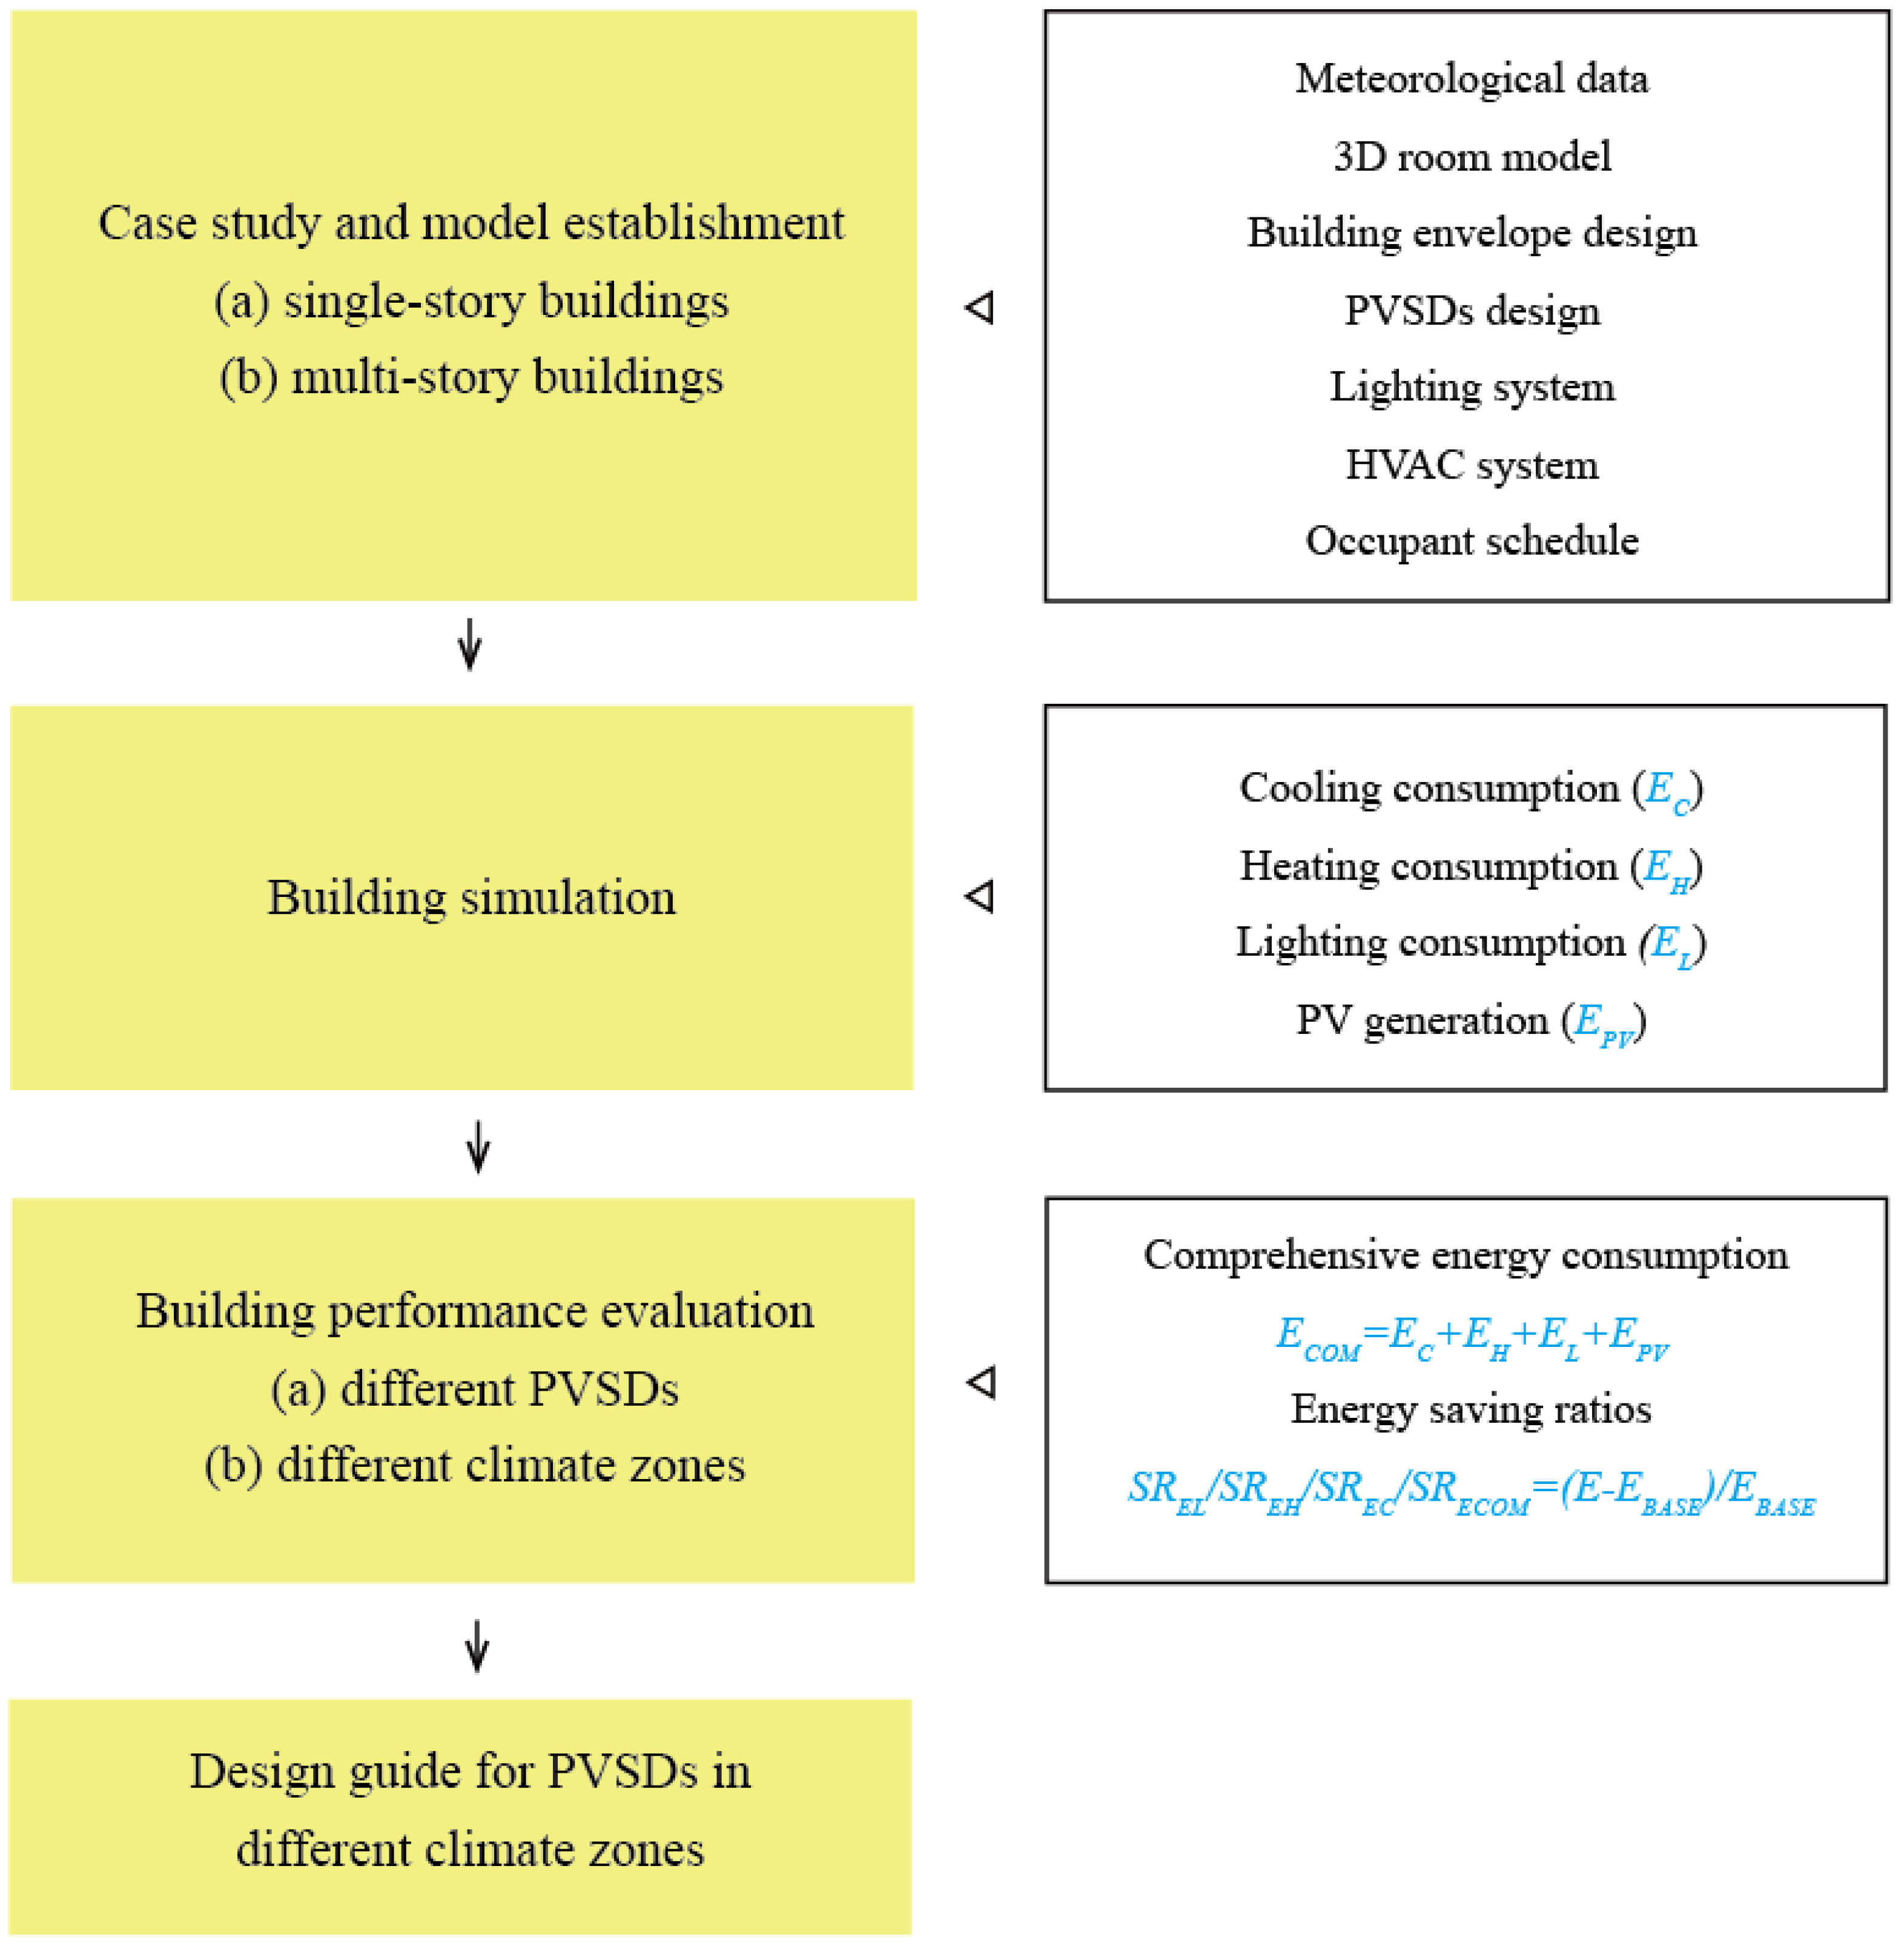
DesignBuilder was used to simulate the building energy performance, for which the calculation core is EnergyPlus [36]. The calculation core was developed by the US Department of Energy (DOE) and is available to researchers in the building industry to simulate building energy performance—the applicability of the simulation results has been evaluated and analyzed in previous studies [37]. In this study, the following four aspects of building energy performance are investigated: cooling consumption, heating consumption, lighting consumption, and PV generation. In the performance evaluation part, the energy efficiency of the building with PVSDs is discussed (compared to the base case). Research framework is shown in Figure 5: (1) First, case study and model establishment are carried out to establish models of single-story and multi-story buildings, and boundary conditions such as meteorological data are introduced; (2) a performance simulation of established models is carried out to calculate the energy consumption and PV system’s generation; (3) data analysis is carried out, which includes the energy-performance comparison of various PVSDs and different climate zones; (4) guidance on the parameter design of PVSDs is summarized.
The building energy performance E0 (kW·h/year) is characterized by comparing the level of building energy consumption E (kW·h/m2·year) per unit of floor area S (m2):
E = E0/S,
The four types of energy consumption were recorded as EC (cooling consumption), EH (heating consumption), EL (lighting consumption), and EPV (PV generation). The corresponding calculations for total energy consumption (ETOTAL) and comprehensive energy consumption (ECOM, kW·h/m2·year) are shown below:
ETOTAL = EC + EH + EL,
ECOM = EC + EH + EL + EPV,
Energy-saving ratio (SRE) can be used to analyze and compare the impact of PVSDs applied in building façades to the energy consumption of base case (EBASE). The corresponding calculation is shown below:
SRE = (E − EBASE)/EBASE,

2.2. Model Description and Simulation Set Up

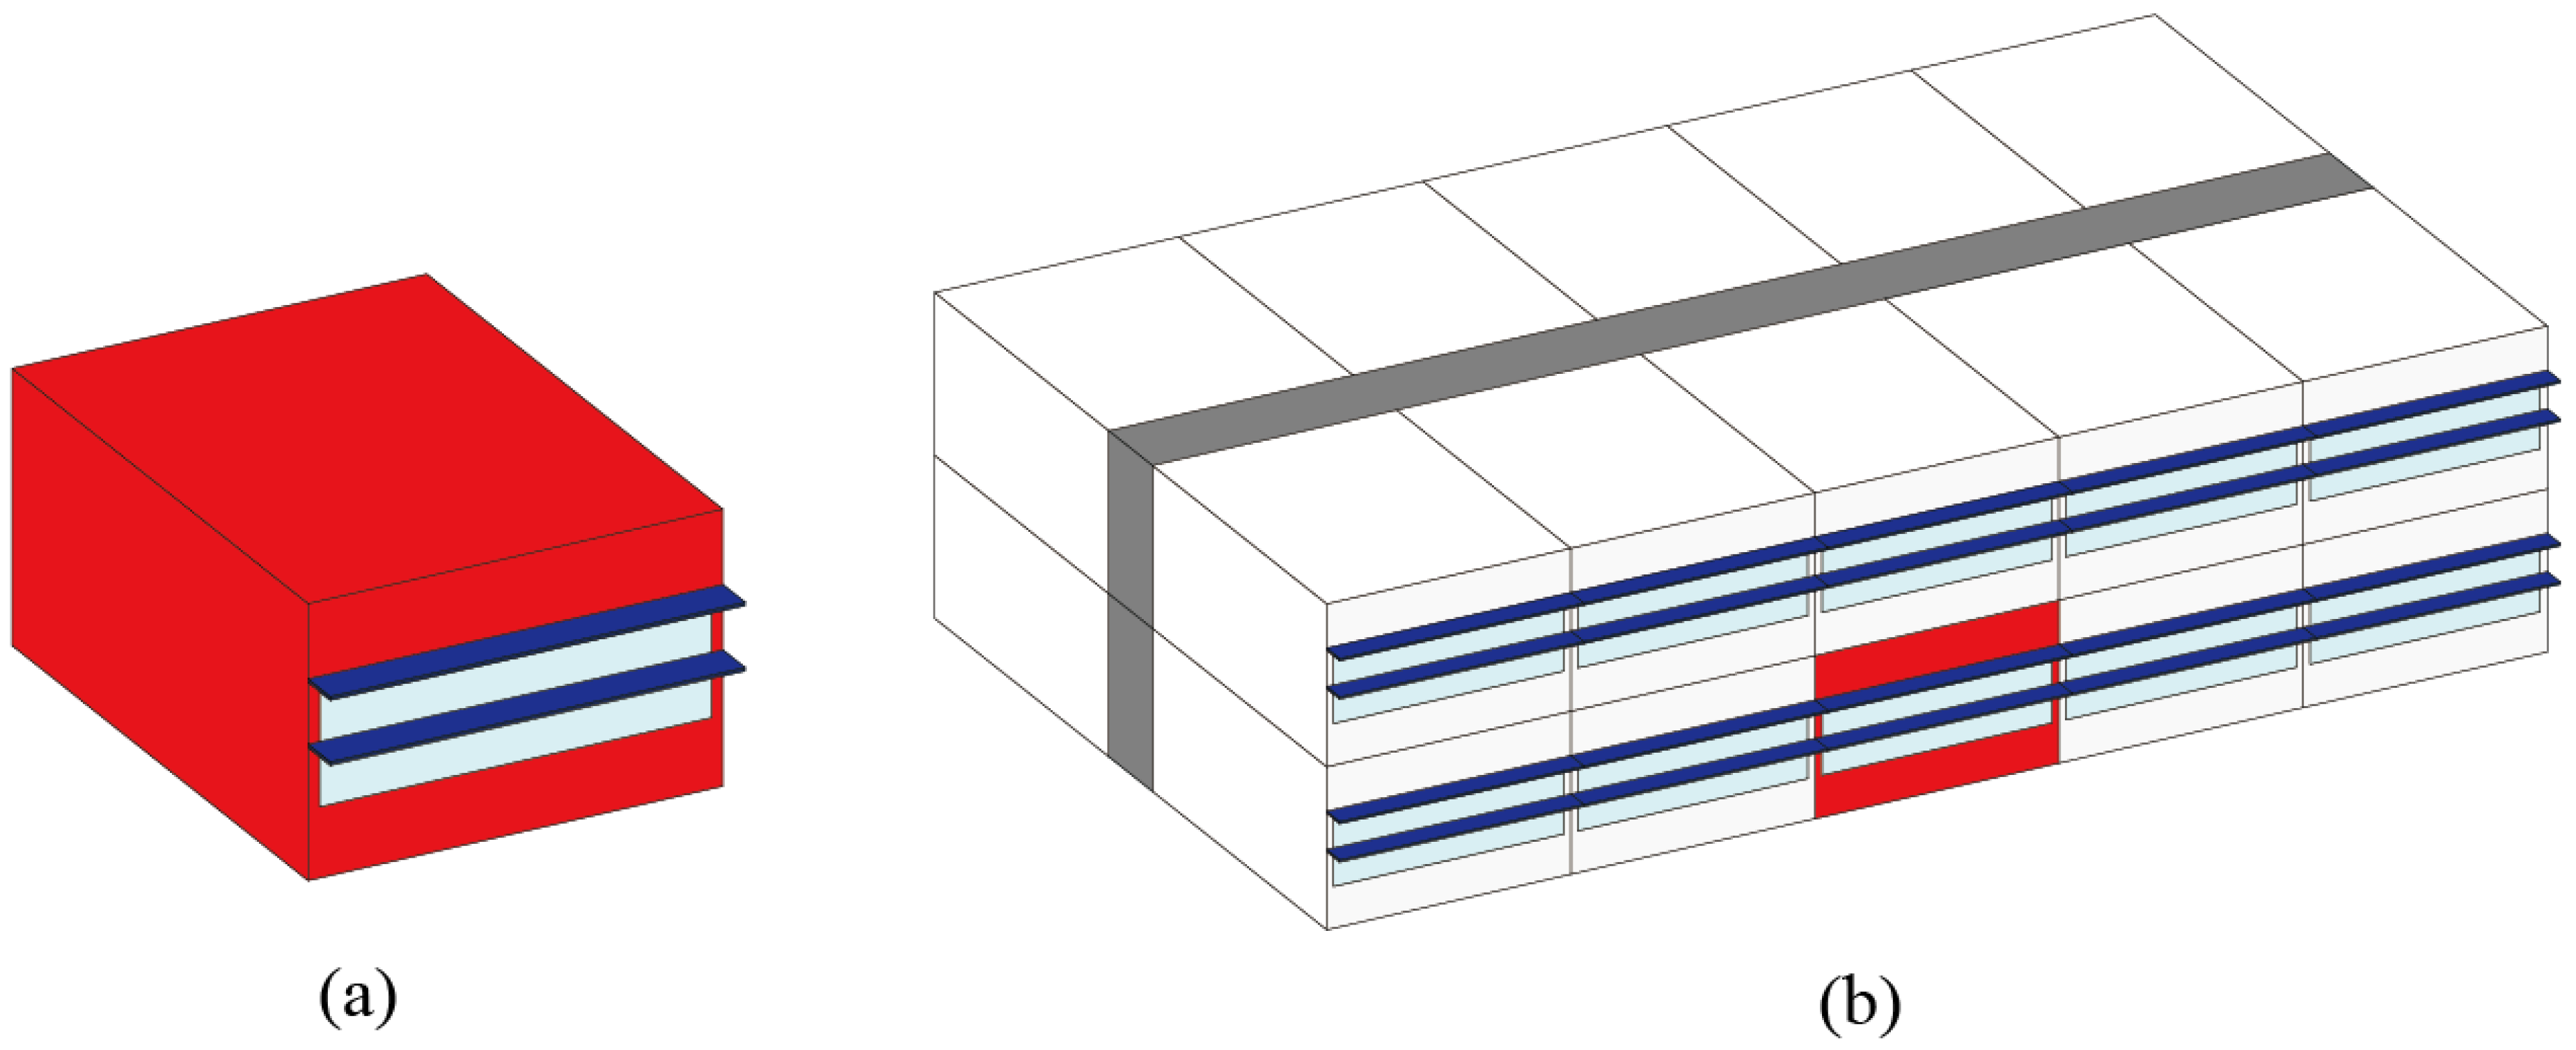
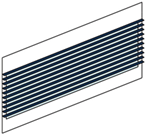
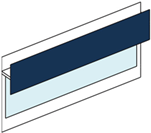
The room modelling parameters in this study are shown in Table 1. The building is an office with a window in the south façade, while the internal walls, ceilings, and floors are assumed to be insulated. To investigate the effect of different PVSDs on the comprehensive energy consumption of the building, 9 PVSDs were constructed with the design parameters shown in Table 2, and the PV panels were set to be fixed. In order to avoid differences in energy efficiency due to variations in the total PV panel areas applied, the PVSDs discussed all have a total PV panel area of 7.2 m2. Modeling of the single-story and multi-story buildings is shown in Figure 6. The single-story building is an individual room (Figure 6a); the energy performance simulation of the multi-story building was represented by an individual room (Figure 6b, red block), along with two rooms each in the east–west direction, plus another story above.
This study considered the application of a reversible heat pump for heating and cooling the building, the heating coefficient of performance (COP) was set at 3.5 and the cooling COP was set at 2.5 [38]. The properties of the building envelope and technical systems in this study are listed in Table 3.

3. Results and Discussion

In Section 3.1, the meteorological parameters of the five cities studied are presented, such as solar radiation, which reflects the amount of solar energy available. In Section 3.2, the energy performance (heating/cooling/lighting energy consumption, PV generation) of different PVSDs in single-story and multi-story buildings is demonstrated. In Section 3.3, the analysis of comprehensive energy-saving ratios in each climate zone is shown separately. In Section 3.4, the energy-saving potential of different PVSDs is ranked, and a cross-region discussion is presented.

3.1. Meteorological Data of Different Climate Zones in China

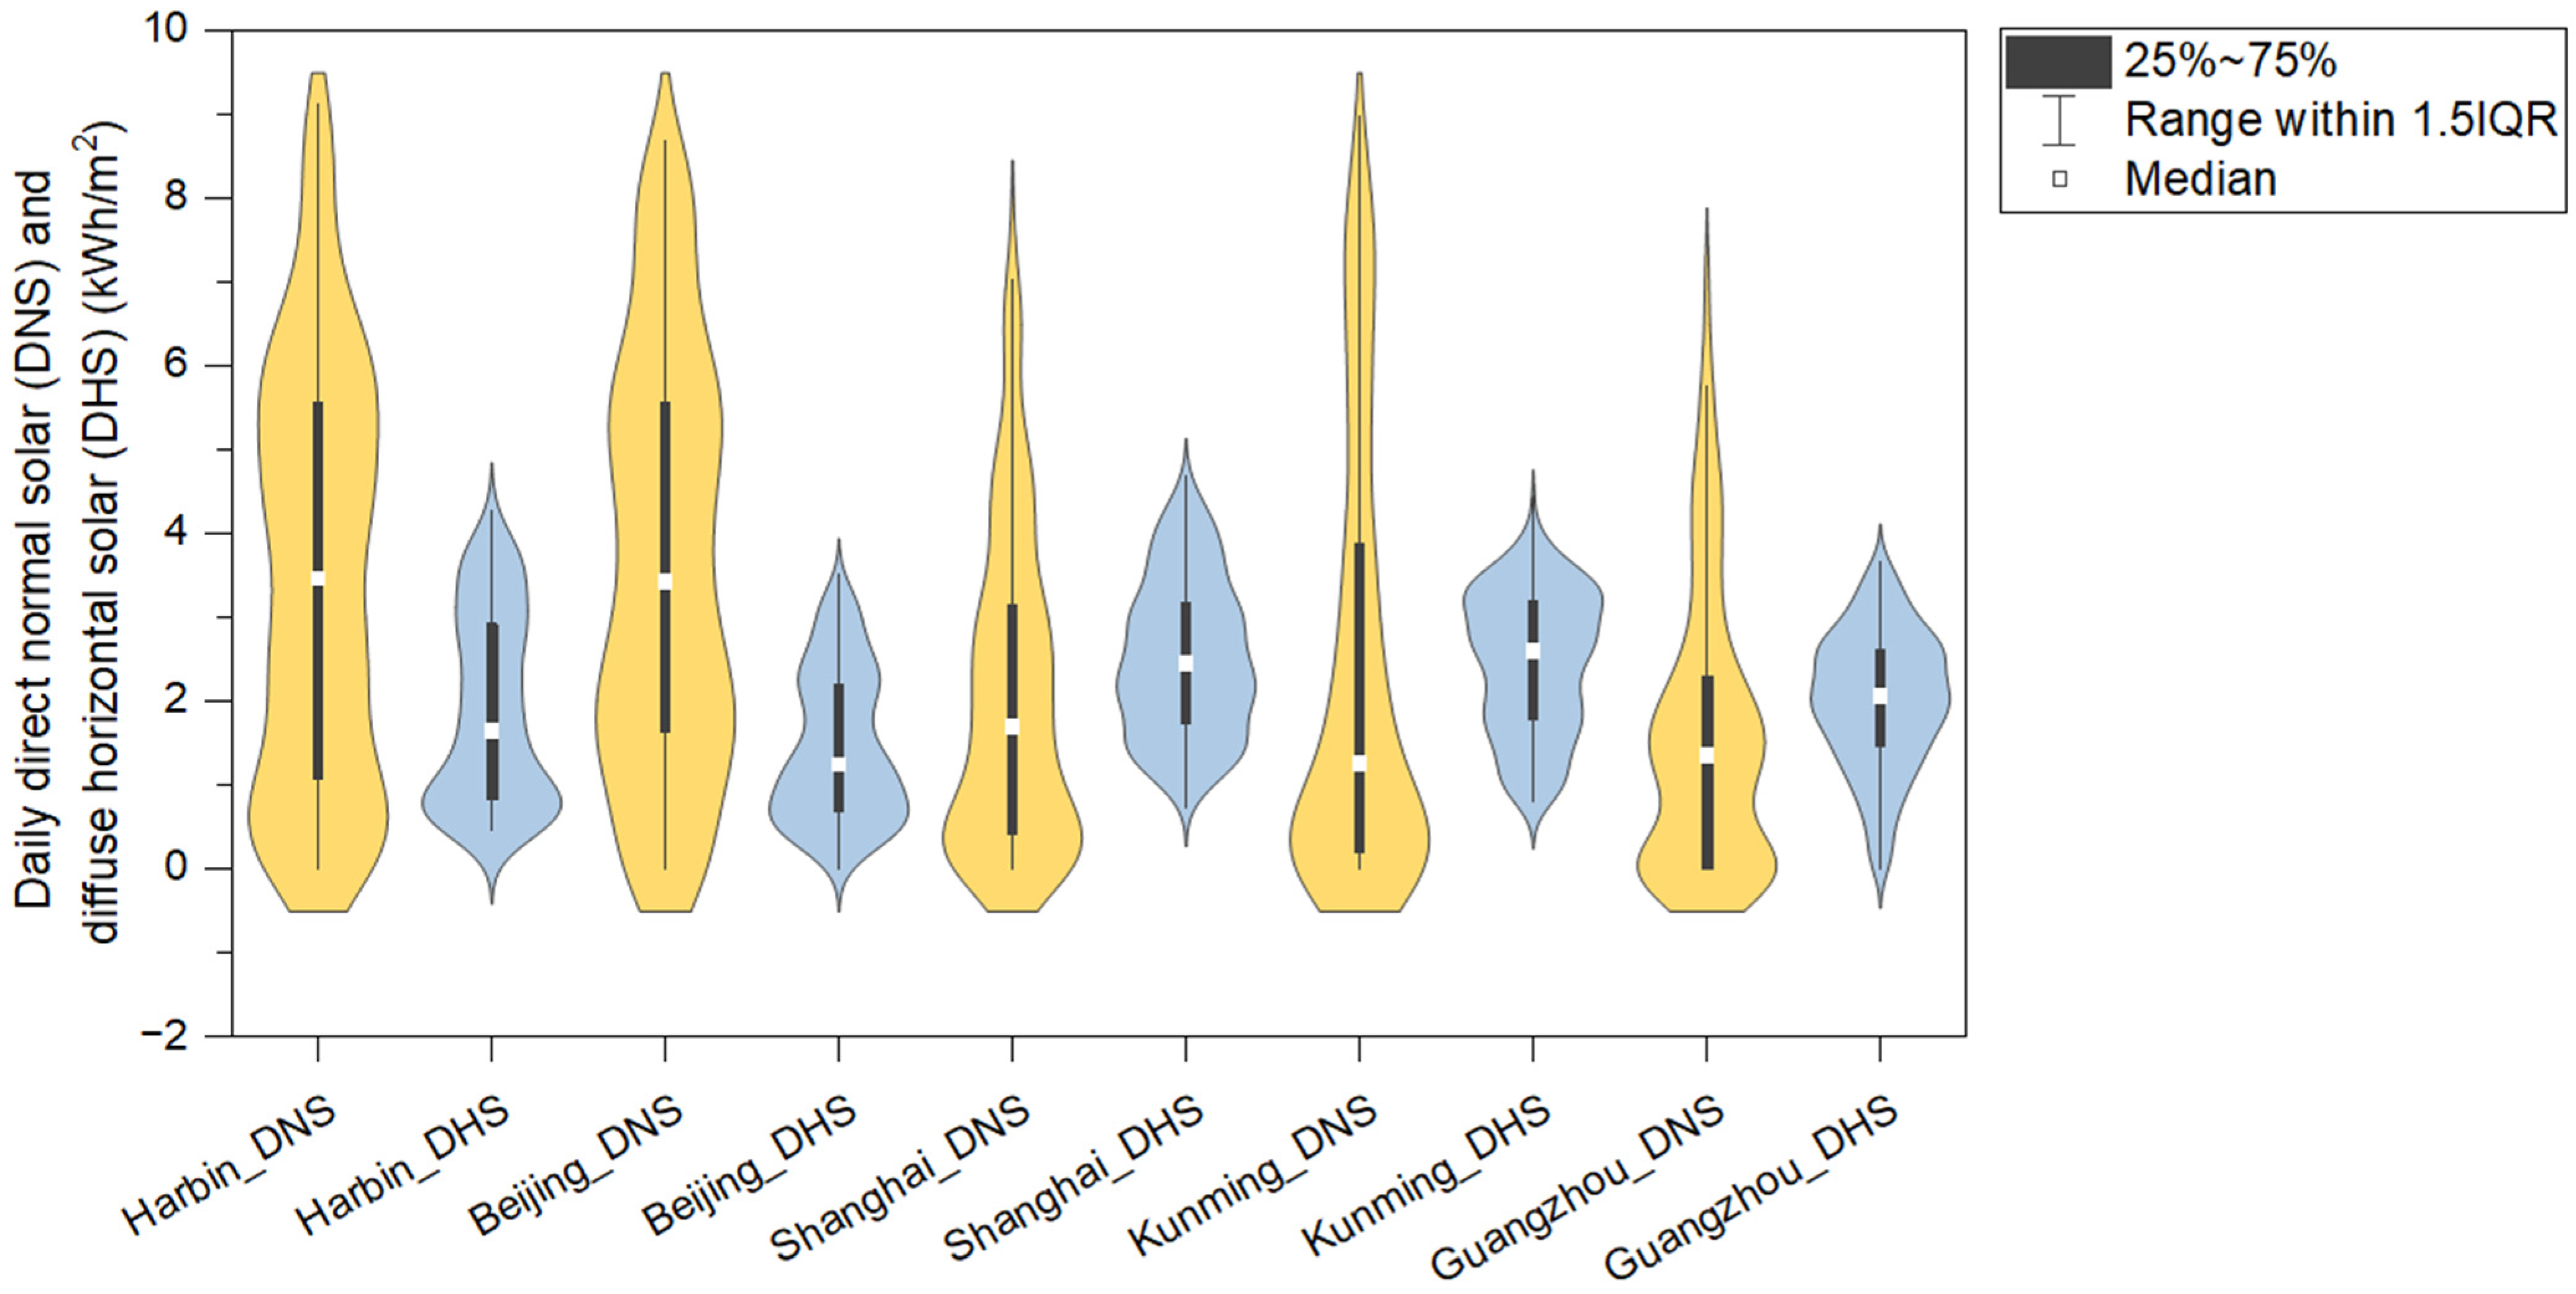
Table 4 provides geographical coordinates and meteorological information for the cities represented in the five climate zones. The latitudes of the five climatic zones range from 23.22° N to 45.75° N. In terms of the availability of solar energy, Beijing has a higher accumulation of direct normal solar energy, corresponding to a value of 1325.34 kW·h/a, while Guangzhou has the lowest. In terms of temperature, the lowest temperature in the five climate zones reached −29.9 °C in Harbin; the highest temperature reached 38.0 °C in Shanghai. The largest difference in the maximum and minimum temperatures throughout the year was in Shanghai, which reached 60.0 °C. As shown in Figure 7, the general distribution of daily direct normal solar (DNS) and diffuse horizontal solar (DHS) data in the five cities—which to some extent reflects the available solar energy throughout the year—significantly affects BIPV façade production.

3.2. Energy Consumption Analysis of Building with Different PVSDs

(1)
Harbin
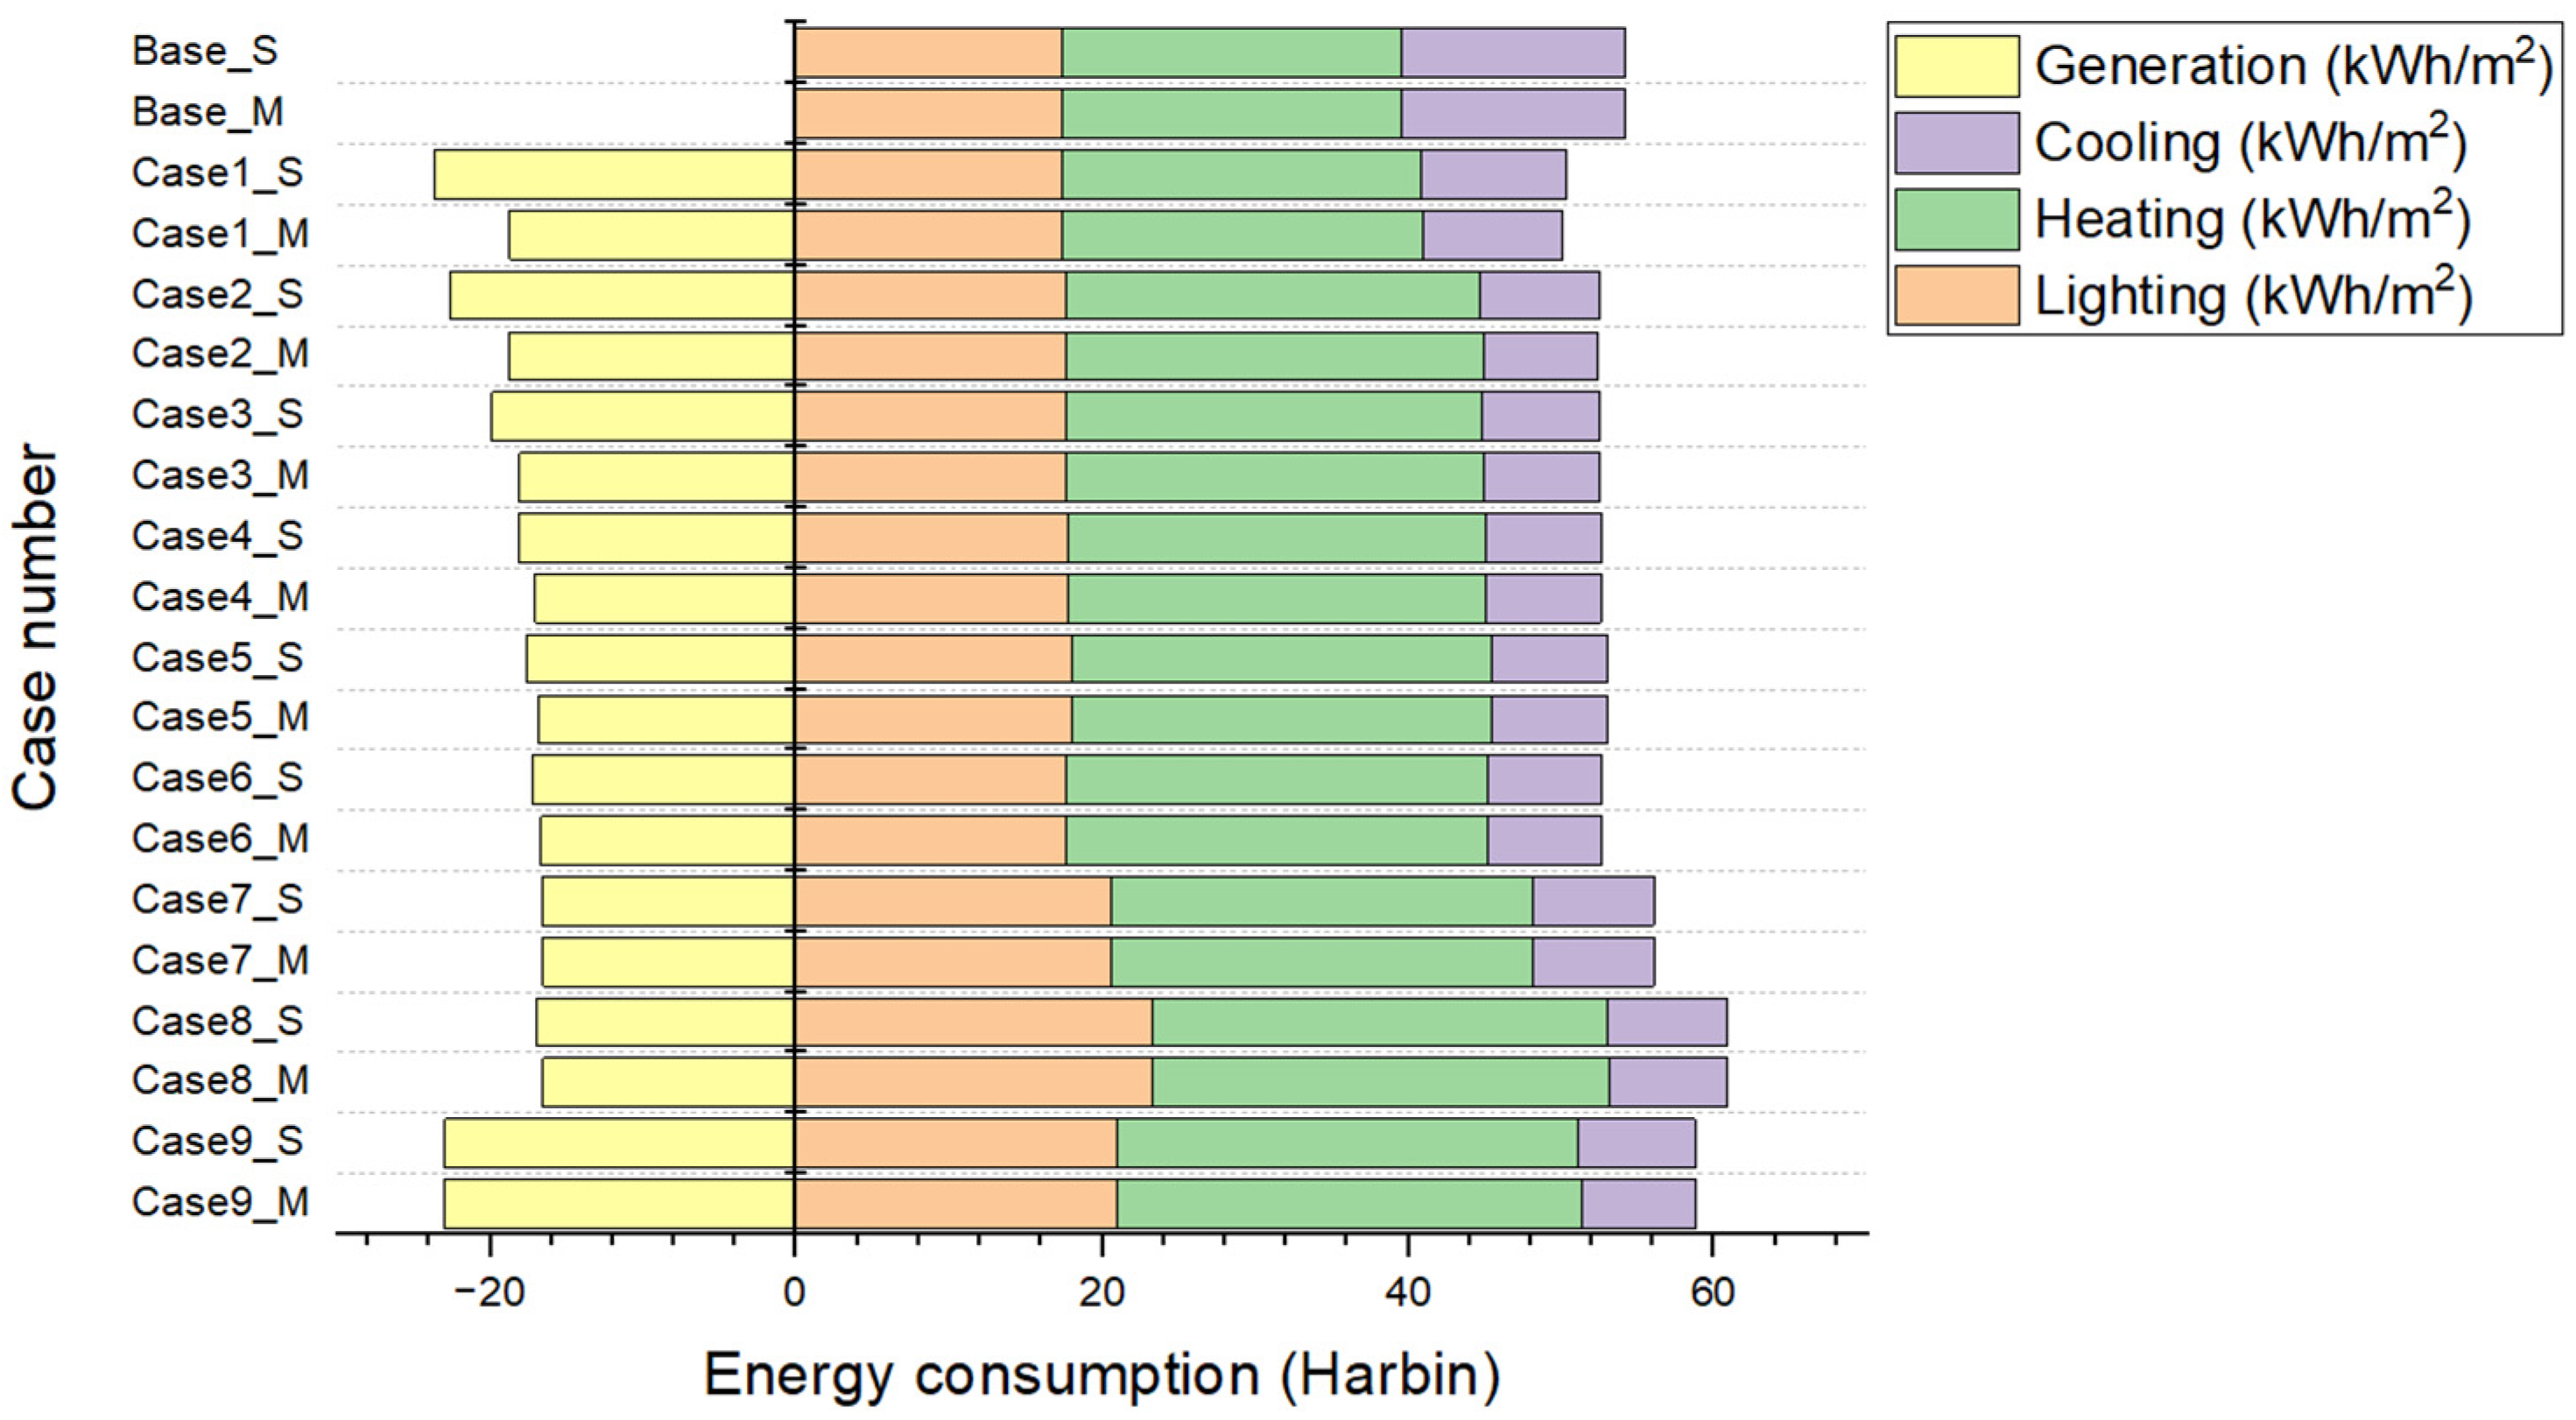
Figure 8 shows the energy modeling analysis of different PVSDs applied to buildings in Harbin, which are the coldest of the five climate zones and have low cooling energy consumption throughout the year. The majority of the ETOTAL is for heating.
Specifically, in terms of ETOTAL, the application of PVSDs to buildings in Case 1–Case 6 results in a reduction in ETOTAL; Case 7–Case 9 result in an increase in ETOTAL, as the increase in EL and EH exceeds the reduction in EC. The maximum ETOTAL is 60.88 kW·h/m2 (Case 8_M), and the minimum is 50.12 kW·h/m2 (Case 1_M). The base case has an EC of 14.62 kW·h/m2, and the different PVSDs range between 7.41 kW·h/m2 (Case 9_M) and 9.51 kW·h/m2 (Case 1_S). The lowest value of EC can be reduced to one-half by integrating PVSDs in buildings. The EH of the base case is 22.29 kW·h/m2, and the building with different PVSDs has a range of 23.46 kW·h/m2 (Case 1_S) to 30.34 kW·h/m2 (Case 9_M). The maximum increase in EH is about one-third. The EL of the base case is 17.32 kW·h/m2. The building with different PVSDs has a lighting-consumption range of 17.41 kW·h/m2 (Case 1_S) to 23.34 kW·h/m2 (Case 1_S)—Case 1_S has the most minimal impact on the lighting energy consumption, with an increase of only 0.09 kW·h/m2. In terms of energy production, different PVSDs yielded between 16.55 kW·h/m2 (Case 8_M) and 22.66 kW·h/m2 (Case 1_S). As the PV panels in Case 9 are vertical, the energy production is the same in both single-story and multi-story buildings.
(2)
Beijing
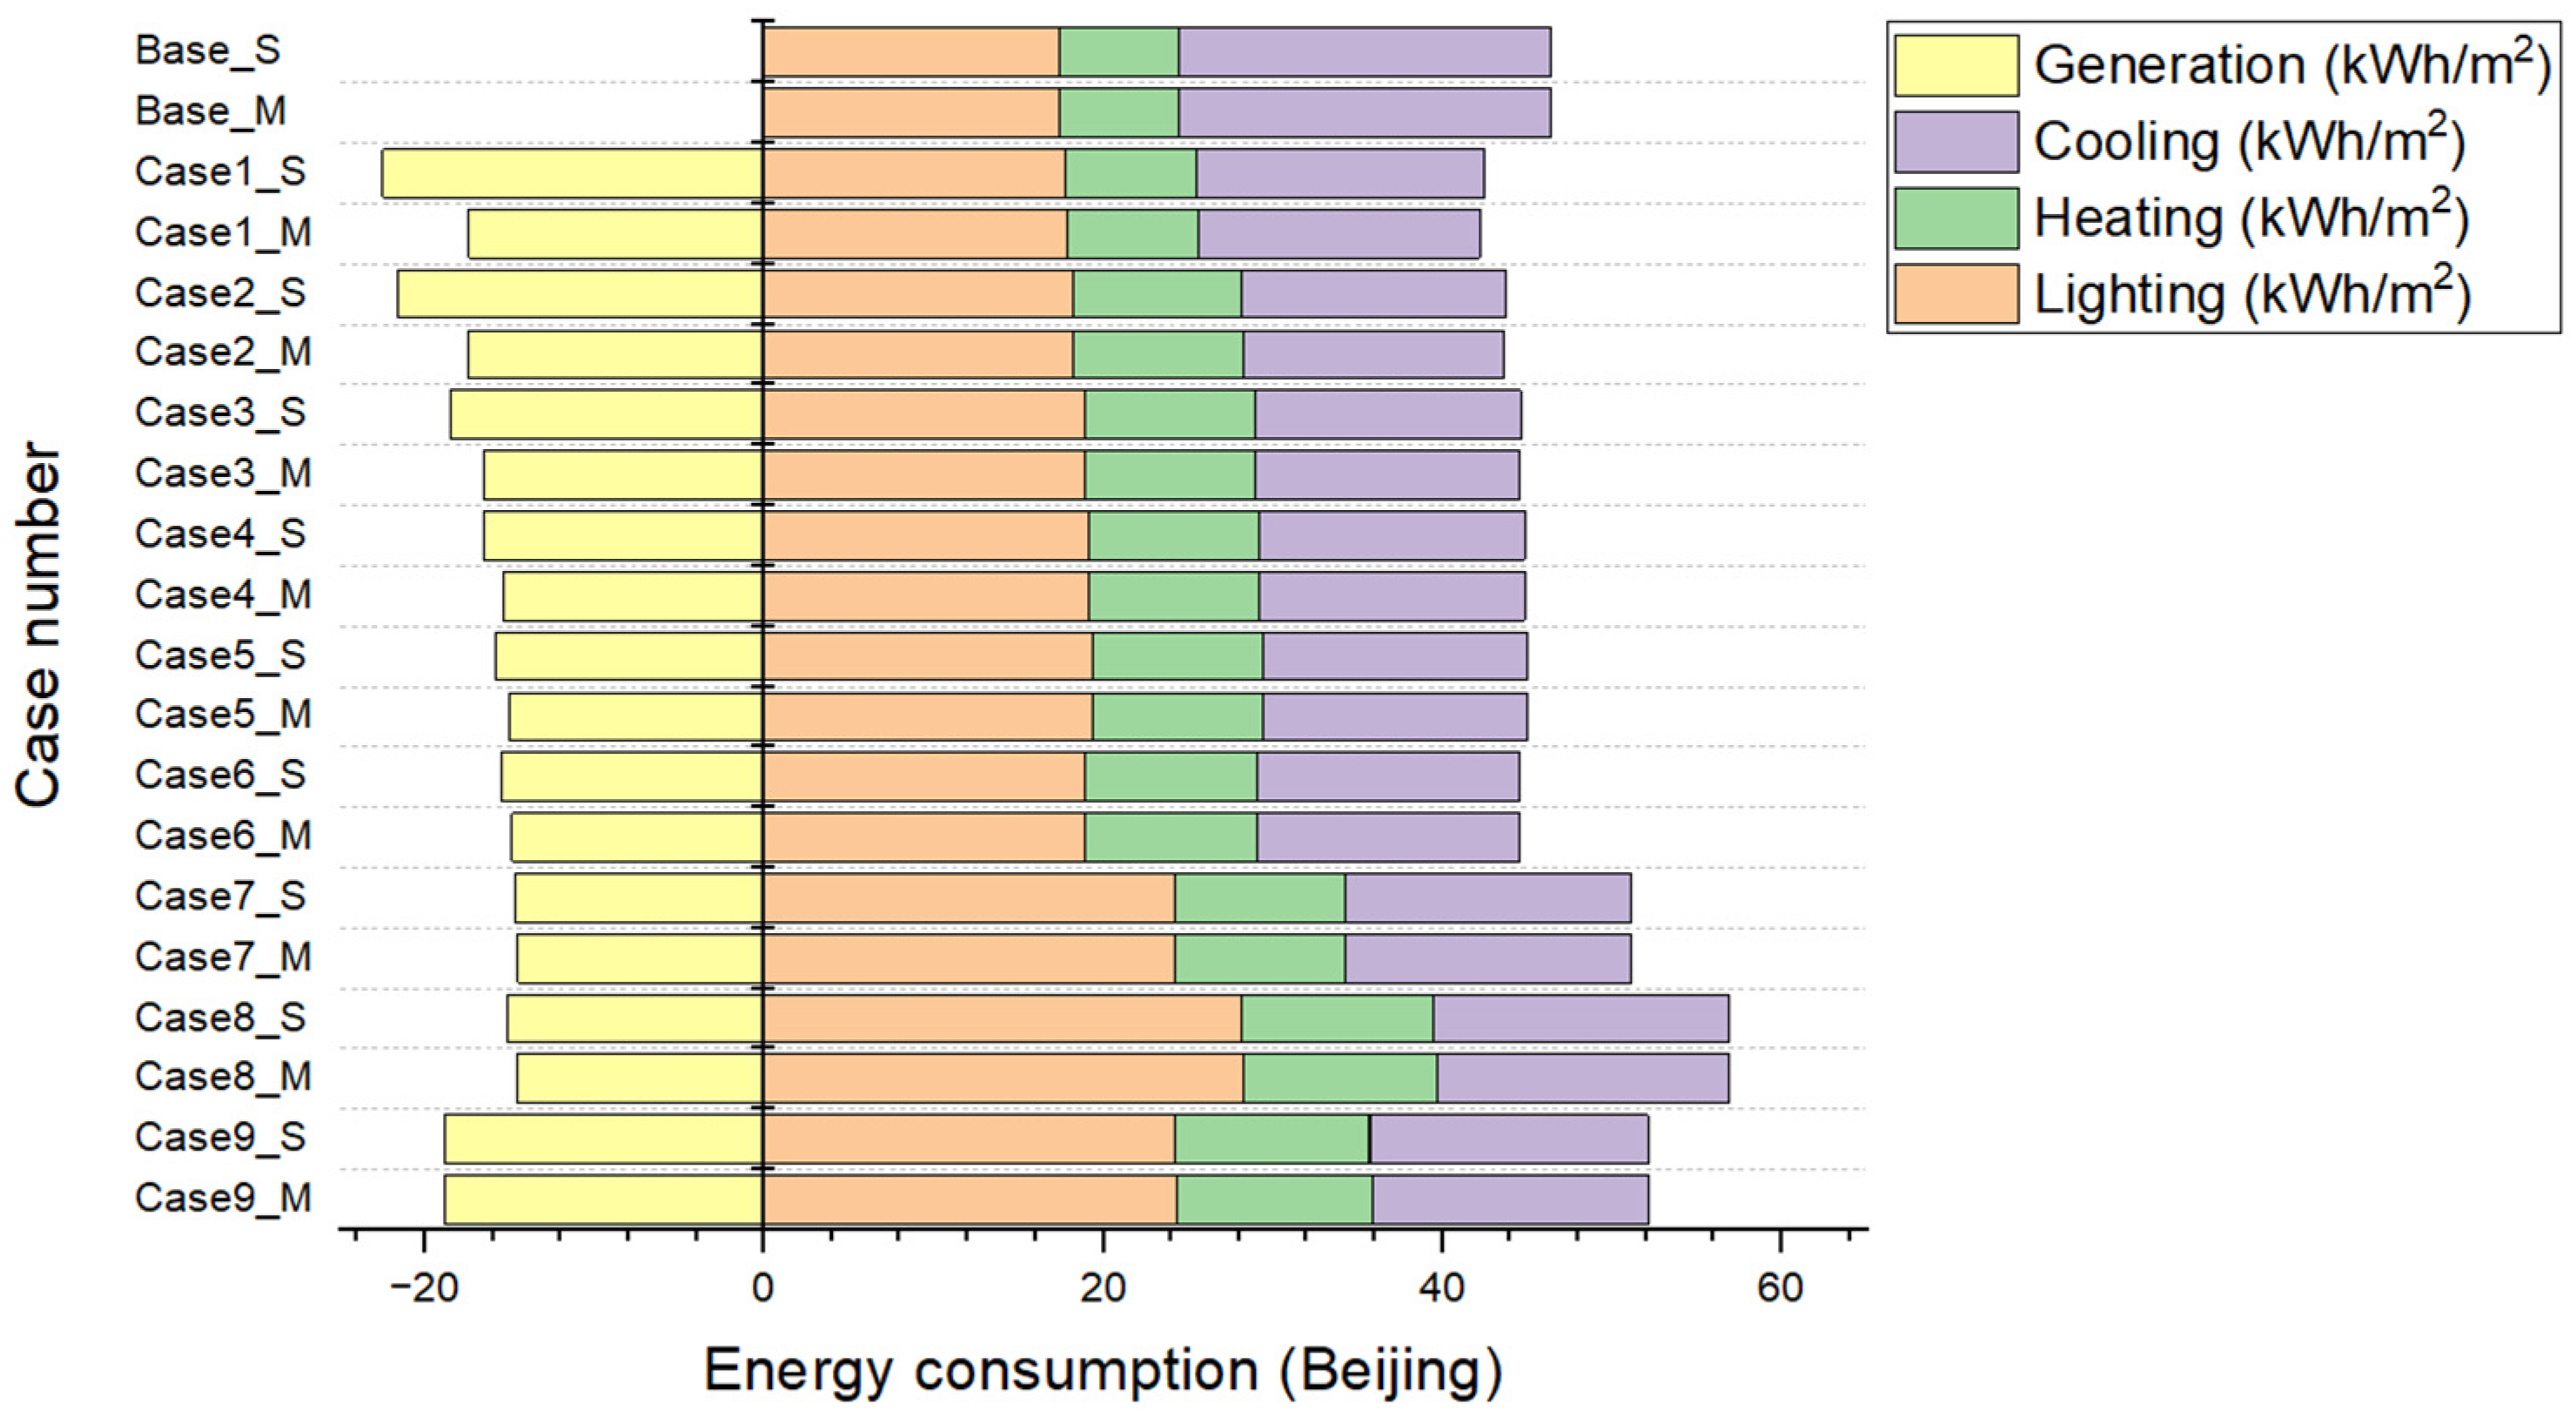
Figure 9 shows the energy analysis of different PVSDs in a cold zone (a typical city selected is Beijing). In general, energy consumption for lighting and cooling accounts for most of the ETOTAL of the building.
To be specific, the ETOTAL of the base case is 46.42 kW·h/m2. Case 1–Case 6 lead to a reduction in total energy consumption, with the most significant energy-saving being 42.19 kW·h/m2 (Case 1_S). Case 7–Case 9 lead to an increase in ETOTAL, with the largest increase being 56.91 kW·h/m2 (Case 8_M). The EC of the base case is 21.98 kW·h/m2. The EC of a building with different PVSDs ranges from 15.26 kW·h/m2 (Case 2_M) to 17.39 kW·h/m2 (Case 8_S). The EH of the base case is 7.01 kW·h/m2. The EH of a building with PVSDs ranges from 7.69 kW·h/m2 (Case 1_S) to 11.56 kW·h/m2 (Case 9_M). The minimum increase in EH is only 0.68 kW·h/m2. The EL for the base case is 17.42 kW·h/m2. The lighting consumption of a building with different PVSDs ranges from 17.77 kW·h/m2 (Case 1_S) to 28.26 kW·h/m2 (Case 8_M). The PVSDs with the lowest impact on lighting energy consumption correspond to an increase of only 0.35 kW·h/m2 compared to the base case. In terms of PV output, the different PVSDs yielded between 14.55 kW·h/m2 (Case 7_M) and 22.45 kW·h/m2 (Case 1_S).
(3)
Shanghai
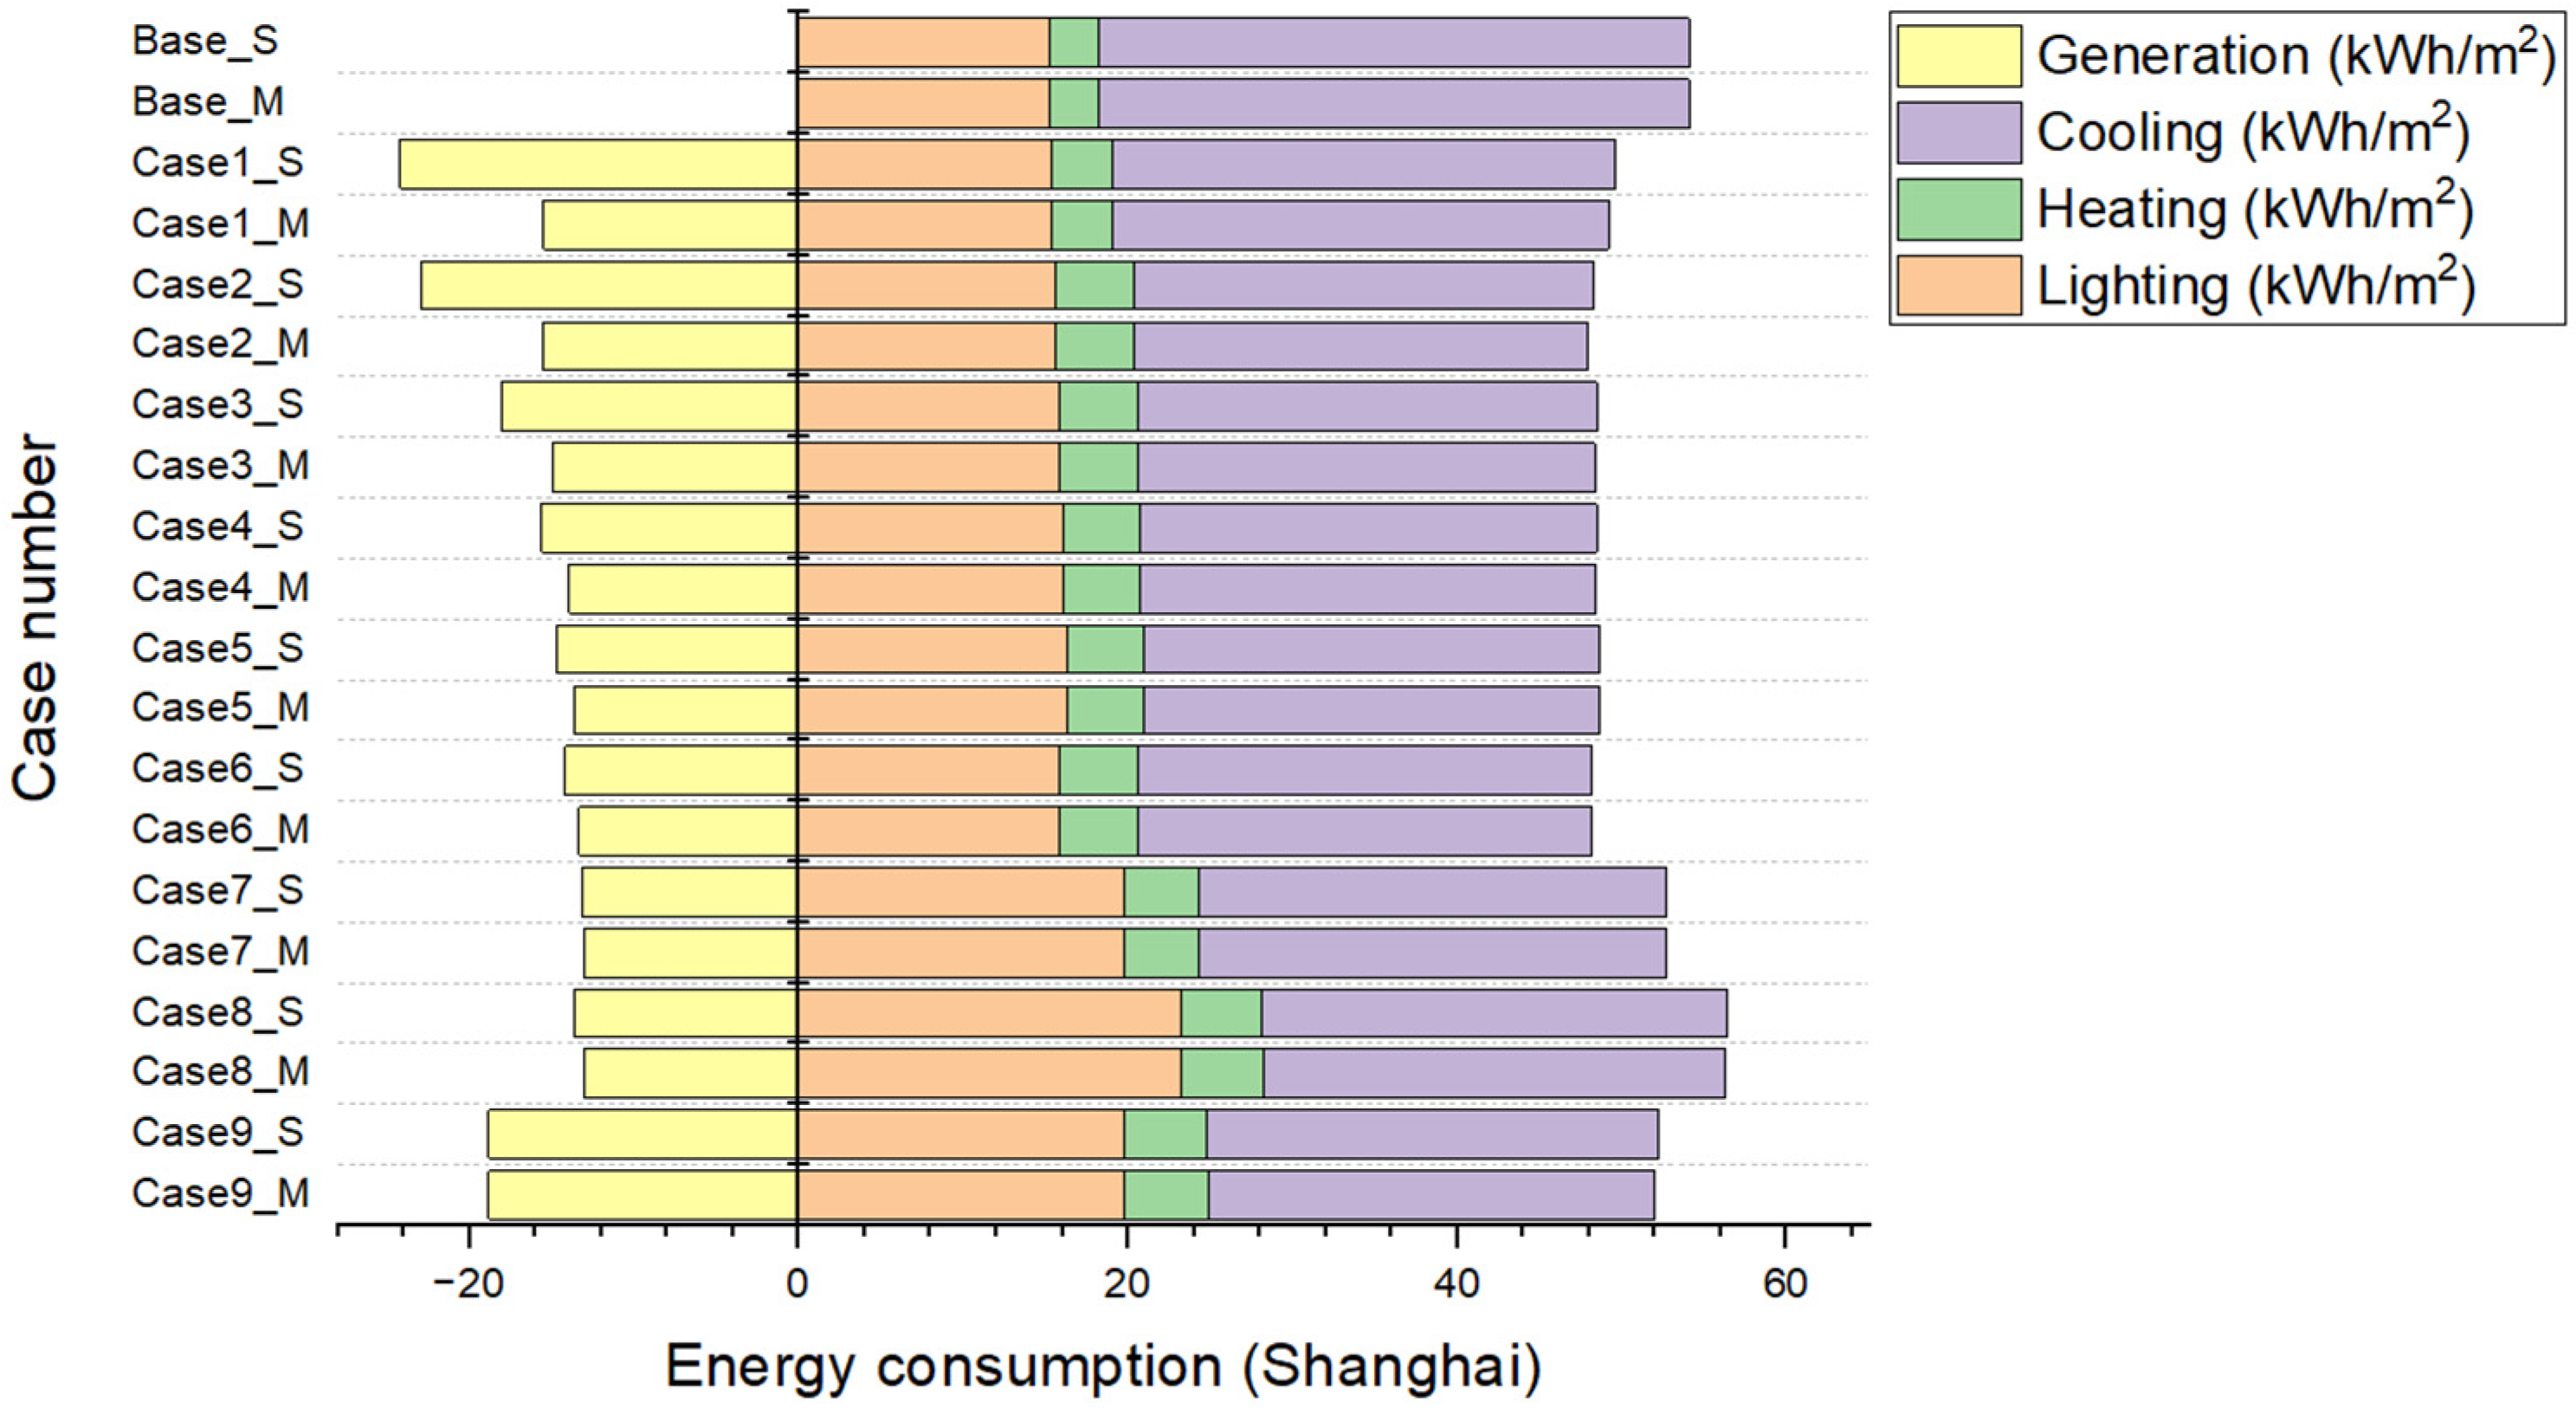
The results of the energy analysis for the application of different PVSDs in buildings in a hot summer and cold winter zone (Shanghai) are shown in Figure 10. In the ETOTAL, cooling consumption is the largest, and few shares of heating consumption are found.
Further on, compared to the base case, for ETOTAL, only Case 8 leads to an increase. The maximum ETOTAL is 56.36 kW·h/m2 (Case 8_M), and the minimum is 47.96 kW·h/m2 (Case 2_M). The EC of the base case is 35.90 kW·h/m2. The EC for different PVSDs ranges from 27.12 kW·h/m2 (Case 9_M) to 30.56 kW·h/m2 (Case 1_S). The EH of the base case is 2.89 kW·h/m2. The heating consumption of buildings with different PVSDs ranges from 3.62 kW·h/m2 (Case 1_S) to 5.09 kW·h/m2 (Case 9_M). The lighting consumption for the base case is 15.27 kW·h/m2. The EL of buildings with different PVSDs ranges from 15.40 kW·h/m2 (Case 1_S) to 23.22 kW·h/m2 (Case 8_M). Case1_S has the most minimal impact on indoor lighting energy consumption, with an increase of only 0.13 kW·h/m2. In terms of PV production, different PVSDs yielded between 13.05 kW·h/m2 (Case 7_M) and 24.19 kW·h/m2 (Case 1_S). The maximum PV production is approximately twice the minimum.
(4)
Kunming
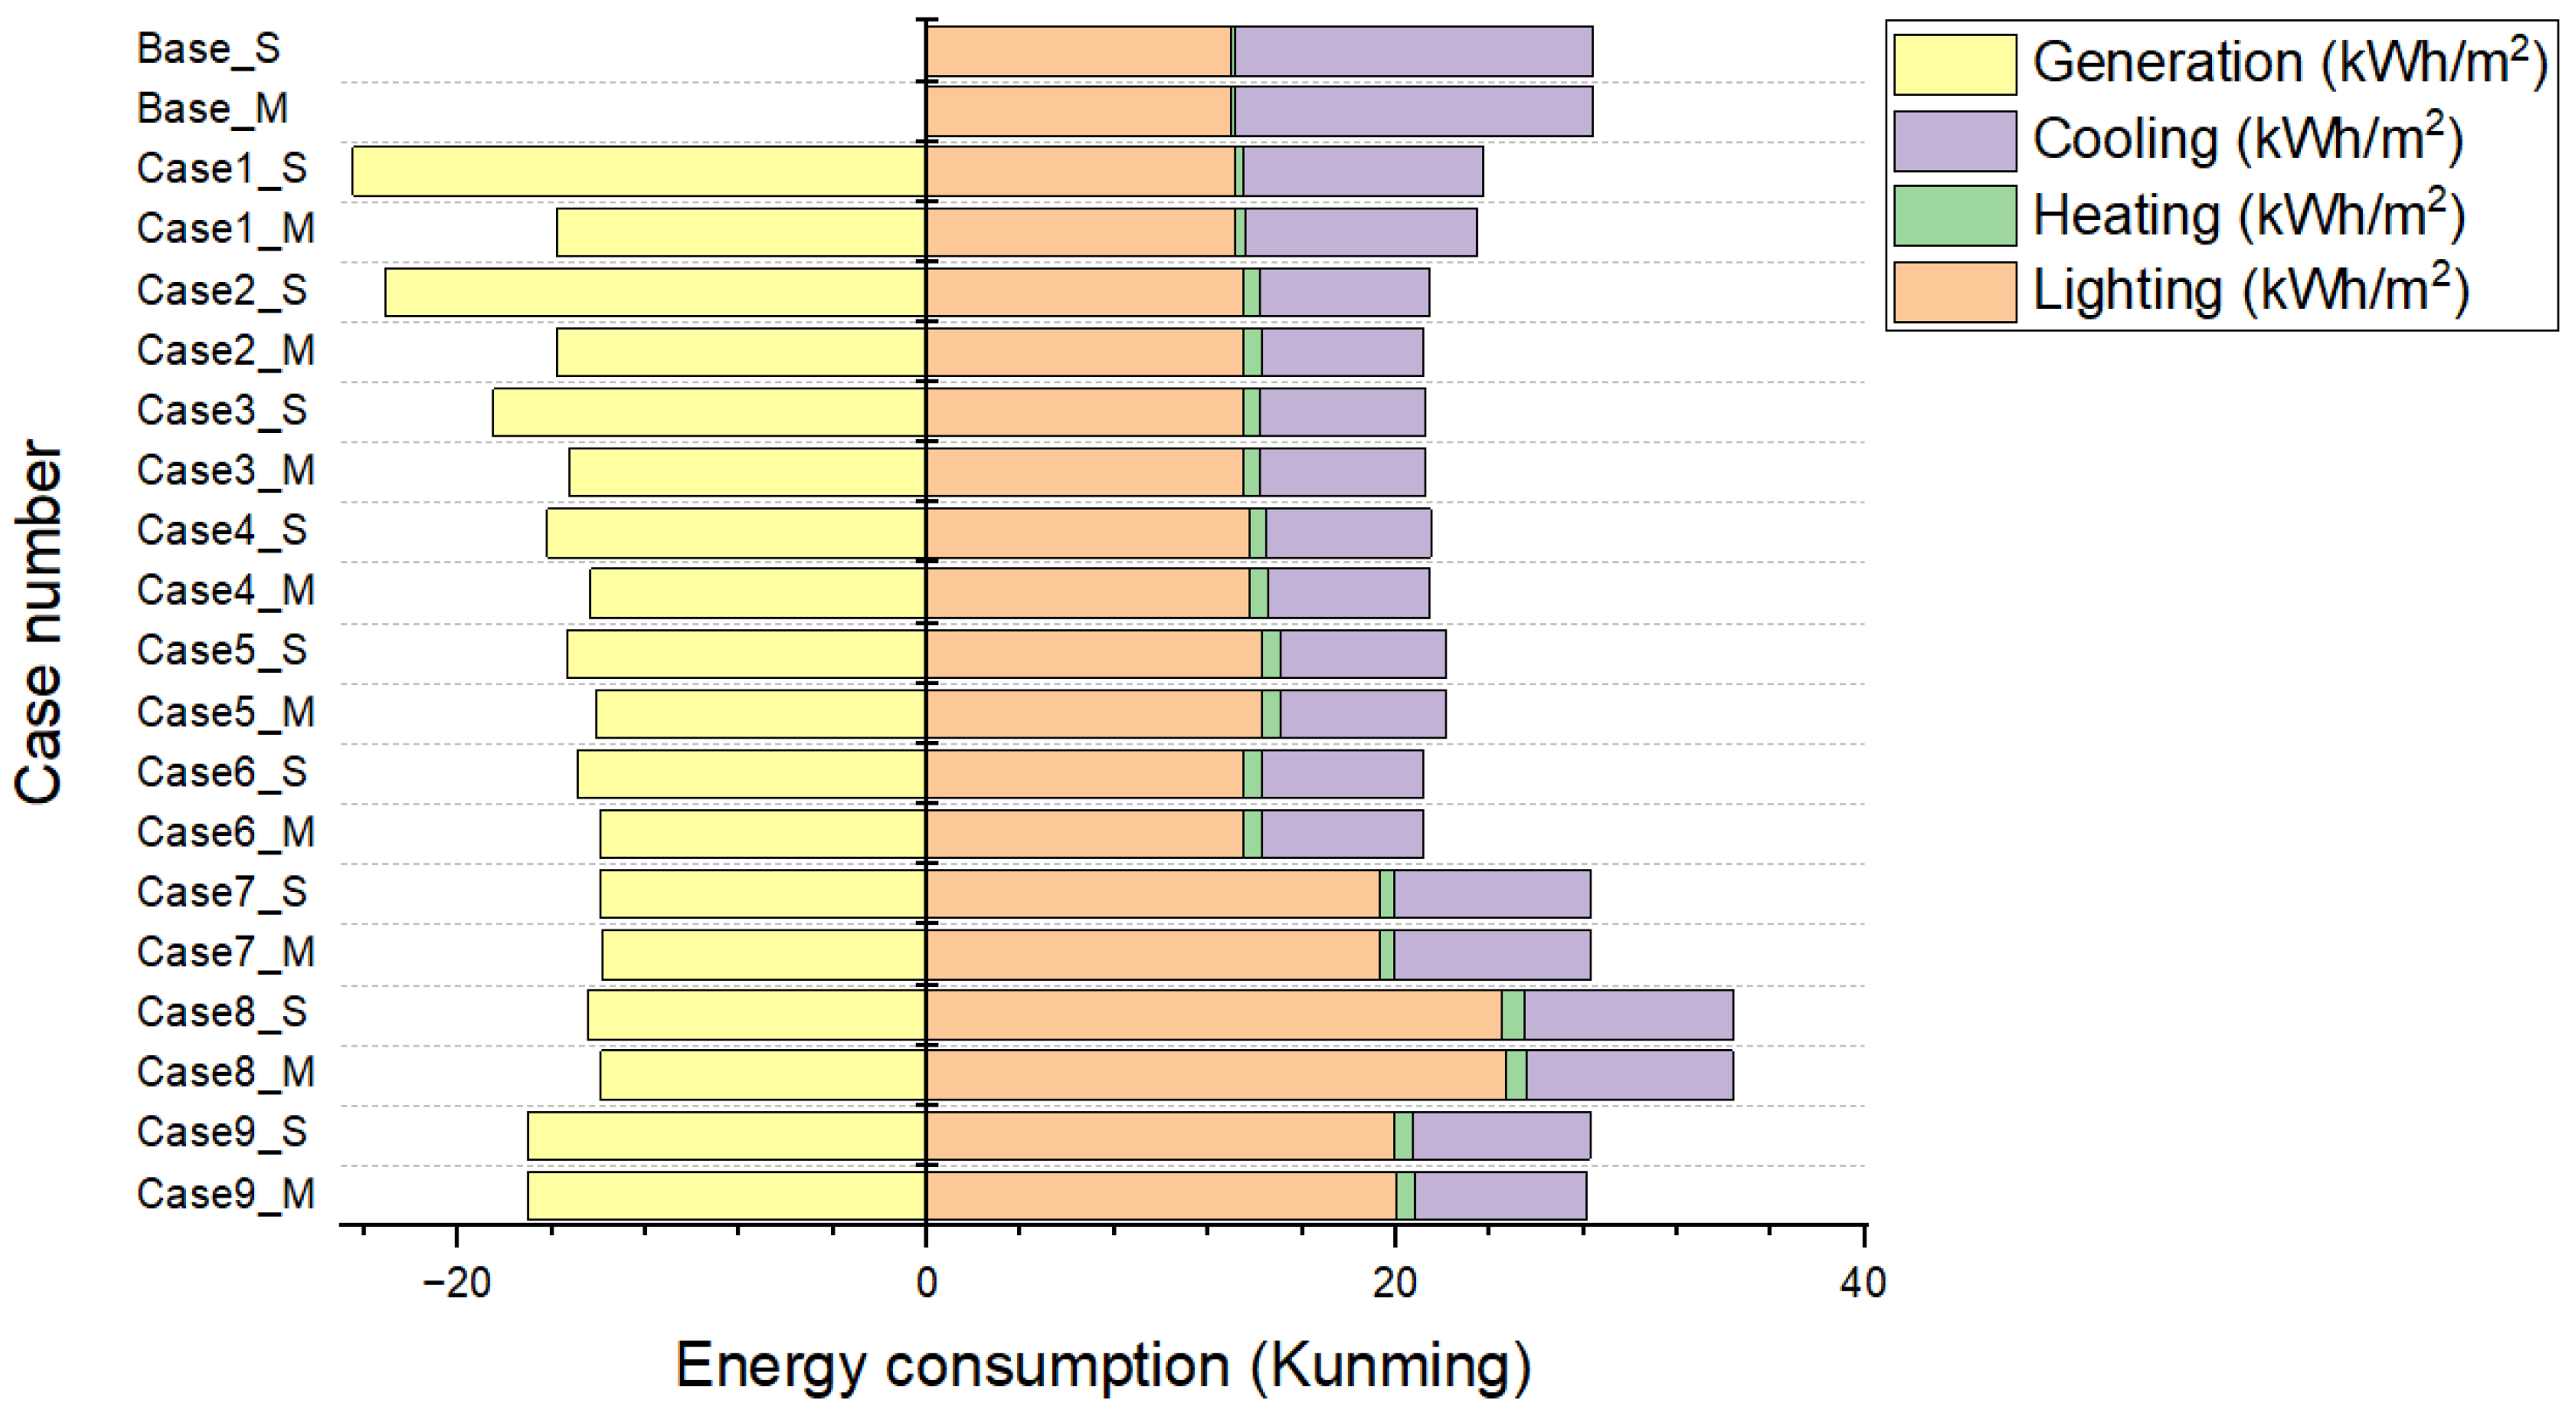
The results of the energy analysis of the different PVSDs applied to the buildings in the moderate zone (where Kunming was chosen as an example) are shown in Figure 11. It can be clearly seen that the proportion of energy consumption for lighting is the largest.
Specifically, in terms of total energy consumption, Case 8 resulted in an increase in the ETOTAL of the building, and Case 7 and Case 9 have a similar ETOTAL to the base case. The maximum ETOTAL is 34.38 kW·h/m2 (Case 8_S), and the minimum is 21.15 kW·h/m2 (Case 6_M). For this reason, the application of Case 8 results in a significant increase in energy consumption for lighting. At the same time, the extent of change in heating and cooling energy consumption has little impact on the total energy consumption. The EC for the base case is 15.29 kW·h/m2. The EC for buildings with different PVSDs ranges from 6.85 kW·h/m2 (Case 6_M) to 10.24 kW·h/m2 (Case 1_S). The lowest cooling consumption can be reduced by more than half by using PVSDs. The base case has a heating consumption of 0.17 kW·h/m2, and the EH for buildings with different PVSDs ranges from 0.36 kW·h/m2 (Case 1_S) to 0.91 kW·h/m2 (Case 8_M), which is much lower than cooling energy consumption. The lighting consumption for the base case is 12.95 kW·h/m2. The lighting consumption for different cases ranges from 13.14 kW·h/m2 (Case 1_S) to 24.64 kW·h/m2 (Case 8_M). Regarding PV production, the different PVSDs yielded between 13.88 kW·h/m2 (Case 7_M) and 24.50 kW·h/m2 (Case 1_S). The highest energy production was approximately twice that of the lowest.
(5)
Guangzhou
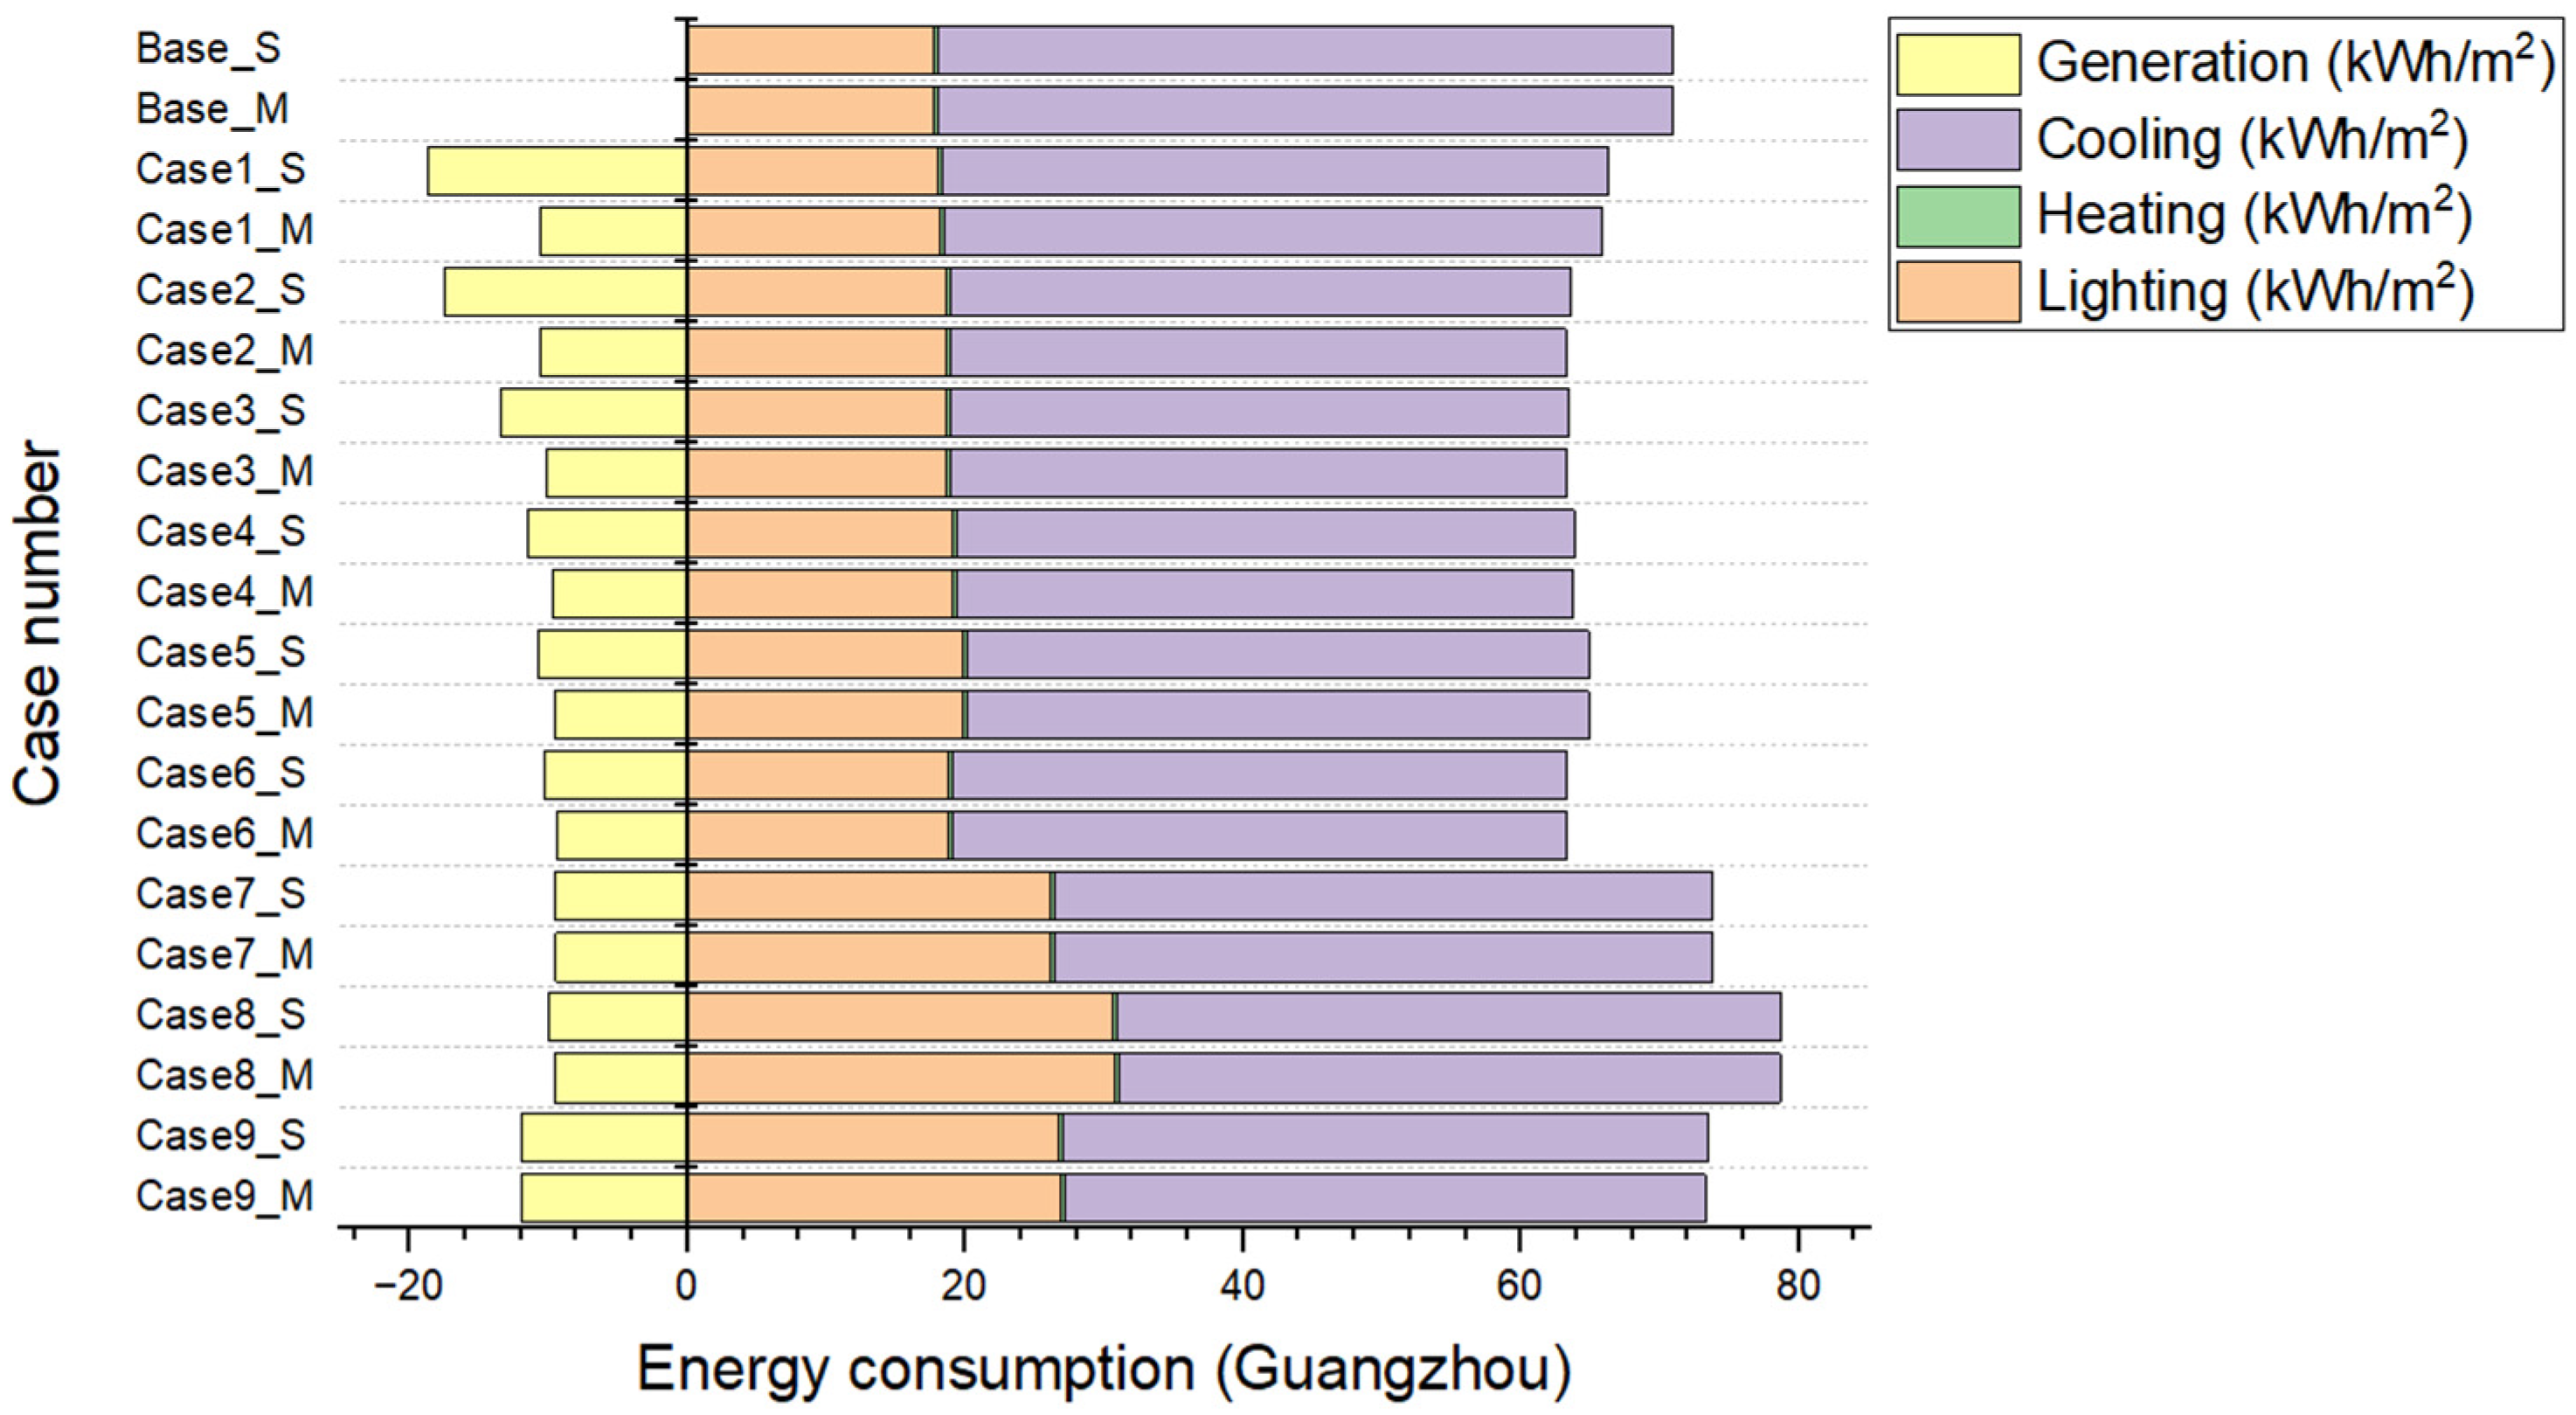
Guangzhou’s energy-analysis results of applying different PVSDs are shown in Figure 12. The hot summer and warm winter zone is the closest climate zone to the equator in China in terms of latitude, so as expected, cooling energy consumption is dominant throughout the year, and heating consumption is rather low.
Compared to the base case, for ETOTAL, applying PVSDs to buildings in Case 1–Case 6 leads to a reduction, and in Case 7–Case 9 leads to an increase. The maximum total energy consumption is 78.75 kW·h/m2 (Case 8_S), and the minimum is 63.19 kW·h/m2 (Case 2_M). The cooling energy consumption of the base case is 52.96 kW·h/m2. The range of cooling energy consumption for different cases is between 44.18 kW·h/m2 (Case 6_M) and 47.88 kW·h/m2 (Case 1_S). The heating consumption in the base case is 0.24 kW·h/m2, and the heating consumption of buildings with different PVSDs ranges from 0.27 kW·h/m2 (Case 7_S) to 0.35 kW·h/m2 (Case 6_M). The maximum increase in heating consumption is only 0.11 kW·h/m2. The lighting consumption of the base case is 17.77 kW·h/m2, and the lighting consumption of buildings with different PVSDs ranges from 18.08 kW·h/m2 (Case 1_S) to 30.71 kW·h/m2 (Case 8_M). In terms of PV systems, the energy production of different PVSDs ranged from 9.43 kW·h/m2 (Case 6_M) to 18.77 kW·h/m2 (Case 1_S).

3.3. PVSDs’ Effects on Energy Consumption in Different Climate Zones

In this section, the benefits derived from buildings with different PVSDs in terms of comprehensive energy performance are discussed. By comparing the energy performance of buildings with PVSDs (single-story and multi-story buildings) to the base case in terms of heating, cooling, lighting and comprehensive energy consumption, the ratios of energy saving are calculated. The four corresponding indicators are the saving ratios of lighting consumption (SRL), heating consumption (SRH), cooling consumption (SRC), and comprehensive energy consumption (SRCOM).
(1)
Harbin
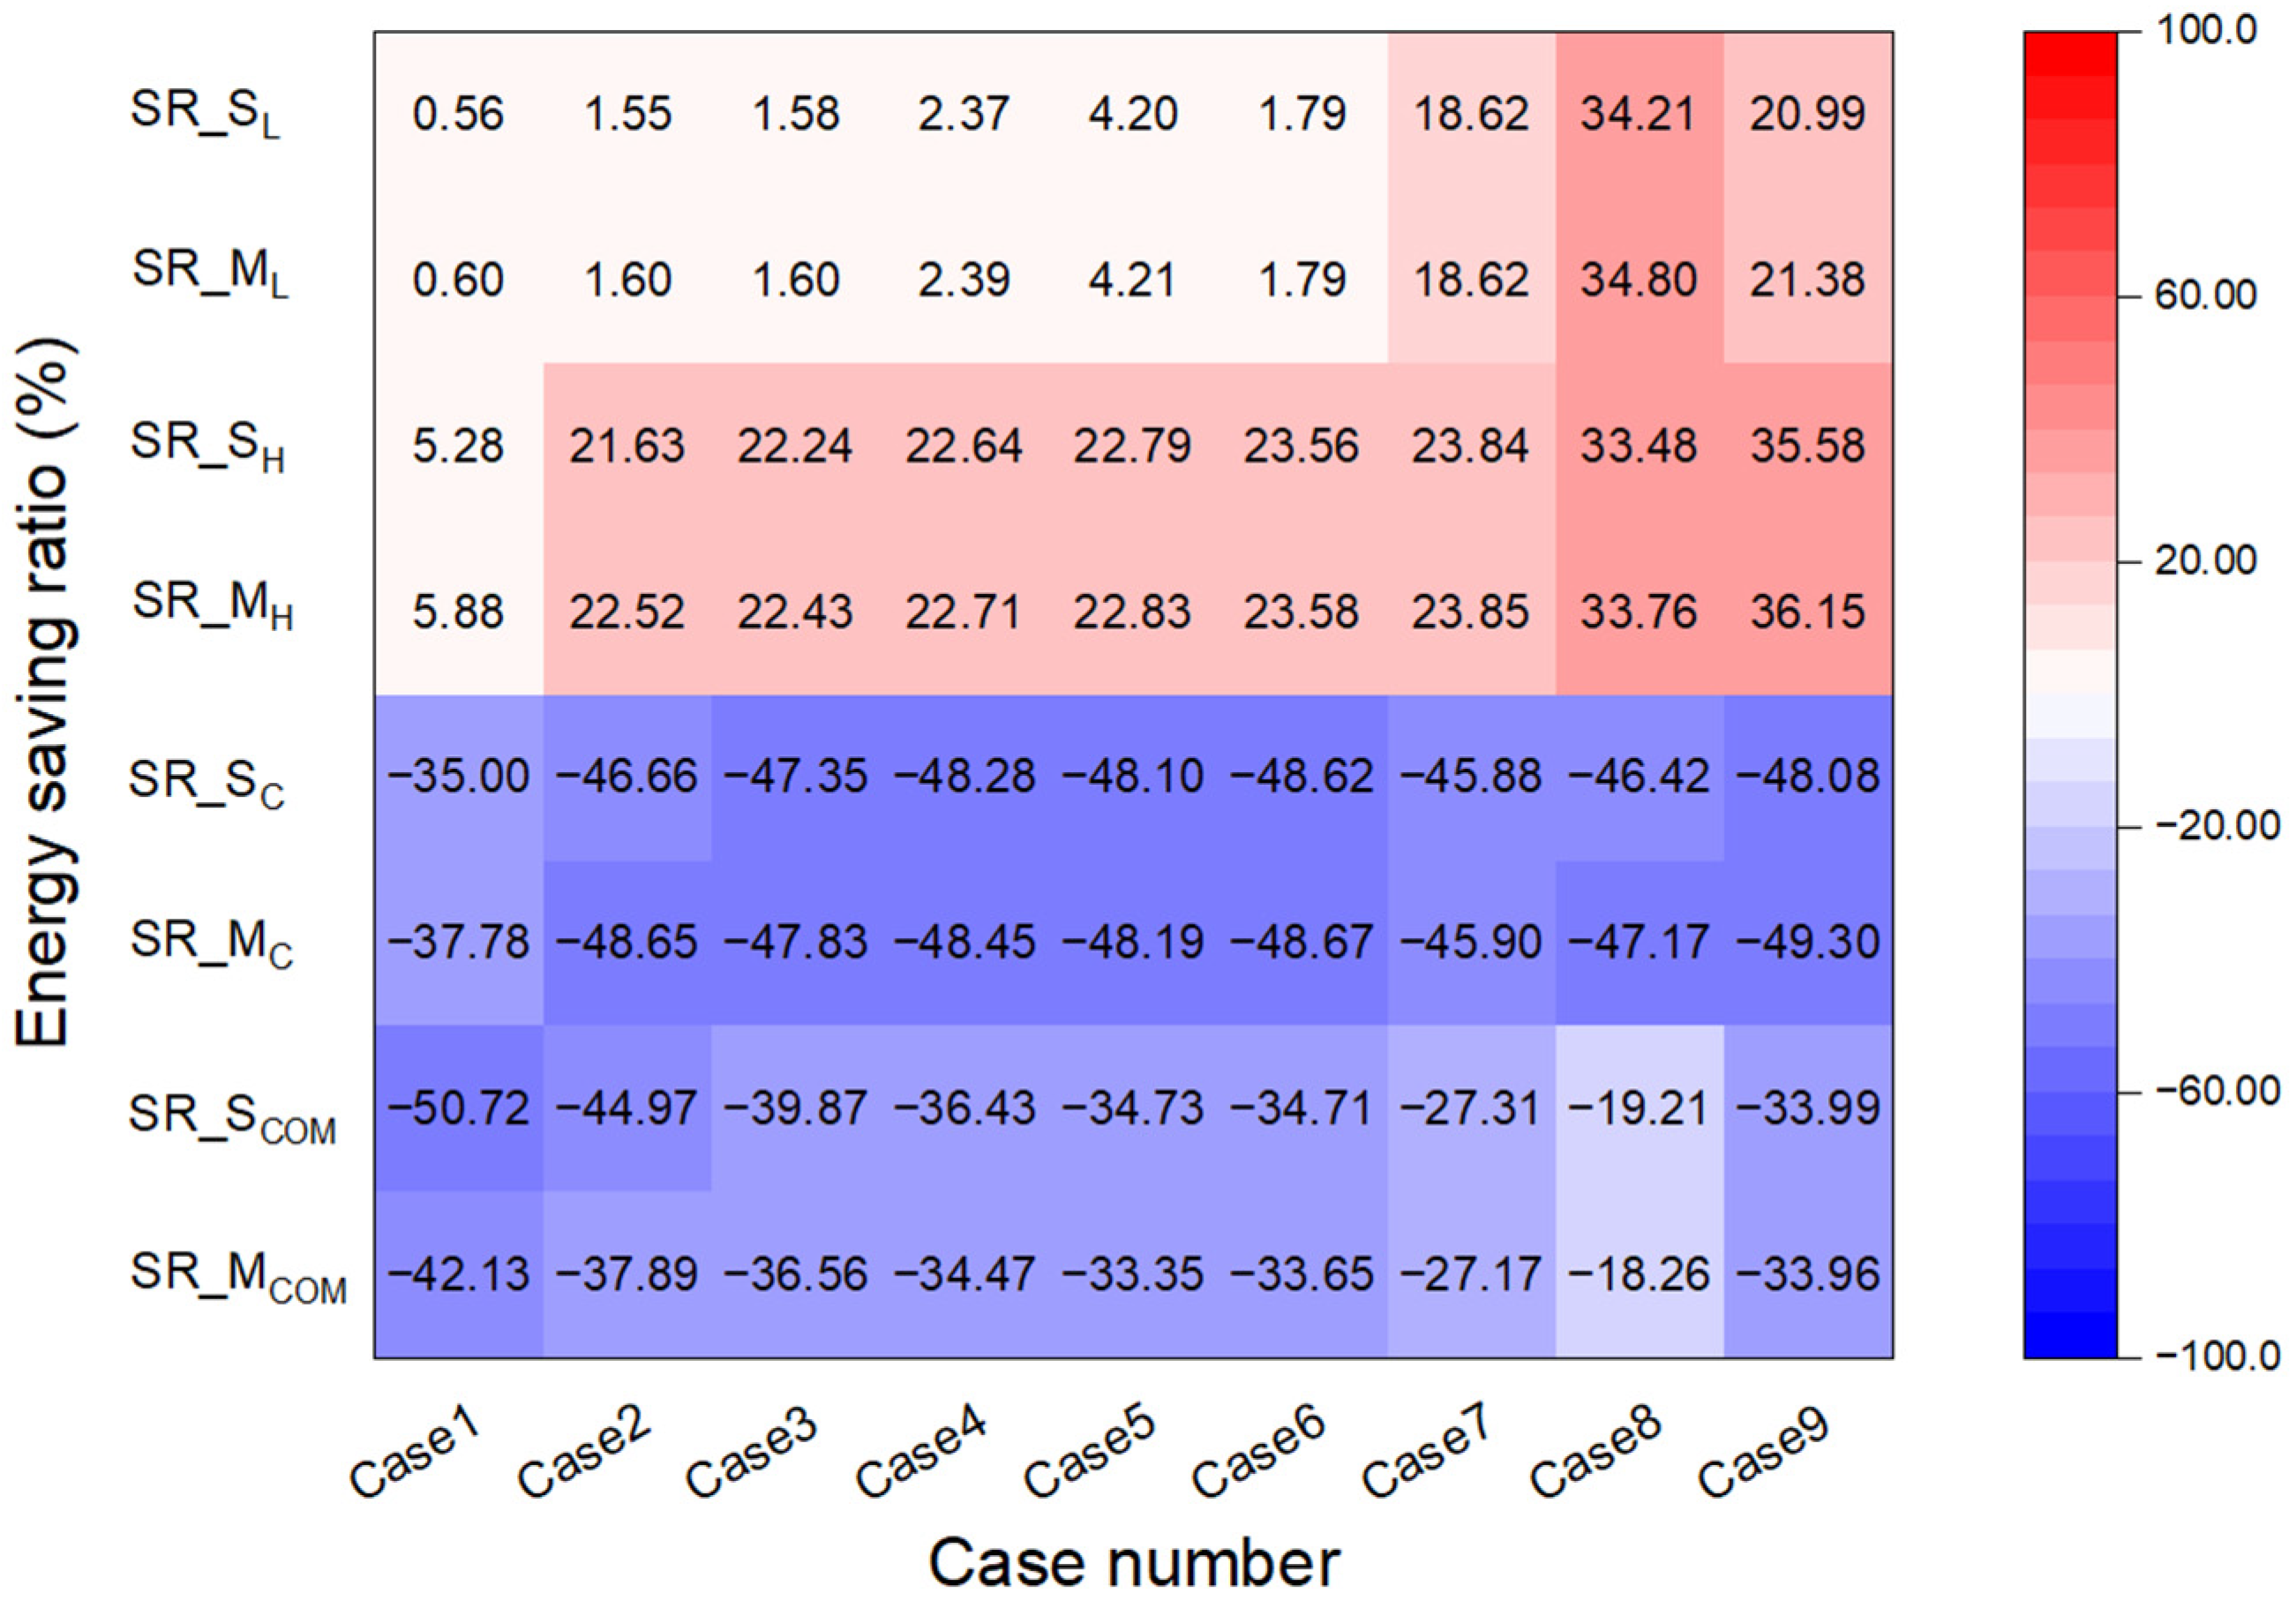
Figure 13 shows the energy-saving benefits of integrating PVSDs in buildings in Harbin. This heat map was plotted to represent the change in the energy ratio (SR) of the four energy performance metrics for different PVSDs (Case 1–Case 9) compared to the base case. Energy-saving ratios for single-story buildings (SR_S) and multi-story buildings (SR_M) are plotted separately. Specifically, even though the total energy consumption of Case 7–Case 9 increases, the power generated by PV can be effectively replenished with energy. In single-story buildings, the comprehensive energy savings ratios of different PVSDs ranged from 19.21% (Case 8_S) to 50.72% (Case 1_S). In multi-story buildings, ratios ranged from 18.26% (Case 8_S) to 42.13% (Case 1_S). The energy-saving potential of different PVSDs to reduce cooling energy consumption is comparable. However, Case 8 leads to a larger increase in heating and lighting energy consumption, making the building’s total energy consumption level higher, which results in poor energy savings. Furthermore, for the same PVSDs, Case 1 shows the greatest difference in single-story and multi-story buildings, and Case 9 shows the least difference—this reflects the impact of shading effects on the comprehensive energy-saving rates provided by different PVSDs. This also suggests that setting PV panels vertically is an effective strategy when trying to avoid upper PVSDs’ shading effects on production losses. In single-story buildings, the ranking of PVSDs in terms of energy-savings rates is Case 1 > Case 2 > Case 3 > Case 4 > Case 5 > Case 6 > Case 9 > Case 7 > Case 8; in multi-story buildings, the ranking of PVSDs in terms of energy-savings rates is Case 1 > Case 2 > Case 3 > Case 4 > Case 9 > Case 6 > Case 5 > Case 7 > Case 8.
(2)
Beijing
Beijing as a typical cold zone, Figure 14 shows the energy-saving rates of different cases. As mentioned above, even though the total energy consumption increases in Case 7–Case 9, applying different PVSDs can reduce the comprehensive energy consumption due to PV generation. In single-story buildings, SRCOM for buildings with PVSDs is in the range of 9.91% (Case 8_S) to 56.97% (Case 1_S); in multi-story buildings, it ranges from 8.78% (Case 8_S) to 46.63% (Case 1_S). There is a significant difference in energy savings rates between cases. In single-story buildings, the ranking of PVSDs in terms of energy-savings rates is Case 1 > Case 2 > Case 3 > Case 4 > Case 5 > Case 6 > Case 9 > Case 7 > Case 8; in multi-story buildings, the ranking of PVSDs in terms of energy-savings rates is Case 1 > Case 2 > Case 3 > Case 4 > Case 6 > Case 5 > Case 9 > Case 7 > Case 8.
(3)
Shanghai
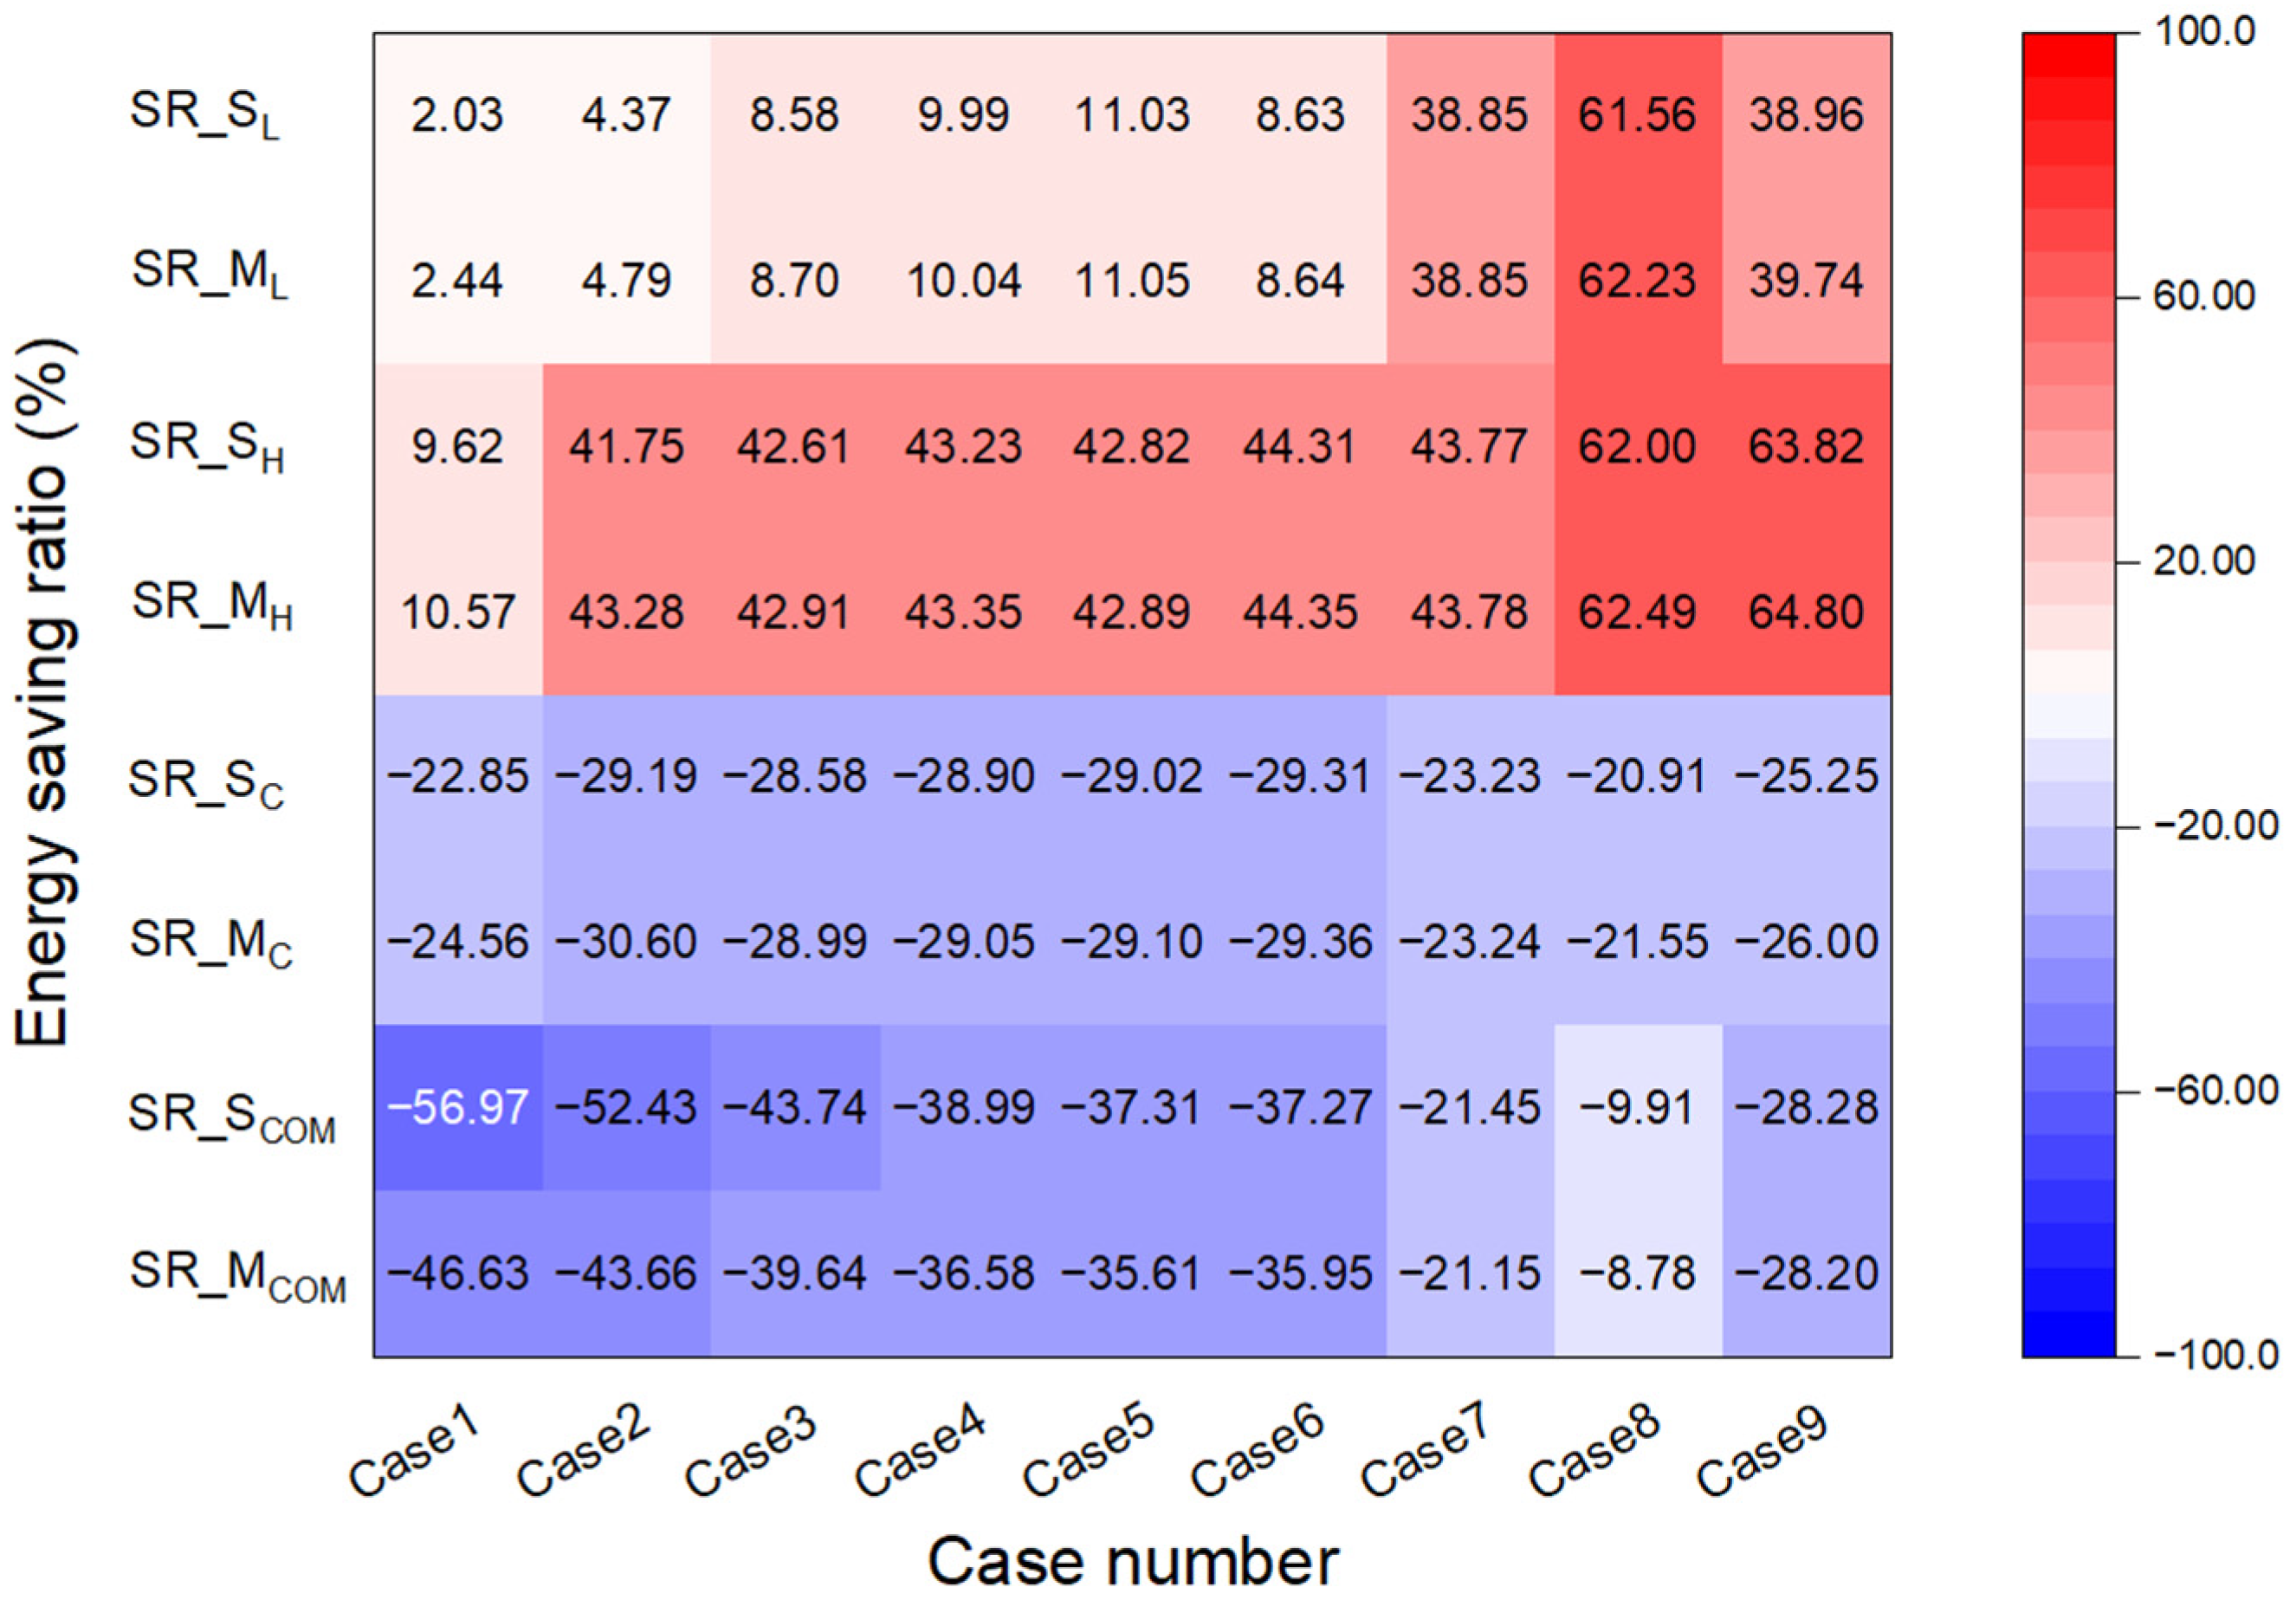
Figure 15 shows the energy-saving performance of applying different PVSDs in Shanghai. Due to the low heating consumption, even Case 9_M shows that the heating energy consumption increased by 75.92%; the corresponding comprehensive energy saving ratio also has a positive efficiency of 38.66%. Case 1 has the smallest impact on the energy consumption of lighting, cooling, and heating of the building, which is related to the solar altitude angle in Shanghai area. At the same time, the location of the PV panel in Case 1 is further away from the upper edge of the window, which causes less of an effect on window-transmitted solar radiation energy. In single-story buildings, comprehensive energy-saving ratios of different PVSDs ranged from 20.11% (Case 8_S) to 53.06% (Case 1_S). In multi-story buildings, comprehensive energy savings ratios of different PVSDs ranged from 21.03% (Case 8_M) to 40.00% (Case 2_M). There is no difference in PV production between Case 2_M and Case 1_M, but the relative positions of the PV panels and windows lead to a difference in comprehensive energy efficiency, making Case 1 more energy-efficient in single-story buildings and Case 2 more energy-efficient in multi-story buildings. In single-story buildings, the ranking of PVSDs in terms of energy-savings rates is Case 1 > Case 2 > Case 3 > Case 4 > Case 9 > Case 5 > Case 6 > Case 7 > Case 8; in multi-story buildings, the ranking of PVSDs in terms of energy-savings rates is Case 2 > Case 9 > Case 3 > Case 1 > Case 4 > Case 6 > Case 5 > Case 7 > Case 8.
(4)
Kunming
As shown in Figure 16, the energy-saving potential of PVSDs is higher when applied in moderate zones (with Kunming used as an example). In single-story buildings, comprehensive energy savings ratios of different PVSDs ranged from 29.94% (Case 8_S) to 105.74% (Case 2_S). In multi-story buildings, comprehensive energy saving ratios of different PVSDs ranged from 18.26% (Case 8_S) to 42.13% (Case 1_S). Case 1_S and Case 2_S have comprehensive energy savings rates of over 100%. The reason for this is that lighting and cooling account for the majority of energy consumption in Kunming; however, there is a small increase in lighting energy consumption that resulted from these two styles of PVSDs, and with the reduction in cooling and supplementary PV generation, the building energy-saving potential is considerable. As for the heating energy consumption of buildings in Kunming, since it accounts for a negligible percentage, even if Case 8_M increases by 423.86%, it has a tiny impact on the comprehensive energy consumption. Case 8 is a fine indicator: it demonstrates that PVSDs have a high energy-saving potential and are well-suited for moderate zones such as Kunming, where the level of air conditioning energy consumption is low—as long as PVSDs do not increase the building’s lighting consumption significantly. In single-story buildings, the ranking of PVSDs in terms of energy-savings rates is Case 2 > Case 1 > Case 3 > Case 4 > Case 6 > Case 5 > Case 9 > Case 7 > Case 8; in multi-story buildings, the ranking of PVSDs in terms of energy-savings rates is Case 2 > Case 3 > Case 4 > Case 6 > Case 1 > Case 5 > Case 9 > Case 7 > Case 8.
(5)
Guangzhou
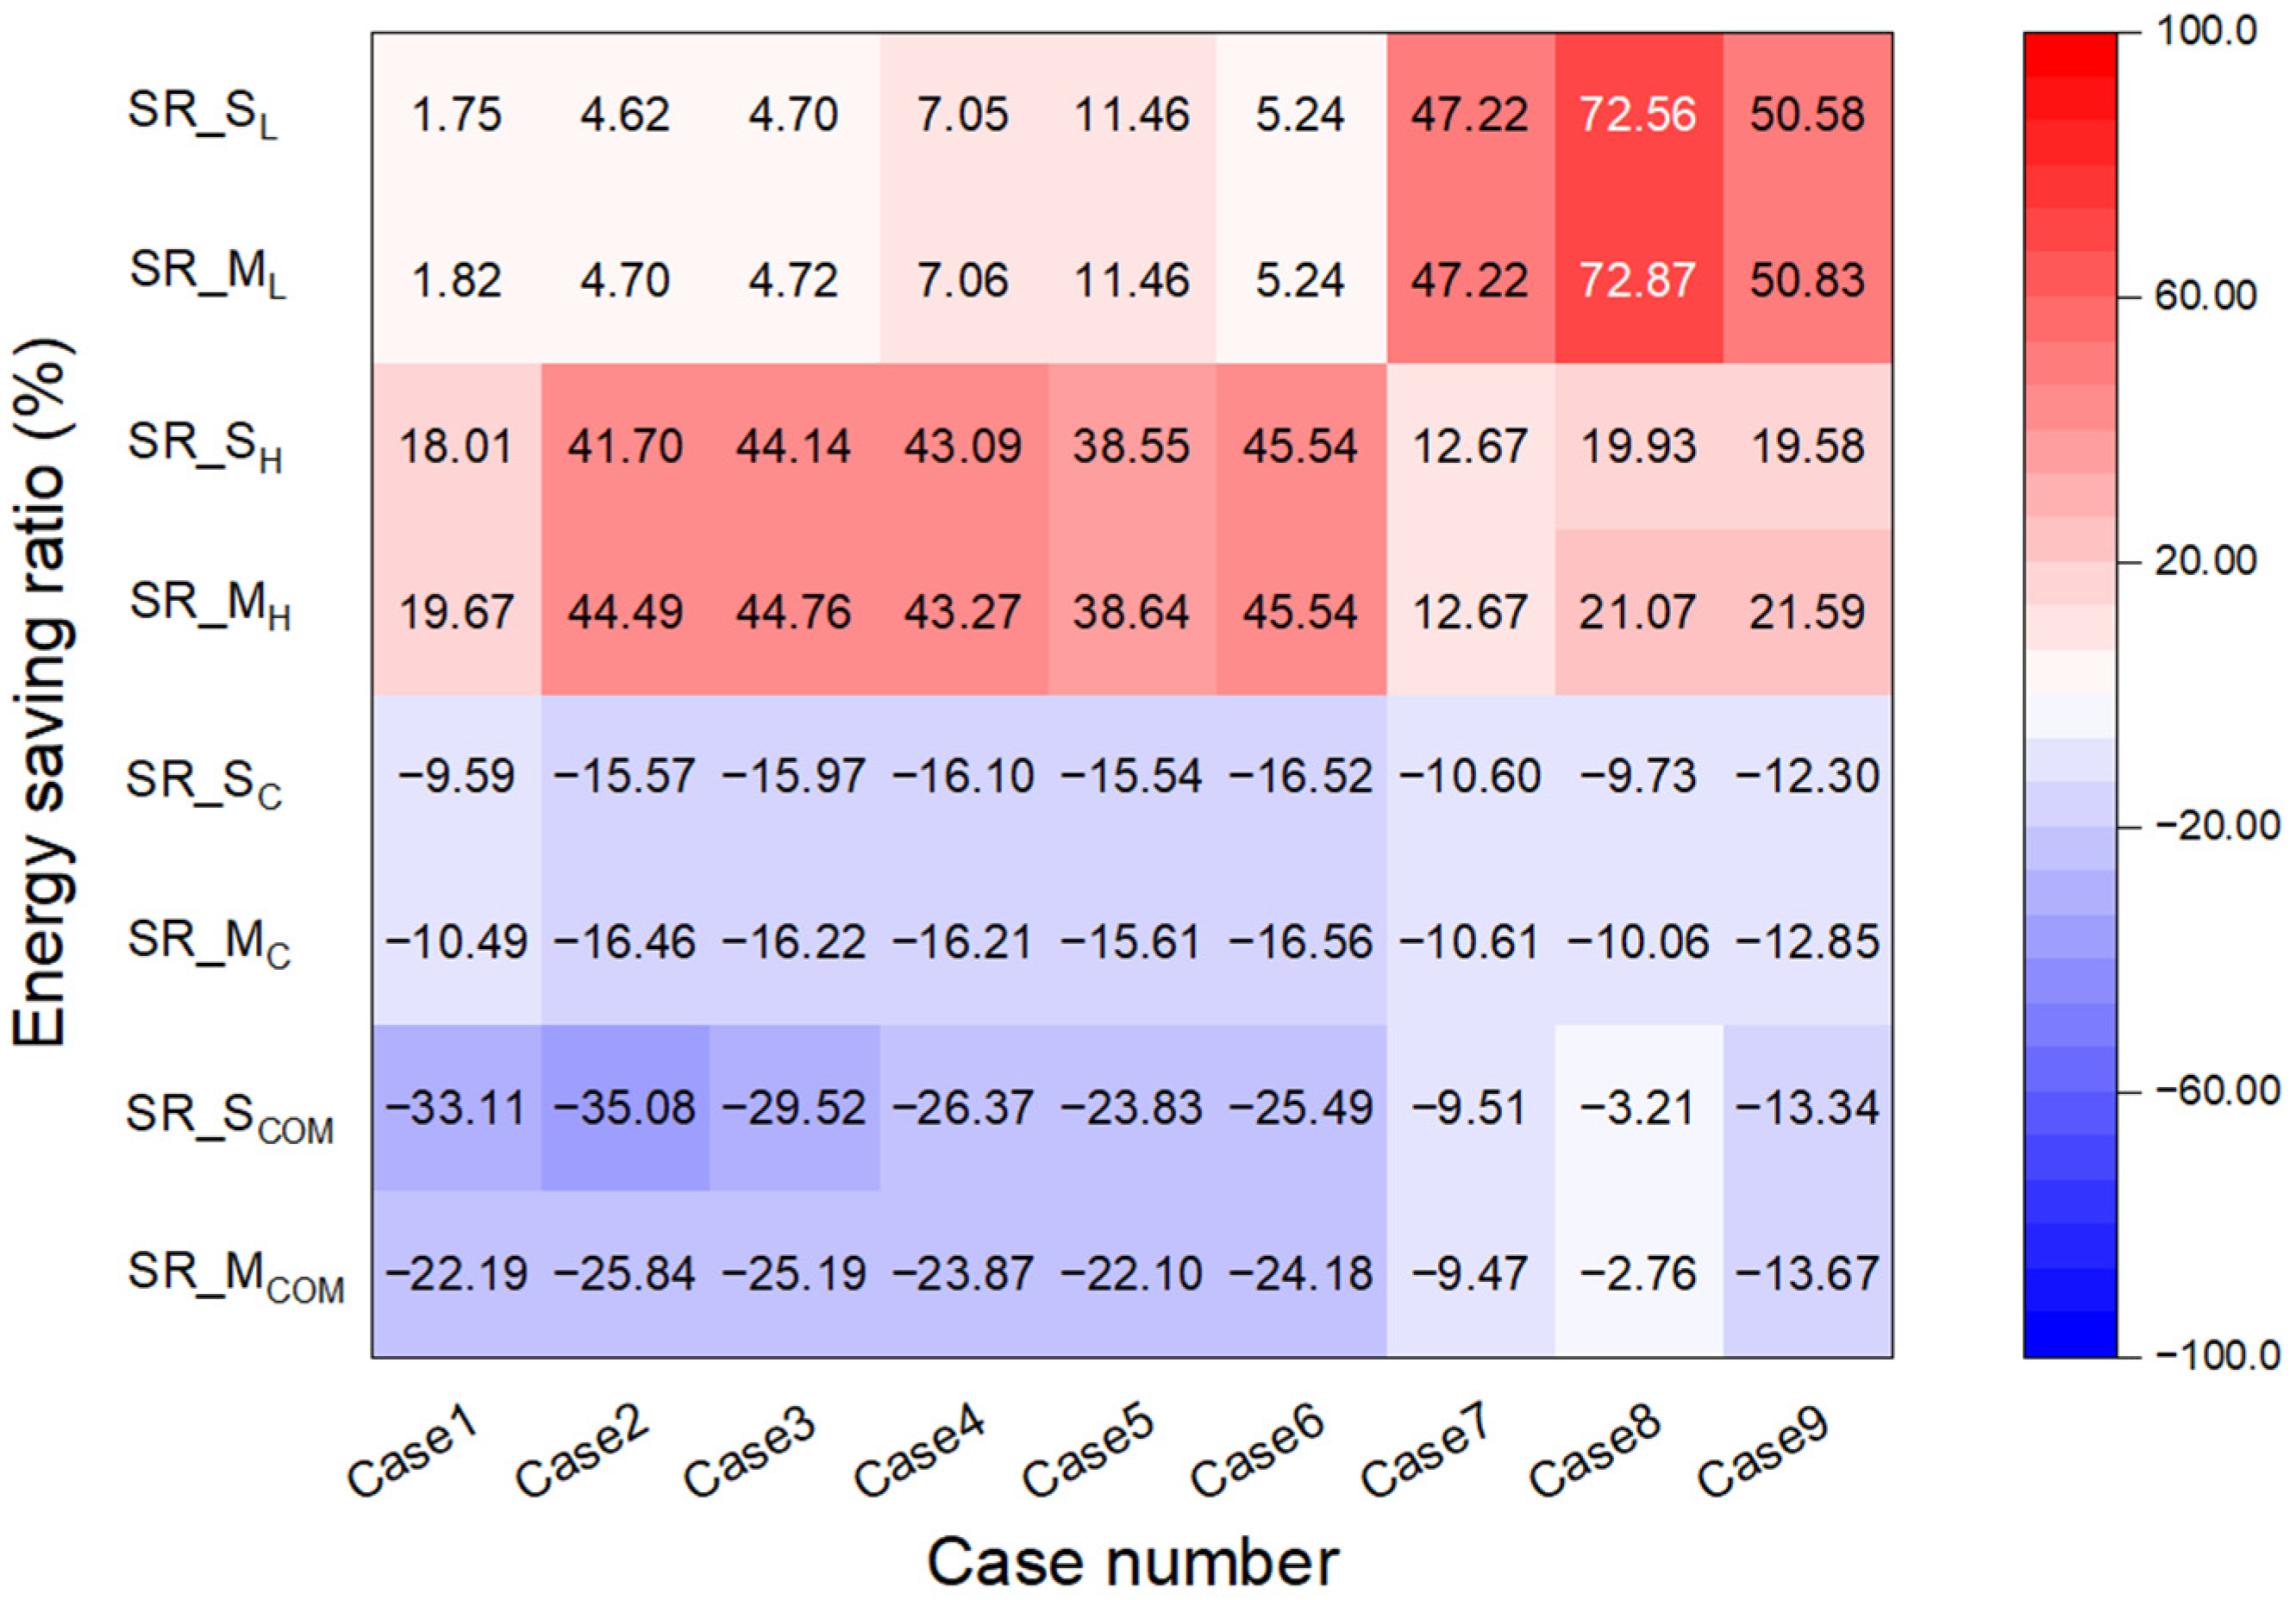
In a hot summer and warm winter zone (such as Guangzhou—Figure 17), different PVSDs can reduce comprehensive energy consumption (even if it is a minor advantage in terms of generation share, as described in Figure 12). For single-story buildings, comprehensive energy savings ratios for different PVSDs ranged from 3.21% (Case 8_S) to 35.08% (Case 2_S). For multi-story buildings, comprehensive energy savings ratios of different PVSDs ranged from 2.76% (Case 8_S) to 25.84% (Case 2_S). The reason for such a minor saving in the comprehensive energy consumption of Case 8 is the significant increase in its lighting energy consumption; in terms of cooling energy consumption, different PVSDs show savings of between 9% and 17% compared to the base case-changes in lighting energy consumption dominate the comprehensive energy consumption. In addition, Guangzhou has the lowest solar radiation among the five cities, leading to a geographic disadvantage and a low PV production. In single-story buildings, the ranking of PVSDs in terms of energy-savings rates is Case 2 > Case 1 > Case 3 > Case 4 > Case 6 > Case 5 > Case 9 > Case 7 > Case 8; in multi-story buildings, the ranking of PVSDs in terms of energy-savings rates is Case 2 > Case 3 > Case 6 > Case 4 > Case 1 > Case 5 > Case 9 > Case 7 > Case 8.

3.4. A Cross-Region Comparison of Different PVSDs

Based on the results and discussions in previous paragraphs, it was tried to identify the comprehensive energy-saving potential of different PVSDs. As a result, it can be found that the energy-saving potential of different PVSDs varies, and energy-saving rates of the same PVSDs applied in different climate zones may also vary—this makes the choice of PVSDs comparable across different climate zones.
In this section, the PVSDs are ranked by their comprehensive energy-saving potential. The following two aspects were investigated: (1) the application potential of different PVSDs in five climate zones. (2) The application potential of PVSDs in single-story and multi-story buildings under different climatic conditions.
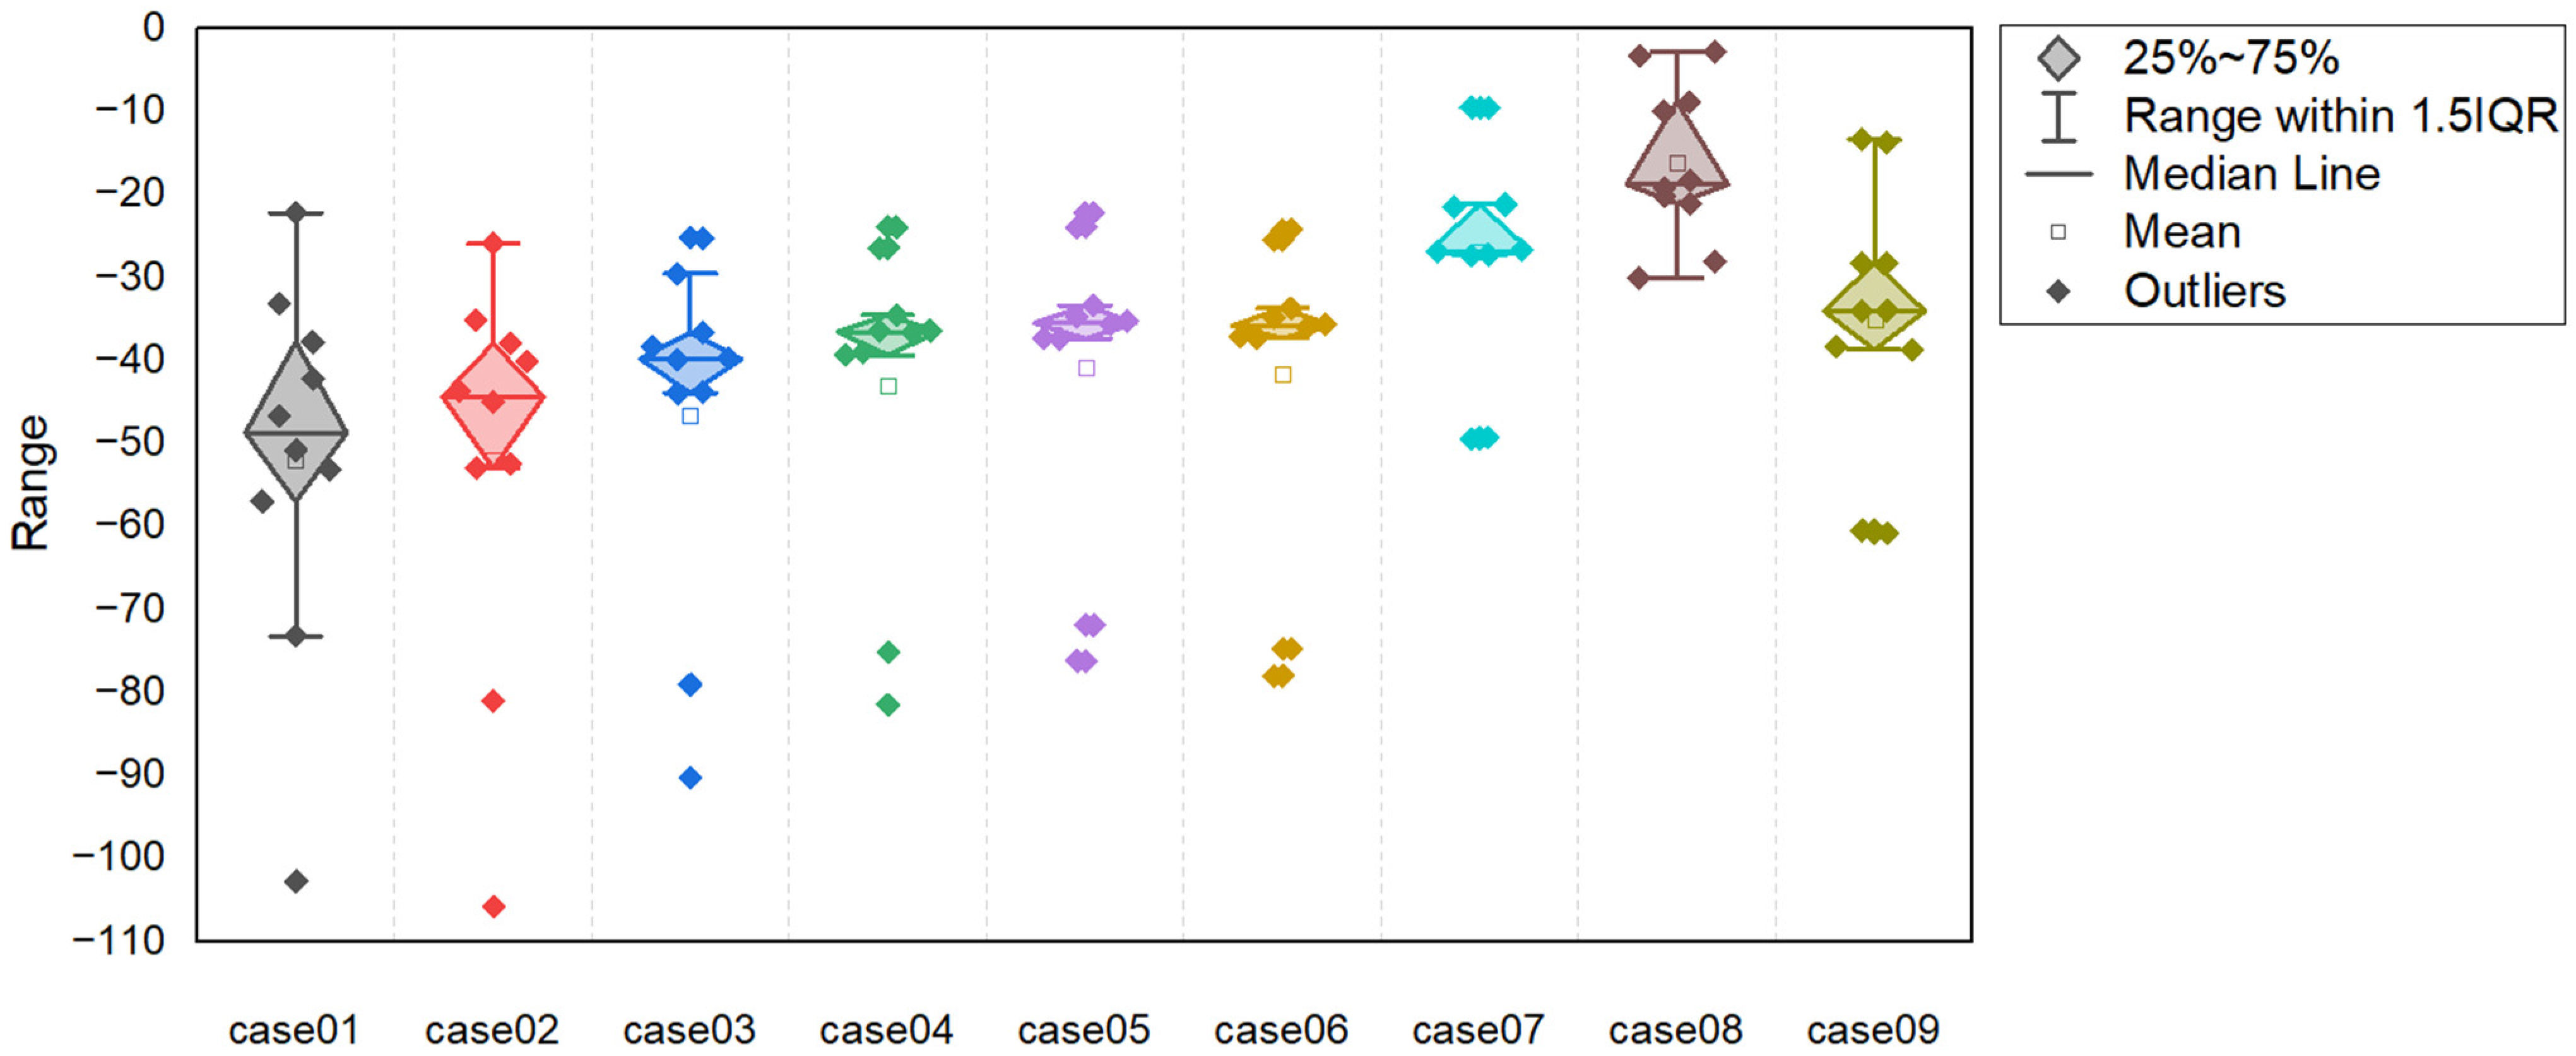
In Figure 18, comprehensive energy-saving ratios for different PVSDs are shown. The analysis characterizes the energy-saving potential of different shapes of PVSDs. Generally, comprehensive energy-saving ratios vary from 2.76% (Guangzhou, Case 8_M) to 105.74% (Kunming, Case 2_S). In severe cold zone and cold zone, the PVSDs with the best performance can achieve a comprehensive energy saving rate of 50.72% (Harbin, Case 1_S) or 56.97% (Beijing, Case 1_S). This also demonstrates that cold regions can also be promising for PVSDs application—when the proper style of PVSDs is chosen. The average values of comprehensive energy savings ratios are in the range of 16.12% (Case 8) to 51.95% (Case 2) for the different PVSDs. Moreover, the different PVSDs can be ranked in order of their comprehensive energy-saving potential as follows: Case 2 > Case 1 > Case 3 > Case 4 > Case 6 > Case 5 > Case 9 > Case 7 > Case 8.
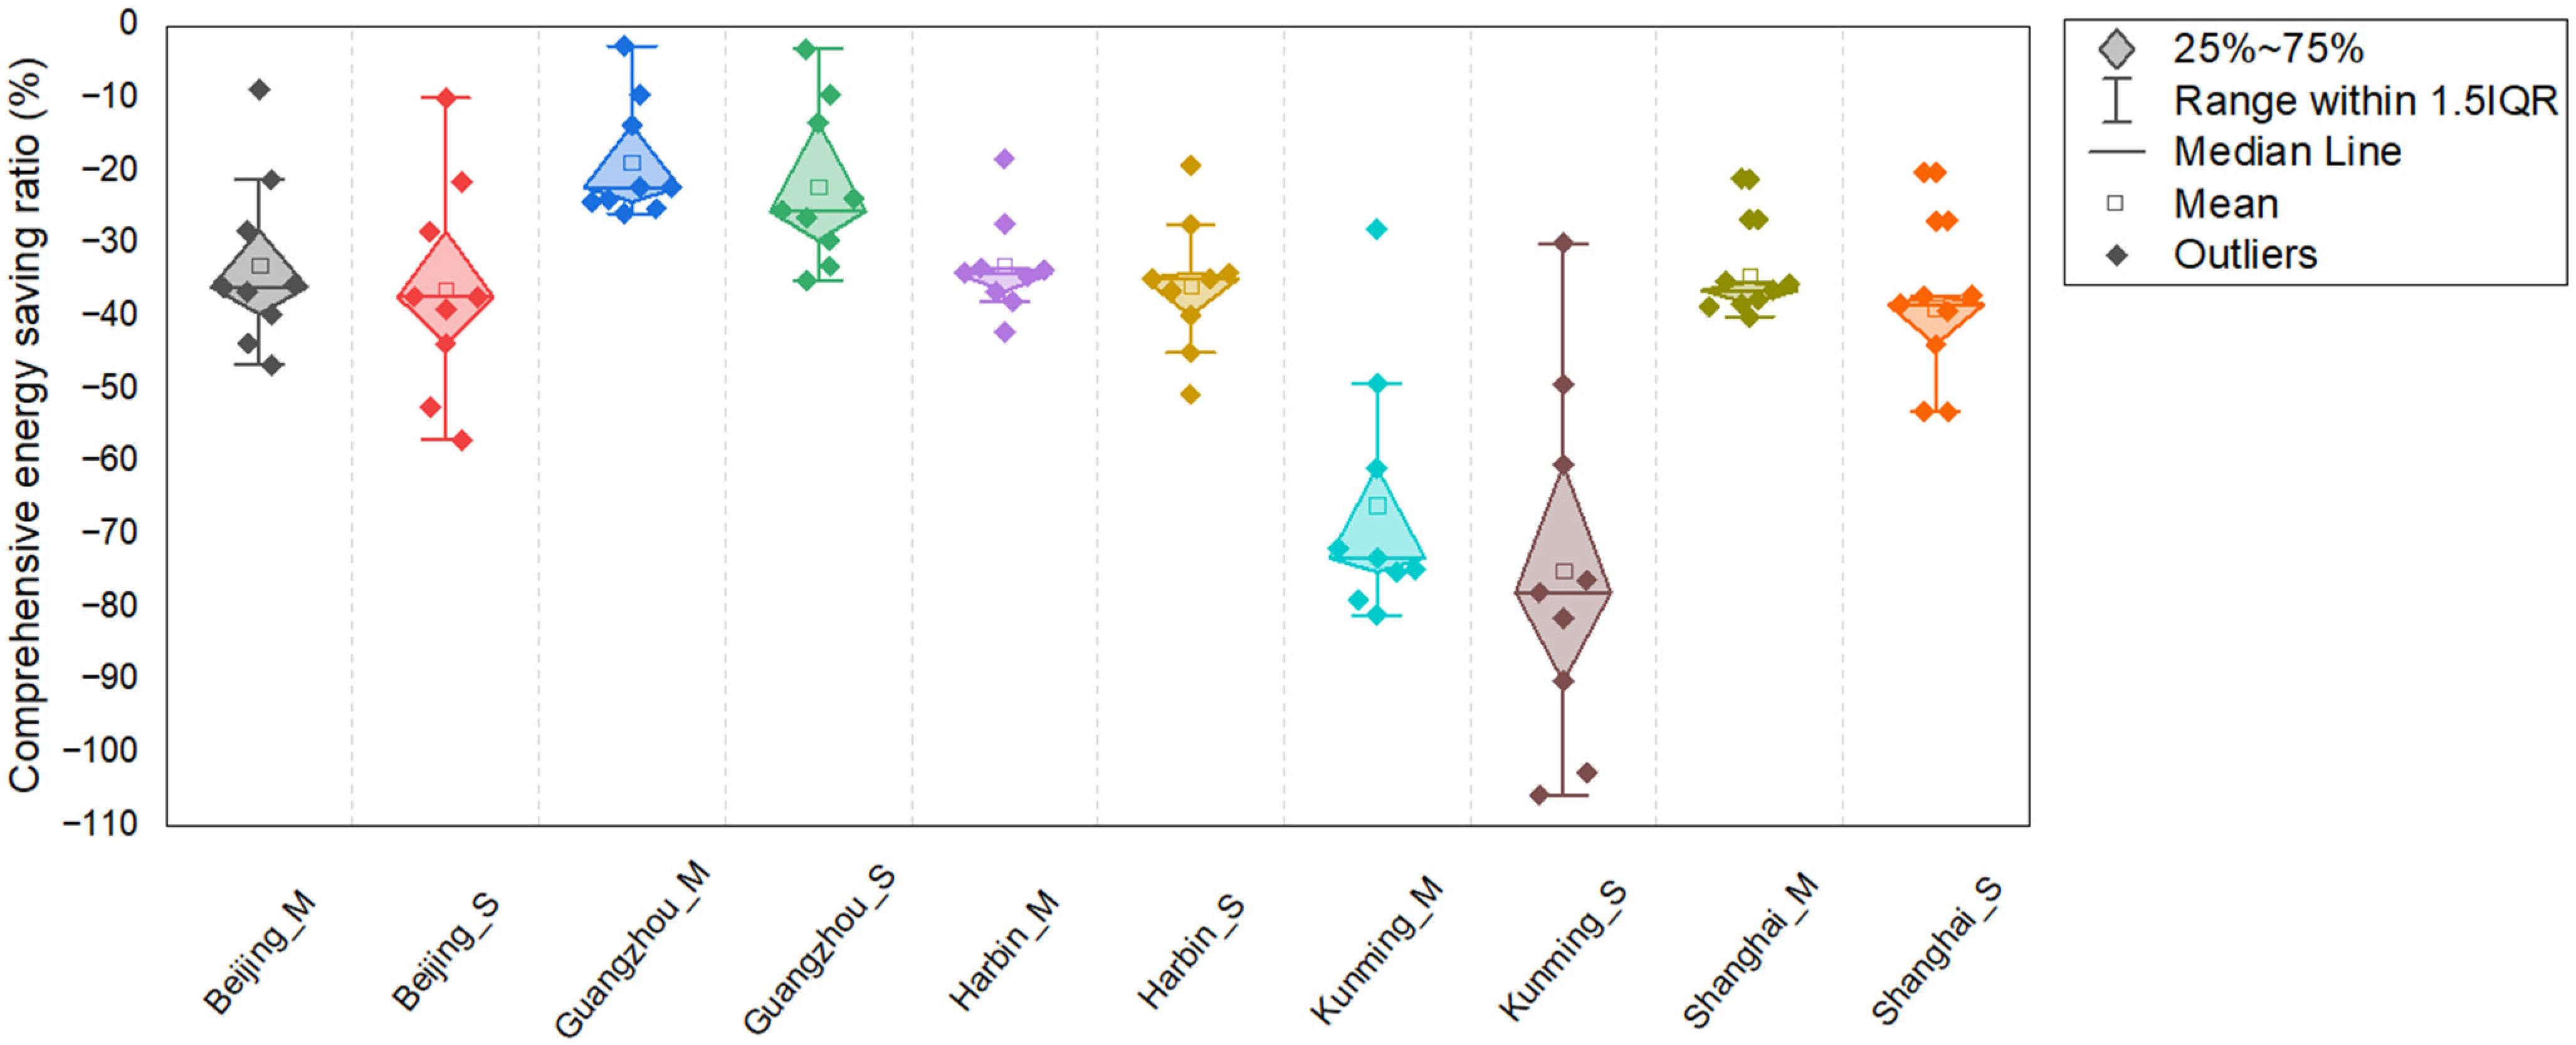
Figure 19 shows the energy performance of different PVSDs in single-story and multi-story buildings in five typical cities, which reveals the variability of PVSDs performance in different climate zones. In terms of the average values of comprehensive energy-saving rates for single-story and multi-story buildings, the distribution ranges from 18.81% (Guangzhou_M) to 74.87% (Kunming_S). The ranking of different PVSDs is Kunming_S > Kunming_M > Shanghai_S > Beijing_S > Harbin_S > Shanghai_M > Harbin_M > Beijing_M > Guangzhou_S > Guangzhou_M. It can be seen that the potential for the application of PVSDs in single-story buildings is generally better than in multi-story buildings. Even in a severe cold zone or cold zone, the energy-saving potential of PVSDs can be considerable. The above ranking is also a reminder at the early design stage to achieve a specific building energy-saving ratio target: the top ranking has more styles of PVSDs to choose from, as they all have the energy-saving potential that meets the performance objectives.

3.5. PVSDs and Other Existing Techniques: A Comparative Study

Through the results and discussion above, it can be found that various PVSDs have different energy-saving effects. In Table 5, the energy-saving effects of PVSDs and other existing techniques are compared, including PV glazing, a photovoltaic double-skin façade, electrochromic windows, thermochromic windows, spectrally selective windows using ATO nanofluids, and flat gravity-assisted heat pipes and PCM.

4. Conclusions

In this study, simulation models of different PVSDs in single-story and multi-story buildings were developed, and a cross-region study was carried out to explore the comprehensive energy-saving potential. The main findings are as follows:
(1)
Different PVSDs have variable energy-saving potential in five climate zones. The comprehensive energy-saving ratios of nine PVSDs range from 2.76% (Guangzhou, semi-eggcrate with louvers in the vertical plane, multi-layer) to 105.74% (Kunming, lower single panel, single layer), and it is necessary to choose the appropriate PVSDs for each of the single-story and multi-story buildings. At the same time, PVSDs can have a positive energy-saving potential in cold regions, and in zones where PVSDs are generally more energy efficient, the choice of PVSDs is more flexible to achieve specific energy-saving ratio targets.
(2)
For climate zones with low air-conditioning energy consumption (e.g., Kunming), the choice of PVSDs should be based primarily on the negative effect of shading devices on the increase in lighting energy consumption.
(3)
In terms of the average comprehensive energy-saving ratio for five climate zones, single-story buildings are more suitable than multi-story buildings when applying PVSDs. If it is desired to reduce the PVSDs shading effect in multi-story buildings, Case 7 (multiple panels with 10 pieces), Case 8 (semi-eggcrate with louvers in the vertical plane), and Case 9 (vertical panel) provide references. A smaller width of the PV panels or placing the panels vertically can effectively avoid the shading effect of the upper PVSDs. In addition, the distance between the PV panel and the window’s top edge is an important parameter.
In the future, studies will be carried out on sensitivity analysis and multi-objective optimization for the design of PVSDs. In addition to lighting, thermal performance, and power generation, other objectives will be studied, such as the utilization of radiative sky cooling [43], window view visibility [44] (even if window view visibility is the same in single-story and multi-story buildings with the same PVSDs applied), and daylight glare probability (DGP) [45].

Author Contributions

Conceptualization, S.S.; data curation, S.S.; formal analysis, S.S.; funding acquisition, Y.S.; investigation, S.S., J.S., M.L., X.C. and W.G.; methodology, S.S.; software, S.S.; supervision, Y.S.; visualization, S.S.; writing—original draft, S.S.; writing—review and editing, S.S. All authors have read and agreed to the published version of the manuscript.

Funding

This research was funded by Ministry of Housing and Urban-Rural Development of the People’s Republic of China (grant number 2022-R-025) and National Natural Science Foundation of China (grant number 52078264).

Data Availability Statement

Not applicable.

Conflicts of Interest

The authors declare no conflict of interest.

References

  1. Jakučionytė-Skodienė, M.; Krikštolaitis, R.; Liobikienė, G. The contribution of changes in climate-friendly behaviour, climate change concern and personal responsibility to household greenhouse gas emissions: Heating/cooling and transport activities in the European Union. Energy 2022, 246, 123387. [Google Scholar] [CrossRef]
  2. Yang, T.; Athienitis, A.K. A review of research and developments of building-integrated photovoltaic/thermal (BIPV/T) systems. Renew. Sustain. Energy Rev. 2016, 66, 886–912. [Google Scholar] [CrossRef]
  3. He, B.-J.; Yang, L.; Ye, M.; Mou, B.; Zhou, Y. Overview of rural building energy efficiency in China. Energy Policy 2014, 69, 385–396. [Google Scholar] [CrossRef]
  4. China Building Energy Consumption Annual Report 2020. Build. Energy Effic. 2021, 49, 1–6.
  5. Zhang, Y.; Kang, J.; Jin, H. A review of green building development in China from the perspective of energy saving. Energies 2018, 11, 334. [Google Scholar] [CrossRef] [Green Version]
  6. GB 55015-2021; General Code for Energy Efficiency and Renewable Energy Application in Buildings. Ministry of Housing and Urban-Rural Development of the People’s Republic of China: Beijing, China, 2021.
  7. Shi, S.; Chu, Y.; He, Y.; Song, Y. Research on technical strategies of the overall design-oriented international BIPV project. Archit. Tech. 2021, 27, 49–53. [Google Scholar]
  8. Kirimtat, A.; Tasgetiren, M.F.; Brida, P.; Krejcar, O. Control of PV integrated shading devices in buildings: A review. Build. Environ. 2022, 214, 108961. [Google Scholar] [CrossRef]
  9. Kou, F.; Shi, S.; Zhu, N.; Song, Y.; Zou, Y.; Mo, J.; Wang, X. Improving the indoor thermal environment in lightweight buildings in winter by passive solar heating: An experimental study. Indoor Built Environ. 2022, 31, 2257–2273. [Google Scholar] [CrossRef]
  10. Shi, S.; Chu, Y.; Gao, W.; Song, Y. BIPV technology application for architectural façade. World Archit. Rev. 2022, 37, 35–38. [Google Scholar]
  11. Liao, W.; Xu, S. Energy performance comparison among see-through amorphous-silicon PV (photovoltaic) glazings and traditional glazings under different architectural conditions in China. Energy 2015, 83, 267–275. [Google Scholar] [CrossRef]
  12. Lee, H.M.; Yoon, J.H. Power performance analysis of a transparent DSSC BIPV window based on 2 year measurement data in a full-scale mock-up. Appl. Energy 2018, 225, 1013–1021. [Google Scholar] [CrossRef]
  13. Jarimi, H.; Lv, Q.; Ramadan, O.; Zhang, S.; Riffat, S. Design, mathematical modelling and experimental investigation of vacuum insulated semi-transparent thin-film photovoltaic (PV) glazing. J. Build. Eng. 2020, 31, 101430. [Google Scholar] [CrossRef]
  14. Wang, C.; Ji, J.; Uddin, M.M.; Yu, B.; Song, Z. The study of a double-skin ventilated window integrated with CdTe cells in a rural building. Energy 2021, 215, 119043. [Google Scholar] [CrossRef]
  15. Peng, J.; Lu, L.; Yang, H. An experimental study of the thermal performance of a novel photovoltaic double-skin façade in Hong Kong. Sol. Energy 2013, 97, 293–304. [Google Scholar] [CrossRef]
  16. Peng, J.Q.; Curcija, D.C.; Lu, L.; Selkowitz, S.E.; Yang, H.X.; Zhang, W.L. Numerical investigation of the energy-saving potential of a semi-transparent photovoltaic double-skin façade in a cool-summer Mediterranean climate. Appl. Energy 2016, 165, 345–356. [Google Scholar] [CrossRef]
  17. Peng, J.; Lu, L.; Yang, H.; Ma, T. Comparative study of the thermal and power performances of a semi-transparent photovoltaic façade under different ventilation modes. Appl. Energy 2015, 138, 572–583. [Google Scholar] [CrossRef]
  18. Yang, S.L.; Cannavale, A.; Di Carlo, A.; Prasad, D.; Sproul, A.; Fiorito, F. Performance assessment of BIPV/T double-skin façade for various climate zones in Australia: Effects on energy consumption. Sol. Energy 2020, 199, 377–399. [Google Scholar] [CrossRef]
  19. Sinapis, K.; Donker, M. BIPV Report 2013 State of the Art in Building Integrated Photovoltaics; SEAC: Eindhoven, The Netherlands, 2015. [Google Scholar]
  20. Yoo, S.H.; Lee, E.T. Efficiency characteristic of building integrated photovoltaics as a shading device. Build. Environ. 2002, 37, 615–623. [Google Scholar] [CrossRef]
  21. Sun, L.L.; Yang, H.X. Impacts of the shading-type building-integrated photovoltaic claddings on electricity generation and cooling load component through shaded windows. Energy Build. 2010, 42, 455–460. [Google Scholar] [CrossRef]
  22. Sun, L.; Lu, L.; Yang, H. Optimum design of shading-type building-integrated photovoltaic claddings with different surface azimuth angles. Appl. Energy 2012, 90, 233–240. [Google Scholar] [CrossRef]
  23. Zhang, W.L.; Lu, L.; Peng, J.Q. Evaluation of potential benefits of solar photovoltaic shadings in Hong Kong. Energy 2017, 137, 1152–1158. [Google Scholar] [CrossRef]
  24. Mandalaki, M.; Zervas, K.; Tsoutsos, T.; Vazakas, A. Assessment of fixed shading devices with integrated PV for efficient energy use. Sol. Energy 2012, 86, 2561–2575. [Google Scholar] [CrossRef]
  25. Skandalos, N.; Karamanis, D. An optimization approach to photovoltaic building integration towards low energy buildings in different climate zones. Appl. Energy 2021, 295, 117017. [Google Scholar] [CrossRef]
  26. Li, X.; Peng, J.; Li, N.; Wu, Y.; Fang, Y.; Li, T.; Wang, M.; Wang, C. Optimal design of photovoltaic shading systems for multi-story buildings. J. Clean. Prod. 2019, 220, 1024–1038. [Google Scholar] [CrossRef]
  27. Baghoolizadeh, M.; Nadooshan, A.A.; Raisi, A.; Malekshah, E.H. The effect of photovoltaic shading with ideal tilt angle on the energy cost optimization of a building model in European cities. Energy Sustain. Dev. 2022, 71, 505–516. [Google Scholar] [CrossRef]
  28. Baghoolizadeh, M.; Nadooshan, A.A.; Dehkordi, S.A.H.H.; Rostamzadeh-Renani, M.; Rostamzadeh-Renani, R.; Afrand, M. Multi-objective optimization of annual electricity consumption and annual electricity production of a residential building using photovoltaic shadings. Int. J. Energy Res. 2022; in press. [Google Scholar] [CrossRef]
  29. Gindi, S.E. The effect of shading devices with integrated photovoltaics on energy efficiency of buildings. In Advanced Studies in Efficient Environmental Design and City Planning; Springer: Berlin/Heidelberg, Germany, 2021; pp. 105–120. [Google Scholar]
  30. Mesloub, A.; Ghosh, A.; Touahmia, M.; Albaqawy, G.A.; Noaime, E.; Alsolami, B.M. Performance Analysis of Photovoltaic Integrated Shading Devices (PVSDs) and Semi-Transparent Photovoltaic (STPV) Devices Retrofitted to a Prototype Office Building in a Hot Desert Climate. Sustainability 2020, 12, 10145. [Google Scholar] [CrossRef]
  31. Taveres-Cachat, E.; Lobaccaro, G.; Goia, F.; Chaudhary, G. A methodology to improve the performance of PV integrated shading devices using multi-objective optimization. Appl. Energy 2019, 247, 731–744. [Google Scholar] [CrossRef]
  32. Zhang, X.; Lau, S.-K.; Lau, S.S.Y.; Zhao, Y. Photovoltaic integrated shading devices (PVSDs): A review. Sol. Energy 2018, 170, 947–968. [Google Scholar] [CrossRef]
  33. Yang, R.J.; Zou, P.X. Building integrated photovoltaics (BIPV): Costs, benefits, risks, barriers and improvement strategy. Int. J. Construct. Manag. 2016, 16, 39–53. [Google Scholar] [CrossRef]
  34. Windsor Liscombe, R. (Ed.) Architecture and the Canadian Fabric; UBC Press: Toronto, ON, Canada, 2011; p. 21. [Google Scholar]
  35. Li, N.; Peng, Z.; Dai, J.; Li, Z. Performance-Oriented Passive Design Strategies for Shape and Envelope Structure of Independent Residential Buildings in Yangtze River Delta Suburbs. Sustainability 2022, 14, 4571. [Google Scholar] [CrossRef]
  36. Crawley, D.B.; Lawrie, L.K.; Winkelmann, F.C.; Buhl, W.F.; Huang, Y.J.; Pedersen, C.O.; Strand, R.K.; Liesen, R.J.; Fisher, D.E.; Witte, M.J.; et al. EnergyPlus: Creating a new-generation building energy simulation program. Energy Build. 2001, 33, 319–331. [Google Scholar] [CrossRef]
  37. Mendis, T.; Huang, Z.; Xu, S.; Zhang, W. Economic potential analysis of photovoltaic integrated shading strategies on commercial building façades in urban blocks: A case study of Colombo, Sri Lanka. Energy 2020, 194, 116908. [Google Scholar] [CrossRef]
  38. Favoino, F.; Fiorito, F.; Cannavale, A.; Ranzi, G.; Overend, M. Optimal control and performance of photovoltachromic switchable glazing for building integration in temperate climates. Appl. Energy 2016, 178, 943–961. [Google Scholar] [CrossRef] [Green Version]
  39. GB 50034-2013; Standard for Lighting Design of Buildings. Ministry of Housing and Urban-Rural Development of the People’s Republic of China: Beijing, China, 2013.
  40. Xu, Y.; Yan, C.; Yan, S.; Liu, H.; Pan, Y.; Zhu, F.; Jiang, Y. A multi-objective optimization method based on an adaptive meta-model for classroom design with smart electrochromic windows. Energy 2022, 243, 122777. [Google Scholar] [CrossRef]
  41. Zhang, L.; Xia, H.; Xia, F.; Du, Y.; Wu, Y.; Gao, Y. Energy-Saving Smart Windows with HPC/PAA Hybrid Hydrogels as Thermochromic Materials. ACS Appl. Energy Mater. 2021, 4, 9783–9791. [Google Scholar] [CrossRef]
  42. Zhang, C.; Shen, C.; Zhang, Y.; Zheng, K.; Pu, J.; Zhao, X.; Ma, X. Experimental study of indoor light/thermal environment with spectrally selective windows using ATO nanofluids in winter. Energy Build. 2023, 278, 112597. [Google Scholar] [CrossRef]
  43. Wu, Y.; Zhao, H.; Sun, H.; Duan, M.; Lin, B.; Wu, S. A review of the application of radiative sky cooling in buildings: Challenges and optimization. Energy Convers. Manag. 2022, 265, 115768. [Google Scholar] [CrossRef]
  44. Ko, W.H.; Schiavon, S.; Zhang, H.; Graham, L.T.; Brager, G.; Mauss, I.; Lin, Y.-W. The impact of a view from a window on thermal comfort, emotion, and cognitive performance. Build. Environ. 2020, 175, 106779. [Google Scholar] [CrossRef] [Green Version]
  45. Sun, Y.; Liu, D.; Flor, J.-F.; Shank, K.; Baig, H.; Wilson, R.; Liu, H.; Sundaram, S.; Mallick, T.K.; Wu, Y. Analysis of the daylight performance of window integrated photovoltaics systems. Renew. Energy 2020, 145, 153–163. [Google Scholar] [CrossRef]
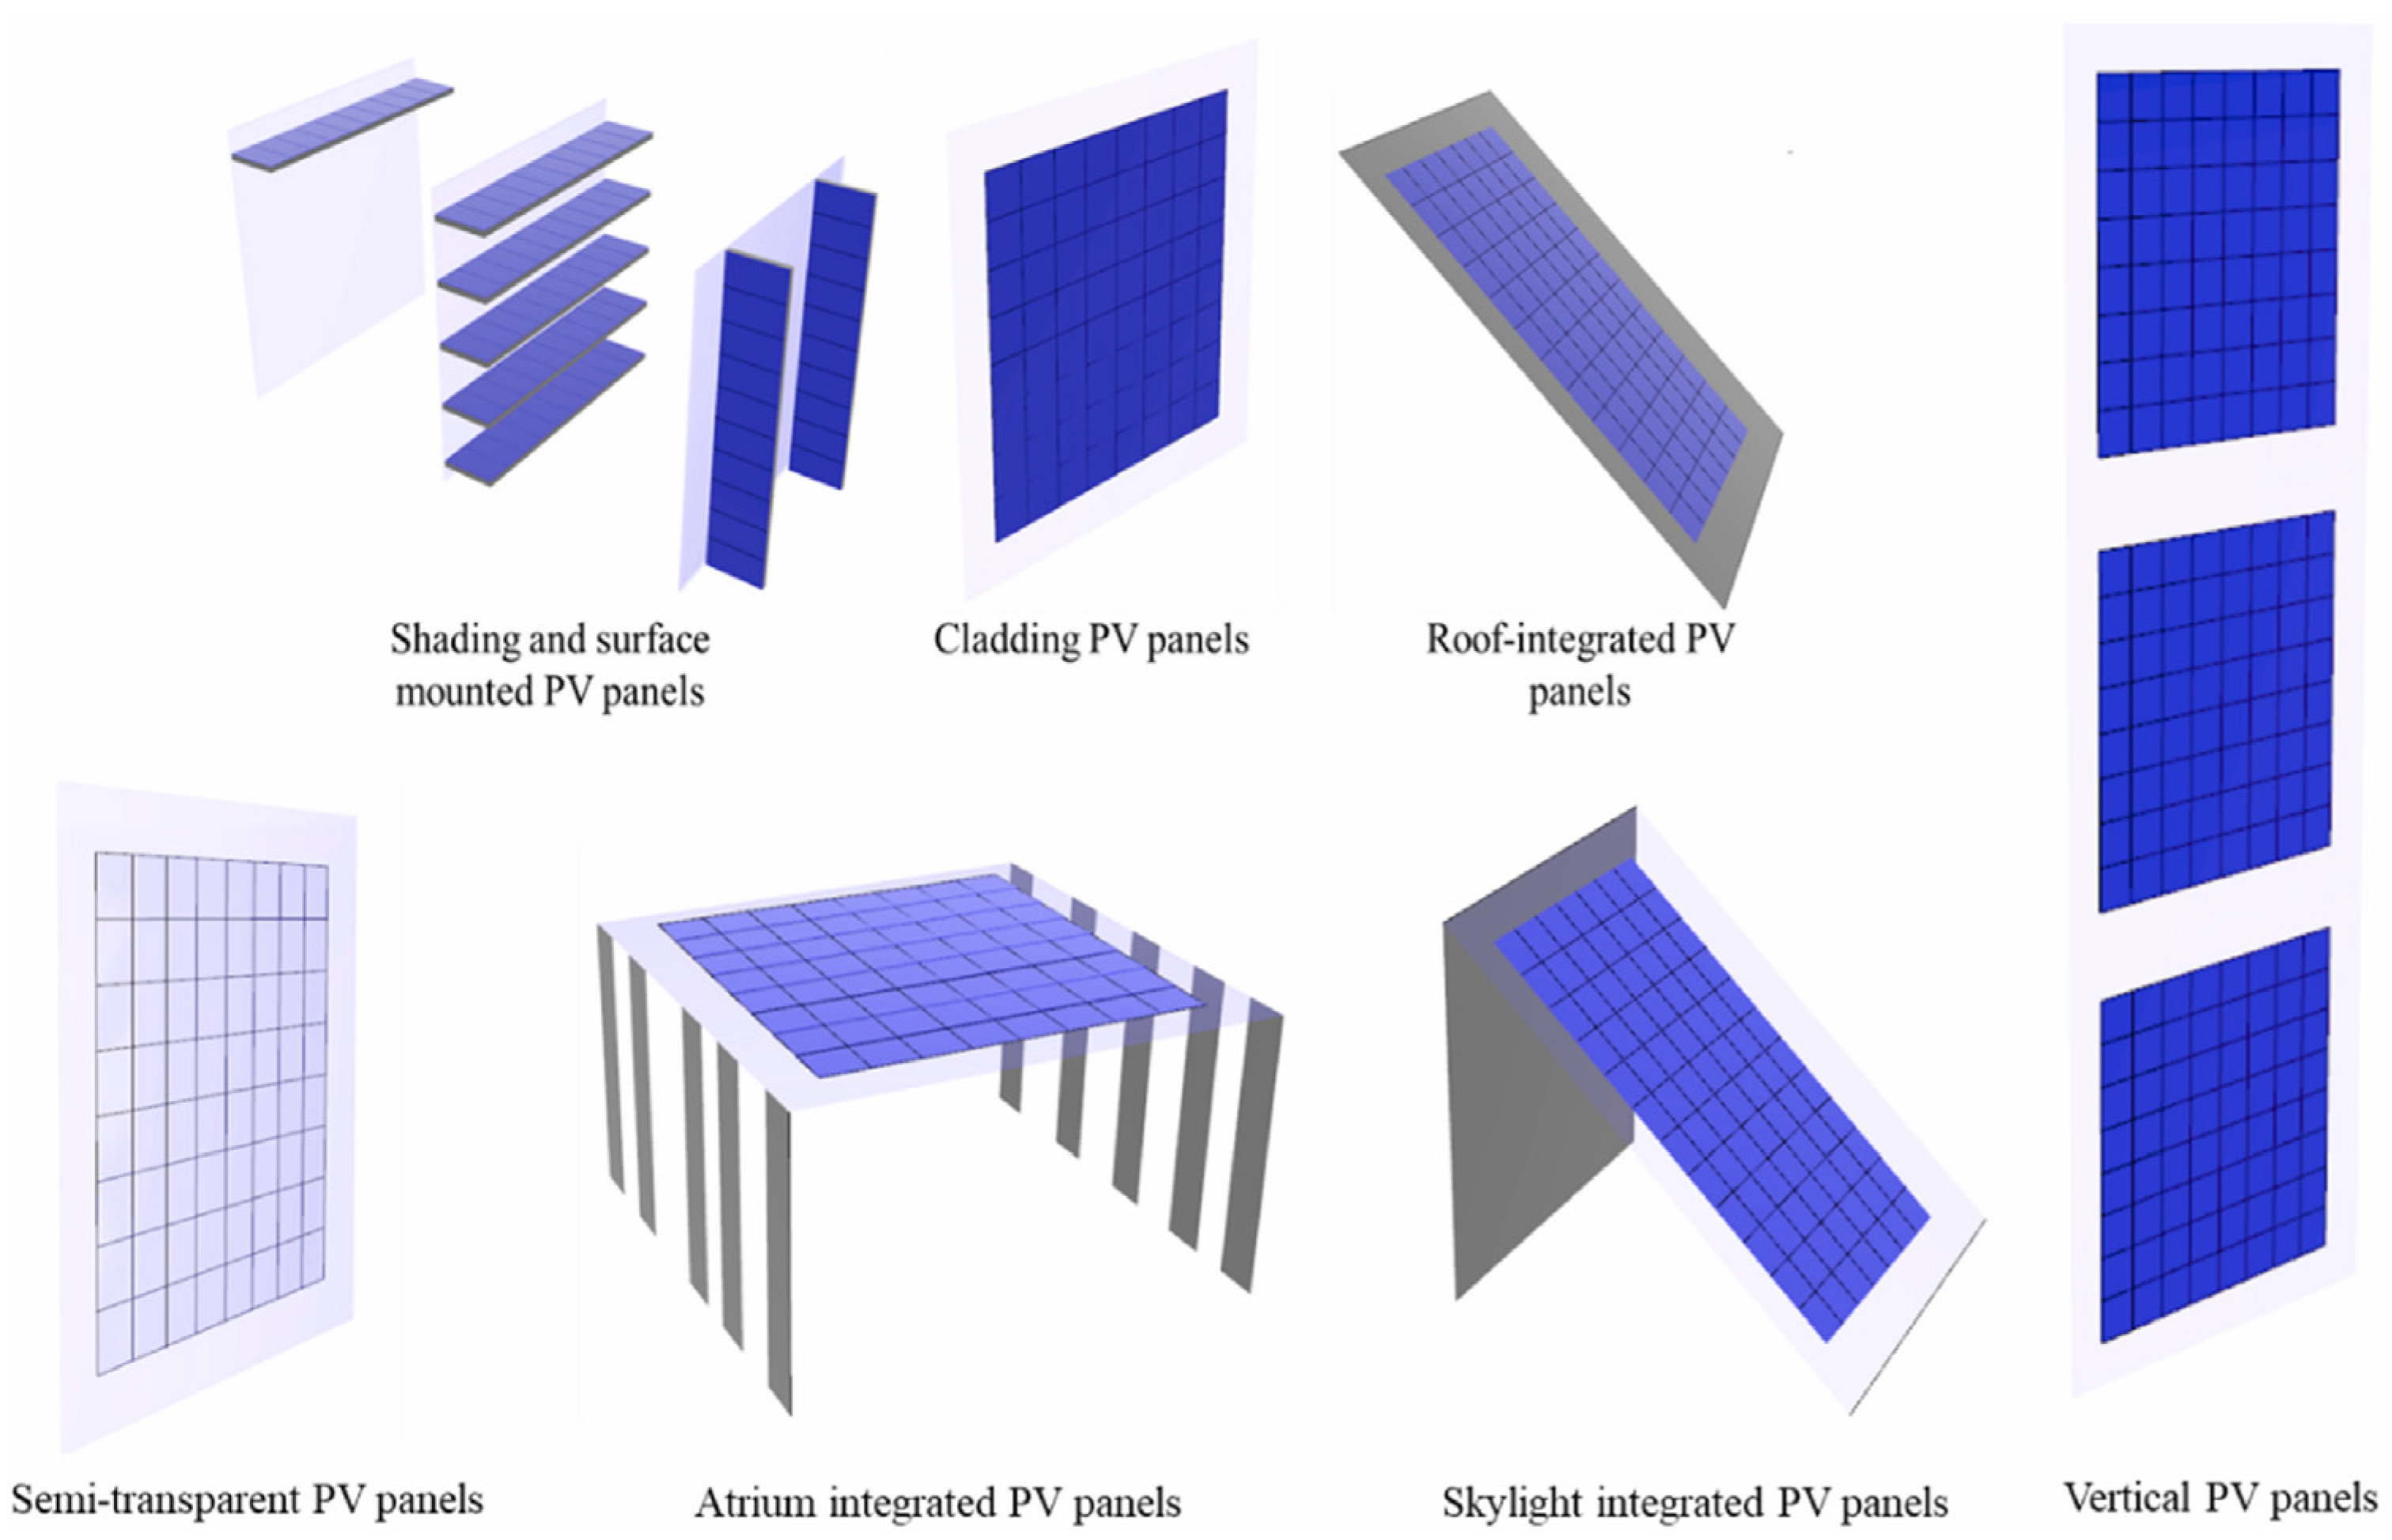
Figure 1. PV-integrated building envelope [8].
Energies 15 09196 g001
Figure 2. Semi-transparent a-Si PV glazing [11].
Energies 15 09196 g002
Figure 3. A photovoltaic double skin-façade in Beijing [10].
Energies 15 09196 g003
Figure 4. Cases of different PVSDs [19,31,32].
Energies 15 09196 g004
Figure 5. Research framework.
Energies 15 09196 g005
Figure 6. (a) Single-story buildings with PVSDs; (b) multi-story buildings with PVSDs.
Energies 15 09196 g006
Figure 7. Comparison of available solar in five cities.
Energies 15 09196 g007
Figure 8. Energy consumption of single-story and multi-story buildings (in Harbin) with different PVSDs.
Energies 15 09196 g008
Figure 9. Energy consumption of single-story and multi-story buildings (in Beijing) with different PVSDs.
Energies 15 09196 g009
Figure 10. Energy consumption of single-story and multi-story buildings (in Shanghai) with different PVSDs.
Energies 15 09196 g010
Figure 11. Energy consumption of single-story and multi-story buildings (in Kunming) with different PVSDs.
Energies 15 09196 g011
Figure 12. Energy consumption of single-story and multi-story buildings (in Guangzhou) with different PVSDs.
Energies 15 09196 g012
Figure 13. Energy saving analysis of buildings with different PVSDs in Harbin.
Energies 15 09196 g013
Figure 14. Energy saving analysis of building with different PVSDs in Beijing.
Energies 15 09196 g014
Figure 15. Energy saving analysis of building with different PVSDs in Shanghai.
Energies 15 09196 g015
Figure 16. Energy saving analysis of building with different PVSDs in Kunming.
Energies 15 09196 g016
Figure 17. Energy saving analysis of building with different PVSDs in Guangzhou.
Energies 15 09196 g017
Figure 18. Comprehensive energy-saving potential comparison between different PVSDs.
Energies 15 09196 g018
Figure 19. Comprehensive energy-saving potential comparison of typical cities in different climate zones.
Energies 15 09196 g019
Table 1. Room modeling parameters.
ParametersValues
Room width (m)6.00
Room depth (m)8.00
Room height (m)3.90
Window width (m)5.00
Window height (m)1.84
Sill height (m)1.00
Table 2. Room modeling parameters.
Case NumberCase 01Case 02Case 03
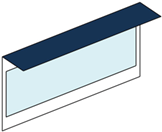
NameSingle panel (higher)Single panel (lower)Double panels
DiagramEnergies 15 09196 i001Energies 15 09196 i002Energies 15 09196 i003
Number of PV panels112
Distances between PV panels (m)--0.92
Area of single PVSD (m2)7.27.23.6
Total area of PV panels (m2)7.2
Case NumberCase 04Case 05Case 06
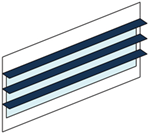
NameMultiple panels (3 pieces)Multiple panels (4 pieces)Multiple panels (5 pieces)
DiagramEnergies 15 09196 i004Energies 15 09196 i005Energies 15 09196 i006
Number of PVSDs345
Distances between PV panels (m)0.610.460.37
Area of single PVSD (m2)2.41.81.44
Total area of PV panels (m2)7.2
Case NumberCase 07Case 08Case 09
NameMultiple panels (10 pieces)Semi-eggcrate with louvers in the vertical planeVertical panel
DiagramEnergies 15 09196 i007Energies 15 09196 i008Energies 15 09196 i009
Number of PVSDs10101
Distances between PV panels (m)0.180.18-
Area of single PVSD (m2)0.720.727.2
Total area of PV panels (m2)7.2
Table 3. Parameters of the energy-analysis model.
ParameterValue
U-value of external wall [W/(m2 K)]0.400
U-value of window [W/(m2 K)]1.978
SHGC of window0.687
Air tightness (1/h)0.700
Normalized power density of general lighting [W/(m2 100 lux)]5.000
Occupancy of weekdaysFrom 7 to 19
Workdays/week (day)5
People density (people/m2)0.111
Target illuminance (lx)400 [39]
Working plane height (m)0.75 [39]
Heating setpoint temperature (°C)21
Heating set back temperature (°C)12
Cooling setpoint temperature (°C)26
Cooling set back temperature (°C)28
PV efficiency0.150
Table 4. Meteorological data of typical cities in five climate zones.
Climate ZoneCityGeographical LocationDirect Normal Solar (kW·h/a)Diffuse Horizontal Solar (kW·h/a)Outside Dry-Bulb Temperature
Longitude (°)Latitude (°)Tmax (°C)Tmin (°C)
Severe coldHarbin126.7745.751286.35691.7033.1−29.9
ColdBeijing116.2839.931325.34531.7937.2−14.2
Hot-summer and cold-winterShanghai121.4731.40759.93918.9838.0−7.0
ModerateKunming102.6825.02850.08900.8729.9−2.0
Hot-summer and warm-winterGuangzhou113.4823.22588.55736.1236.64.7
Table 5. Comparison of PVSDs and other techniques.
Façade TechniquesTechnique TypeSolar Energy Utilization MethodsCityResearch MethodsRoom DescriptionBuilding TypeEnergy-Saving Effects
PVSDs (this study)ActiveThermal, optical, and electricalHarbin (45.75° N)Simulations6.0 × 8.0 × 3.9 (width × depth × height, unit: m)OfficeComprehensive energy-saving ratios range from 18.26% to 50.72% annually
Beijing (39.93° N)Comprehensive energy-saving ratios range from 8.78% to 56.97% annually
Shanghai (31.40° N)Comprehensive energy-saving ratios range from 20.11% to 53.06% annually
Kunming (25.02° N)Comprehensive energy-saving ratios range from 18.26% to 105.74% annually
Guangzhou (23.22° N)Comprehensive energy-saving ratios range from 2.76% to 35.08% annually
A-Si PV glazing [11]ActiveThermal, optical, and electricalWuhan (30.60° N)Experiments and simulationsVarious cases—room depth (4/8/12 m), room width (4/5/6 m) and room height (3.5/4/4.5 m)Office6.5% (low transmittance) and 4.9% (high transmittance) savings of total energy consumption on average; a-Si PV glazing in shallow rooms with large windows or high ceilings has great energy-saving potential
Transparent DSSC BIPV window [12]ActiveThermal, optical, and electricalDaejeon (36.20° N)Experiments3.0 × 9.0 × 3.0 (width × depth × height, unit: m)-Enhanced power generation under low solar-radiation conditions
BIPV/T double-skin façade [18]ActiveThermal, optical, and electricalDarwin
(12.4° S)
Simulations2.44 × 2.3 × 2.44 (width × length × height, unit: m)OfficeTotal annual energy savings of 34.1% annually
Sydney (33.95° S)Total annual energy savings of 86% annually
Canberra (35.3° S)Total annual energy savings of 106% annually
Smart electrochromic windows [40]ActiveThermal and opticalNanjing (31.93° N)Simulations60 m2 (floor area)ClassroomTotal annual energy consumption decreased by 254 kW·h at most
Smart thermochromic window [41]PassiveThermal and optical-ExperimentsExperimental box for downsizing-When heated for 1 h, experimental box with thermochromic smart window is 9.1 °C lower than the experimental box with double-glazed window—there is a good heat-insulation effect
Spectrally selective windows using ATO nanofluids [42]PassiveThermal and opticalHarbin (45.75° N)Experiments0.75 × 1.25 × 0.75 (width × length × height, unit: m)-Effective in delaying the peak room temperature and increasing room temperature in the afternoon and evening; the window with nanofluids volume concentration of 1000 ppm has a delay time of 33 min
Flat gravity-assisted heat pipes and PCM [9]PassiveThermalBeijing (39.93° N)Experiments2.4 × 2.4 × 2.4 (width × depth × height, unit: m)-Increases the percentage of solar energy used for indoor heating from 8.7% to 57.5% (suitable for cold areas or winter)
Publisher’s Note: MDPI stays neutral with regard to jurisdictional claims in published maps and institutional affiliations.